Lago Vista, TX Map & Demographics
Lago Vista Map
Lago Vista Overview
$57,811
PER CAPITA INCOME
$131,500
AVG FAMILY INCOME
$108,823
AVG HOUSEHOLD INCOME
38.1%
WAGE / INCOME GAP [ % ]
61.9¢/ $1
WAGE / INCOME GAP [ $ ]
0.40
INEQUALITY / GINI INDEX
9,001
TOTAL POPULATION
4,796
MALE POPULATION
4,205
FEMALE POPULATION
114.05
MALES / 100 FEMALES
87.68
FEMALES / 100 MALES
52.9
MEDIAN AGE
2.7
AVG FAMILY SIZE
2.3
AVG HOUSEHOLD SIZE
4,203
LABOR FORCE [ PEOPLE ]
53.4%
PERCENT IN LABOR FORCE
5.0%
UNEMPLOYMENT RATE
Income in Lago Vista
Income Overview in Lago Vista
Per Capita Income in Lago Vista is $57,811, while median incomes of families and households are $131,500 and $108,823 respectively.
| Characteristic | Number | Measure |
| Per Capita Income | 9,001 | $57,811 |
| Median Family Income | 2,772 | $131,500 |
| Mean Family Income | 2,772 | $154,132 |
| Median Household Income | 3,889 | $108,823 |
| Mean Household Income | 3,889 | $130,652 |
| Income Deficit | 2,772 | $0 |
| Wage / Income Gap (%) | 9,001 | 38.05% |
| Wage / Income Gap ($) | 9,001 | 61.95¢ per $1 |
| Gini / Inequality Index | 9,001 | 0.40 |
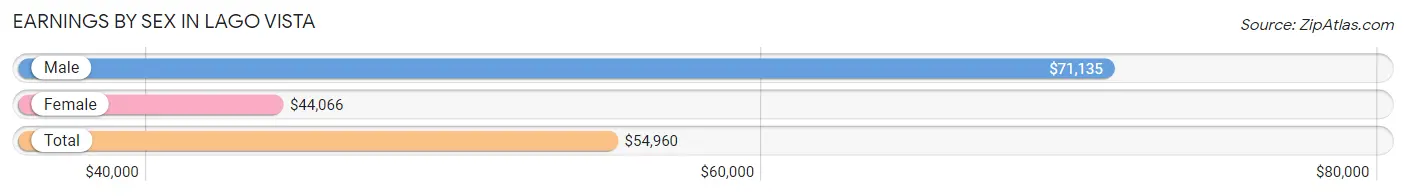
Earnings by Sex in Lago Vista
Average Earnings in Lago Vista are $54,960, $71,135 for men and $44,066 for women, a difference of 38.1%.
| Sex | Number | Average Earnings |
| Male | 2,561 (55.9%) | $71,135 |
| Female | 2,024 (44.1%) | $44,066 |
| Total | 4,585 (100.0%) | $54,960 |
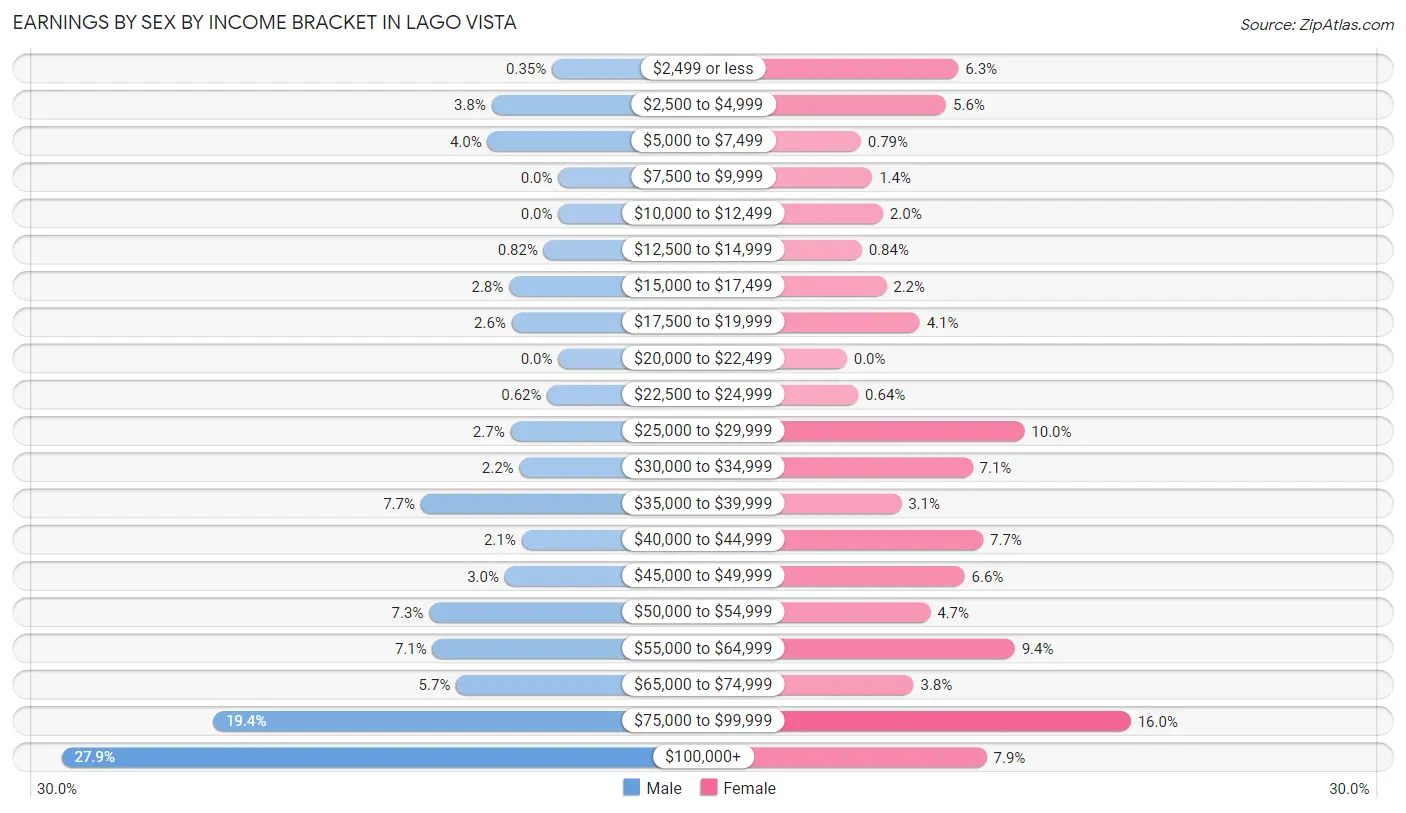
Earnings by Sex by Income Bracket in Lago Vista
The most common earnings brackets in Lago Vista are $100,000+ for men (715 | 27.9%) and $75,000 to $99,999 for women (323 | 16.0%).
| Income | Male | Female |
| $2,499 or less | 9 (0.4%) | 127 (6.3%) |
| $2,500 to $4,999 | 96 (3.7%) | 113 (5.6%) |
| $5,000 to $7,499 | 102 (4.0%) | 16 (0.8%) |
| $7,500 to $9,999 | 0 (0.0%) | 29 (1.4%) |
| $10,000 to $12,499 | 0 (0.0%) | 41 (2.0%) |
| $12,500 to $14,999 | 21 (0.8%) | 17 (0.8%) |
| $15,000 to $17,499 | 71 (2.8%) | 45 (2.2%) |
| $17,500 to $19,999 | 67 (2.6%) | 83 (4.1%) |
| $20,000 to $22,499 | 0 (0.0%) | 0 (0.0%) |
| $22,500 to $24,999 | 16 (0.6%) | 13 (0.6%) |
| $25,000 to $29,999 | 69 (2.7%) | 202 (10.0%) |
| $30,000 to $34,999 | 56 (2.2%) | 143 (7.1%) |
| $35,000 to $39,999 | 198 (7.7%) | 62 (3.1%) |
| $40,000 to $44,999 | 53 (2.1%) | 155 (7.7%) |
| $45,000 to $49,999 | 77 (3.0%) | 134 (6.6%) |
| $50,000 to $54,999 | 186 (7.3%) | 95 (4.7%) |
| $55,000 to $64,999 | 181 (7.1%) | 191 (9.4%) |
| $65,000 to $74,999 | 147 (5.7%) | 76 (3.7%) |
| $75,000 to $99,999 | 497 (19.4%) | 323 (16.0%) |
| $100,000+ | 715 (27.9%) | 159 (7.9%) |
| Total | 2,561 (100.0%) | 2,024 (100.0%) |
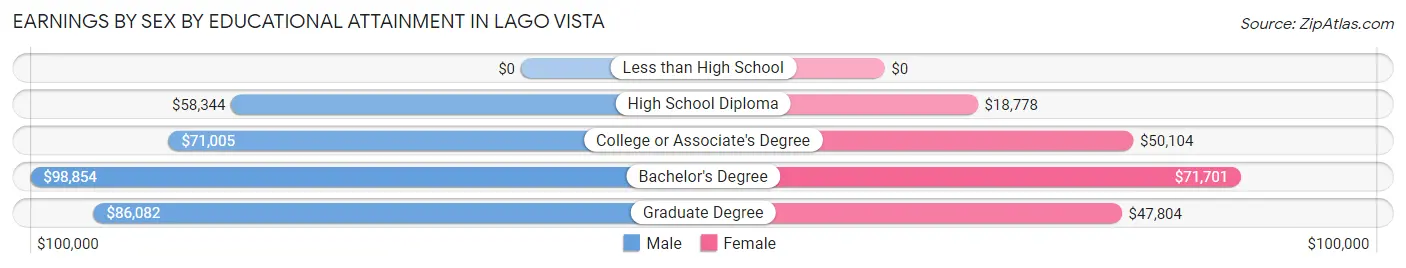
Earnings by Sex by Educational Attainment in Lago Vista
Average earnings in Lago Vista are $80,339 for men and $45,137 for women, a difference of 43.8%. Men with an educational attainment of bachelor's degree enjoy the highest average annual earnings of $98,854, while those with high school diploma education earn the least with $58,344. Women with an educational attainment of bachelor's degree earn the most with the average annual earnings of $71,701, while those with high school diploma education have the smallest earnings of $18,778.
| Educational Attainment | Male Income | Female Income |
| Less than High School | - | - |
| High School Diploma | $58,344 | $18,778 |
| College or Associate's Degree | $71,005 | $50,104 |
| Bachelor's Degree | $98,854 | $71,701 |
| Graduate Degree | $86,082 | $47,804 |
| Total | $80,339 | $45,137 |
Family Income in Lago Vista
Family Income Brackets in Lago Vista
According to the Lago Vista family income data, there are 765 families falling into the $100,000 to $149,999 income range, which is the most common income bracket and makes up 27.6% of all families.
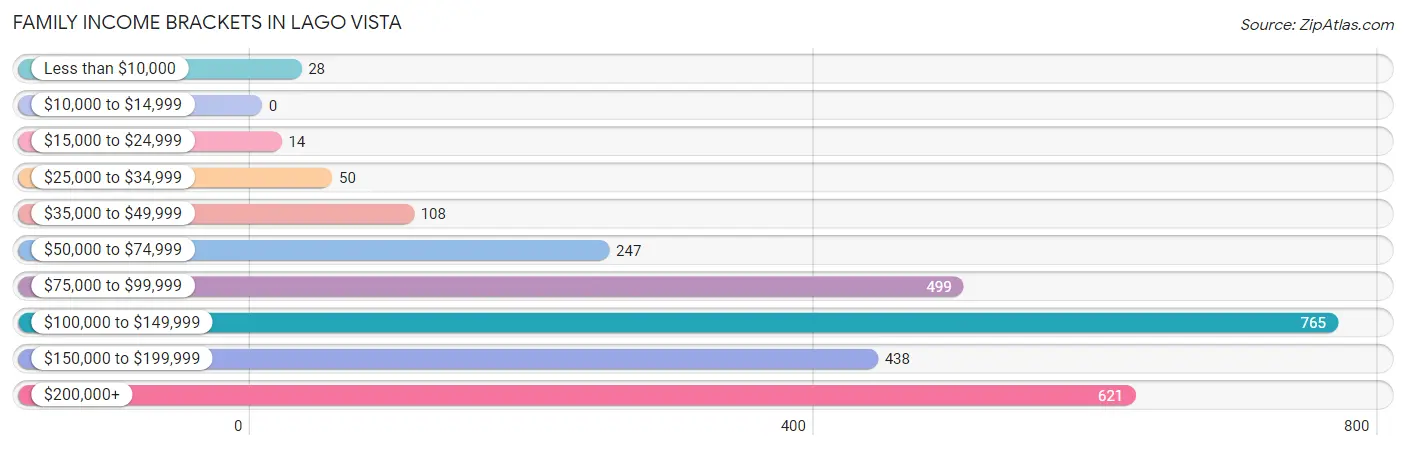
| Income Bracket | # Families | % Families |
| Less than $10,000 | 28 | 1.0% |
| $10,000 to $14,999 | 0 | 0.0% |
| $15,000 to $24,999 | 14 | 0.5% |
| $25,000 to $34,999 | 50 | 1.8% |
| $35,000 to $49,999 | 108 | 3.9% |
| $50,000 to $74,999 | 247 | 8.9% |
| $75,000 to $99,999 | 499 | 18.0% |
| $100,000 to $149,999 | 765 | 27.6% |
| $150,000 to $199,999 | 438 | 15.8% |
| $200,000+ | 621 | 22.4% |
Family Income by Famaliy Size in Lago Vista
3-person families (572 | 20.6%) account for the highest median family income in Lago Vista with $194,667 per family, while 3-person families (572 | 20.6%) have the highest median income of $64,889 per family member.
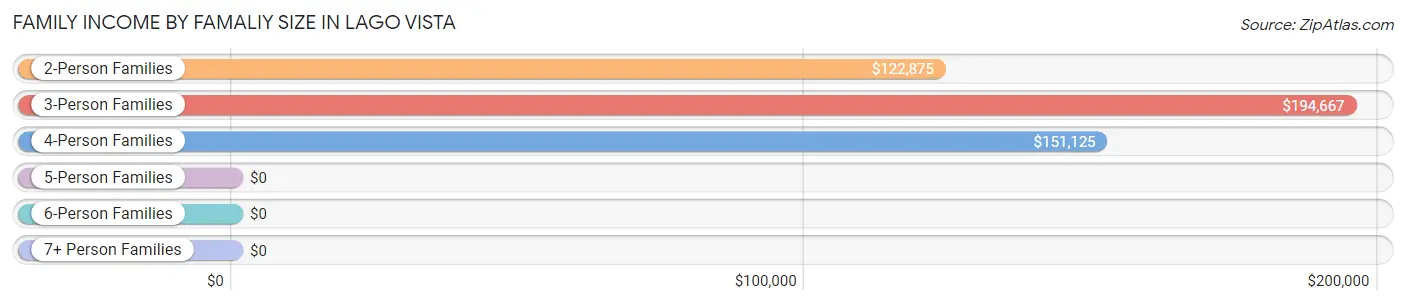
| Income Bracket | # Families | Median Income |
| 2-Person Families | 1,624 (58.6%) | $122,875 |
| 3-Person Families | 572 (20.6%) | $194,667 |
| 4-Person Families | 303 (10.9%) | $151,125 |
| 5-Person Families | 251 (9.0%) | $0 |
| 6-Person Families | 22 (0.8%) | $0 |
| 7+ Person Families | 0 (0.0%) | $0 |
| Total | 2,772 (100.0%) | $131,500 |
Family Income by Number of Earners in Lago Vista
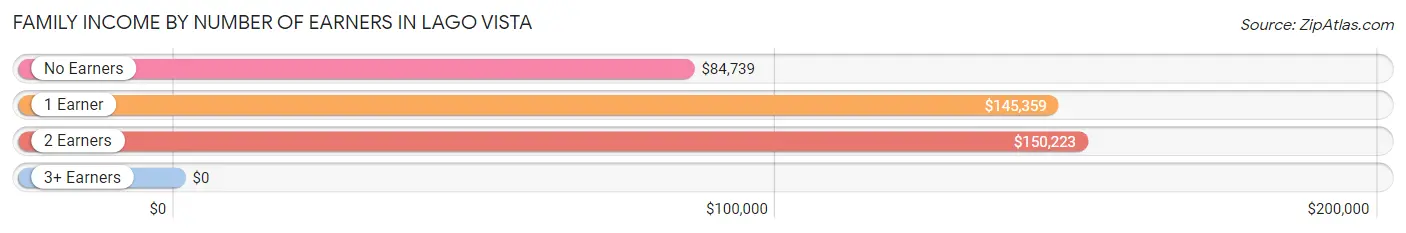
| Number of Earners | # Families | Median Income |
| No Earners | 554 (20.0%) | $84,739 |
| 1 Earner | 947 (34.2%) | $145,359 |
| 2 Earners | 1,099 (39.7%) | $150,223 |
| 3+ Earners | 172 (6.2%) | $0 |
| Total | 2,772 (100.0%) | $131,500 |
Household Income in Lago Vista
Household Income Brackets in Lago Vista
With 875 households falling in the category, the $100,000 to $149,999 income range is the most frequent in Lago Vista, accounting for 22.5% of all households. In contrast, only 16 households (0.4%) fall into the $10,000 to $14,999 income bracket, making it the least populous group.
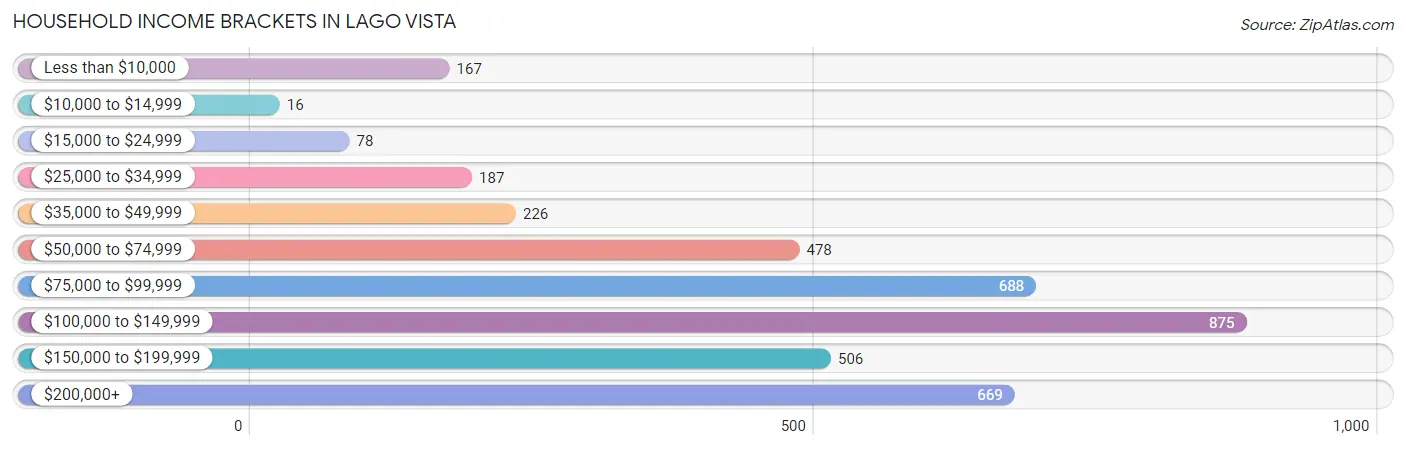
| Income Bracket | # Households | % Households |
| Less than $10,000 | 167 | 4.3% |
| $10,000 to $14,999 | 16 | 0.4% |
| $15,000 to $24,999 | 78 | 2.0% |
| $25,000 to $34,999 | 187 | 4.8% |
| $35,000 to $49,999 | 226 | 5.8% |
| $50,000 to $74,999 | 478 | 12.3% |
| $75,000 to $99,999 | 688 | 17.7% |
| $100,000 to $149,999 | 875 | 22.5% |
| $150,000 to $199,999 | 506 | 13.0% |
| $200,000+ | 669 | 17.2% |
Household Income by Householder Age in Lago Vista
The median household income in Lago Vista is $108,823, with the highest median household income of $124,453 found in the 45 to 64 years age bracket for the primary householder. A total of 1,620 households (41.7%) fall into this category. Meanwhile, the 15 to 24 years age bracket for the primary householder has the lowest median household income of $0, with 8 households (0.2%) in this group.
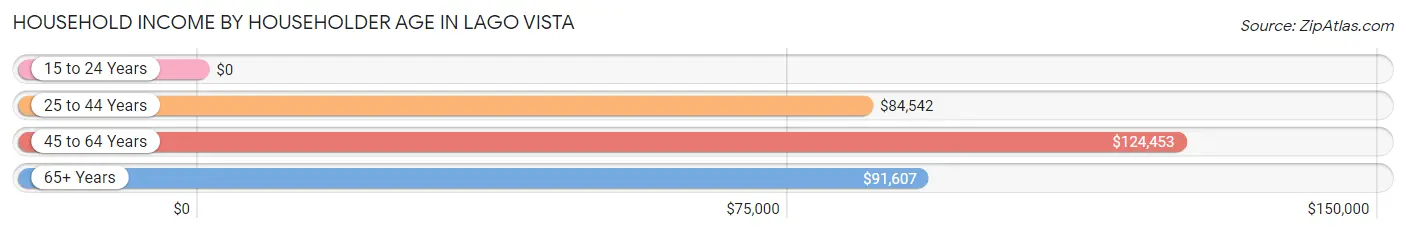
| Income Bracket | # Households | Median Income |
| 15 to 24 Years | 8 (0.2%) | $0 |
| 25 to 44 Years | 665 (17.1%) | $84,542 |
| 45 to 64 Years | 1,620 (41.7%) | $124,453 |
| 65+ Years | 1,596 (41.0%) | $91,607 |
| Total | 3,889 (100.0%) | $108,823 |
Poverty in Lago Vista
Income Below Poverty by Sex and Age in Lago Vista
With 3.6% poverty level for males and 3.9% for females among the residents of Lago Vista, 25 to 34 year old males and 12 to 14 year old females are the most vulnerable to poverty, with 135 males (24.5%) and 13 females (14.6%) in their respective age groups living below the poverty level.
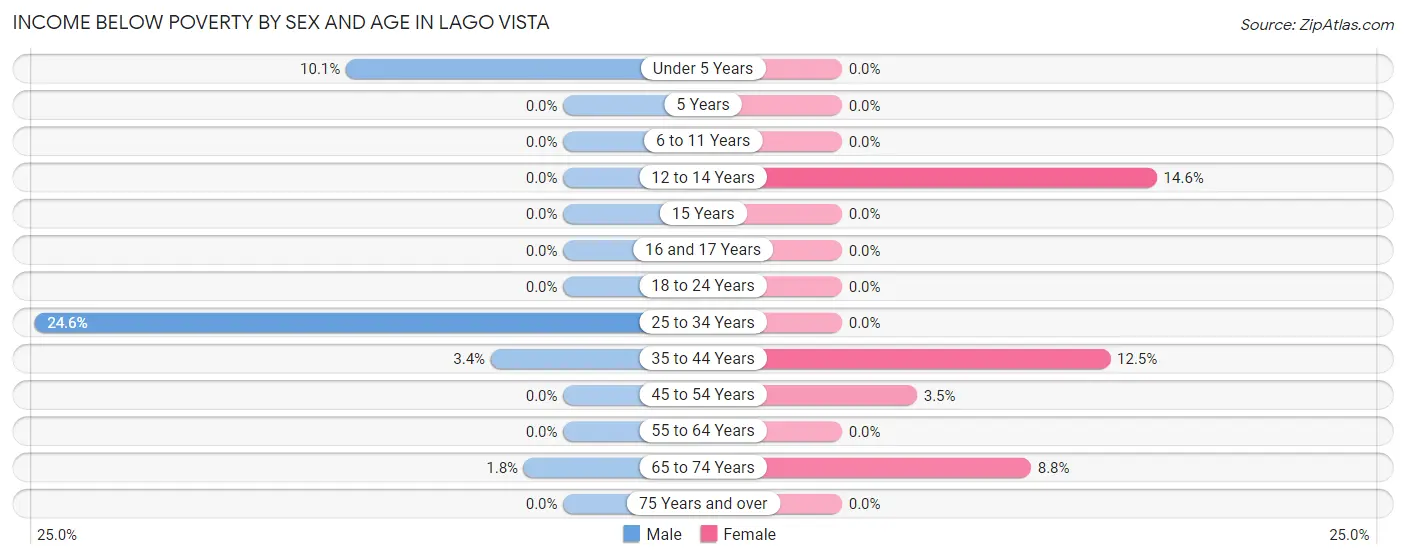
| Age Bracket | Male | Female |
| Under 5 Years | 12 (10.1%) | 0 (0.0%) |
| 5 Years | 0 (0.0%) | 0 (0.0%) |
| 6 to 11 Years | 0 (0.0%) | 0 (0.0%) |
| 12 to 14 Years | 0 (0.0%) | 13 (14.6%) |
| 15 Years | 0 (0.0%) | 0 (0.0%) |
| 16 and 17 Years | 0 (0.0%) | 0 (0.0%) |
| 18 to 24 Years | 0 (0.0%) | 0 (0.0%) |
| 25 to 34 Years | 135 (24.5%) | 0 (0.0%) |
| 35 to 44 Years | 16 (3.4%) | 65 (12.4%) |
| 45 to 54 Years | 0 (0.0%) | 26 (3.5%) |
| 55 to 64 Years | 0 (0.0%) | 0 (0.0%) |
| 65 to 74 Years | 12 (1.8%) | 57 (8.8%) |
| 75 Years and over | 0 (0.0%) | 0 (0.0%) |
| Total | 175 (3.6%) | 161 (3.9%) |
Income Above Poverty by Sex and Age in Lago Vista
According to the poverty statistics in Lago Vista, males aged 5 years and females aged under 5 years are the age groups that are most secure financially, with 100.0% of males and 100.0% of females in these age groups living above the poverty line.
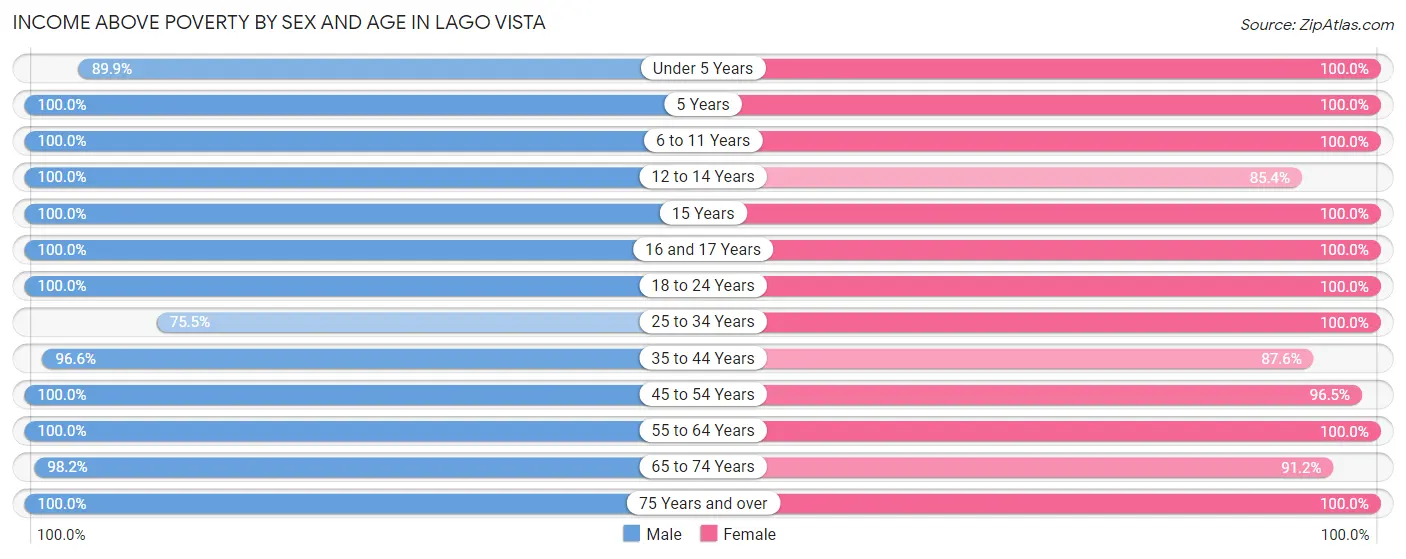
| Age Bracket | Male | Female |
| Under 5 Years | 107 (89.9%) | 122 (100.0%) |
| 5 Years | 129 (100.0%) | 13 (100.0%) |
| 6 to 11 Years | 315 (100.0%) | 39 (100.0%) |
| 12 to 14 Years | 118 (100.0%) | 76 (85.4%) |
| 15 Years | 46 (100.0%) | 78 (100.0%) |
| 16 and 17 Years | 82 (100.0%) | 14 (100.0%) |
| 18 to 24 Years | 155 (100.0%) | 75 (100.0%) |
| 25 to 34 Years | 415 (75.4%) | 332 (100.0%) |
| 35 to 44 Years | 460 (96.6%) | 457 (87.5%) |
| 45 to 54 Years | 734 (100.0%) | 721 (96.5%) |
| 55 to 64 Years | 793 (100.0%) | 966 (100.0%) |
| 65 to 74 Years | 642 (98.2%) | 593 (91.2%) |
| 75 Years and over | 625 (100.0%) | 496 (100.0%) |
| Total | 4,621 (96.4%) | 3,982 (96.1%) |
Income Below Poverty Among Married-Couple Families in Lago Vista
The poverty statistics for married-couple families in Lago Vista show that 0.4% or 11 of the total 2,611 families live below the poverty line. Families with no children have the highest poverty rate of 0.6%, comprising of 11 families. On the other hand, families with 1 or 2 children have the lowest poverty rate of 0.0%, which includes 0 families.
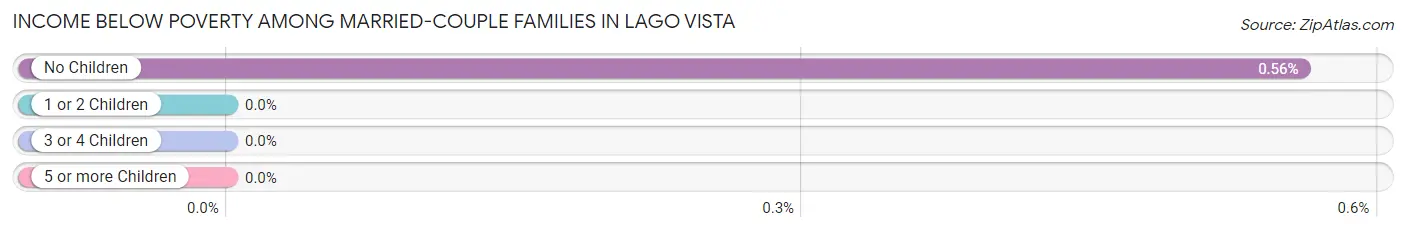
| Children | Above Poverty | Below Poverty |
| No Children | 1,961 (99.4%) | 11 (0.6%) |
| 1 or 2 Children | 504 (100.0%) | 0 (0.0%) |
| 3 or 4 Children | 135 (100.0%) | 0 (0.0%) |
| 5 or more Children | 0 (0.0%) | 0 (0.0%) |
| Total | 2,600 (99.6%) | 11 (0.4%) |
Income Below Poverty Among Single-Parent Households in Lago Vista

| Children | Single Father | Single Mother |
| No Children | 0 (0.0%) | 0 (0.0%) |
| 1 or 2 Children | 16 (100.0%) | 0 (0.0%) |
| 3 or 4 Children | 0 (0.0%) | 0 (0.0%) |
| 5 or more Children | 0 (0.0%) | 0 (0.0%) |
| Total | 16 (61.5%) | 0 (0.0%) |
Income Below Poverty Among Married-Couple vs Single-Parent Households in Lago Vista
The poverty data for Lago Vista shows that 11 of the married-couple family households (0.4%) and 16 of the single-parent households (9.9%) are living below the poverty level. Within the married-couple family households, those with no children have the highest poverty rate, with 11 households (0.6%) falling below the poverty line. Among the single-parent households, those with 1 or 2 children have the highest poverty rate, with 16 household (43.2%) living below poverty.
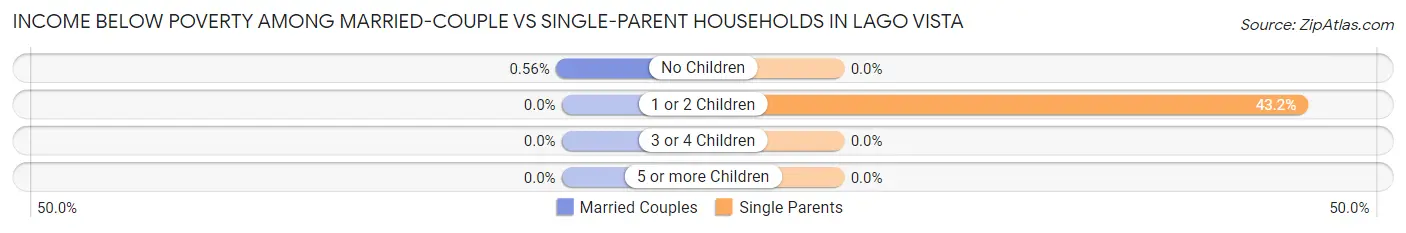
| Children | Married-Couple Families | Single-Parent Households |
| No Children | 11 (0.6%) | 0 (0.0%) |
| 1 or 2 Children | 0 (0.0%) | 16 (43.2%) |
| 3 or 4 Children | 0 (0.0%) | 0 (0.0%) |
| 5 or more Children | 0 (0.0%) | 0 (0.0%) |
| Total | 11 (0.4%) | 16 (9.9%) |
Race in Lago Vista
The most populous races in Lago Vista are White / Caucasian (7,609 | 84.5%), Hispanic or Latino (1,944 | 21.6%), and Two or more Races (886 | 9.8%).
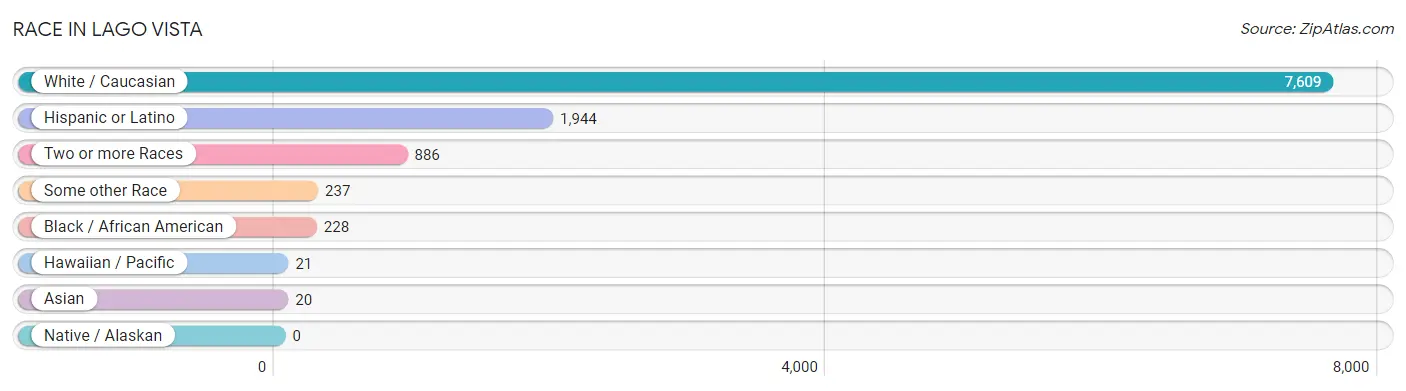
| Race | # Population | % Population |
| Asian | 20 | 0.2% |
| Black / African American | 228 | 2.5% |
| Hawaiian / Pacific | 21 | 0.2% |
| Hispanic or Latino | 1,944 | 21.6% |
| Native / Alaskan | 0 | 0.0% |
| White / Caucasian | 7,609 | 84.5% |
| Two or more Races | 886 | 9.8% |
| Some other Race | 237 | 2.6% |
| Total | 9,001 | 100.0% |
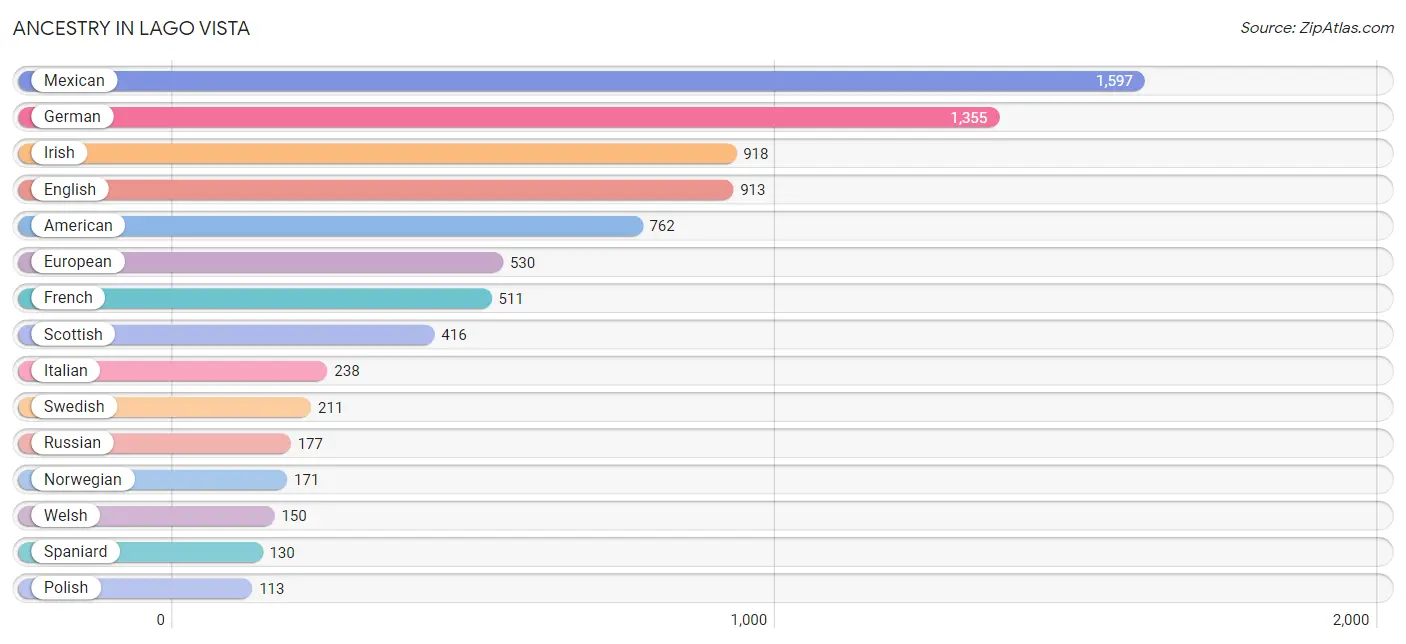
Ancestry in Lago Vista
The most populous ancestries reported in Lago Vista are Mexican (1,597 | 17.7%), German (1,355 | 15.0%), Irish (918 | 10.2%), English (913 | 10.1%), and American (762 | 8.5%), together accounting for 61.6% of all Lago Vista residents.
| Ancestry | # Population | % Population |
| African | 68 | 0.8% |
| American | 762 | 8.5% |
| Arab | 23 | 0.3% |
| Barbadian | 28 | 0.3% |
| Bhutanese | 41 | 0.5% |
| British | 28 | 0.3% |
| Burmese | 62 | 0.7% |
| Canadian | 16 | 0.2% |
| Cherokee | 13 | 0.1% |
| Cuban | 49 | 0.5% |
| Czech | 40 | 0.4% |
| Danish | 21 | 0.2% |
| Dominican | 60 | 0.7% |
| Dutch | 34 | 0.4% |
| English | 913 | 10.1% |
| European | 530 | 5.9% |
| French | 511 | 5.7% |
| French Canadian | 61 | 0.7% |
| German | 1,355 | 15.0% |
| Greek | 39 | 0.4% |
| Haitian | 15 | 0.2% |
| Hungarian | 16 | 0.2% |
| Indian (Asian) | 17 | 0.2% |
| Irish | 918 | 10.2% |
| Italian | 238 | 2.6% |
| Lebanese | 23 | 0.3% |
| Lithuanian | 10 | 0.1% |
| Maltese | 30 | 0.3% |
| Mexican | 1,597 | 17.7% |
| Native Hawaiian | 58 | 0.6% |
| Northern European | 63 | 0.7% |
| Norwegian | 171 | 1.9% |
| Pakistani | 20 | 0.2% |
| Polish | 113 | 1.3% |
| Portuguese | 13 | 0.1% |
| Puerto Rican | 40 | 0.4% |
| Russian | 177 | 2.0% |
| Scandinavian | 13 | 0.1% |
| Scotch-Irish | 111 | 1.2% |
| Scottish | 416 | 4.6% |
| Serbian | 19 | 0.2% |
| Slovak | 11 | 0.1% |
| South American | 51 | 0.6% |
| Spaniard | 130 | 1.4% |
| Spanish | 17 | 0.2% |
| Subsaharan African | 68 | 0.8% |
| Swedish | 211 | 2.3% |
| Swiss | 15 | 0.2% |
| Venezuelan | 51 | 0.6% |
| Welsh | 150 | 1.7% | View All 50 Rows |
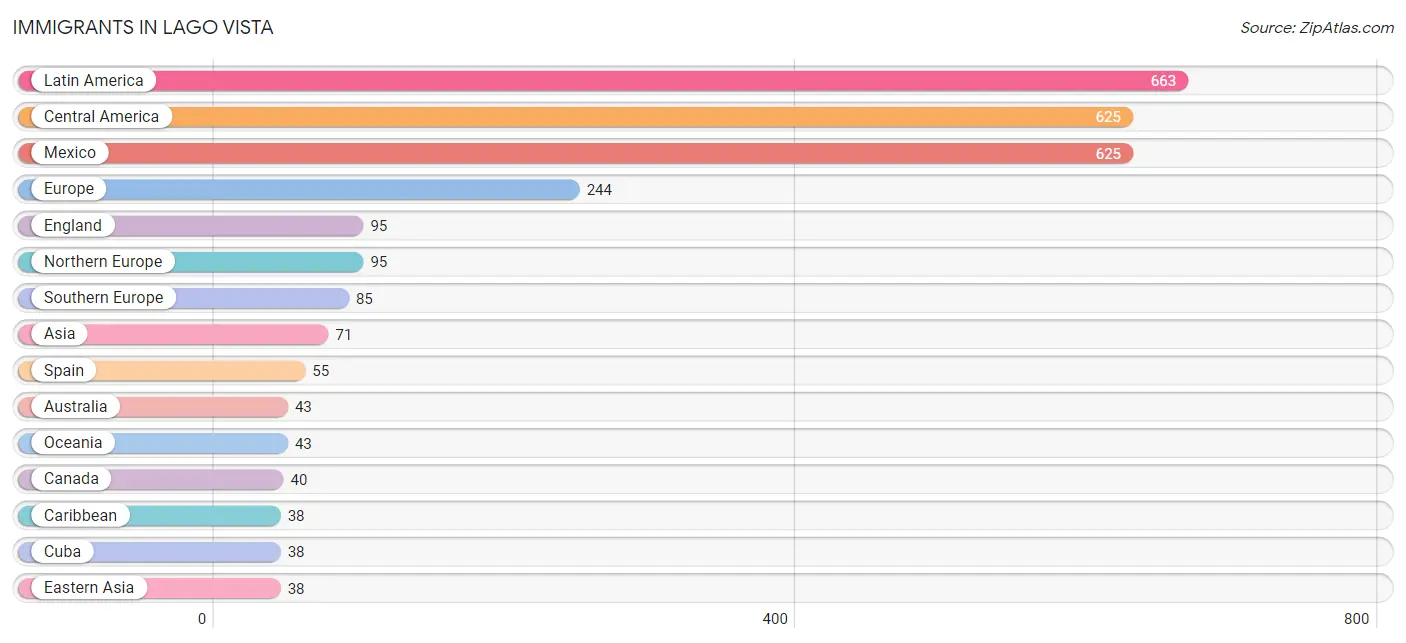
Immigrants in Lago Vista
The most numerous immigrant groups reported in Lago Vista came from Latin America (663 | 7.4%), Central America (625 | 6.9%), Mexico (625 | 6.9%), Europe (244 | 2.7%), and England (95 | 1.1%), together accounting for 25.0% of all Lago Vista residents.
| Immigration Origin | # Population | % Population |
| Africa | 17 | 0.2% |
| Asia | 71 | 0.8% |
| Australia | 43 | 0.5% |
| Canada | 40 | 0.4% |
| Caribbean | 38 | 0.4% |
| Central America | 625 | 6.9% |
| Cuba | 38 | 0.4% |
| Eastern Asia | 38 | 0.4% |
| Eastern Europe | 36 | 0.4% |
| England | 95 | 1.1% |
| Europe | 244 | 2.7% |
| Germany | 28 | 0.3% |
| Japan | 38 | 0.4% |
| Latin America | 663 | 7.4% |
| Mexico | 625 | 6.9% |
| Northern Europe | 95 | 1.1% |
| Oceania | 43 | 0.5% |
| Russia | 36 | 0.4% |
| South Africa | 17 | 0.2% |
| South Central Asia | 13 | 0.1% |
| South Eastern Asia | 20 | 0.2% |
| Southern Europe | 85 | 0.9% |
| Spain | 55 | 0.6% |
| Sri Lanka | 13 | 0.1% |
| Thailand | 20 | 0.2% |
| Western Europe | 28 | 0.3% | View All 26 Rows |
Sex and Age in Lago Vista
Sex and Age in Lago Vista
The most populous age groups in Lago Vista are 55 to 59 Years (408 | 8.5%) for men and 60 to 64 Years (567 | 13.5%) for women.
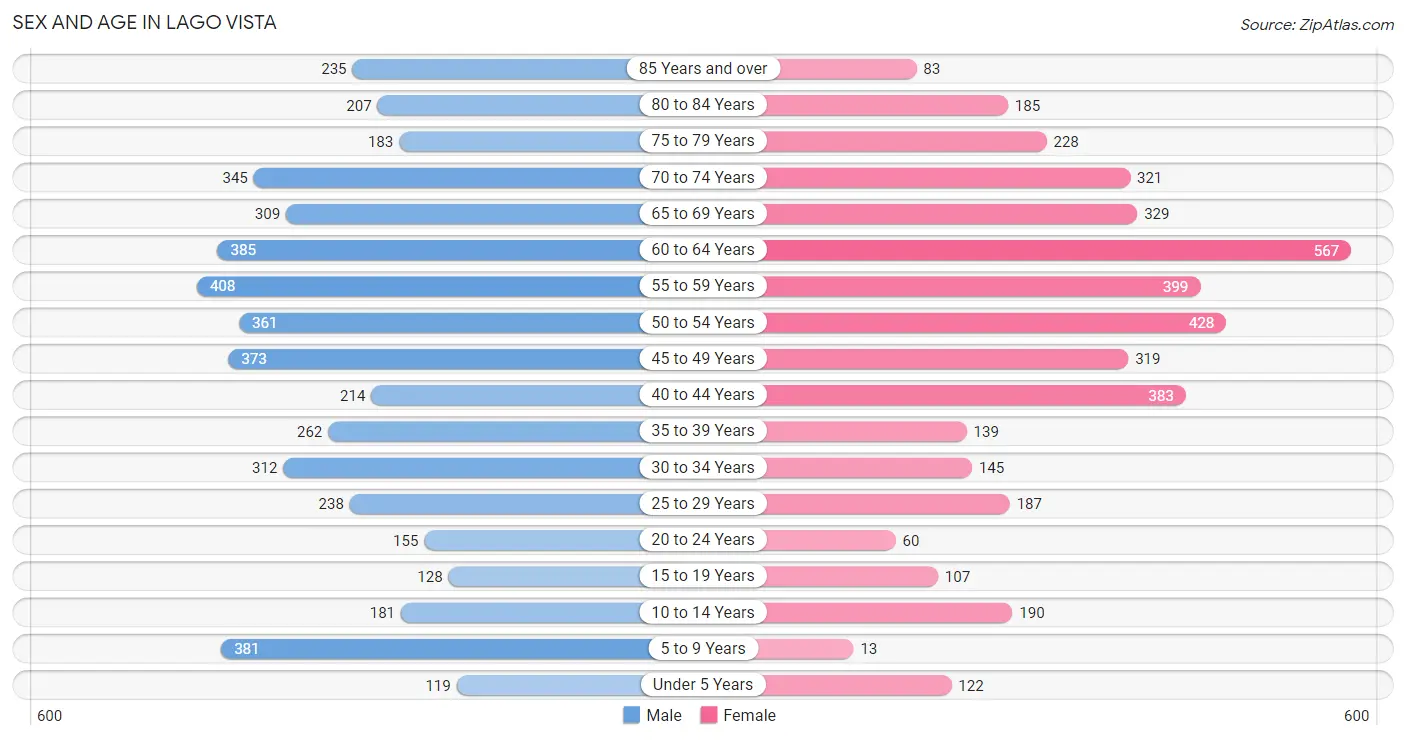
| Age Bracket | Male | Female |
| Under 5 Years | 119 (2.5%) | 122 (2.9%) |
| 5 to 9 Years | 381 (7.9%) | 13 (0.3%) |
| 10 to 14 Years | 181 (3.8%) | 190 (4.5%) |
| 15 to 19 Years | 128 (2.7%) | 107 (2.5%) |
| 20 to 24 Years | 155 (3.2%) | 60 (1.4%) |
| 25 to 29 Years | 238 (5.0%) | 187 (4.4%) |
| 30 to 34 Years | 312 (6.5%) | 145 (3.5%) |
| 35 to 39 Years | 262 (5.5%) | 139 (3.3%) |
| 40 to 44 Years | 214 (4.5%) | 383 (9.1%) |
| 45 to 49 Years | 373 (7.8%) | 319 (7.6%) |
| 50 to 54 Years | 361 (7.5%) | 428 (10.2%) |
| 55 to 59 Years | 408 (8.5%) | 399 (9.5%) |
| 60 to 64 Years | 385 (8.0%) | 567 (13.5%) |
| 65 to 69 Years | 309 (6.4%) | 329 (7.8%) |
| 70 to 74 Years | 345 (7.2%) | 321 (7.6%) |
| 75 to 79 Years | 183 (3.8%) | 228 (5.4%) |
| 80 to 84 Years | 207 (4.3%) | 185 (4.4%) |
| 85 Years and over | 235 (4.9%) | 83 (2.0%) |
| Total | 4,796 (100.0%) | 4,205 (100.0%) |
Families and Households in Lago Vista
Median Family Size in Lago Vista
The median family size in Lago Vista is 2.71 persons per family, with married-couple families (2,611 | 94.2%) accounting for the largest median family size of 2.74 persons per family. On the other hand, single female/mother families (135 | 4.9%) represent the smallest median family size with 2.13 persons per family.
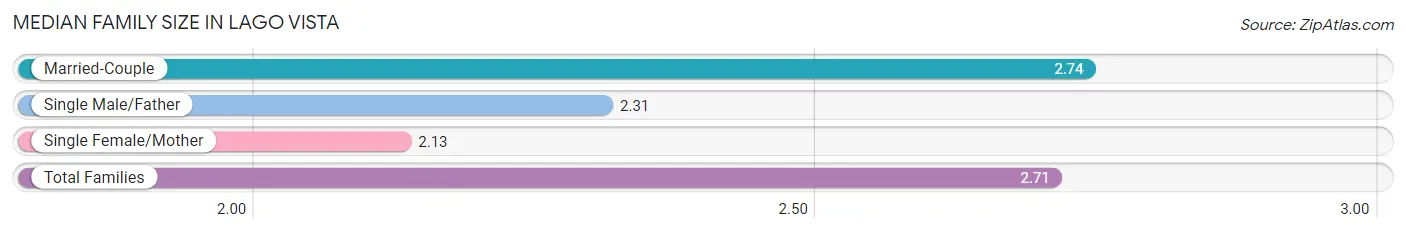
| Family Type | # Families | Family Size |
| Married-Couple | 2,611 (94.2%) | 2.74 |
| Single Male/Father | 26 (0.9%) | 2.31 |
| Single Female/Mother | 135 (4.9%) | 2.13 |
| Total Families | 2,772 (100.0%) | 2.71 |
Median Household Size in Lago Vista
The median household size in Lago Vista is 2.31 persons per household, with married-couple households (2,611 | 67.1%) accounting for the largest median household size of 2.75 persons per household. non-family households (1,117 | 28.7%) represent the smallest median household size with 1.30 persons per household.
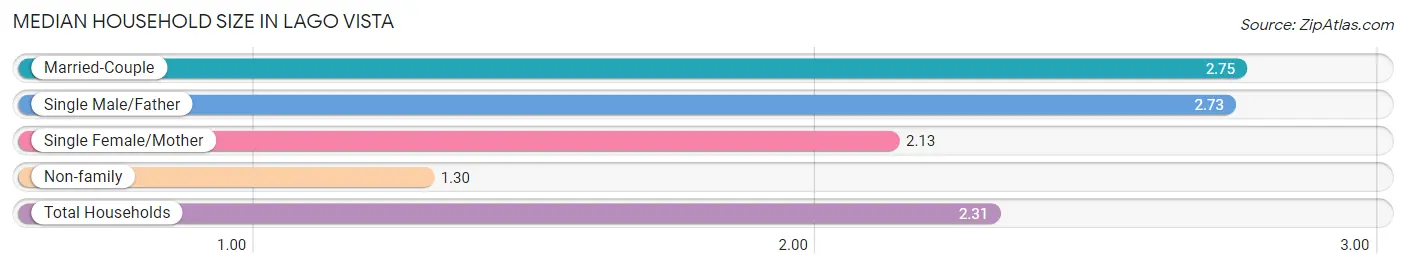
| Household Type | # Households | Household Size |
| Married-Couple | 2,611 (67.1%) | 2.75 |
| Single Male/Father | 26 (0.7%) | 2.73 |
| Single Female/Mother | 135 (3.5%) | 2.13 |
| Non-family | 1,117 (28.7%) | 1.30 |
| Total Households | 3,889 (100.0%) | 2.31 |
Household Size by Marriage Status in Lago Vista
Out of a total of 3,889 households in Lago Vista, 2,772 (71.3%) are family households, while 1,117 (28.7%) are nonfamily households. The most numerous type of family households are 2-person households, comprising 1,587, and the most common type of nonfamily households are 1-person households, comprising 842.
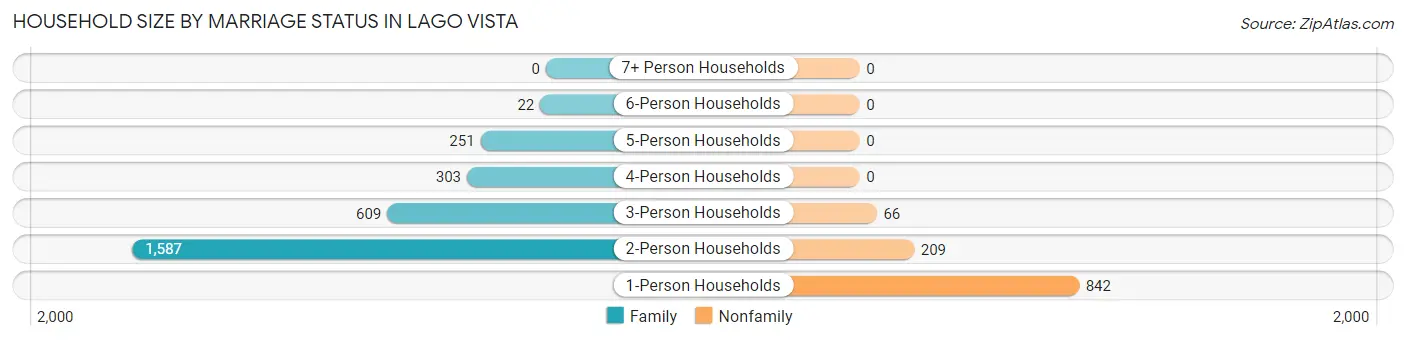
| Household Size | Family Households | Nonfamily Households |
| 1-Person Households | - | 842 (21.6%) |
| 2-Person Households | 1,587 (40.8%) | 209 (5.4%) |
| 3-Person Households | 609 (15.7%) | 66 (1.7%) |
| 4-Person Households | 303 (7.8%) | 0 (0.0%) |
| 5-Person Households | 251 (6.5%) | 0 (0.0%) |
| 6-Person Households | 22 (0.6%) | 0 (0.0%) |
| 7+ Person Households | 0 (0.0%) | 0 (0.0%) |
| Total | 2,772 (71.3%) | 1,117 (28.7%) |
Female Fertility in Lago Vista
Fertility by Age in Lago Vista
Average fertility rate in Lago Vista is 76.0 births per 1,000 women. Women in the age bracket of 20 to 34 years have the highest fertility rate with 247.0 births per 1,000 women. Women in the age bracket of 20 to 34 years acount for 91.5% of all women with births.
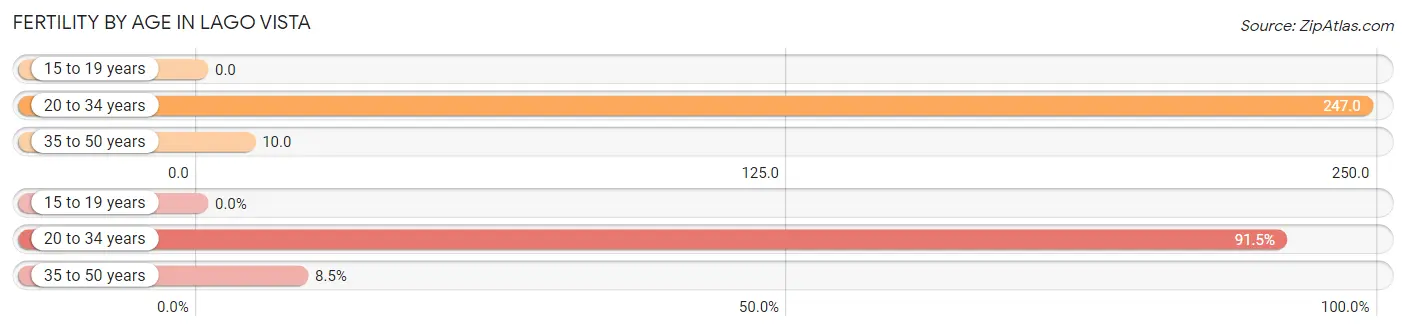
| Age Bracket | Women with Births | Births / 1,000 Women |
| 15 to 19 years | 0 (0.0%) | 0.0 |
| 20 to 34 years | 97 (91.5%) | 247.0 |
| 35 to 50 years | 9 (8.5%) | 10.0 |
| Total | 106 (100.0%) | 76.0 |
Fertility by Age by Marriage Status in Lago Vista
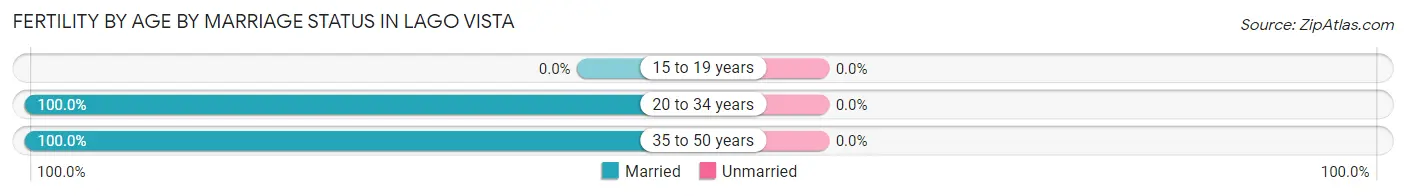
| Age Bracket | Married | Unmarried |
| 15 to 19 years | 0 (0.0%) | 0 (0.0%) |
| 20 to 34 years | 97 (100.0%) | 0 (0.0%) |
| 35 to 50 years | 9 (100.0%) | 0 (0.0%) |
| Total | 106 (100.0%) | 0 (0.0%) |
Fertility by Education in Lago Vista
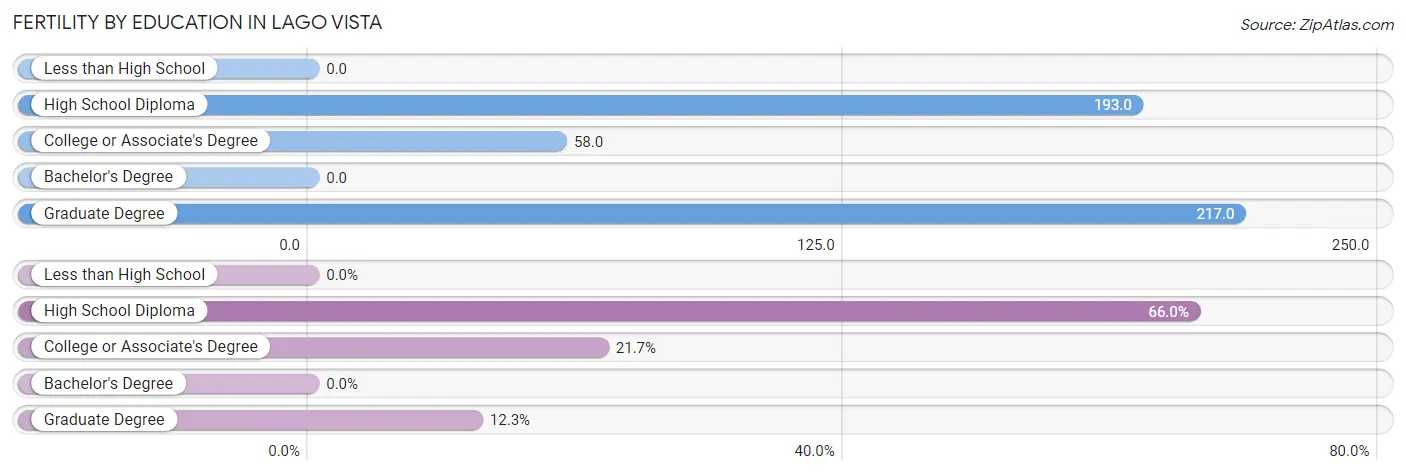
| Educational Attainment | Women with Births | Births / 1,000 Women |
| Less than High School | 0 (0.0%) | 0.0 |
| High School Diploma | 70 (66.0%) | 193.0 |
| College or Associate's Degree | 23 (21.7%) | 58.0 |
| Bachelor's Degree | 0 (0.0%) | 0.0 |
| Graduate Degree | 13 (12.3%) | 217.0 |
| Total | 106 (100.0%) | 76.0 |
Fertility by Education by Marriage Status in Lago Vista
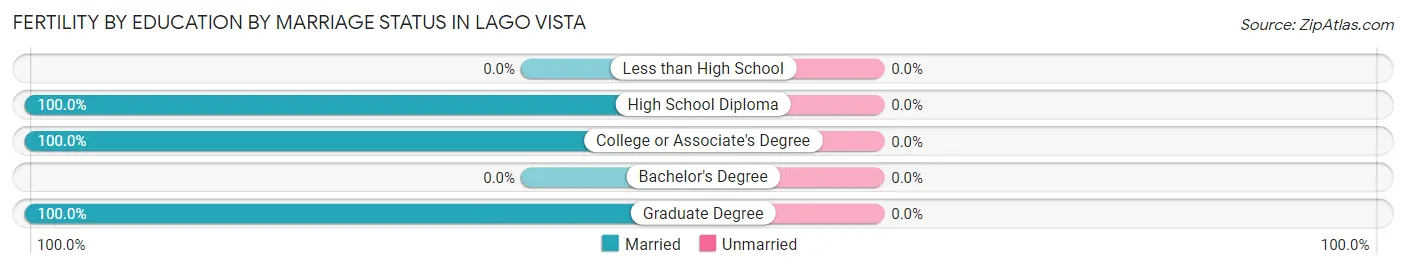
| Educational Attainment | Married | Unmarried |
| Less than High School | 0 (0.0%) | 0 (0.0%) |
| High School Diploma | 70 (100.0%) | 0 (0.0%) |
| College or Associate's Degree | 23 (100.0%) | 0 (0.0%) |
| Bachelor's Degree | 0 (0.0%) | 0 (0.0%) |
| Graduate Degree | 13 (100.0%) | 0 (0.0%) |
| Total | 106 (100.0%) | 0 (0.0%) |
Employment Characteristics in Lago Vista
Employment by Class of Employer in Lago Vista
Among the 3,948 employed individuals in Lago Vista, private company employees (2,636 | 66.8%), not-for-profit organizations (337 | 8.5%), and self-employed (incorporated) (302 | 7.6%) make up the most common classes of employment.
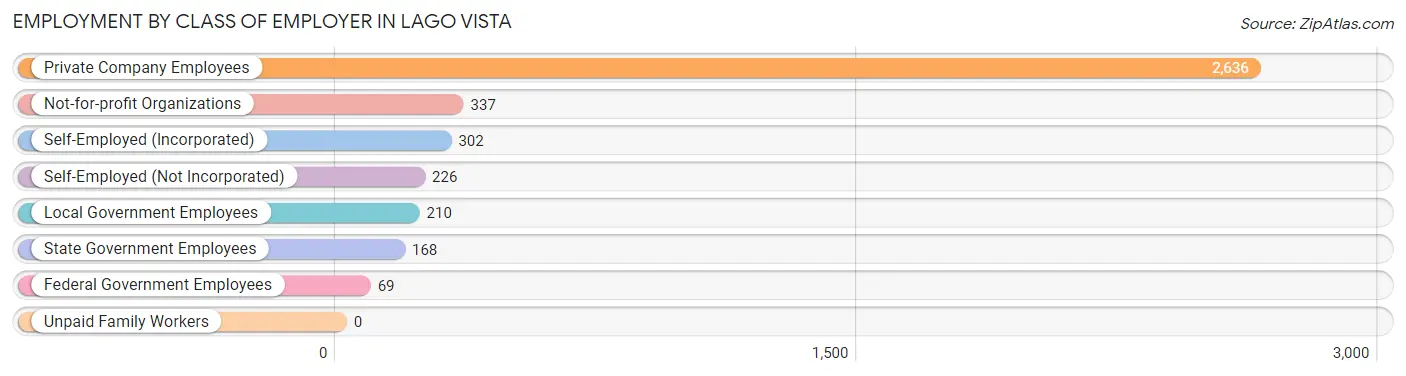
| Employer Class | # Employees | % Employees |
| Private Company Employees | 2,636 | 66.8% |
| Self-Employed (Incorporated) | 302 | 7.6% |
| Self-Employed (Not Incorporated) | 226 | 5.7% |
| Not-for-profit Organizations | 337 | 8.5% |
| Local Government Employees | 210 | 5.3% |
| State Government Employees | 168 | 4.3% |
| Federal Government Employees | 69 | 1.8% |
| Unpaid Family Workers | 0 | 0.0% |
| Total | 3,948 | 100.0% |
Employment Status by Age in Lago Vista
According to the labor force statistics for Lago Vista, out of the total population over 16 years of age (7,871), 53.4% or 4,203 individuals are in the labor force, with 5.0% or 210 of them unemployed. The age group with the highest labor force participation rate is 45 to 54 years, with 85.7% or 1,269 individuals in the labor force. Within the labor force, the 25 to 29 years age range has the highest percentage of unemployed individuals, with 49.3% or 100 of them being unemployed.
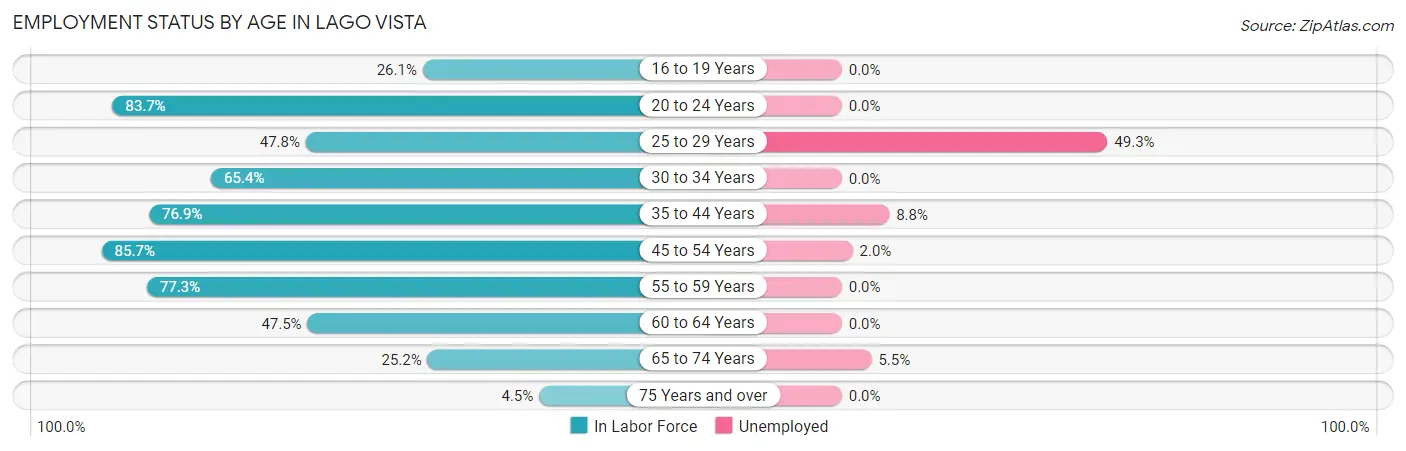
| Age Bracket | In Labor Force | Unemployed |
| 16 to 19 Years | 29 (26.1%) | 0 (0.0%) |
| 20 to 24 Years | 180 (83.7%) | 0 (0.0%) |
| 25 to 29 Years | 203 (47.8%) | 100 (49.3%) |
| 30 to 34 Years | 299 (65.4%) | 0 (0.0%) |
| 35 to 44 Years | 767 (76.9%) | 67 (8.8%) |
| 45 to 54 Years | 1,269 (85.7%) | 25 (2.0%) |
| 55 to 59 Years | 624 (77.3%) | 0 (0.0%) |
| 60 to 64 Years | 452 (47.5%) | 0 (0.0%) |
| 65 to 74 Years | 329 (25.2%) | 18 (5.5%) |
| 75 Years and over | 50 (4.5%) | 0 (0.0%) |
| Total | 4,203 (53.4%) | 210 (5.0%) |
Employment Status by Educational Attainment in Lago Vista
According to labor force statistics for Lago Vista, 70.6% of individuals (3,615) out of the total population between 25 and 64 years of age (5,120) are in the labor force, with 5.3% or 192 of them being unemployed. The group with the highest labor force participation rate are those with the educational attainment of less than high school, with 86.1% or 329 individuals in the labor force. Within the labor force, individuals with less than high school education have the highest percentage of unemployment, with 18.5% or 61 of them being unemployed.

| Educational Attainment | In Labor Force | Unemployed |
| Less than High School | 329 (86.1%) | 71 (18.5%) |
| High School Diploma | 550 (45.3%) | 151 (12.4%) |
| College / Associate Degree | 1,325 (78.7%) | 52 (3.1%) |
| Bachelor's Degree or higher | 1,411 (76.7%) | 33 (1.8%) |
| Total | 3,615 (70.6%) | 271 (5.3%) |
Employment Occupations by Sex in Lago Vista
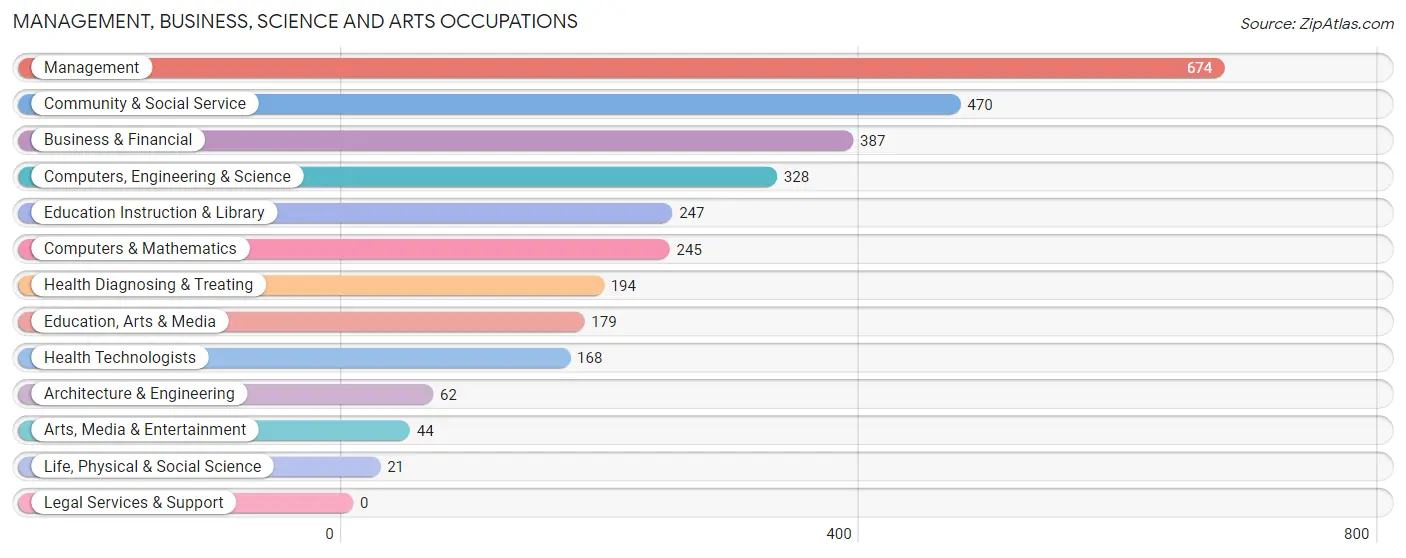
Management, Business, Science and Arts Occupations
The most common Management, Business, Science and Arts occupations in Lago Vista are Management (674 | 17.0%), Community & Social Service (470 | 11.8%), Business & Financial (387 | 9.7%), Computers, Engineering & Science (328 | 8.3%), and Education Instruction & Library (247 | 6.2%).
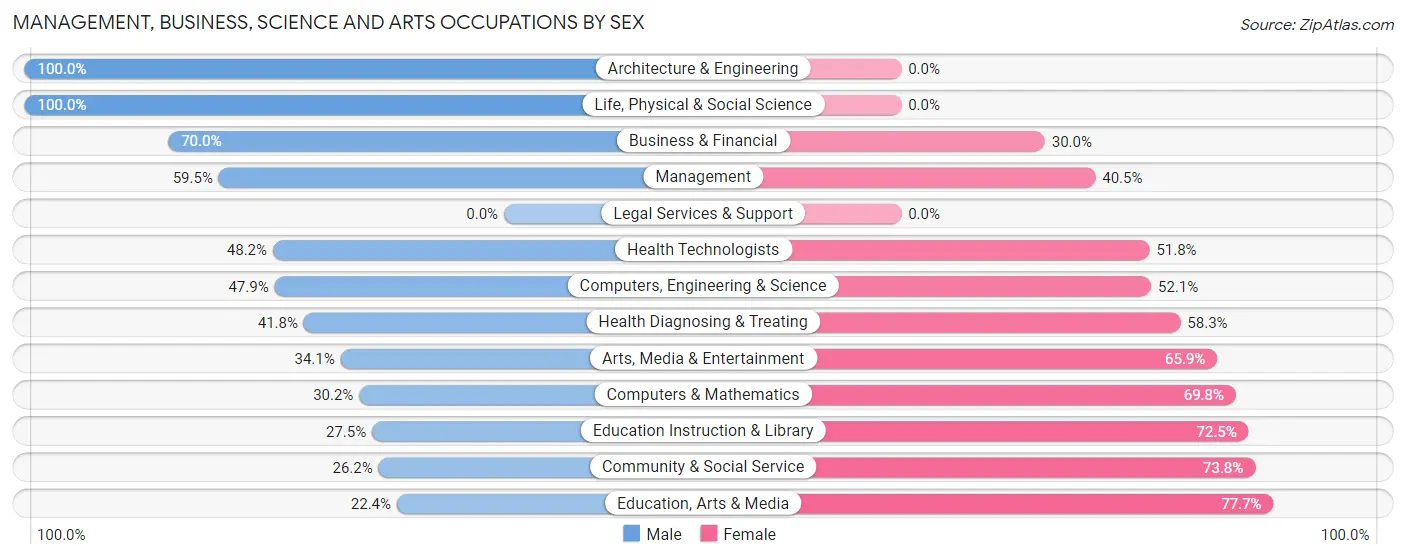
Management, Business, Science and Arts Occupations by Sex
Within the Management, Business, Science and Arts occupations in Lago Vista, the most male-oriented occupations are Architecture & Engineering (100.0%), Life, Physical & Social Science (100.0%), and Business & Financial (70.0%), while the most female-oriented occupations are Education, Arts & Media (77.6%), Community & Social Service (73.8%), and Education Instruction & Library (72.5%).
| Occupation | Male | Female |
| Management | 401 (59.5%) | 273 (40.5%) |
| Business & Financial | 271 (70.0%) | 116 (30.0%) |
| Computers, Engineering & Science | 157 (47.9%) | 171 (52.1%) |
| Computers & Mathematics | 74 (30.2%) | 171 (69.8%) |
| Architecture & Engineering | 62 (100.0%) | 0 (0.0%) |
| Life, Physical & Social Science | 21 (100.0%) | 0 (0.0%) |
| Community & Social Service | 123 (26.2%) | 347 (73.8%) |
| Education, Arts & Media | 40 (22.4%) | 139 (77.6%) |
| Legal Services & Support | 0 (0.0%) | 0 (0.0%) |
| Education Instruction & Library | 68 (27.5%) | 179 (72.5%) |
| Arts, Media & Entertainment | 15 (34.1%) | 29 (65.9%) |
| Health Diagnosing & Treating | 81 (41.7%) | 113 (58.3%) |
| Health Technologists | 81 (48.2%) | 87 (51.8%) |
| Total (Category) | 1,033 (50.3%) | 1,020 (49.7%) |
| Total (Overall) | 2,182 (54.9%) | 1,790 (45.1%) |
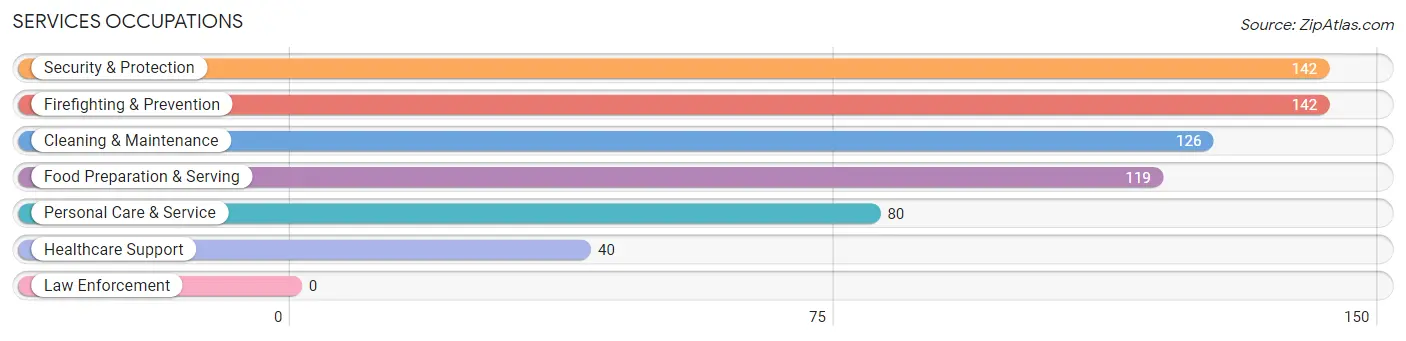
Services Occupations
The most common Services occupations in Lago Vista are Security & Protection (142 | 3.6%), Firefighting & Prevention (142 | 3.6%), Cleaning & Maintenance (126 | 3.2%), Food Preparation & Serving (119 | 3.0%), and Personal Care & Service (80 | 2.0%).
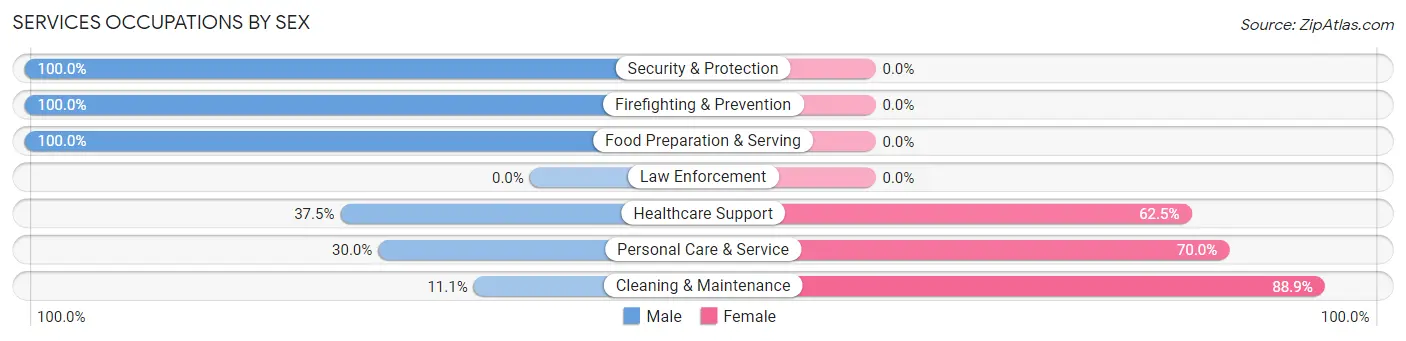
Services Occupations by Sex
Within the Services occupations in Lago Vista, the most male-oriented occupations are Security & Protection (100.0%), Firefighting & Prevention (100.0%), and Food Preparation & Serving (100.0%), while the most female-oriented occupations are Cleaning & Maintenance (88.9%), Personal Care & Service (70.0%), and Healthcare Support (62.5%).
| Occupation | Male | Female |
| Healthcare Support | 15 (37.5%) | 25 (62.5%) |
| Security & Protection | 142 (100.0%) | 0 (0.0%) |
| Firefighting & Prevention | 142 (100.0%) | 0 (0.0%) |
| Law Enforcement | 0 (0.0%) | 0 (0.0%) |
| Food Preparation & Serving | 119 (100.0%) | 0 (0.0%) |
| Cleaning & Maintenance | 14 (11.1%) | 112 (88.9%) |
| Personal Care & Service | 24 (30.0%) | 56 (70.0%) |
| Total (Category) | 314 (61.9%) | 193 (38.1%) |
| Total (Overall) | 2,182 (54.9%) | 1,790 (45.1%) |
Sales and Office Occupations
The most common Sales and Office occupations in Lago Vista are Office & Administration (424 | 10.7%), and Sales & Related (293 | 7.4%).

Sales and Office Occupations by Sex

| Occupation | Male | Female |
| Sales & Related | 184 (62.8%) | 109 (37.2%) |
| Office & Administration | 85 (20.1%) | 339 (79.9%) |
| Total (Category) | 269 (37.5%) | 448 (62.5%) |
| Total (Overall) | 2,182 (54.9%) | 1,790 (45.1%) |
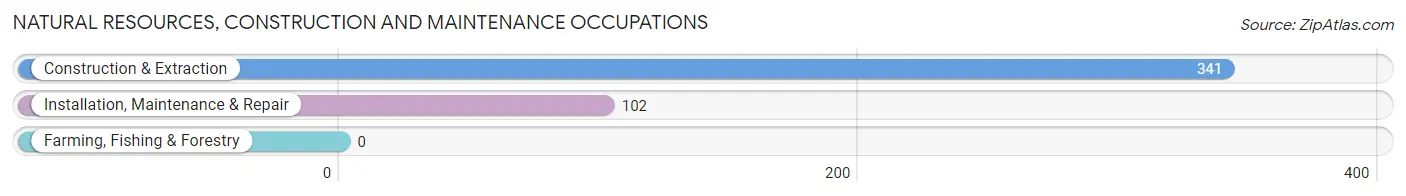
Natural Resources, Construction and Maintenance Occupations
The most common Natural Resources, Construction and Maintenance occupations in Lago Vista are Construction & Extraction (341 | 8.6%), and Installation, Maintenance & Repair (102 | 2.6%).
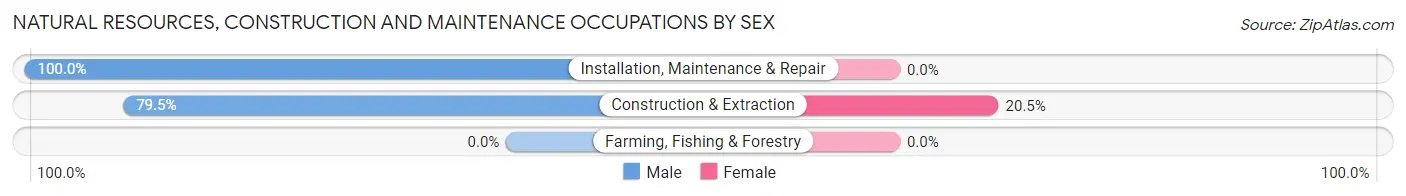
Natural Resources, Construction and Maintenance Occupations by Sex
| Occupation | Male | Female |
| Farming, Fishing & Forestry | 0 (0.0%) | 0 (0.0%) |
| Construction & Extraction | 271 (79.5%) | 70 (20.5%) |
| Installation, Maintenance & Repair | 102 (100.0%) | 0 (0.0%) |
| Total (Category) | 373 (84.2%) | 70 (15.8%) |
| Total (Overall) | 2,182 (54.9%) | 1,790 (45.1%) |
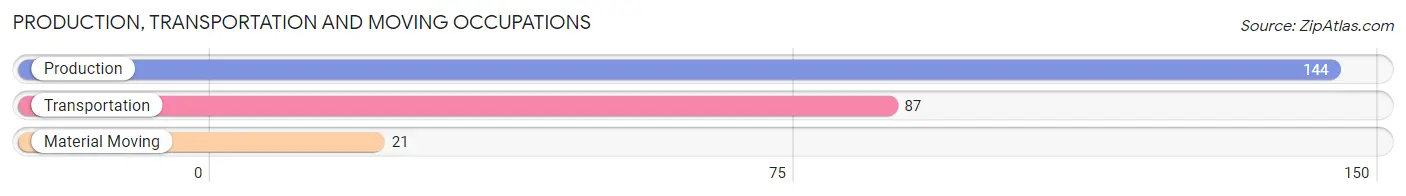
Production, Transportation and Moving Occupations
The most common Production, Transportation and Moving occupations in Lago Vista are Production (144 | 3.6%), Transportation (87 | 2.2%), and Material Moving (21 | 0.5%).
Production, Transportation and Moving Occupations by Sex
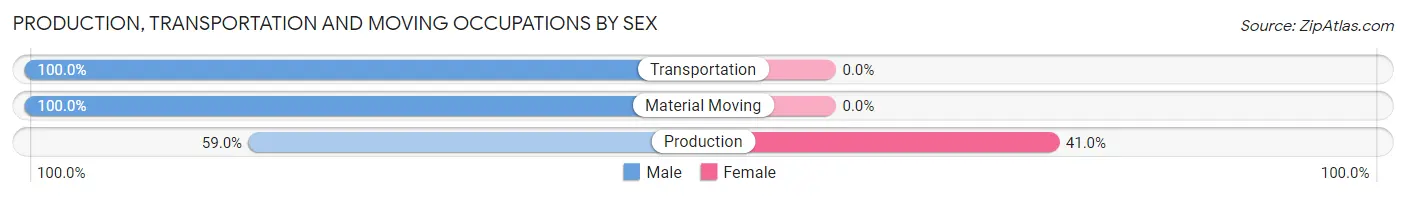
| Occupation | Male | Female |
| Production | 85 (59.0%) | 59 (41.0%) |
| Transportation | 87 (100.0%) | 0 (0.0%) |
| Material Moving | 21 (100.0%) | 0 (0.0%) |
| Total (Category) | 193 (76.6%) | 59 (23.4%) |
| Total (Overall) | 2,182 (54.9%) | 1,790 (45.1%) |
Employment Industries by Sex in Lago Vista
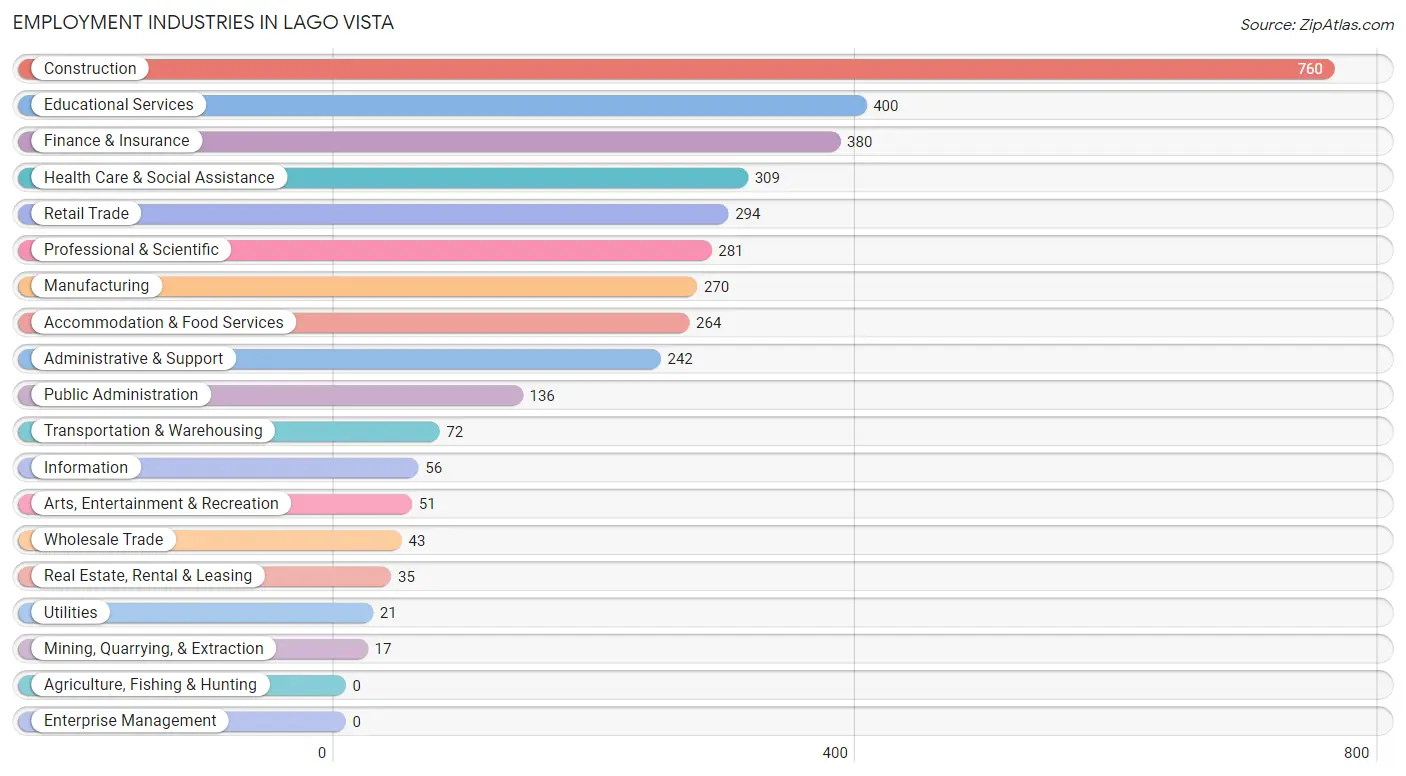
Employment Industries in Lago Vista
The major employment industries in Lago Vista include Construction (760 | 19.1%), Educational Services (400 | 10.1%), Finance & Insurance (380 | 9.6%), Health Care & Social Assistance (309 | 7.8%), and Retail Trade (294 | 7.4%).
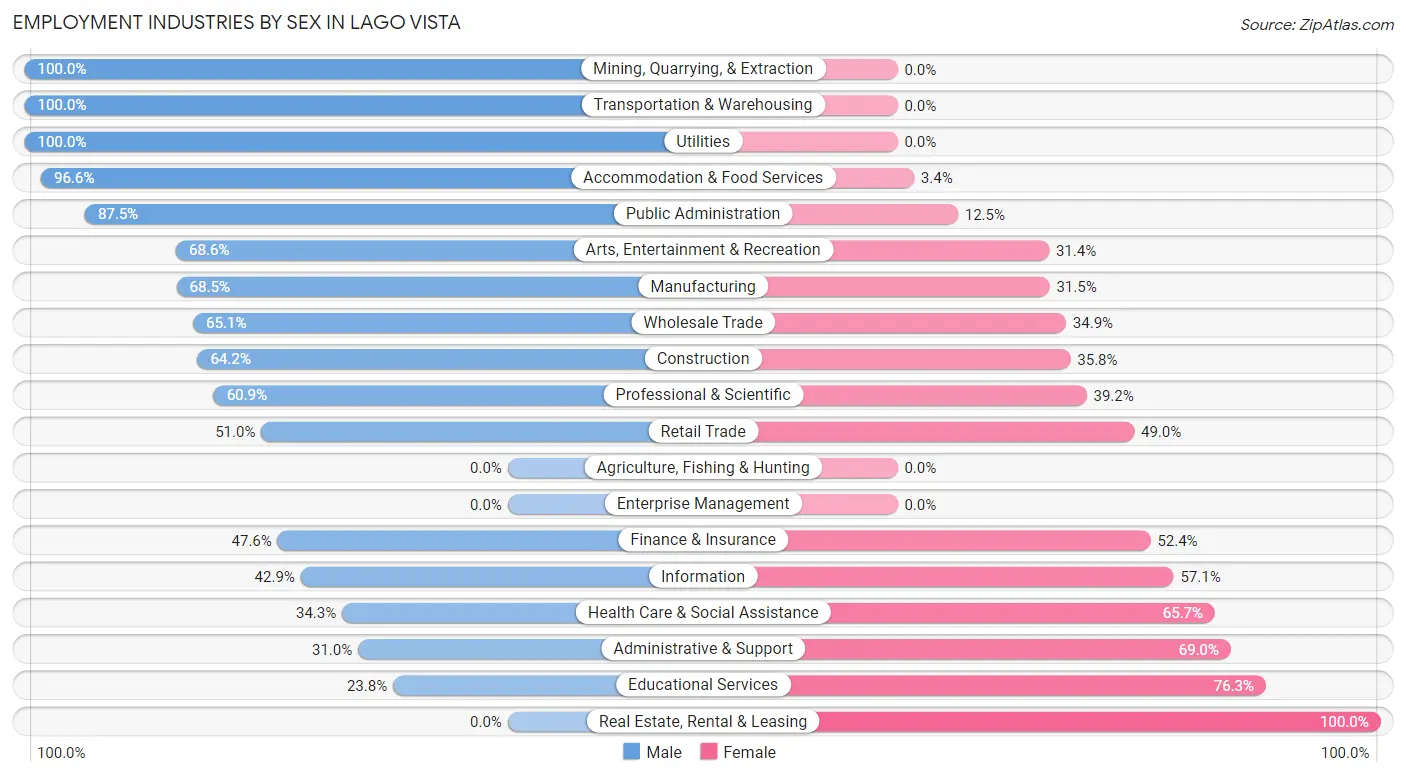
Employment Industries by Sex in Lago Vista
The Lago Vista industries that see more men than women are Mining, Quarrying, & Extraction (100.0%), Transportation & Warehousing (100.0%), and Utilities (100.0%), whereas the industries that tend to have a higher number of women are Real Estate, Rental & Leasing (100.0%), Educational Services (76.2%), and Administrative & Support (69.0%).
| Industry | Male | Female |
| Agriculture, Fishing & Hunting | 0 (0.0%) | 0 (0.0%) |
| Mining, Quarrying, & Extraction | 17 (100.0%) | 0 (0.0%) |
| Construction | 488 (64.2%) | 272 (35.8%) |
| Manufacturing | 185 (68.5%) | 85 (31.5%) |
| Wholesale Trade | 28 (65.1%) | 15 (34.9%) |
| Retail Trade | 150 (51.0%) | 144 (49.0%) |
| Transportation & Warehousing | 72 (100.0%) | 0 (0.0%) |
| Utilities | 21 (100.0%) | 0 (0.0%) |
| Information | 24 (42.9%) | 32 (57.1%) |
| Finance & Insurance | 181 (47.6%) | 199 (52.4%) |
| Real Estate, Rental & Leasing | 0 (0.0%) | 35 (100.0%) |
| Professional & Scientific | 171 (60.9%) | 110 (39.2%) |
| Enterprise Management | 0 (0.0%) | 0 (0.0%) |
| Administrative & Support | 75 (31.0%) | 167 (69.0%) |
| Educational Services | 95 (23.7%) | 305 (76.2%) |
| Health Care & Social Assistance | 106 (34.3%) | 203 (65.7%) |
| Arts, Entertainment & Recreation | 35 (68.6%) | 16 (31.4%) |
| Accommodation & Food Services | 255 (96.6%) | 9 (3.4%) |
| Public Administration | 119 (87.5%) | 17 (12.5%) |
| Total | 2,182 (54.9%) | 1,790 (45.1%) |
Education in Lago Vista
School Enrollment in Lago Vista
The most common levels of schooling among the 1,140 students in Lago Vista are middle school (327 | 28.7%), high school (251 | 22.0%), and kindergarten (181 | 15.9%).
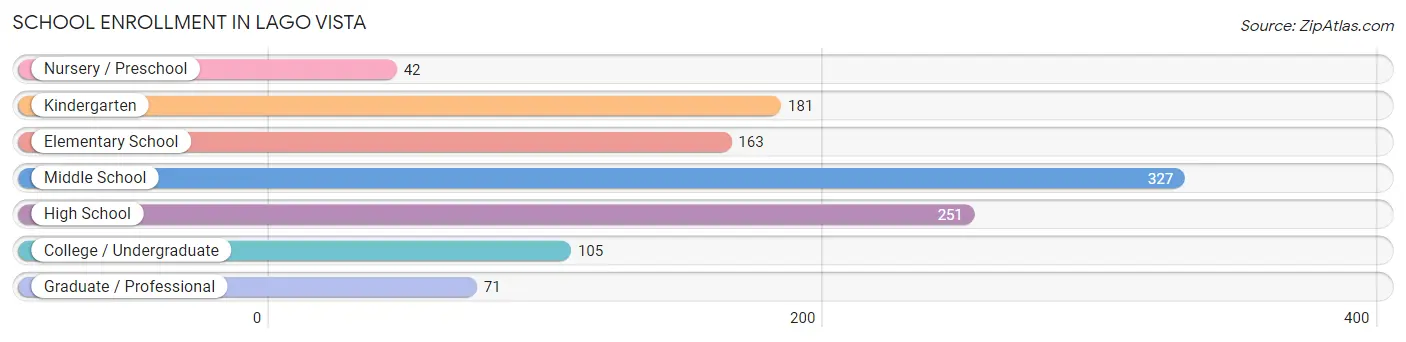
| School Level | # Students | % Students |
| Nursery / Preschool | 42 | 3.7% |
| Kindergarten | 181 | 15.9% |
| Elementary School | 163 | 14.3% |
| Middle School | 327 | 28.7% |
| High School | 251 | 22.0% |
| College / Undergraduate | 105 | 9.2% |
| Graduate / Professional | 71 | 6.2% |
| Total | 1,140 | 100.0% |
School Enrollment by Age by Funding Source in Lago Vista
Out of a total of 1,140 students who are enrolled in schools in Lago Vista, 290 (25.4%) attend a private institution, while the remaining 850 (74.6%) are enrolled in public schools. The age group of 3 to 4 year olds has the highest likelihood of being enrolled in private schools, with 27 (100.0% in the age bracket) enrolled. Conversely, the age group of 5 to 9 year old has the lowest likelihood of being enrolled in a private school, with 346 (100.0% in the age bracket) attending a public institution.
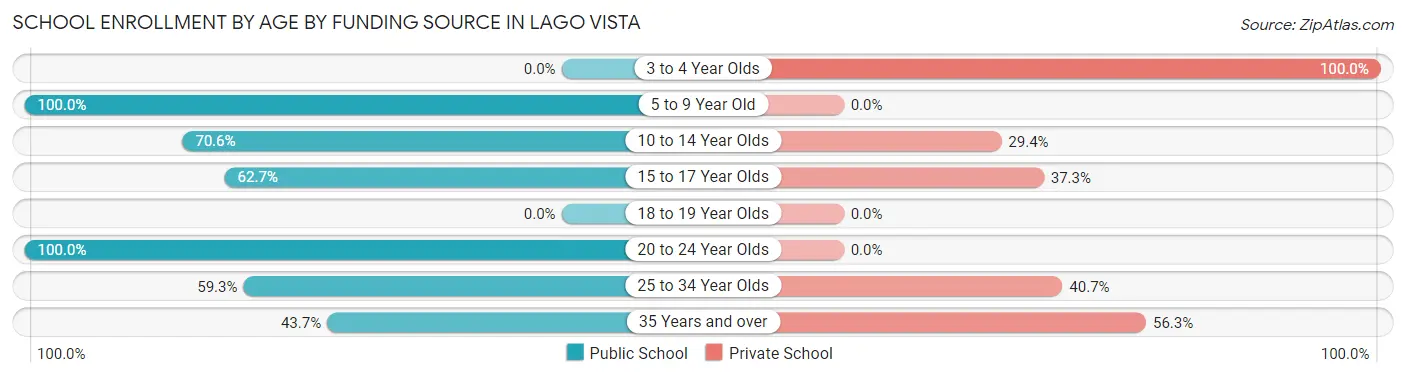
| Age Bracket | Public School | Private School |
| 3 to 4 Year Olds | 0 (0.0%) | 27 (100.0%) |
| 5 to 9 Year Old | 346 (100.0%) | 0 (0.0%) |
| 10 to 14 Year Olds | 262 (70.6%) | 109 (29.4%) |
| 15 to 17 Year Olds | 138 (62.7%) | 82 (37.3%) |
| 18 to 19 Year Olds | 0 (0.0%) | 0 (0.0%) |
| 20 to 24 Year Olds | 35 (100.0%) | 0 (0.0%) |
| 25 to 34 Year Olds | 32 (59.3%) | 22 (40.7%) |
| 35 Years and over | 38 (43.7%) | 49 (56.3%) |
| Total | 850 (74.6%) | 290 (25.4%) |
Educational Attainment by Field of Study in Lago Vista
Business (646 | 22.4%), education (317 | 11.0%), bio, nature & agricultural (281 | 9.7%), visual & performing arts (261 | 9.0%), and social sciences (232 | 8.0%) are the most common fields of study among 2,886 individuals in Lago Vista who have obtained a bachelor's degree or higher.
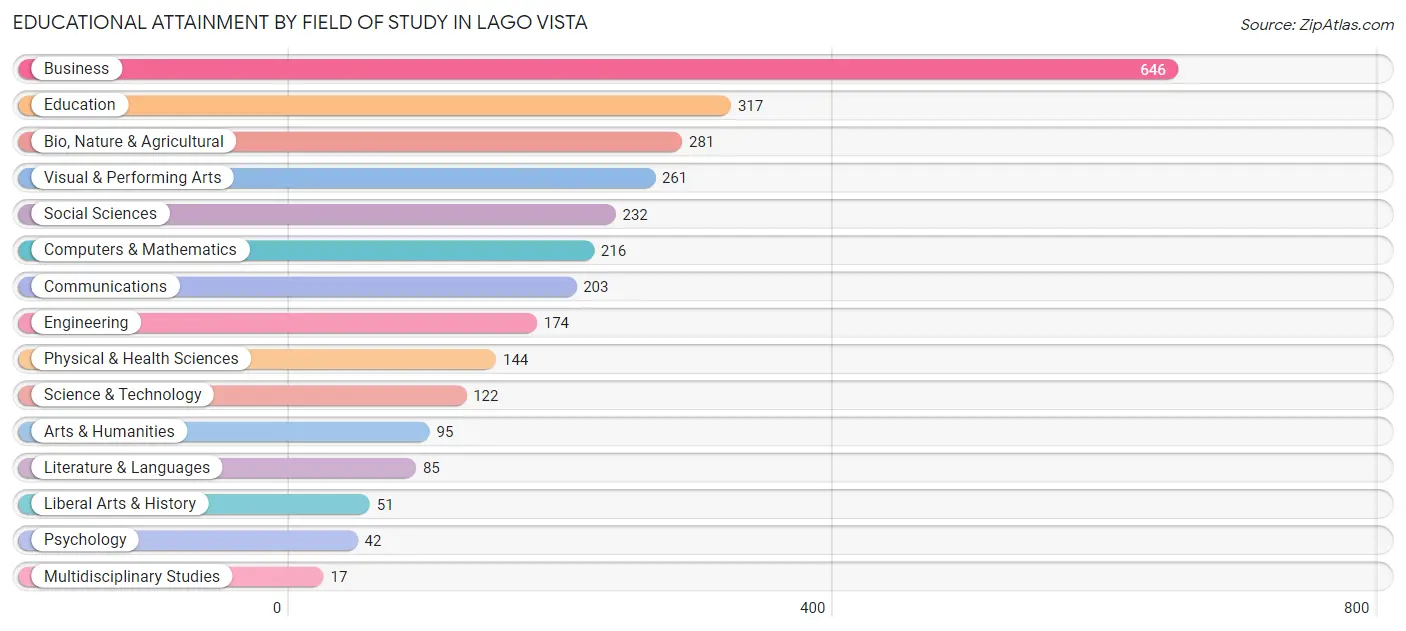
| Field of Study | # Graduates | % Graduates |
| Computers & Mathematics | 216 | 7.5% |
| Bio, Nature & Agricultural | 281 | 9.7% |
| Physical & Health Sciences | 144 | 5.0% |
| Psychology | 42 | 1.5% |
| Social Sciences | 232 | 8.0% |
| Engineering | 174 | 6.0% |
| Multidisciplinary Studies | 17 | 0.6% |
| Science & Technology | 122 | 4.2% |
| Business | 646 | 22.4% |
| Education | 317 | 11.0% |
| Literature & Languages | 85 | 2.9% |
| Liberal Arts & History | 51 | 1.8% |
| Visual & Performing Arts | 261 | 9.0% |
| Communications | 203 | 7.0% |
| Arts & Humanities | 95 | 3.3% |
| Total | 2,886 | 100.0% |
Transportation & Commute in Lago Vista
Vehicle Availability by Sex in Lago Vista
The most prevalent vehicle ownership categories in Lago Vista are males with 2 vehicles (959, accounting for 43.5%) and females with 2 vehicles (926, making up 55.0%).
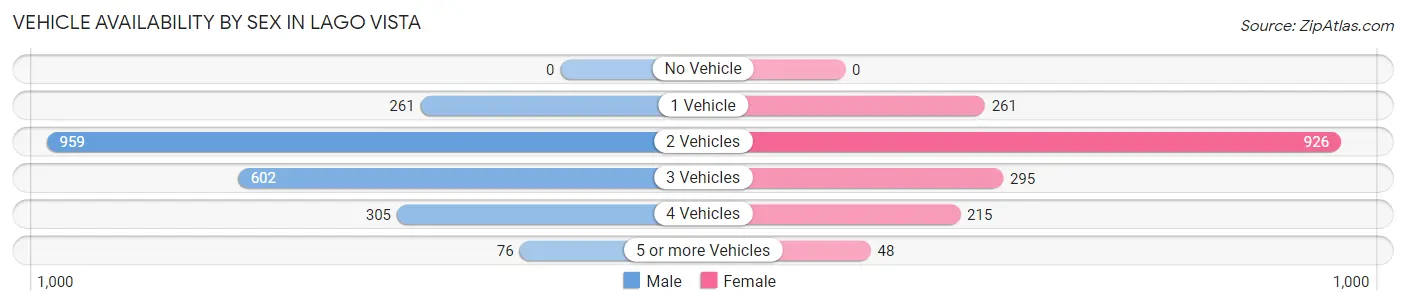
| Vehicles Available | Male | Female |
| No Vehicle | 0 (0.0%) | 0 (0.0%) |
| 1 Vehicle | 261 (11.8%) | 261 (15.0%) |
| 2 Vehicles | 959 (43.5%) | 926 (53.1%) |
| 3 Vehicles | 602 (27.3%) | 295 (16.9%) |
| 4 Vehicles | 305 (13.8%) | 215 (12.3%) |
| 5 or more Vehicles | 76 (3.5%) | 48 (2.8%) |
| Total | 2,203 (100.0%) | 1,745 (100.0%) |
Commute Time in Lago Vista
The most frequently occuring commute durations in Lago Vista are 45 to 59 minutes (830 commuters, 24.9%), 60 to 89 minutes (477 commuters, 14.3%), and 20 to 24 minutes (301 commuters, 9.0%).
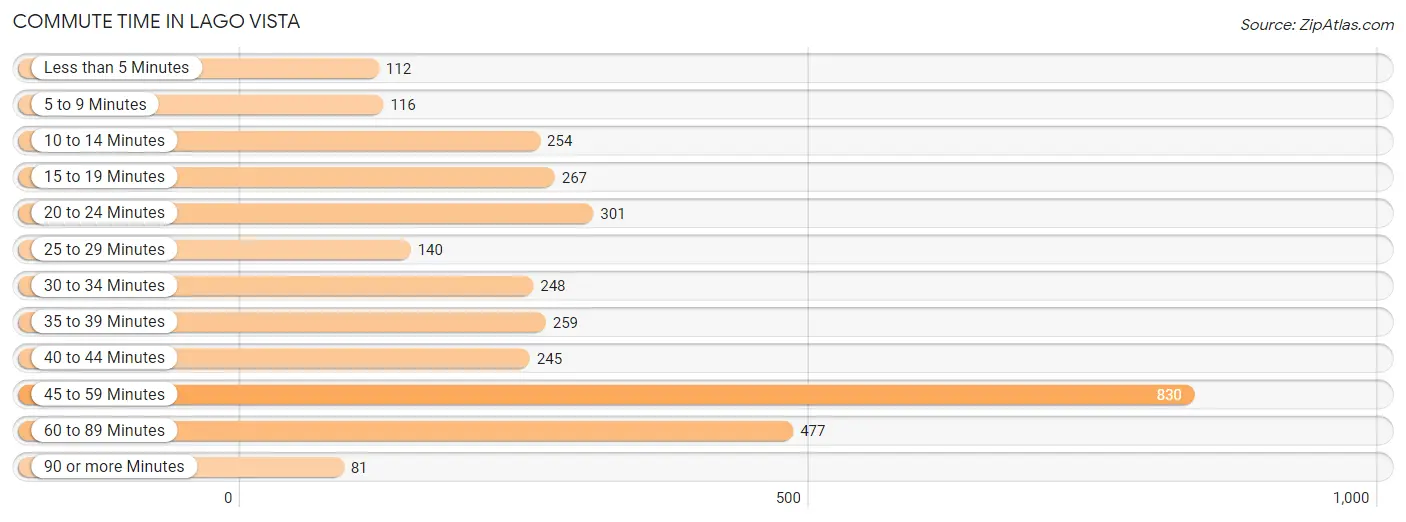
| Commute Time | # Commuters | % Commuters |
| Less than 5 Minutes | 112 | 3.4% |
| 5 to 9 Minutes | 116 | 3.5% |
| 10 to 14 Minutes | 254 | 7.6% |
| 15 to 19 Minutes | 267 | 8.0% |
| 20 to 24 Minutes | 301 | 9.0% |
| 25 to 29 Minutes | 140 | 4.2% |
| 30 to 34 Minutes | 248 | 7.4% |
| 35 to 39 Minutes | 259 | 7.8% |
| 40 to 44 Minutes | 245 | 7.4% |
| 45 to 59 Minutes | 830 | 24.9% |
| 60 to 89 Minutes | 477 | 14.3% |
| 90 or more Minutes | 81 | 2.4% |
Commute Time by Sex in Lago Vista
The most common commute times in Lago Vista are 45 to 59 minutes (652 commuters, 33.3%) for males and 60 to 89 minutes (233 commuters, 17.0%) for females.
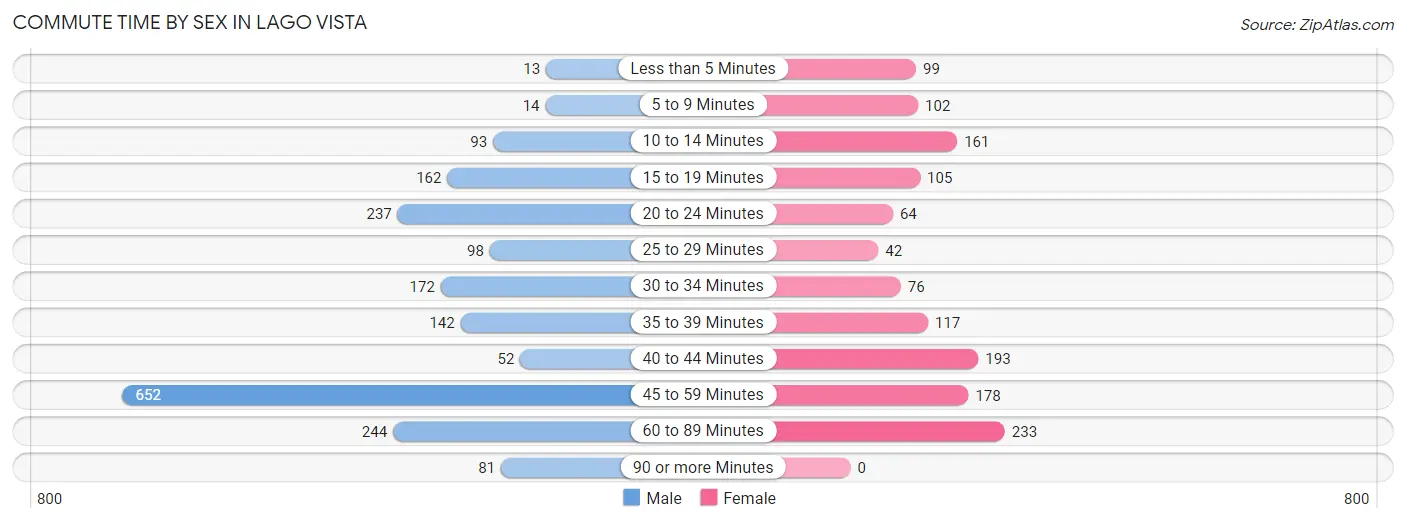
| Commute Time | Male | Female |
| Less than 5 Minutes | 13 (0.7%) | 99 (7.2%) |
| 5 to 9 Minutes | 14 (0.7%) | 102 (7.4%) |
| 10 to 14 Minutes | 93 (4.7%) | 161 (11.7%) |
| 15 to 19 Minutes | 162 (8.3%) | 105 (7.7%) |
| 20 to 24 Minutes | 237 (12.1%) | 64 (4.7%) |
| 25 to 29 Minutes | 98 (5.0%) | 42 (3.1%) |
| 30 to 34 Minutes | 172 (8.8%) | 76 (5.6%) |
| 35 to 39 Minutes | 142 (7.2%) | 117 (8.5%) |
| 40 to 44 Minutes | 52 (2.6%) | 193 (14.1%) |
| 45 to 59 Minutes | 652 (33.3%) | 178 (13.0%) |
| 60 to 89 Minutes | 244 (12.4%) | 233 (17.0%) |
| 90 or more Minutes | 81 (4.1%) | 0 (0.0%) |
Time of Departure to Work by Sex in Lago Vista
The most frequent times of departure to work in Lago Vista are 6:30 AM to 6:59 AM (454, 23.2%) for males and 7:00 AM to 7:29 AM (370, 27.0%) for females.
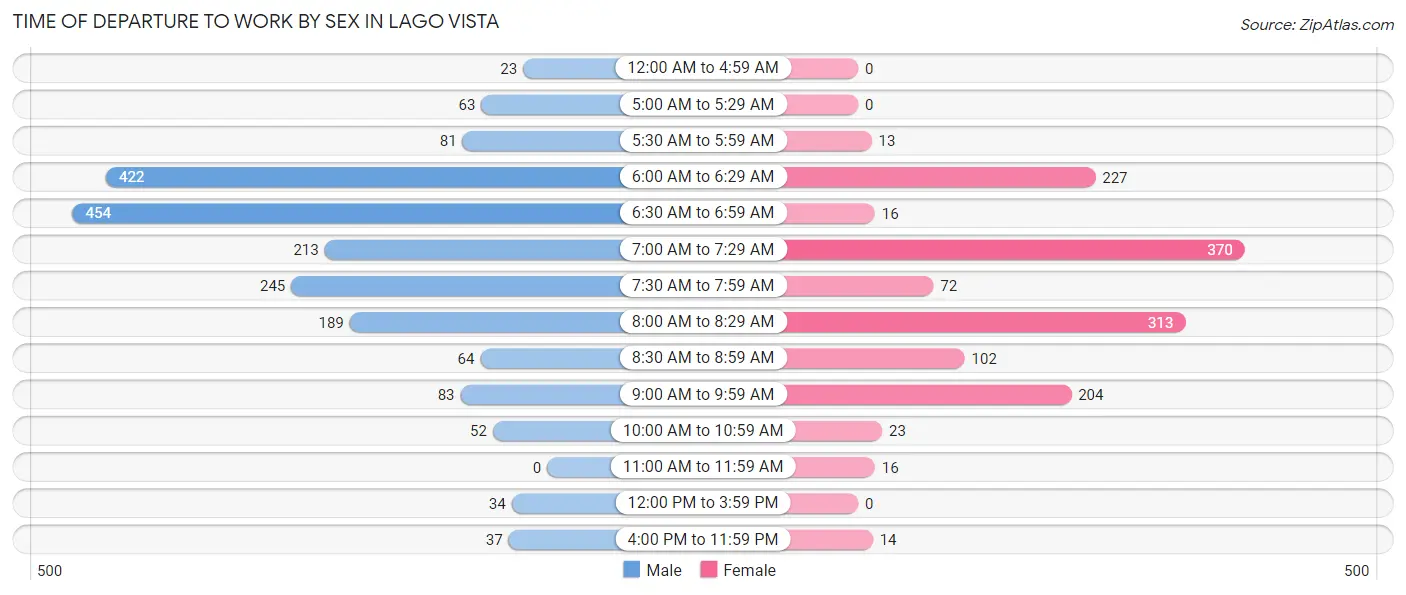
| Time of Departure | Male | Female |
| 12:00 AM to 4:59 AM | 23 (1.2%) | 0 (0.0%) |
| 5:00 AM to 5:29 AM | 63 (3.2%) | 0 (0.0%) |
| 5:30 AM to 5:59 AM | 81 (4.1%) | 13 (0.9%) |
| 6:00 AM to 6:29 AM | 422 (21.5%) | 227 (16.6%) |
| 6:30 AM to 6:59 AM | 454 (23.2%) | 16 (1.2%) |
| 7:00 AM to 7:29 AM | 213 (10.9%) | 370 (27.0%) |
| 7:30 AM to 7:59 AM | 245 (12.5%) | 72 (5.3%) |
| 8:00 AM to 8:29 AM | 189 (9.6%) | 313 (22.9%) |
| 8:30 AM to 8:59 AM | 64 (3.3%) | 102 (7.4%) |
| 9:00 AM to 9:59 AM | 83 (4.2%) | 204 (14.9%) |
| 10:00 AM to 10:59 AM | 52 (2.6%) | 23 (1.7%) |
| 11:00 AM to 11:59 AM | 0 (0.0%) | 16 (1.2%) |
| 12:00 PM to 3:59 PM | 34 (1.7%) | 0 (0.0%) |
| 4:00 PM to 11:59 PM | 37 (1.9%) | 14 (1.0%) |
| Total | 1,960 (100.0%) | 1,370 (100.0%) |
Housing Occupancy in Lago Vista
Occupancy by Ownership in Lago Vista
Of the total 3,889 dwellings in Lago Vista, owner-occupied units account for 3,380 (86.9%), while renter-occupied units make up 509 (13.1%).
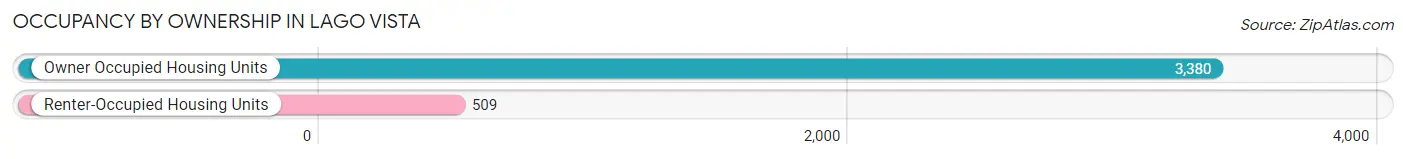
| Occupancy | # Housing Units | % Housing Units |
| Owner Occupied Housing Units | 3,380 | 86.9% |
| Renter-Occupied Housing Units | 509 | 13.1% |
| Total Occupied Housing Units | 3,889 | 100.0% |
Occupancy by Household Size in Lago Vista
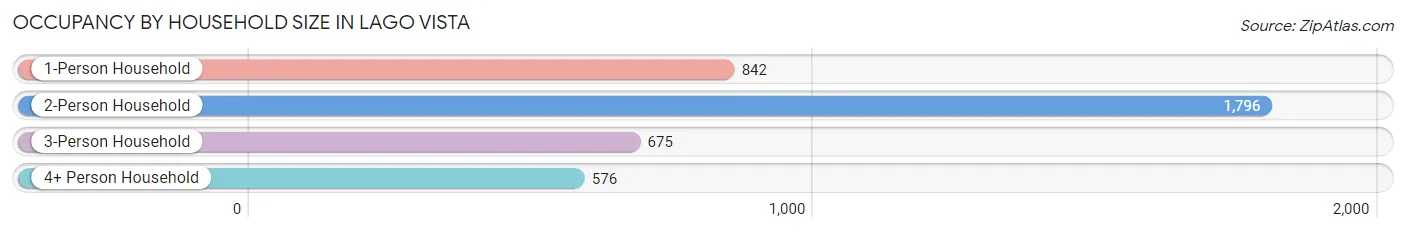
| Household Size | # Housing Units | % Housing Units |
| 1-Person Household | 842 | 21.6% |
| 2-Person Household | 1,796 | 46.2% |
| 3-Person Household | 675 | 17.4% |
| 4+ Person Household | 576 | 14.8% |
| Total Housing Units | 3,889 | 100.0% |
Occupancy by Ownership by Household Size in Lago Vista
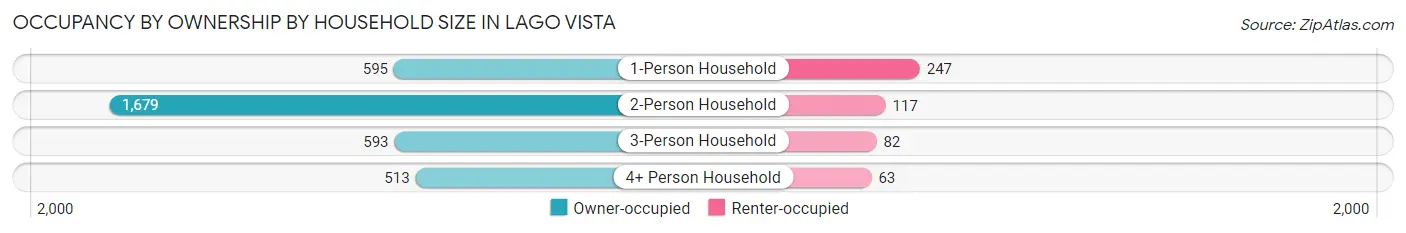
| Household Size | Owner-occupied | Renter-occupied |
| 1-Person Household | 595 (70.7%) | 247 (29.3%) |
| 2-Person Household | 1,679 (93.5%) | 117 (6.5%) |
| 3-Person Household | 593 (87.8%) | 82 (12.1%) |
| 4+ Person Household | 513 (89.1%) | 63 (10.9%) |
| Total Housing Units | 3,380 (86.9%) | 509 (13.1%) |
Occupancy by Educational Attainment in Lago Vista
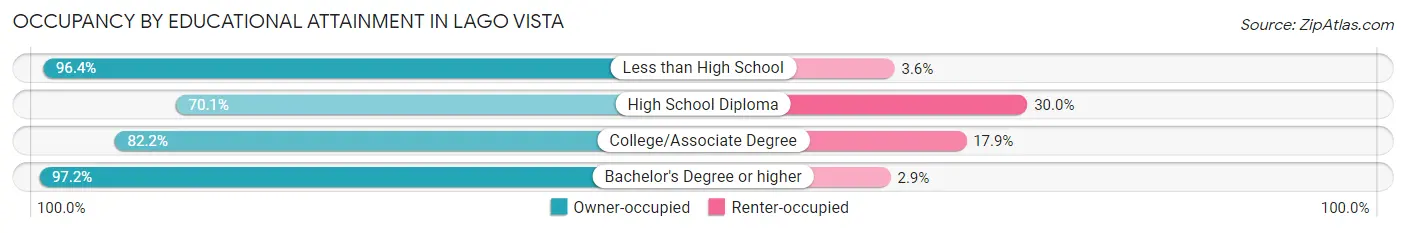
| Household Size | Owner-occupied | Renter-occupied |
| Less than High School | 344 (96.4%) | 13 (3.6%) |
| High School Diploma | 531 (70.1%) | 227 (29.9%) |
| College/Associate Degree | 1,040 (82.2%) | 226 (17.8%) |
| Bachelor's Degree or higher | 1,465 (97.2%) | 43 (2.9%) |
Occupancy by Age of Householder in Lago Vista
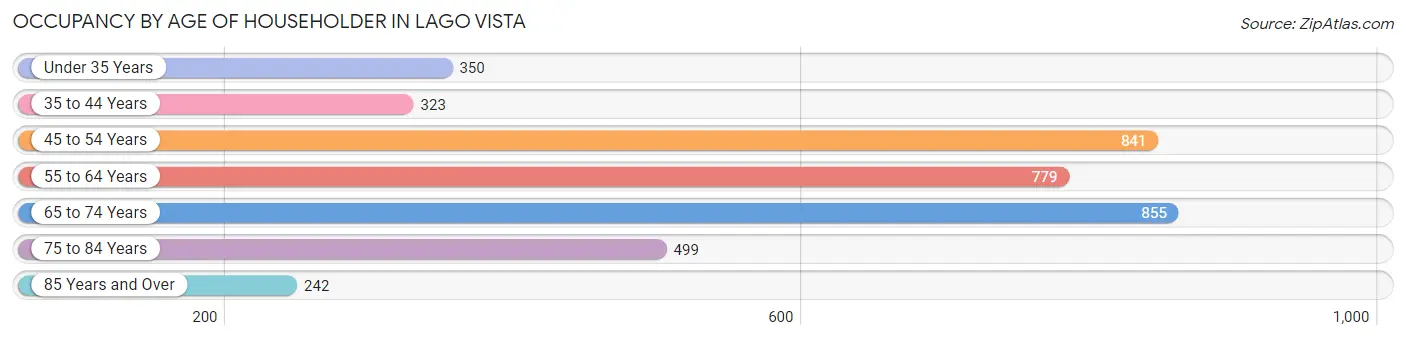
| Age Bracket | # Households | % Households |
| Under 35 Years | 350 | 9.0% |
| 35 to 44 Years | 323 | 8.3% |
| 45 to 54 Years | 841 | 21.6% |
| 55 to 64 Years | 779 | 20.0% |
| 65 to 74 Years | 855 | 22.0% |
| 75 to 84 Years | 499 | 12.8% |
| 85 Years and Over | 242 | 6.2% |
| Total | 3,889 | 100.0% |
Housing Finances in Lago Vista
Median Income by Occupancy in Lago Vista
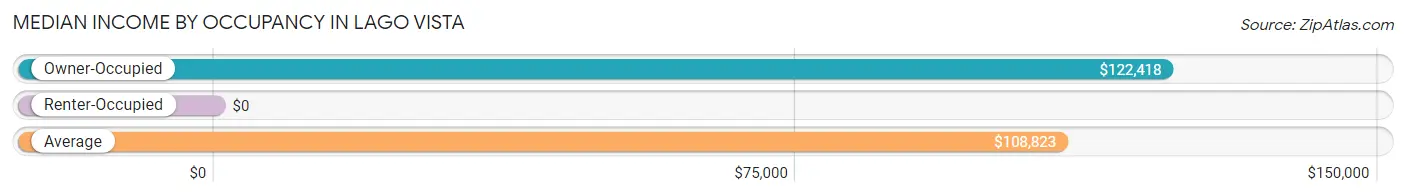
| Occupancy Type | # Households | Median Income |
| Owner-Occupied | 3,380 (86.9%) | $122,418 |
| Renter-Occupied | 509 (13.1%) | $0 |
| Average | 3,889 (100.0%) | $108,823 |
Occupancy by Householder Income Bracket in Lago Vista
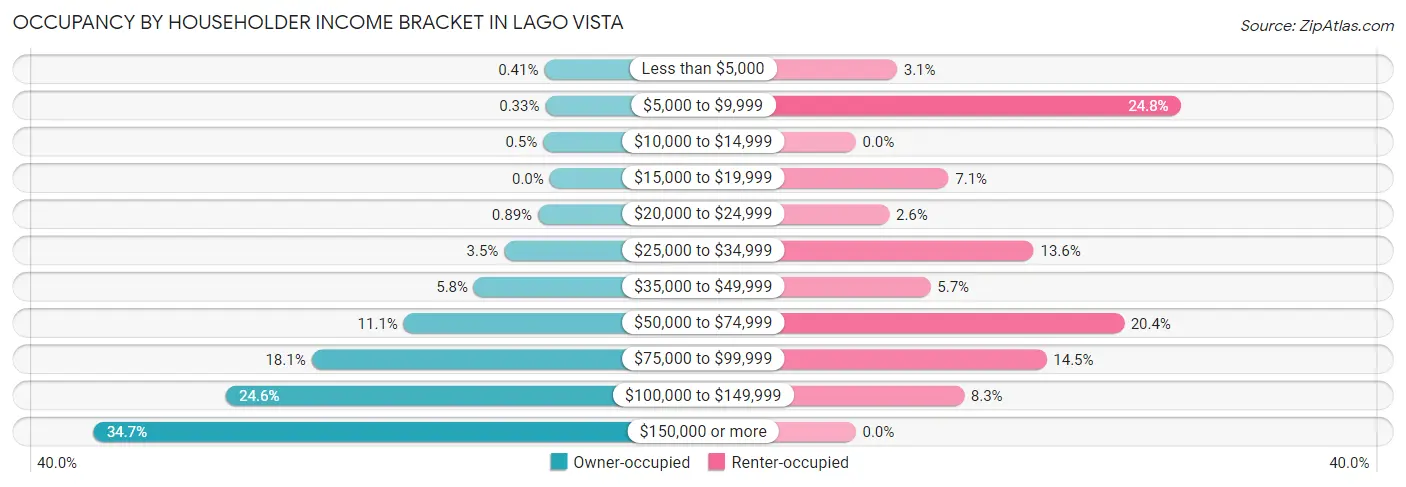
| Income Bracket | Owner-occupied | Renter-occupied |
| Less than $5,000 | 14 (0.4%) | 16 (3.1%) |
| $5,000 to $9,999 | 11 (0.3%) | 126 (24.7%) |
| $10,000 to $14,999 | 17 (0.5%) | 0 (0.0%) |
| $15,000 to $19,999 | 0 (0.0%) | 36 (7.1%) |
| $20,000 to $24,999 | 30 (0.9%) | 13 (2.5%) |
| $25,000 to $34,999 | 117 (3.5%) | 69 (13.6%) |
| $35,000 to $49,999 | 195 (5.8%) | 29 (5.7%) |
| $50,000 to $74,999 | 376 (11.1%) | 104 (20.4%) |
| $75,000 to $99,999 | 613 (18.1%) | 74 (14.5%) |
| $100,000 to $149,999 | 833 (24.6%) | 42 (8.3%) |
| $150,000 or more | 1,174 (34.7%) | 0 (0.0%) |
| Total | 3,380 (100.0%) | 509 (100.0%) |
Monthly Housing Cost Tiers in Lago Vista
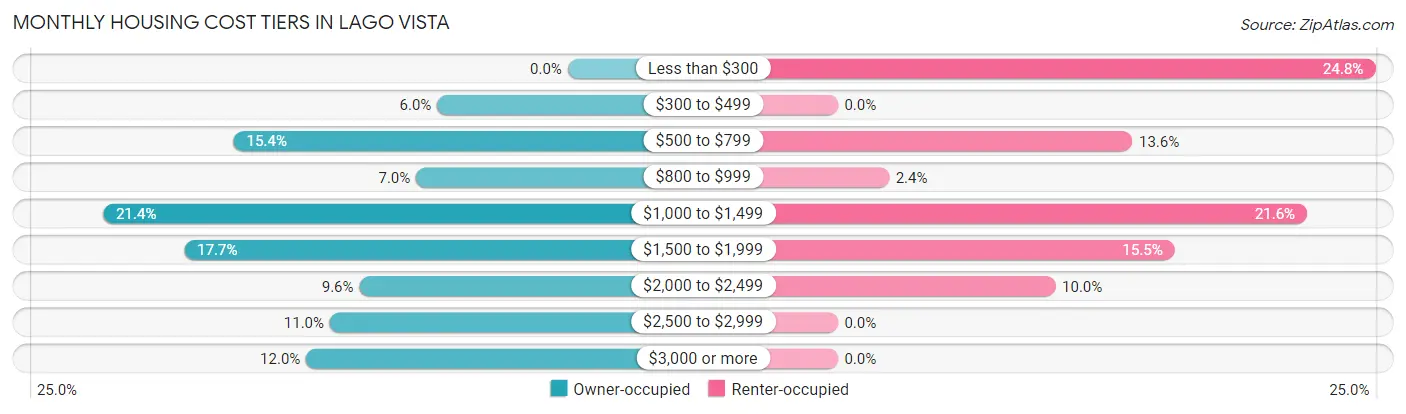
| Monthly Cost | Owner-occupied | Renter-occupied |
| Less than $300 | 0 (0.0%) | 126 (24.7%) |
| $300 to $499 | 203 (6.0%) | 0 (0.0%) |
| $500 to $799 | 520 (15.4%) | 69 (13.6%) |
| $800 to $999 | 236 (7.0%) | 12 (2.4%) |
| $1,000 to $1,499 | 723 (21.4%) | 110 (21.6%) |
| $1,500 to $1,999 | 597 (17.7%) | 79 (15.5%) |
| $2,000 to $2,499 | 324 (9.6%) | 51 (10.0%) |
| $2,500 to $2,999 | 370 (11.0%) | 0 (0.0%) |
| $3,000 or more | 407 (12.0%) | 0 (0.0%) |
| Total | 3,380 (100.0%) | 509 (100.0%) |
Physical Housing Characteristics in Lago Vista
Housing Structures in Lago Vista
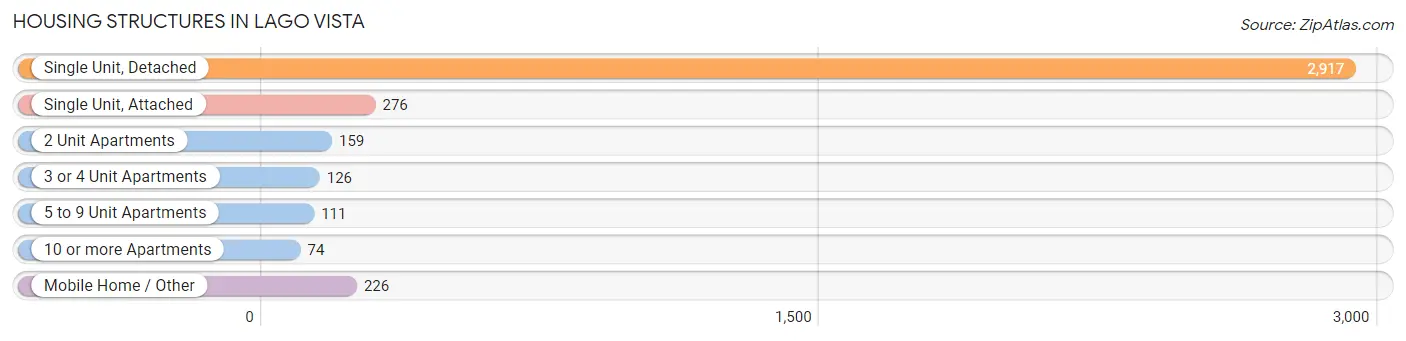
| Structure Type | # Housing Units | % Housing Units |
| Single Unit, Detached | 2,917 | 75.0% |
| Single Unit, Attached | 276 | 7.1% |
| 2 Unit Apartments | 159 | 4.1% |
| 3 or 4 Unit Apartments | 126 | 3.2% |
| 5 to 9 Unit Apartments | 111 | 2.9% |
| 10 or more Apartments | 74 | 1.9% |
| Mobile Home / Other | 226 | 5.8% |
| Total | 3,889 | 100.0% |
Housing Structures by Occupancy in Lago Vista
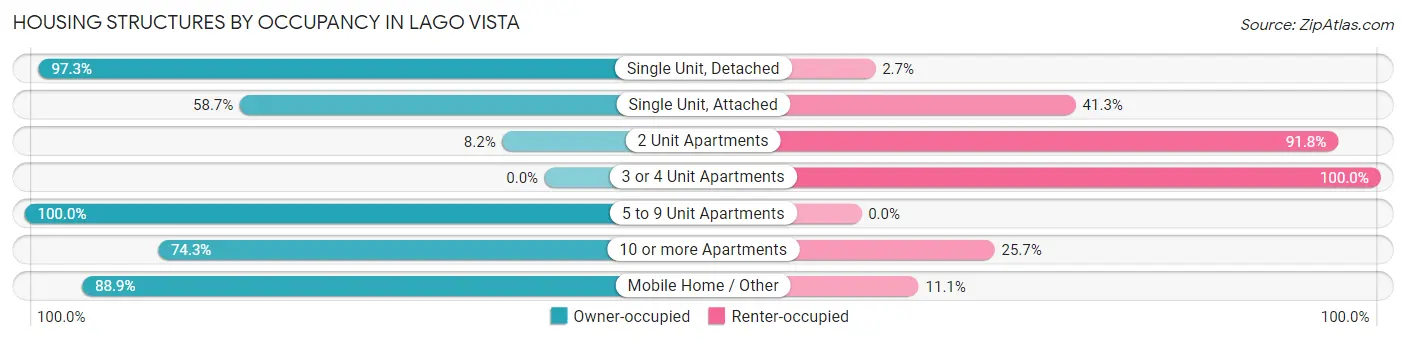
| Structure Type | Owner-occupied | Renter-occupied |
| Single Unit, Detached | 2,838 (97.3%) | 79 (2.7%) |
| Single Unit, Attached | 162 (58.7%) | 114 (41.3%) |
| 2 Unit Apartments | 13 (8.2%) | 146 (91.8%) |
| 3 or 4 Unit Apartments | 0 (0.0%) | 126 (100.0%) |
| 5 to 9 Unit Apartments | 111 (100.0%) | 0 (0.0%) |
| 10 or more Apartments | 55 (74.3%) | 19 (25.7%) |
| Mobile Home / Other | 201 (88.9%) | 25 (11.1%) |
| Total | 3,380 (86.9%) | 509 (13.1%) |
Housing Structures by Number of Rooms in Lago Vista
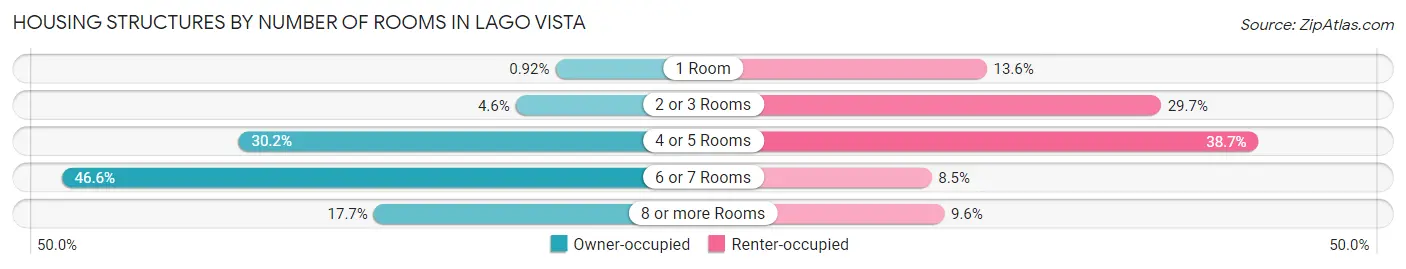
| Number of Rooms | Owner-occupied | Renter-occupied |
| 1 Room | 31 (0.9%) | 69 (13.6%) |
| 2 or 3 Rooms | 155 (4.6%) | 151 (29.7%) |
| 4 or 5 Rooms | 1,021 (30.2%) | 197 (38.7%) |
| 6 or 7 Rooms | 1,574 (46.6%) | 43 (8.5%) |
| 8 or more Rooms | 599 (17.7%) | 49 (9.6%) |
| Total | 3,380 (100.0%) | 509 (100.0%) |
Housing Structure by Heating Type in Lago Vista
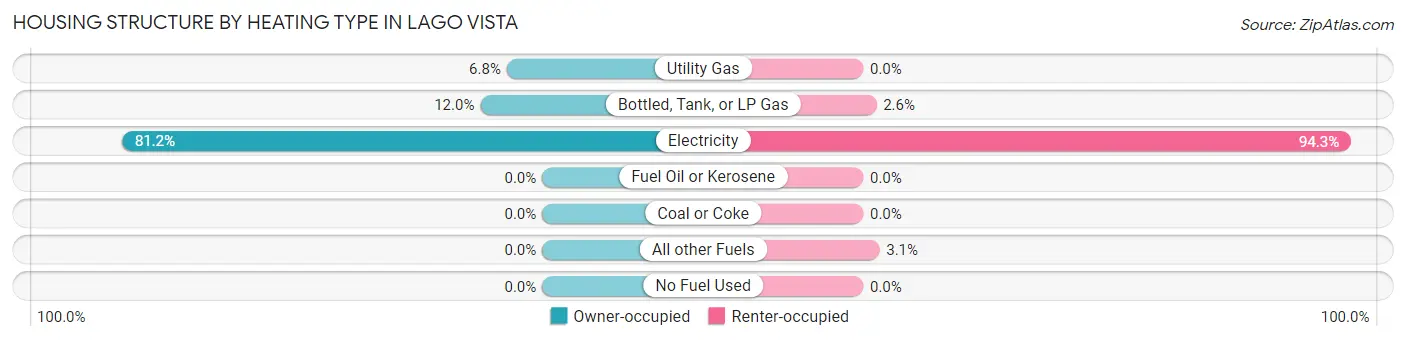
| Heating Type | Owner-occupied | Renter-occupied |
| Utility Gas | 231 (6.8%) | 0 (0.0%) |
| Bottled, Tank, or LP Gas | 404 (11.9%) | 13 (2.5%) |
| Electricity | 2,745 (81.2%) | 480 (94.3%) |
| Fuel Oil or Kerosene | 0 (0.0%) | 0 (0.0%) |
| Coal or Coke | 0 (0.0%) | 0 (0.0%) |
| All other Fuels | 0 (0.0%) | 16 (3.1%) |
| No Fuel Used | 0 (0.0%) | 0 (0.0%) |
| Total | 3,380 (100.0%) | 509 (100.0%) |
Household Vehicle Usage in Lago Vista
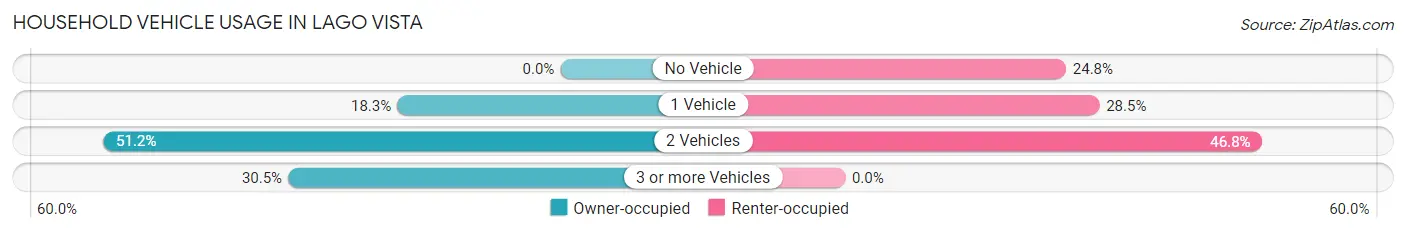
| Vehicles per Household | Owner-occupied | Renter-occupied |
| No Vehicle | 0 (0.0%) | 126 (24.7%) |
| 1 Vehicle | 618 (18.3%) | 145 (28.5%) |
| 2 Vehicles | 1,731 (51.2%) | 238 (46.8%) |
| 3 or more Vehicles | 1,031 (30.5%) | 0 (0.0%) |
| Total | 3,380 (100.0%) | 509 (100.0%) |
Real Estate & Mortgages in Lago Vista
Real Estate and Mortgage Overview in Lago Vista
| Characteristic | Without Mortgage | With Mortgage |
| Housing Units | 1,337 | 2,043 |
| Median Property Value | $322,300 | $382,300 |
| Median Household Income | $84,721 | $961 |
| Monthly Housing Costs | $799 | $407 |
| Real Estate Taxes | $4,366 | $157 |
Property Value by Mortgage Status in Lago Vista
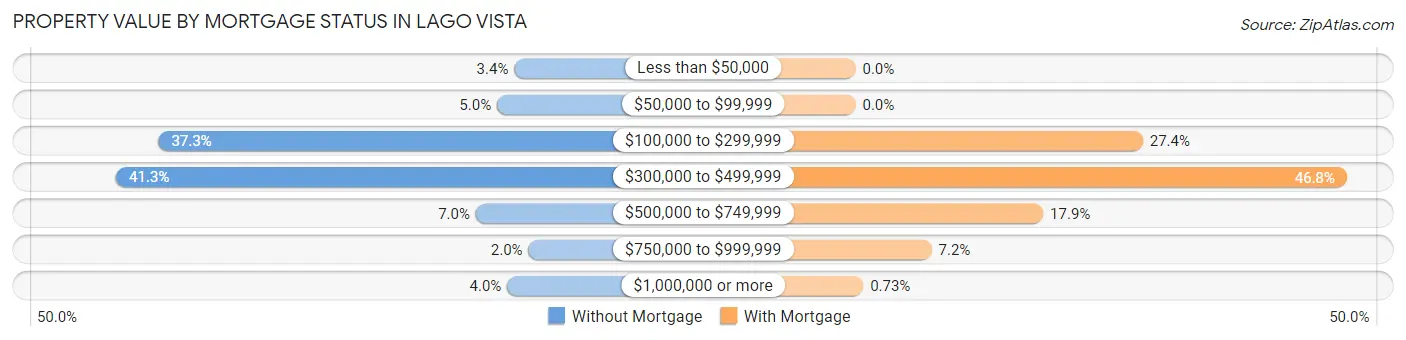
| Property Value | Without Mortgage | With Mortgage |
| Less than $50,000 | 45 (3.4%) | 0 (0.0%) |
| $50,000 to $99,999 | 67 (5.0%) | 0 (0.0%) |
| $100,000 to $299,999 | 498 (37.2%) | 559 (27.4%) |
| $300,000 to $499,999 | 552 (41.3%) | 956 (46.8%) |
| $500,000 to $749,999 | 94 (7.0%) | 365 (17.9%) |
| $750,000 to $999,999 | 27 (2.0%) | 148 (7.2%) |
| $1,000,000 or more | 54 (4.0%) | 15 (0.7%) |
| Total | 1,337 (100.0%) | 2,043 (100.0%) |
Household Income by Mortgage Status in Lago Vista
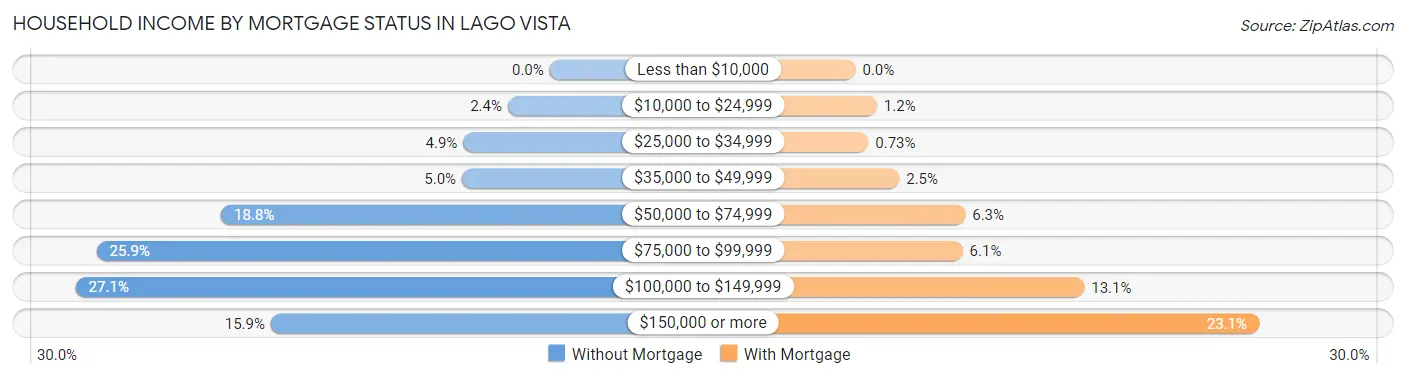
| Household Income | Without Mortgage | With Mortgage |
| Less than $10,000 | 0 (0.0%) | 0 (0.0%) |
| $10,000 to $24,999 | 32 (2.4%) | 25 (1.2%) |
| $25,000 to $34,999 | 66 (4.9%) | 15 (0.7%) |
| $35,000 to $49,999 | 67 (5.0%) | 51 (2.5%) |
| $50,000 to $74,999 | 251 (18.8%) | 128 (6.3%) |
| $75,000 to $99,999 | 346 (25.9%) | 125 (6.1%) |
| $100,000 to $149,999 | 362 (27.1%) | 267 (13.1%) |
| $150,000 or more | 213 (15.9%) | 471 (23.1%) |
| Total | 1,337 (100.0%) | 2,043 (100.0%) |
Property Value to Household Income Ratio in Lago Vista
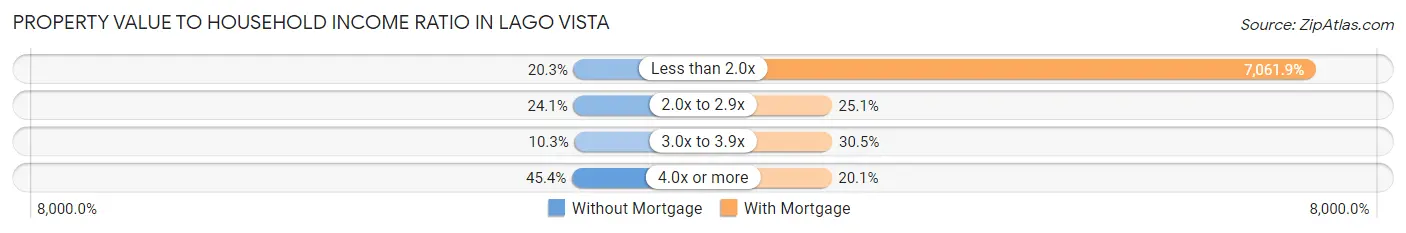
| Value-to-Income Ratio | Without Mortgage | With Mortgage |
| Less than 2.0x | 271 (20.3%) | 144,275 (7,061.9%) |
| 2.0x to 2.9x | 322 (24.1%) | 512 (25.1%) |
| 3.0x to 3.9x | 137 (10.2%) | 623 (30.5%) |
| 4.0x or more | 607 (45.4%) | 411 (20.1%) |
| Total | 1,337 (100.0%) | 2,043 (100.0%) |
Real Estate Taxes by Mortgage Status in Lago Vista

| Property Taxes | Without Mortgage | With Mortgage |
| Less than $800 | 132 (9.9%) | 0 (0.0%) |
| $800 to $1,499 | 112 (8.4%) | 8 (0.4%) |
| $800 to $1,499 | 1,093 (81.8%) | 28 (1.4%) |
| Total | 1,337 (100.0%) | 2,043 (100.0%) |
Health & Disability in Lago Vista
Health Insurance Coverage by Age in Lago Vista
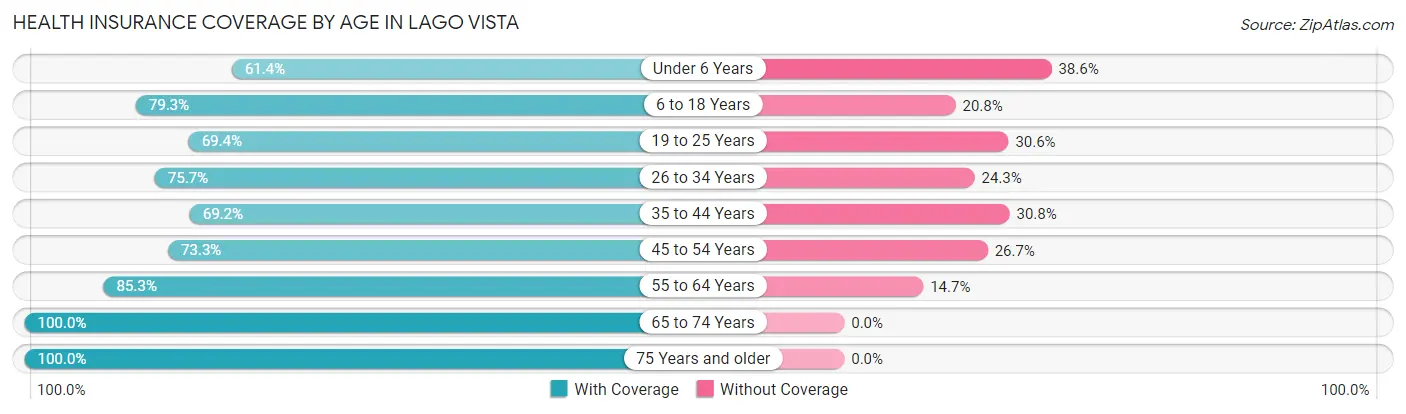
| Age Bracket | With Coverage | Without Coverage |
| Under 6 Years | 235 (61.4%) | 148 (38.6%) |
| 6 to 18 Years | 680 (79.2%) | 178 (20.7%) |
| 19 to 25 Years | 170 (69.4%) | 75 (30.6%) |
| 26 to 34 Years | 645 (75.7%) | 207 (24.3%) |
| 35 to 44 Years | 676 (69.2%) | 301 (30.8%) |
| 45 to 54 Years | 1,085 (73.3%) | 396 (26.7%) |
| 55 to 64 Years | 1,500 (85.3%) | 259 (14.7%) |
| 65 to 74 Years | 1,304 (100.0%) | 0 (0.0%) |
| 75 Years and older | 1,121 (100.0%) | 0 (0.0%) |
| Total | 7,416 (82.6%) | 1,564 (17.4%) |
Health Insurance Coverage by Citizenship Status in Lago Vista

| Citizenship Status | With Coverage | Without Coverage |
| Native Born | 235 (61.4%) | 148 (38.6%) |
| Foreign Born, Citizen | 680 (79.2%) | 178 (20.7%) |
| Foreign Born, not a Citizen | 170 (69.4%) | 75 (30.6%) |
Health Insurance Coverage by Household Income in Lago Vista
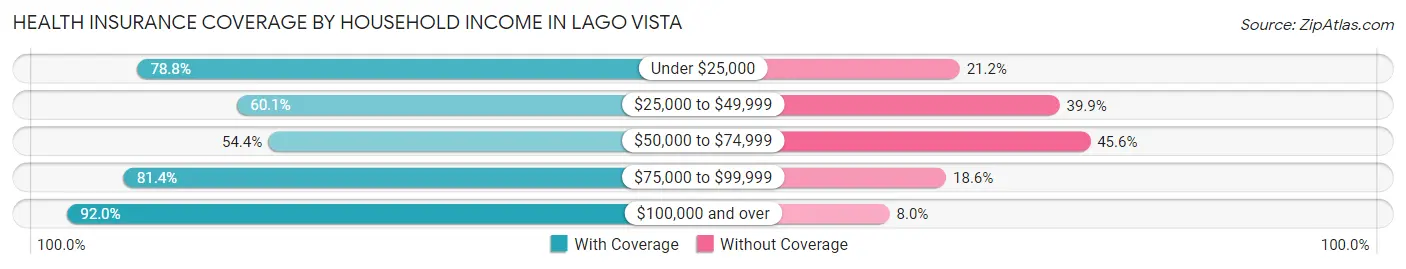
| Household Income | With Coverage | Without Coverage |
| Under $25,000 | 272 (78.8%) | 73 (21.2%) |
| $25,000 to $49,999 | 436 (60.1%) | 289 (39.9%) |
| $50,000 to $74,999 | 582 (54.4%) | 488 (45.6%) |
| $75,000 to $99,999 | 1,273 (81.4%) | 291 (18.6%) |
| $100,000 and over | 4,853 (92.0%) | 423 (8.0%) |
Public vs Private Health Insurance Coverage by Age in Lago Vista
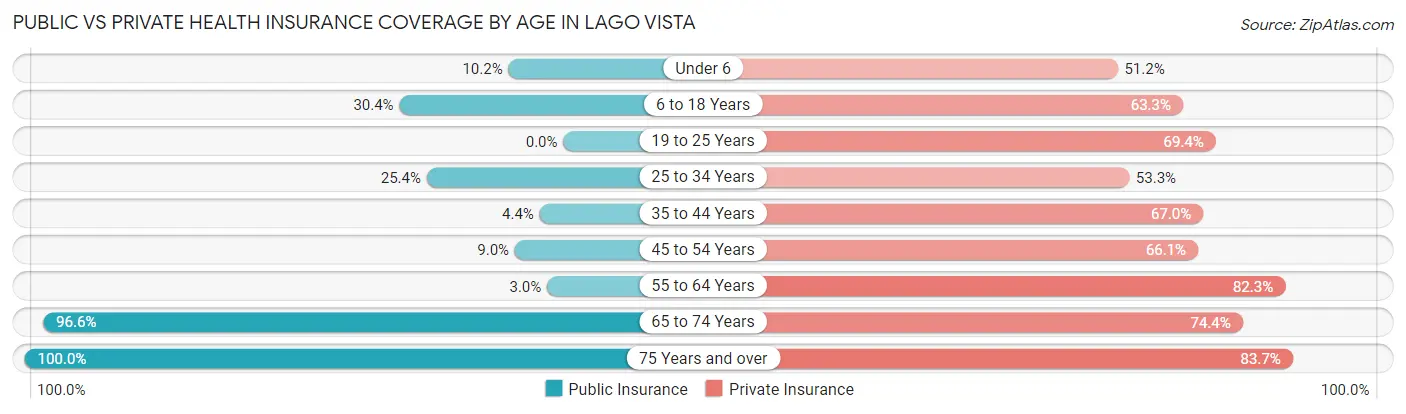
| Age Bracket | Public Insurance | Private Insurance |
| Under 6 | 39 (10.2%) | 196 (51.2%) |
| 6 to 18 Years | 261 (30.4%) | 543 (63.3%) |
| 19 to 25 Years | 0 (0.0%) | 170 (69.4%) |
| 25 to 34 Years | 216 (25.4%) | 454 (53.3%) |
| 35 to 44 Years | 43 (4.4%) | 655 (67.0%) |
| 45 to 54 Years | 133 (9.0%) | 979 (66.1%) |
| 55 to 64 Years | 53 (3.0%) | 1,447 (82.3%) |
| 65 to 74 Years | 1,259 (96.6%) | 970 (74.4%) |
| 75 Years and over | 1,121 (100.0%) | 938 (83.7%) |
| Total | 3,125 (34.8%) | 6,352 (70.7%) |
Disability Status by Sex by Age in Lago Vista
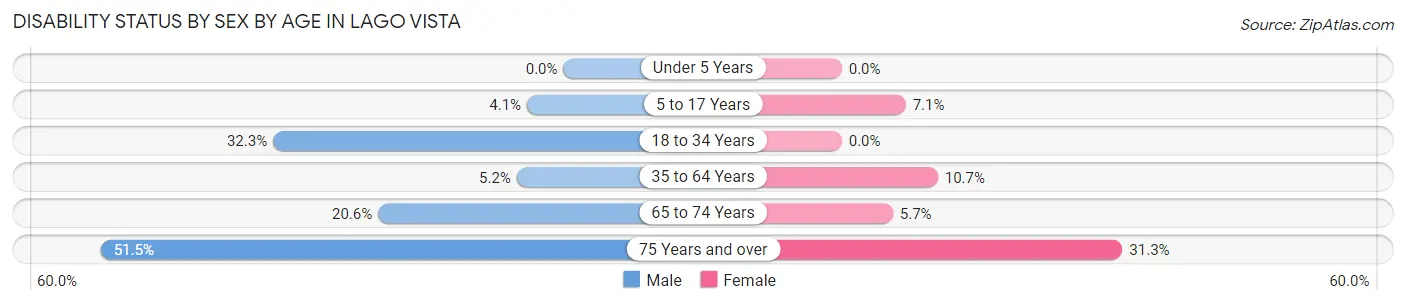
| Age Bracket | Male | Female |
| Under 5 Years | 0 (0.0%) | 0 (0.0%) |
| 5 to 17 Years | 28 (4.1%) | 21 (7.1%) |
| 18 to 34 Years | 228 (32.3%) | 0 (0.0%) |
| 35 to 64 Years | 103 (5.2%) | 239 (10.7%) |
| 65 to 74 Years | 135 (20.6%) | 37 (5.7%) |
| 75 Years and over | 322 (51.5%) | 155 (31.2%) |
Disability Class by Sex by Age in Lago Vista
Disability Class: Hearing Difficulty
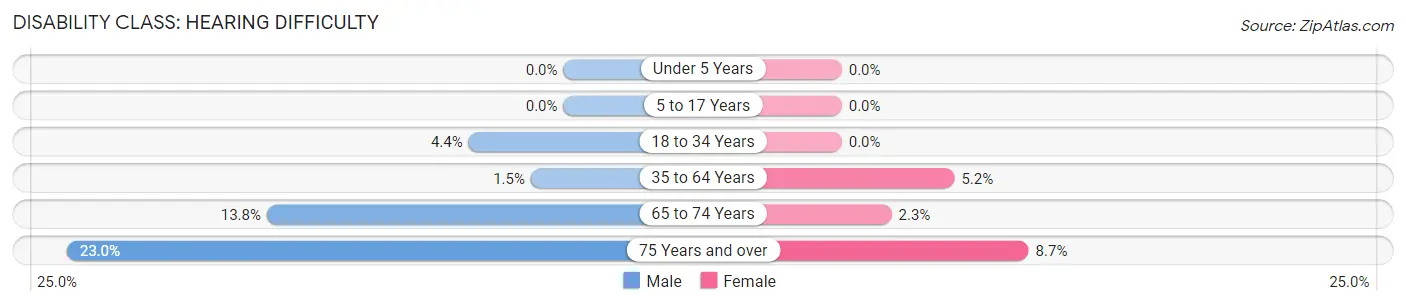
| Age Bracket | Male | Female |
| Under 5 Years | 0 (0.0%) | 0 (0.0%) |
| 5 to 17 Years | 0 (0.0%) | 0 (0.0%) |
| 18 to 34 Years | 31 (4.4%) | 0 (0.0%) |
| 35 to 64 Years | 30 (1.5%) | 117 (5.2%) |
| 65 to 74 Years | 90 (13.8%) | 15 (2.3%) |
| 75 Years and over | 144 (23.0%) | 43 (8.7%) |
Disability Class: Vision Difficulty
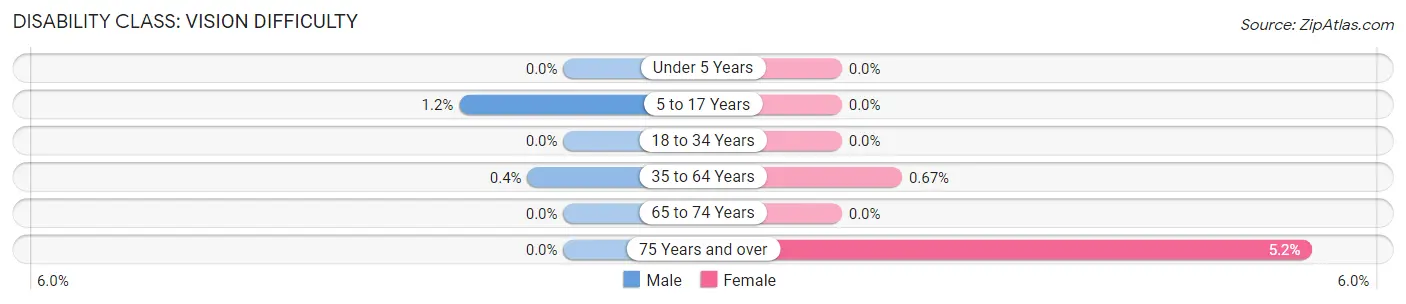
| Age Bracket | Male | Female |
| Under 5 Years | 0 (0.0%) | 0 (0.0%) |
| 5 to 17 Years | 8 (1.2%) | 0 (0.0%) |
| 18 to 34 Years | 0 (0.0%) | 0 (0.0%) |
| 35 to 64 Years | 8 (0.4%) | 15 (0.7%) |
| 65 to 74 Years | 0 (0.0%) | 0 (0.0%) |
| 75 Years and over | 0 (0.0%) | 26 (5.2%) |
Disability Class: Cognitive Difficulty
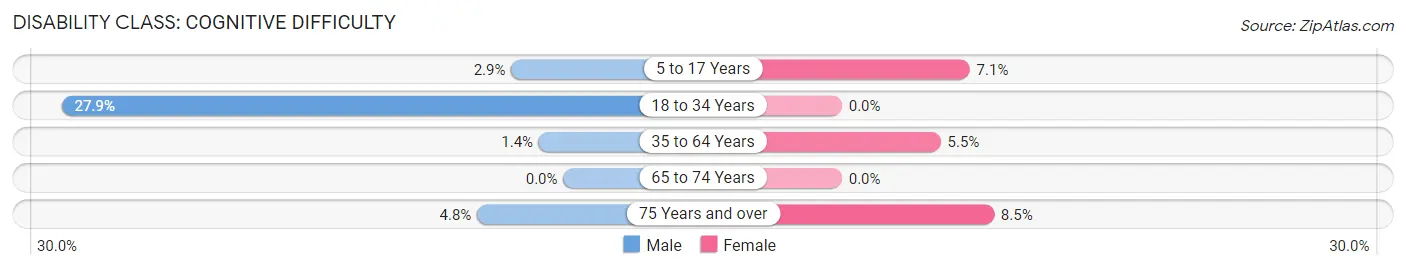
| Age Bracket | Male | Female |
| 5 to 17 Years | 20 (2.9%) | 21 (7.1%) |
| 18 to 34 Years | 197 (27.9%) | 0 (0.0%) |
| 35 to 64 Years | 27 (1.4%) | 123 (5.5%) |
| 65 to 74 Years | 0 (0.0%) | 0 (0.0%) |
| 75 Years and over | 30 (4.8%) | 42 (8.5%) |
Disability Class: Ambulatory Difficulty
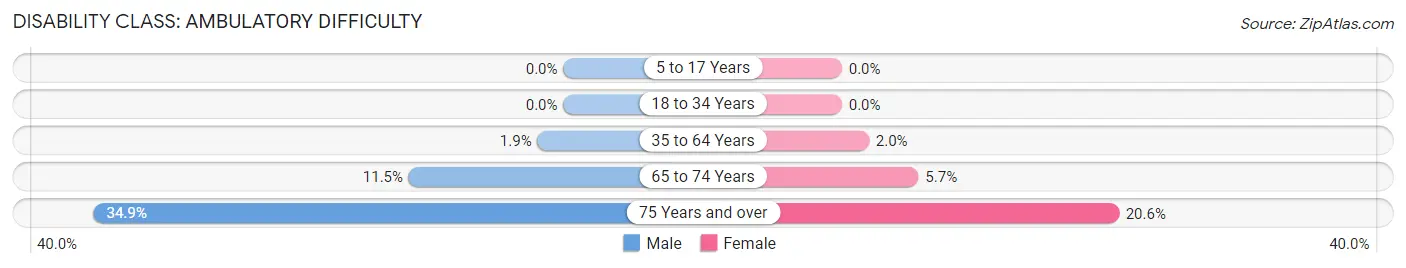
| Age Bracket | Male | Female |
| 5 to 17 Years | 0 (0.0%) | 0 (0.0%) |
| 18 to 34 Years | 0 (0.0%) | 0 (0.0%) |
| 35 to 64 Years | 38 (1.9%) | 45 (2.0%) |
| 65 to 74 Years | 75 (11.5%) | 37 (5.7%) |
| 75 Years and over | 218 (34.9%) | 102 (20.6%) |
Disability Class: Self-Care Difficulty

| Age Bracket | Male | Female |
| 5 to 17 Years | 0 (0.0%) | 0 (0.0%) |
| 18 to 34 Years | 0 (0.0%) | 0 (0.0%) |
| 35 to 64 Years | 0 (0.0%) | 45 (2.0%) |
| 65 to 74 Years | 0 (0.0%) | 0 (0.0%) |
| 75 Years and over | 174 (27.8%) | 12 (2.4%) |
Technology Access in Lago Vista
Computing Device Access in Lago Vista
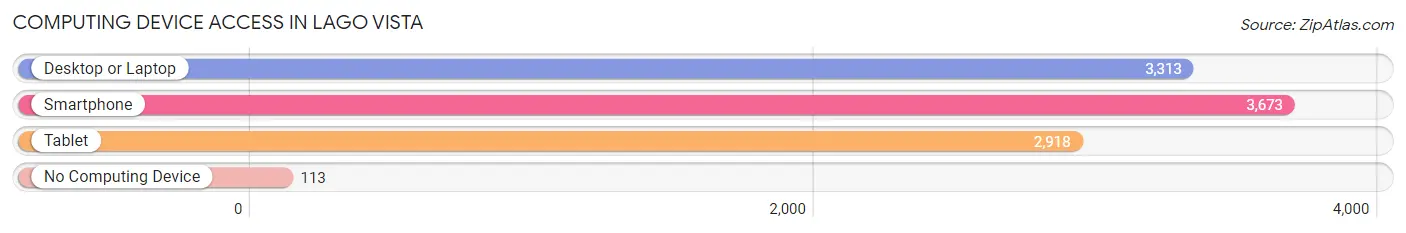
| Device Type | # Households | % Households |
| Desktop or Laptop | 3,313 | 85.2% |
| Smartphone | 3,673 | 94.5% |
| Tablet | 2,918 | 75.0% |
| No Computing Device | 113 | 2.9% |
| Total | 3,889 | 100.0% |
Internet Access in Lago Vista
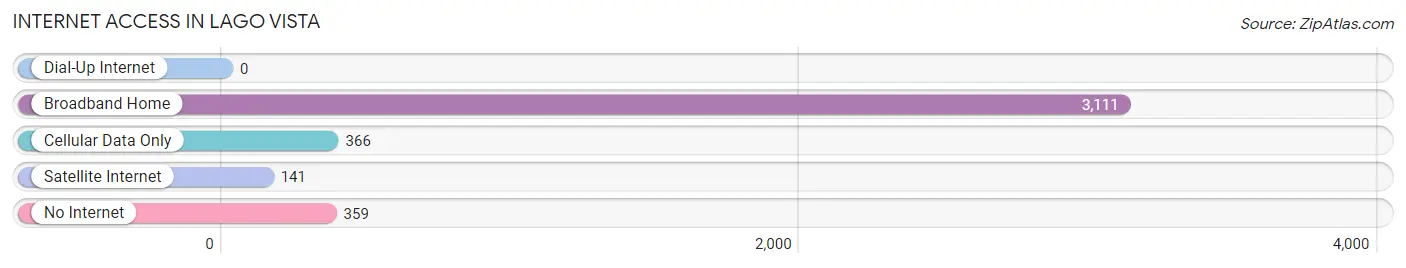
| Internet Type | # Households | % Households |
| Dial-Up Internet | 0 | 0.0% |
| Broadband Home | 3,111 | 80.0% |
| Cellular Data Only | 366 | 9.4% |
| Satellite Internet | 141 | 3.6% |
| No Internet | 359 | 9.2% |
| Total | 3,889 | 100.0% |
Lago Vista Summary
Vista, Texas is a small town located in the heart of the Texas Hill Country, just north of Austin. It is a rural community with a population of just over 1,000 people. The town is situated on the banks of the Colorado River and is surrounded by rolling hills and lush vegetation. Vista is known for its small-town charm and its close proximity to the larger cities of Austin and San Antonio.
History
Vista was first settled in the late 1800s by German immigrants who were looking for a place to call home. The town was originally called “Vista Hill” and was later changed to “Vista” in 1891. The town was officially incorporated in 1892 and was named after the nearby Vista Hill.
The town grew slowly but steadily over the years, and by the early 1900s, it had become a thriving community. The town was home to several businesses, including a general store, a blacksmith shop, a hotel, and a post office.
In the 1920s, the town began to experience a period of growth and prosperity. The population increased from just over 500 people in 1920 to over 1,000 people in 1930. This growth was largely due to the influx of new residents who were attracted to the area by the abundance of natural resources and the availability of jobs.
Geography
Vista is located in the heart of the Texas Hill Country, just north of Austin. The town is situated on the banks of the Colorado River and is surrounded by rolling hills and lush vegetation. The town is located at an elevation of 830 feet and has an average temperature of 73 degrees Fahrenheit.
The town is located in the Llano Estacado region of Texas, which is known for its dry climate and its abundance of natural resources. The area is home to several species of wildlife, including deer, wild turkeys, and quail.
Economy
Vista’s economy is largely based on agriculture and tourism. The town is home to several farms and ranches, which produce a variety of crops, including cotton, corn, and hay. The town is also home to several wineries, which produce a variety of wines.
The town is also home to several businesses, including restaurants, shops, and hotels. The town is also home to several art galleries, which feature the work of local artists.
Demographics
As of the 2010 census, the population of Vista was 1,072. The town is predominantly white, with a population that is 97.3% white. The town is also home to a small Hispanic population, which makes up 1.7% of the population. The median household income in Vista is $45,000, and the median home value is $125,000.
Conclusion
Vista, Texas is a small town located in the heart of the Texas Hill Country, just north of Austin. The town is known for its small-town charm and its close proximity to the larger cities of Austin and San Antonio. The town is home to several businesses, including restaurants, shops, and hotels. The town is also home to several farms and ranches, which produce a variety of crops, including cotton, corn, and hay. The town is predominantly white, with a population that is 97.3% white. The median household income in Vista is $45,000, and the median home value is $125,000.
Common Questions
What is Per Capita Income in Lago Vista?
Per Capita income in Lago Vista is $57,811.
What is the Median Family Income in Lago Vista?
Median Family Income in Lago Vista is $131,500.
What is the Median Household income in Lago Vista?
Median Household Income in Lago Vista is $108,823.
What is Income or Wage Gap in Lago Vista?
Income or Wage Gap in Lago Vista is 38.1%.
Women in Lago Vista earn 61.9 cents for every dollar earned by a man.
What is Inequality or Gini Index in Lago Vista?
Inequality or Gini Index in Lago Vista is 0.40.
What is the Total Population of Lago Vista?
Total Population of Lago Vista is 9,001.
What is the Total Male Population of Lago Vista?
Total Male Population of Lago Vista is 4,796.
What is the Total Female Population of Lago Vista?
Total Female Population of Lago Vista is 4,205.
What is the Ratio of Males per 100 Females in Lago Vista?
There are 114.05 Males per 100 Females in Lago Vista.
What is the Ratio of Females per 100 Males in Lago Vista?
There are 87.68 Females per 100 Males in Lago Vista.
What is the Median Population Age in Lago Vista?
Median Population Age in Lago Vista is 52.9 Years.
What is the Average Family Size in Lago Vista
Average Family Size in Lago Vista is 2.7 People.
What is the Average Household Size in Lago Vista
Average Household Size in Lago Vista is 2.3 People.
How Large is the Labor Force in Lago Vista?
There are 4,203 People in the Labor Forcein in Lago Vista.
What is the Percentage of People in the Labor Force in Lago Vista?
53.4% of People are in the Labor Force in Lago Vista.
What is the Unemployment Rate in Lago Vista?
Unemployment Rate in Lago Vista is 5.0%.