Columbiaville, MI Map & Demographics
Columbiaville Map
Columbiaville Overview
$31,601
PER CAPITA INCOME
$61,250
AVG FAMILY INCOME
$58,403
AVG HOUSEHOLD INCOME
23.9%
WAGE / INCOME GAP [ % ]
76.1¢/ $1
WAGE / INCOME GAP [ $ ]
0.41
INEQUALITY / GINI INDEX
774
TOTAL POPULATION
373
MALE POPULATION
401
FEMALE POPULATION
93.02
MALES / 100 FEMALES
107.51
FEMALES / 100 MALES
38.5
MEDIAN AGE
2.8
AVG FAMILY SIZE
2.3
AVG HOUSEHOLD SIZE
396
LABOR FORCE [ PEOPLE ]
60.6%
PERCENT IN LABOR FORCE
14.4%
UNEMPLOYMENT RATE
Columbiaville Zip Codes
Columbiaville Area Codes
Income in Columbiaville
Income Overview in Columbiaville
Per Capita Income in Columbiaville is $31,601, while median incomes of families and households are $61,250 and $58,403 respectively.
| Characteristic | Number | Measure |
| Per Capita Income | 774 | $31,601 |
| Median Family Income | 217 | $61,250 |
| Mean Family Income | 217 | $71,847 |
| Median Household Income | 335 | $58,403 |
| Mean Household Income | 335 | $70,197 |
| Income Deficit | 217 | $0 |
| Wage / Income Gap (%) | 774 | 23.93% |
| Wage / Income Gap ($) | 774 | 76.07¢ per $1 |
| Gini / Inequality Index | 774 | 0.41 |
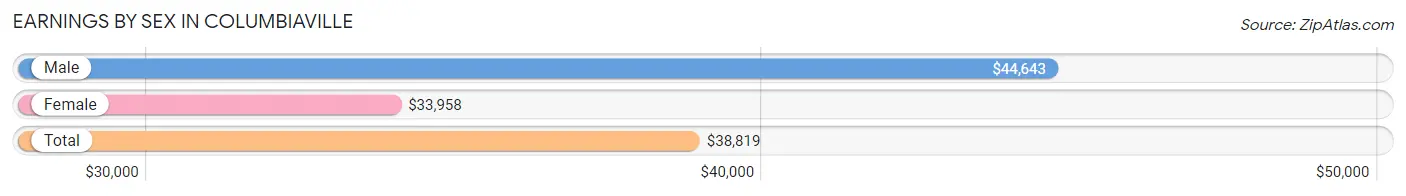
Earnings by Sex in Columbiaville
Average Earnings in Columbiaville are $38,819, $44,643 for men and $33,958 for women, a difference of 23.9%.
| Sex | Number | Average Earnings |
| Male | 218 (51.5%) | $44,643 |
| Female | 205 (48.5%) | $33,958 |
| Total | 423 (100.0%) | $38,819 |
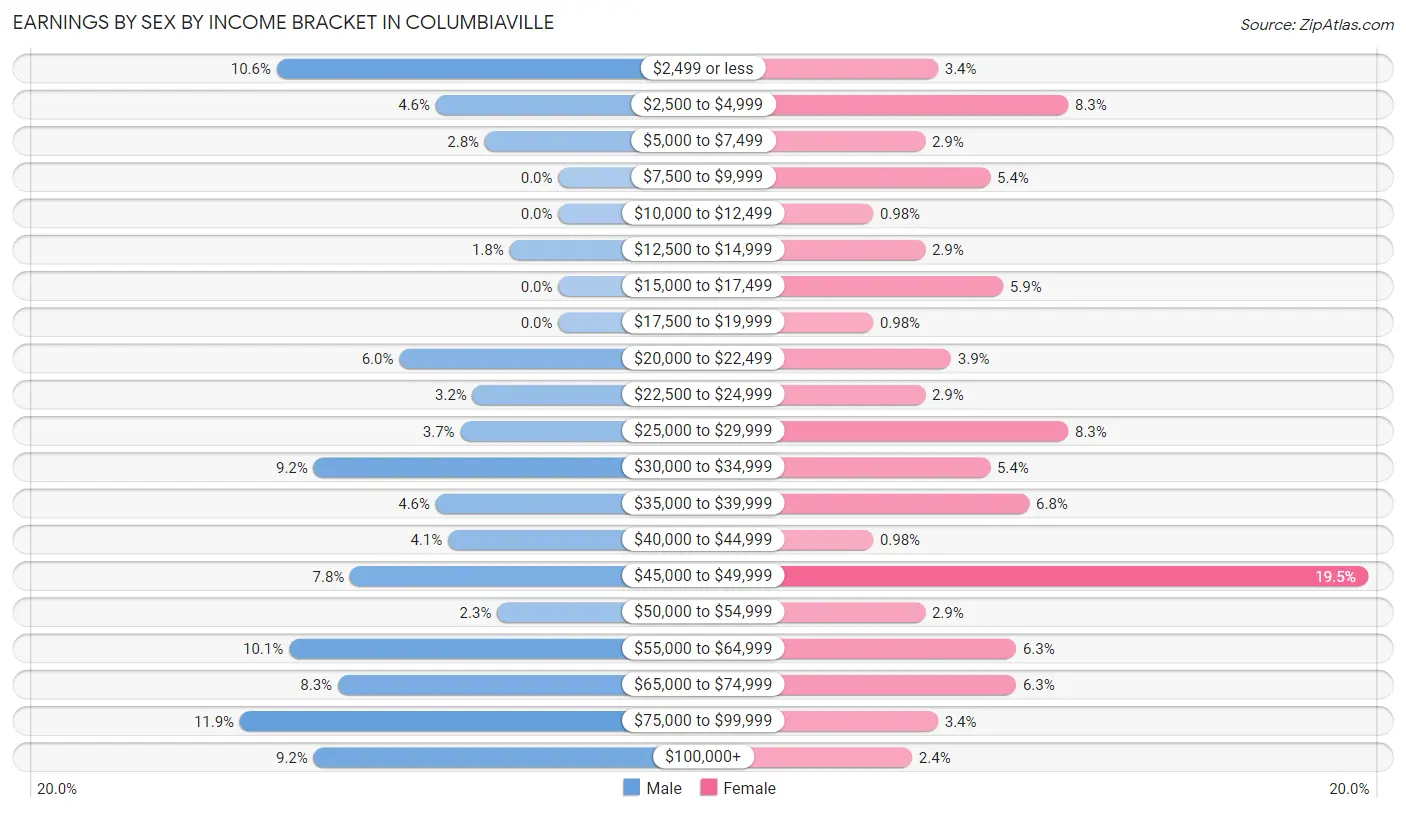
Earnings by Sex by Income Bracket in Columbiaville
The most common earnings brackets in Columbiaville are $75,000 to $99,999 for men (26 | 11.9%) and $45,000 to $49,999 for women (40 | 19.5%).
| Income | Male | Female |
| $2,499 or less | 23 (10.5%) | 7 (3.4%) |
| $2,500 to $4,999 | 10 (4.6%) | 17 (8.3%) |
| $5,000 to $7,499 | 6 (2.8%) | 6 (2.9%) |
| $7,500 to $9,999 | 0 (0.0%) | 11 (5.4%) |
| $10,000 to $12,499 | 0 (0.0%) | 2 (1.0%) |
| $12,500 to $14,999 | 4 (1.8%) | 6 (2.9%) |
| $15,000 to $17,499 | 0 (0.0%) | 12 (5.9%) |
| $17,500 to $19,999 | 0 (0.0%) | 2 (1.0%) |
| $20,000 to $22,499 | 13 (6.0%) | 8 (3.9%) |
| $22,500 to $24,999 | 7 (3.2%) | 6 (2.9%) |
| $25,000 to $29,999 | 8 (3.7%) | 17 (8.3%) |
| $30,000 to $34,999 | 20 (9.2%) | 11 (5.4%) |
| $35,000 to $39,999 | 10 (4.6%) | 14 (6.8%) |
| $40,000 to $44,999 | 9 (4.1%) | 2 (1.0%) |
| $45,000 to $49,999 | 17 (7.8%) | 40 (19.5%) |
| $50,000 to $54,999 | 5 (2.3%) | 6 (2.9%) |
| $55,000 to $64,999 | 22 (10.1%) | 13 (6.3%) |
| $65,000 to $74,999 | 18 (8.3%) | 13 (6.3%) |
| $75,000 to $99,999 | 26 (11.9%) | 7 (3.4%) |
| $100,000+ | 20 (9.2%) | 5 (2.4%) |
| Total | 218 (100.0%) | 205 (100.0%) |
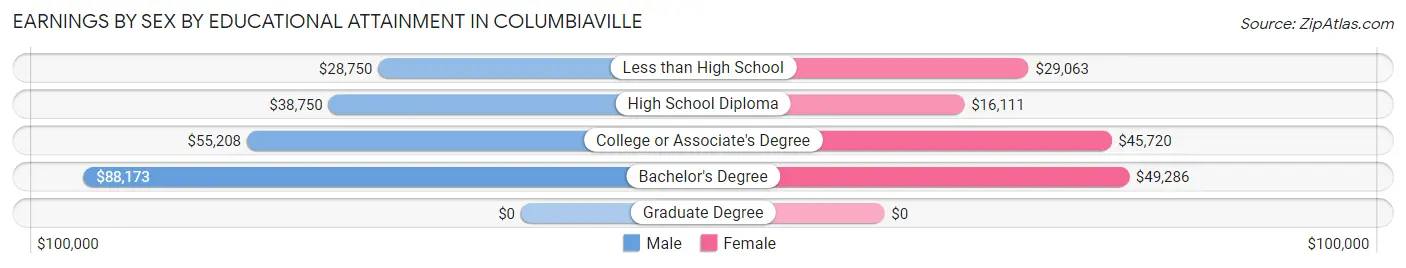
Earnings by Sex by Educational Attainment in Columbiaville
Average earnings in Columbiaville are $46,641 for men and $39,583 for women, a difference of 15.1%. Men with an educational attainment of bachelor's degree enjoy the highest average annual earnings of $88,173, while those with less than high school education earn the least with $28,750. Women with an educational attainment of bachelor's degree earn the most with the average annual earnings of $49,286, while those with high school diploma education have the smallest earnings of $16,111.
| Educational Attainment | Male Income | Female Income |
| Less than High School | $28,750 | $29,063 |
| High School Diploma | $38,750 | $16,111 |
| College or Associate's Degree | $55,208 | $45,720 |
| Bachelor's Degree | $88,173 | $49,286 |
| Graduate Degree | - | - |
| Total | $46,641 | $39,583 |
Family Income in Columbiaville
Family Income Brackets in Columbiaville
According to the Columbiaville family income data, there are 53 families falling into the $25,000 to $34,999 income range, which is the most common income bracket and makes up 24.4% of all families.
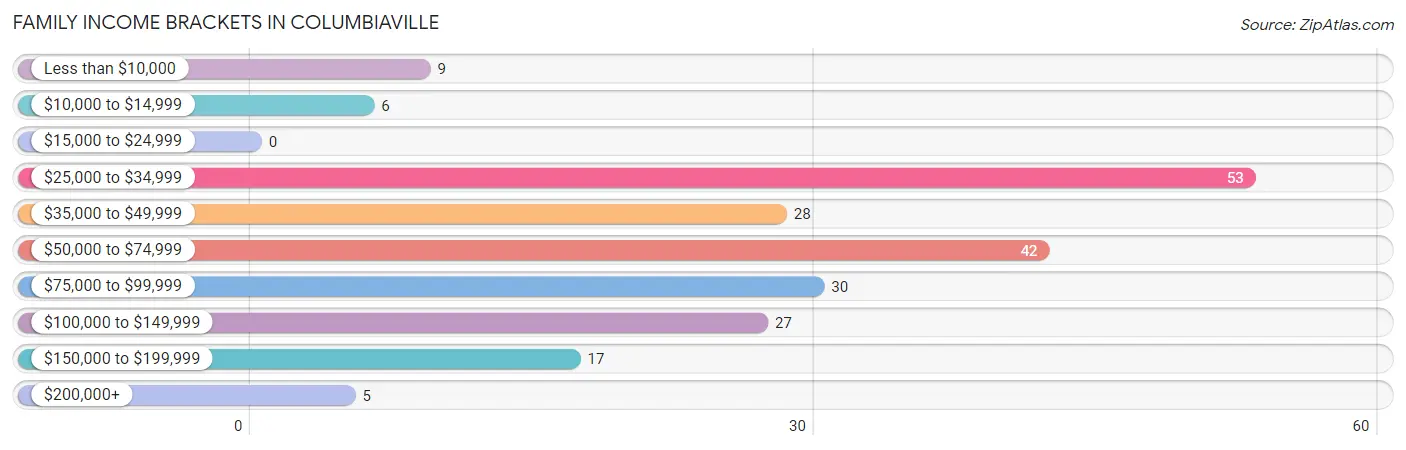
| Income Bracket | # Families | % Families |
| Less than $10,000 | 9 | 4.1% |
| $10,000 to $14,999 | 6 | 2.8% |
| $15,000 to $24,999 | 0 | 0.0% |
| $25,000 to $34,999 | 53 | 24.4% |
| $35,000 to $49,999 | 28 | 12.9% |
| $50,000 to $74,999 | 42 | 19.4% |
| $75,000 to $99,999 | 30 | 13.8% |
| $100,000 to $149,999 | 27 | 12.4% |
| $150,000 to $199,999 | 17 | 7.8% |
| $200,000+ | 5 | 2.3% |
Family Income by Famaliy Size in Columbiaville
3-person families (77 | 35.5%) account for the highest median family income in Columbiaville with $66,964 per family, while 3-person families (77 | 35.5%) have the highest median income of $22,321 per family member.
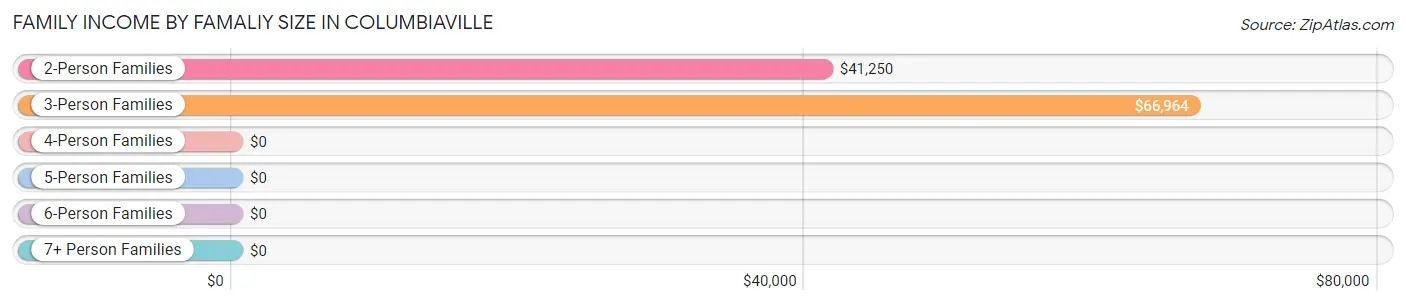
| Income Bracket | # Families | Median Income |
| 2-Person Families | 100 (46.1%) | $41,250 |
| 3-Person Families | 77 (35.5%) | $66,964 |
| 4-Person Families | 20 (9.2%) | $0 |
| 5-Person Families | 13 (6.0%) | $0 |
| 6-Person Families | 4 (1.8%) | $0 |
| 7+ Person Families | 3 (1.4%) | $0 |
| Total | 217 (100.0%) | $61,250 |
Family Income by Number of Earners in Columbiaville
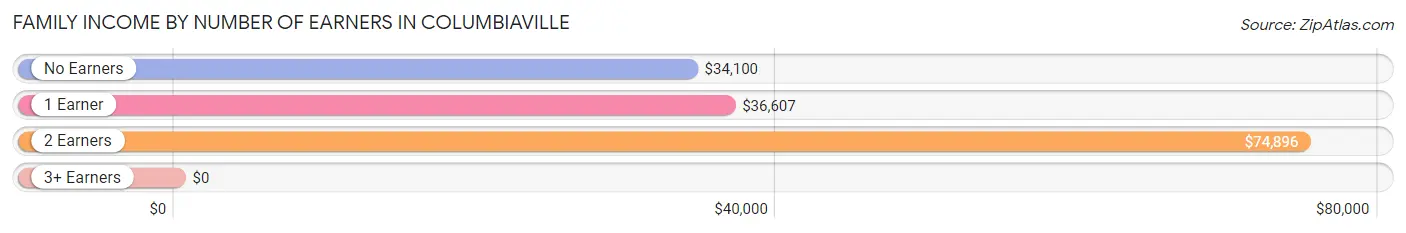
| Number of Earners | # Families | Median Income |
| No Earners | 46 (21.2%) | $34,100 |
| 1 Earner | 68 (31.3%) | $36,607 |
| 2 Earners | 81 (37.3%) | $74,896 |
| 3+ Earners | 22 (10.1%) | $0 |
| Total | 217 (100.0%) | $61,250 |
Household Income in Columbiaville
Household Income Brackets in Columbiaville
With 74 households falling in the category, the $50,000 to $74,999 income range is the most frequent in Columbiaville, accounting for 22.1% of all households. In contrast, only 10 households (3.0%) fall into the $200,000+ income bracket, making it the least populous group.
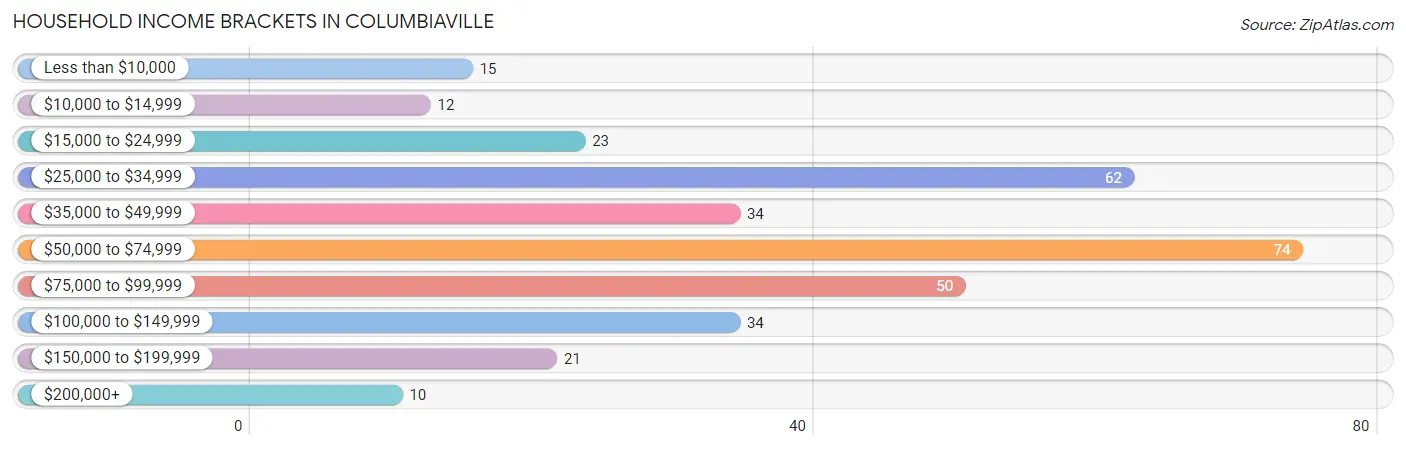
| Income Bracket | # Households | % Households |
| Less than $10,000 | 15 | 4.5% |
| $10,000 to $14,999 | 12 | 3.6% |
| $15,000 to $24,999 | 23 | 6.9% |
| $25,000 to $34,999 | 62 | 18.5% |
| $35,000 to $49,999 | 34 | 10.1% |
| $50,000 to $74,999 | 74 | 22.1% |
| $75,000 to $99,999 | 50 | 14.9% |
| $100,000 to $149,999 | 34 | 10.1% |
| $150,000 to $199,999 | 21 | 6.3% |
| $200,000+ | 10 | 3.0% |
Household Income by Householder Age in Columbiaville
The median household income in Columbiaville is $58,403, with the highest median household income of $59,375 found in the 25 to 44 years age bracket for the primary householder. A total of 119 households (35.5%) fall into this category. Meanwhile, the 15 to 24 years age bracket for the primary householder has the lowest median household income of $0, with 21 households (6.3%) in this group.
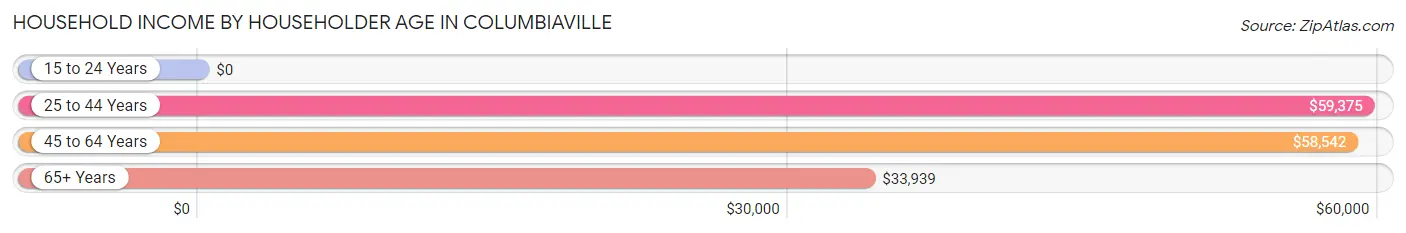
| Income Bracket | # Households | Median Income |
| 15 to 24 Years | 21 (6.3%) | $0 |
| 25 to 44 Years | 119 (35.5%) | $59,375 |
| 45 to 64 Years | 107 (31.9%) | $58,542 |
| 65+ Years | 88 (26.3%) | $33,939 |
| Total | 335 (100.0%) | $58,403 |
Poverty in Columbiaville
Income Below Poverty by Sex and Age in Columbiaville
With 4.3% poverty level for males and 13.7% for females among the residents of Columbiaville, 16 and 17 year old males and 12 to 14 year old females are the most vulnerable to poverty, with 5 males (62.5%) and 3 females (42.9%) in their respective age groups living below the poverty level.
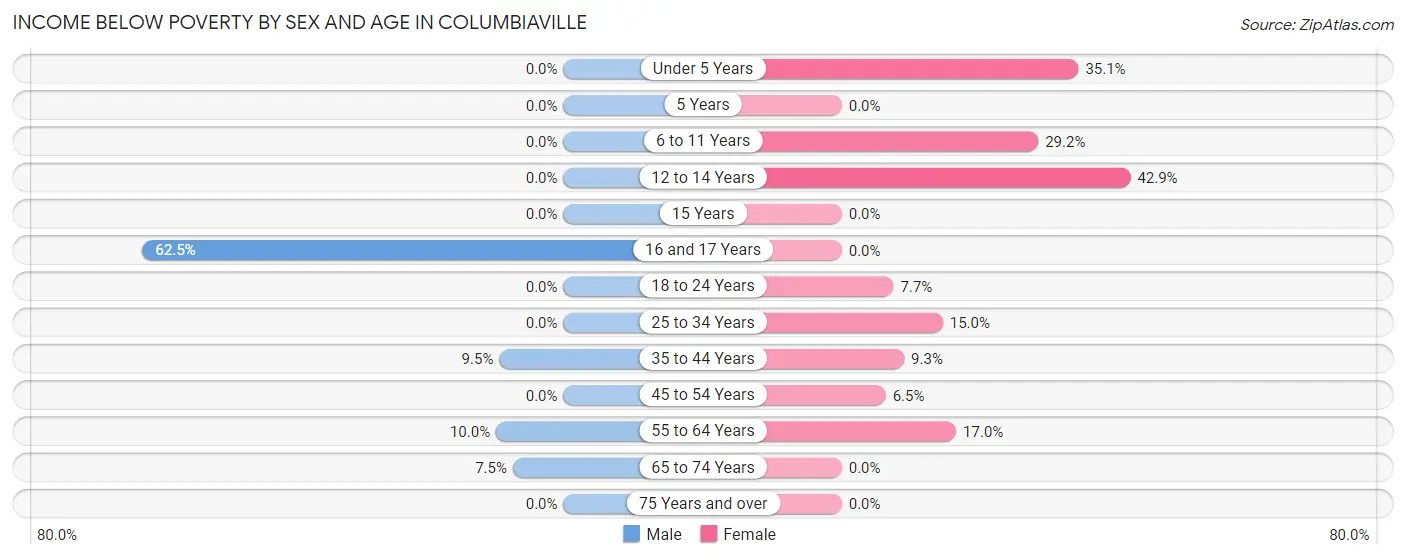
| Age Bracket | Male | Female |
| Under 5 Years | 0 (0.0%) | 13 (35.1%) |
| 5 Years | 0 (0.0%) | 0 (0.0%) |
| 6 to 11 Years | 0 (0.0%) | 7 (29.2%) |
| 12 to 14 Years | 0 (0.0%) | 3 (42.9%) |
| 15 Years | 0 (0.0%) | 0 (0.0%) |
| 16 and 17 Years | 5 (62.5%) | 0 (0.0%) |
| 18 to 24 Years | 0 (0.0%) | 3 (7.7%) |
| 25 to 34 Years | 0 (0.0%) | 12 (15.0%) |
| 35 to 44 Years | 4 (9.5%) | 5 (9.3%) |
| 45 to 54 Years | 0 (0.0%) | 3 (6.5%) |
| 55 to 64 Years | 4 (10.0%) | 9 (17.0%) |
| 65 to 74 Years | 3 (7.5%) | 0 (0.0%) |
| 75 Years and over | 0 (0.0%) | 0 (0.0%) |
| Total | 16 (4.3%) | 55 (13.7%) |
Income Above Poverty by Sex and Age in Columbiaville
According to the poverty statistics in Columbiaville, males aged under 5 years and females aged 5 years are the age groups that are most secure financially, with 100.0% of males and 100.0% of females in these age groups living above the poverty line.
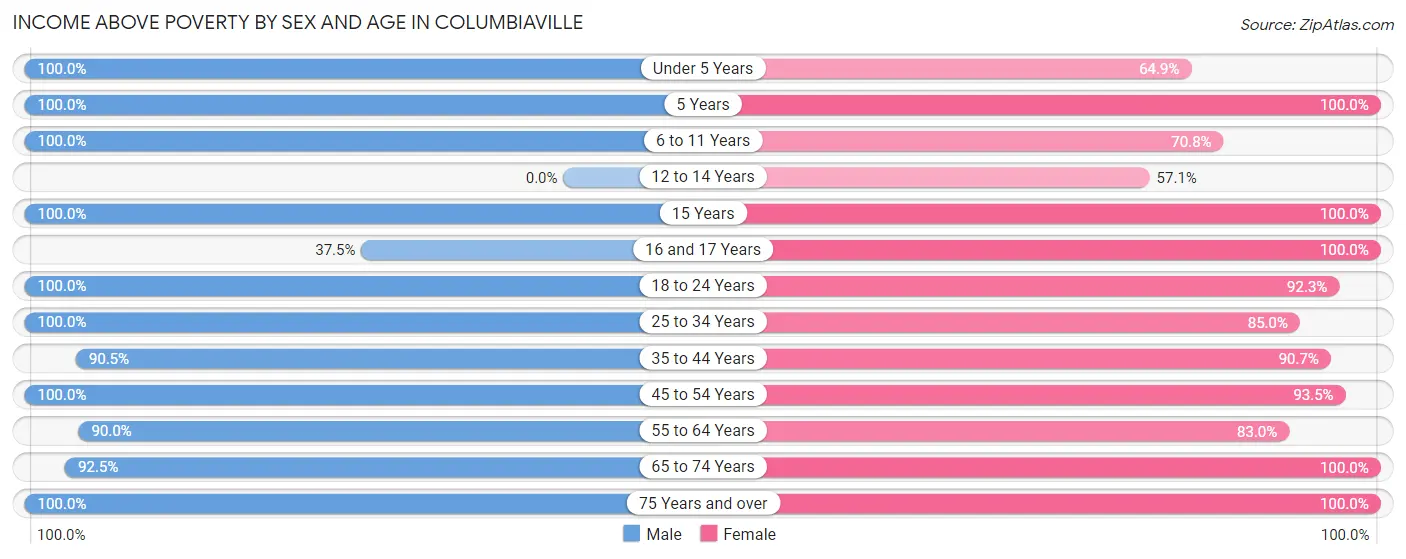
| Age Bracket | Male | Female |
| Under 5 Years | 18 (100.0%) | 24 (64.9%) |
| 5 Years | 5 (100.0%) | 2 (100.0%) |
| 6 to 11 Years | 19 (100.0%) | 17 (70.8%) |
| 12 to 14 Years | 0 (0.0%) | 4 (57.1%) |
| 15 Years | 5 (100.0%) | 4 (100.0%) |
| 16 and 17 Years | 3 (37.5%) | 4 (100.0%) |
| 18 to 24 Years | 44 (100.0%) | 36 (92.3%) |
| 25 to 34 Years | 52 (100.0%) | 68 (85.0%) |
| 35 to 44 Years | 38 (90.5%) | 49 (90.7%) |
| 45 to 54 Years | 60 (100.0%) | 43 (93.5%) |
| 55 to 64 Years | 36 (90.0%) | 44 (83.0%) |
| 65 to 74 Years | 37 (92.5%) | 22 (100.0%) |
| 75 Years and over | 40 (100.0%) | 29 (100.0%) |
| Total | 357 (95.7%) | 346 (86.3%) |
Income Below Poverty Among Married-Couple Families in Columbiaville
The poverty statistics for married-couple families in Columbiaville show that 2.4% or 4 of the total 167 families live below the poverty line. Families with 3 or 4 children have the highest poverty rate of 44.4%, comprising of 4 families. On the other hand, families with no children have the lowest poverty rate of 0.0%, which includes 0 families.
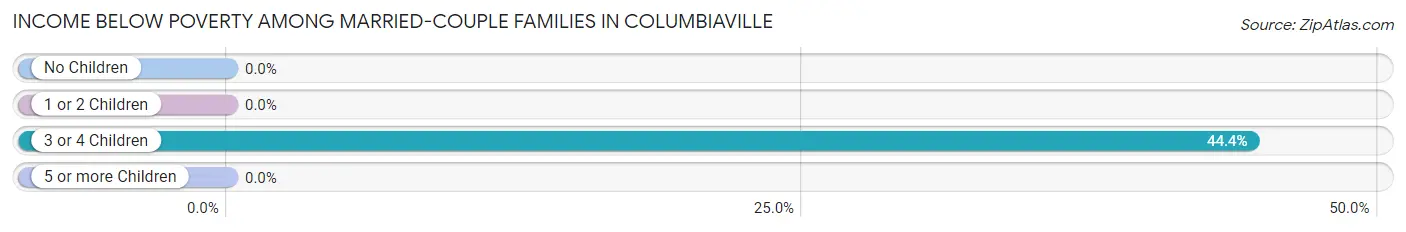
| Children | Above Poverty | Below Poverty |
| No Children | 97 (100.0%) | 0 (0.0%) |
| 1 or 2 Children | 61 (100.0%) | 0 (0.0%) |
| 3 or 4 Children | 5 (55.6%) | 4 (44.4%) |
| 5 or more Children | 0 (0.0%) | 0 (0.0%) |
| Total | 163 (97.6%) | 4 (2.4%) |
Income Below Poverty Among Single-Parent Households in Columbiaville
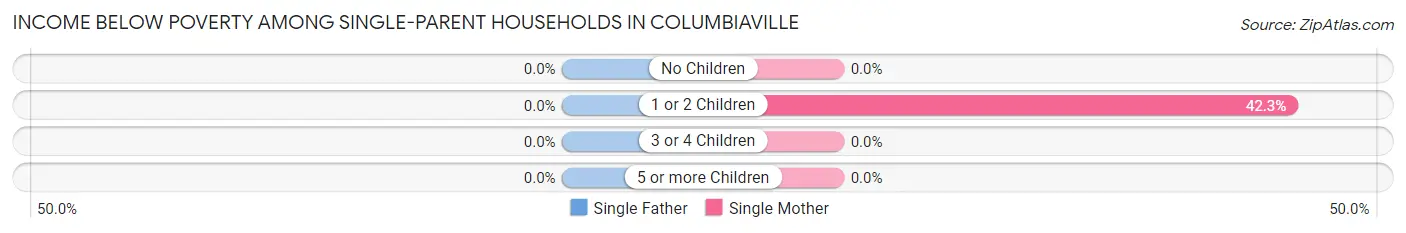
| Children | Single Father | Single Mother |
| No Children | 0 (0.0%) | 0 (0.0%) |
| 1 or 2 Children | 0 (0.0%) | 11 (42.3%) |
| 3 or 4 Children | 0 (0.0%) | 0 (0.0%) |
| 5 or more Children | 0 (0.0%) | 0 (0.0%) |
| Total | 0 (0.0%) | 11 (26.8%) |
Income Below Poverty Among Married-Couple vs Single-Parent Households in Columbiaville
The poverty data for Columbiaville shows that 4 of the married-couple family households (2.4%) and 11 of the single-parent households (22.0%) are living below the poverty level. Within the married-couple family households, those with 3 or 4 children have the highest poverty rate, with 4 households (44.4%) falling below the poverty line. Among the single-parent households, those with 1 or 2 children have the highest poverty rate, with 11 household (42.3%) living below poverty.
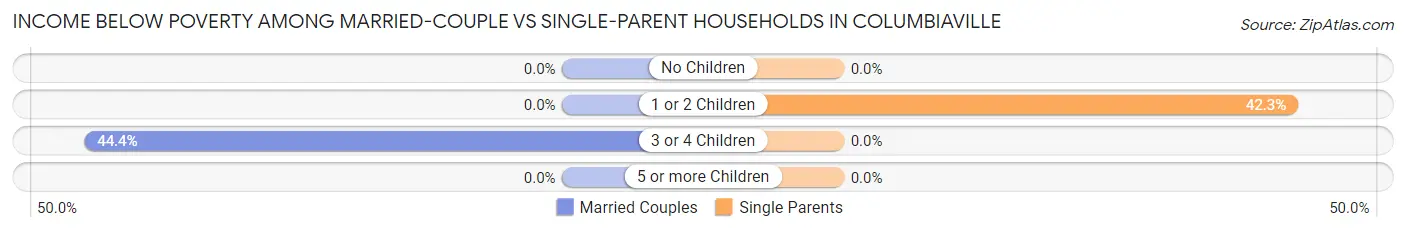
| Children | Married-Couple Families | Single-Parent Households |
| No Children | 0 (0.0%) | 0 (0.0%) |
| 1 or 2 Children | 0 (0.0%) | 11 (42.3%) |
| 3 or 4 Children | 4 (44.4%) | 0 (0.0%) |
| 5 or more Children | 0 (0.0%) | 0 (0.0%) |
| Total | 4 (2.4%) | 11 (22.0%) |
Race in Columbiaville
The most populous races in Columbiaville are White / Caucasian (759 | 98.1%), Hispanic or Latino (14 | 1.8%), and Two or more Races (12 | 1.5%).
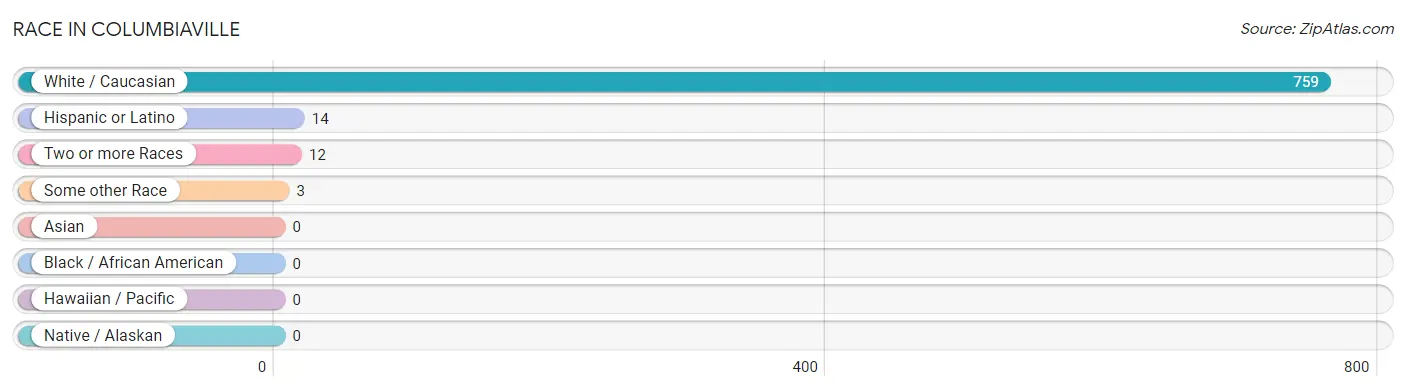
| Race | # Population | % Population |
| Asian | 0 | 0.0% |
| Black / African American | 0 | 0.0% |
| Hawaiian / Pacific | 0 | 0.0% |
| Hispanic or Latino | 14 | 1.8% |
| Native / Alaskan | 0 | 0.0% |
| White / Caucasian | 759 | 98.1% |
| Two or more Races | 12 | 1.5% |
| Some other Race | 3 | 0.4% |
| Total | 774 | 100.0% |
Ancestry in Columbiaville
The most populous ancestries reported in Columbiaville are German (207 | 26.7%), Irish (141 | 18.2%), English (106 | 13.7%), French (82 | 10.6%), and Polish (75 | 9.7%), together accounting for 78.9% of all Columbiaville residents.
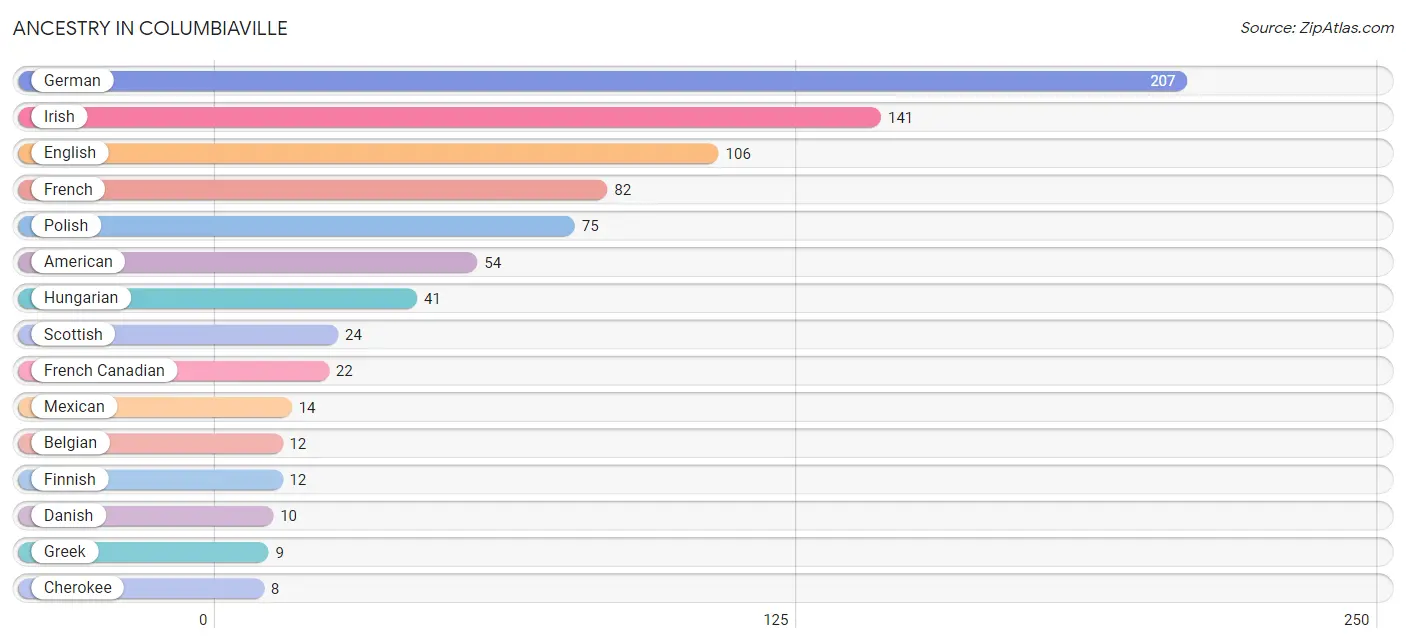
| Ancestry | # Population | % Population |
| American | 54 | 7.0% |
| Arab | 2 | 0.3% |
| Belgian | 12 | 1.5% |
| Canadian | 2 | 0.3% |
| Cherokee | 8 | 1.0% |
| Czech | 2 | 0.3% |
| Danish | 10 | 1.3% |
| Dutch | 6 | 0.8% |
| Eastern European | 2 | 0.3% |
| English | 106 | 13.7% |
| Finnish | 12 | 1.5% |
| French | 82 | 10.6% |
| French Canadian | 22 | 2.8% |
| German | 207 | 26.7% |
| Greek | 9 | 1.2% |
| Hungarian | 41 | 5.3% |
| Irish | 141 | 18.2% |
| Italian | 5 | 0.6% |
| Lithuanian | 3 | 0.4% |
| Mexican | 14 | 1.8% |
| Norwegian | 4 | 0.5% |
| Polish | 75 | 9.7% |
| Scotch-Irish | 6 | 0.8% |
| Scottish | 24 | 3.1% |
| Syrian | 2 | 0.3% | View All 25 Rows |
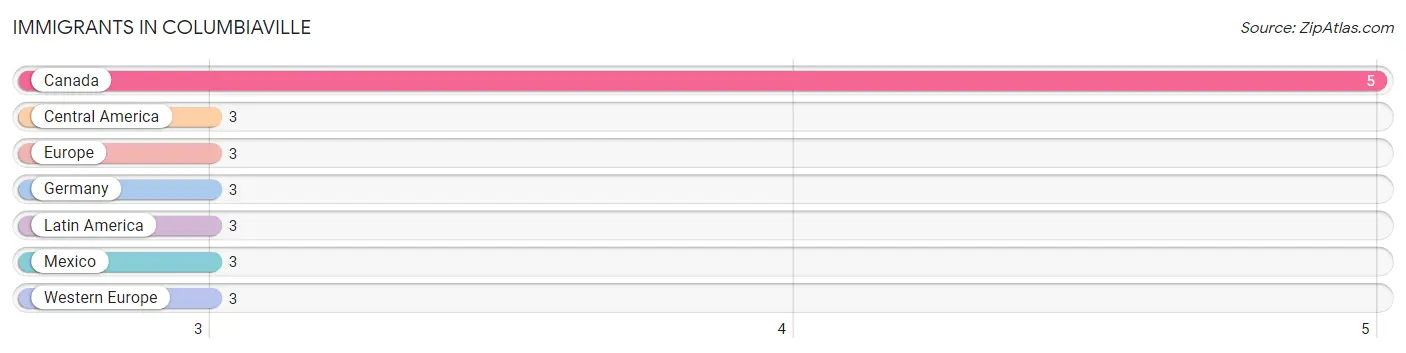
Immigrants in Columbiaville
The most numerous immigrant groups reported in Columbiaville came from Canada (5 | 0.6%), Central America (3 | 0.4%), Europe (3 | 0.4%), Germany (3 | 0.4%), and Latin America (3 | 0.4%), together accounting for 2.2% of all Columbiaville residents.
| Immigration Origin | # Population | % Population |
| Canada | 5 | 0.6% |
| Central America | 3 | 0.4% |
| Europe | 3 | 0.4% |
| Germany | 3 | 0.4% |
| Latin America | 3 | 0.4% |
| Mexico | 3 | 0.4% |
| Western Europe | 3 | 0.4% | View All 7 Rows |
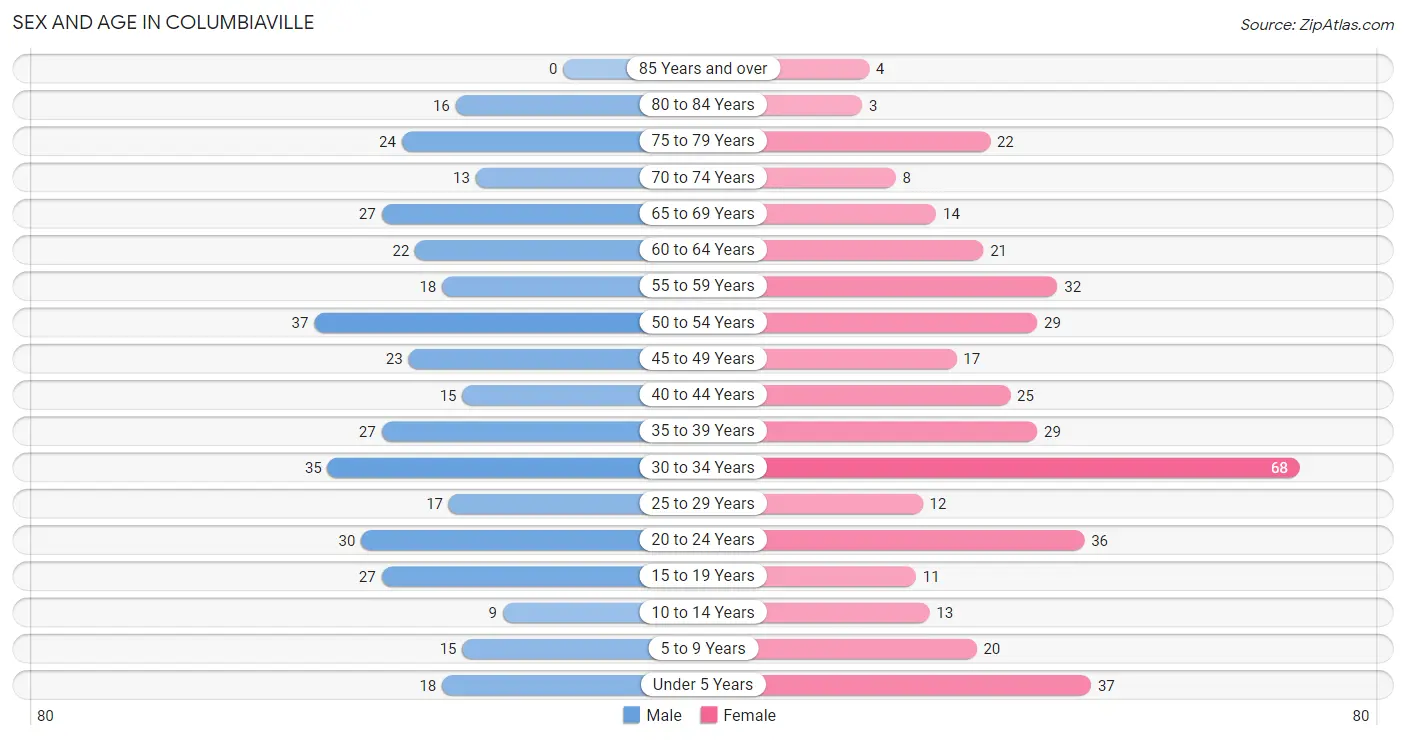
Sex and Age in Columbiaville
Sex and Age in Columbiaville
The most populous age groups in Columbiaville are 50 to 54 Years (37 | 9.9%) for men and 30 to 34 Years (68 | 17.0%) for women.
| Age Bracket | Male | Female |
| Under 5 Years | 18 (4.8%) | 37 (9.2%) |
| 5 to 9 Years | 15 (4.0%) | 20 (5.0%) |
| 10 to 14 Years | 9 (2.4%) | 13 (3.2%) |
| 15 to 19 Years | 27 (7.2%) | 11 (2.7%) |
| 20 to 24 Years | 30 (8.0%) | 36 (9.0%) |
| 25 to 29 Years | 17 (4.6%) | 12 (3.0%) |
| 30 to 34 Years | 35 (9.4%) | 68 (17.0%) |
| 35 to 39 Years | 27 (7.2%) | 29 (7.2%) |
| 40 to 44 Years | 15 (4.0%) | 25 (6.2%) |
| 45 to 49 Years | 23 (6.2%) | 17 (4.2%) |
| 50 to 54 Years | 37 (9.9%) | 29 (7.2%) |
| 55 to 59 Years | 18 (4.8%) | 32 (8.0%) |
| 60 to 64 Years | 22 (5.9%) | 21 (5.2%) |
| 65 to 69 Years | 27 (7.2%) | 14 (3.5%) |
| 70 to 74 Years | 13 (3.5%) | 8 (2.0%) |
| 75 to 79 Years | 24 (6.4%) | 22 (5.5%) |
| 80 to 84 Years | 16 (4.3%) | 3 (0.7%) |
| 85 Years and over | 0 (0.0%) | 4 (1.0%) |
| Total | 373 (100.0%) | 401 (100.0%) |
Families and Households in Columbiaville
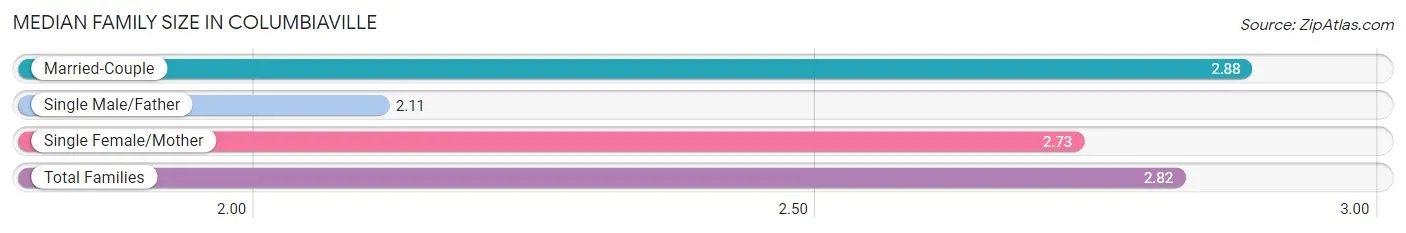
Median Family Size in Columbiaville
The median family size in Columbiaville is 2.82 persons per family, with married-couple families (167 | 77.0%) accounting for the largest median family size of 2.88 persons per family. On the other hand, single male/father families (9 | 4.2%) represent the smallest median family size with 2.11 persons per family.
| Family Type | # Families | Family Size |
| Married-Couple | 167 (77.0%) | 2.88 |
| Single Male/Father | 9 (4.2%) | 2.11 |
| Single Female/Mother | 41 (18.9%) | 2.73 |
| Total Families | 217 (100.0%) | 2.82 |
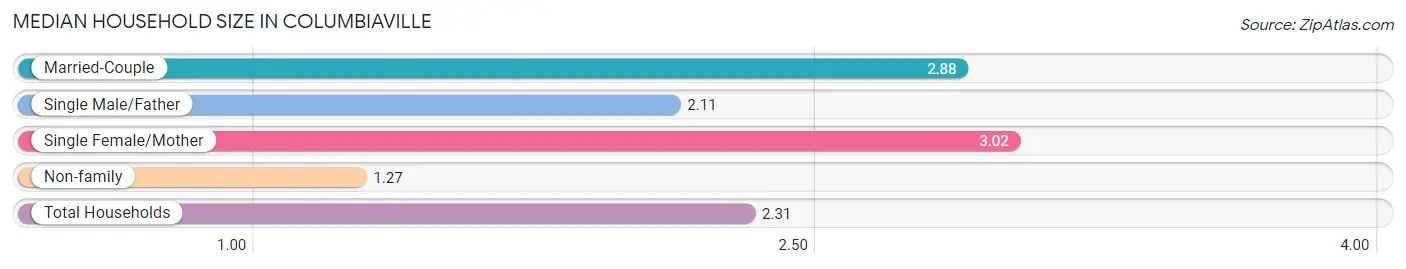
Median Household Size in Columbiaville
The median household size in Columbiaville is 2.31 persons per household, with single female/mother households (41 | 12.2%) accounting for the largest median household size of 3.02 persons per household. non-family households (118 | 35.2%) represent the smallest median household size with 1.27 persons per household.
| Household Type | # Households | Household Size |
| Married-Couple | 167 (49.8%) | 2.88 |
| Single Male/Father | 9 (2.7%) | 2.11 |
| Single Female/Mother | 41 (12.2%) | 3.02 |
| Non-family | 118 (35.2%) | 1.27 |
| Total Households | 335 (100.0%) | 2.31 |
Household Size by Marriage Status in Columbiaville
Out of a total of 335 households in Columbiaville, 217 (64.8%) are family households, while 118 (35.2%) are nonfamily households. The most numerous type of family households are 2-person households, comprising 95, and the most common type of nonfamily households are 1-person households, comprising 88.
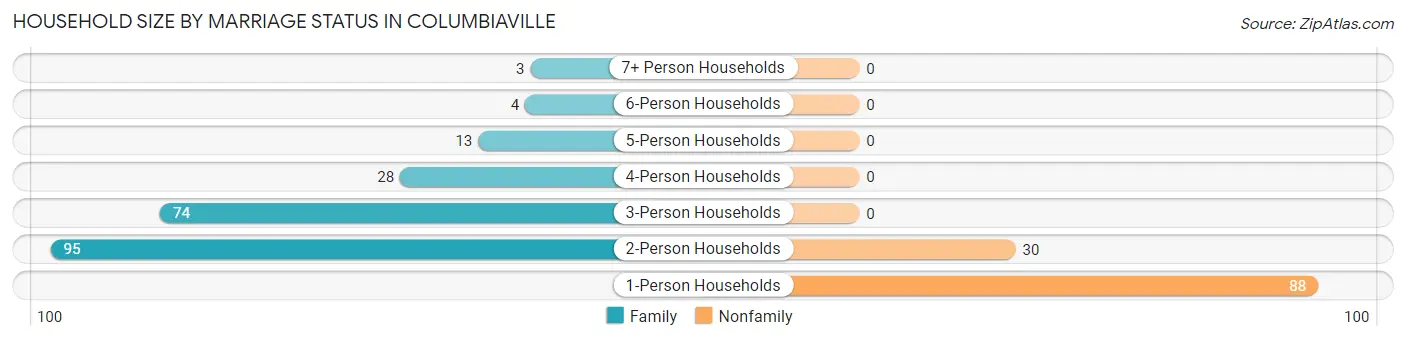
| Household Size | Family Households | Nonfamily Households |
| 1-Person Households | - | 88 (26.3%) |
| 2-Person Households | 95 (28.4%) | 30 (9.0%) |
| 3-Person Households | 74 (22.1%) | 0 (0.0%) |
| 4-Person Households | 28 (8.4%) | 0 (0.0%) |
| 5-Person Households | 13 (3.9%) | 0 (0.0%) |
| 6-Person Households | 4 (1.2%) | 0 (0.0%) |
| 7+ Person Households | 3 (0.9%) | 0 (0.0%) |
| Total | 217 (64.8%) | 118 (35.2%) |
Female Fertility in Columbiaville
Fertility by Age in Columbiaville
Average fertility rate in Columbiaville is 78.0 births per 1,000 women. Women in the age bracket of 20 to 34 years have the highest fertility rate with 112.0 births per 1,000 women. Women in the age bracket of 20 to 34 years acount for 81.2% of all women with births.
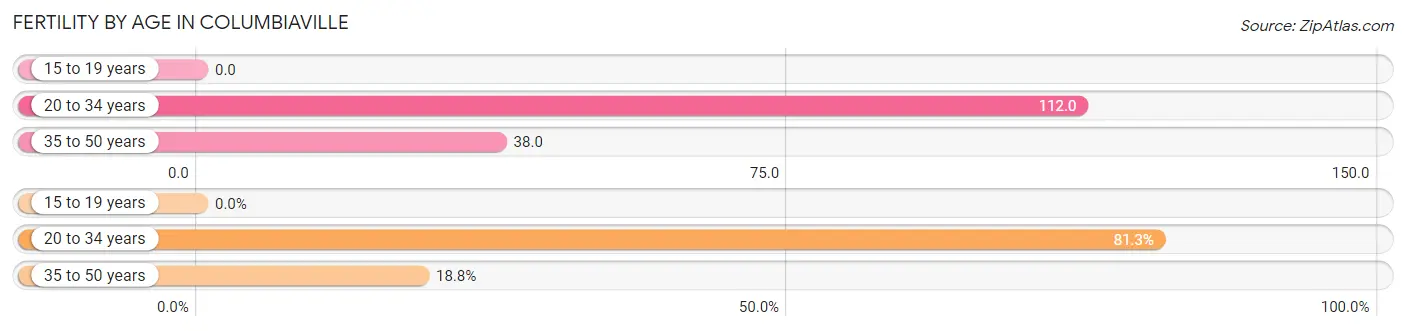
| Age Bracket | Women with Births | Births / 1,000 Women |
| 15 to 19 years | 0 (0.0%) | 0.0 |
| 20 to 34 years | 13 (81.2%) | 112.0 |
| 35 to 50 years | 3 (18.8%) | 38.0 |
| Total | 16 (100.0%) | 78.0 |
Fertility by Age by Marriage Status in Columbiaville
81.2% of women with births (16) in Columbiaville are married. The highest percentage of unmarried women with births falls into 20 to 34 years age bracket with 23.1% of them unmarried at the time of birth, while the lowest percentage of unmarried women with births belong to 35 to 50 years age bracket with 0.0% of them unmarried.
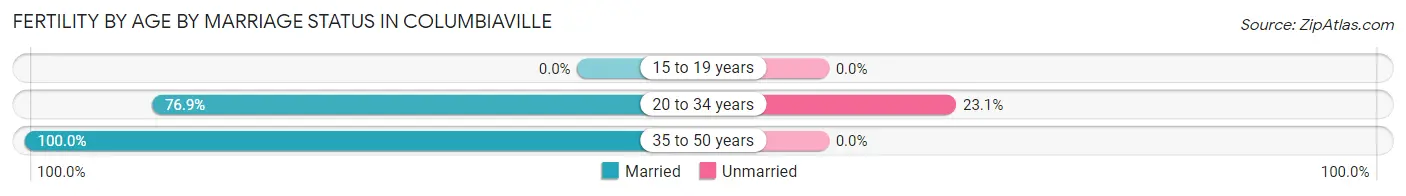
| Age Bracket | Married | Unmarried |
| 15 to 19 years | 0 (0.0%) | 0 (0.0%) |
| 20 to 34 years | 10 (76.9%) | 3 (23.1%) |
| 35 to 50 years | 3 (100.0%) | 0 (0.0%) |
| Total | 13 (81.2%) | 3 (18.8%) |
Fertility by Education in Columbiaville
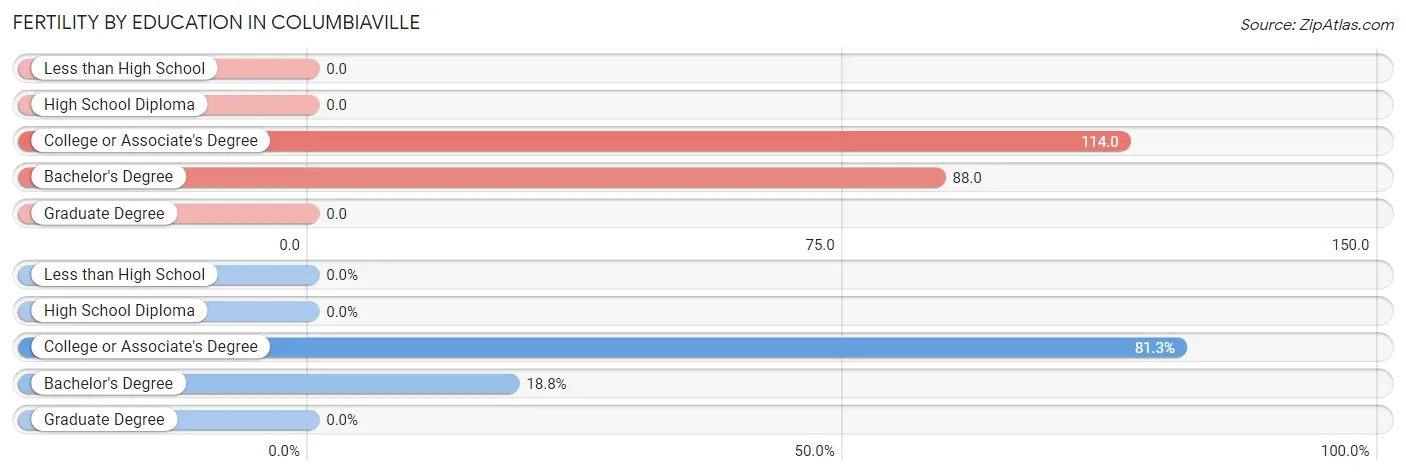
| Educational Attainment | Women with Births | Births / 1,000 Women |
| Less than High School | 0 (0.0%) | 0.0 |
| High School Diploma | 0 (0.0%) | 0.0 |
| College or Associate's Degree | 13 (81.2%) | 114.0 |
| Bachelor's Degree | 3 (18.8%) | 88.0 |
| Graduate Degree | 0 (0.0%) | 0.0 |
| Total | 16 (100.0%) | 78.0 |
Fertility by Education by Marriage Status in Columbiaville
18.8% of women with births in Columbiaville are unmarried. Women with the educational attainment of bachelor's degree are most likely to be married with 100.0% of them married at childbirth, while women with the educational attainment of college or associate's degree are least likely to be married with 23.1% of them unmarried at childbirth.
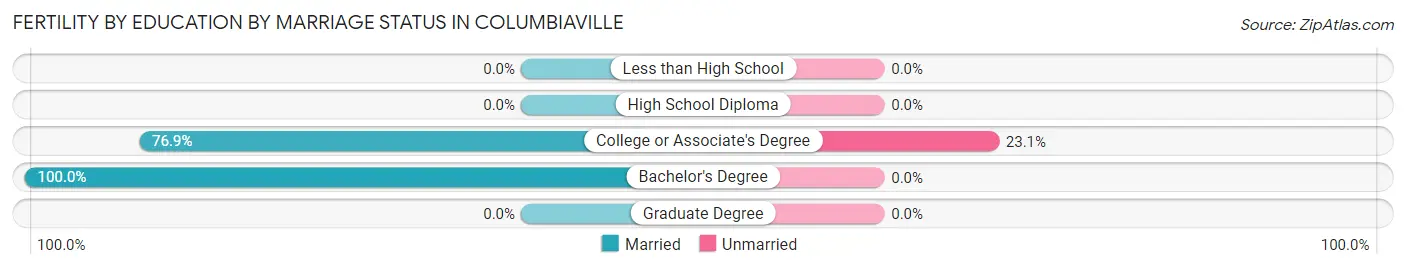
| Educational Attainment | Married | Unmarried |
| Less than High School | 0 (0.0%) | 0 (0.0%) |
| High School Diploma | 0 (0.0%) | 0 (0.0%) |
| College or Associate's Degree | 10 (76.9%) | 3 (23.1%) |
| Bachelor's Degree | 3 (100.0%) | 0 (0.0%) |
| Graduate Degree | 0 (0.0%) | 0 (0.0%) |
| Total | 13 (81.2%) | 3 (18.8%) |
Employment Characteristics in Columbiaville
Employment by Class of Employer in Columbiaville
Among the 320 employed individuals in Columbiaville, private company employees (219 | 68.4%), self-employed (not incorporated) (34 | 10.6%), and local government employees (26 | 8.1%) make up the most common classes of employment.
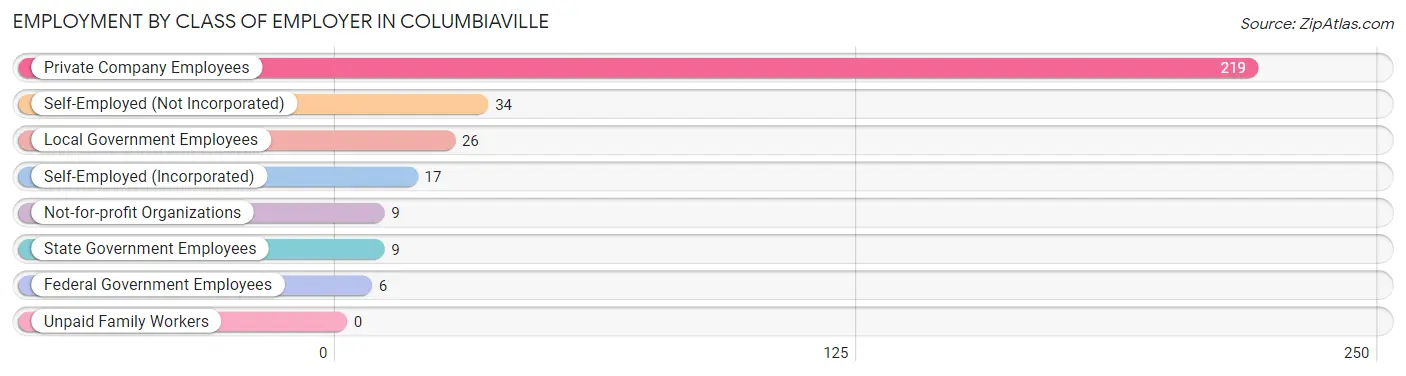
| Employer Class | # Employees | % Employees |
| Private Company Employees | 219 | 68.4% |
| Self-Employed (Incorporated) | 17 | 5.3% |
| Self-Employed (Not Incorporated) | 34 | 10.6% |
| Not-for-profit Organizations | 9 | 2.8% |
| Local Government Employees | 26 | 8.1% |
| State Government Employees | 9 | 2.8% |
| Federal Government Employees | 6 | 1.9% |
| Unpaid Family Workers | 0 | 0.0% |
| Total | 320 | 100.0% |
Employment Status by Age in Columbiaville
According to the labor force statistics for Columbiaville, out of the total population over 16 years of age (653), 60.6% or 396 individuals are in the labor force, with 14.4% or 57 of them unemployed. The age group with the highest labor force participation rate is 25 to 29 years, with 93.1% or 27 individuals in the labor force. Within the labor force, the 30 to 34 years age range has the highest percentage of unemployed individuals, with 53.4% or 47 of them being unemployed.
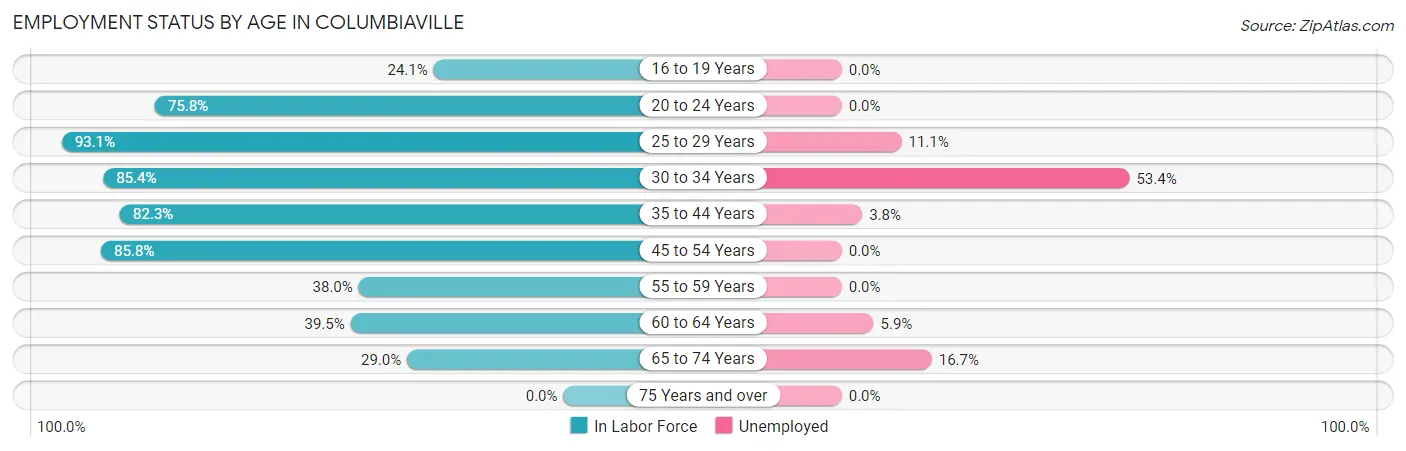
| Age Bracket | In Labor Force | Unemployed |
| 16 to 19 Years | 7 (24.1%) | 0 (0.0%) |
| 20 to 24 Years | 50 (75.8%) | 0 (0.0%) |
| 25 to 29 Years | 27 (93.1%) | 3 (11.1%) |
| 30 to 34 Years | 88 (85.4%) | 47 (53.4%) |
| 35 to 44 Years | 79 (82.3%) | 3 (3.8%) |
| 45 to 54 Years | 91 (85.8%) | 0 (0.0%) |
| 55 to 59 Years | 19 (38.0%) | 0 (0.0%) |
| 60 to 64 Years | 17 (39.5%) | 1 (5.9%) |
| 65 to 74 Years | 18 (29.0%) | 3 (16.7%) |
| 75 Years and over | 0 (0.0%) | 0 (0.0%) |
| Total | 396 (60.6%) | 57 (14.4%) |
Employment Status by Educational Attainment in Columbiaville
According to labor force statistics for Columbiaville, 75.2% of individuals (321) out of the total population between 25 and 64 years of age (427) are in the labor force, with 16.8% or 54 of them being unemployed. The group with the highest labor force participation rate are those with the educational attainment of college / associate degree, with 86.7% or 156 individuals in the labor force. Within the labor force, individuals with college / associate degree education have the highest percentage of unemployment, with 28.2% or 44 of them being unemployed.
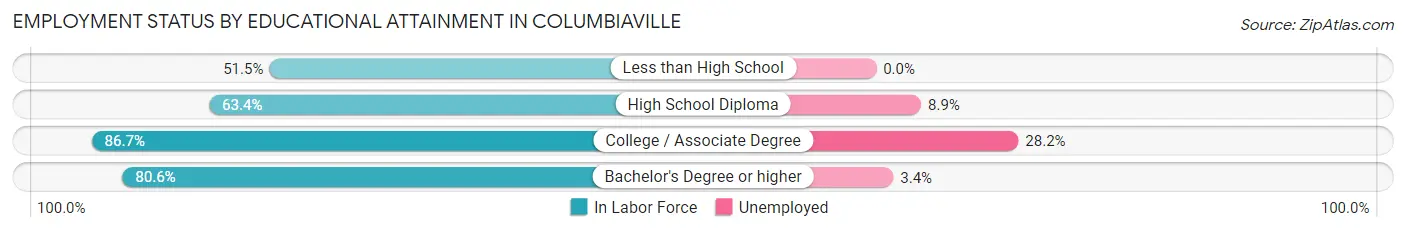
| Educational Attainment | In Labor Force | Unemployed |
| Less than High School | 17 (51.5%) | 0 (0.0%) |
| High School Diploma | 90 (63.4%) | 13 (8.9%) |
| College / Associate Degree | 156 (86.7%) | 51 (28.2%) |
| Bachelor's Degree or higher | 58 (80.6%) | 2 (3.4%) |
| Total | 321 (75.2%) | 72 (16.8%) |
Employment Occupations by Sex in Columbiaville
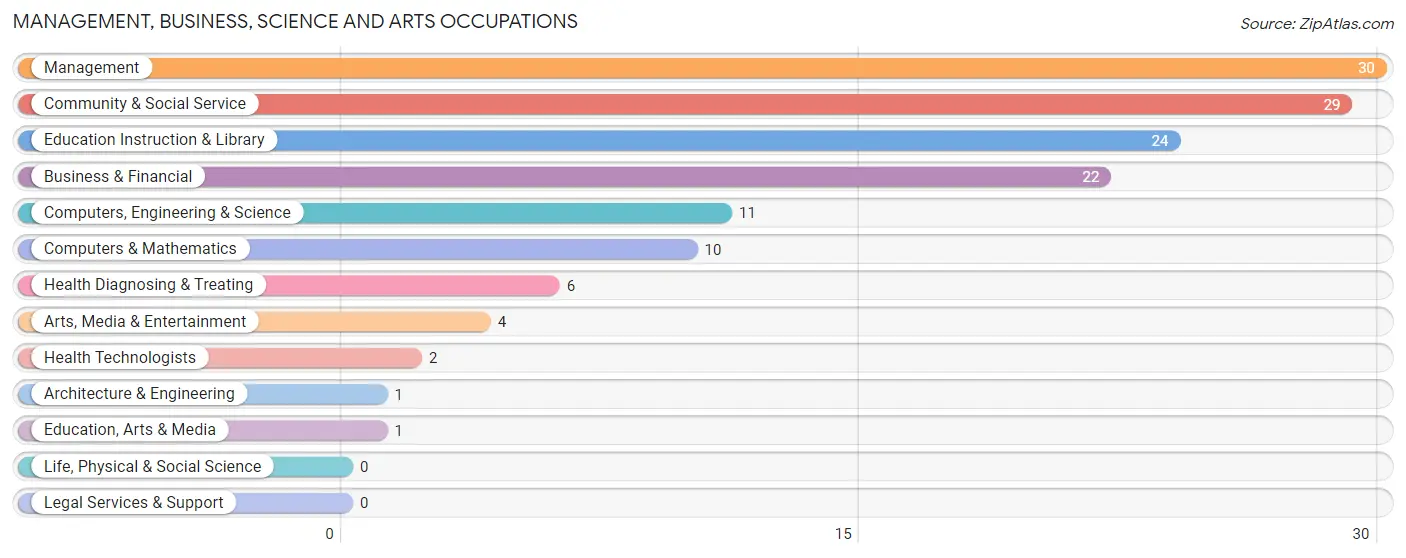
Management, Business, Science and Arts Occupations
The most common Management, Business, Science and Arts occupations in Columbiaville are Management (30 | 8.8%), Community & Social Service (29 | 8.6%), Education Instruction & Library (24 | 7.1%), Business & Financial (22 | 6.5%), and Computers, Engineering & Science (11 | 3.2%).
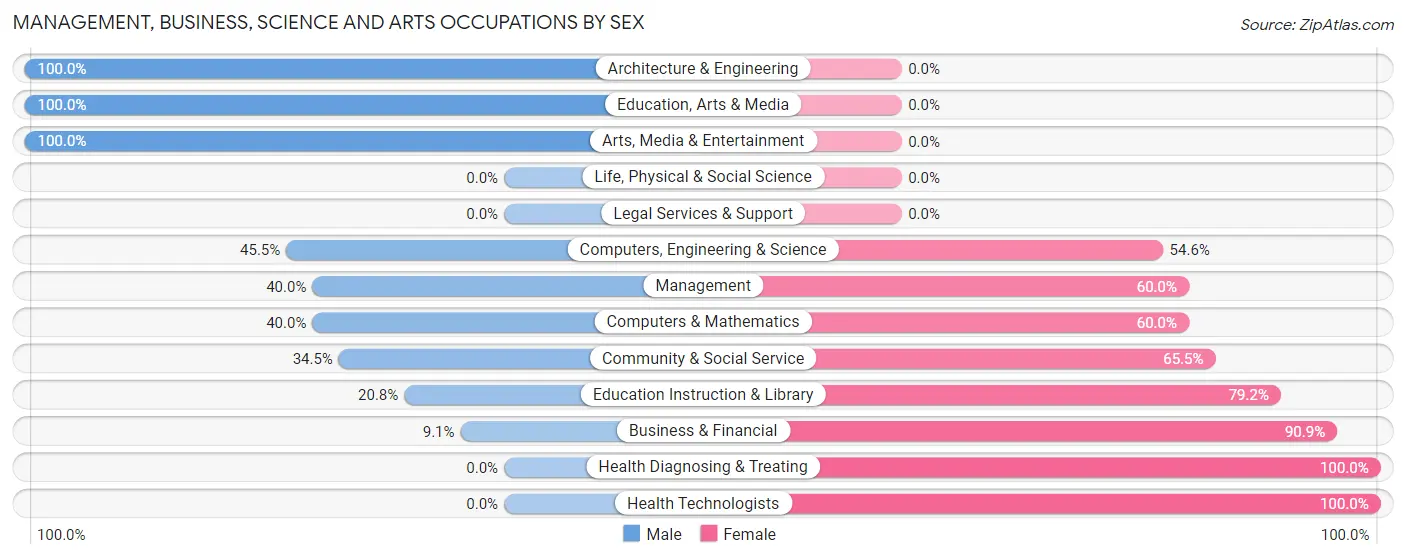
Management, Business, Science and Arts Occupations by Sex
Within the Management, Business, Science and Arts occupations in Columbiaville, the most male-oriented occupations are Architecture & Engineering (100.0%), Education, Arts & Media (100.0%), and Arts, Media & Entertainment (100.0%), while the most female-oriented occupations are Health Diagnosing & Treating (100.0%), Health Technologists (100.0%), and Business & Financial (90.9%).
| Occupation | Male | Female |
| Management | 12 (40.0%) | 18 (60.0%) |
| Business & Financial | 2 (9.1%) | 20 (90.9%) |
| Computers, Engineering & Science | 5 (45.5%) | 6 (54.5%) |
| Computers & Mathematics | 4 (40.0%) | 6 (60.0%) |
| Architecture & Engineering | 1 (100.0%) | 0 (0.0%) |
| Life, Physical & Social Science | 0 (0.0%) | 0 (0.0%) |
| Community & Social Service | 10 (34.5%) | 19 (65.5%) |
| Education, Arts & Media | 1 (100.0%) | 0 (0.0%) |
| Legal Services & Support | 0 (0.0%) | 0 (0.0%) |
| Education Instruction & Library | 5 (20.8%) | 19 (79.2%) |
| Arts, Media & Entertainment | 4 (100.0%) | 0 (0.0%) |
| Health Diagnosing & Treating | 0 (0.0%) | 6 (100.0%) |
| Health Technologists | 0 (0.0%) | 2 (100.0%) |
| Total (Category) | 29 (29.6%) | 69 (70.4%) |
| Total (Overall) | 184 (54.3%) | 155 (45.7%) |
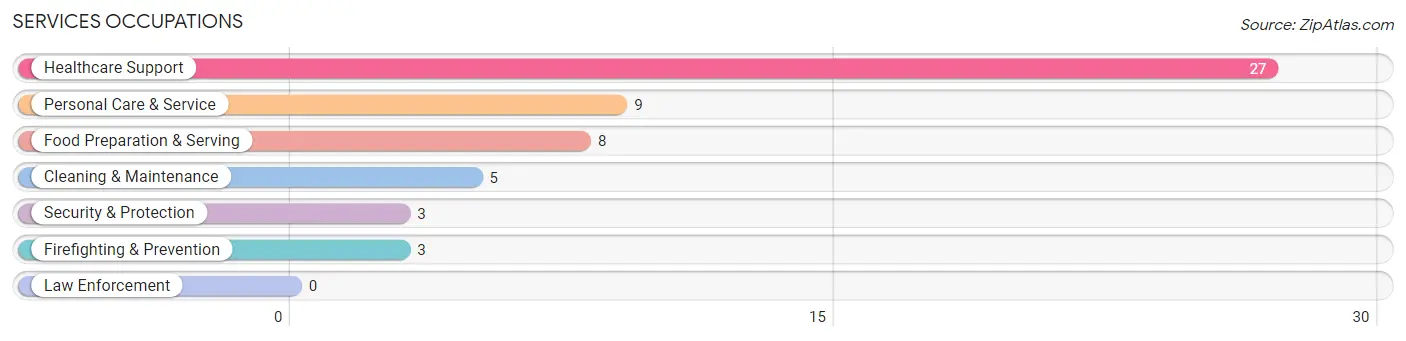
Services Occupations
The most common Services occupations in Columbiaville are Healthcare Support (27 | 8.0%), Personal Care & Service (9 | 2.6%), Food Preparation & Serving (8 | 2.4%), Cleaning & Maintenance (5 | 1.5%), and Security & Protection (3 | 0.9%).
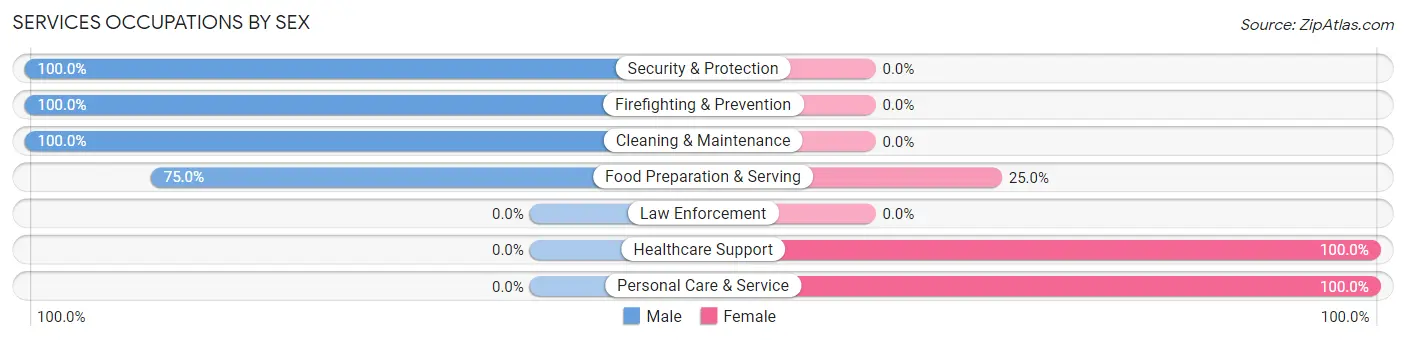
Services Occupations by Sex
Within the Services occupations in Columbiaville, the most male-oriented occupations are Security & Protection (100.0%), Firefighting & Prevention (100.0%), and Cleaning & Maintenance (100.0%), while the most female-oriented occupations are Healthcare Support (100.0%), Personal Care & Service (100.0%), and Food Preparation & Serving (25.0%).
| Occupation | Male | Female |
| Healthcare Support | 0 (0.0%) | 27 (100.0%) |
| Security & Protection | 3 (100.0%) | 0 (0.0%) |
| Firefighting & Prevention | 3 (100.0%) | 0 (0.0%) |
| Law Enforcement | 0 (0.0%) | 0 (0.0%) |
| Food Preparation & Serving | 6 (75.0%) | 2 (25.0%) |
| Cleaning & Maintenance | 5 (100.0%) | 0 (0.0%) |
| Personal Care & Service | 0 (0.0%) | 9 (100.0%) |
| Total (Category) | 14 (26.9%) | 38 (73.1%) |
| Total (Overall) | 184 (54.3%) | 155 (45.7%) |
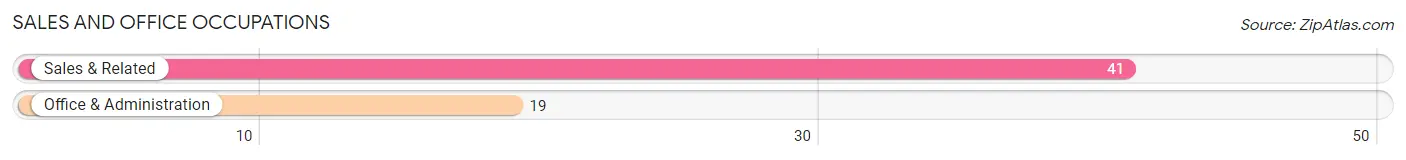
Sales and Office Occupations
The most common Sales and Office occupations in Columbiaville are Sales & Related (41 | 12.1%), and Office & Administration (19 | 5.6%).
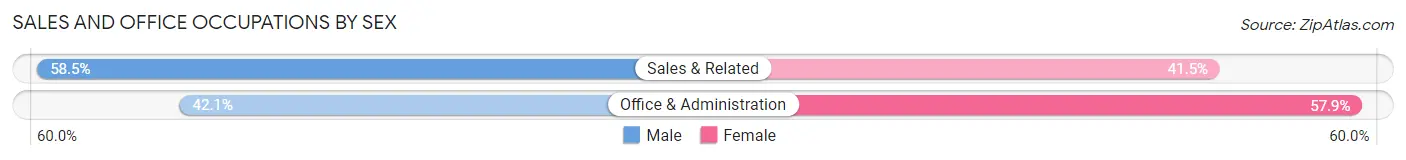
Sales and Office Occupations by Sex
| Occupation | Male | Female |
| Sales & Related | 24 (58.5%) | 17 (41.5%) |
| Office & Administration | 8 (42.1%) | 11 (57.9%) |
| Total (Category) | 32 (53.3%) | 28 (46.7%) |
| Total (Overall) | 184 (54.3%) | 155 (45.7%) |
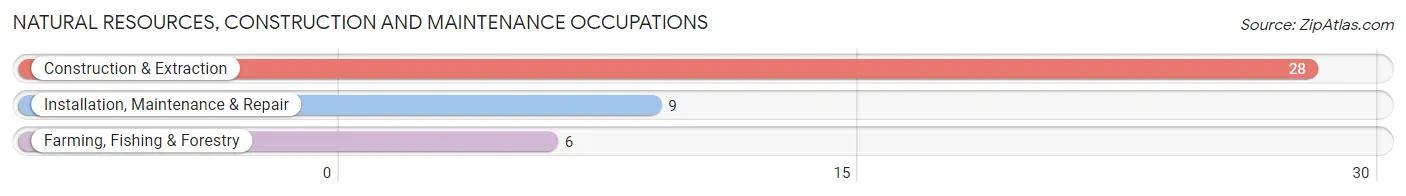
Natural Resources, Construction and Maintenance Occupations
The most common Natural Resources, Construction and Maintenance occupations in Columbiaville are Construction & Extraction (28 | 8.3%), Installation, Maintenance & Repair (9 | 2.6%), and Farming, Fishing & Forestry (6 | 1.8%).
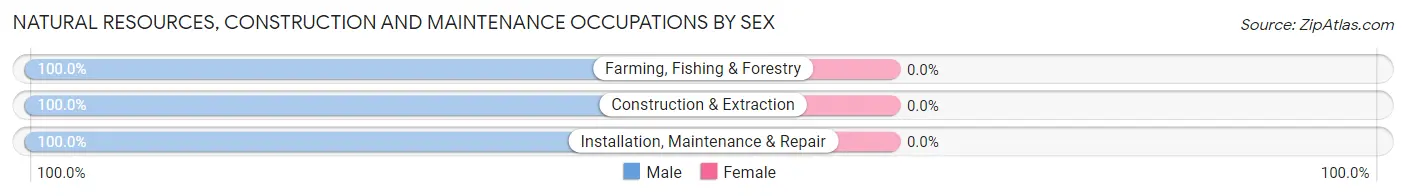
Natural Resources, Construction and Maintenance Occupations by Sex
| Occupation | Male | Female |
| Farming, Fishing & Forestry | 6 (100.0%) | 0 (0.0%) |
| Construction & Extraction | 28 (100.0%) | 0 (0.0%) |
| Installation, Maintenance & Repair | 9 (100.0%) | 0 (0.0%) |
| Total (Category) | 43 (100.0%) | 0 (0.0%) |
| Total (Overall) | 184 (54.3%) | 155 (45.7%) |
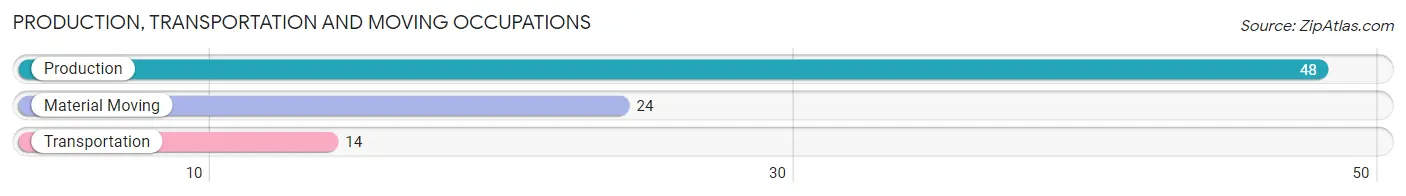
Production, Transportation and Moving Occupations
The most common Production, Transportation and Moving occupations in Columbiaville are Production (48 | 14.2%), Material Moving (24 | 7.1%), and Transportation (14 | 4.1%).
Production, Transportation and Moving Occupations by Sex
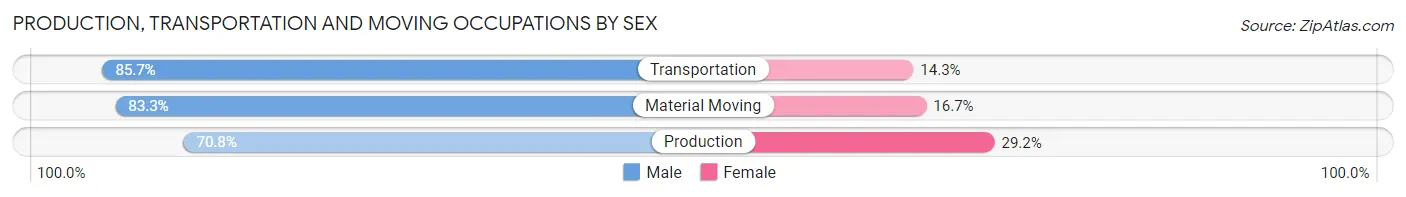
| Occupation | Male | Female |
| Production | 34 (70.8%) | 14 (29.2%) |
| Transportation | 12 (85.7%) | 2 (14.3%) |
| Material Moving | 20 (83.3%) | 4 (16.7%) |
| Total (Category) | 66 (76.7%) | 20 (23.3%) |
| Total (Overall) | 184 (54.3%) | 155 (45.7%) |
Employment Industries by Sex in Columbiaville
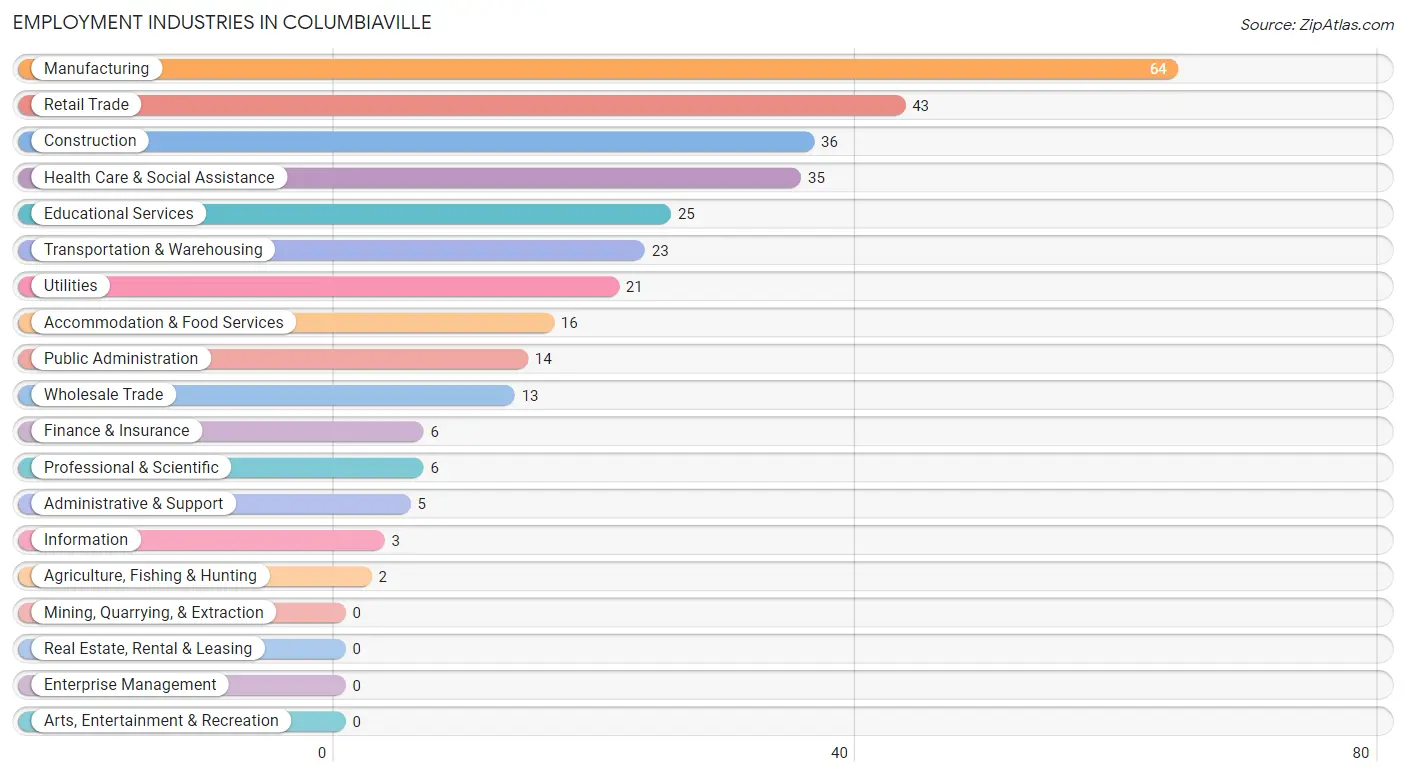
Employment Industries in Columbiaville
The major employment industries in Columbiaville include Manufacturing (64 | 18.9%), Retail Trade (43 | 12.7%), Construction (36 | 10.6%), Health Care & Social Assistance (35 | 10.3%), and Educational Services (25 | 7.4%).
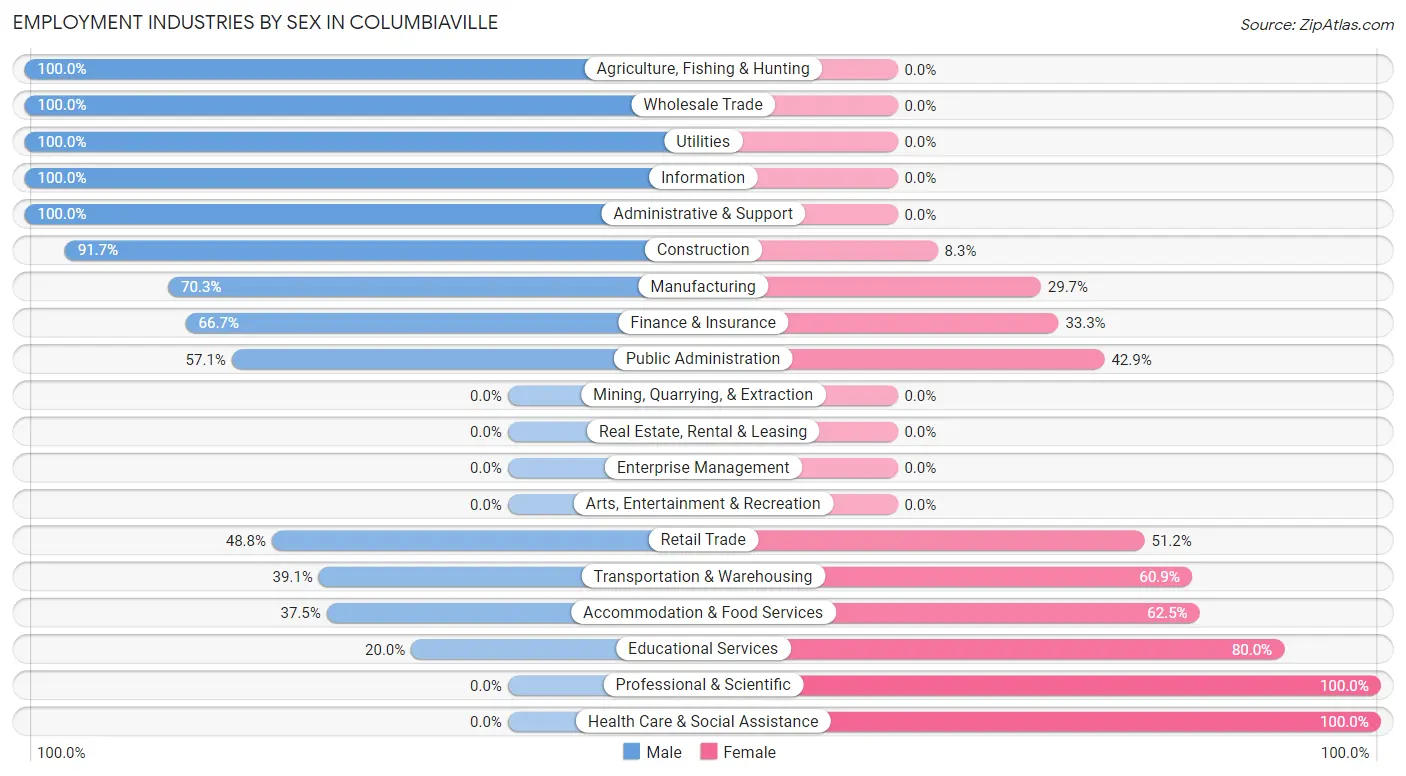
Employment Industries by Sex in Columbiaville
The Columbiaville industries that see more men than women are Agriculture, Fishing & Hunting (100.0%), Wholesale Trade (100.0%), and Utilities (100.0%), whereas the industries that tend to have a higher number of women are Professional & Scientific (100.0%), Health Care & Social Assistance (100.0%), and Educational Services (80.0%).
| Industry | Male | Female |
| Agriculture, Fishing & Hunting | 2 (100.0%) | 0 (0.0%) |
| Mining, Quarrying, & Extraction | 0 (0.0%) | 0 (0.0%) |
| Construction | 33 (91.7%) | 3 (8.3%) |
| Manufacturing | 45 (70.3%) | 19 (29.7%) |
| Wholesale Trade | 13 (100.0%) | 0 (0.0%) |
| Retail Trade | 21 (48.8%) | 22 (51.2%) |
| Transportation & Warehousing | 9 (39.1%) | 14 (60.9%) |
| Utilities | 21 (100.0%) | 0 (0.0%) |
| Information | 3 (100.0%) | 0 (0.0%) |
| Finance & Insurance | 4 (66.7%) | 2 (33.3%) |
| Real Estate, Rental & Leasing | 0 (0.0%) | 0 (0.0%) |
| Professional & Scientific | 0 (0.0%) | 6 (100.0%) |
| Enterprise Management | 0 (0.0%) | 0 (0.0%) |
| Administrative & Support | 5 (100.0%) | 0 (0.0%) |
| Educational Services | 5 (20.0%) | 20 (80.0%) |
| Health Care & Social Assistance | 0 (0.0%) | 35 (100.0%) |
| Arts, Entertainment & Recreation | 0 (0.0%) | 0 (0.0%) |
| Accommodation & Food Services | 6 (37.5%) | 10 (62.5%) |
| Public Administration | 8 (57.1%) | 6 (42.9%) |
| Total | 184 (54.3%) | 155 (45.7%) |
Education in Columbiaville
School Enrollment in Columbiaville
The most common levels of schooling among the 138 students in Columbiaville are college / undergraduate (39 | 28.3%), elementary school (35 | 25.4%), and high school (27 | 19.6%).
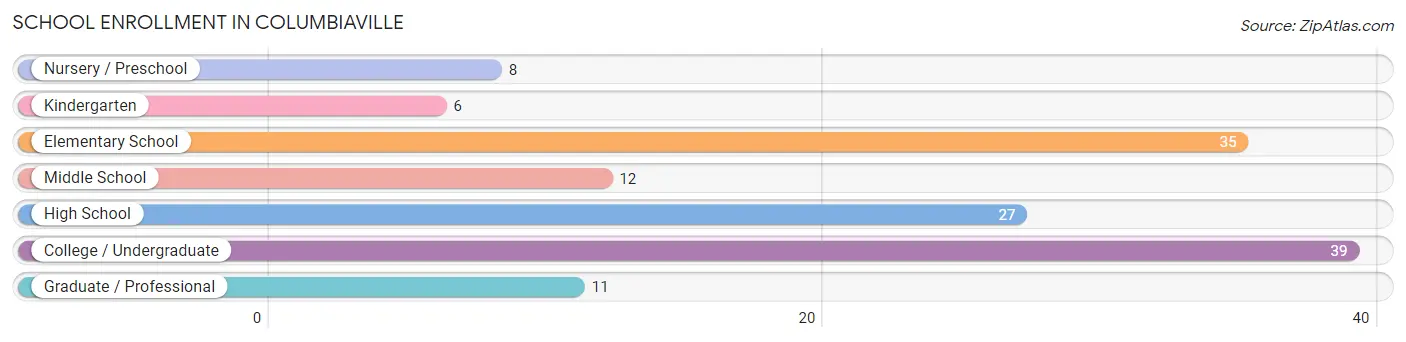
| School Level | # Students | % Students |
| Nursery / Preschool | 8 | 5.8% |
| Kindergarten | 6 | 4.3% |
| Elementary School | 35 | 25.4% |
| Middle School | 12 | 8.7% |
| High School | 27 | 19.6% |
| College / Undergraduate | 39 | 28.3% |
| Graduate / Professional | 11 | 8.0% |
| Total | 138 | 100.0% |
School Enrollment by Age by Funding Source in Columbiaville
Out of a total of 138 students who are enrolled in schools in Columbiaville, 14 (10.1%) attend a private institution, while the remaining 124 (89.9%) are enrolled in public schools. The age group of 3 to 4 year olds has the highest likelihood of being enrolled in private schools, with 3 (42.9% in the age bracket) enrolled. Conversely, the age group of 20 to 24 year olds has the lowest likelihood of being enrolled in a private school, with 25 (100.0% in the age bracket) attending a public institution.
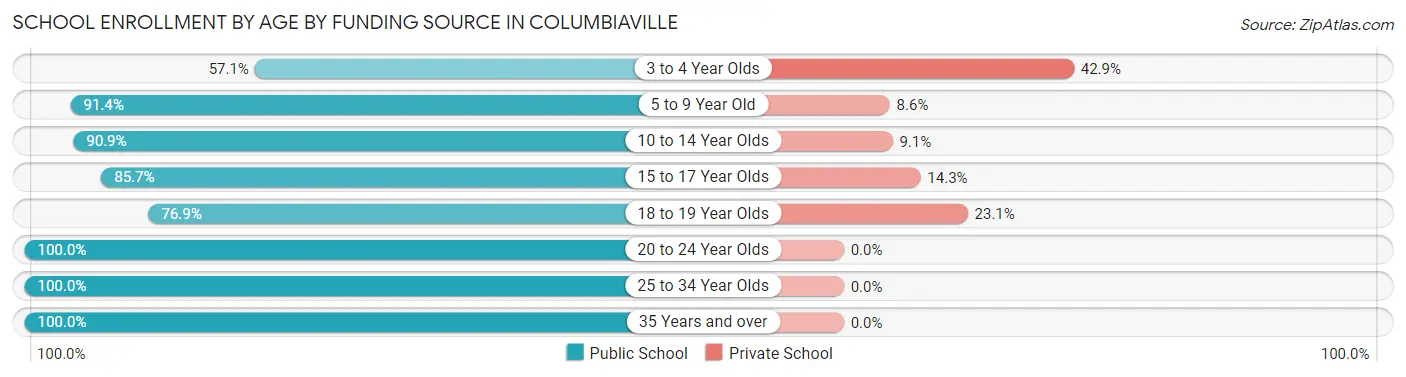
| Age Bracket | Public School | Private School |
| 3 to 4 Year Olds | 4 (57.1%) | 3 (42.9%) |
| 5 to 9 Year Old | 32 (91.4%) | 3 (8.6%) |
| 10 to 14 Year Olds | 20 (90.9%) | 2 (9.1%) |
| 15 to 17 Year Olds | 18 (85.7%) | 3 (14.3%) |
| 18 to 19 Year Olds | 10 (76.9%) | 3 (23.1%) |
| 20 to 24 Year Olds | 25 (100.0%) | 0 (0.0%) |
| 25 to 34 Year Olds | 6 (100.0%) | 0 (0.0%) |
| 35 Years and over | 9 (100.0%) | 0 (0.0%) |
| Total | 124 (89.9%) | 14 (10.1%) |
Educational Attainment by Field of Study in Columbiaville
Business (33 | 36.3%), education (19 | 20.9%), psychology (8 | 8.8%), bio, nature & agricultural (5 | 5.5%), and physical & health sciences (5 | 5.5%) are the most common fields of study among 91 individuals in Columbiaville who have obtained a bachelor's degree or higher.
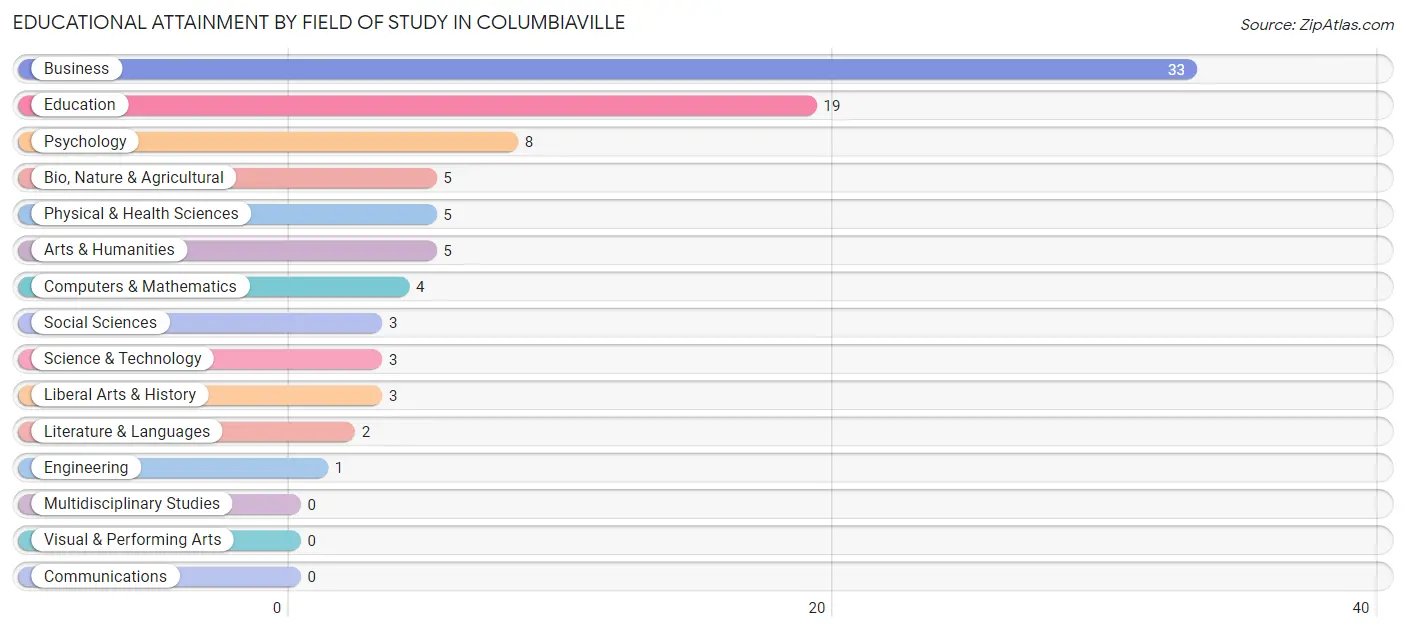
| Field of Study | # Graduates | % Graduates |
| Computers & Mathematics | 4 | 4.4% |
| Bio, Nature & Agricultural | 5 | 5.5% |
| Physical & Health Sciences | 5 | 5.5% |
| Psychology | 8 | 8.8% |
| Social Sciences | 3 | 3.3% |
| Engineering | 1 | 1.1% |
| Multidisciplinary Studies | 0 | 0.0% |
| Science & Technology | 3 | 3.3% |
| Business | 33 | 36.3% |
| Education | 19 | 20.9% |
| Literature & Languages | 2 | 2.2% |
| Liberal Arts & History | 3 | 3.3% |
| Visual & Performing Arts | 0 | 0.0% |
| Communications | 0 | 0.0% |
| Arts & Humanities | 5 | 5.5% |
| Total | 91 | 100.0% |
Transportation & Commute in Columbiaville
Vehicle Availability by Sex in Columbiaville
The most prevalent vehicle ownership categories in Columbiaville are males with 2 vehicles (69, accounting for 41.3%) and females with 2 vehicles (53, making up 45.1%).
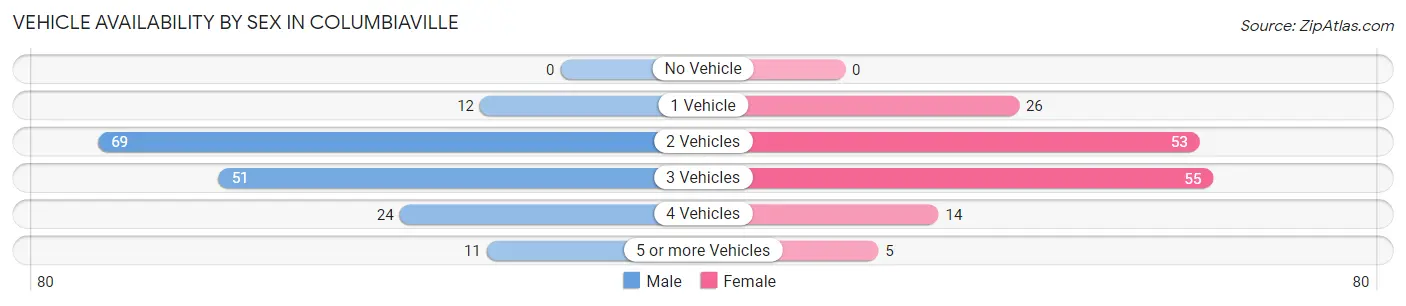
| Vehicles Available | Male | Female |
| No Vehicle | 0 (0.0%) | 0 (0.0%) |
| 1 Vehicle | 12 (7.2%) | 26 (17.0%) |
| 2 Vehicles | 69 (41.3%) | 53 (34.6%) |
| 3 Vehicles | 51 (30.5%) | 55 (35.9%) |
| 4 Vehicles | 24 (14.4%) | 14 (9.1%) |
| 5 or more Vehicles | 11 (6.6%) | 5 (3.3%) |
| Total | 167 (100.0%) | 153 (100.0%) |
Commute Time in Columbiaville
The most frequently occuring commute durations in Columbiaville are 20 to 24 minutes (40 commuters, 13.2%), 30 to 34 minutes (39 commuters, 12.8%), and 45 to 59 minutes (30 commuters, 9.9%).
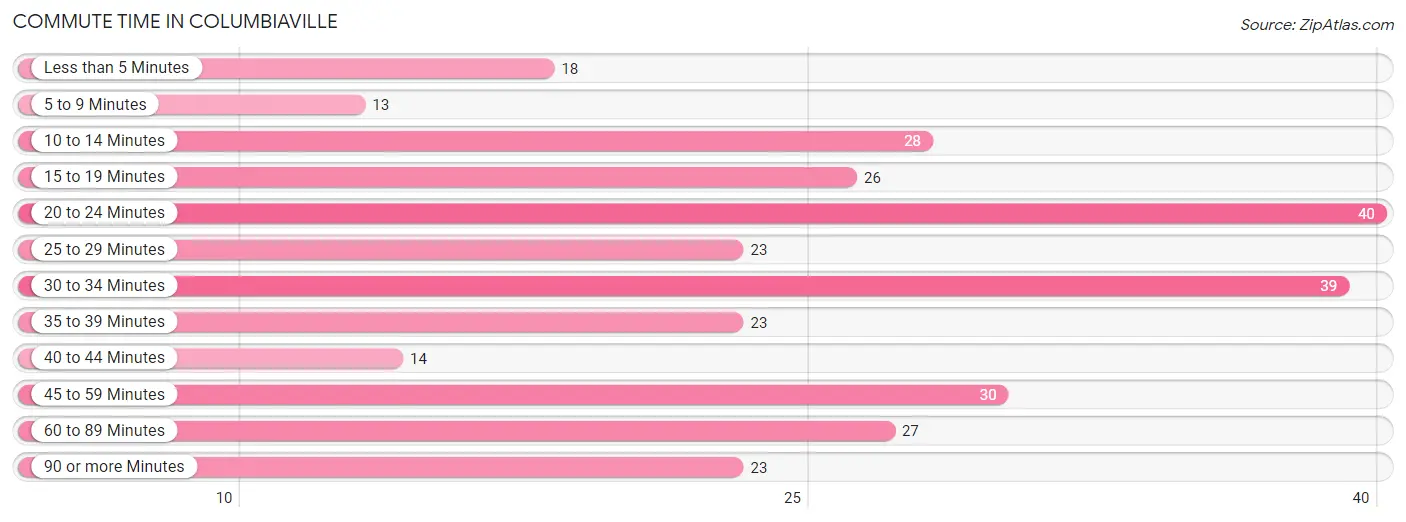
| Commute Time | # Commuters | % Commuters |
| Less than 5 Minutes | 18 | 5.9% |
| 5 to 9 Minutes | 13 | 4.3% |
| 10 to 14 Minutes | 28 | 9.2% |
| 15 to 19 Minutes | 26 | 8.6% |
| 20 to 24 Minutes | 40 | 13.2% |
| 25 to 29 Minutes | 23 | 7.6% |
| 30 to 34 Minutes | 39 | 12.8% |
| 35 to 39 Minutes | 23 | 7.6% |
| 40 to 44 Minutes | 14 | 4.6% |
| 45 to 59 Minutes | 30 | 9.9% |
| 60 to 89 Minutes | 27 | 8.9% |
| 90 or more Minutes | 23 | 7.6% |
Commute Time by Sex in Columbiaville
The most common commute times in Columbiaville are 45 to 59 minutes (21 commuters, 13.2%) for males and 20 to 24 minutes (32 commuters, 22.1%) for females.
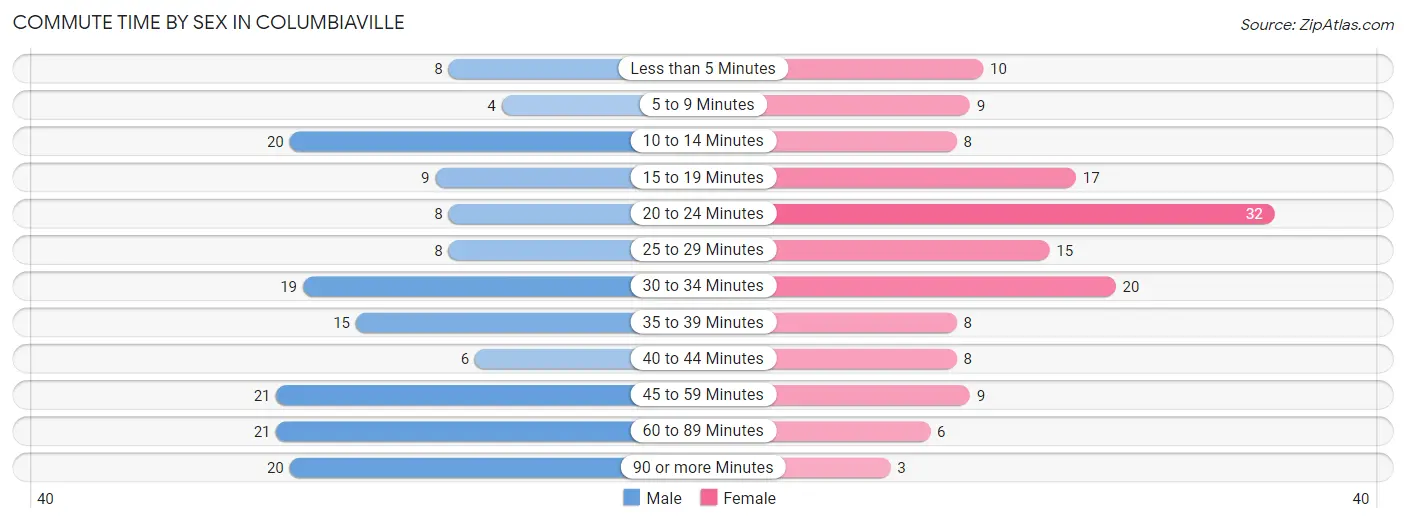
| Commute Time | Male | Female |
| Less than 5 Minutes | 8 (5.0%) | 10 (6.9%) |
| 5 to 9 Minutes | 4 (2.5%) | 9 (6.2%) |
| 10 to 14 Minutes | 20 (12.6%) | 8 (5.5%) |
| 15 to 19 Minutes | 9 (5.7%) | 17 (11.7%) |
| 20 to 24 Minutes | 8 (5.0%) | 32 (22.1%) |
| 25 to 29 Minutes | 8 (5.0%) | 15 (10.3%) |
| 30 to 34 Minutes | 19 (11.9%) | 20 (13.8%) |
| 35 to 39 Minutes | 15 (9.4%) | 8 (5.5%) |
| 40 to 44 Minutes | 6 (3.8%) | 8 (5.5%) |
| 45 to 59 Minutes | 21 (13.2%) | 9 (6.2%) |
| 60 to 89 Minutes | 21 (13.2%) | 6 (4.1%) |
| 90 or more Minutes | 20 (12.6%) | 3 (2.1%) |
Time of Departure to Work by Sex in Columbiaville
The most frequent times of departure to work in Columbiaville are 7:30 AM to 7:59 AM (26, 16.4%) for males and 7:30 AM to 7:59 AM (34, 23.4%) for females.
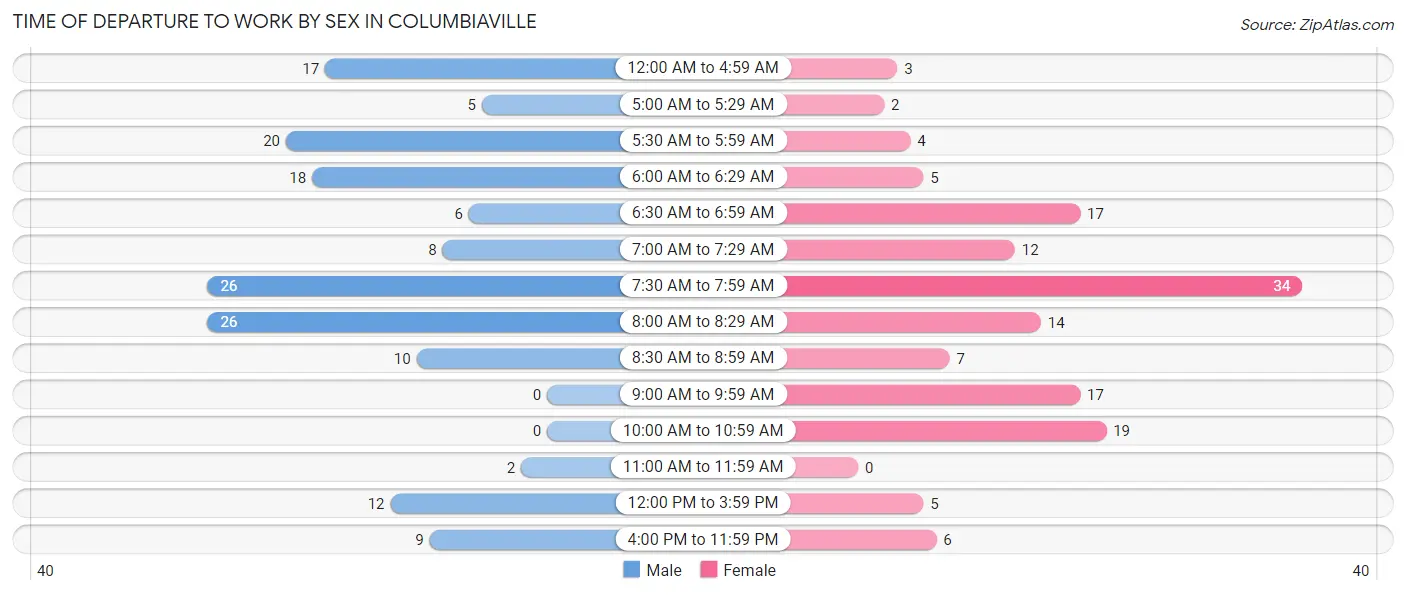
| Time of Departure | Male | Female |
| 12:00 AM to 4:59 AM | 17 (10.7%) | 3 (2.1%) |
| 5:00 AM to 5:29 AM | 5 (3.1%) | 2 (1.4%) |
| 5:30 AM to 5:59 AM | 20 (12.6%) | 4 (2.8%) |
| 6:00 AM to 6:29 AM | 18 (11.3%) | 5 (3.5%) |
| 6:30 AM to 6:59 AM | 6 (3.8%) | 17 (11.7%) |
| 7:00 AM to 7:29 AM | 8 (5.0%) | 12 (8.3%) |
| 7:30 AM to 7:59 AM | 26 (16.4%) | 34 (23.4%) |
| 8:00 AM to 8:29 AM | 26 (16.4%) | 14 (9.7%) |
| 8:30 AM to 8:59 AM | 10 (6.3%) | 7 (4.8%) |
| 9:00 AM to 9:59 AM | 0 (0.0%) | 17 (11.7%) |
| 10:00 AM to 10:59 AM | 0 (0.0%) | 19 (13.1%) |
| 11:00 AM to 11:59 AM | 2 (1.3%) | 0 (0.0%) |
| 12:00 PM to 3:59 PM | 12 (7.5%) | 5 (3.5%) |
| 4:00 PM to 11:59 PM | 9 (5.7%) | 6 (4.1%) |
| Total | 159 (100.0%) | 145 (100.0%) |
Housing Occupancy in Columbiaville
Occupancy by Ownership in Columbiaville
Of the total 335 dwellings in Columbiaville, owner-occupied units account for 277 (82.7%), while renter-occupied units make up 58 (17.3%).
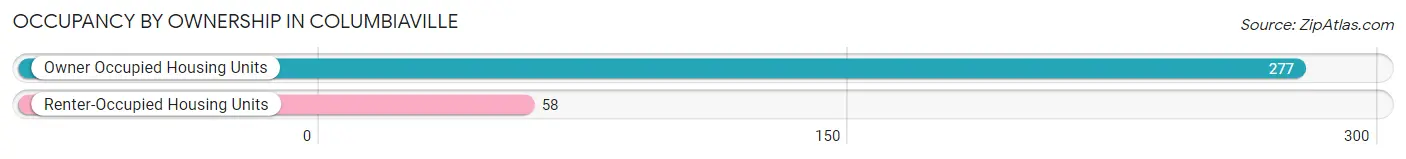
| Occupancy | # Housing Units | % Housing Units |
| Owner Occupied Housing Units | 277 | 82.7% |
| Renter-Occupied Housing Units | 58 | 17.3% |
| Total Occupied Housing Units | 335 | 100.0% |
Occupancy by Household Size in Columbiaville
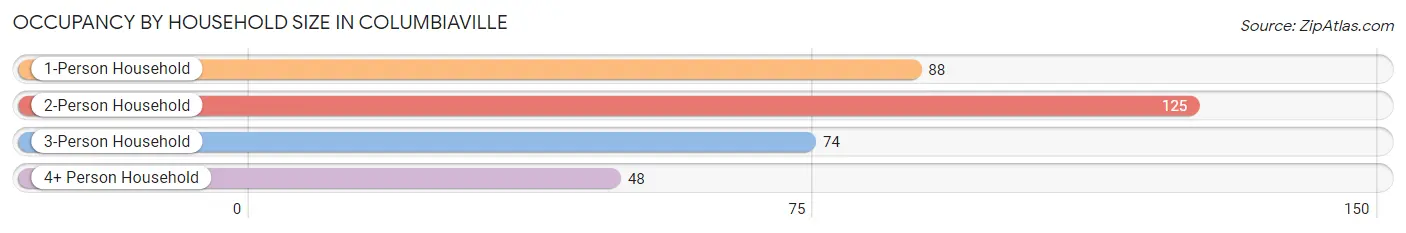
| Household Size | # Housing Units | % Housing Units |
| 1-Person Household | 88 | 26.3% |
| 2-Person Household | 125 | 37.3% |
| 3-Person Household | 74 | 22.1% |
| 4+ Person Household | 48 | 14.3% |
| Total Housing Units | 335 | 100.0% |
Occupancy by Ownership by Household Size in Columbiaville
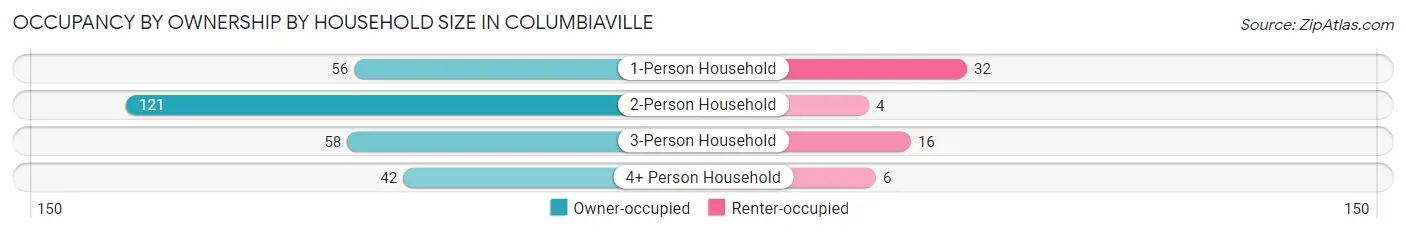
| Household Size | Owner-occupied | Renter-occupied |
| 1-Person Household | 56 (63.6%) | 32 (36.4%) |
| 2-Person Household | 121 (96.8%) | 4 (3.2%) |
| 3-Person Household | 58 (78.4%) | 16 (21.6%) |
| 4+ Person Household | 42 (87.5%) | 6 (12.5%) |
| Total Housing Units | 277 (82.7%) | 58 (17.3%) |
Occupancy by Educational Attainment in Columbiaville
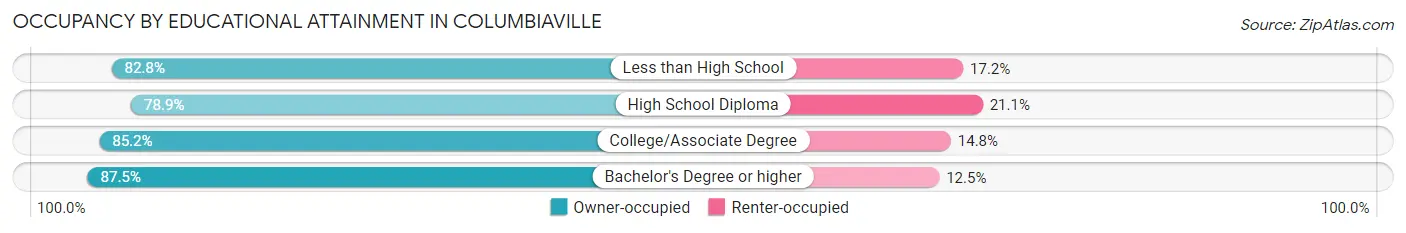
| Household Size | Owner-occupied | Renter-occupied |
| Less than High School | 24 (82.8%) | 5 (17.2%) |
| High School Diploma | 112 (78.9%) | 30 (21.1%) |
| College/Associate Degree | 92 (85.2%) | 16 (14.8%) |
| Bachelor's Degree or higher | 49 (87.5%) | 7 (12.5%) |
Occupancy by Age of Householder in Columbiaville
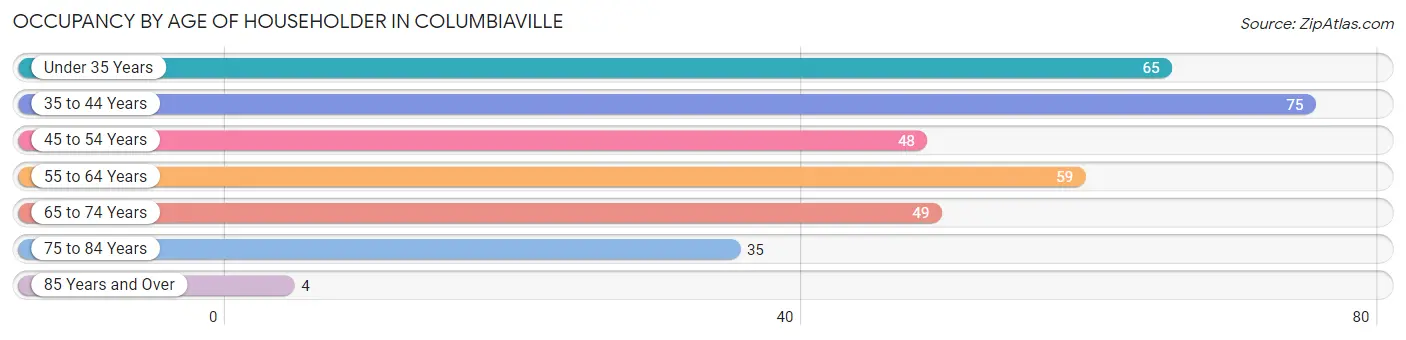
| Age Bracket | # Households | % Households |
| Under 35 Years | 65 | 19.4% |
| 35 to 44 Years | 75 | 22.4% |
| 45 to 54 Years | 48 | 14.3% |
| 55 to 64 Years | 59 | 17.6% |
| 65 to 74 Years | 49 | 14.6% |
| 75 to 84 Years | 35 | 10.4% |
| 85 Years and Over | 4 | 1.2% |
| Total | 335 | 100.0% |
Housing Finances in Columbiaville
Median Income by Occupancy in Columbiaville
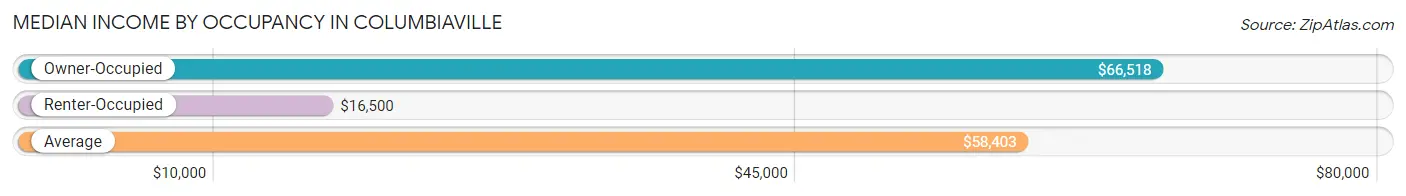
| Occupancy Type | # Households | Median Income |
| Owner-Occupied | 277 (82.7%) | $66,518 |
| Renter-Occupied | 58 (17.3%) | $16,500 |
| Average | 335 (100.0%) | $58,403 |
Occupancy by Householder Income Bracket in Columbiaville
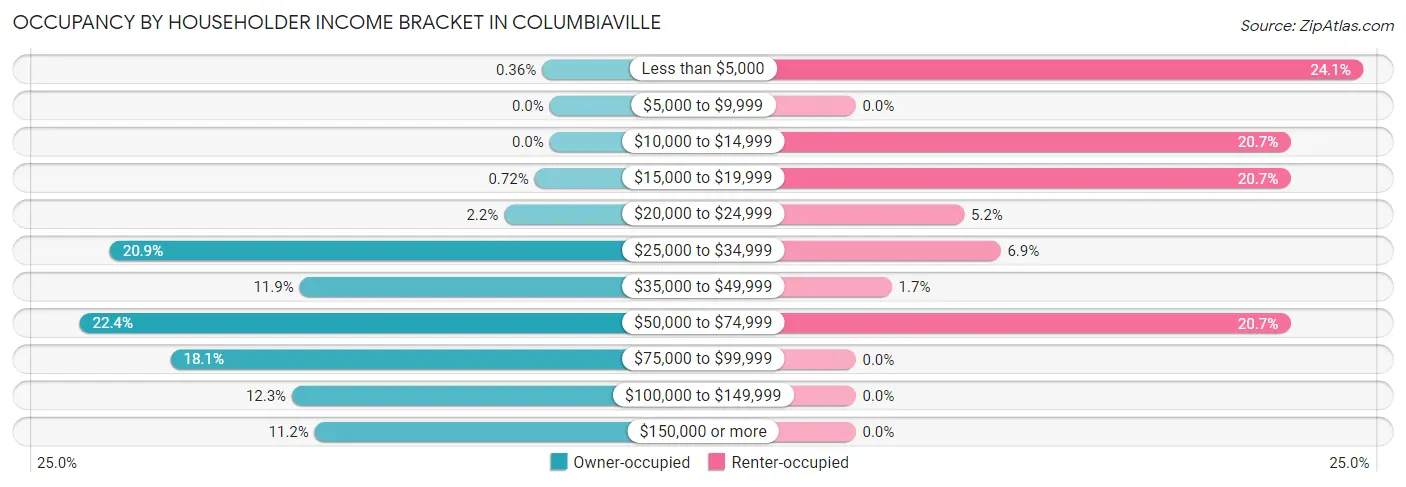
| Income Bracket | Owner-occupied | Renter-occupied |
| Less than $5,000 | 1 (0.4%) | 14 (24.1%) |
| $5,000 to $9,999 | 0 (0.0%) | 0 (0.0%) |
| $10,000 to $14,999 | 0 (0.0%) | 12 (20.7%) |
| $15,000 to $19,999 | 2 (0.7%) | 12 (20.7%) |
| $20,000 to $24,999 | 6 (2.2%) | 3 (5.2%) |
| $25,000 to $34,999 | 58 (20.9%) | 4 (6.9%) |
| $35,000 to $49,999 | 33 (11.9%) | 1 (1.7%) |
| $50,000 to $74,999 | 62 (22.4%) | 12 (20.7%) |
| $75,000 to $99,999 | 50 (18.0%) | 0 (0.0%) |
| $100,000 to $149,999 | 34 (12.3%) | 0 (0.0%) |
| $150,000 or more | 31 (11.2%) | 0 (0.0%) |
| Total | 277 (100.0%) | 58 (100.0%) |
Monthly Housing Cost Tiers in Columbiaville
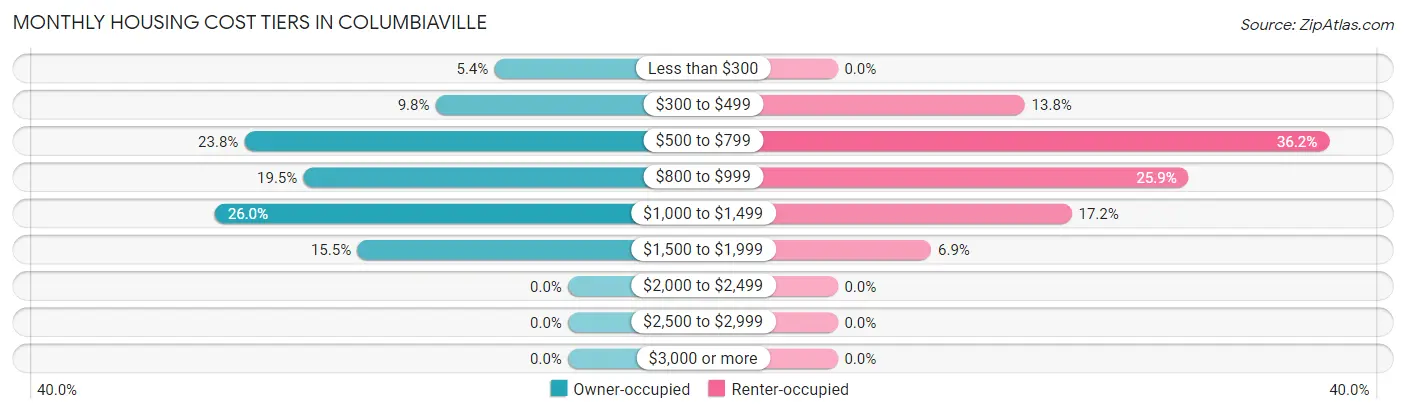
| Monthly Cost | Owner-occupied | Renter-occupied |
| Less than $300 | 15 (5.4%) | 0 (0.0%) |
| $300 to $499 | 27 (9.8%) | 8 (13.8%) |
| $500 to $799 | 66 (23.8%) | 21 (36.2%) |
| $800 to $999 | 54 (19.5%) | 15 (25.9%) |
| $1,000 to $1,499 | 72 (26.0%) | 10 (17.2%) |
| $1,500 to $1,999 | 43 (15.5%) | 4 (6.9%) |
| $2,000 to $2,499 | 0 (0.0%) | 0 (0.0%) |
| $2,500 to $2,999 | 0 (0.0%) | 0 (0.0%) |
| $3,000 or more | 0 (0.0%) | 0 (0.0%) |
| Total | 277 (100.0%) | 58 (100.0%) |
Physical Housing Characteristics in Columbiaville
Housing Structures in Columbiaville
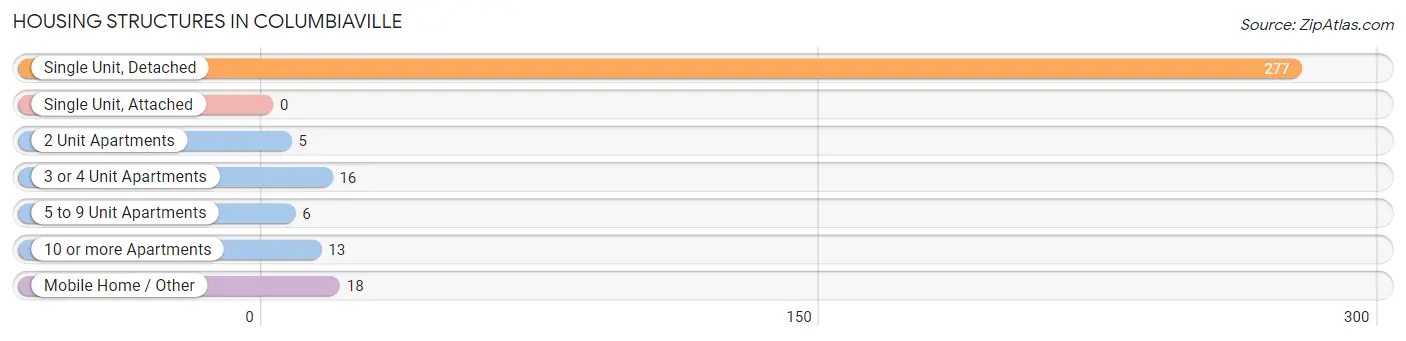
| Structure Type | # Housing Units | % Housing Units |
| Single Unit, Detached | 277 | 82.7% |
| Single Unit, Attached | 0 | 0.0% |
| 2 Unit Apartments | 5 | 1.5% |
| 3 or 4 Unit Apartments | 16 | 4.8% |
| 5 to 9 Unit Apartments | 6 | 1.8% |
| 10 or more Apartments | 13 | 3.9% |
| Mobile Home / Other | 18 | 5.4% |
| Total | 335 | 100.0% |
Housing Structures by Occupancy in Columbiaville
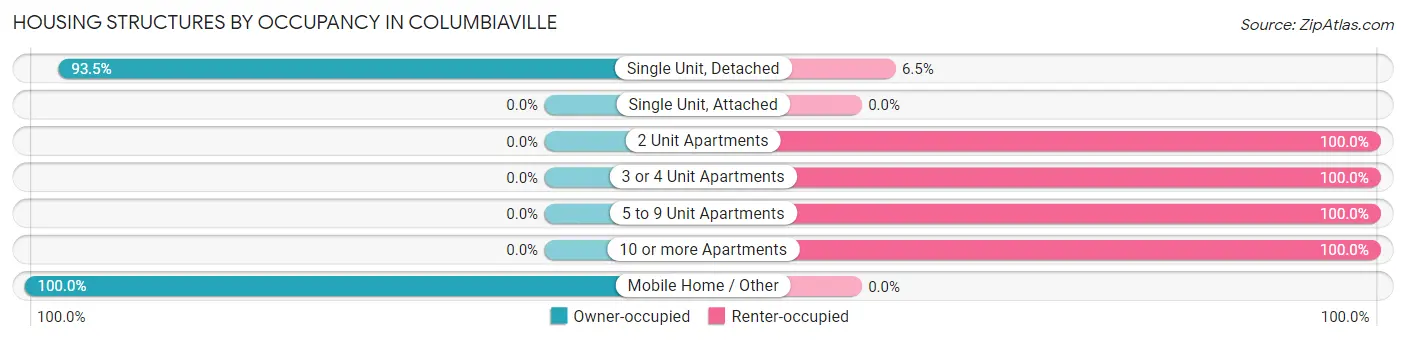
| Structure Type | Owner-occupied | Renter-occupied |
| Single Unit, Detached | 259 (93.5%) | 18 (6.5%) |
| Single Unit, Attached | 0 (0.0%) | 0 (0.0%) |
| 2 Unit Apartments | 0 (0.0%) | 5 (100.0%) |
| 3 or 4 Unit Apartments | 0 (0.0%) | 16 (100.0%) |
| 5 to 9 Unit Apartments | 0 (0.0%) | 6 (100.0%) |
| 10 or more Apartments | 0 (0.0%) | 13 (100.0%) |
| Mobile Home / Other | 18 (100.0%) | 0 (0.0%) |
| Total | 277 (82.7%) | 58 (17.3%) |
Housing Structures by Number of Rooms in Columbiaville
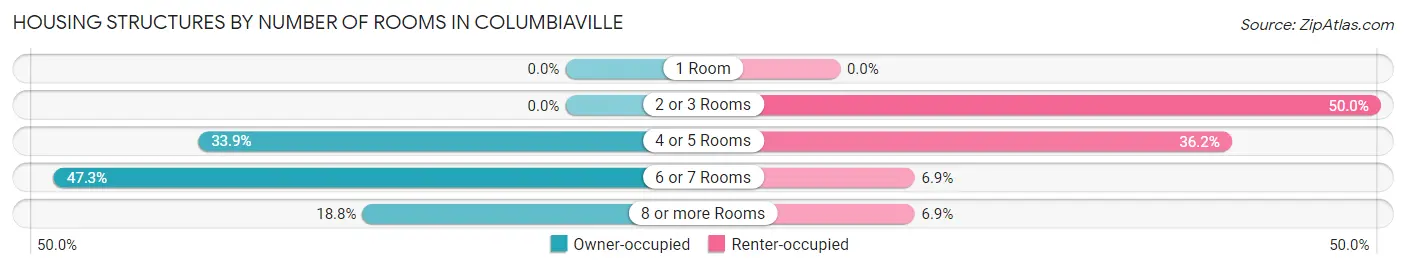
| Number of Rooms | Owner-occupied | Renter-occupied |
| 1 Room | 0 (0.0%) | 0 (0.0%) |
| 2 or 3 Rooms | 0 (0.0%) | 29 (50.0%) |
| 4 or 5 Rooms | 94 (33.9%) | 21 (36.2%) |
| 6 or 7 Rooms | 131 (47.3%) | 4 (6.9%) |
| 8 or more Rooms | 52 (18.8%) | 4 (6.9%) |
| Total | 277 (100.0%) | 58 (100.0%) |
Housing Structure by Heating Type in Columbiaville
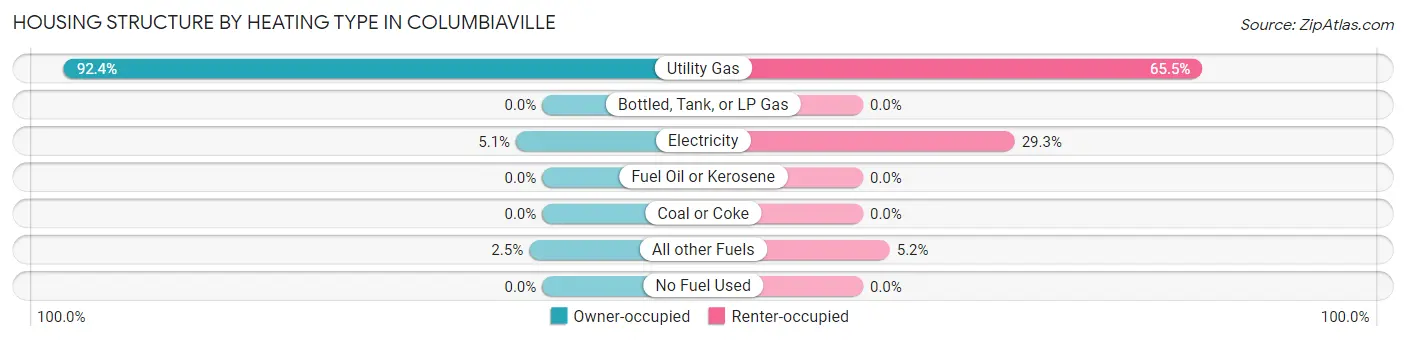
| Heating Type | Owner-occupied | Renter-occupied |
| Utility Gas | 256 (92.4%) | 38 (65.5%) |
| Bottled, Tank, or LP Gas | 0 (0.0%) | 0 (0.0%) |
| Electricity | 14 (5.1%) | 17 (29.3%) |
| Fuel Oil or Kerosene | 0 (0.0%) | 0 (0.0%) |
| Coal or Coke | 0 (0.0%) | 0 (0.0%) |
| All other Fuels | 7 (2.5%) | 3 (5.2%) |
| No Fuel Used | 0 (0.0%) | 0 (0.0%) |
| Total | 277 (100.0%) | 58 (100.0%) |
Household Vehicle Usage in Columbiaville
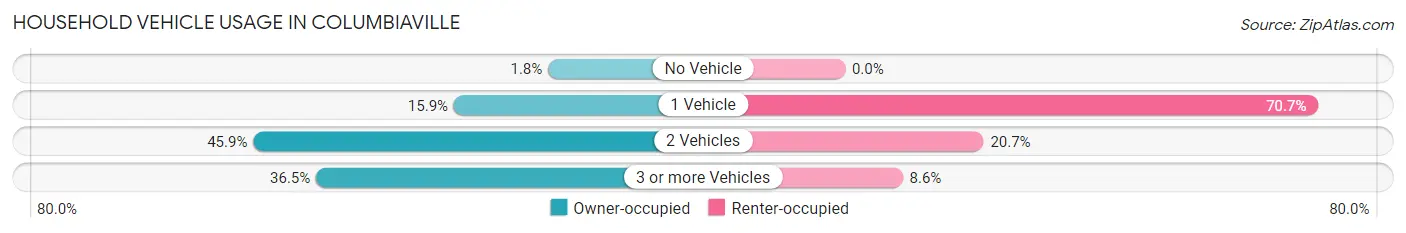
| Vehicles per Household | Owner-occupied | Renter-occupied |
| No Vehicle | 5 (1.8%) | 0 (0.0%) |
| 1 Vehicle | 44 (15.9%) | 41 (70.7%) |
| 2 Vehicles | 127 (45.9%) | 12 (20.7%) |
| 3 or more Vehicles | 101 (36.5%) | 5 (8.6%) |
| Total | 277 (100.0%) | 58 (100.0%) |
Real Estate & Mortgages in Columbiaville
Real Estate and Mortgage Overview in Columbiaville
| Characteristic | Without Mortgage | With Mortgage |
| Housing Units | 87 | 190 |
| Median Property Value | $102,800 | $118,000 |
| Median Household Income | $52,361 | $20 |
| Monthly Housing Costs | $505 | $0 |
| Real Estate Taxes | $1,637 | $18 |
Property Value by Mortgage Status in Columbiaville
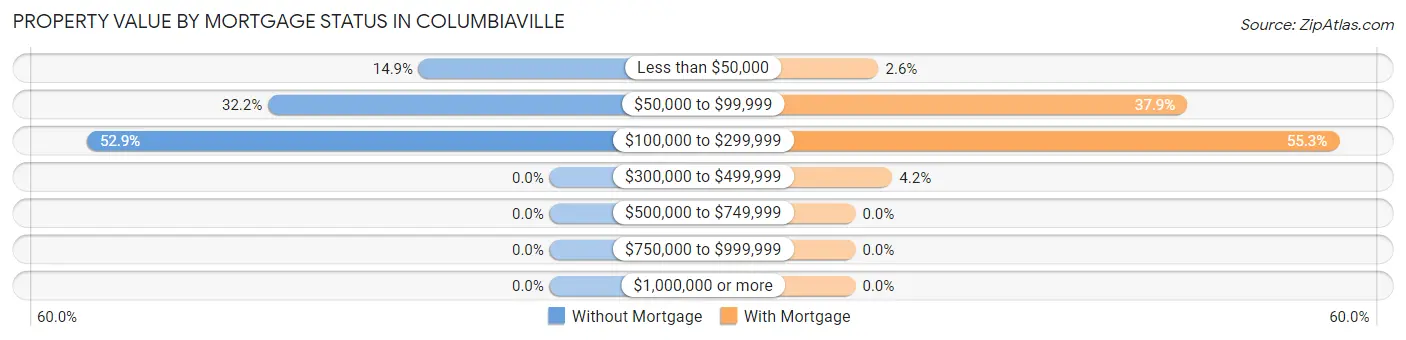
| Property Value | Without Mortgage | With Mortgage |
| Less than $50,000 | 13 (14.9%) | 5 (2.6%) |
| $50,000 to $99,999 | 28 (32.2%) | 72 (37.9%) |
| $100,000 to $299,999 | 46 (52.9%) | 105 (55.3%) |
| $300,000 to $499,999 | 0 (0.0%) | 8 (4.2%) |
| $500,000 to $749,999 | 0 (0.0%) | 0 (0.0%) |
| $750,000 to $999,999 | 0 (0.0%) | 0 (0.0%) |
| $1,000,000 or more | 0 (0.0%) | 0 (0.0%) |
| Total | 87 (100.0%) | 190 (100.0%) |
Household Income by Mortgage Status in Columbiaville
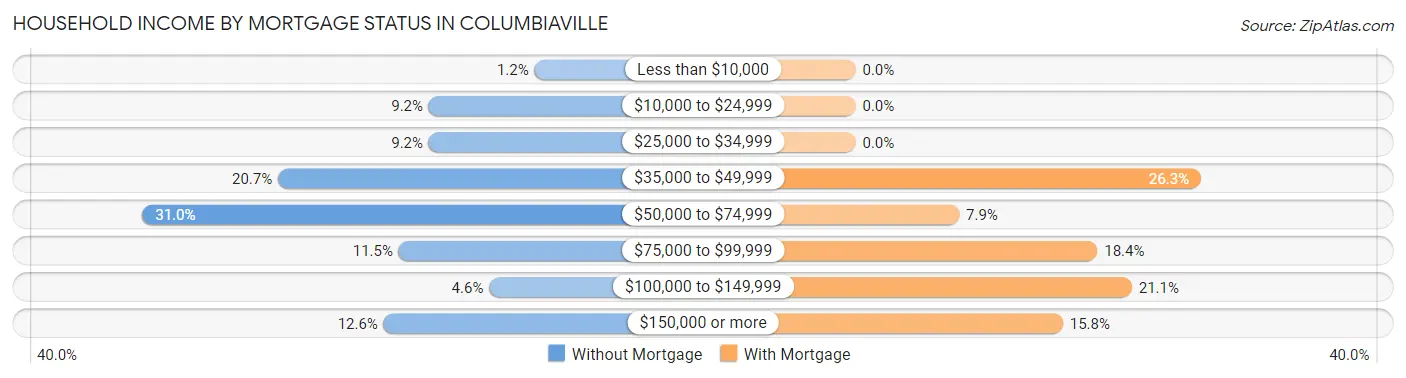
| Household Income | Without Mortgage | With Mortgage |
| Less than $10,000 | 1 (1.1%) | 0 (0.0%) |
| $10,000 to $24,999 | 8 (9.2%) | 0 (0.0%) |
| $25,000 to $34,999 | 8 (9.2%) | 0 (0.0%) |
| $35,000 to $49,999 | 18 (20.7%) | 50 (26.3%) |
| $50,000 to $74,999 | 27 (31.0%) | 15 (7.9%) |
| $75,000 to $99,999 | 10 (11.5%) | 35 (18.4%) |
| $100,000 to $149,999 | 4 (4.6%) | 40 (21.0%) |
| $150,000 or more | 11 (12.6%) | 30 (15.8%) |
| Total | 87 (100.0%) | 190 (100.0%) |
Property Value to Household Income Ratio in Columbiaville
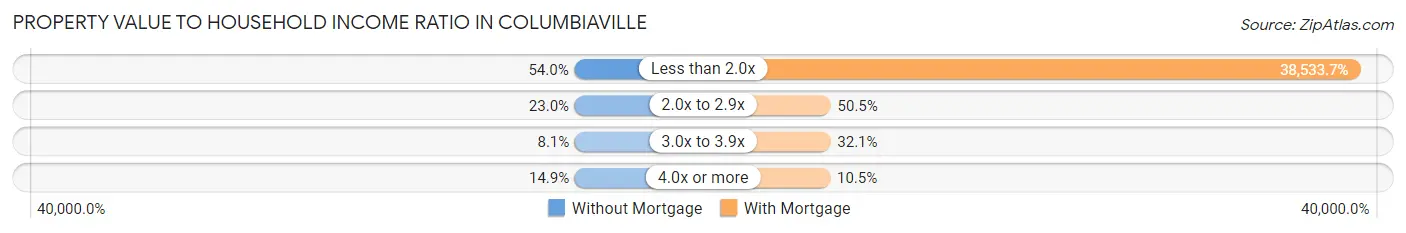
| Value-to-Income Ratio | Without Mortgage | With Mortgage |
| Less than 2.0x | 47 (54.0%) | 73,214 (38,533.7%) |
| 2.0x to 2.9x | 20 (23.0%) | 96 (50.5%) |
| 3.0x to 3.9x | 7 (8.1%) | 61 (32.1%) |
| 4.0x or more | 13 (14.9%) | 20 (10.5%) |
| Total | 87 (100.0%) | 190 (100.0%) |
Real Estate Taxes by Mortgage Status in Columbiaville
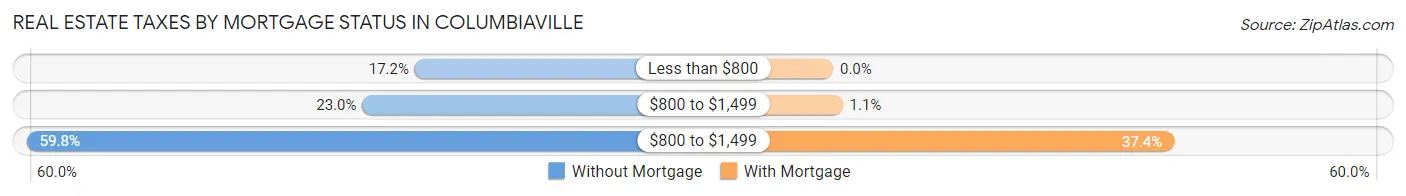
| Property Taxes | Without Mortgage | With Mortgage |
| Less than $800 | 15 (17.2%) | 0 (0.0%) |
| $800 to $1,499 | 20 (23.0%) | 2 (1.1%) |
| $800 to $1,499 | 52 (59.8%) | 71 (37.4%) |
| Total | 87 (100.0%) | 190 (100.0%) |
Health & Disability in Columbiaville
Health Insurance Coverage by Age in Columbiaville
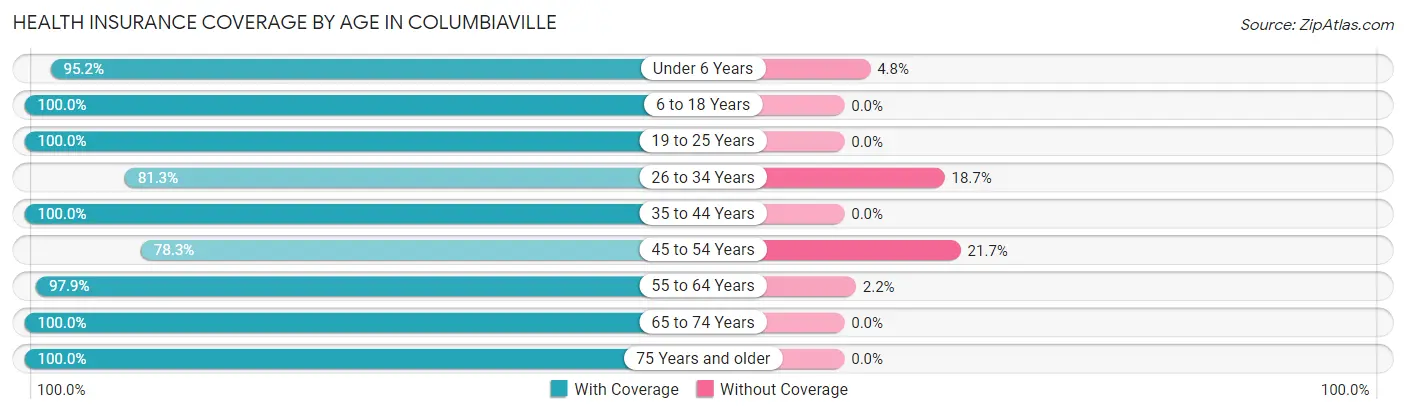
| Age Bracket | With Coverage | Without Coverage |
| Under 6 Years | 59 (95.2%) | 3 (4.8%) |
| 6 to 18 Years | 84 (100.0%) | 0 (0.0%) |
| 19 to 25 Years | 79 (100.0%) | 0 (0.0%) |
| 26 to 34 Years | 100 (81.3%) | 23 (18.7%) |
| 35 to 44 Years | 96 (100.0%) | 0 (0.0%) |
| 45 to 54 Years | 83 (78.3%) | 23 (21.7%) |
| 55 to 64 Years | 91 (97.9%) | 2 (2.1%) |
| 65 to 74 Years | 62 (100.0%) | 0 (0.0%) |
| 75 Years and older | 69 (100.0%) | 0 (0.0%) |
| Total | 723 (93.4%) | 51 (6.6%) |
Health Insurance Coverage by Citizenship Status in Columbiaville
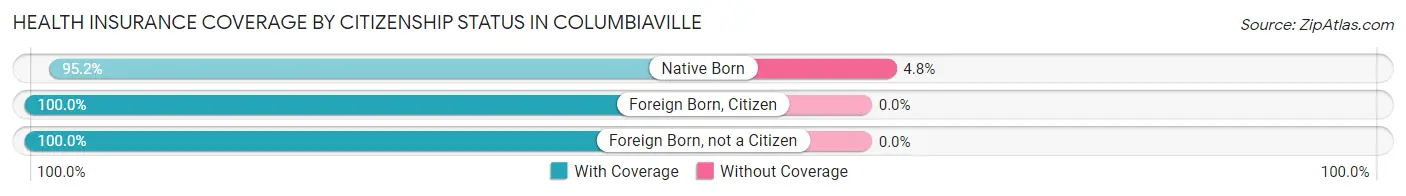
| Citizenship Status | With Coverage | Without Coverage |
| Native Born | 59 (95.2%) | 3 (4.8%) |
| Foreign Born, Citizen | 84 (100.0%) | 0 (0.0%) |
| Foreign Born, not a Citizen | 79 (100.0%) | 0 (0.0%) |
Health Insurance Coverage by Household Income in Columbiaville
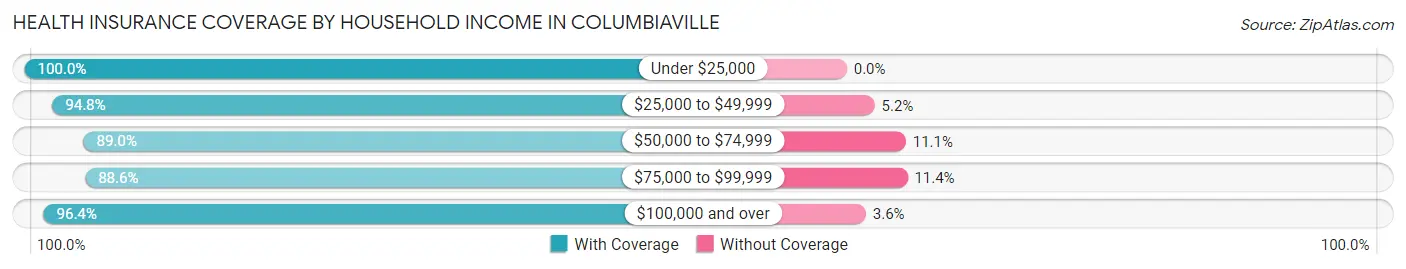
| Household Income | With Coverage | Without Coverage |
| Under $25,000 | 82 (100.0%) | 0 (0.0%) |
| $25,000 to $49,999 | 182 (94.8%) | 10 (5.2%) |
| $50,000 to $74,999 | 153 (88.9%) | 19 (11.1%) |
| $75,000 to $99,999 | 117 (88.6%) | 15 (11.4%) |
| $100,000 and over | 189 (96.4%) | 7 (3.6%) |
Public vs Private Health Insurance Coverage by Age in Columbiaville
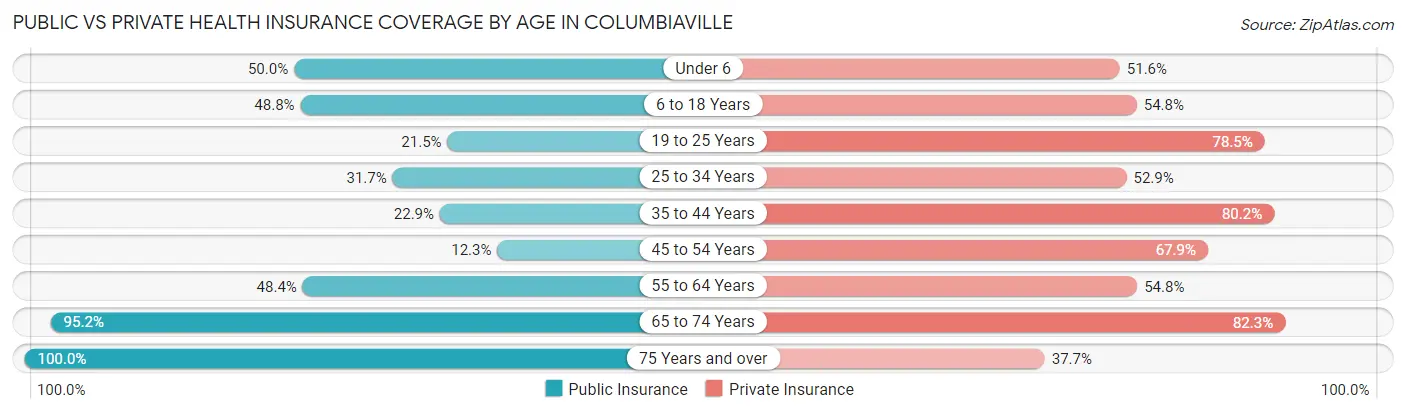
| Age Bracket | Public Insurance | Private Insurance |
| Under 6 | 31 (50.0%) | 32 (51.6%) |
| 6 to 18 Years | 41 (48.8%) | 46 (54.8%) |
| 19 to 25 Years | 17 (21.5%) | 62 (78.5%) |
| 25 to 34 Years | 39 (31.7%) | 65 (52.8%) |
| 35 to 44 Years | 22 (22.9%) | 77 (80.2%) |
| 45 to 54 Years | 13 (12.3%) | 72 (67.9%) |
| 55 to 64 Years | 45 (48.4%) | 51 (54.8%) |
| 65 to 74 Years | 59 (95.2%) | 51 (82.3%) |
| 75 Years and over | 69 (100.0%) | 26 (37.7%) |
| Total | 336 (43.4%) | 482 (62.3%) |
Disability Status by Sex by Age in Columbiaville
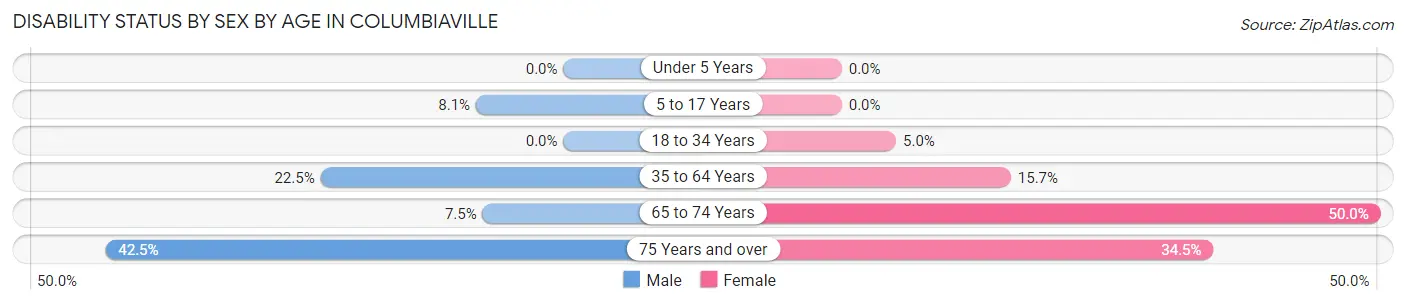
| Age Bracket | Male | Female |
| Under 5 Years | 0 (0.0%) | 0 (0.0%) |
| 5 to 17 Years | 3 (8.1%) | 0 (0.0%) |
| 18 to 34 Years | 0 (0.0%) | 6 (5.0%) |
| 35 to 64 Years | 32 (22.5%) | 24 (15.7%) |
| 65 to 74 Years | 3 (7.5%) | 11 (50.0%) |
| 75 Years and over | 17 (42.5%) | 10 (34.5%) |
Disability Class by Sex by Age in Columbiaville
Disability Class: Hearing Difficulty
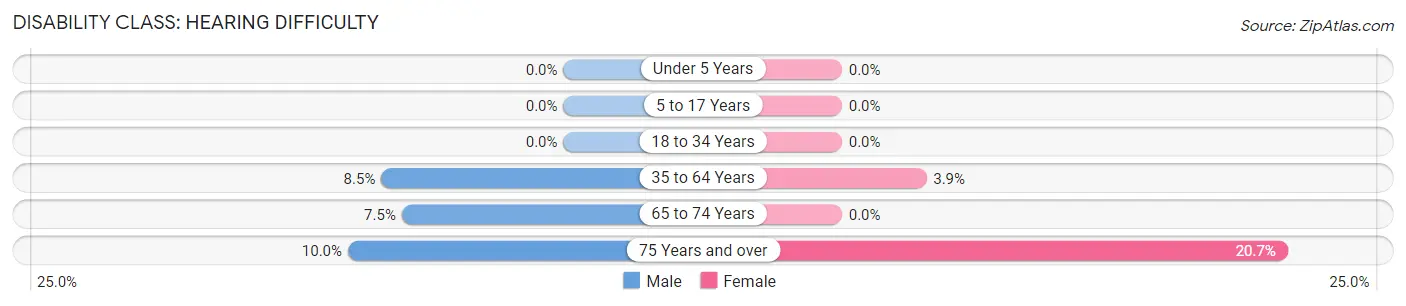
| Age Bracket | Male | Female |
| Under 5 Years | 0 (0.0%) | 0 (0.0%) |
| 5 to 17 Years | 0 (0.0%) | 0 (0.0%) |
| 18 to 34 Years | 0 (0.0%) | 0 (0.0%) |
| 35 to 64 Years | 12 (8.5%) | 6 (3.9%) |
| 65 to 74 Years | 3 (7.5%) | 0 (0.0%) |
| 75 Years and over | 4 (10.0%) | 6 (20.7%) |
Disability Class: Vision Difficulty
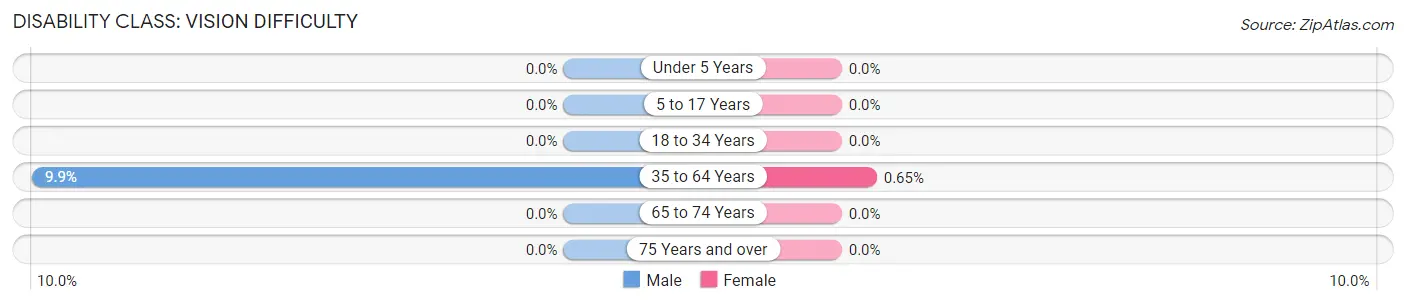
| Age Bracket | Male | Female |
| Under 5 Years | 0 (0.0%) | 0 (0.0%) |
| 5 to 17 Years | 0 (0.0%) | 0 (0.0%) |
| 18 to 34 Years | 0 (0.0%) | 0 (0.0%) |
| 35 to 64 Years | 14 (9.9%) | 1 (0.6%) |
| 65 to 74 Years | 0 (0.0%) | 0 (0.0%) |
| 75 Years and over | 0 (0.0%) | 0 (0.0%) |
Disability Class: Cognitive Difficulty
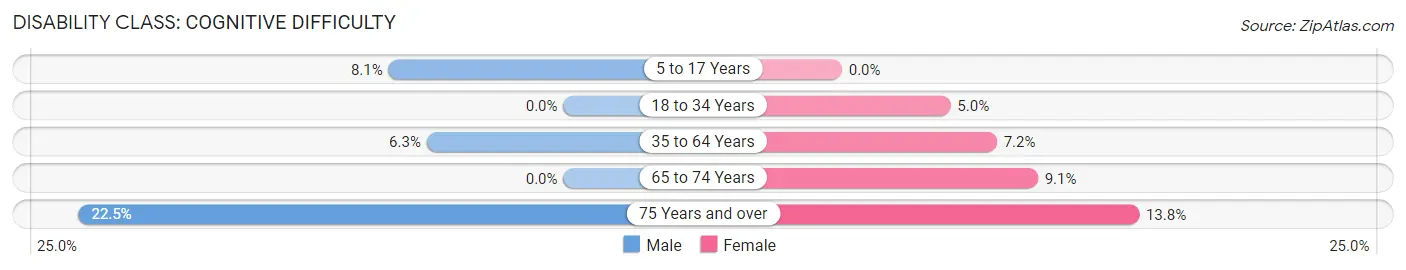
| Age Bracket | Male | Female |
| 5 to 17 Years | 3 (8.1%) | 0 (0.0%) |
| 18 to 34 Years | 0 (0.0%) | 6 (5.0%) |
| 35 to 64 Years | 9 (6.3%) | 11 (7.2%) |
| 65 to 74 Years | 0 (0.0%) | 2 (9.1%) |
| 75 Years and over | 9 (22.5%) | 4 (13.8%) |
Disability Class: Ambulatory Difficulty
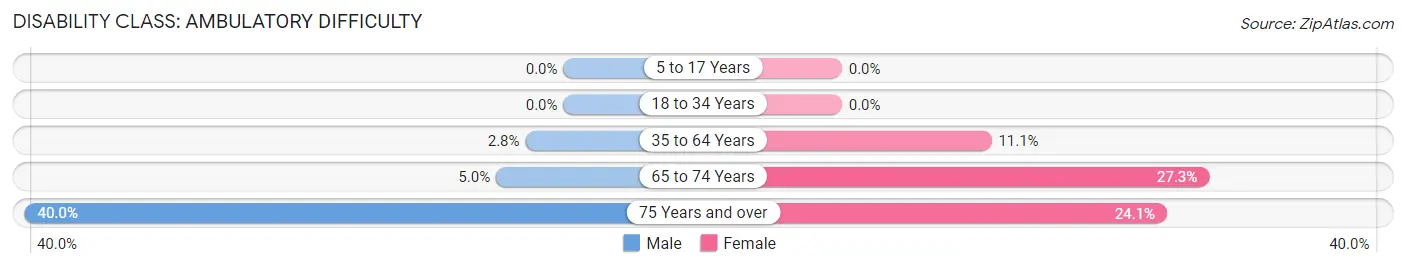
| Age Bracket | Male | Female |
| 5 to 17 Years | 0 (0.0%) | 0 (0.0%) |
| 18 to 34 Years | 0 (0.0%) | 0 (0.0%) |
| 35 to 64 Years | 4 (2.8%) | 17 (11.1%) |
| 65 to 74 Years | 2 (5.0%) | 6 (27.3%) |
| 75 Years and over | 16 (40.0%) | 7 (24.1%) |
Disability Class: Self-Care Difficulty
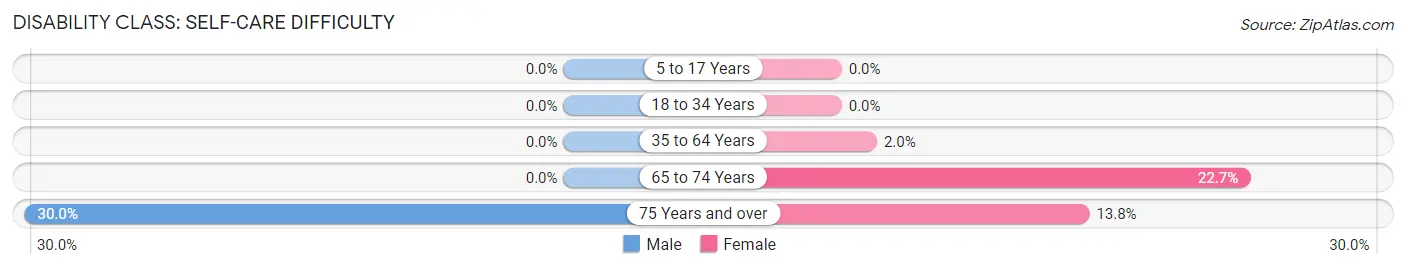
| Age Bracket | Male | Female |
| 5 to 17 Years | 0 (0.0%) | 0 (0.0%) |
| 18 to 34 Years | 0 (0.0%) | 0 (0.0%) |
| 35 to 64 Years | 0 (0.0%) | 3 (2.0%) |
| 65 to 74 Years | 0 (0.0%) | 5 (22.7%) |
| 75 Years and over | 12 (30.0%) | 4 (13.8%) |
Technology Access in Columbiaville
Computing Device Access in Columbiaville
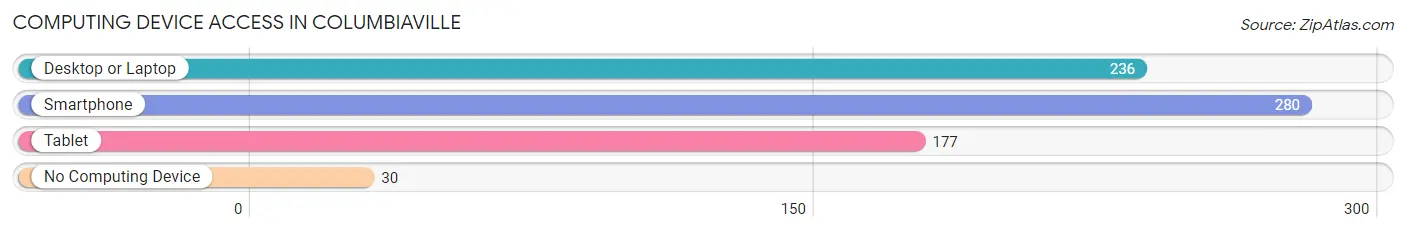
| Device Type | # Households | % Households |
| Desktop or Laptop | 236 | 70.5% |
| Smartphone | 280 | 83.6% |
| Tablet | 177 | 52.8% |
| No Computing Device | 30 | 9.0% |
| Total | 335 | 100.0% |
Internet Access in Columbiaville
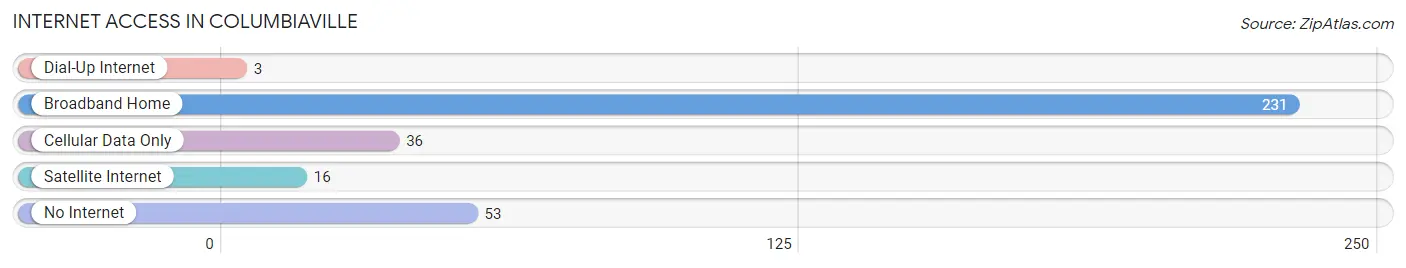
| Internet Type | # Households | % Households |
| Dial-Up Internet | 3 | 0.9% |
| Broadband Home | 231 | 69.0% |
| Cellular Data Only | 36 | 10.7% |
| Satellite Internet | 16 | 4.8% |
| No Internet | 53 | 15.8% |
| Total | 335 | 100.0% |
Columbiaville Summary
Columbiaville is a small village located in Lapeer County, Michigan. It is situated on the banks of the Flint River, approximately 20 miles north of Flint. The village has a population of 1,717 people, according to the 2010 census.
History
Columbiaville was founded in 1837 by a group of settlers from New York. The village was originally known as Columbia, but the name was changed to Columbiaville in 1845. The village was incorporated in 1867.
The village was a major stop on the Grand Trunk Railroad, which ran through the village from 1871 to 1971. The railroad was a major source of employment for the village, and it also brought in many visitors.
The village was also home to a number of factories, including a paper mill, a flour mill, a sawmill, and a brickyard. These factories provided employment for many of the village's residents.
Geography
Columbiaville is located in the southeastern corner of Lapeer County, approximately 20 miles north of Flint. The village is situated on the banks of the Flint River, which flows through the village. The village is surrounded by farmland and woodlands.
The village has a total area of 1.2 square miles, all of which is land. The village is located at an elevation of 845 feet above sea level.
Economy
The economy of Columbiaville is largely based on agriculture and manufacturing. The village is home to a number of small businesses, including a grocery store, a hardware store, and a restaurant.
The village is also home to a number of factories, including a paper mill, a flour mill, a sawmill, and a brickyard. These factories provide employment for many of the village's residents.
Demographics
According to the 2010 census, the population of Columbiaville was 1,717. The population is predominantly white (97.2%), with a small percentage of African Americans (1.2%) and Hispanics (1.1%).
The median household income in Columbiaville is $41,944, and the median family income is $50,917. The per capita income is $20,917. The unemployment rate is 6.2%.
The village is served by the Lapeer County School District. The village has one elementary school, one middle school, and one high school. The village also has a public library.
Common Questions
What is Per Capita Income in Columbiaville?
Per Capita income in Columbiaville is $31,601.
What is the Median Family Income in Columbiaville?
Median Family Income in Columbiaville is $61,250.
What is the Median Household income in Columbiaville?
Median Household Income in Columbiaville is $58,403.
What is Income or Wage Gap in Columbiaville?
Income or Wage Gap in Columbiaville is 23.9%.
Women in Columbiaville earn 76.1 cents for every dollar earned by a man.
What is Inequality or Gini Index in Columbiaville?
Inequality or Gini Index in Columbiaville is 0.41.
What is the Total Population of Columbiaville?
Total Population of Columbiaville is 774.
What is the Total Male Population of Columbiaville?
Total Male Population of Columbiaville is 373.
What is the Total Female Population of Columbiaville?
Total Female Population of Columbiaville is 401.
What is the Ratio of Males per 100 Females in Columbiaville?
There are 93.02 Males per 100 Females in Columbiaville.
What is the Ratio of Females per 100 Males in Columbiaville?
There are 107.51 Females per 100 Males in Columbiaville.
What is the Median Population Age in Columbiaville?
Median Population Age in Columbiaville is 38.5 Years.
What is the Average Family Size in Columbiaville
Average Family Size in Columbiaville is 2.8 People.
What is the Average Household Size in Columbiaville
Average Household Size in Columbiaville is 2.3 People.
How Large is the Labor Force in Columbiaville?
There are 396 People in the Labor Forcein in Columbiaville.
What is the Percentage of People in the Labor Force in Columbiaville?
60.6% of People are in the Labor Force in Columbiaville.
What is the Unemployment Rate in Columbiaville?
Unemployment Rate in Columbiaville is 14.4%.