Zip Codes with the Highest Percentage of Population with a Degree in Psychology in Detroit, MI
RELATED REPORTS & OPTIONS
Psychology
Detroit
Compare Zip Codes
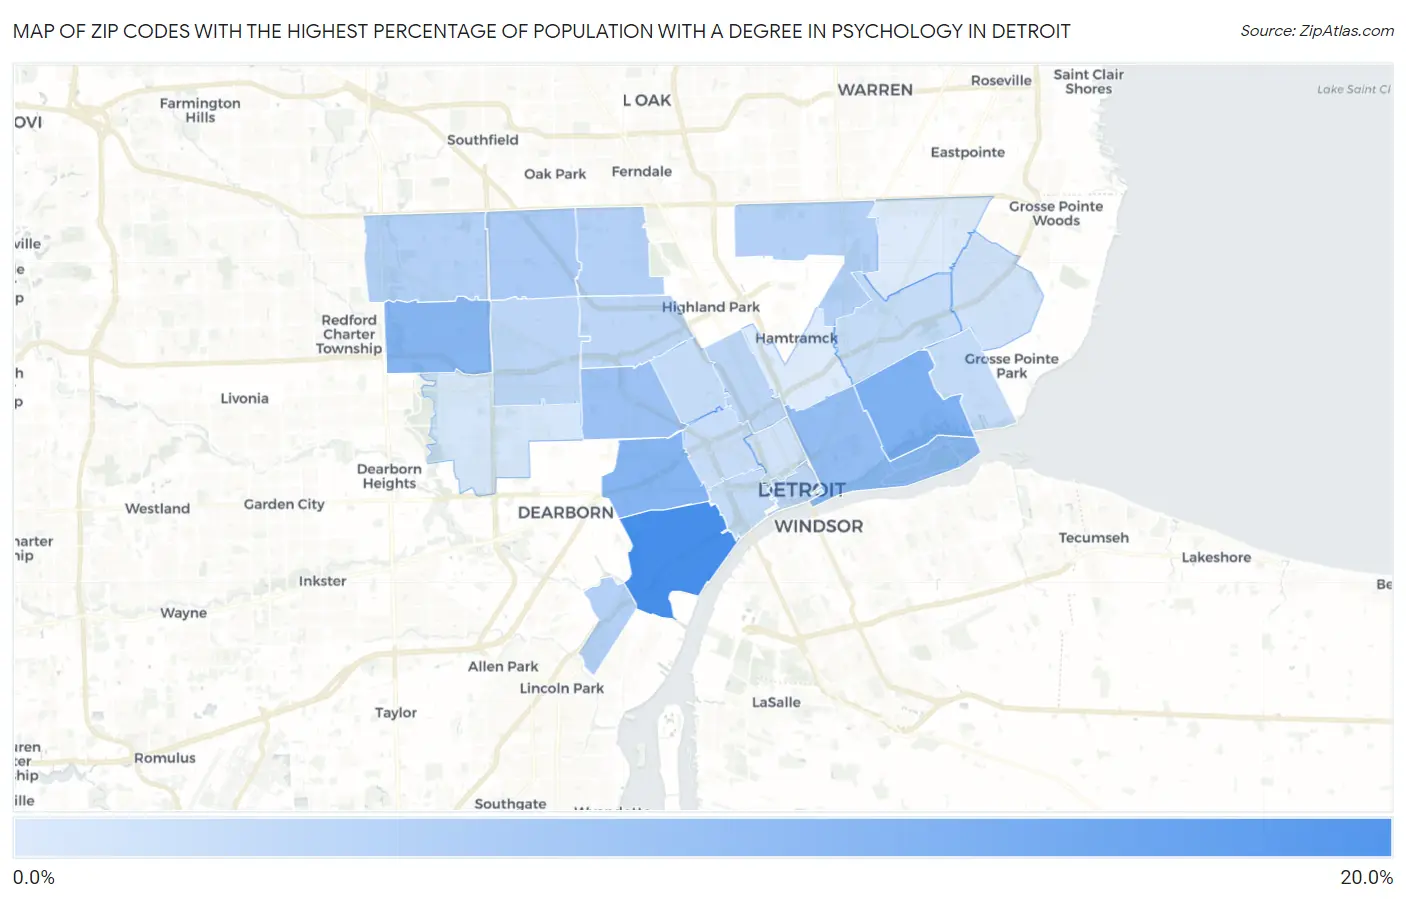
Map of Zip Codes with the Highest Percentage of Population with a Degree in Psychology in Detroit
1.7%
17.7%
Zip Codes with the Highest Percentage of Population with a Degree in Psychology in Detroit, MI
| Zip Code | % Graduates | vs State | vs National | |
| 1. | 48209 | 17.7% | 4.5%(+13.2)#9 | 5.1%(+12.6)#829 |
| 2. | 48214 | 11.5% | 4.5%(+7.03)#29 | 5.1%(+6.45)#1,875 |
| 3. | 48210 | 10.7% | 4.5%(+6.22)#35 | 5.1%(+5.64)#2,181 |
| 4. | 48223 | 10.5% | 4.5%(+6.01)#38 | 5.1%(+5.44)#2,264 |
| 5. | 48207 | 9.2% | 4.5%(+4.73)#53 | 5.1%(+4.15)#2,987 |
| 6. | 48204 | 8.5% | 4.5%(+4.08)#66 | 5.1%(+3.50)#3,563 |
| 7. | 48235 | 6.9% | 4.5%(+2.48)#114 | 5.1%(+1.90)#5,726 |
| 8. | 48234 | 6.0% | 4.5%(+1.48)#179 | 5.1%(+0.904)#8,078 |
| 9. | 48221 | 5.9% | 4.5%(+1.45)#182 | 5.1%(+0.869)#8,195 |
| 10. | 48219 | 5.8% | 4.5%(+1.36)#193 | 5.1%(+0.780)#8,476 |
| 11. | 48217 | 5.8% | 4.5%(+1.29)#200 | 5.1%(+0.712)#8,702 |
| 12. | 48227 | 5.0% | 4.5%(+0.534)#271 | 5.1%(-0.045)#11,233 |
| 13. | 48202 | 5.0% | 4.5%(+0.525)#272 | 5.1%(-0.054)#11,295 |
| 14. | 48226 | 5.0% | 4.5%(+0.493)#275 | 5.1%(-0.085)#11,400 |
| 15. | 48238 | 4.8% | 4.5%(+0.372)#288 | 5.1%(-0.207)#11,800 |
| 16. | 48216 | 4.2% | 4.5%(-0.303)#396 | 5.1%(-0.881)#14,327 |
| 17. | 48215 | 4.1% | 4.5%(-0.335)#400 | 5.1%(-0.914)#14,439 |
| 18. | 48206 | 4.0% | 4.5%(-0.459)#423 | 5.1%(-1.04)#14,873 |
| 19. | 48213 | 3.9% | 4.5%(-0.579)#437 | 5.1%(-1.16)#15,298 |
| 20. | 48208 | 3.7% | 4.5%(-0.816)#470 | 5.1%(-1.40)#16,121 |
| 21. | 48224 | 3.1% | 4.5%(-1.35)#565 | 5.1%(-1.93)#17,891 |
| 22. | 48201 | 2.8% | 4.5%(-1.69)#614 | 5.1%(-2.27)#18,843 |
| 23. | 48228 | 2.3% | 4.5%(-2.18)#691 | 5.1%(-2.76)#20,119 |
| 24. | 48205 | 1.8% | 4.5%(-2.70)#755 | 5.1%(-3.28)#21,296 |
| 25. | 48211 | 1.7% | 4.5%(-2.80)#759 | 5.1%(-3.38)#21,483 |
1
Common Questions
What are the Top 10 Zip Codes with the Highest Percentage of Population with a Degree in Psychology in Detroit, MI?
Top 10 Zip Codes with the Highest Percentage of Population with a Degree in Psychology in Detroit, MI are:
What zip code has the Highest Percentage of Population with a Degree in Psychology in Detroit, MI?
48209 has the Highest Percentage of Population with a Degree in Psychology in Detroit, MI with 17.7%.
What is the Percentage of Population with a Degree in Psychology in Detroit, MI?
Percentage of Population with a Degree in Psychology in Detroit is 6.2%.
What is the Percentage of Population with a Degree in Psychology in Michigan?
Percentage of Population with a Degree in Psychology in Michigan is 4.5%.
What is the Percentage of Population with a Degree in Psychology in the United States?
Percentage of Population with a Degree in Psychology in the United States is 5.1%.