Zip Codes with the Highest Percentage of Population with a Degree in Psychology in Michigan
RELATED REPORTS & OPTIONS
Psychology
Michigan
Compare Zip Codes
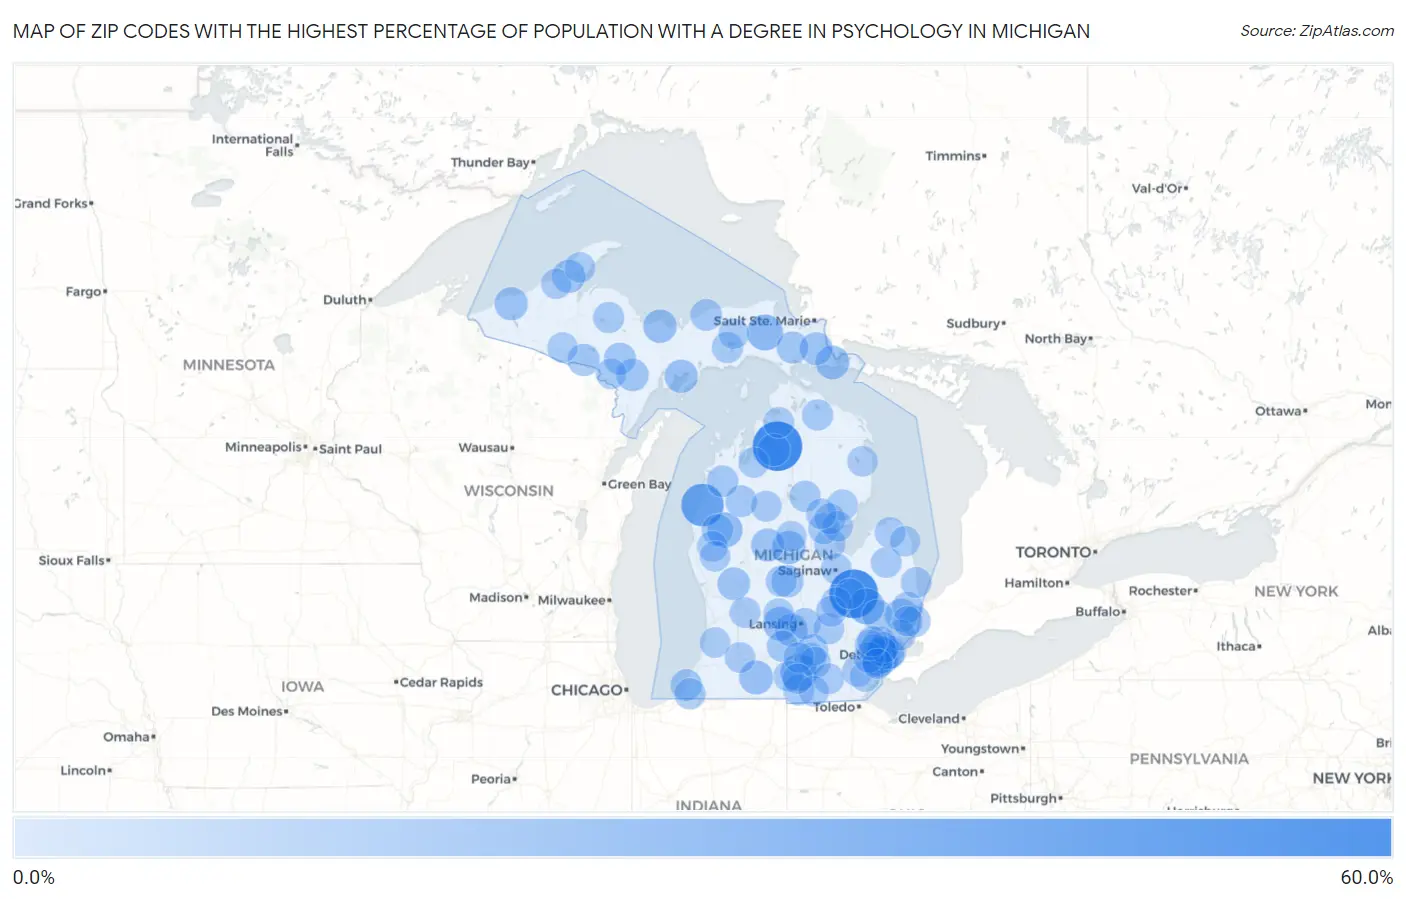
Map of Zip Codes with the Highest Percentage of Population with a Degree in Psychology in Michigan
0.0%
60.0%
Zip Codes with the Highest Percentage of Population with a Degree in Psychology in Michigan
| Zip Code | % Graduates | vs State | vs National | |
| 1. | 49611 | 59.5% | 4.5%(+55.0)#1 | 5.1%(+54.4)#69 |
| 2. | 48437 | 57.1% | 4.5%(+52.7)#2 | 5.1%(+52.1)#75 |
| 3. | 49626 | 40.0% | 4.5%(+35.5)#3 | 5.1%(+34.9)#175 |
| 4. | 49241 | 24.3% | 4.5%(+19.9)#4 | 5.1%(+19.3)#447 |
| 5. | 48122 | 23.8% | 4.5%(+19.3)#5 | 5.1%(+18.8)#461 |
| 6. | 48440 | 22.6% | 4.5%(+18.2)#6 | 5.1%(+17.6)#509 |
| 7. | 49748 | 22.2% | 4.5%(+17.7)#7 | 5.1%(+17.2)#537 |
| 8. | 49304 | 19.9% | 4.5%(+15.4)#8 | 5.1%(+14.8)#670 |
| 9. | 48209 | 17.7% | 4.5%(+13.2)#9 | 5.1%(+12.6)#829 |
| 10. | 49066 | 16.7% | 4.5%(+12.2)#10 | 5.1%(+11.6)#933 |
| 11. | 48861 | 16.6% | 4.5%(+12.1)#11 | 5.1%(+11.5)#953 |
| 12. | 49725 | 16.2% | 4.5%(+11.7)#12 | 5.1%(+11.1)#996 |
| 13. | 49822 | 15.8% | 4.5%(+11.3)#13 | 5.1%(+10.7)#1,032 |
| 14. | 48878 | 15.6% | 4.5%(+11.1)#14 | 5.1%(+10.6)#1,055 |
| 15. | 49864 | 15.4% | 4.5%(+10.9)#15 | 5.1%(+10.3)#1,081 |
| 16. | 49963 | 15.0% | 4.5%(+10.5)#16 | 5.1%(+9.95)#1,128 |
| 17. | 49971 | 15.0% | 4.5%(+10.5)#17 | 5.1%(+9.95)#1,129 |
| 18. | 49305 | 14.3% | 4.5%(+9.88)#18 | 5.1%(+9.30)#1,217 |
| 19. | 49774 | 13.8% | 4.5%(+9.28)#19 | 5.1%(+8.70)#1,323 |
| 20. | 48876 | 13.6% | 4.5%(+9.17)#20 | 5.1%(+8.60)#1,339 |
| 21. | 48062 | 13.6% | 4.5%(+9.11)#21 | 5.1%(+8.53)#1,359 |
| 22. | 49330 | 13.4% | 4.5%(+8.90)#22 | 5.1%(+8.32)#1,401 |
| 23. | 49659 | 13.3% | 4.5%(+8.78)#23 | 5.1%(+8.20)#1,431 |
| 24. | 49902 | 12.5% | 4.5%(+8.03)#24 | 5.1%(+7.45)#1,597 |
| 25. | 49873 | 12.5% | 4.5%(+8.03)#25 | 5.1%(+7.45)#1,606 |
| 26. | 48889 | 12.3% | 4.5%(+7.85)#26 | 5.1%(+7.27)#1,648 |
| 27. | 49831 | 11.8% | 4.5%(+7.29)#27 | 5.1%(+6.71)#1,797 |
| 28. | 49780 | 11.6% | 4.5%(+7.11)#28 | 5.1%(+6.53)#1,857 |
| 29. | 48214 | 11.5% | 4.5%(+7.03)#29 | 5.1%(+6.45)#1,875 |
| 30. | 49618 | 11.1% | 4.5%(+6.64)#30 | 5.1%(+6.06)#2,014 |
| 31. | 49839 | 11.1% | 4.5%(+6.64)#31 | 5.1%(+6.06)#2,025 |
| 32. | 49402 | 11.0% | 4.5%(+6.52)#32 | 5.1%(+5.94)#2,063 |
| 33. | 48070 | 10.8% | 4.5%(+6.36)#33 | 5.1%(+5.78)#2,125 |
| 34. | 49202 | 10.8% | 4.5%(+6.30)#34 | 5.1%(+5.72)#2,149 |
| 35. | 48210 | 10.7% | 4.5%(+6.22)#35 | 5.1%(+5.64)#2,181 |
| 36. | 49683 | 10.5% | 4.5%(+6.07)#36 | 5.1%(+5.49)#2,237 |
| 37. | 49106 | 10.5% | 4.5%(+6.06)#37 | 5.1%(+5.48)#2,240 |
| 38. | 48223 | 10.5% | 4.5%(+6.01)#38 | 5.1%(+5.44)#2,264 |
| 39. | 49272 | 10.3% | 4.5%(+5.86)#39 | 5.1%(+5.29)#2,319 |
| 40. | 48825 | 10.2% | 4.5%(+5.75)#40 | 5.1%(+5.18)#2,371 |
| 41. | 49076 | 10.1% | 4.5%(+5.63)#41 | 5.1%(+5.06)#2,442 |
| 42. | 48054 | 9.9% | 4.5%(+5.39)#42 | 5.1%(+4.81)#2,571 |
| 43. | 49836 | 9.9% | 4.5%(+5.39)#43 | 5.1%(+4.81)#2,574 |
| 44. | 49254 | 9.9% | 4.5%(+5.38)#44 | 5.1%(+4.81)#2,575 |
| 45. | 48634 | 9.7% | 4.5%(+5.23)#45 | 5.1%(+4.65)#2,659 |
| 46. | 49113 | 9.7% | 4.5%(+5.22)#46 | 5.1%(+4.65)#2,661 |
| 47. | 48027 | 9.7% | 4.5%(+5.20)#47 | 5.1%(+4.63)#2,677 |
| 48. | 49765 | 9.6% | 4.5%(+5.11)#48 | 5.1%(+4.53)#2,735 |
| 49. | 49814 | 9.4% | 4.5%(+4.96)#49 | 5.1%(+4.38)#2,824 |
| 50. | 48370 | 9.3% | 4.5%(+4.85)#50 | 5.1%(+4.27)#2,886 |
| 51. | 48613 | 9.3% | 4.5%(+4.83)#51 | 5.1%(+4.25)#2,908 |
| 52. | 48656 | 9.3% | 4.5%(+4.79)#52 | 5.1%(+4.21)#2,937 |
| 53. | 48207 | 9.2% | 4.5%(+4.73)#53 | 5.1%(+4.15)#2,987 |
| 54. | 48818 | 9.1% | 4.5%(+4.67)#54 | 5.1%(+4.09)#3,021 |
| 55. | 49242 | 9.1% | 4.5%(+4.67)#55 | 5.1%(+4.09)#3,025 |
| 56. | 48836 | 9.1% | 4.5%(+4.64)#56 | 5.1%(+4.06)#3,042 |
| 57. | 48770 | 9.0% | 4.5%(+4.49)#57 | 5.1%(+3.91)#3,163 |
| 58. | 48191 | 8.8% | 4.5%(+4.30)#58 | 5.1%(+3.72)#3,330 |
| 59. | 49796 | 8.7% | 4.5%(+4.28)#59 | 5.1%(+3.70)#3,344 |
| 60. | 48045 | 8.7% | 4.5%(+4.27)#60 | 5.1%(+3.70)#3,348 |
| 61. | 48659 | 8.7% | 4.5%(+4.19)#61 | 5.1%(+3.61)#3,446 |
| 62. | 49512 | 8.6% | 4.5%(+4.18)#62 | 5.1%(+3.60)#3,457 |
| 63. | 48101 | 8.6% | 4.5%(+4.14)#63 | 5.1%(+3.56)#3,500 |
| 64. | 48658 | 8.6% | 4.5%(+4.10)#64 | 5.1%(+3.53)#3,532 |
| 65. | 49657 | 8.6% | 4.5%(+4.08)#65 | 5.1%(+3.50)#3,556 |
| 66. | 48204 | 8.5% | 4.5%(+4.08)#66 | 5.1%(+3.50)#3,563 |
| 67. | 49287 | 8.5% | 4.5%(+4.07)#67 | 5.1%(+3.49)#3,568 |
| 68. | 48607 | 8.5% | 4.5%(+4.02)#68 | 5.1%(+3.44)#3,613 |
| 69. | 48450 | 8.5% | 4.5%(+4.01)#69 | 5.1%(+3.43)#3,628 |
| 70. | 48203 | 8.4% | 4.5%(+3.97)#70 | 5.1%(+3.39)#3,668 |
| 71. | 49459 | 8.3% | 4.5%(+3.86)#71 | 5.1%(+3.28)#3,771 |
| 72. | 48426 | 8.3% | 4.5%(+3.86)#72 | 5.1%(+3.28)#3,772 |
| 73. | 48432 | 8.3% | 4.5%(+3.86)#73 | 5.1%(+3.28)#3,785 |
| 74. | 48449 | 8.3% | 4.5%(+3.84)#74 | 5.1%(+3.26)#3,803 |
| 75. | 48429 | 8.3% | 4.5%(+3.80)#75 | 5.1%(+3.22)#3,834 |
| 76. | 48117 | 8.2% | 4.5%(+3.77)#76 | 5.1%(+3.19)#3,865 |
| 77. | 48186 | 8.2% | 4.5%(+3.76)#77 | 5.1%(+3.18)#3,875 |
| 78. | 48610 | 8.2% | 4.5%(+3.71)#78 | 5.1%(+3.14)#3,916 |
| 79. | 49252 | 8.2% | 4.5%(+3.69)#79 | 5.1%(+3.11)#3,948 |
| 80. | 49870 | 8.1% | 4.5%(+3.68)#80 | 5.1%(+3.10)#3,970 |
| 81. | 48875 | 8.1% | 4.5%(+3.66)#81 | 5.1%(+3.08)#3,981 |
| 82. | 49421 | 8.1% | 4.5%(+3.66)#82 | 5.1%(+3.08)#3,982 |
| 83. | 49006 | 8.1% | 4.5%(+3.65)#83 | 5.1%(+3.08)#3,989 |
| 84. | 48617 | 8.1% | 4.5%(+3.61)#84 | 5.1%(+3.03)#4,035 |
| 85. | 48336 | 8.1% | 4.5%(+3.58)#85 | 5.1%(+3.00)#4,065 |
| 86. | 48762 | 8.0% | 4.5%(+3.51)#86 | 5.1%(+2.93)#4,159 |
| 87. | 49247 | 8.0% | 4.5%(+3.48)#87 | 5.1%(+2.90)#4,190 |
| 88. | 49269 | 8.0% | 4.5%(+3.48)#88 | 5.1%(+2.90)#4,195 |
| 89. | 49965 | 7.9% | 4.5%(+3.45)#89 | 5.1%(+2.87)#4,240 |
| 90. | 48458 | 7.9% | 4.5%(+3.44)#90 | 5.1%(+2.87)#4,243 |
| 91. | 48441 | 7.9% | 4.5%(+3.43)#91 | 5.1%(+2.85)#4,254 |
| 92. | 49853 | 7.9% | 4.5%(+3.41)#92 | 5.1%(+2.83)#4,278 |
| 93. | 49934 | 7.8% | 4.5%(+3.37)#93 | 5.1%(+2.79)#4,321 |
| 94. | 48034 | 7.8% | 4.5%(+3.35)#94 | 5.1%(+2.78)#4,340 |
| 95. | 49450 | 7.8% | 4.5%(+3.28)#95 | 5.1%(+2.70)#4,420 |
| 96. | 49690 | 7.7% | 4.5%(+3.25)#96 | 5.1%(+2.67)#4,455 |
| 97. | 48195 | 7.6% | 4.5%(+3.16)#97 | 5.1%(+2.58)#4,606 |
| 98. | 49250 | 7.6% | 4.5%(+3.15)#98 | 5.1%(+2.57)#4,618 |
| 99. | 48064 | 7.6% | 4.5%(+3.12)#99 | 5.1%(+2.54)#4,674 |
| 100. | 49935 | 7.6% | 4.5%(+3.12)#100 | 5.1%(+2.54)#4,678 |
Common Questions
What are the Top 10 Zip Codes with the Highest Percentage of Population with a Degree in Psychology in Michigan?
Top 10 Zip Codes with the Highest Percentage of Population with a Degree in Psychology in Michigan are:
What zip code has the Highest Percentage of Population with a Degree in Psychology in Michigan?
49611 has the Highest Percentage of Population with a Degree in Psychology in Michigan with 59.5%.
What is the Percentage of Population with a Degree in Psychology in the State of Michigan?
Percentage of Population with a Degree in Psychology in Michigan is 4.5%.
What is the Percentage of Population with a Degree in Psychology in the United States?
Percentage of Population with a Degree in Psychology in the United States is 5.1%.