Nessen City, MI Map & Demographics
Nessen City Map
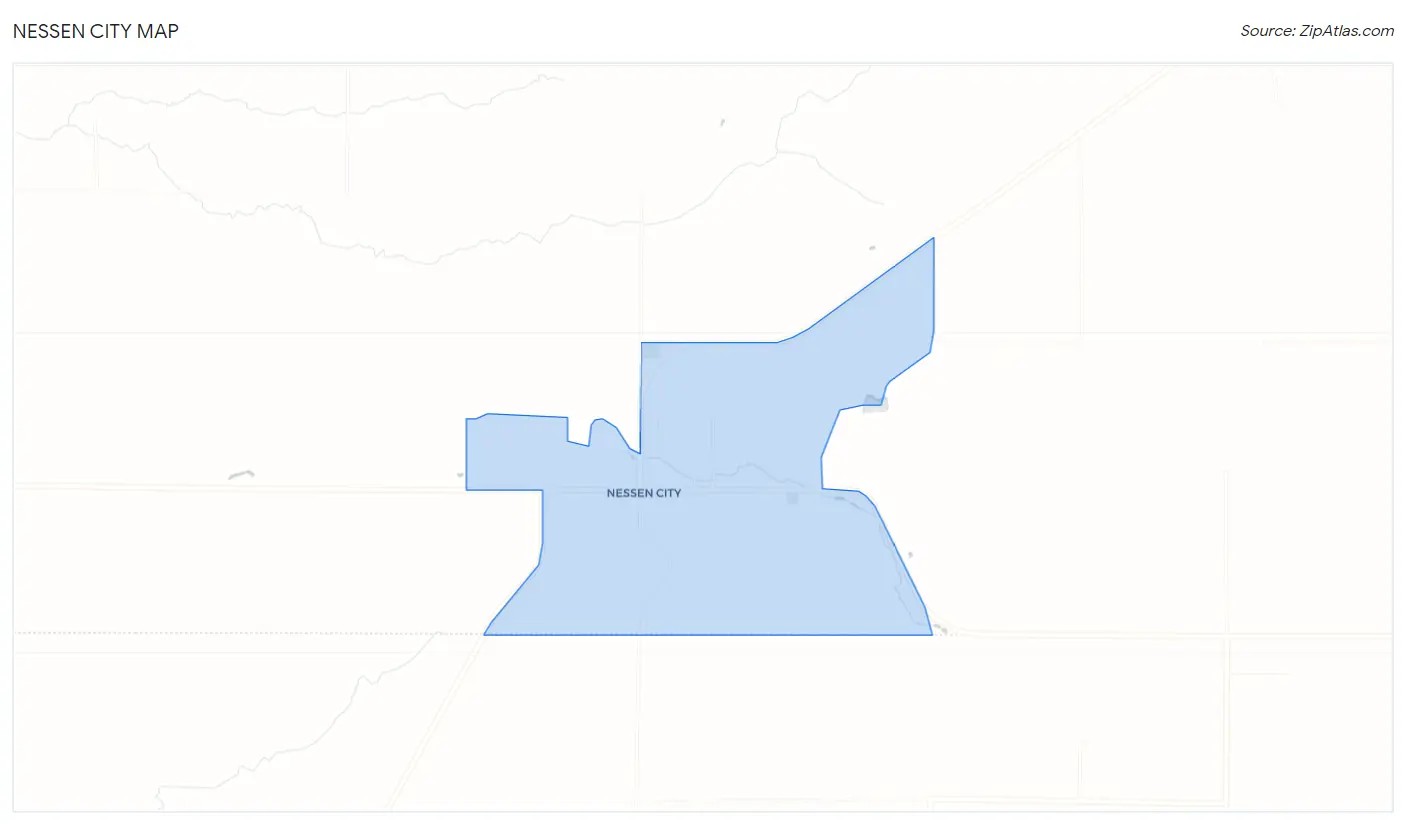
Nessen City Overview
$20,047
PER CAPITA INCOME
$48,750
AVG FAMILY INCOME
$33,750
AVG HOUSEHOLD INCOME
0.40
INEQUALITY / GINI INDEX
90
TOTAL POPULATION
43
MALE POPULATION
47
FEMALE POPULATION
91.49
MALES / 100 FEMALES
109.30
FEMALES / 100 MALES
55.5
MEDIAN AGE
3.5
AVG FAMILY SIZE
3.2
AVG HOUSEHOLD SIZE
32
LABOR FORCE [ PEOPLE ]
40.5%
PERCENT IN LABOR FORCE
12.5%
UNEMPLOYMENT RATE
Income in Nessen City
Income Overview in Nessen City
Per Capita Income in Nessen City is $20,047, while median incomes of families and households are $48,750 and $33,750 respectively.
| Characteristic | Number | Measure |
| Per Capita Income | 90 | $20,047 |
| Median Family Income | 22 | $48,750 |
| Mean Family Income | 22 | $63,614 |
| Median Household Income | 28 | $33,750 |
| Mean Household Income | 28 | $53,975 |
| Income Deficit | 22 | $0 |
| Wage / Income Gap (%) | 90 | 0.00% |
| Wage / Income Gap ($) | 90 | 100.00¢ per $1 |
| Gini / Inequality Index | 90 | 0.40 |
Earnings by Sex in Nessen City
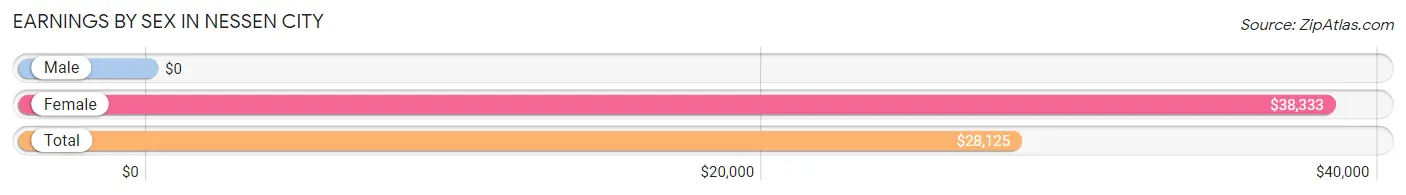
| Sex | Number | Average Earnings |
| Male | 20 (58.8%) | $0 |
| Female | 14 (41.2%) | $38,333 |
| Total | 34 (100.0%) | $28,125 |
Earnings by Sex by Income Bracket in Nessen City
The most common earnings brackets in Nessen City are $12,500 to $14,999 for men (6 | 30.0%) and $17,500 to $19,999 for women (5 | 35.7%).
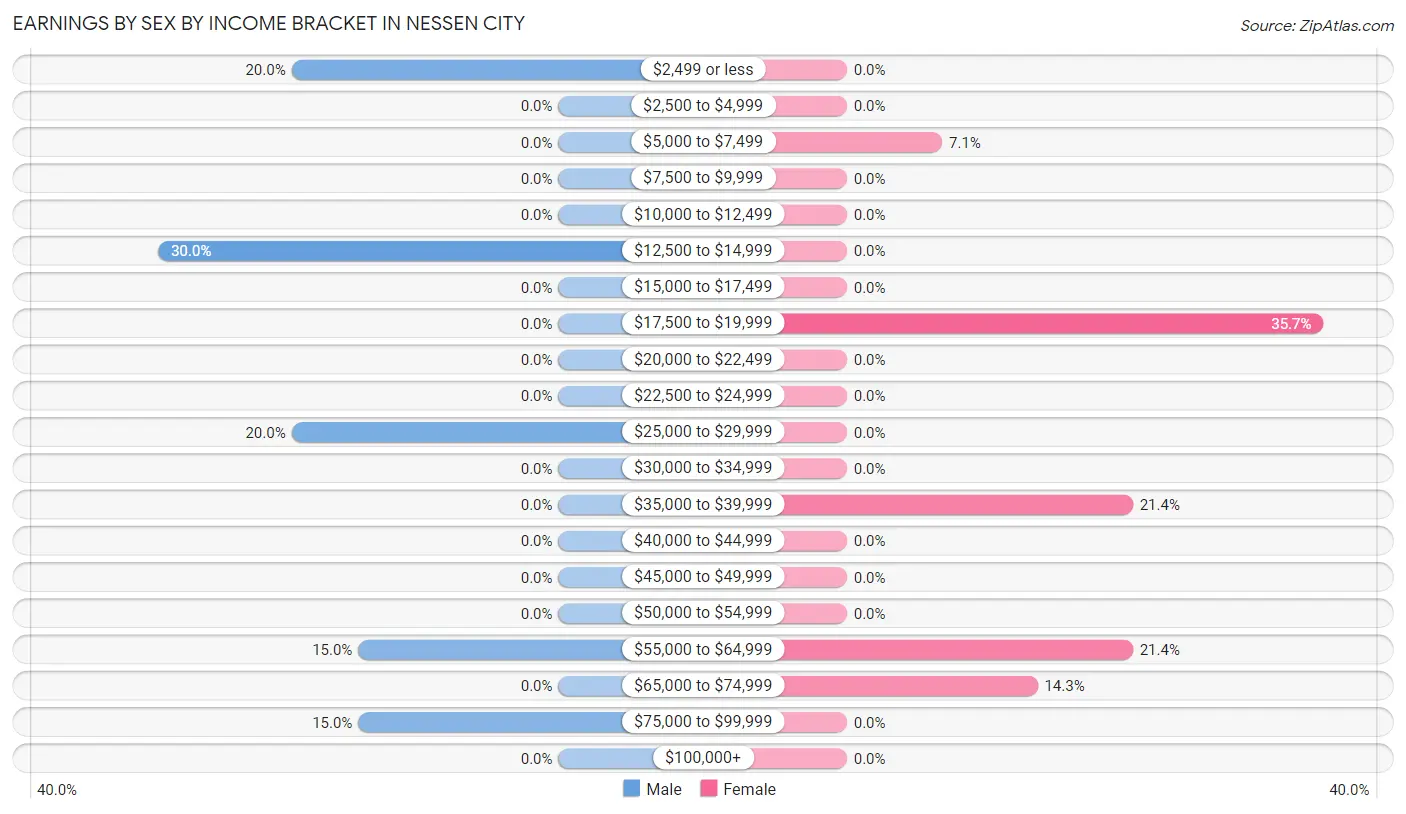
| Income | Male | Female |
| $2,499 or less | 4 (20.0%) | 0 (0.0%) |
| $2,500 to $4,999 | 0 (0.0%) | 0 (0.0%) |
| $5,000 to $7,499 | 0 (0.0%) | 1 (7.1%) |
| $7,500 to $9,999 | 0 (0.0%) | 0 (0.0%) |
| $10,000 to $12,499 | 0 (0.0%) | 0 (0.0%) |
| $12,500 to $14,999 | 6 (30.0%) | 0 (0.0%) |
| $15,000 to $17,499 | 0 (0.0%) | 0 (0.0%) |
| $17,500 to $19,999 | 0 (0.0%) | 5 (35.7%) |
| $20,000 to $22,499 | 0 (0.0%) | 0 (0.0%) |
| $22,500 to $24,999 | 0 (0.0%) | 0 (0.0%) |
| $25,000 to $29,999 | 4 (20.0%) | 0 (0.0%) |
| $30,000 to $34,999 | 0 (0.0%) | 0 (0.0%) |
| $35,000 to $39,999 | 0 (0.0%) | 3 (21.4%) |
| $40,000 to $44,999 | 0 (0.0%) | 0 (0.0%) |
| $45,000 to $49,999 | 0 (0.0%) | 0 (0.0%) |
| $50,000 to $54,999 | 0 (0.0%) | 0 (0.0%) |
| $55,000 to $64,999 | 3 (15.0%) | 3 (21.4%) |
| $65,000 to $74,999 | 0 (0.0%) | 2 (14.3%) |
| $75,000 to $99,999 | 3 (15.0%) | 0 (0.0%) |
| $100,000+ | 0 (0.0%) | 0 (0.0%) |
| Total | 20 (100.0%) | 14 (100.0%) |
Earnings by Sex by Educational Attainment in Nessen City
| Educational Attainment | Male Income | Female Income |
| Less than High School | - | - |
| High School Diploma | - | - |
| College or Associate's Degree | - | - |
| Bachelor's Degree | - | - |
| Graduate Degree | - | - |
| Total | - | - |
Family Income in Nessen City
Family Income Brackets in Nessen City
According to the Nessen City family income data, there are 7 families falling into the $25,000 to $34,999 income range, which is the most common income bracket and makes up 31.8% of all families.
| Income Bracket | # Families | % Families |
| Less than $10,000 | 0 | 0.0% |
| $10,000 to $14,999 | 0 | 0.0% |
| $15,000 to $24,999 | 1 | 4.5% |
| $25,000 to $34,999 | 7 | 31.8% |
| $35,000 to $49,999 | 3 | 13.6% |
| $50,000 to $74,999 | 6 | 27.3% |
| $75,000 to $99,999 | 0 | 0.0% |
| $100,000 to $149,999 | 3 | 13.6% |
| $150,000 to $199,999 | 2 | 9.1% |
| $200,000+ | 0 | 0.0% |
Family Income by Famaliy Size in Nessen City
2-person families (19 | 86.4%) account for the highest median family income in Nessen City with $38,750 per family, while 2-person families (19 | 86.4%) have the highest median income of $19,375 per family member.
| Income Bracket | # Families | Median Income |
| 2-Person Families | 19 (86.4%) | $38,750 |
| 3-Person Families | 0 (0.0%) | $0 |
| 4-Person Families | 0 (0.0%) | $0 |
| 5-Person Families | 2 (9.1%) | $0 |
| 6-Person Families | 0 (0.0%) | $0 |
| 7+ Person Families | 1 (4.5%) | $0 |
| Total | 22 (100.0%) | $48,750 |
Family Income by Number of Earners in Nessen City
| Number of Earners | # Families | Median Income |
| No Earners | 6 (27.3%) | $0 |
| 1 Earner | 10 (45.5%) | $48,750 |
| 2 Earners | 4 (18.2%) | $0 |
| 3+ Earners | 2 (9.1%) | $0 |
| Total | 22 (100.0%) | $48,750 |
Household Income in Nessen City
Household Income Brackets in Nessen City
With 8 households falling in the category, the $25,000 to $34,999 income range is the most frequent in Nessen City, accounting for 28.6% of all households.
| Income Bracket | # Households | % Households |
| Less than $10,000 | 0 | 0.0% |
| $10,000 to $14,999 | 0 | 0.0% |
| $15,000 to $24,999 | 6 | 21.4% |
| $25,000 to $34,999 | 8 | 28.6% |
| $35,000 to $49,999 | 3 | 10.7% |
| $50,000 to $74,999 | 6 | 21.4% |
| $75,000 to $99,999 | 0 | 0.0% |
| $100,000 to $149,999 | 3 | 10.7% |
| $150,000 to $199,999 | 2 | 7.1% |
| $200,000+ | 0 | 0.0% |
Household Income by Householder Age in Nessen City
The median household income in Nessen City is $33,750, with the highest median household income of $29,750 found in the 45 to 64 years age bracket for the primary householder. A total of 17 households (60.7%) fall into this category.
| Income Bracket | # Households | Median Income |
| 15 to 24 Years | 0 (0.0%) | $0 |
| 25 to 44 Years | 5 (17.9%) | $0 |
| 45 to 64 Years | 17 (60.7%) | $29,750 |
| 65+ Years | 6 (21.4%) | $0 |
| Total | 28 (100.0%) | $33,750 |
Poverty in Nessen City
Income Below Poverty by Sex and Age in Nessen City
With 9.3% poverty level for males and 4.3% for females among the residents of Nessen City, 25 to 34 year old males and 55 to 64 year old females are the most vulnerable to poverty, with 4 males (57.1%) and 2 females (13.3%) in their respective age groups living below the poverty level.
| Age Bracket | Male | Female |
| Under 5 Years | 0 (0.0%) | 0 (0.0%) |
| 5 Years | 0 (0.0%) | 0 (0.0%) |
| 6 to 11 Years | 0 (0.0%) | 0 (0.0%) |
| 12 to 14 Years | 0 (0.0%) | 0 (0.0%) |
| 15 Years | 0 (0.0%) | 0 (0.0%) |
| 16 and 17 Years | 0 (0.0%) | 0 (0.0%) |
| 18 to 24 Years | 0 (0.0%) | 0 (0.0%) |
| 25 to 34 Years | 4 (57.1%) | 0 (0.0%) |
| 35 to 44 Years | 0 (0.0%) | 0 (0.0%) |
| 45 to 54 Years | 0 (0.0%) | 0 (0.0%) |
| 55 to 64 Years | 0 (0.0%) | 2 (13.3%) |
| 65 to 74 Years | 0 (0.0%) | 0 (0.0%) |
| 75 Years and over | 0 (0.0%) | 0 (0.0%) |
| Total | 4 (9.3%) | 2 (4.3%) |
Income Above Poverty by Sex and Age in Nessen City
According to the poverty statistics in Nessen City, males aged 12 to 14 years and females aged under 5 years are the age groups that are most secure financially, with 100.0% of males and 100.0% of females in these age groups living above the poverty line.
| Age Bracket | Male | Female |
| Under 5 Years | 0 (0.0%) | 2 (100.0%) |
| 5 Years | 0 (0.0%) | 0 (0.0%) |
| 6 to 11 Years | 0 (0.0%) | 0 (0.0%) |
| 12 to 14 Years | 2 (100.0%) | 0 (0.0%) |
| 15 Years | 7 (100.0%) | 0 (0.0%) |
| 16 and 17 Years | 4 (100.0%) | 0 (0.0%) |
| 18 to 24 Years | 4 (100.0%) | 1 (100.0%) |
| 25 to 34 Years | 3 (42.9%) | 3 (100.0%) |
| 35 to 44 Years | 0 (0.0%) | 2 (100.0%) |
| 45 to 54 Years | 3 (100.0%) | 9 (100.0%) |
| 55 to 64 Years | 15 (100.0%) | 13 (86.7%) |
| 65 to 74 Years | 1 (100.0%) | 1 (100.0%) |
| 75 Years and over | 0 (0.0%) | 14 (100.0%) |
| Total | 39 (90.7%) | 45 (95.7%) |
Income Below Poverty Among Married-Couple Families in Nessen City
| Children | Above Poverty | Below Poverty |
| No Children | 11 (100.0%) | 0 (0.0%) |
| 1 or 2 Children | 0 (0.0%) | 0 (0.0%) |
| 3 or 4 Children | 2 (100.0%) | 0 (0.0%) |
| 5 or more Children | 0 (0.0%) | 0 (0.0%) |
| Total | 13 (100.0%) | 0 (0.0%) |
Income Below Poverty Among Single-Parent Households in Nessen City
| Children | Single Father | Single Mother |
| No Children | 0 (0.0%) | 0 (0.0%) |
| 1 or 2 Children | 0 (0.0%) | 0 (0.0%) |
| 3 or 4 Children | 0 (0.0%) | 0 (0.0%) |
| 5 or more Children | 0 (0.0%) | 0 (0.0%) |
| Total | 0 (0.0%) | 0 (0.0%) |
Income Below Poverty Among Married-Couple vs Single-Parent Households in Nessen City
| Children | Married-Couple Families | Single-Parent Households |
| No Children | 0 (0.0%) | 0 (0.0%) |
| 1 or 2 Children | 0 (0.0%) | 0 (0.0%) |
| 3 or 4 Children | 0 (0.0%) | 0 (0.0%) |
| 5 or more Children | 0 (0.0%) | 0 (0.0%) |
| Total | 0 (0.0%) | 0 (0.0%) |
Race in Nessen City
The most populous races in Nessen City are White / Caucasian (84 | 93.3%), and Two or more Races (6 | 6.7%).
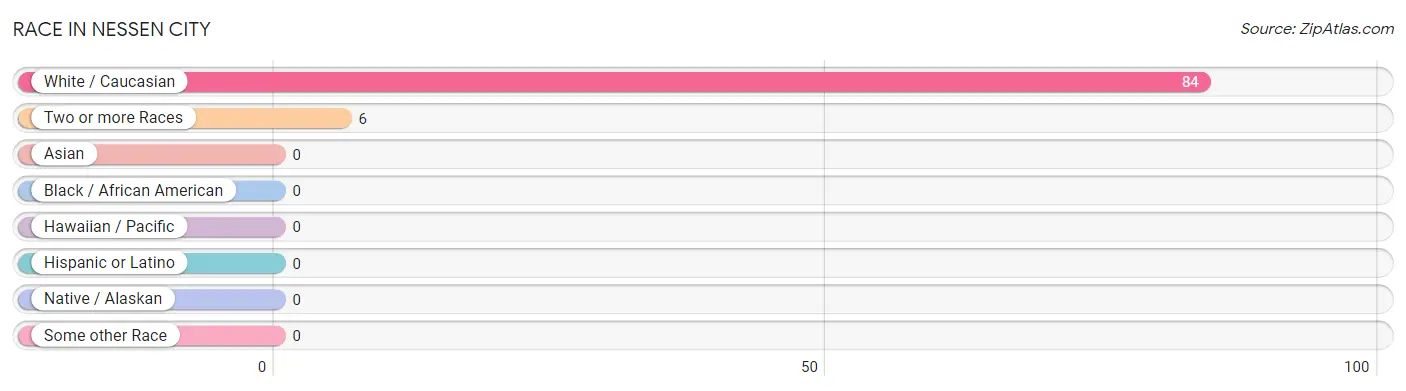
| Race | # Population | % Population |
| Asian | 0 | 0.0% |
| Black / African American | 0 | 0.0% |
| Hawaiian / Pacific | 0 | 0.0% |
| Hispanic or Latino | 0 | 0.0% |
| Native / Alaskan | 0 | 0.0% |
| White / Caucasian | 84 | 93.3% |
| Two or more Races | 6 | 6.7% |
| Some other Race | 0 | 0.0% |
| Total | 90 | 100.0% |
Ancestry in Nessen City
The most populous ancestries reported in Nessen City are German (46 | 51.1%), Irish (26 | 28.9%), French (13 | 14.4%), American (9 | 10.0%), and Dutch (9 | 10.0%), together accounting for 114.4% of all Nessen City residents.
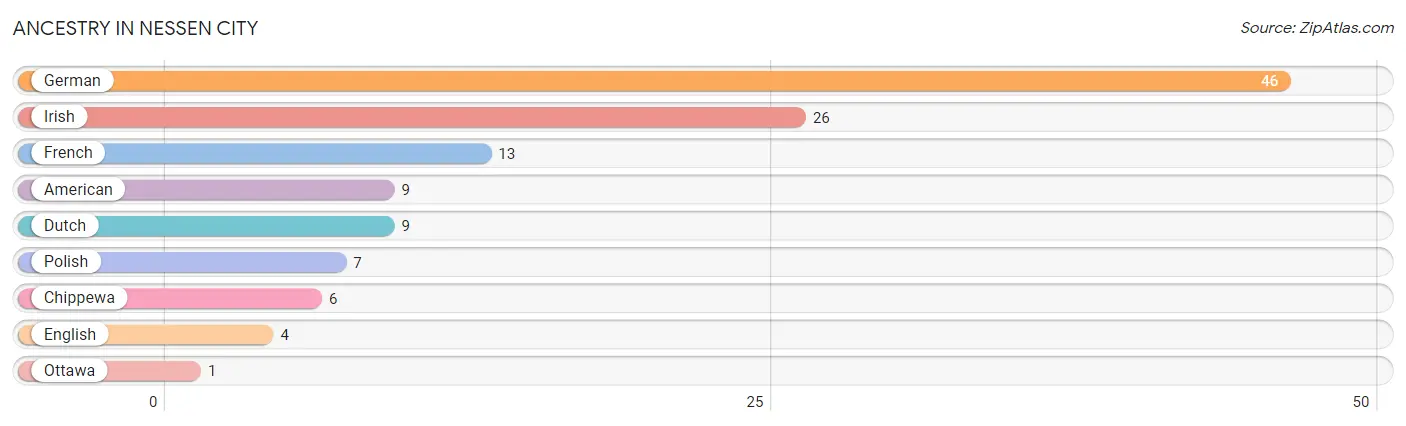
| Ancestry | # Population | % Population |
| American | 9 | 10.0% |
| Chippewa | 6 | 6.7% |
| Dutch | 9 | 10.0% |
| English | 4 | 4.4% |
| French | 13 | 14.4% |
| German | 46 | 51.1% |
| Irish | 26 | 28.9% |
| Ottawa | 1 | 1.1% |
| Polish | 7 | 7.8% | View All 9 Rows |
Immigrants in Nessen City

| Immigration Origin | # Population | % Population | View All 0 Rows |
Sex and Age in Nessen City
Sex and Age in Nessen City
The most populous age groups in Nessen City are 15 to 19 Years (11 | 25.6%) for men and 75 to 79 Years (13 | 27.7%) for women.
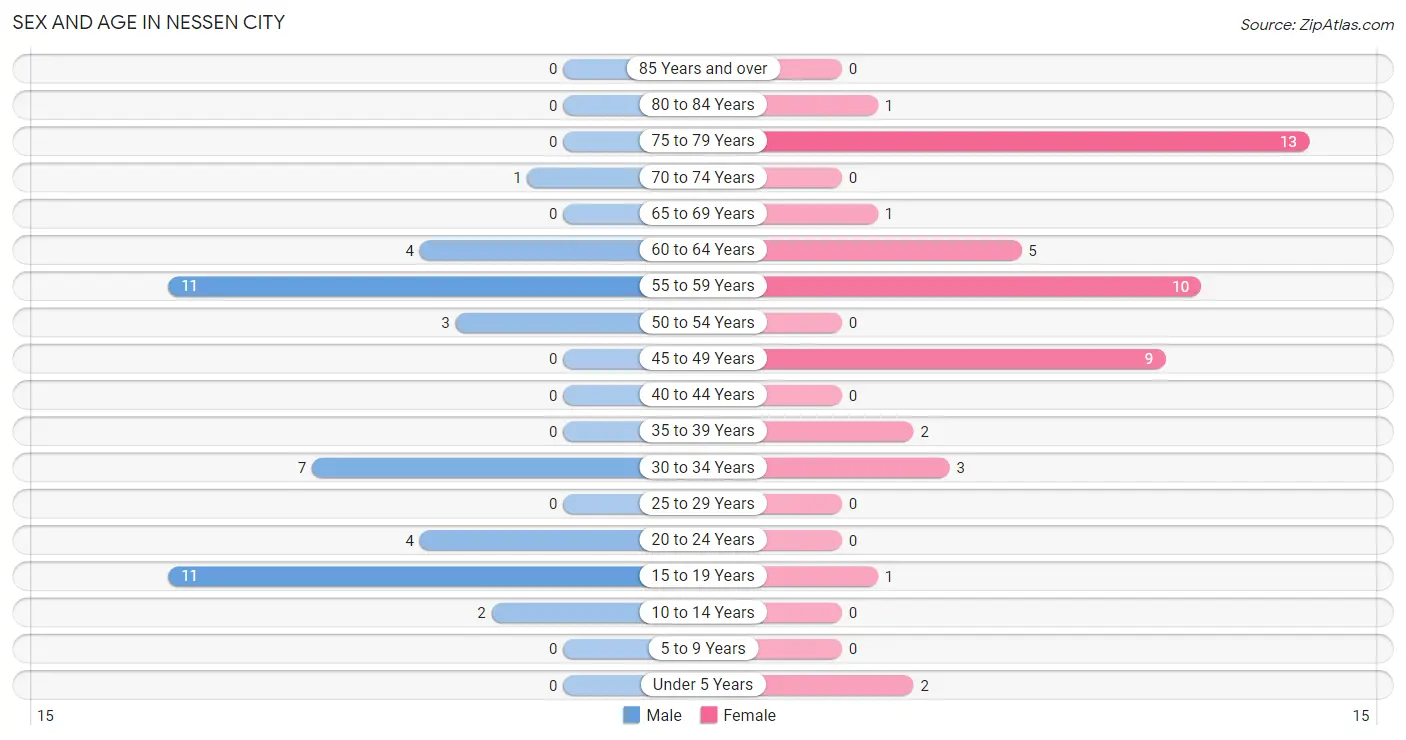
| Age Bracket | Male | Female |
| Under 5 Years | 0 (0.0%) | 2 (4.3%) |
| 5 to 9 Years | 0 (0.0%) | 0 (0.0%) |
| 10 to 14 Years | 2 (4.6%) | 0 (0.0%) |
| 15 to 19 Years | 11 (25.6%) | 1 (2.1%) |
| 20 to 24 Years | 4 (9.3%) | 0 (0.0%) |
| 25 to 29 Years | 0 (0.0%) | 0 (0.0%) |
| 30 to 34 Years | 7 (16.3%) | 3 (6.4%) |
| 35 to 39 Years | 0 (0.0%) | 2 (4.3%) |
| 40 to 44 Years | 0 (0.0%) | 0 (0.0%) |
| 45 to 49 Years | 0 (0.0%) | 9 (19.2%) |
| 50 to 54 Years | 3 (7.0%) | 0 (0.0%) |
| 55 to 59 Years | 11 (25.6%) | 10 (21.3%) |
| 60 to 64 Years | 4 (9.3%) | 5 (10.6%) |
| 65 to 69 Years | 0 (0.0%) | 1 (2.1%) |
| 70 to 74 Years | 1 (2.3%) | 0 (0.0%) |
| 75 to 79 Years | 0 (0.0%) | 13 (27.7%) |
| 80 to 84 Years | 0 (0.0%) | 1 (2.1%) |
| 85 Years and over | 0 (0.0%) | 0 (0.0%) |
| Total | 43 (100.0%) | 47 (100.0%) |
Families and Households in Nessen City
Median Family Size in Nessen City
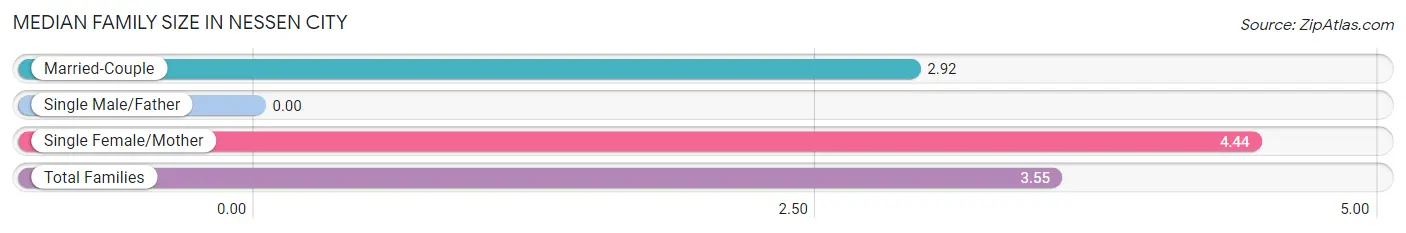
| Family Type | # Families | Family Size |
| Married-Couple | 13 (59.1%) | 2.92 |
| Single Male/Father | 0 (0.0%) | - |
| Single Female/Mother | 9 (40.9%) | 4.44 |
| Total Families | 22 (100.0%) | 3.55 |
Median Household Size in Nessen City
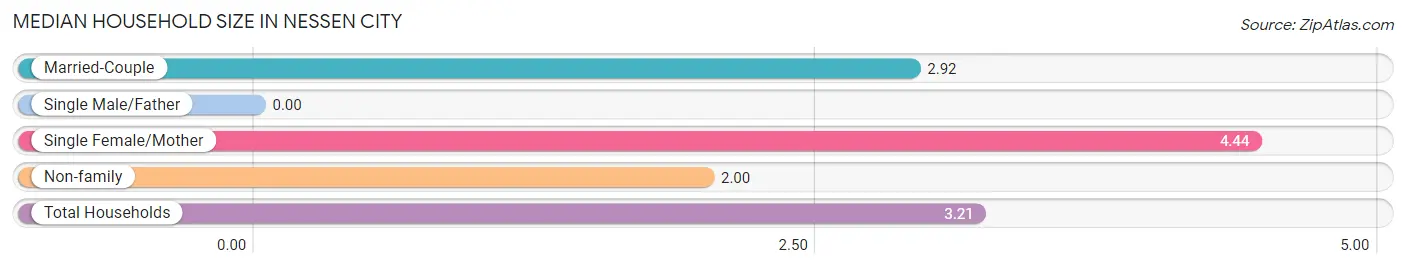
| Household Type | # Households | Household Size |
| Married-Couple | 13 (46.4%) | 2.92 |
| Single Male/Father | 0 (0.0%) | - |
| Single Female/Mother | 9 (32.1%) | 4.44 |
| Non-family | 6 (21.4%) | 2.00 |
| Total Households | 28 (100.0%) | 3.21 |
Household Size by Marriage Status in Nessen City
Out of a total of 28 households in Nessen City, 22 (78.6%) are family households, while 6 (21.4%) are nonfamily households. The most numerous type of family households are 2-person households, comprising 19, and the most common type of nonfamily households are 1-person households, comprising 4.
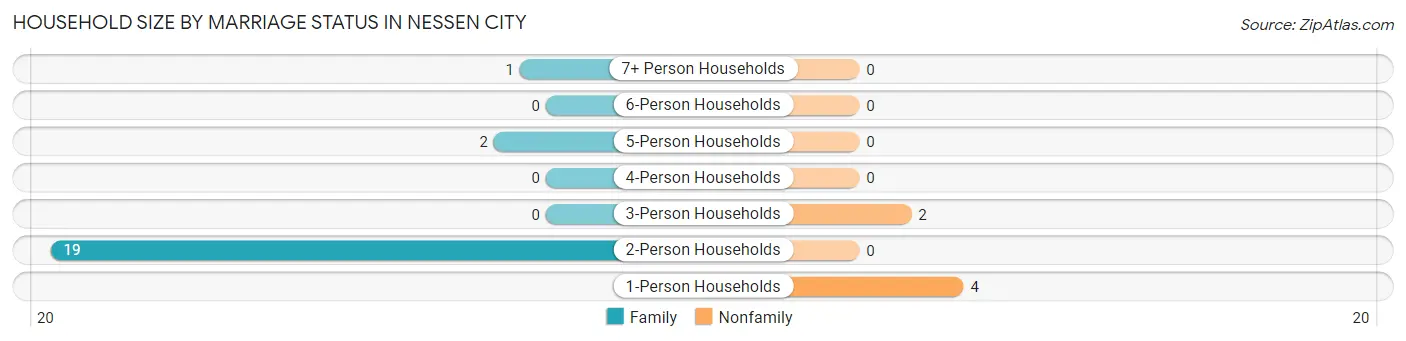
| Household Size | Family Households | Nonfamily Households |
| 1-Person Households | - | 4 (14.3%) |
| 2-Person Households | 19 (67.9%) | 0 (0.0%) |
| 3-Person Households | 0 (0.0%) | 2 (7.1%) |
| 4-Person Households | 0 (0.0%) | 0 (0.0%) |
| 5-Person Households | 2 (7.1%) | 0 (0.0%) |
| 6-Person Households | 0 (0.0%) | 0 (0.0%) |
| 7+ Person Households | 1 (3.6%) | 0 (0.0%) |
| Total | 22 (78.6%) | 6 (21.4%) |
Female Fertility in Nessen City
Fertility by Age in Nessen City
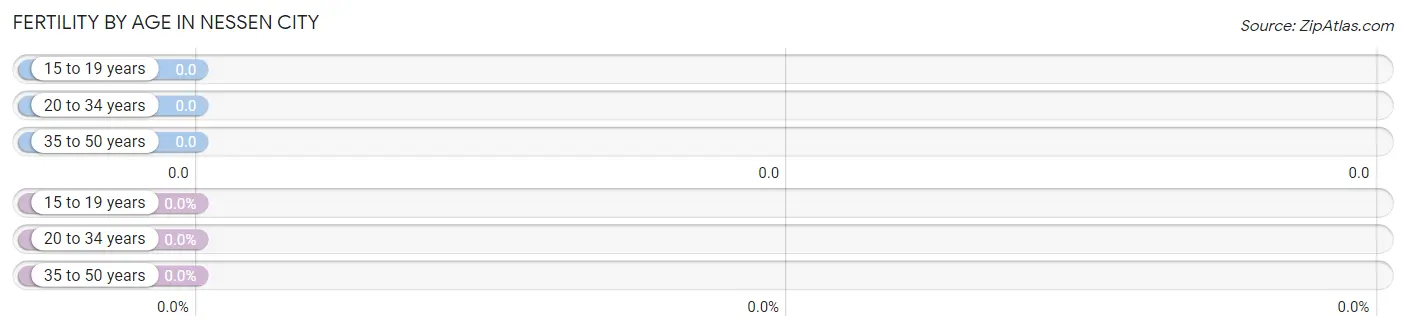
| Age Bracket | Women with Births | Births / 1,000 Women |
| 15 to 19 years | 0 (0.0%) | 0.0 |
| 20 to 34 years | 0 (0.0%) | 0.0 |
| 35 to 50 years | 0 (0.0%) | 0.0 |
| Total | 0 (0.0%) | 0.0 |
Fertility by Age by Marriage Status in Nessen City
| Age Bracket | Married | Unmarried |
| 15 to 19 years | 0 (0.0%) | 0 (0.0%) |
| 20 to 34 years | 0 (0.0%) | 0 (0.0%) |
| 35 to 50 years | 0 (0.0%) | 0 (0.0%) |
| Total | 0 (0.0%) | 0 (0.0%) |
Fertility by Education in Nessen City
| Educational Attainment | Women with Births | Births / 1,000 Women |
| Less than High School | 0 (0.0%) | 0.0 |
| High School Diploma | 0 (0.0%) | 0.0 |
| College or Associate's Degree | 0 (0.0%) | 0.0 |
| Bachelor's Degree | 0 (0.0%) | 0.0 |
| Graduate Degree | 0 (0.0%) | 0.0 |
| Total | 0 (0.0%) | 0.0 |
Fertility by Education by Marriage Status in Nessen City
| Educational Attainment | Married | Unmarried |
| Less than High School | 0 (0.0%) | 0 (0.0%) |
| High School Diploma | 0 (0.0%) | 0 (0.0%) |
| College or Associate's Degree | 0 (0.0%) | 0 (0.0%) |
| Bachelor's Degree | 0 (0.0%) | 0 (0.0%) |
| Graduate Degree | 0 (0.0%) | 0 (0.0%) |
| Total | 0 (0.0%) | 0 (0.0%) |
Employment Characteristics in Nessen City
Employment by Class of Employer in Nessen City
Among the 28 employed individuals in Nessen City, private company employees (23 | 82.1%), and not-for-profit organizations (5 | 17.9%) make up the most common classes of employment.
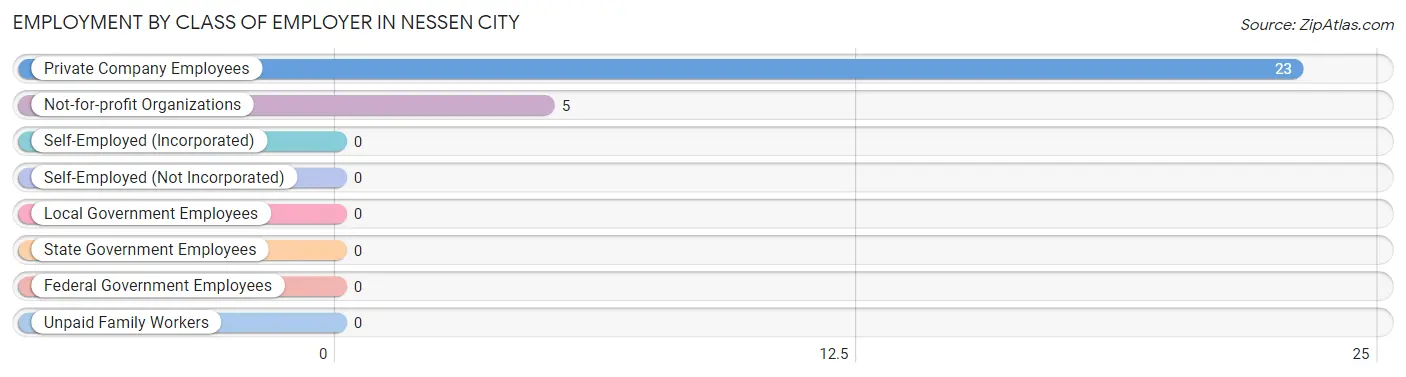
| Employer Class | # Employees | % Employees |
| Private Company Employees | 23 | 82.1% |
| Self-Employed (Incorporated) | 0 | 0.0% |
| Self-Employed (Not Incorporated) | 0 | 0.0% |
| Not-for-profit Organizations | 5 | 17.9% |
| Local Government Employees | 0 | 0.0% |
| State Government Employees | 0 | 0.0% |
| Federal Government Employees | 0 | 0.0% |
| Unpaid Family Workers | 0 | 0.0% |
| Total | 28 | 100.0% |
Employment Status by Age in Nessen City
According to the labor force statistics for Nessen City, out of the total population over 16 years of age (79), 40.5% or 32 individuals are in the labor force, with 12.5% or 4 of them unemployed. The age group with the highest labor force participation rate is 16 to 19 years, with 100.0% or 5 individuals in the labor force. Within the labor force, the 30 to 34 years age range has the highest percentage of unemployed individuals, with 40.0% or 4 of them being unemployed.
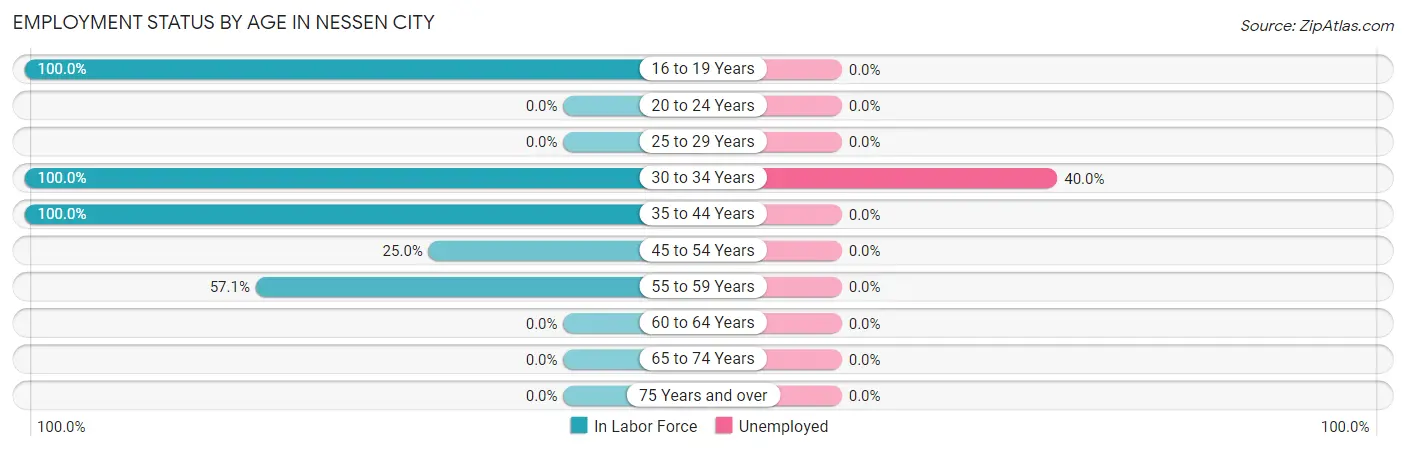
| Age Bracket | In Labor Force | Unemployed |
| 16 to 19 Years | 5 (100.0%) | 0 (0.0%) |
| 20 to 24 Years | 0 (0.0%) | 0 (0.0%) |
| 25 to 29 Years | 0 (0.0%) | 0 (0.0%) |
| 30 to 34 Years | 10 (100.0%) | 4 (40.0%) |
| 35 to 44 Years | 2 (100.0%) | 0 (0.0%) |
| 45 to 54 Years | 3 (25.0%) | 0 (0.0%) |
| 55 to 59 Years | 12 (57.1%) | 0 (0.0%) |
| 60 to 64 Years | 0 (0.0%) | 0 (0.0%) |
| 65 to 74 Years | 0 (0.0%) | 0 (0.0%) |
| 75 Years and over | 0 (0.0%) | 0 (0.0%) |
| Total | 32 (40.5%) | 4 (12.5%) |
Employment Status by Educational Attainment in Nessen City
According to labor force statistics for Nessen City, 50.0% of individuals (27) out of the total population between 25 and 64 years of age (54) are in the labor force, with 14.8% or 4 of them being unemployed. The group with the highest labor force participation rate are those with the educational attainment of less than high school, with 66.7% or 4 individuals in the labor force. Within the labor force, individuals with high school diploma education have the highest percentage of unemployment, with 57.1% or 4 of them being unemployed.
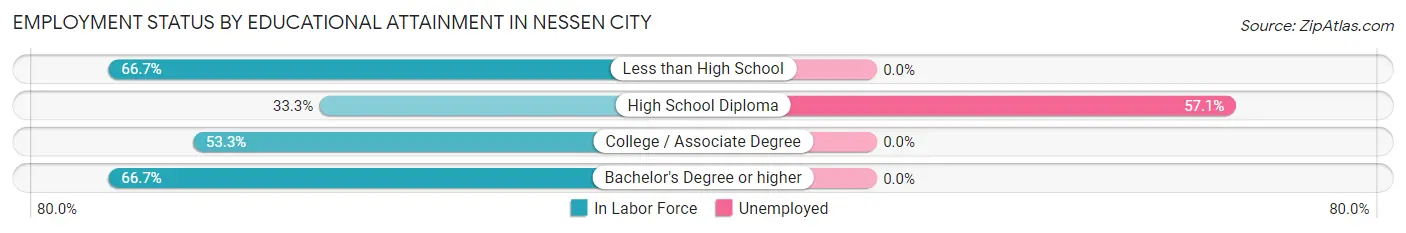
| Educational Attainment | In Labor Force | Unemployed |
| Less than High School | 4 (66.7%) | 0 (0.0%) |
| High School Diploma | 7 (33.3%) | 12 (57.1%) |
| College / Associate Degree | 8 (53.3%) | 0 (0.0%) |
| Bachelor's Degree or higher | 8 (66.7%) | 0 (0.0%) |
| Total | 27 (50.0%) | 8 (14.8%) |
Employment Occupations by Sex in Nessen City
Management, Business, Science and Arts Occupations
The most common Management, Business, Science and Arts occupations in Nessen City are Management (7 | 25.0%), Business & Financial (6 | 21.4%), Community & Social Service (3 | 10.7%), and Arts, Media & Entertainment (3 | 10.7%).
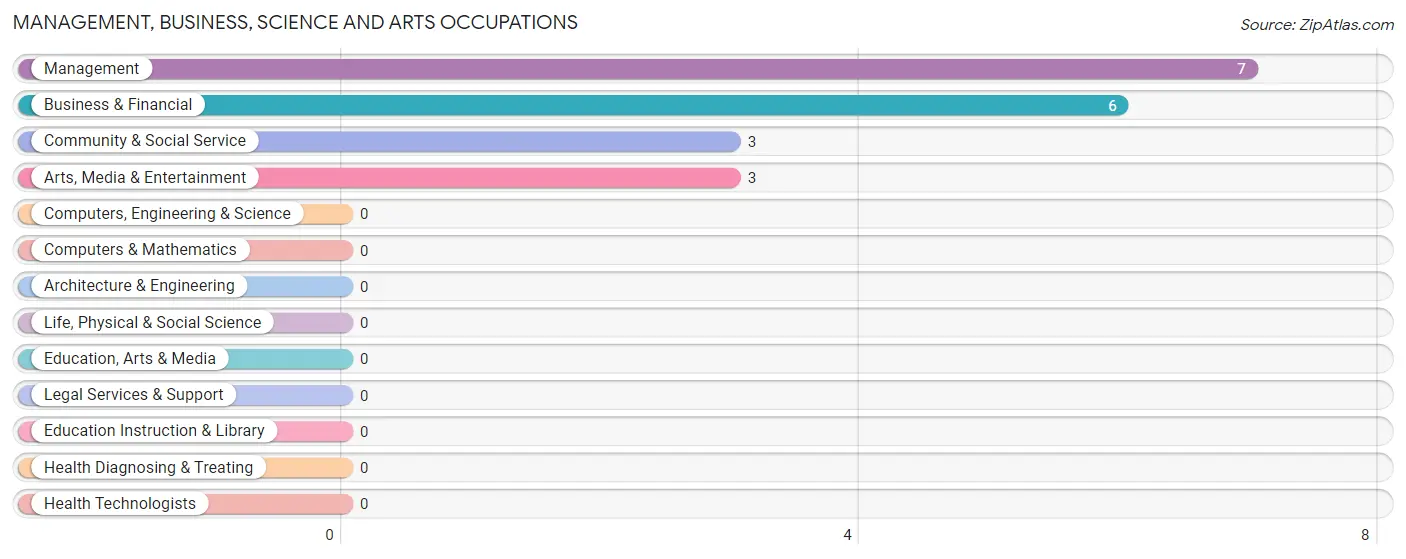
Management, Business, Science and Arts Occupations by Sex
Within the Management, Business, Science and Arts occupations in Nessen City, the most male-oriented occupations are Community & Social Service (100.0%), and Arts, Media & Entertainment (100.0%), while the most female-oriented occupations are Management (100.0%), and Business & Financial (100.0%).
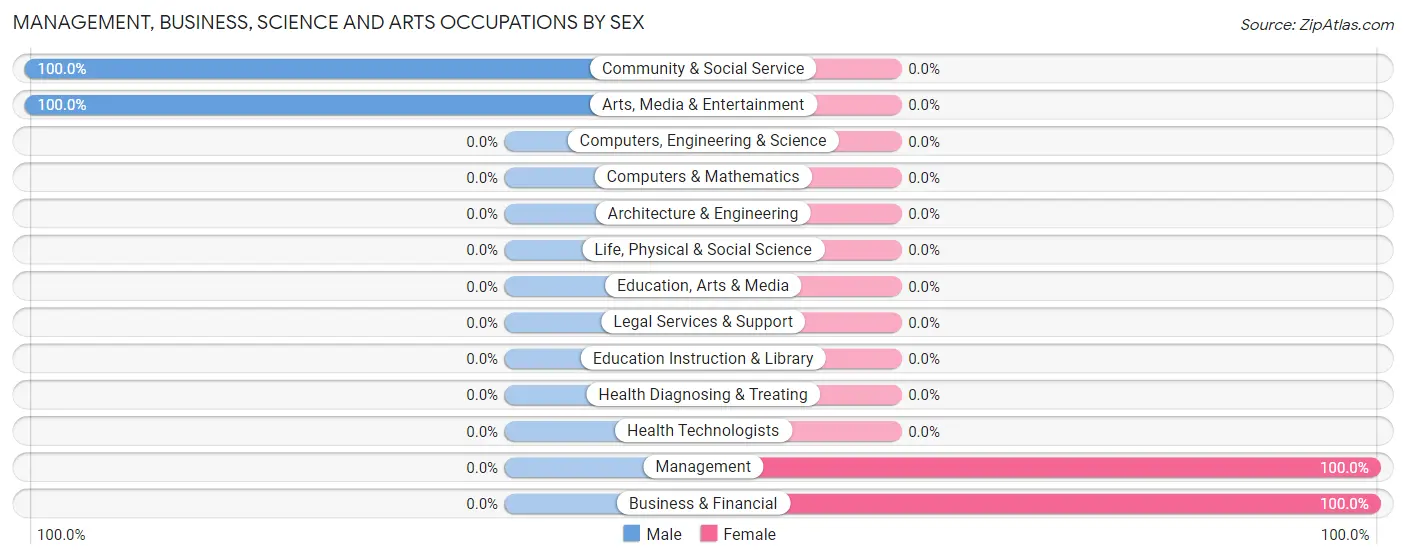
| Occupation | Male | Female |
| Management | 0 (0.0%) | 7 (100.0%) |
| Business & Financial | 0 (0.0%) | 6 (100.0%) |
| Computers, Engineering & Science | 0 (0.0%) | 0 (0.0%) |
| Computers & Mathematics | 0 (0.0%) | 0 (0.0%) |
| Architecture & Engineering | 0 (0.0%) | 0 (0.0%) |
| Life, Physical & Social Science | 0 (0.0%) | 0 (0.0%) |
| Community & Social Service | 3 (100.0%) | 0 (0.0%) |
| Education, Arts & Media | 0 (0.0%) | 0 (0.0%) |
| Legal Services & Support | 0 (0.0%) | 0 (0.0%) |
| Education Instruction & Library | 0 (0.0%) | 0 (0.0%) |
| Arts, Media & Entertainment | 3 (100.0%) | 0 (0.0%) |
| Health Diagnosing & Treating | 0 (0.0%) | 0 (0.0%) |
| Health Technologists | 0 (0.0%) | 0 (0.0%) |
| Total (Category) | 3 (18.8%) | 13 (81.2%) |
| Total (Overall) | 14 (50.0%) | 14 (50.0%) |
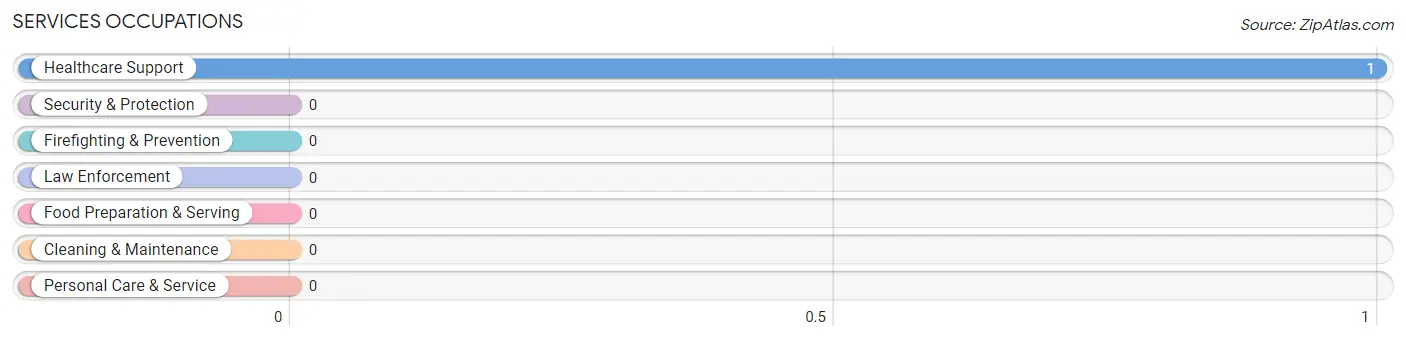
Services Occupations
The most common Services occupations in Nessen City are , and Healthcare Support (1 | 3.6%).
Services Occupations by Sex
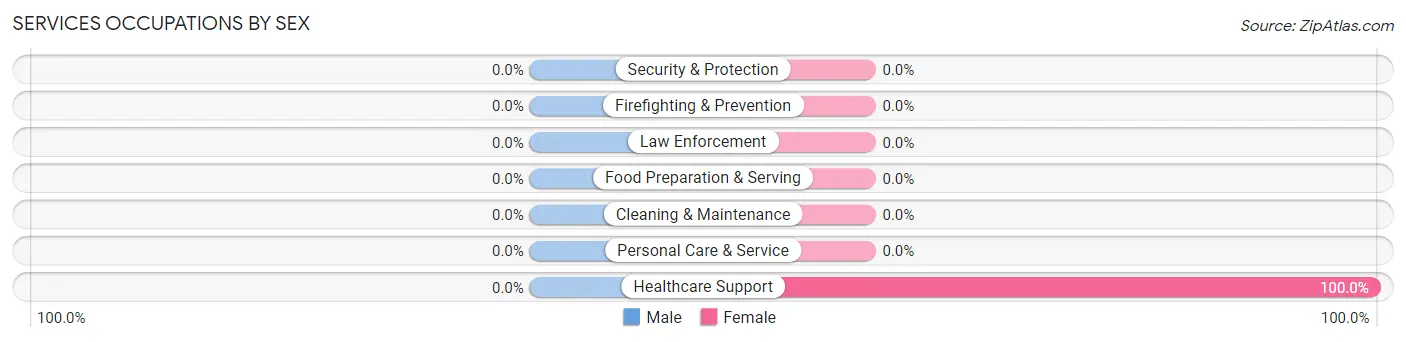
| Occupation | Male | Female |
| Healthcare Support | 0 (0.0%) | 1 (100.0%) |
| Security & Protection | 0 (0.0%) | 0 (0.0%) |
| Firefighting & Prevention | 0 (0.0%) | 0 (0.0%) |
| Law Enforcement | 0 (0.0%) | 0 (0.0%) |
| Food Preparation & Serving | 0 (0.0%) | 0 (0.0%) |
| Cleaning & Maintenance | 0 (0.0%) | 0 (0.0%) |
| Personal Care & Service | 0 (0.0%) | 0 (0.0%) |
| Total (Category) | 0 (0.0%) | 1 (100.0%) |
| Total (Overall) | 14 (50.0%) | 14 (50.0%) |
Sales and Office Occupations
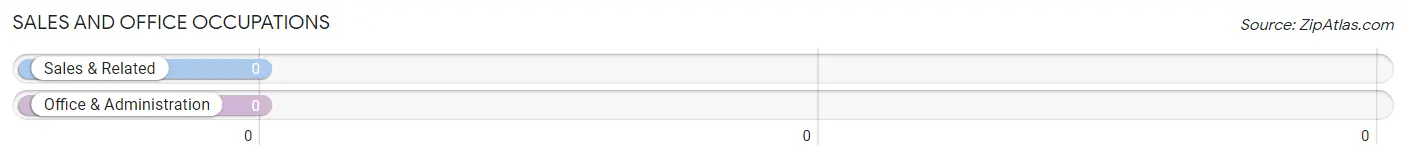
Sales and Office Occupations by Sex
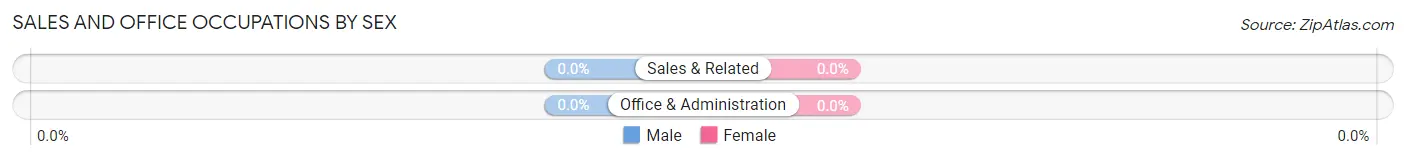
| Occupation | Male | Female |
| Sales & Related | 0 (0.0%) | 0 (0.0%) |
| Office & Administration | 0 (0.0%) | 0 (0.0%) |
| Total (Category) | 0 (0.0%) | 0 (0.0%) |
| Total (Overall) | 14 (50.0%) | 14 (50.0%) |
Natural Resources, Construction and Maintenance Occupations
The most common Natural Resources, Construction and Maintenance occupations in Nessen City are , and Construction & Extraction (3 | 10.7%).
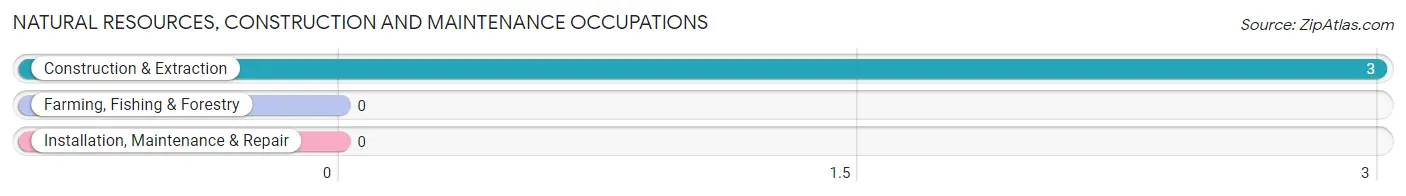
Natural Resources, Construction and Maintenance Occupations by Sex
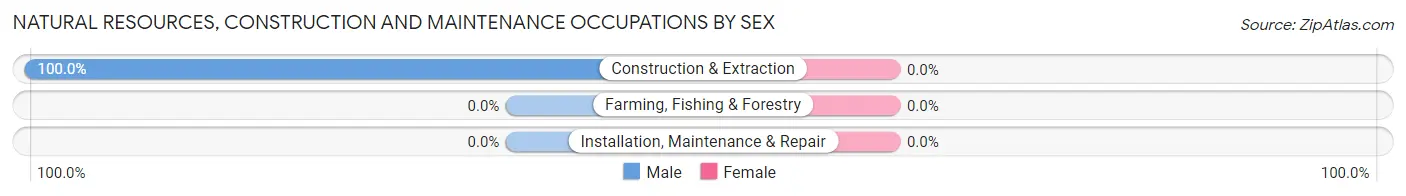
| Occupation | Male | Female |
| Farming, Fishing & Forestry | 0 (0.0%) | 0 (0.0%) |
| Construction & Extraction | 3 (100.0%) | 0 (0.0%) |
| Installation, Maintenance & Repair | 0 (0.0%) | 0 (0.0%) |
| Total (Category) | 3 (100.0%) | 0 (0.0%) |
| Total (Overall) | 14 (50.0%) | 14 (50.0%) |
Production, Transportation and Moving Occupations
The most common Production, Transportation and Moving occupations in Nessen City are , and Production (8 | 28.6%).
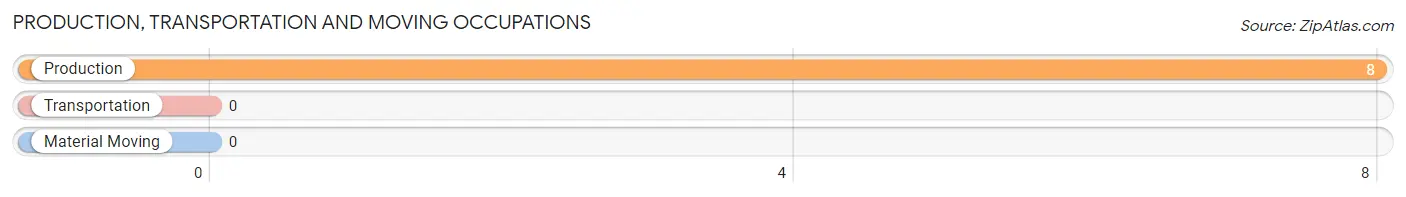
Production, Transportation and Moving Occupations by Sex
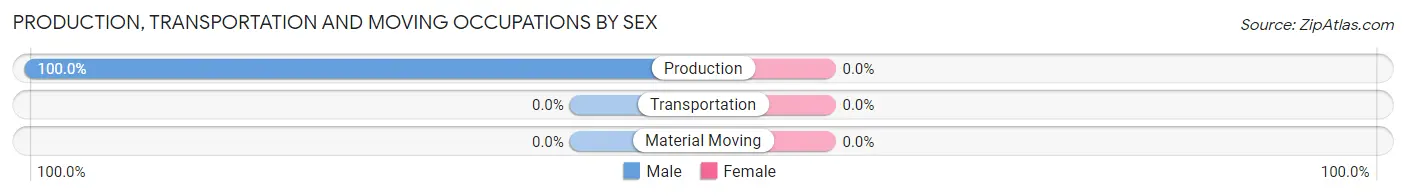
| Occupation | Male | Female |
| Production | 8 (100.0%) | 0 (0.0%) |
| Transportation | 0 (0.0%) | 0 (0.0%) |
| Material Moving | 0 (0.0%) | 0 (0.0%) |
| Total (Category) | 8 (100.0%) | 0 (0.0%) |
| Total (Overall) | 14 (50.0%) | 14 (50.0%) |
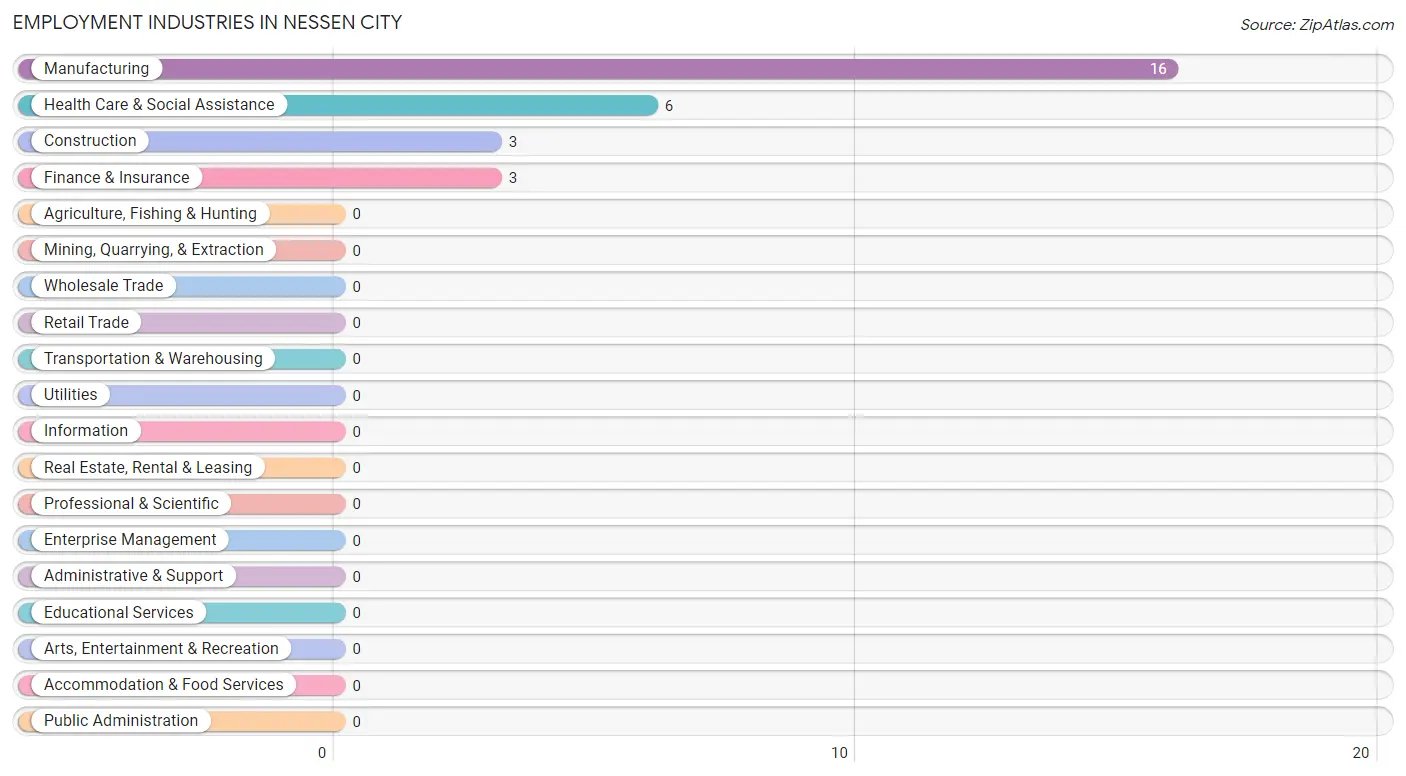
Employment Industries by Sex in Nessen City
Employment Industries in Nessen City
The major employment industries in Nessen City include Manufacturing (16 | 57.1%), Health Care & Social Assistance (6 | 21.4%), Construction (3 | 10.7%), and Finance & Insurance (3 | 10.7%).
Employment Industries by Sex in Nessen City
The Nessen City industries that see more men than women are Construction (100.0%), and Manufacturing (68.8%), whereas the industries that tend to have a higher number of women are Finance & Insurance (100.0%), Health Care & Social Assistance (100.0%), and Manufacturing (31.2%).
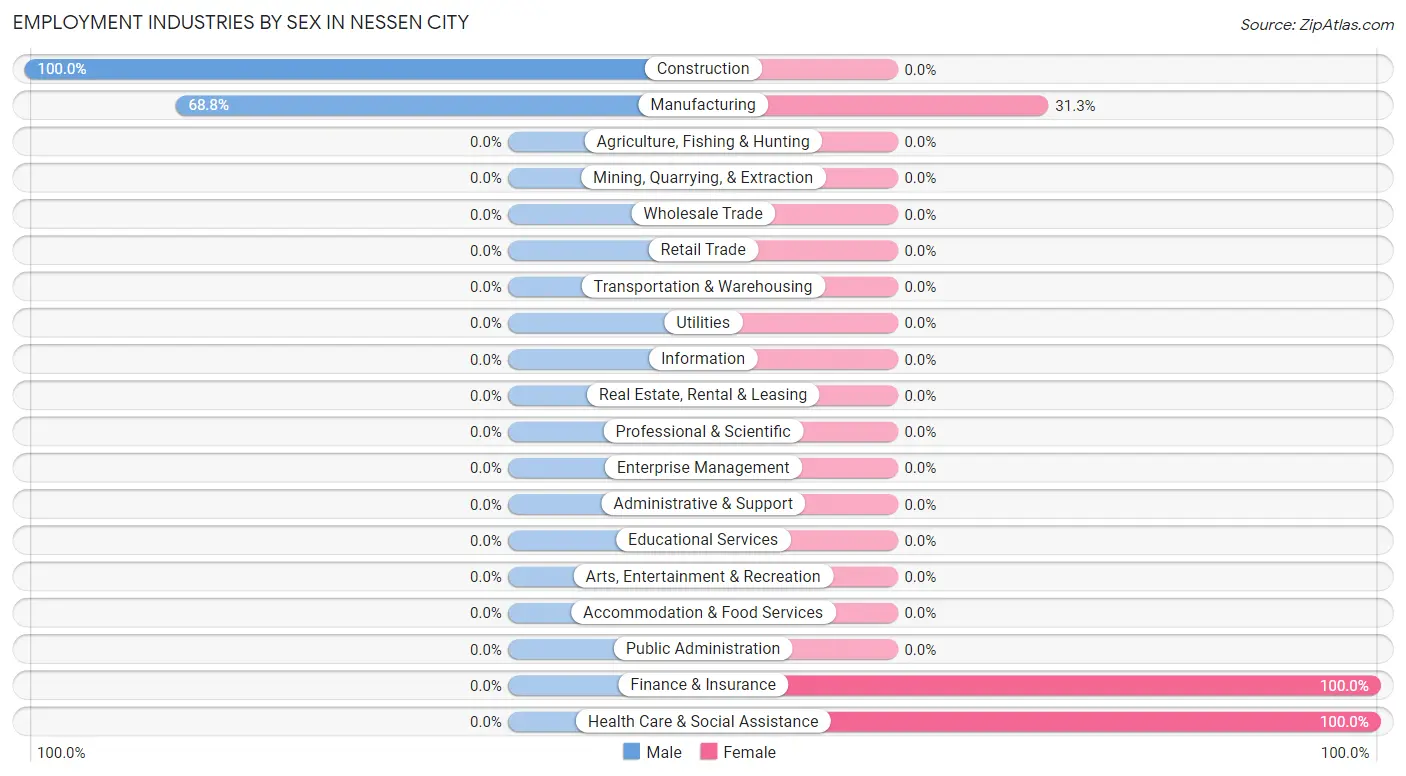
| Industry | Male | Female |
| Agriculture, Fishing & Hunting | 0 (0.0%) | 0 (0.0%) |
| Mining, Quarrying, & Extraction | 0 (0.0%) | 0 (0.0%) |
| Construction | 3 (100.0%) | 0 (0.0%) |
| Manufacturing | 11 (68.8%) | 5 (31.2%) |
| Wholesale Trade | 0 (0.0%) | 0 (0.0%) |
| Retail Trade | 0 (0.0%) | 0 (0.0%) |
| Transportation & Warehousing | 0 (0.0%) | 0 (0.0%) |
| Utilities | 0 (0.0%) | 0 (0.0%) |
| Information | 0 (0.0%) | 0 (0.0%) |
| Finance & Insurance | 0 (0.0%) | 3 (100.0%) |
| Real Estate, Rental & Leasing | 0 (0.0%) | 0 (0.0%) |
| Professional & Scientific | 0 (0.0%) | 0 (0.0%) |
| Enterprise Management | 0 (0.0%) | 0 (0.0%) |
| Administrative & Support | 0 (0.0%) | 0 (0.0%) |
| Educational Services | 0 (0.0%) | 0 (0.0%) |
| Health Care & Social Assistance | 0 (0.0%) | 6 (100.0%) |
| Arts, Entertainment & Recreation | 0 (0.0%) | 0 (0.0%) |
| Accommodation & Food Services | 0 (0.0%) | 0 (0.0%) |
| Public Administration | 0 (0.0%) | 0 (0.0%) |
| Total | 14 (50.0%) | 14 (50.0%) |
Education in Nessen City
School Enrollment in Nessen City
The most common levels of schooling among the 13 students in Nessen City are high school (7 | 53.8%), and middle school (6 | 46.2%).
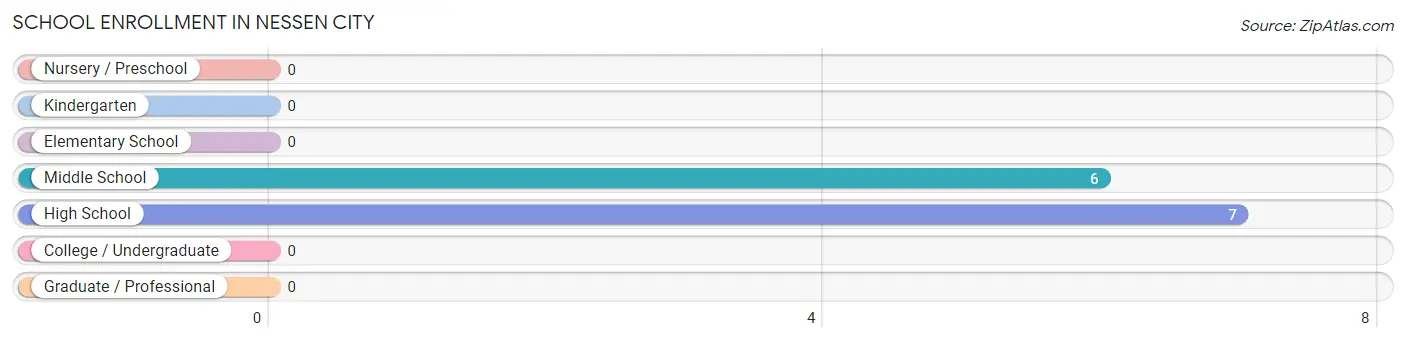
| School Level | # Students | % Students |
| Nursery / Preschool | 0 | 0.0% |
| Kindergarten | 0 | 0.0% |
| Elementary School | 0 | 0.0% |
| Middle School | 6 | 46.2% |
| High School | 7 | 53.8% |
| College / Undergraduate | 0 | 0.0% |
| Graduate / Professional | 0 | 0.0% |
| Total | 13 | 100.0% |
School Enrollment by Age by Funding Source in Nessen City
Out of a total of 13 students who are enrolled in schools in Nessen City, 3 (23.1%) attend a private institution, while the remaining 10 (76.9%) are enrolled in public schools. The age group of 15 to 17 year olds has the highest likelihood of being enrolled in private schools, with 3 (27.3% in the age bracket) enrolled. Conversely, the age group of 10 to 14 year olds has the lowest likelihood of being enrolled in a private school, with 2 (100.0% in the age bracket) attending a public institution.
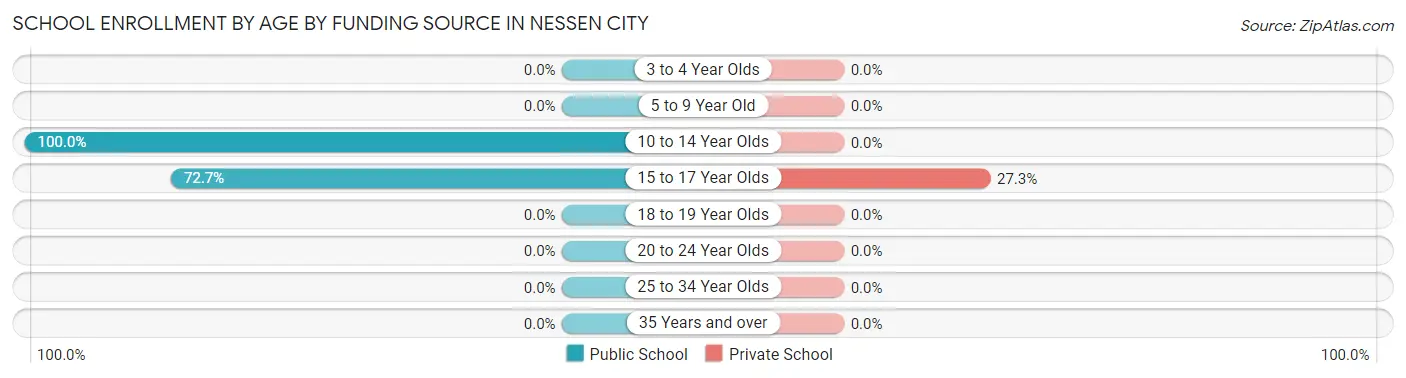
| Age Bracket | Public School | Private School |
| 3 to 4 Year Olds | 0 (0.0%) | 0 (0.0%) |
| 5 to 9 Year Old | 0 (0.0%) | 0 (0.0%) |
| 10 to 14 Year Olds | 2 (100.0%) | 0 (0.0%) |
| 15 to 17 Year Olds | 8 (72.7%) | 3 (27.3%) |
| 18 to 19 Year Olds | 0 (0.0%) | 0 (0.0%) |
| 20 to 24 Year Olds | 0 (0.0%) | 0 (0.0%) |
| 25 to 34 Year Olds | 0 (0.0%) | 0 (0.0%) |
| 35 Years and over | 0 (0.0%) | 0 (0.0%) |
| Total | 10 (76.9%) | 3 (23.1%) |
Educational Attainment by Field of Study in Nessen City
Psychology (5 | 31.2%), bio, nature & agricultural (4 | 25.0%), physical & health sciences (4 | 25.0%), and business (3 | 18.8%) are the most common fields of study among 16 individuals in Nessen City who have obtained a bachelor's degree or higher.
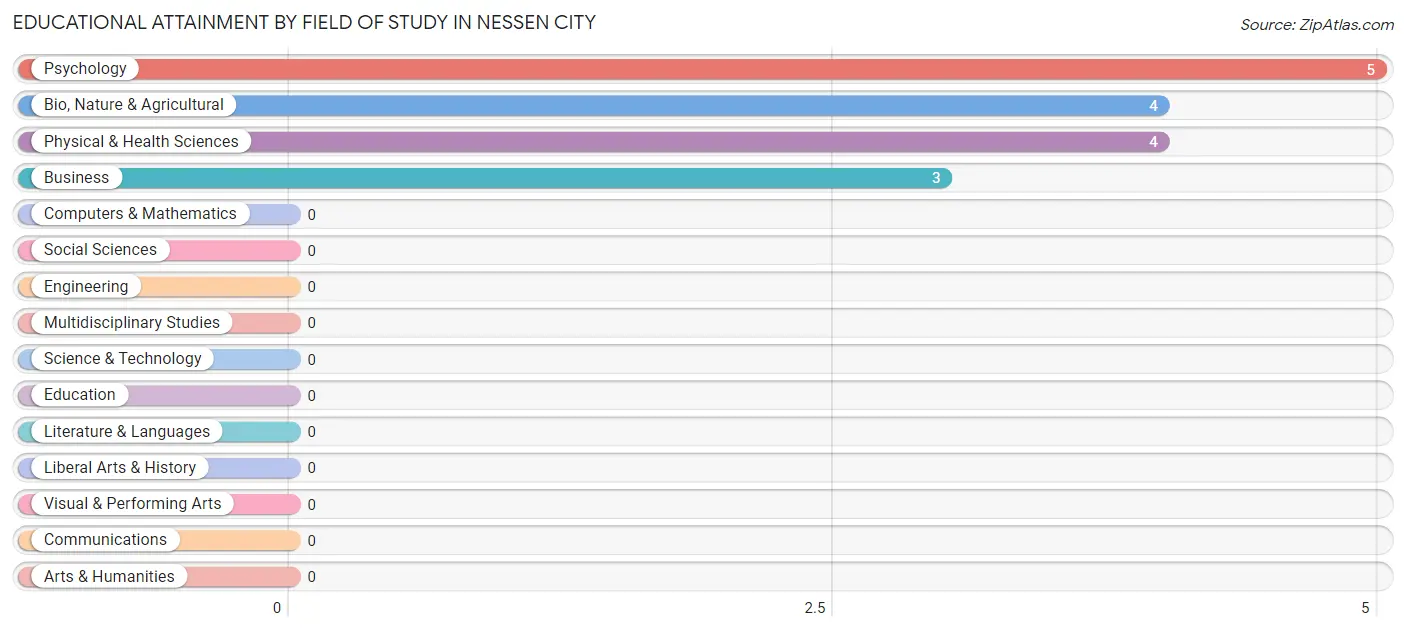
| Field of Study | # Graduates | % Graduates |
| Computers & Mathematics | 0 | 0.0% |
| Bio, Nature & Agricultural | 4 | 25.0% |
| Physical & Health Sciences | 4 | 25.0% |
| Psychology | 5 | 31.2% |
| Social Sciences | 0 | 0.0% |
| Engineering | 0 | 0.0% |
| Multidisciplinary Studies | 0 | 0.0% |
| Science & Technology | 0 | 0.0% |
| Business | 3 | 18.8% |
| Education | 0 | 0.0% |
| Literature & Languages | 0 | 0.0% |
| Liberal Arts & History | 0 | 0.0% |
| Visual & Performing Arts | 0 | 0.0% |
| Communications | 0 | 0.0% |
| Arts & Humanities | 0 | 0.0% |
| Total | 16 | 100.0% |
Transportation & Commute in Nessen City
Vehicle Availability by Sex in Nessen City
The most prevalent vehicle ownership categories in Nessen City are males with 5 or more vehicles (7, accounting for 50.0%) and females with 5 or more vehicles (2, making up 50.0%).
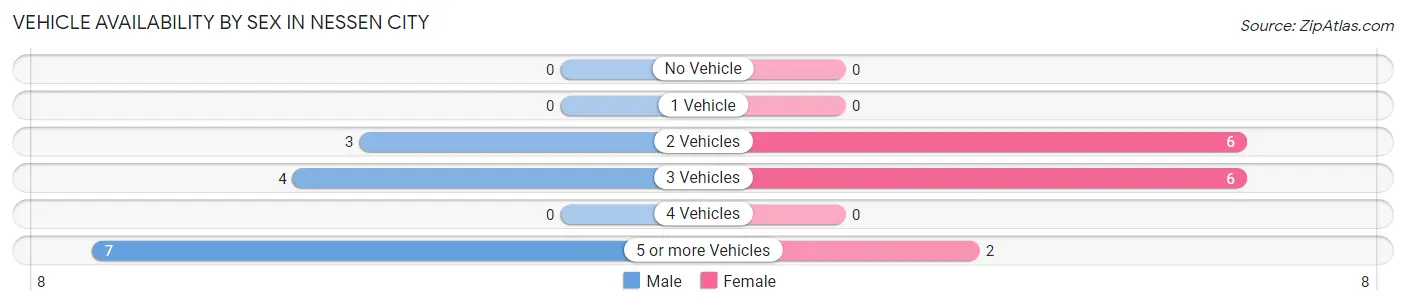
| Vehicles Available | Male | Female |
| No Vehicle | 0 (0.0%) | 0 (0.0%) |
| 1 Vehicle | 0 (0.0%) | 0 (0.0%) |
| 2 Vehicles | 3 (21.4%) | 6 (42.9%) |
| 3 Vehicles | 4 (28.6%) | 6 (42.9%) |
| 4 Vehicles | 0 (0.0%) | 0 (0.0%) |
| 5 or more Vehicles | 7 (50.0%) | 2 (14.3%) |
| Total | 14 (100.0%) | 14 (100.0%) |
Commute Time in Nessen City
The most frequently occuring commute durations in Nessen City are 30 to 34 minutes (15 commuters, 53.6%), 45 to 59 minutes (5 commuters, 17.9%), and 15 to 19 minutes (4 commuters, 14.3%).
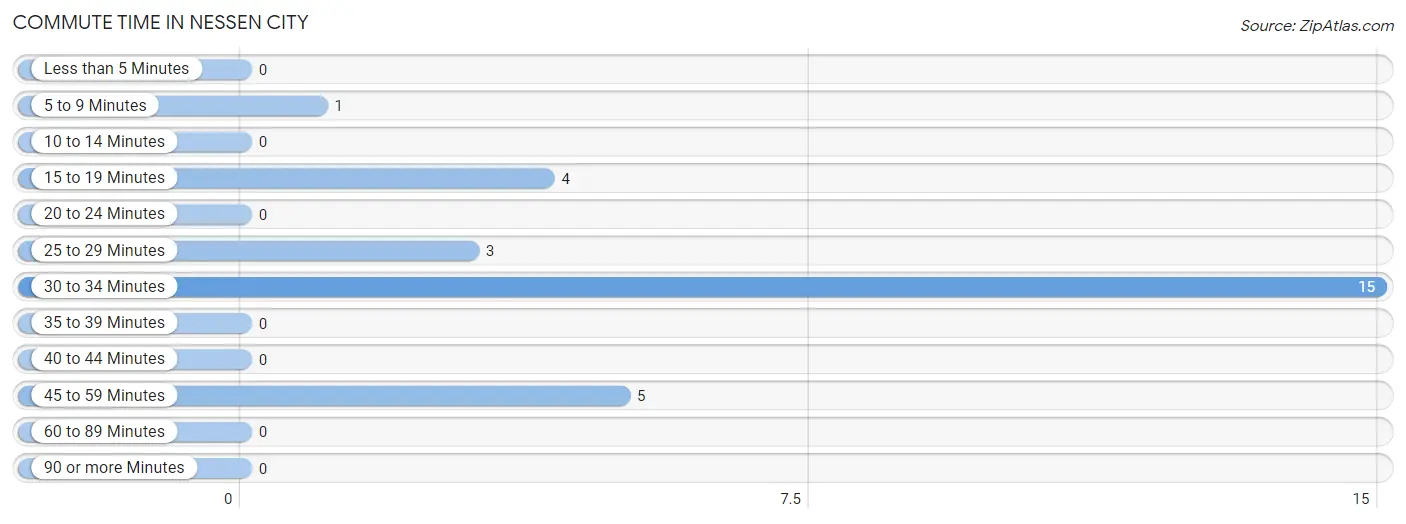
| Commute Time | # Commuters | % Commuters |
| Less than 5 Minutes | 0 | 0.0% |
| 5 to 9 Minutes | 1 | 3.6% |
| 10 to 14 Minutes | 0 | 0.0% |
| 15 to 19 Minutes | 4 | 14.3% |
| 20 to 24 Minutes | 0 | 0.0% |
| 25 to 29 Minutes | 3 | 10.7% |
| 30 to 34 Minutes | 15 | 53.6% |
| 35 to 39 Minutes | 0 | 0.0% |
| 40 to 44 Minutes | 0 | 0.0% |
| 45 to 59 Minutes | 5 | 17.9% |
| 60 to 89 Minutes | 0 | 0.0% |
| 90 or more Minutes | 0 | 0.0% |
Commute Time by Sex in Nessen City
The most common commute times in Nessen City are 30 to 34 minutes (10 commuters, 71.4%) for males and 30 to 34 minutes (5 commuters, 35.7%) for females.
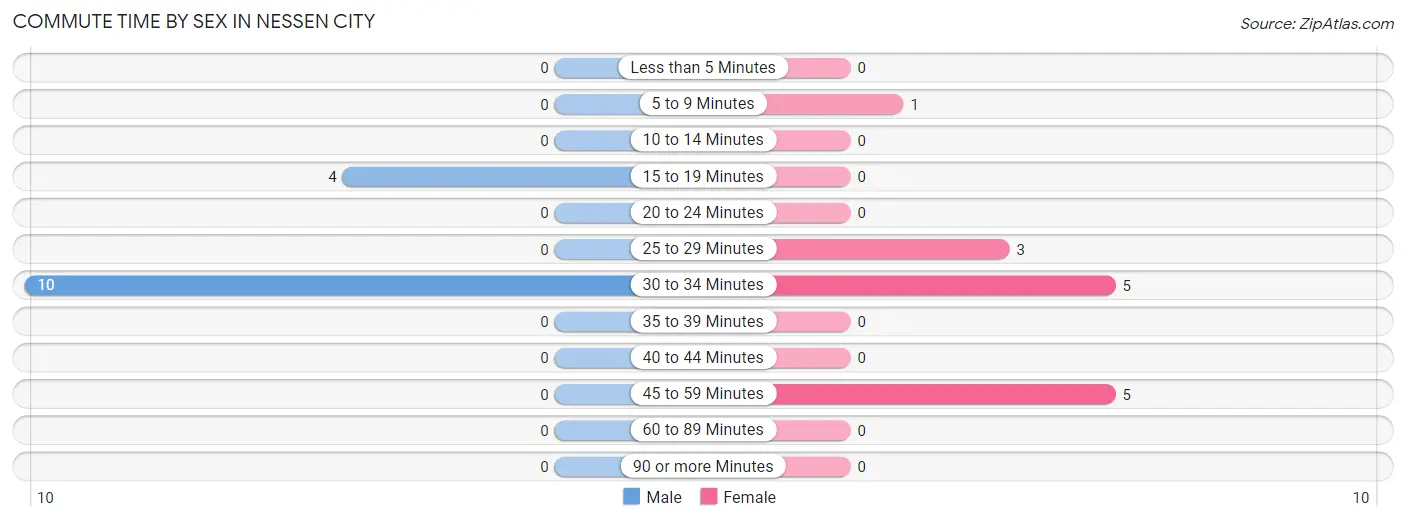
| Commute Time | Male | Female |
| Less than 5 Minutes | 0 (0.0%) | 0 (0.0%) |
| 5 to 9 Minutes | 0 (0.0%) | 1 (7.1%) |
| 10 to 14 Minutes | 0 (0.0%) | 0 (0.0%) |
| 15 to 19 Minutes | 4 (28.6%) | 0 (0.0%) |
| 20 to 24 Minutes | 0 (0.0%) | 0 (0.0%) |
| 25 to 29 Minutes | 0 (0.0%) | 3 (21.4%) |
| 30 to 34 Minutes | 10 (71.4%) | 5 (35.7%) |
| 35 to 39 Minutes | 0 (0.0%) | 0 (0.0%) |
| 40 to 44 Minutes | 0 (0.0%) | 0 (0.0%) |
| 45 to 59 Minutes | 0 (0.0%) | 5 (35.7%) |
| 60 to 89 Minutes | 0 (0.0%) | 0 (0.0%) |
| 90 or more Minutes | 0 (0.0%) | 0 (0.0%) |
Time of Departure to Work by Sex in Nessen City
The most frequent times of departure to work in Nessen City are 5:00 AM to 5:29 AM (10, 71.4%) for males and 7:00 AM to 7:29 AM (5, 35.7%) for females.
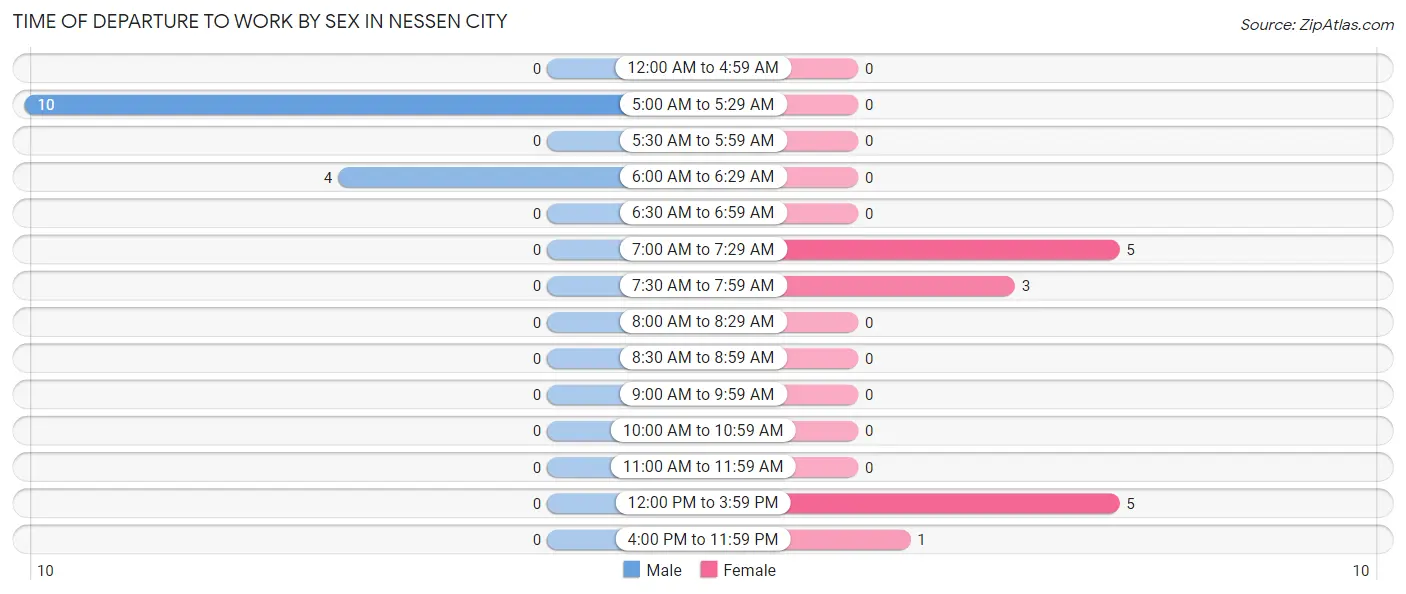
| Time of Departure | Male | Female |
| 12:00 AM to 4:59 AM | 0 (0.0%) | 0 (0.0%) |
| 5:00 AM to 5:29 AM | 10 (71.4%) | 0 (0.0%) |
| 5:30 AM to 5:59 AM | 0 (0.0%) | 0 (0.0%) |
| 6:00 AM to 6:29 AM | 4 (28.6%) | 0 (0.0%) |
| 6:30 AM to 6:59 AM | 0 (0.0%) | 0 (0.0%) |
| 7:00 AM to 7:29 AM | 0 (0.0%) | 5 (35.7%) |
| 7:30 AM to 7:59 AM | 0 (0.0%) | 3 (21.4%) |
| 8:00 AM to 8:29 AM | 0 (0.0%) | 0 (0.0%) |
| 8:30 AM to 8:59 AM | 0 (0.0%) | 0 (0.0%) |
| 9:00 AM to 9:59 AM | 0 (0.0%) | 0 (0.0%) |
| 10:00 AM to 10:59 AM | 0 (0.0%) | 0 (0.0%) |
| 11:00 AM to 11:59 AM | 0 (0.0%) | 0 (0.0%) |
| 12:00 PM to 3:59 PM | 0 (0.0%) | 5 (35.7%) |
| 4:00 PM to 11:59 PM | 0 (0.0%) | 1 (7.1%) |
| Total | 14 (100.0%) | 14 (100.0%) |
Housing Occupancy in Nessen City
Occupancy by Ownership in Nessen City
Of the total 28 dwellings in Nessen City, owner-occupied units account for 25 (89.3%), while renter-occupied units make up 3 (10.7%).
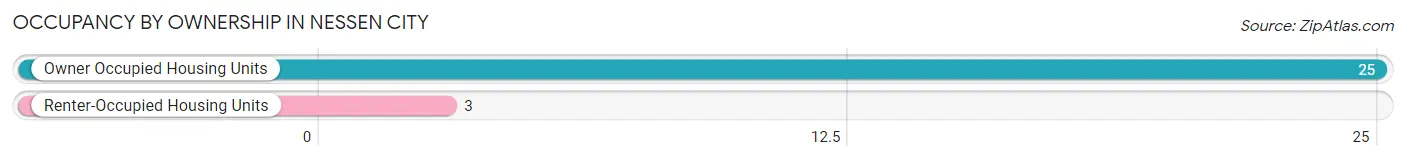
| Occupancy | # Housing Units | % Housing Units |
| Owner Occupied Housing Units | 25 | 89.3% |
| Renter-Occupied Housing Units | 3 | 10.7% |
| Total Occupied Housing Units | 28 | 100.0% |
Occupancy by Household Size in Nessen City
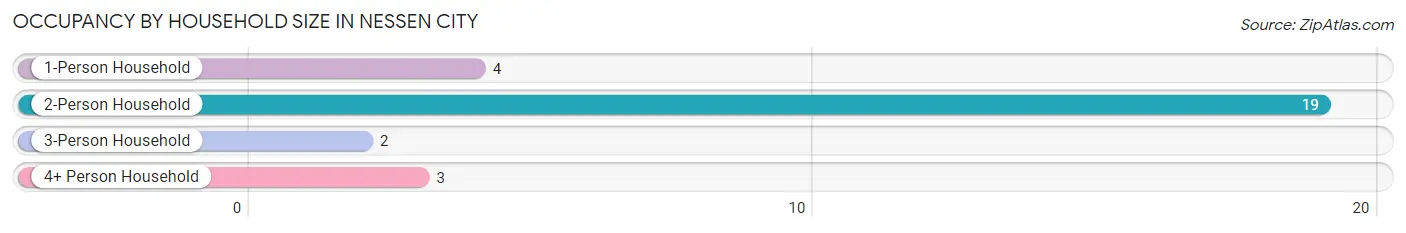
| Household Size | # Housing Units | % Housing Units |
| 1-Person Household | 4 | 14.3% |
| 2-Person Household | 19 | 67.9% |
| 3-Person Household | 2 | 7.1% |
| 4+ Person Household | 3 | 10.7% |
| Total Housing Units | 28 | 100.0% |
Occupancy by Ownership by Household Size in Nessen City
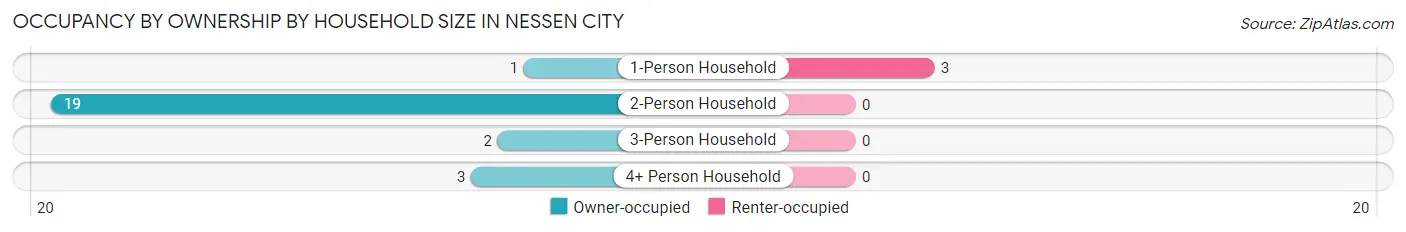
| Household Size | Owner-occupied | Renter-occupied |
| 1-Person Household | 1 (25.0%) | 3 (75.0%) |
| 2-Person Household | 19 (100.0%) | 0 (0.0%) |
| 3-Person Household | 2 (100.0%) | 0 (0.0%) |
| 4+ Person Household | 3 (100.0%) | 0 (0.0%) |
| Total Housing Units | 25 (89.3%) | 3 (10.7%) |
Occupancy by Educational Attainment in Nessen City
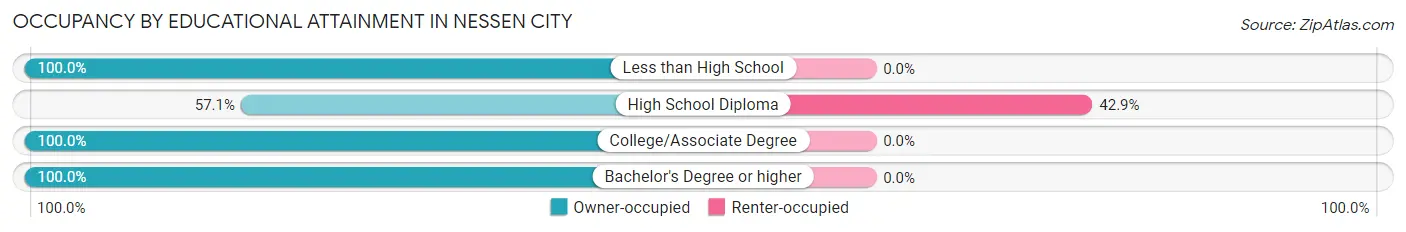
| Household Size | Owner-occupied | Renter-occupied |
| Less than High School | 2 (100.0%) | 0 (0.0%) |
| High School Diploma | 4 (57.1%) | 3 (42.9%) |
| College/Associate Degree | 11 (100.0%) | 0 (0.0%) |
| Bachelor's Degree or higher | 8 (100.0%) | 0 (0.0%) |
Occupancy by Age of Householder in Nessen City
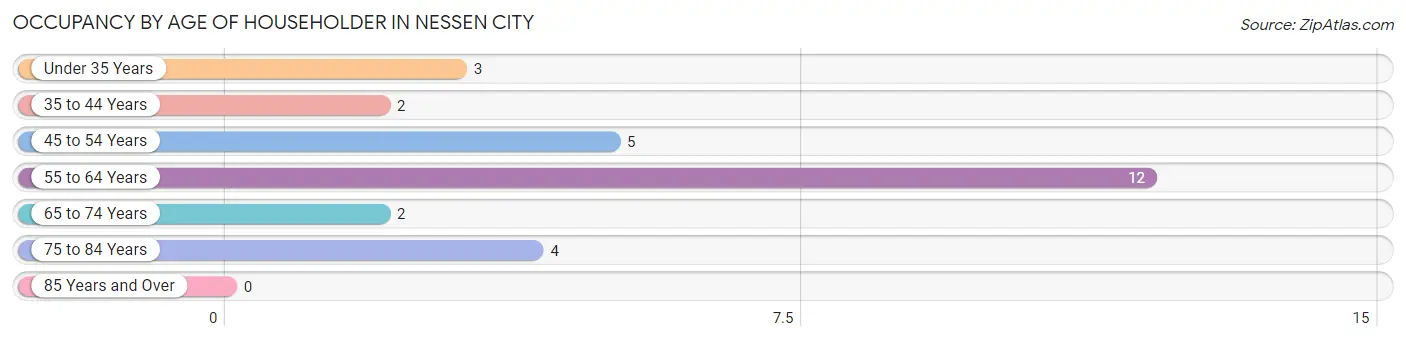
| Age Bracket | # Households | % Households |
| Under 35 Years | 3 | 10.7% |
| 35 to 44 Years | 2 | 7.1% |
| 45 to 54 Years | 5 | 17.9% |
| 55 to 64 Years | 12 | 42.9% |
| 65 to 74 Years | 2 | 7.1% |
| 75 to 84 Years | 4 | 14.3% |
| 85 Years and Over | 0 | 0.0% |
| Total | 28 | 100.0% |
Housing Finances in Nessen City
Median Income by Occupancy in Nessen City
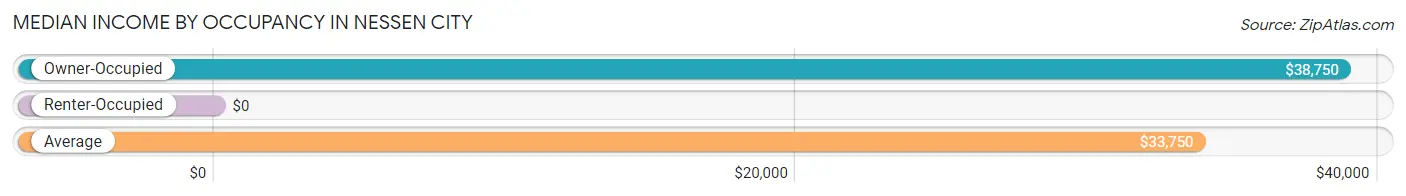
| Occupancy Type | # Households | Median Income |
| Owner-Occupied | 25 (89.3%) | $38,750 |
| Renter-Occupied | 3 (10.7%) | $0 |
| Average | 28 (100.0%) | $33,750 |
Occupancy by Householder Income Bracket in Nessen City
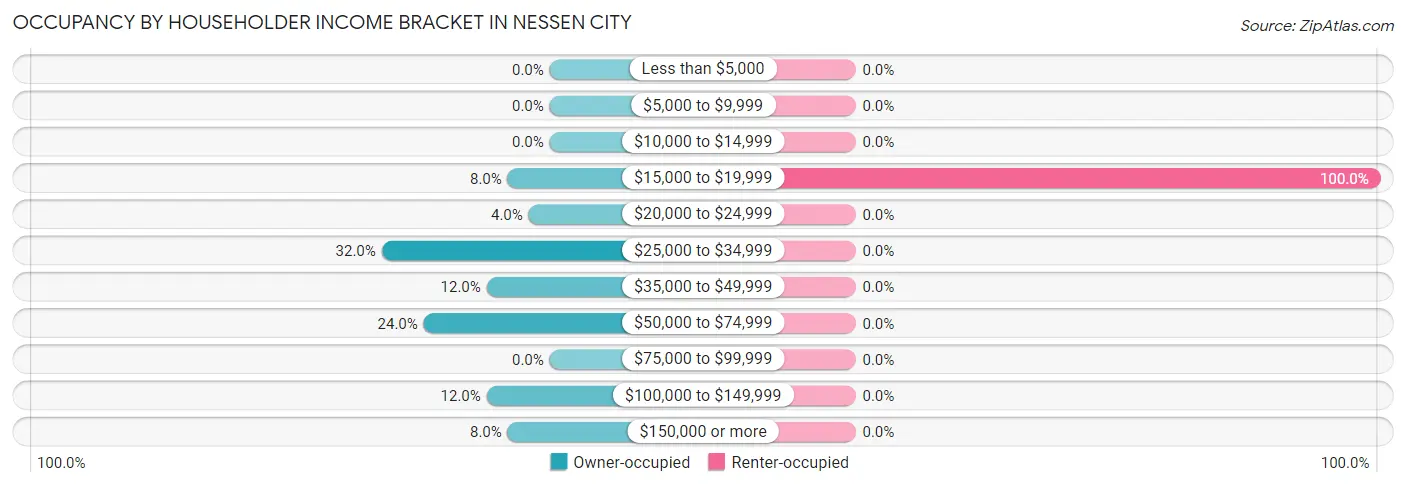
| Income Bracket | Owner-occupied | Renter-occupied |
| Less than $5,000 | 0 (0.0%) | 0 (0.0%) |
| $5,000 to $9,999 | 0 (0.0%) | 0 (0.0%) |
| $10,000 to $14,999 | 0 (0.0%) | 0 (0.0%) |
| $15,000 to $19,999 | 2 (8.0%) | 3 (100.0%) |
| $20,000 to $24,999 | 1 (4.0%) | 0 (0.0%) |
| $25,000 to $34,999 | 8 (32.0%) | 0 (0.0%) |
| $35,000 to $49,999 | 3 (12.0%) | 0 (0.0%) |
| $50,000 to $74,999 | 6 (24.0%) | 0 (0.0%) |
| $75,000 to $99,999 | 0 (0.0%) | 0 (0.0%) |
| $100,000 to $149,999 | 3 (12.0%) | 0 (0.0%) |
| $150,000 or more | 2 (8.0%) | 0 (0.0%) |
| Total | 25 (100.0%) | 3 (100.0%) |
Monthly Housing Cost Tiers in Nessen City
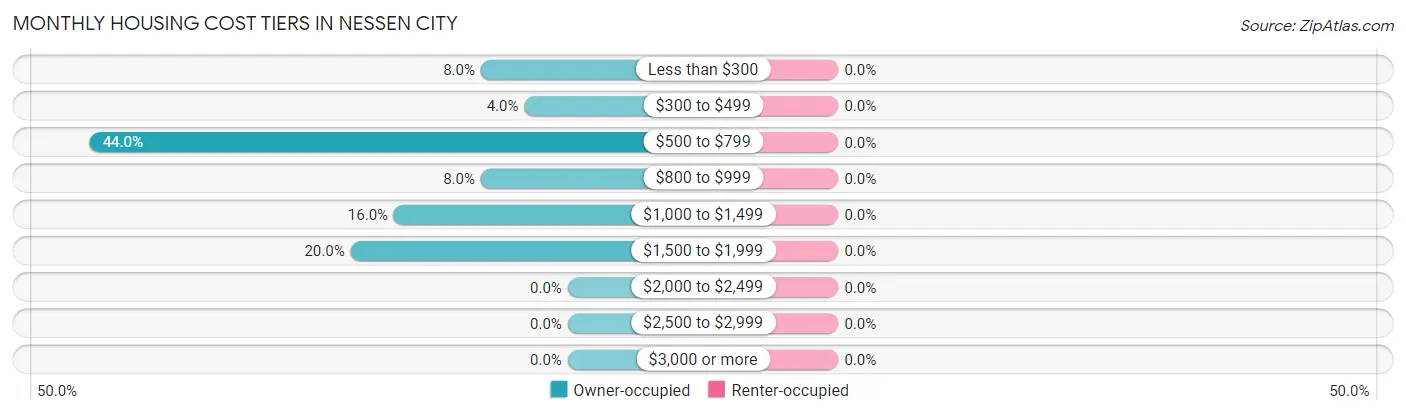
| Monthly Cost | Owner-occupied | Renter-occupied |
| Less than $300 | 2 (8.0%) | 0 (0.0%) |
| $300 to $499 | 1 (4.0%) | 0 (0.0%) |
| $500 to $799 | 11 (44.0%) | 0 (0.0%) |
| $800 to $999 | 2 (8.0%) | 0 (0.0%) |
| $1,000 to $1,499 | 4 (16.0%) | 0 (0.0%) |
| $1,500 to $1,999 | 5 (20.0%) | 0 (0.0%) |
| $2,000 to $2,499 | 0 (0.0%) | 0 (0.0%) |
| $2,500 to $2,999 | 0 (0.0%) | 0 (0.0%) |
| $3,000 or more | 0 (0.0%) | 0 (0.0%) |
| Total | 25 (100.0%) | 3 (100.0%) |
Physical Housing Characteristics in Nessen City
Housing Structures in Nessen City
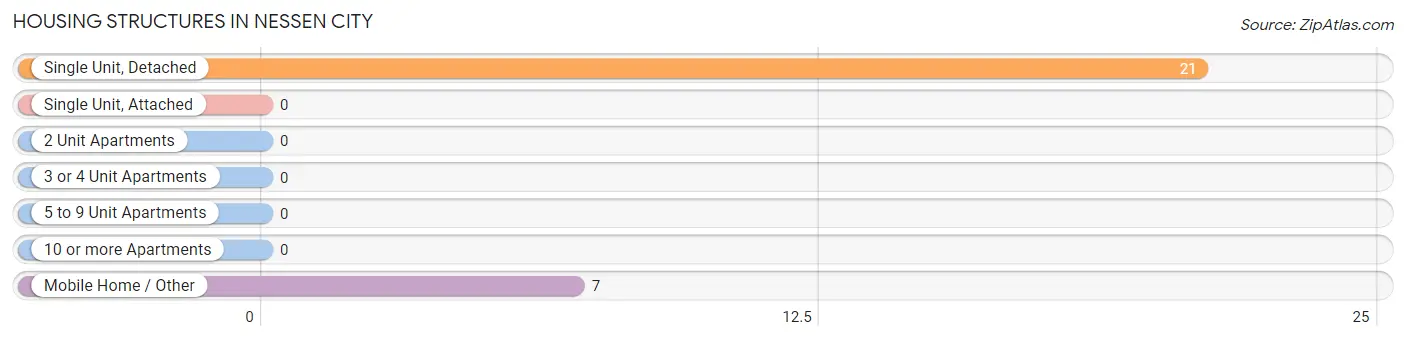
| Structure Type | # Housing Units | % Housing Units |
| Single Unit, Detached | 21 | 75.0% |
| Single Unit, Attached | 0 | 0.0% |
| 2 Unit Apartments | 0 | 0.0% |
| 3 or 4 Unit Apartments | 0 | 0.0% |
| 5 to 9 Unit Apartments | 0 | 0.0% |
| 10 or more Apartments | 0 | 0.0% |
| Mobile Home / Other | 7 | 25.0% |
| Total | 28 | 100.0% |
Housing Structures by Occupancy in Nessen City
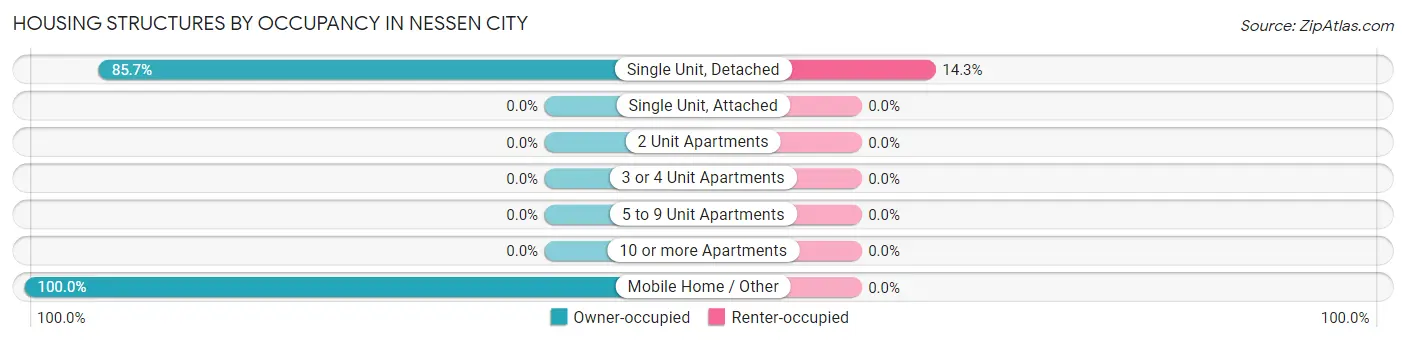
| Structure Type | Owner-occupied | Renter-occupied |
| Single Unit, Detached | 18 (85.7%) | 3 (14.3%) |
| Single Unit, Attached | 0 (0.0%) | 0 (0.0%) |
| 2 Unit Apartments | 0 (0.0%) | 0 (0.0%) |
| 3 or 4 Unit Apartments | 0 (0.0%) | 0 (0.0%) |
| 5 to 9 Unit Apartments | 0 (0.0%) | 0 (0.0%) |
| 10 or more Apartments | 0 (0.0%) | 0 (0.0%) |
| Mobile Home / Other | 7 (100.0%) | 0 (0.0%) |
| Total | 25 (89.3%) | 3 (10.7%) |
Housing Structures by Number of Rooms in Nessen City
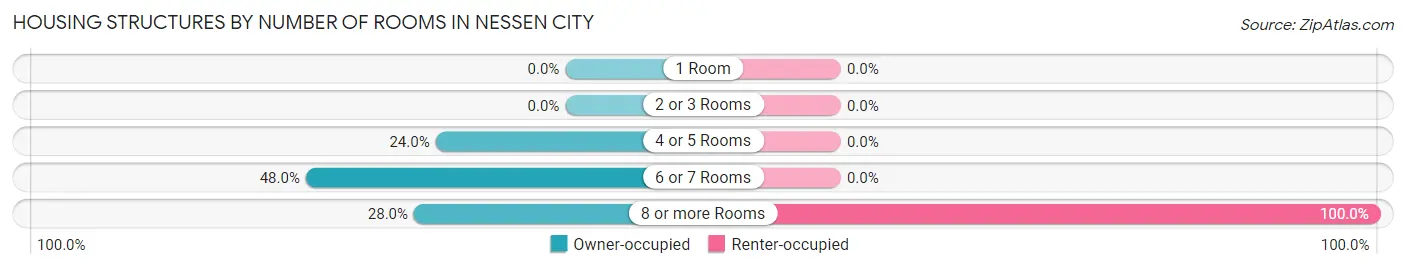
| Number of Rooms | Owner-occupied | Renter-occupied |
| 1 Room | 0 (0.0%) | 0 (0.0%) |
| 2 or 3 Rooms | 0 (0.0%) | 0 (0.0%) |
| 4 or 5 Rooms | 6 (24.0%) | 0 (0.0%) |
| 6 or 7 Rooms | 12 (48.0%) | 0 (0.0%) |
| 8 or more Rooms | 7 (28.0%) | 3 (100.0%) |
| Total | 25 (100.0%) | 3 (100.0%) |
Housing Structure by Heating Type in Nessen City
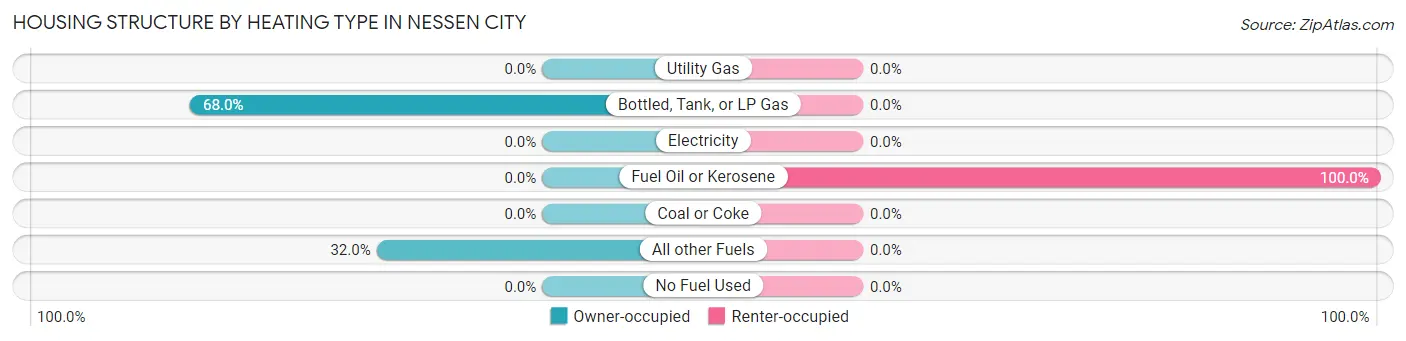
| Heating Type | Owner-occupied | Renter-occupied |
| Utility Gas | 0 (0.0%) | 0 (0.0%) |
| Bottled, Tank, or LP Gas | 17 (68.0%) | 0 (0.0%) |
| Electricity | 0 (0.0%) | 0 (0.0%) |
| Fuel Oil or Kerosene | 0 (0.0%) | 3 (100.0%) |
| Coal or Coke | 0 (0.0%) | 0 (0.0%) |
| All other Fuels | 8 (32.0%) | 0 (0.0%) |
| No Fuel Used | 0 (0.0%) | 0 (0.0%) |
| Total | 25 (100.0%) | 3 (100.0%) |
Household Vehicle Usage in Nessen City
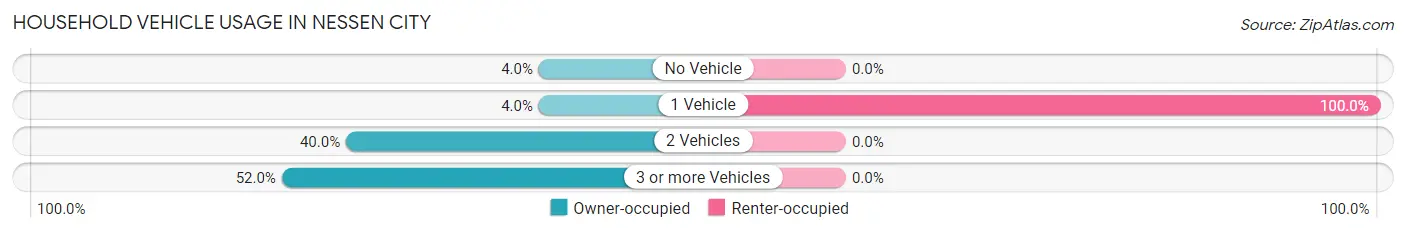
| Vehicles per Household | Owner-occupied | Renter-occupied |
| No Vehicle | 1 (4.0%) | 0 (0.0%) |
| 1 Vehicle | 1 (4.0%) | 3 (100.0%) |
| 2 Vehicles | 10 (40.0%) | 0 (0.0%) |
| 3 or more Vehicles | 13 (52.0%) | 0 (0.0%) |
| Total | 25 (100.0%) | 3 (100.0%) |
Real Estate & Mortgages in Nessen City
Real Estate and Mortgage Overview in Nessen City
| Characteristic | Without Mortgage | With Mortgage |
| Housing Units | 10 | 15 |
| Median Property Value | - | - |
| Median Household Income | $58,000 | $2 |
| Monthly Housing Costs | - | - |
| Real Estate Taxes | $10,001 | $0 |
Property Value by Mortgage Status in Nessen City
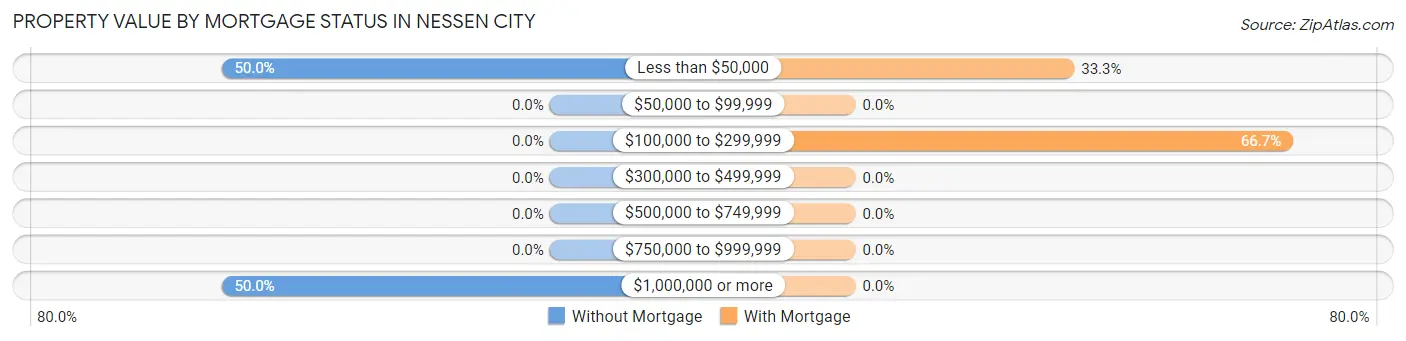
| Property Value | Without Mortgage | With Mortgage |
| Less than $50,000 | 5 (50.0%) | 5 (33.3%) |
| $50,000 to $99,999 | 0 (0.0%) | 0 (0.0%) |
| $100,000 to $299,999 | 0 (0.0%) | 10 (66.7%) |
| $300,000 to $499,999 | 0 (0.0%) | 0 (0.0%) |
| $500,000 to $749,999 | 0 (0.0%) | 0 (0.0%) |
| $750,000 to $999,999 | 0 (0.0%) | 0 (0.0%) |
| $1,000,000 or more | 5 (50.0%) | 0 (0.0%) |
| Total | 10 (100.0%) | 15 (100.0%) |
Household Income by Mortgage Status in Nessen City
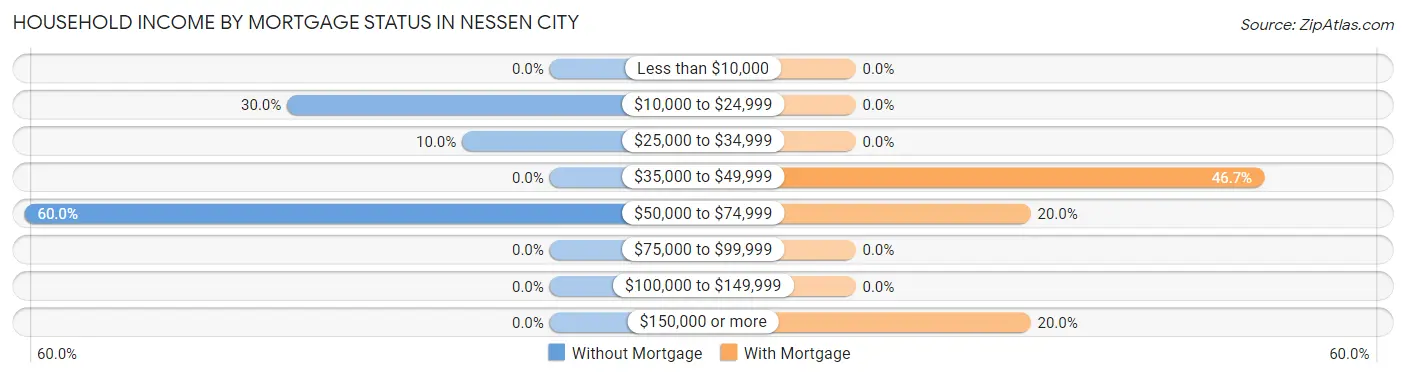
| Household Income | Without Mortgage | With Mortgage |
| Less than $10,000 | 0 (0.0%) | 0 (0.0%) |
| $10,000 to $24,999 | 3 (30.0%) | 0 (0.0%) |
| $25,000 to $34,999 | 1 (10.0%) | 0 (0.0%) |
| $35,000 to $49,999 | 0 (0.0%) | 7 (46.7%) |
| $50,000 to $74,999 | 6 (60.0%) | 3 (20.0%) |
| $75,000 to $99,999 | 0 (0.0%) | 0 (0.0%) |
| $100,000 to $149,999 | 0 (0.0%) | 0 (0.0%) |
| $150,000 or more | 0 (0.0%) | 3 (20.0%) |
| Total | 10 (100.0%) | 15 (100.0%) |
Property Value to Household Income Ratio in Nessen City
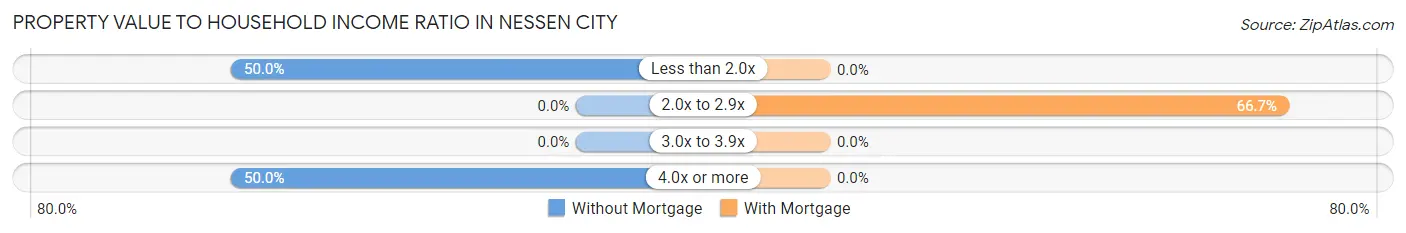
| Value-to-Income Ratio | Without Mortgage | With Mortgage |
| Less than 2.0x | 5 (50.0%) | 0 (0.0%) |
| 2.0x to 2.9x | 0 (0.0%) | 10 (66.7%) |
| 3.0x to 3.9x | 0 (0.0%) | 0 (0.0%) |
| 4.0x or more | 5 (50.0%) | 0 (0.0%) |
| Total | 10 (100.0%) | 15 (100.0%) |
Real Estate Taxes by Mortgage Status in Nessen City
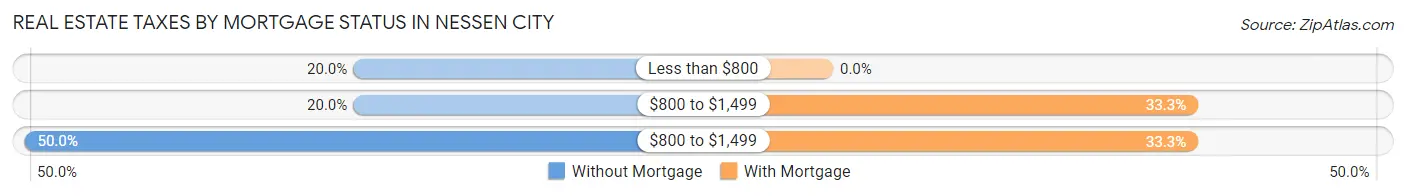
| Property Taxes | Without Mortgage | With Mortgage |
| Less than $800 | 2 (20.0%) | 0 (0.0%) |
| $800 to $1,499 | 2 (20.0%) | 5 (33.3%) |
| $800 to $1,499 | 5 (50.0%) | 5 (33.3%) |
| Total | 10 (100.0%) | 15 (100.0%) |
Health & Disability in Nessen City
Health Insurance Coverage by Age in Nessen City
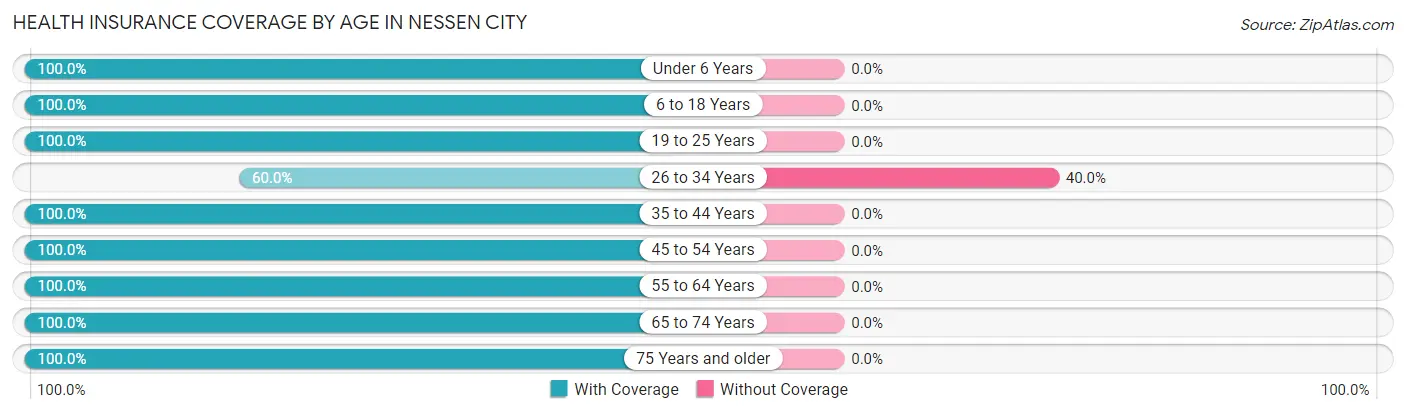
| Age Bracket | With Coverage | Without Coverage |
| Under 6 Years | 2 (100.0%) | 0 (0.0%) |
| 6 to 18 Years | 13 (100.0%) | 0 (0.0%) |
| 19 to 25 Years | 5 (100.0%) | 0 (0.0%) |
| 26 to 34 Years | 6 (60.0%) | 4 (40.0%) |
| 35 to 44 Years | 2 (100.0%) | 0 (0.0%) |
| 45 to 54 Years | 12 (100.0%) | 0 (0.0%) |
| 55 to 64 Years | 30 (100.0%) | 0 (0.0%) |
| 65 to 74 Years | 2 (100.0%) | 0 (0.0%) |
| 75 Years and older | 14 (100.0%) | 0 (0.0%) |
| Total | 86 (95.6%) | 4 (4.4%) |
Health Insurance Coverage by Citizenship Status in Nessen City
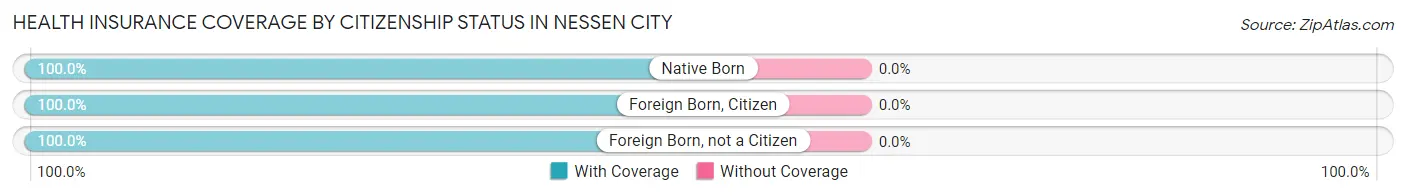
| Citizenship Status | With Coverage | Without Coverage |
| Native Born | 2 (100.0%) | 0 (0.0%) |
| Foreign Born, Citizen | 13 (100.0%) | 0 (0.0%) |
| Foreign Born, not a Citizen | 5 (100.0%) | 0 (0.0%) |
Health Insurance Coverage by Household Income in Nessen City
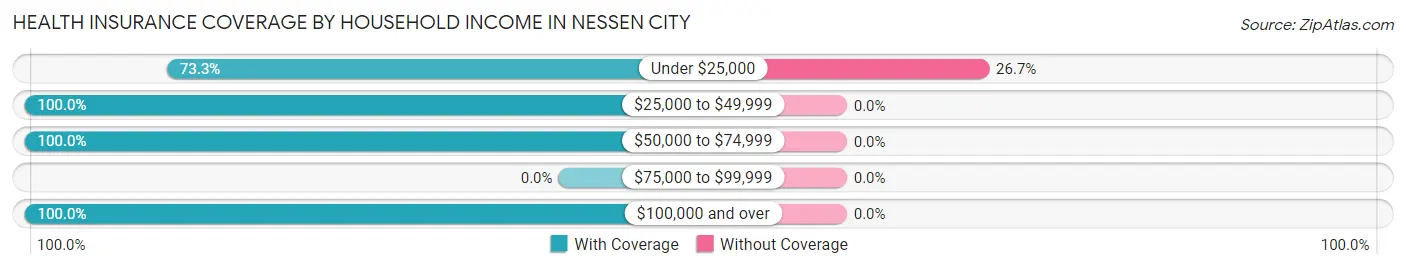
| Household Income | With Coverage | Without Coverage |
| Under $25,000 | 11 (73.3%) | 4 (26.7%) |
| $25,000 to $49,999 | 27 (100.0%) | 0 (0.0%) |
| $50,000 to $74,999 | 27 (100.0%) | 0 (0.0%) |
| $75,000 to $99,999 | 0 (0.0%) | 0 (0.0%) |
| $100,000 and over | 21 (100.0%) | 0 (0.0%) |
Public vs Private Health Insurance Coverage by Age in Nessen City
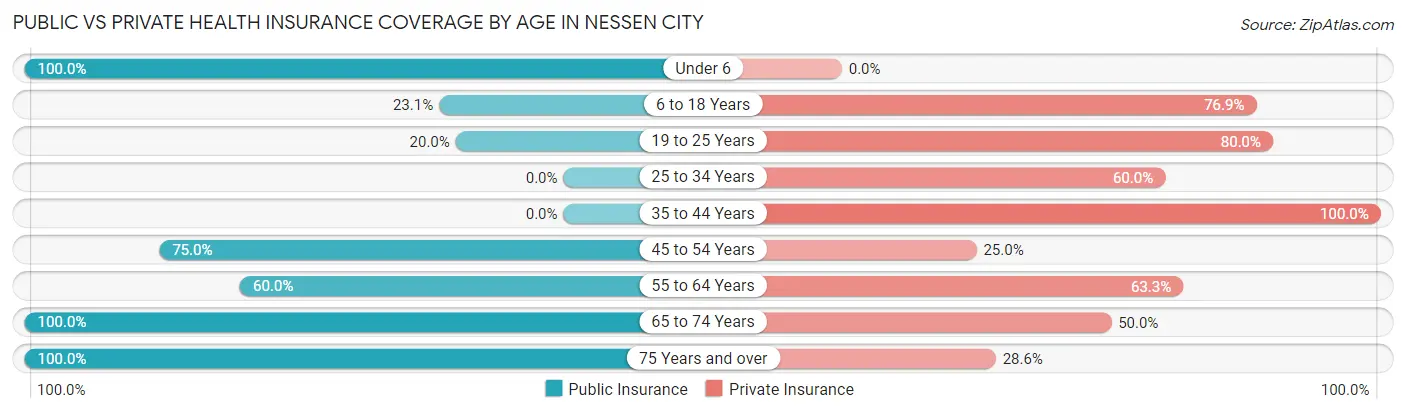
| Age Bracket | Public Insurance | Private Insurance |
| Under 6 | 2 (100.0%) | 0 (0.0%) |
| 6 to 18 Years | 3 (23.1%) | 10 (76.9%) |
| 19 to 25 Years | 1 (20.0%) | 4 (80.0%) |
| 25 to 34 Years | 0 (0.0%) | 6 (60.0%) |
| 35 to 44 Years | 0 (0.0%) | 2 (100.0%) |
| 45 to 54 Years | 9 (75.0%) | 3 (25.0%) |
| 55 to 64 Years | 18 (60.0%) | 19 (63.3%) |
| 65 to 74 Years | 2 (100.0%) | 1 (50.0%) |
| 75 Years and over | 14 (100.0%) | 4 (28.6%) |
| Total | 49 (54.4%) | 49 (54.4%) |
Disability Status by Sex by Age in Nessen City
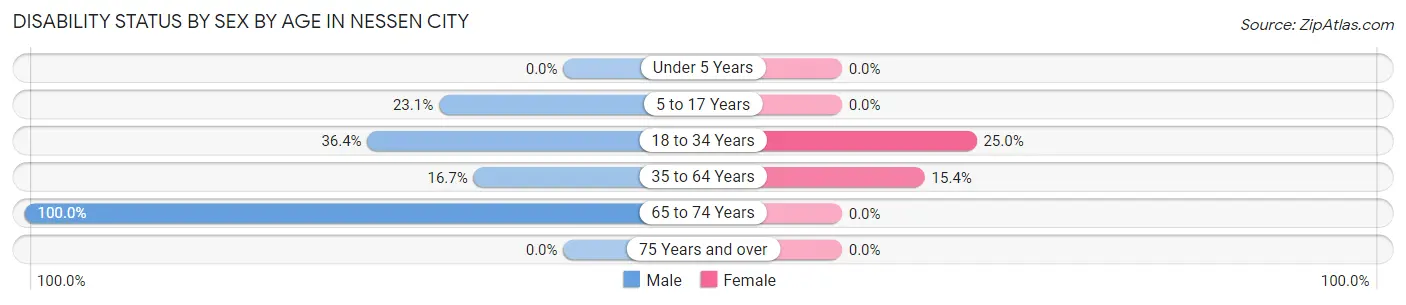
| Age Bracket | Male | Female |
| Under 5 Years | 0 (0.0%) | 0 (0.0%) |
| 5 to 17 Years | 3 (23.1%) | 0 (0.0%) |
| 18 to 34 Years | 4 (36.4%) | 1 (25.0%) |
| 35 to 64 Years | 3 (16.7%) | 4 (15.4%) |
| 65 to 74 Years | 1 (100.0%) | 0 (0.0%) |
| 75 Years and over | 0 (0.0%) | 0 (0.0%) |
Disability Class by Sex by Age in Nessen City
Disability Class: Hearing Difficulty
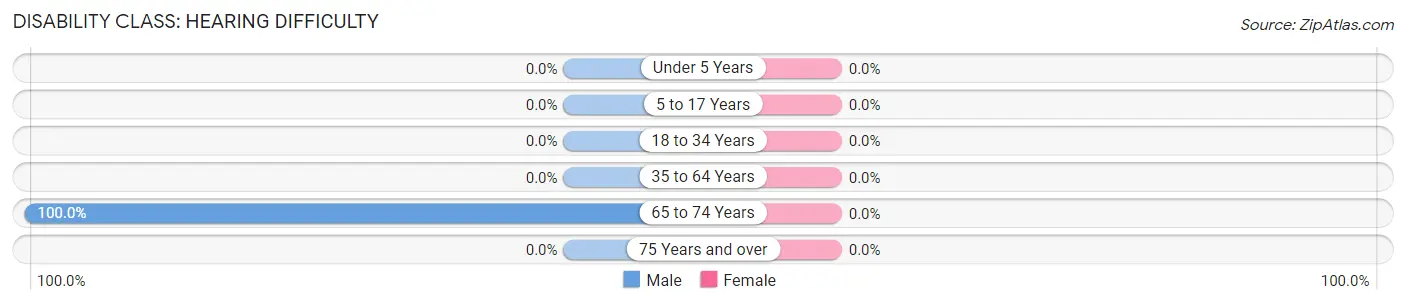
| Age Bracket | Male | Female |
| Under 5 Years | 0 (0.0%) | 0 (0.0%) |
| 5 to 17 Years | 0 (0.0%) | 0 (0.0%) |
| 18 to 34 Years | 0 (0.0%) | 0 (0.0%) |
| 35 to 64 Years | 0 (0.0%) | 0 (0.0%) |
| 65 to 74 Years | 1 (100.0%) | 0 (0.0%) |
| 75 Years and over | 0 (0.0%) | 0 (0.0%) |
Disability Class: Vision Difficulty
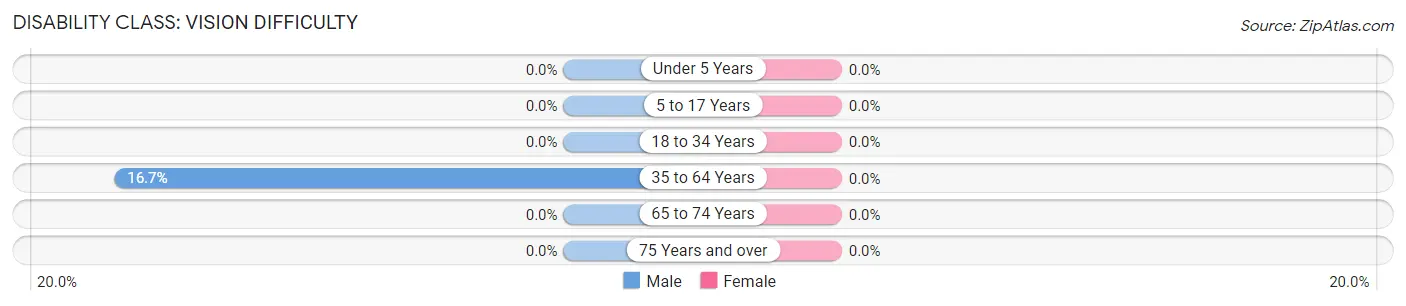
| Age Bracket | Male | Female |
| Under 5 Years | 0 (0.0%) | 0 (0.0%) |
| 5 to 17 Years | 0 (0.0%) | 0 (0.0%) |
| 18 to 34 Years | 0 (0.0%) | 0 (0.0%) |
| 35 to 64 Years | 3 (16.7%) | 0 (0.0%) |
| 65 to 74 Years | 0 (0.0%) | 0 (0.0%) |
| 75 Years and over | 0 (0.0%) | 0 (0.0%) |
Disability Class: Cognitive Difficulty
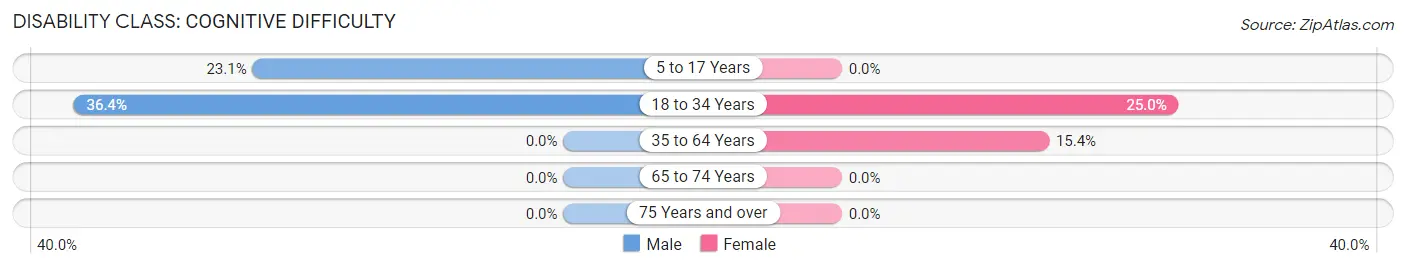
| Age Bracket | Male | Female |
| 5 to 17 Years | 3 (23.1%) | 0 (0.0%) |
| 18 to 34 Years | 4 (36.4%) | 1 (25.0%) |
| 35 to 64 Years | 0 (0.0%) | 4 (15.4%) |
| 65 to 74 Years | 0 (0.0%) | 0 (0.0%) |
| 75 Years and over | 0 (0.0%) | 0 (0.0%) |
Disability Class: Ambulatory Difficulty
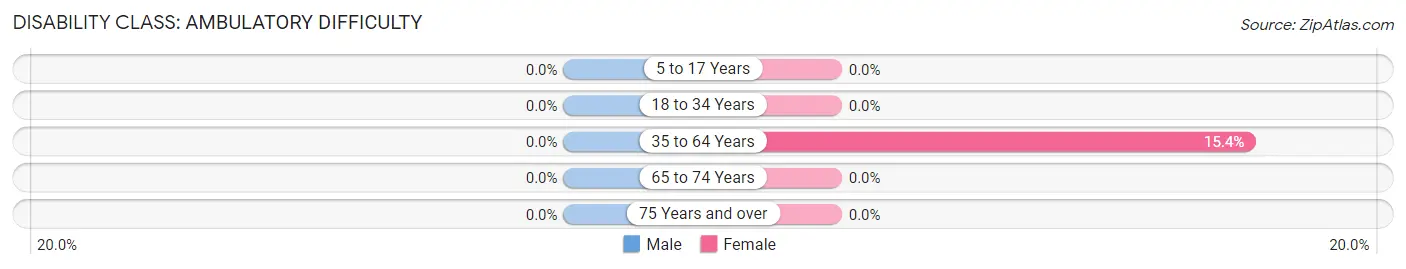
| Age Bracket | Male | Female |
| 5 to 17 Years | 0 (0.0%) | 0 (0.0%) |
| 18 to 34 Years | 0 (0.0%) | 0 (0.0%) |
| 35 to 64 Years | 0 (0.0%) | 4 (15.4%) |
| 65 to 74 Years | 0 (0.0%) | 0 (0.0%) |
| 75 Years and over | 0 (0.0%) | 0 (0.0%) |
Disability Class: Self-Care Difficulty
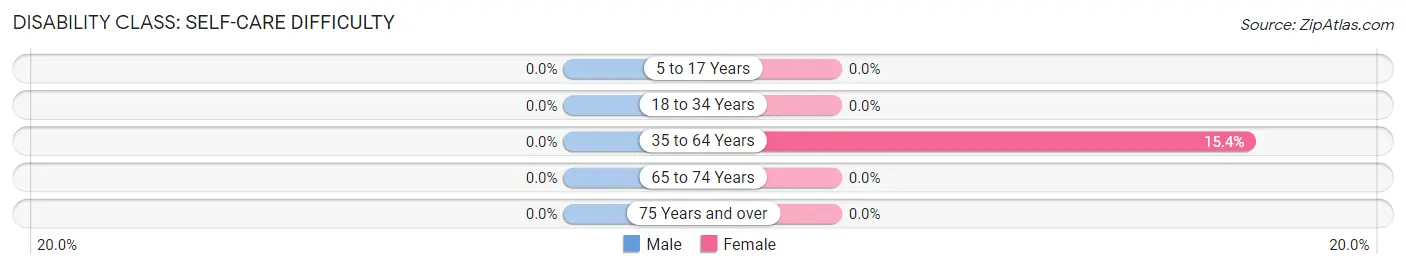
| Age Bracket | Male | Female |
| 5 to 17 Years | 0 (0.0%) | 0 (0.0%) |
| 18 to 34 Years | 0 (0.0%) | 0 (0.0%) |
| 35 to 64 Years | 0 (0.0%) | 4 (15.4%) |
| 65 to 74 Years | 0 (0.0%) | 0 (0.0%) |
| 75 Years and over | 0 (0.0%) | 0 (0.0%) |
Technology Access in Nessen City
Computing Device Access in Nessen City
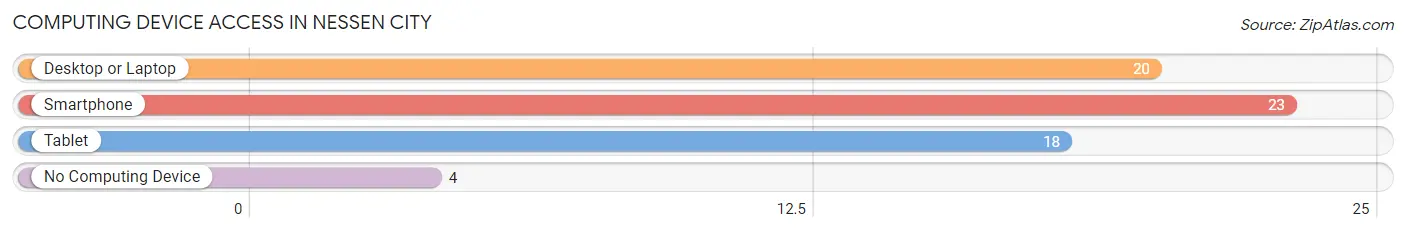
| Device Type | # Households | % Households |
| Desktop or Laptop | 20 | 71.4% |
| Smartphone | 23 | 82.1% |
| Tablet | 18 | 64.3% |
| No Computing Device | 4 | 14.3% |
| Total | 28 | 100.0% |
Internet Access in Nessen City
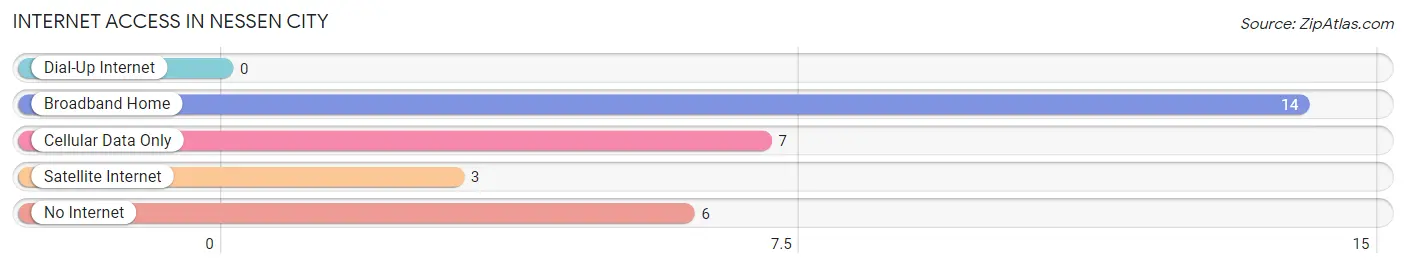
| Internet Type | # Households | % Households |
| Dial-Up Internet | 0 | 0.0% |
| Broadband Home | 14 | 50.0% |
| Cellular Data Only | 7 | 25.0% |
| Satellite Internet | 3 | 10.7% |
| No Internet | 6 | 21.4% |
| Total | 28 | 100.0% |
Nessen City Summary
Nessen City is a small city located in the state of Michigan in the United States. It is situated in the southeastern part of the state, about 25 miles from the state capital of Lansing. The city has a population of approximately 4,000 people and covers an area of about 2.5 square miles.
Nessen City is located in the heart of Michigan's Lower Peninsula, and is surrounded by the cities of Lansing, East Lansing, and Grand Rapids. The city is situated on the banks of the Grand River, which flows through the city and provides a scenic backdrop for the city's downtown area. The city is also home to several parks and recreational areas, including the Nessen City Park, which features a playground, picnic area, and walking trails.
The economy of Nessen City is largely based on manufacturing and agriculture. The city is home to several factories and industrial plants, including a paper mill, a steel mill, and a plastics plant. The city also has a thriving agricultural sector, with many local farmers growing corn, soybeans, and other crops.
The demographics of Nessen City are largely white, with a small percentage of African Americans and Hispanics. The median household income in the city is around $45,000, and the median home value is around $150,000. The city has a low unemployment rate, and the majority of the population is employed in the manufacturing and agricultural sectors.
Nessen City is served by several public schools, including Nessen City High School, Nessen City Middle School, and Nessen City Elementary School. The city also has several private schools, including St. Mary's Catholic School and Nessen City Christian Academy. The city is also home to several colleges and universities, including Michigan State University, Lansing Community College, and Grand Valley State University.
Nessen City is a small city with a rich history and a vibrant economy. The city is home to a diverse population, and offers a variety of recreational activities and educational opportunities. The city is a great place to live, work, and raise a family.
Common Questions
What is Per Capita Income in Nessen City?
Per Capita income in Nessen City is $20,047.
What is the Median Family Income in Nessen City?
Median Family Income in Nessen City is $48,750.
What is the Median Household income in Nessen City?
Median Household Income in Nessen City is $33,750.
What is Inequality or Gini Index in Nessen City?
Inequality or Gini Index in Nessen City is 0.40.
What is the Total Population of Nessen City?
Total Population of Nessen City is 90.
What is the Total Male Population of Nessen City?
Total Male Population of Nessen City is 43.
What is the Total Female Population of Nessen City?
Total Female Population of Nessen City is 47.
What is the Ratio of Males per 100 Females in Nessen City?
There are 91.49 Males per 100 Females in Nessen City.
What is the Ratio of Females per 100 Males in Nessen City?
There are 109.30 Females per 100 Males in Nessen City.
What is the Median Population Age in Nessen City?
Median Population Age in Nessen City is 55.5 Years.
What is the Average Family Size in Nessen City
Average Family Size in Nessen City is 3.5 People.
What is the Average Household Size in Nessen City
Average Household Size in Nessen City is 3.2 People.
How Large is the Labor Force in Nessen City?
There are 32 People in the Labor Forcein in Nessen City.
What is the Percentage of People in the Labor Force in Nessen City?
40.5% of People are in the Labor Force in Nessen City.
What is the Unemployment Rate in Nessen City?
Unemployment Rate in Nessen City is 12.5%.