Zip Codes with the Highest Percentage of Population Employed in Arts, Media & Entertainment in Livonia, MI
RELATED REPORTS & OPTIONS
Arts, Media & Entertainment
Livonia
Compare Zip Codes
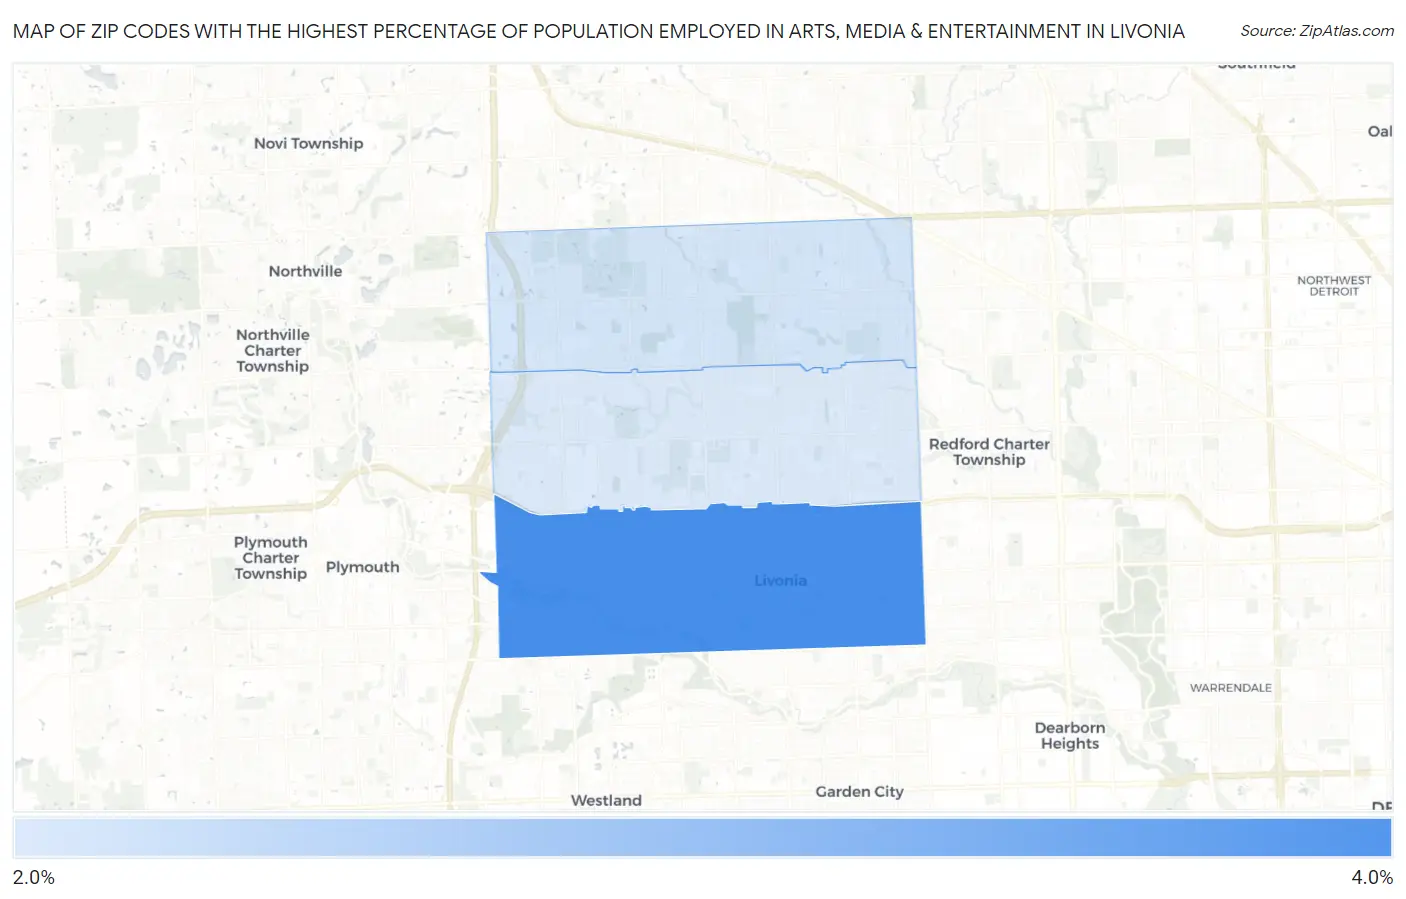
Map of Zip Codes with the Highest Percentage of Population Employed in Arts, Media & Entertainment in Livonia
2.1%
3.4%
Zip Codes with the Highest Percentage of Population Employed in Arts, Media & Entertainment in Livonia, MI
| Zip Code | % Employed | vs State | vs National | |
| 1. | 48150 | 3.4% | 1.7%(+1.68)#72 | 2.1%(+1.32)#3,271 |
| 2. | 48152 | 2.1% | 1.7%(+0.440)#184 | 2.1%(+0.081)#7,084 |
| 3. | 48154 | 2.1% | 1.7%(+0.373)#196 | 2.1%(+0.015)#7,407 |
1
Common Questions
What are the Top Zip Codes with the Highest Percentage of Population Employed in Arts, Media & Entertainment in Livonia, MI?
Top Zip Codes with the Highest Percentage of Population Employed in Arts, Media & Entertainment in Livonia, MI are:
What zip code has the Highest Percentage of Population Employed in Arts, Media & Entertainment in Livonia, MI?
48150 has the Highest Percentage of Population Employed in Arts, Media & Entertainment in Livonia, MI with 3.4%.
What is the Percentage of Population Employed in Arts, Media & Entertainment in Livonia, MI?
Percentage of Population Employed in Arts, Media & Entertainment in Livonia is 2.5%.
What is the Percentage of Population Employed in Arts, Media & Entertainment in Michigan?
Percentage of Population Employed in Arts, Media & Entertainment in Michigan is 1.7%.
What is the Percentage of Population Employed in Arts, Media & Entertainment in the United States?
Percentage of Population Employed in Arts, Media & Entertainment in the United States is 2.1%.