Zip Codes with the Highest Percentage of Population Employed in Arts, Media & Entertainment in Michigan
RELATED REPORTS & OPTIONS
Arts, Media & Entertainment
Michigan
Compare Zip Codes
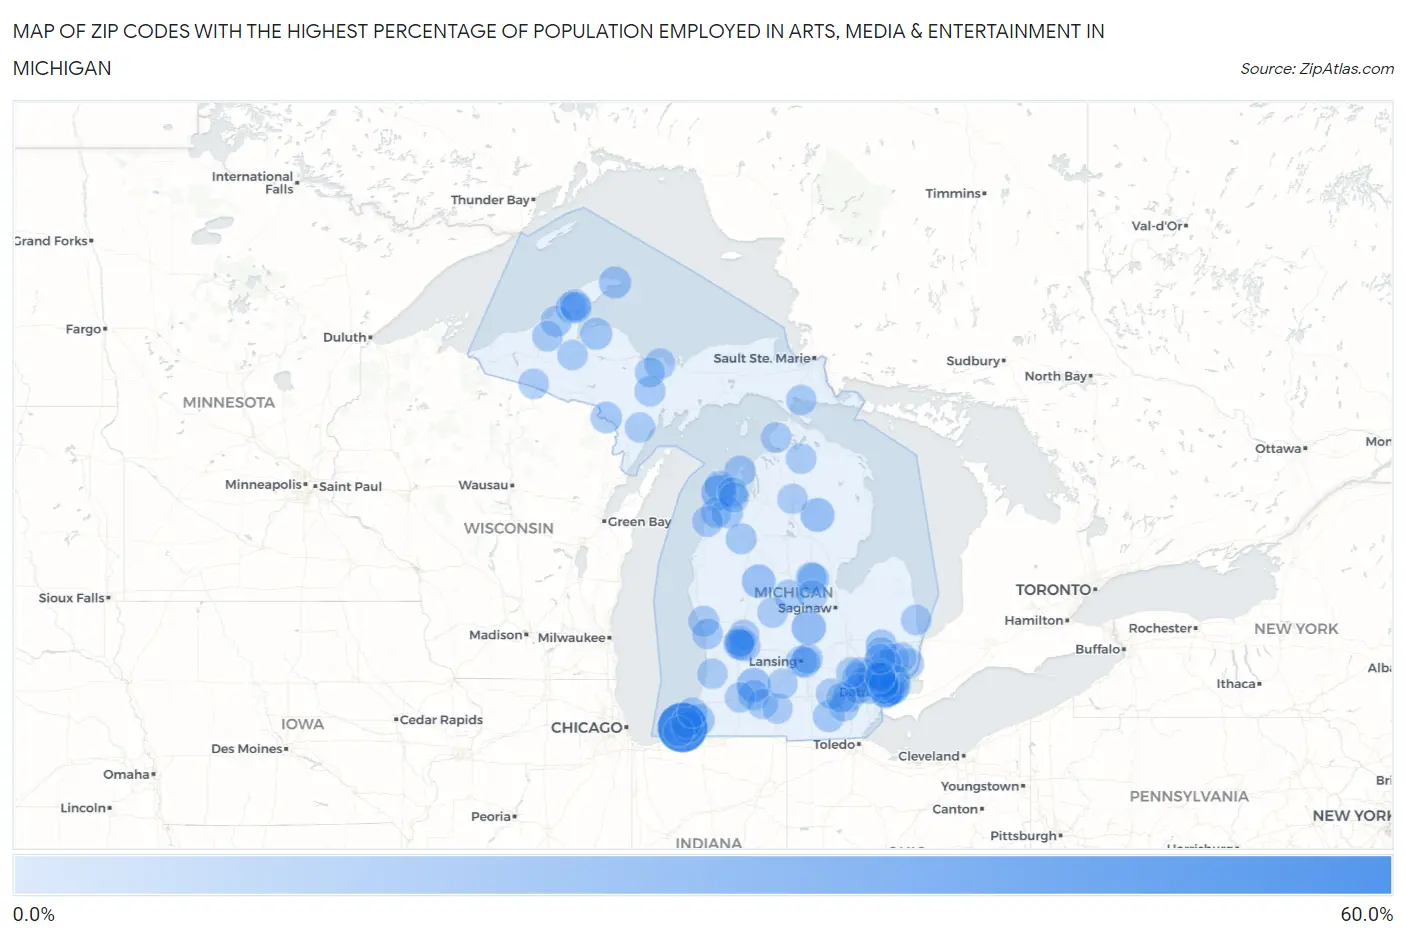
Map of Zip Codes with the Highest Percentage of Population Employed in Arts, Media & Entertainment in Michigan
0.0%
60.0%
Zip Codes with the Highest Percentage of Population Employed in Arts, Media & Entertainment in Michigan
| Zip Code | % Employed | vs State | vs National | |
| 1. | 49115 | 51.9% | 1.7%(+50.2)#1 | 2.1%(+49.9)#10 |
| 2. | 49636 | 14.9% | 1.7%(+13.1)#2 | 2.1%(+12.8)#172 |
| 3. | 48807 | 12.8% | 1.7%(+11.1)#3 | 2.1%(+10.8)#219 |
| 4. | 48636 | 12.0% | 1.7%(+10.3)#4 | 2.1%(+9.92)#257 |
| 5. | 49060 | 11.9% | 1.7%(+10.2)#5 | 2.1%(+9.82)#264 |
| 6. | 49320 | 11.2% | 1.7%(+9.50)#6 | 2.1%(+9.14)#299 |
| 7. | 48069 | 9.5% | 1.7%(+7.83)#7 | 2.1%(+7.48)#410 |
| 8. | 49918 | 7.4% | 1.7%(+5.71)#8 | 2.1%(+5.35)#666 |
| 9. | 49962 | 7.1% | 1.7%(+5.44)#9 | 2.1%(+5.08)#724 |
| 10. | 49104 | 6.9% | 1.7%(+5.17)#10 | 2.1%(+4.81)#788 |
| 11. | 49119 | 6.7% | 1.7%(+5.04)#11 | 2.1%(+4.68)#822 |
| 12. | 48236 | 6.7% | 1.7%(+5.01)#12 | 2.1%(+4.65)#830 |
| 13. | 49287 | 6.3% | 1.7%(+4.63)#13 | 2.1%(+4.27)#920 |
| 14. | 48220 | 6.0% | 1.7%(+4.27)#14 | 2.1%(+3.91)#1,042 |
| 15. | 49670 | 5.9% | 1.7%(+4.17)#15 | 2.1%(+3.81)#1,090 |
| 16. | 49876 | 5.6% | 1.7%(+3.91)#16 | 2.1%(+3.55)#1,191 |
| 17. | 48067 | 5.5% | 1.7%(+3.83)#17 | 2.1%(+3.47)#1,230 |
| 18. | 49643 | 5.5% | 1.7%(+3.81)#18 | 2.1%(+3.45)#1,242 |
| 19. | 48216 | 5.5% | 1.7%(+3.77)#19 | 2.1%(+3.41)#1,265 |
| 20. | 49931 | 5.3% | 1.7%(+3.59)#20 | 2.1%(+3.24)#1,351 |
| 21. | 48070 | 5.3% | 1.7%(+3.56)#21 | 2.1%(+3.20)#1,372 |
| 22. | 48208 | 5.3% | 1.7%(+3.56)#22 | 2.1%(+3.20)#1,373 |
| 23. | 49965 | 5.0% | 1.7%(+3.25)#23 | 2.1%(+2.89)#1,529 |
| 24. | 49630 | 4.9% | 1.7%(+3.24)#24 | 2.1%(+2.88)#1,536 |
| 25. | 48201 | 4.9% | 1.7%(+3.23)#25 | 2.1%(+2.87)#1,542 |
| 26. | 49930 | 4.9% | 1.7%(+3.23)#26 | 2.1%(+2.87)#1,545 |
| 27. | 48628 | 4.8% | 1.7%(+3.09)#27 | 2.1%(+2.73)#1,623 |
| 28. | 48428 | 4.6% | 1.7%(+2.95)#28 | 2.1%(+2.59)#1,735 |
| 29. | 48620 | 4.6% | 1.7%(+2.91)#29 | 2.1%(+2.55)#1,766 |
| 30. | 48104 | 4.6% | 1.7%(+2.90)#30 | 2.1%(+2.54)#1,775 |
| 31. | 48202 | 4.5% | 1.7%(+2.81)#31 | 2.1%(+2.45)#1,846 |
| 32. | 48367 | 4.5% | 1.7%(+2.77)#32 | 2.1%(+2.41)#1,877 |
| 33. | 49618 | 4.5% | 1.7%(+2.77)#33 | 2.1%(+2.41)#1,879 |
| 34. | 49546 | 4.5% | 1.7%(+2.76)#34 | 2.1%(+2.40)#1,888 |
| 35. | 49822 | 4.4% | 1.7%(+2.69)#35 | 2.1%(+2.33)#1,944 |
| 36. | 49440 | 4.4% | 1.7%(+2.69)#36 | 2.1%(+2.33)#1,946 |
| 37. | 48933 | 4.3% | 1.7%(+2.56)#37 | 2.1%(+2.20)#2,080 |
| 38. | 48226 | 4.3% | 1.7%(+2.55)#38 | 2.1%(+2.19)#2,088 |
| 39. | 49922 | 4.2% | 1.7%(+2.53)#39 | 2.1%(+2.17)#2,116 |
| 40. | 49617 | 4.1% | 1.7%(+2.43)#40 | 2.1%(+2.07)#2,208 |
| 41. | 49306 | 4.1% | 1.7%(+2.40)#41 | 2.1%(+2.04)#2,255 |
| 42. | 49613 | 4.1% | 1.7%(+2.38)#42 | 2.1%(+2.02)#2,273 |
| 43. | 48118 | 4.1% | 1.7%(+2.35)#43 | 2.1%(+2.00)#2,297 |
| 44. | 49106 | 4.1% | 1.7%(+2.35)#44 | 2.1%(+2.00)#2,298 |
| 45. | 49456 | 4.0% | 1.7%(+2.31)#45 | 2.1%(+1.95)#2,353 |
| 46. | 49880 | 4.0% | 1.7%(+2.31)#46 | 2.1%(+1.95)#2,360 |
| 47. | 49740 | 4.0% | 1.7%(+2.30)#47 | 2.1%(+1.94)#2,364 |
| 48. | 49948 | 4.0% | 1.7%(+2.30)#48 | 2.1%(+1.94)#2,365 |
| 49. | 48214 | 3.9% | 1.7%(+2.22)#49 | 2.1%(+1.86)#2,467 |
| 50. | 49506 | 3.8% | 1.7%(+2.09)#50 | 2.1%(+1.73)#2,635 |
| 51. | 49505 | 3.8% | 1.7%(+2.09)#51 | 2.1%(+1.73)#2,638 |
| 52. | 49129 | 3.8% | 1.7%(+2.09)#52 | 2.1%(+1.73)#2,643 |
| 53. | 49503 | 3.8% | 1.7%(+2.08)#53 | 2.1%(+1.73)#2,645 |
| 54. | 49053 | 3.7% | 1.7%(+2.02)#54 | 2.1%(+1.66)#2,737 |
| 55. | 49621 | 3.7% | 1.7%(+2.02)#55 | 2.1%(+1.66)#2,738 |
| 56. | 48072 | 3.7% | 1.7%(+2.00)#56 | 2.1%(+1.64)#2,762 |
| 57. | 48824 | 3.7% | 1.7%(+1.99)#57 | 2.1%(+1.63)#2,779 |
| 58. | 48025 | 3.6% | 1.7%(+1.92)#58 | 2.1%(+1.56)#2,870 |
| 59. | 48302 | 3.6% | 1.7%(+1.86)#59 | 2.1%(+1.50)#2,972 |
| 60. | 48393 | 3.5% | 1.7%(+1.83)#60 | 2.1%(+1.47)#3,021 |
| 61. | 48017 | 3.5% | 1.7%(+1.83)#61 | 2.1%(+1.47)#3,026 |
| 62. | 48023 | 3.5% | 1.7%(+1.83)#62 | 2.1%(+1.47)#3,027 |
| 63. | 48450 | 3.5% | 1.7%(+1.76)#63 | 2.1%(+1.40)#3,119 |
| 64. | 48207 | 3.5% | 1.7%(+1.75)#64 | 2.1%(+1.39)#3,128 |
| 65. | 49799 | 3.4% | 1.7%(+1.75)#65 | 2.1%(+1.39)#3,135 |
| 66. | 49085 | 3.4% | 1.7%(+1.74)#66 | 2.1%(+1.38)#3,146 |
| 67. | 48823 | 3.4% | 1.7%(+1.72)#67 | 2.1%(+1.37)#3,180 |
| 68. | 48096 | 3.4% | 1.7%(+1.72)#68 | 2.1%(+1.36)#3,200 |
| 69. | 48382 | 3.4% | 1.7%(+1.71)#69 | 2.1%(+1.35)#3,210 |
| 70. | 49051 | 3.4% | 1.7%(+1.69)#70 | 2.1%(+1.34)#3,247 |
| 71. | 48852 | 3.4% | 1.7%(+1.69)#71 | 2.1%(+1.33)#3,255 |
| 72. | 48150 | 3.4% | 1.7%(+1.68)#72 | 2.1%(+1.32)#3,271 |
| 73. | 48050 | 3.4% | 1.7%(+1.67)#73 | 2.1%(+1.31)#3,293 |
| 74. | 48859 | 3.4% | 1.7%(+1.65)#74 | 2.1%(+1.30)#3,332 |
| 75. | 48316 | 3.3% | 1.7%(+1.64)#75 | 2.1%(+1.28)#3,358 |
| 76. | 48081 | 3.3% | 1.7%(+1.63)#76 | 2.1%(+1.27)#3,382 |
| 77. | 49969 | 3.3% | 1.7%(+1.59)#77 | 2.1%(+1.23)#3,439 |
| 78. | 48640 | 3.3% | 1.7%(+1.55)#78 | 2.1%(+1.19)#3,509 |
| 79. | 48206 | 3.2% | 1.7%(+1.53)#79 | 2.1%(+1.17)#3,537 |
| 80. | 49008 | 3.2% | 1.7%(+1.52)#80 | 2.1%(+1.16)#3,566 |
| 81. | 48176 | 3.2% | 1.7%(+1.52)#81 | 2.1%(+1.16)#3,574 |
| 82. | 48375 | 3.2% | 1.7%(+1.51)#82 | 2.1%(+1.15)#3,598 |
| 83. | 48230 | 3.2% | 1.7%(+1.50)#83 | 2.1%(+1.14)#3,606 |
| 84. | 49970 | 3.2% | 1.7%(+1.49)#84 | 2.1%(+1.13)#3,631 |
| 85. | 48170 | 3.2% | 1.7%(+1.48)#85 | 2.1%(+1.13)#3,644 |
| 86. | 49092 | 3.2% | 1.7%(+1.47)#86 | 2.1%(+1.11)#3,695 |
| 87. | 49896 | 3.2% | 1.7%(+1.46)#87 | 2.1%(+1.10)#3,702 |
| 88. | 48030 | 3.1% | 1.7%(+1.44)#88 | 2.1%(+1.08)#3,749 |
| 89. | 48084 | 3.1% | 1.7%(+1.43)#89 | 2.1%(+1.07)#3,769 |
| 90. | 49076 | 3.1% | 1.7%(+1.42)#90 | 2.1%(+1.06)#3,783 |
| 91. | 49684 | 3.1% | 1.7%(+1.41)#91 | 2.1%(+1.05)#3,825 |
| 92. | 49733 | 3.1% | 1.7%(+1.38)#92 | 2.1%(+1.02)#3,894 |
| 93. | 49745 | 3.1% | 1.7%(+1.37)#93 | 2.1%(+1.01)#3,930 |
| 94. | 48203 | 3.1% | 1.7%(+1.36)#94 | 2.1%(+0.999)#3,951 |
| 95. | 49408 | 3.1% | 1.7%(+1.36)#95 | 2.1%(+0.999)#3,952 |
| 96. | 48073 | 3.0% | 1.7%(+1.35)#96 | 2.1%(+0.988)#3,972 |
| 97. | 48103 | 3.0% | 1.7%(+1.26)#97 | 2.1%(+0.906)#4,165 |
| 98. | 49885 | 3.0% | 1.7%(+1.26)#98 | 2.1%(+0.905)#4,167 |
| 99. | 48380 | 2.9% | 1.7%(+1.24)#99 | 2.1%(+0.884)#4,216 |
| 100. | 48363 | 2.9% | 1.7%(+1.23)#100 | 2.1%(+0.872)#4,252 |
Common Questions
What are the Top 10 Zip Codes with the Highest Percentage of Population Employed in Arts, Media & Entertainment in Michigan?
Top 10 Zip Codes with the Highest Percentage of Population Employed in Arts, Media & Entertainment in Michigan are:
What zip code has the Highest Percentage of Population Employed in Arts, Media & Entertainment in Michigan?
49115 has the Highest Percentage of Population Employed in Arts, Media & Entertainment in Michigan with 51.9%.
What is the Percentage of Population Employed in Arts, Media & Entertainment in the State of Michigan?
Percentage of Population Employed in Arts, Media & Entertainment in Michigan is 1.7%.
What is the Percentage of Population Employed in Arts, Media & Entertainment in the United States?
Percentage of Population Employed in Arts, Media & Entertainment in the United States is 2.1%.