Dames Quarter, MD Map & Demographics
Dames Quarter Map
Dames Quarter Overview
$25,147
PER CAPITA INCOME
$67,105
AVG HOUSEHOLD INCOME
32.5%
WAGE / INCOME GAP [ % ]
67.5¢/ $1
WAGE / INCOME GAP [ $ ]
0.20
INEQUALITY / GINI INDEX
212
TOTAL POPULATION
97
MALE POPULATION
115
FEMALE POPULATION
84.35
MALES / 100 FEMALES
118.56
FEMALES / 100 MALES
41.5
MEDIAN AGE
4.2
AVG FAMILY SIZE
3.4
AVG HOUSEHOLD SIZE
153
LABOR FORCE [ PEOPLE ]
72.2%
PERCENT IN LABOR FORCE
Dames Quarter Area Codes
Income in Dames Quarter
Income Overview in Dames Quarter
| Characteristic | Number | Measure |
| Per Capita Income | 212 | $25,147 |
| Median Family Income | 47 | $0 |
| Mean Family Income | 47 | $0 |
| Median Household Income | 62 | $67,105 |
| Mean Household Income | 62 | $73,856 |
| Income Deficit | 47 | $0 |
| Wage / Income Gap (%) | 212 | 32.54% |
| Wage / Income Gap ($) | 212 | 67.46¢ per $1 |
| Gini / Inequality Index | 212 | 0.20 |
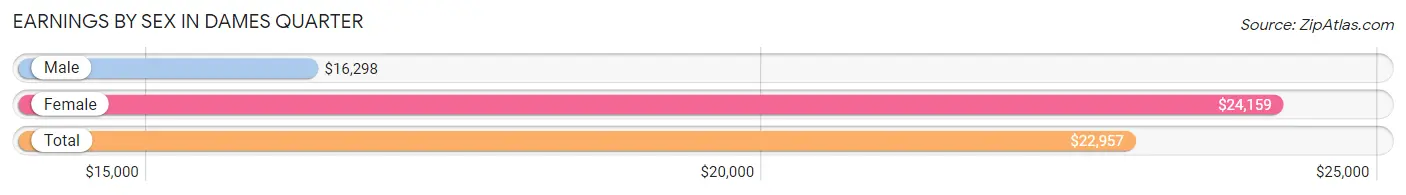
Earnings by Sex in Dames Quarter
Average Earnings in Dames Quarter are $22,957, $16,298 for men and $24,159 for women, a difference of 32.5%.
| Sex | Number | Average Earnings |
| Male | 92 (50.3%) | $16,298 |
| Female | 91 (49.7%) | $24,159 |
| Total | 183 (100.0%) | $22,957 |
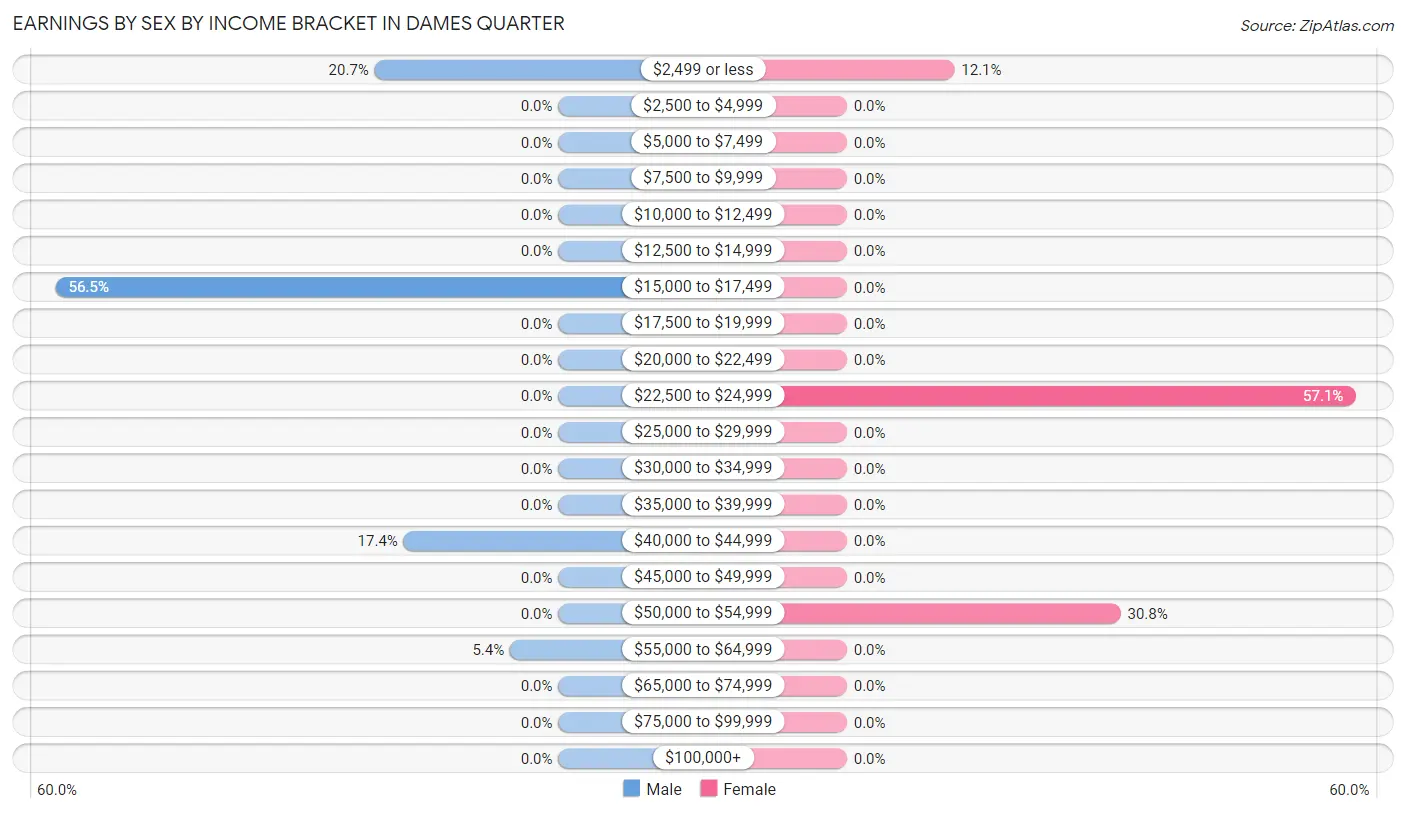
Earnings by Sex by Income Bracket in Dames Quarter
The most common earnings brackets in Dames Quarter are $15,000 to $17,499 for men (52 | 56.5%) and $22,500 to $24,999 for women (52 | 57.1%).
| Income | Male | Female |
| $2,499 or less | 19 (20.6%) | 11 (12.1%) |
| $2,500 to $4,999 | 0 (0.0%) | 0 (0.0%) |
| $5,000 to $7,499 | 0 (0.0%) | 0 (0.0%) |
| $7,500 to $9,999 | 0 (0.0%) | 0 (0.0%) |
| $10,000 to $12,499 | 0 (0.0%) | 0 (0.0%) |
| $12,500 to $14,999 | 0 (0.0%) | 0 (0.0%) |
| $15,000 to $17,499 | 52 (56.5%) | 0 (0.0%) |
| $17,500 to $19,999 | 0 (0.0%) | 0 (0.0%) |
| $20,000 to $22,499 | 0 (0.0%) | 0 (0.0%) |
| $22,500 to $24,999 | 0 (0.0%) | 52 (57.1%) |
| $25,000 to $29,999 | 0 (0.0%) | 0 (0.0%) |
| $30,000 to $34,999 | 0 (0.0%) | 0 (0.0%) |
| $35,000 to $39,999 | 0 (0.0%) | 0 (0.0%) |
| $40,000 to $44,999 | 16 (17.4%) | 0 (0.0%) |
| $45,000 to $49,999 | 0 (0.0%) | 0 (0.0%) |
| $50,000 to $54,999 | 0 (0.0%) | 28 (30.8%) |
| $55,000 to $64,999 | 5 (5.4%) | 0 (0.0%) |
| $65,000 to $74,999 | 0 (0.0%) | 0 (0.0%) |
| $75,000 to $99,999 | 0 (0.0%) | 0 (0.0%) |
| $100,000+ | 0 (0.0%) | 0 (0.0%) |
| Total | 92 (100.0%) | 91 (100.0%) |
Earnings by Sex by Educational Attainment in Dames Quarter
| Educational Attainment | Male Income | Female Income |
| Less than High School | - | - |
| High School Diploma | - | - |
| College or Associate's Degree | - | - |
| Bachelor's Degree | - | - |
| Graduate Degree | - | - |
| Total | - | - |
Family Income in Dames Quarter
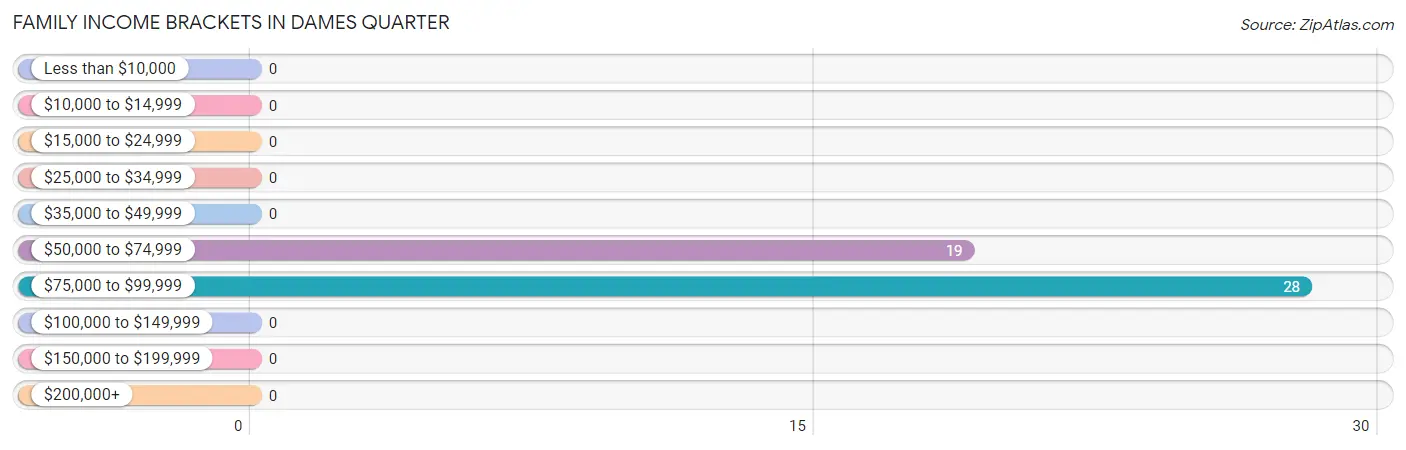
Family Income Brackets in Dames Quarter
According to the Dames Quarter family income data, there are 28 families falling into the $75,000 to $99,999 income range, which is the most common income bracket and makes up 59.6% of all families.
| Income Bracket | # Families | % Families |
| Less than $10,000 | 0 | 0.0% |
| $10,000 to $14,999 | 0 | 0.0% |
| $15,000 to $24,999 | 0 | 0.0% |
| $25,000 to $34,999 | 0 | 0.0% |
| $35,000 to $49,999 | 0 | 0.0% |
| $50,000 to $74,999 | 19 | 40.4% |
| $75,000 to $99,999 | 28 | 59.6% |
| $100,000 to $149,999 | 0 | 0.0% |
| $150,000 to $199,999 | 0 | 0.0% |
| $200,000+ | 0 | 0.0% |
Family Income by Famaliy Size in Dames Quarter
| Income Bracket | # Families | Median Income |
| 2-Person Families | 0 (0.0%) | $0 |
| 3-Person Families | 19 (40.4%) | $0 |
| 4-Person Families | 28 (59.6%) | $0 |
| 5-Person Families | 0 (0.0%) | $0 |
| 6-Person Families | 0 (0.0%) | $0 |
| 7+ Person Families | 0 (0.0%) | $0 |
| Total | 47 (100.0%) | $0 |
Family Income by Number of Earners in Dames Quarter
| Number of Earners | # Families | Median Income |
| No Earners | 0 (0.0%) | $0 |
| 1 Earner | 0 (0.0%) | $0 |
| 2 Earners | 19 (40.4%) | $0 |
| 3+ Earners | 28 (59.6%) | $0 |
| Total | 47 (100.0%) | $0 |
Household Income in Dames Quarter
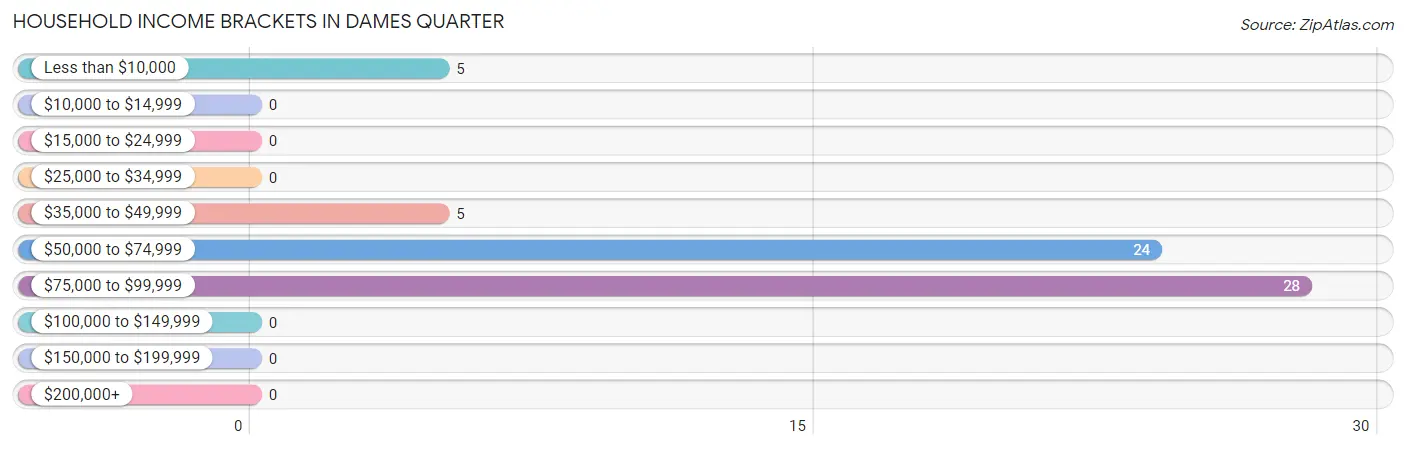
Household Income Brackets in Dames Quarter
With 28 households falling in the category, the $75,000 to $99,999 income range is the most frequent in Dames Quarter, accounting for 45.2% of all households.
| Income Bracket | # Households | % Households |
| Less than $10,000 | 5 | 8.1% |
| $10,000 to $14,999 | 0 | 0.0% |
| $15,000 to $24,999 | 0 | 0.0% |
| $25,000 to $34,999 | 0 | 0.0% |
| $35,000 to $49,999 | 5 | 8.1% |
| $50,000 to $74,999 | 24 | 38.7% |
| $75,000 to $99,999 | 28 | 45.2% |
| $100,000 to $149,999 | 0 | 0.0% |
| $150,000 to $199,999 | 0 | 0.0% |
| $200,000+ | 0 | 0.0% |
Household Income by Householder Age in Dames Quarter
| Income Bracket | # Households | Median Income |
| 15 to 24 Years | 0 (0.0%) | $0 |
| 25 to 44 Years | 28 (45.2%) | $0 |
| 45 to 64 Years | 19 (30.6%) | $0 |
| 65+ Years | 15 (24.2%) | $0 |
| Total | 62 (100.0%) | $67,105 |
Poverty in Dames Quarter
Income Below Poverty by Sex and Age in Dames Quarter
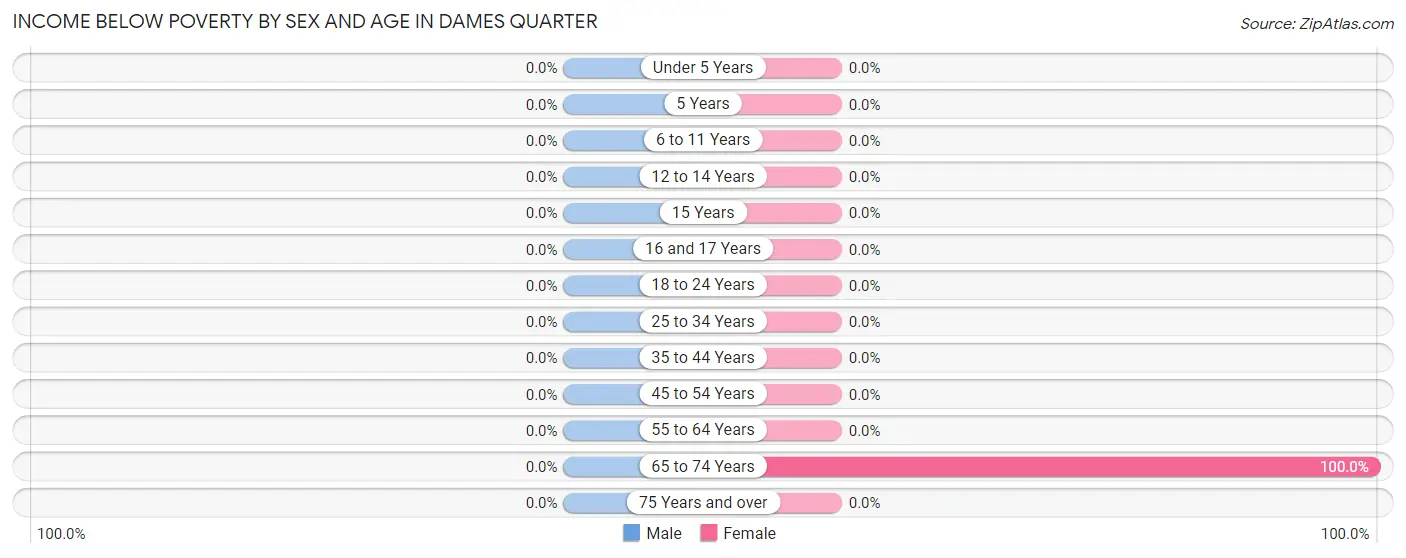
| Age Bracket | Male | Female |
| Under 5 Years | 0 (0.0%) | 0 (0.0%) |
| 5 Years | 0 (0.0%) | 0 (0.0%) |
| 6 to 11 Years | 0 (0.0%) | 0 (0.0%) |
| 12 to 14 Years | 0 (0.0%) | 0 (0.0%) |
| 15 Years | 0 (0.0%) | 0 (0.0%) |
| 16 and 17 Years | 0 (0.0%) | 0 (0.0%) |
| 18 to 24 Years | 0 (0.0%) | 0 (0.0%) |
| 25 to 34 Years | 0 (0.0%) | 0 (0.0%) |
| 35 to 44 Years | 0 (0.0%) | 0 (0.0%) |
| 45 to 54 Years | 0 (0.0%) | 0 (0.0%) |
| 55 to 64 Years | 0 (0.0%) | 0 (0.0%) |
| 65 to 74 Years | 0 (0.0%) | 5 (100.0%) |
| 75 Years and over | 0 (0.0%) | 0 (0.0%) |
| Total | 0 (0.0%) | 5 (4.3%) |
Income Above Poverty by Sex and Age in Dames Quarter
According to the poverty statistics in Dames Quarter, males aged 18 to 24 years and females aged 16 and 17 years are the age groups that are most secure financially, with 100.0% of males and 100.0% of females in these age groups living above the poverty line.
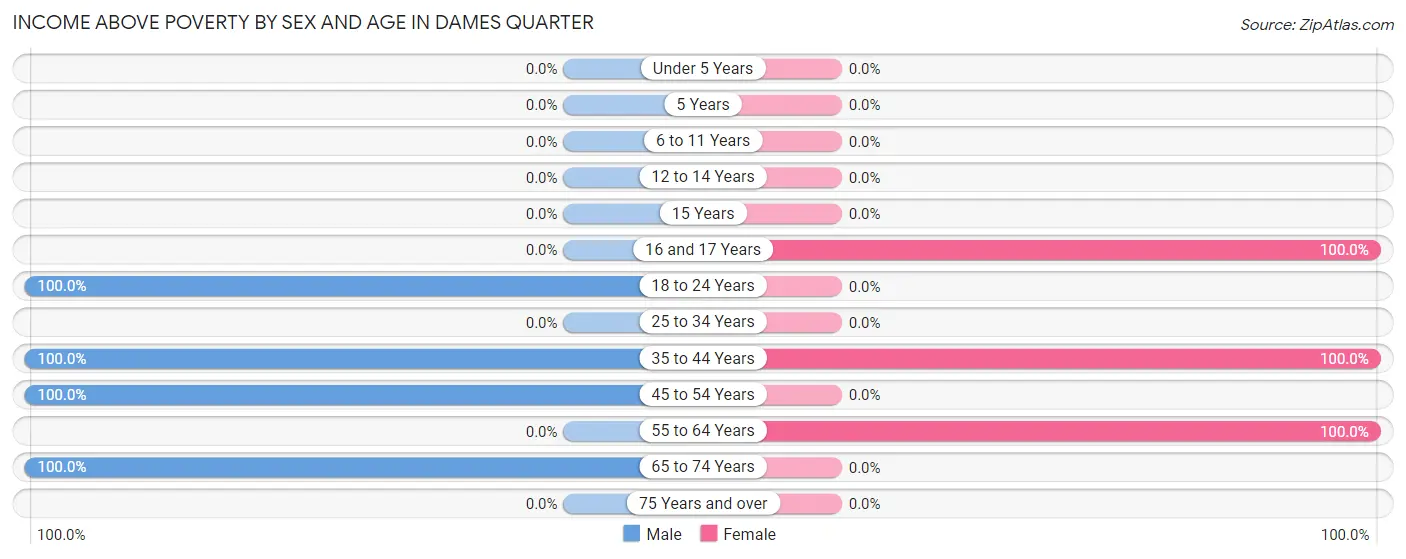
| Age Bracket | Male | Female |
| Under 5 Years | 0 (0.0%) | 0 (0.0%) |
| 5 Years | 0 (0.0%) | 0 (0.0%) |
| 6 to 11 Years | 0 (0.0%) | 0 (0.0%) |
| 12 to 14 Years | 0 (0.0%) | 0 (0.0%) |
| 15 Years | 0 (0.0%) | 0 (0.0%) |
| 16 and 17 Years | 0 (0.0%) | 11 (100.0%) |
| 18 to 24 Years | 19 (100.0%) | 0 (0.0%) |
| 25 to 34 Years | 0 (0.0%) | 0 (0.0%) |
| 35 to 44 Years | 52 (100.0%) | 80 (100.0%) |
| 45 to 54 Years | 16 (100.0%) | 0 (0.0%) |
| 55 to 64 Years | 0 (0.0%) | 19 (100.0%) |
| 65 to 74 Years | 10 (100.0%) | 0 (0.0%) |
| 75 Years and over | 0 (0.0%) | 0 (0.0%) |
| Total | 97 (100.0%) | 110 (95.7%) |
Income Below Poverty Among Married-Couple Families in Dames Quarter
| Children | Above Poverty | Below Poverty |
| No Children | 0 (0.0%) | 0 (0.0%) |
| 1 or 2 Children | 28 (100.0%) | 0 (0.0%) |
| 3 or 4 Children | 0 (0.0%) | 0 (0.0%) |
| 5 or more Children | 0 (0.0%) | 0 (0.0%) |
| Total | 28 (100.0%) | 0 (0.0%) |
Income Below Poverty Among Single-Parent Households in Dames Quarter
| Children | Single Father | Single Mother |
| No Children | 0 (0.0%) | 0 (0.0%) |
| 1 or 2 Children | 0 (0.0%) | 0 (0.0%) |
| 3 or 4 Children | 0 (0.0%) | 0 (0.0%) |
| 5 or more Children | 0 (0.0%) | 0 (0.0%) |
| Total | 0 (0.0%) | 0 (0.0%) |
Income Below Poverty Among Married-Couple vs Single-Parent Households in Dames Quarter
| Children | Married-Couple Families | Single-Parent Households |
| No Children | 0 (0.0%) | 0 (0.0%) |
| 1 or 2 Children | 0 (0.0%) | 0 (0.0%) |
| 3 or 4 Children | 0 (0.0%) | 0 (0.0%) |
| 5 or more Children | 0 (0.0%) | 0 (0.0%) |
| Total | 0 (0.0%) | 0 (0.0%) |
Race in Dames Quarter
The most populous races in Dames Quarter are , and White / Caucasian (212 | 100.0%).
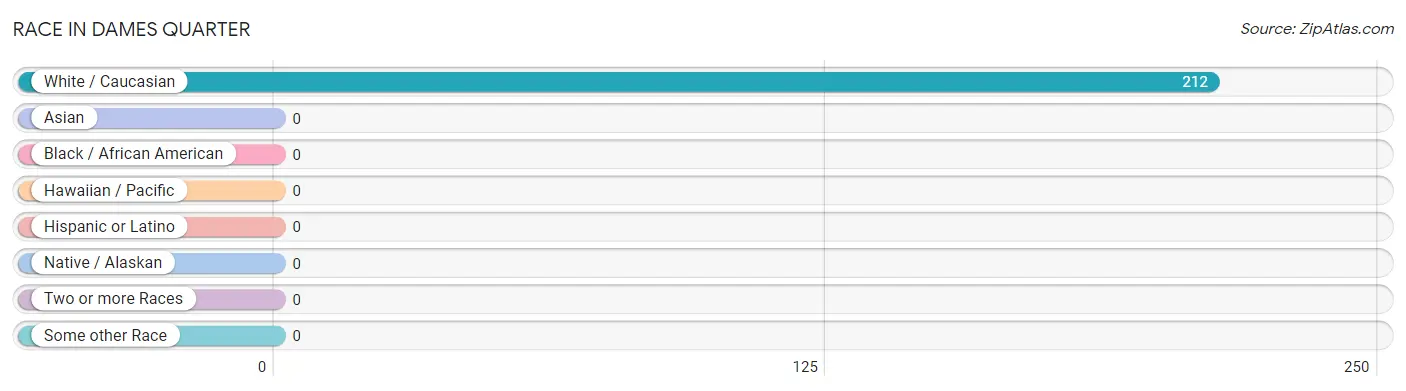
| Race | # Population | % Population |
| Asian | 0 | 0.0% |
| Black / African American | 0 | 0.0% |
| Hawaiian / Pacific | 0 | 0.0% |
| Hispanic or Latino | 0 | 0.0% |
| Native / Alaskan | 0 | 0.0% |
| White / Caucasian | 212 | 100.0% |
| Two or more Races | 0 | 0.0% |
| Some other Race | 0 | 0.0% |
| Total | 212 | 100.0% |
Ancestry in Dames Quarter
The most populous ancestries reported in Dames Quarter are English (76 | 35.8%), Czech (57 | 26.9%), Polish (52 | 24.5%), Welsh (52 | 24.5%), and Pennsylvania German (19 | 9.0%), together accounting for 120.8% of all Dames Quarter residents.
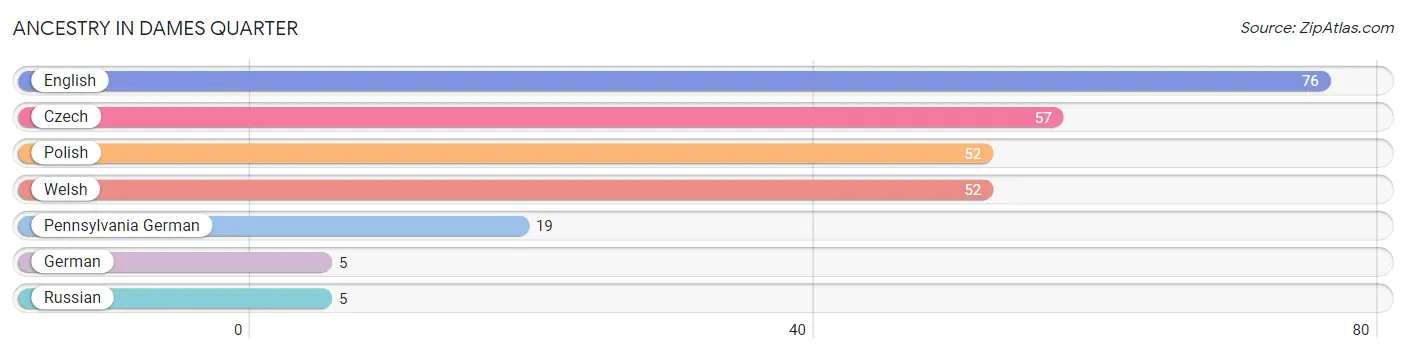
| Ancestry | # Population | % Population |
| Czech | 57 | 26.9% |
| English | 76 | 35.8% |
| German | 5 | 2.4% |
| Pennsylvania German | 19 | 9.0% |
| Polish | 52 | 24.5% |
| Russian | 5 | 2.4% |
| Welsh | 52 | 24.5% | View All 7 Rows |
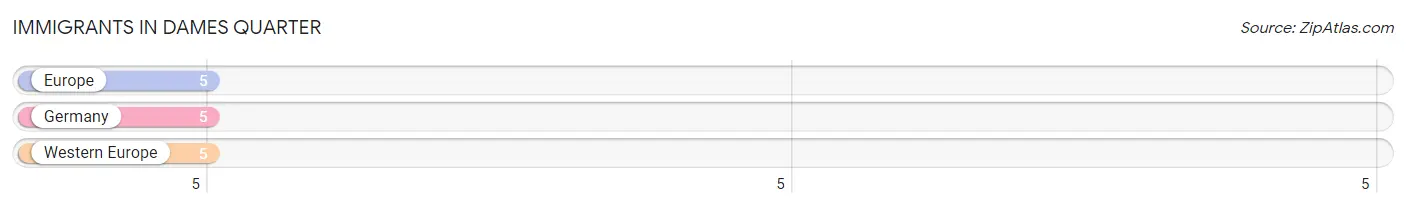
Immigrants in Dames Quarter
The most numerous immigrant groups reported in Dames Quarter came from Europe (5 | 2.4%), Germany (5 | 2.4%), and Western Europe (5 | 2.4%), together accounting for 7.1% of all Dames Quarter residents.
| Immigration Origin | # Population | % Population |
| Europe | 5 | 2.4% |
| Germany | 5 | 2.4% |
| Western Europe | 5 | 2.4% | View All 3 Rows |
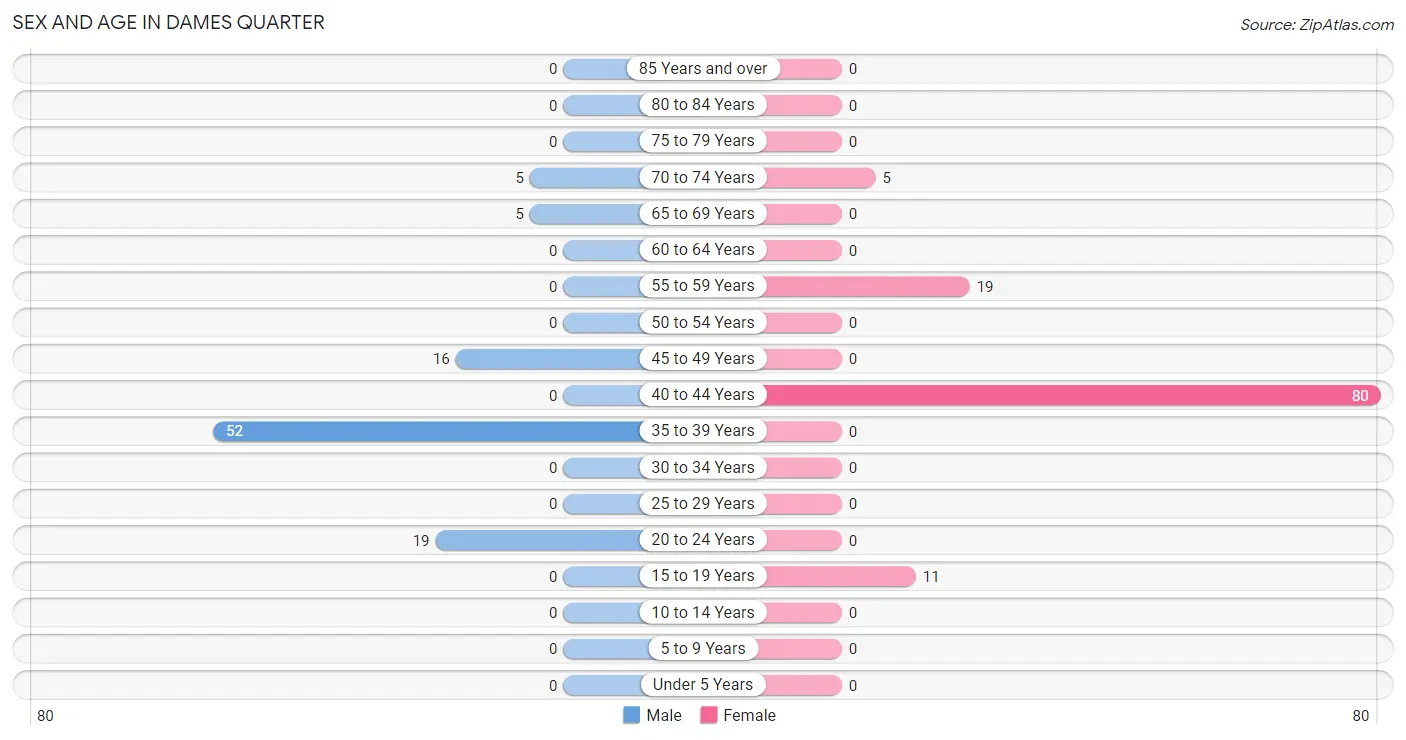
Sex and Age in Dames Quarter
Sex and Age in Dames Quarter
The most populous age groups in Dames Quarter are 35 to 39 Years (52 | 53.6%) for men and 40 to 44 Years (80 | 69.6%) for women.
| Age Bracket | Male | Female |
| Under 5 Years | 0 (0.0%) | 0 (0.0%) |
| 5 to 9 Years | 0 (0.0%) | 0 (0.0%) |
| 10 to 14 Years | 0 (0.0%) | 0 (0.0%) |
| 15 to 19 Years | 0 (0.0%) | 11 (9.6%) |
| 20 to 24 Years | 19 (19.6%) | 0 (0.0%) |
| 25 to 29 Years | 0 (0.0%) | 0 (0.0%) |
| 30 to 34 Years | 0 (0.0%) | 0 (0.0%) |
| 35 to 39 Years | 52 (53.6%) | 0 (0.0%) |
| 40 to 44 Years | 0 (0.0%) | 80 (69.6%) |
| 45 to 49 Years | 16 (16.5%) | 0 (0.0%) |
| 50 to 54 Years | 0 (0.0%) | 0 (0.0%) |
| 55 to 59 Years | 0 (0.0%) | 19 (16.5%) |
| 60 to 64 Years | 0 (0.0%) | 0 (0.0%) |
| 65 to 69 Years | 5 (5.1%) | 0 (0.0%) |
| 70 to 74 Years | 5 (5.1%) | 5 (4.3%) |
| 75 to 79 Years | 0 (0.0%) | 0 (0.0%) |
| 80 to 84 Years | 0 (0.0%) | 0 (0.0%) |
| 85 Years and over | 0 (0.0%) | 0 (0.0%) |
| Total | 97 (100.0%) | 115 (100.0%) |
Families and Households in Dames Quarter
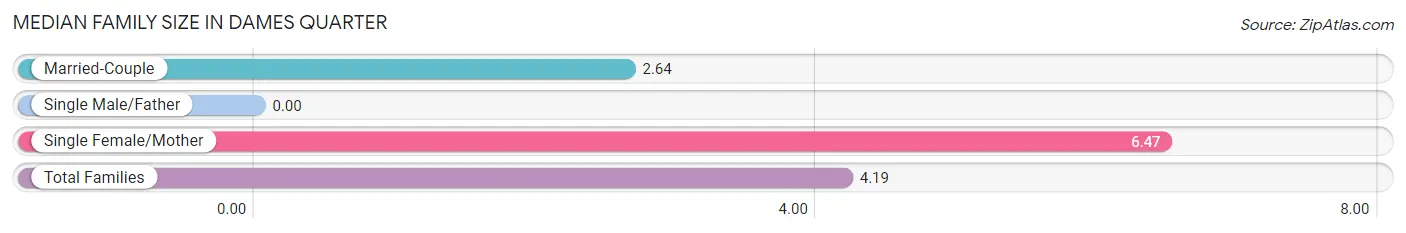
Median Family Size in Dames Quarter
| Family Type | # Families | Family Size |
| Married-Couple | 28 (59.6%) | 2.64 |
| Single Male/Father | 0 (0.0%) | - |
| Single Female/Mother | 19 (40.4%) | 6.47 |
| Total Families | 47 (100.0%) | 4.19 |
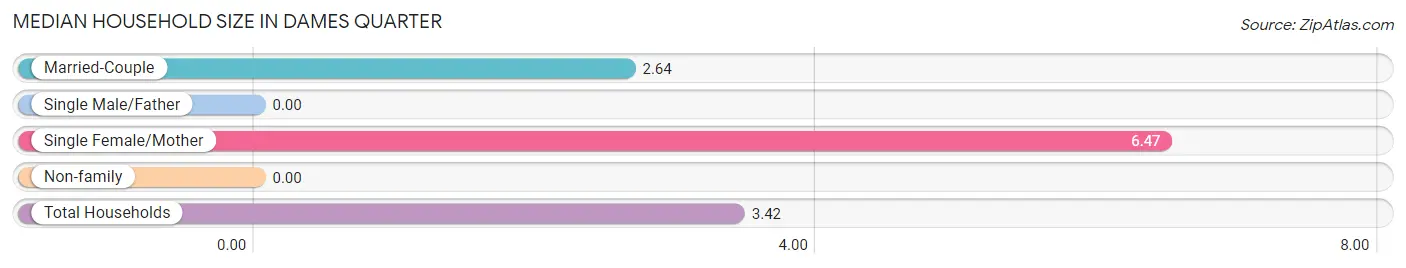
Median Household Size in Dames Quarter
| Household Type | # Households | Household Size |
| Married-Couple | 28 (45.2%) | 2.64 |
| Single Male/Father | 0 (0.0%) | - |
| Single Female/Mother | 19 (30.6%) | 6.47 |
| Non-family | 15 (24.2%) | - |
| Total Households | 62 (100.0%) | 3.42 |
Household Size by Marriage Status in Dames Quarter
Out of a total of 62 households in Dames Quarter, 47 (75.8%) are family households, while 15 (24.2%) are nonfamily households. The most numerous type of family households are 4-person households, comprising 28, and the most common type of nonfamily households are 1-person households, comprising 15.
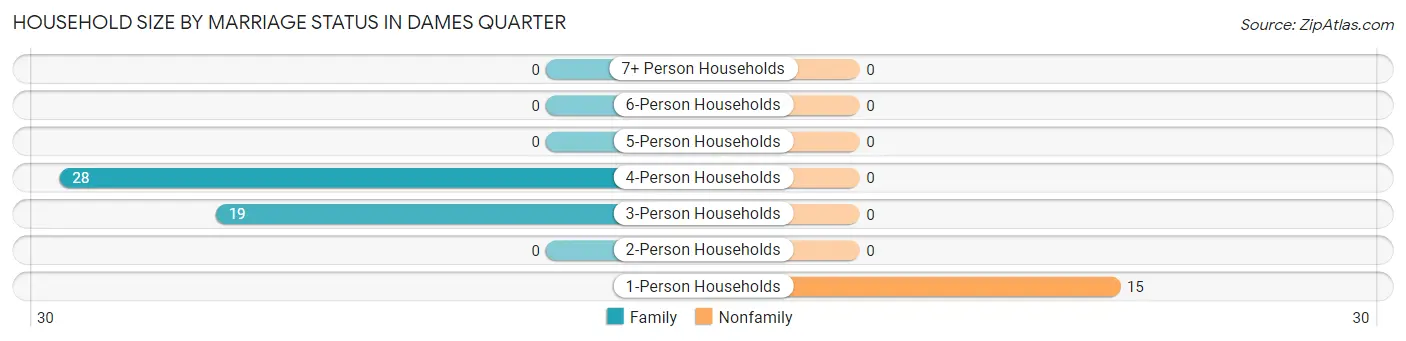
| Household Size | Family Households | Nonfamily Households |
| 1-Person Households | - | 15 (24.2%) |
| 2-Person Households | 0 (0.0%) | 0 (0.0%) |
| 3-Person Households | 19 (30.6%) | 0 (0.0%) |
| 4-Person Households | 28 (45.2%) | 0 (0.0%) |
| 5-Person Households | 0 (0.0%) | 0 (0.0%) |
| 6-Person Households | 0 (0.0%) | 0 (0.0%) |
| 7+ Person Households | 0 (0.0%) | 0 (0.0%) |
| Total | 47 (75.8%) | 15 (24.2%) |
Female Fertility in Dames Quarter
Fertility by Age in Dames Quarter
| Age Bracket | Women with Births | Births / 1,000 Women |
| 15 to 19 years | 0 (0.0%) | 0.0 |
| 20 to 34 years | 0 (0.0%) | 0.0 |
| 35 to 50 years | 0 (0.0%) | 0.0 |
| Total | 0 (0.0%) | 0.0 |
Fertility by Age by Marriage Status in Dames Quarter
| Age Bracket | Married | Unmarried |
| 15 to 19 years | 0 (0.0%) | 0 (0.0%) |
| 20 to 34 years | 0 (0.0%) | 0 (0.0%) |
| 35 to 50 years | 0 (0.0%) | 0 (0.0%) |
| Total | 0 (0.0%) | 0 (0.0%) |
Fertility by Education in Dames Quarter
| Educational Attainment | Women with Births | Births / 1,000 Women |
| Less than High School | 0 (0.0%) | 0.0 |
| High School Diploma | 0 (0.0%) | 0.0 |
| College or Associate's Degree | 0 (0.0%) | 0.0 |
| Bachelor's Degree | 0 (0.0%) | 0.0 |
| Graduate Degree | 0 (0.0%) | 0.0 |
| Total | 0 (0.0%) | 0.0 |
Fertility by Education by Marriage Status in Dames Quarter
| Educational Attainment | Married | Unmarried |
| Less than High School | 0 (0.0%) | 0 (0.0%) |
| High School Diploma | 0 (0.0%) | 0 (0.0%) |
| College or Associate's Degree | 0 (0.0%) | 0 (0.0%) |
| Bachelor's Degree | 0 (0.0%) | 0 (0.0%) |
| Graduate Degree | 0 (0.0%) | 0 (0.0%) |
| Total | 0 (0.0%) | 0 (0.0%) |
Employment Characteristics in Dames Quarter
Employment by Class of Employer in Dames Quarter
Among the 153 employed individuals in Dames Quarter, private company employees (109 | 71.2%), local government employees (28 | 18.3%), and self-employed (not incorporated) (16 | 10.5%) make up the most common classes of employment.
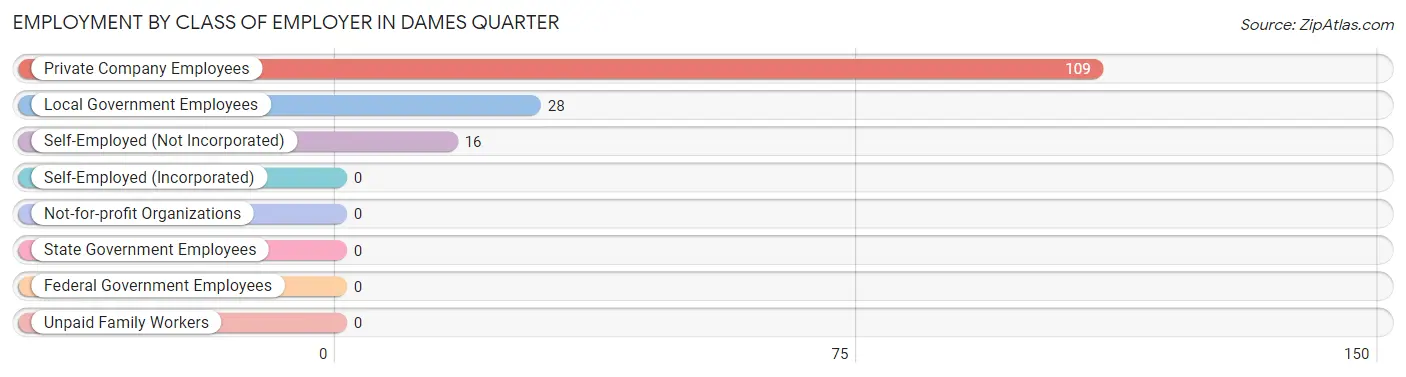
| Employer Class | # Employees | % Employees |
| Private Company Employees | 109 | 71.2% |
| Self-Employed (Incorporated) | 0 | 0.0% |
| Self-Employed (Not Incorporated) | 16 | 10.5% |
| Not-for-profit Organizations | 0 | 0.0% |
| Local Government Employees | 28 | 18.3% |
| State Government Employees | 0 | 0.0% |
| Federal Government Employees | 0 | 0.0% |
| Unpaid Family Workers | 0 | 0.0% |
| Total | 153 | 100.0% |
Employment Status by Age in Dames Quarter
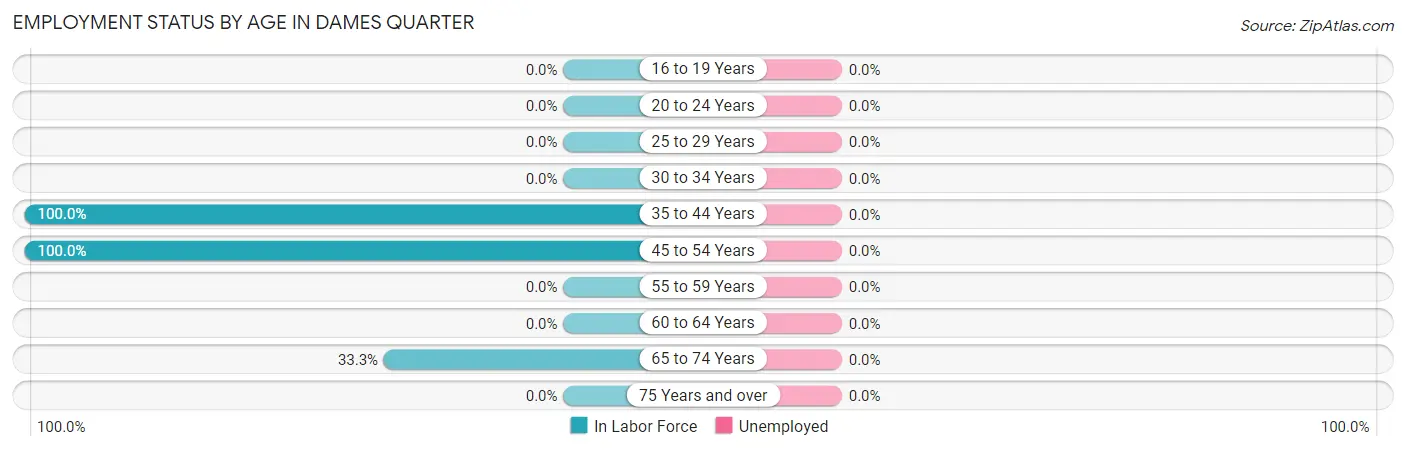
| Age Bracket | In Labor Force | Unemployed |
| 16 to 19 Years | 0 (0.0%) | 0 (0.0%) |
| 20 to 24 Years | 0 (0.0%) | 0 (0.0%) |
| 25 to 29 Years | 0 (0.0%) | 0 (0.0%) |
| 30 to 34 Years | 0 (0.0%) | 0 (0.0%) |
| 35 to 44 Years | 132 (100.0%) | 0 (0.0%) |
| 45 to 54 Years | 16 (100.0%) | 0 (0.0%) |
| 55 to 59 Years | 0 (0.0%) | 0 (0.0%) |
| 60 to 64 Years | 0 (0.0%) | 0 (0.0%) |
| 65 to 74 Years | 5 (33.3%) | 0 (0.0%) |
| 75 Years and over | 0 (0.0%) | 0 (0.0%) |
| Total | 153 (72.2%) | 0 (0.0%) |
Employment Status by Educational Attainment in Dames Quarter
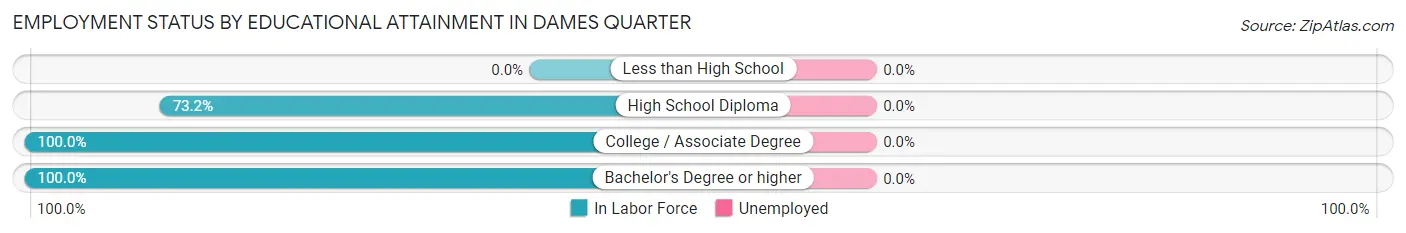
| Educational Attainment | In Labor Force | Unemployed |
| Less than High School | 0 (0.0%) | 0 (0.0%) |
| High School Diploma | 52 (73.2%) | 0 (0.0%) |
| College / Associate Degree | 68 (100.0%) | 0 (0.0%) |
| Bachelor's Degree or higher | 28 (100.0%) | 0 (0.0%) |
| Total | 148 (88.6%) | 0 (0.0%) |
Employment Occupations by Sex in Dames Quarter
Management, Business, Science and Arts Occupations
The most common Management, Business, Science and Arts occupations in Dames Quarter are Community & Social Service (28 | 18.3%), Education, Arts & Media (28 | 18.3%), and Management (5 | 3.3%).
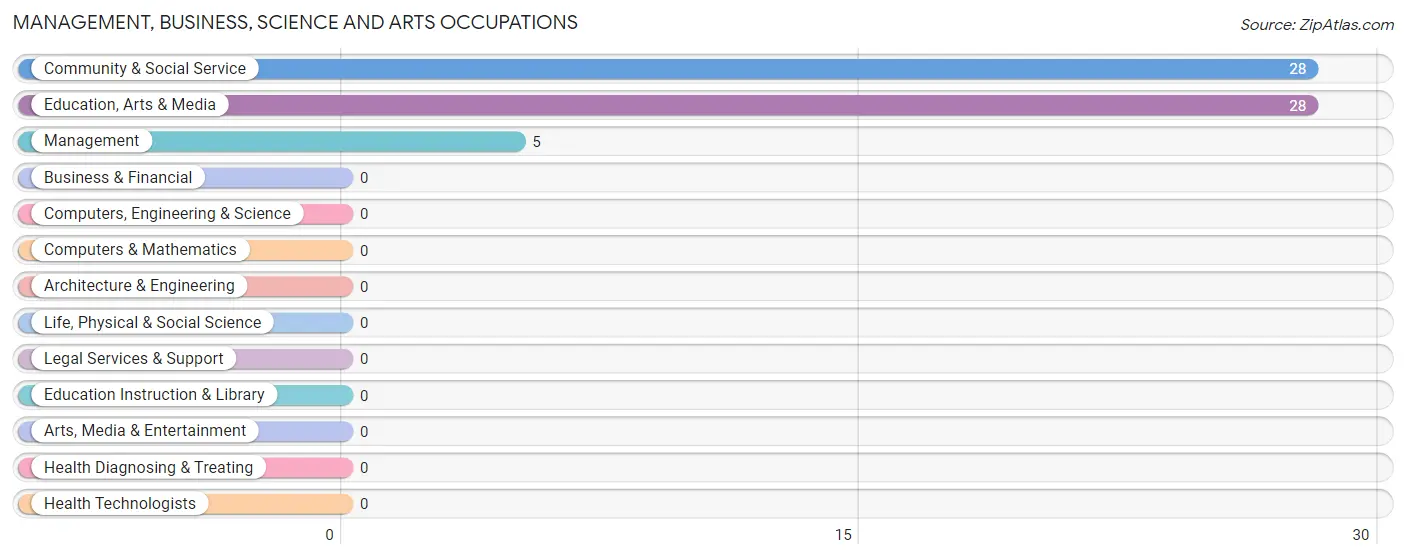
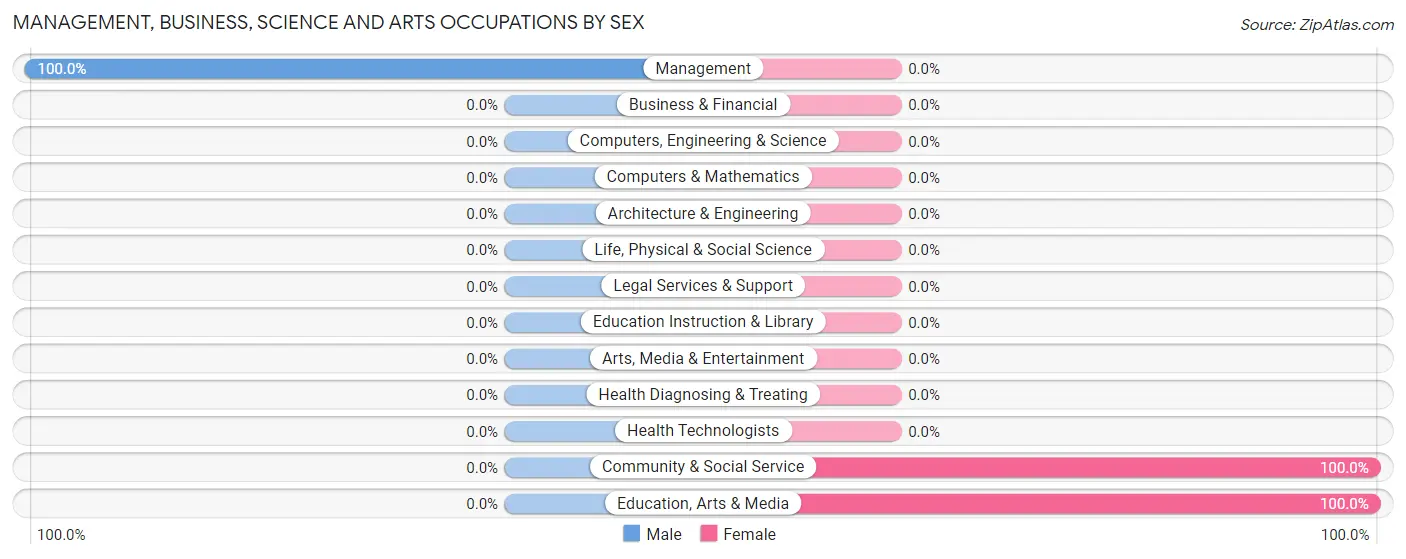
Management, Business, Science and Arts Occupations by Sex
| Occupation | Male | Female |
| Management | 5 (100.0%) | 0 (0.0%) |
| Business & Financial | 0 (0.0%) | 0 (0.0%) |
| Computers, Engineering & Science | 0 (0.0%) | 0 (0.0%) |
| Computers & Mathematics | 0 (0.0%) | 0 (0.0%) |
| Architecture & Engineering | 0 (0.0%) | 0 (0.0%) |
| Life, Physical & Social Science | 0 (0.0%) | 0 (0.0%) |
| Community & Social Service | 0 (0.0%) | 28 (100.0%) |
| Education, Arts & Media | 0 (0.0%) | 28 (100.0%) |
| Legal Services & Support | 0 (0.0%) | 0 (0.0%) |
| Education Instruction & Library | 0 (0.0%) | 0 (0.0%) |
| Arts, Media & Entertainment | 0 (0.0%) | 0 (0.0%) |
| Health Diagnosing & Treating | 0 (0.0%) | 0 (0.0%) |
| Health Technologists | 0 (0.0%) | 0 (0.0%) |
| Total (Category) | 5 (15.1%) | 28 (84.9%) |
| Total (Overall) | 73 (47.7%) | 80 (52.3%) |
Services Occupations
Services Occupations by Sex
| Occupation | Male | Female |
| Healthcare Support | 0 (0.0%) | 0 (0.0%) |
| Security & Protection | 0 (0.0%) | 0 (0.0%) |
| Firefighting & Prevention | 0 (0.0%) | 0 (0.0%) |
| Law Enforcement | 0 (0.0%) | 0 (0.0%) |
| Food Preparation & Serving | 0 (0.0%) | 0 (0.0%) |
| Cleaning & Maintenance | 0 (0.0%) | 0 (0.0%) |
| Personal Care & Service | 0 (0.0%) | 0 (0.0%) |
| Total (Category) | 0 (0.0%) | 0 (0.0%) |
| Total (Overall) | 73 (47.7%) | 80 (52.3%) |
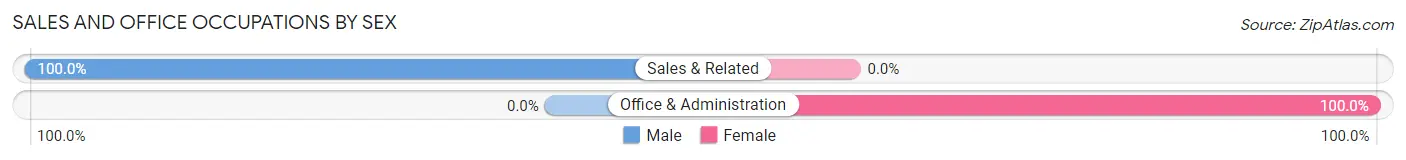
Sales and Office Occupations
The most common Sales and Office occupations in Dames Quarter are Sales & Related (52 | 34.0%), and Office & Administration (52 | 34.0%).
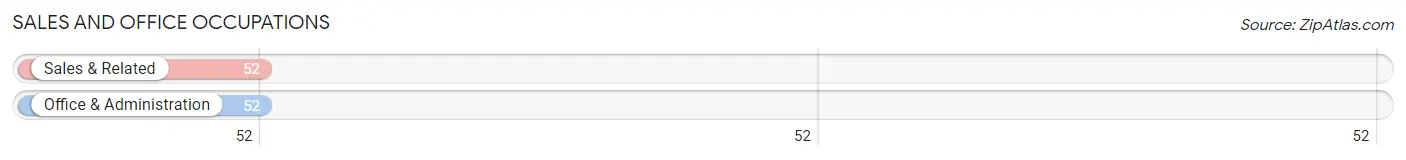
Sales and Office Occupations by Sex
| Occupation | Male | Female |
| Sales & Related | 52 (100.0%) | 0 (0.0%) |
| Office & Administration | 0 (0.0%) | 52 (100.0%) |
| Total (Category) | 52 (50.0%) | 52 (50.0%) |
| Total (Overall) | 73 (47.7%) | 80 (52.3%) |
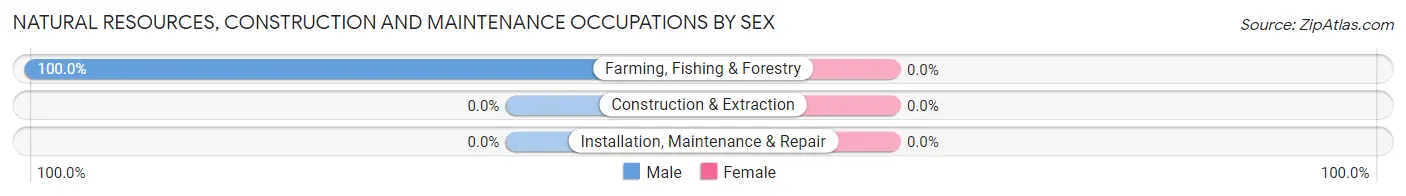
Natural Resources, Construction and Maintenance Occupations
The most common Natural Resources, Construction and Maintenance occupations in Dames Quarter are , and Farming, Fishing & Forestry (16 | 10.5%).
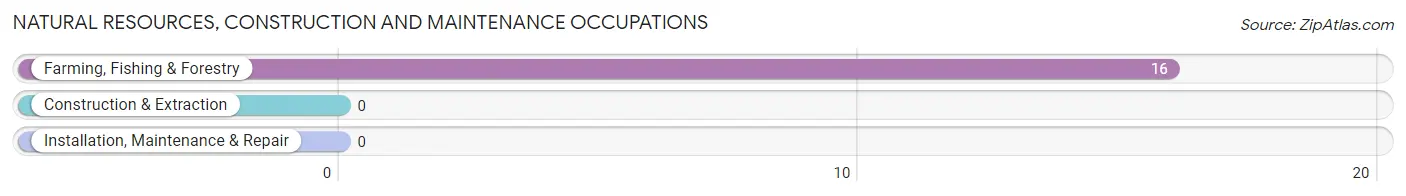
Natural Resources, Construction and Maintenance Occupations by Sex
| Occupation | Male | Female |
| Farming, Fishing & Forestry | 16 (100.0%) | 0 (0.0%) |
| Construction & Extraction | 0 (0.0%) | 0 (0.0%) |
| Installation, Maintenance & Repair | 0 (0.0%) | 0 (0.0%) |
| Total (Category) | 16 (100.0%) | 0 (0.0%) |
| Total (Overall) | 73 (47.7%) | 80 (52.3%) |
Production, Transportation and Moving Occupations
Production, Transportation and Moving Occupations by Sex
| Occupation | Male | Female |
| Production | 0 (0.0%) | 0 (0.0%) |
| Transportation | 0 (0.0%) | 0 (0.0%) |
| Material Moving | 0 (0.0%) | 0 (0.0%) |
| Total (Category) | 0 (0.0%) | 0 (0.0%) |
| Total (Overall) | 73 (47.7%) | 80 (52.3%) |
Employment Industries by Sex in Dames Quarter
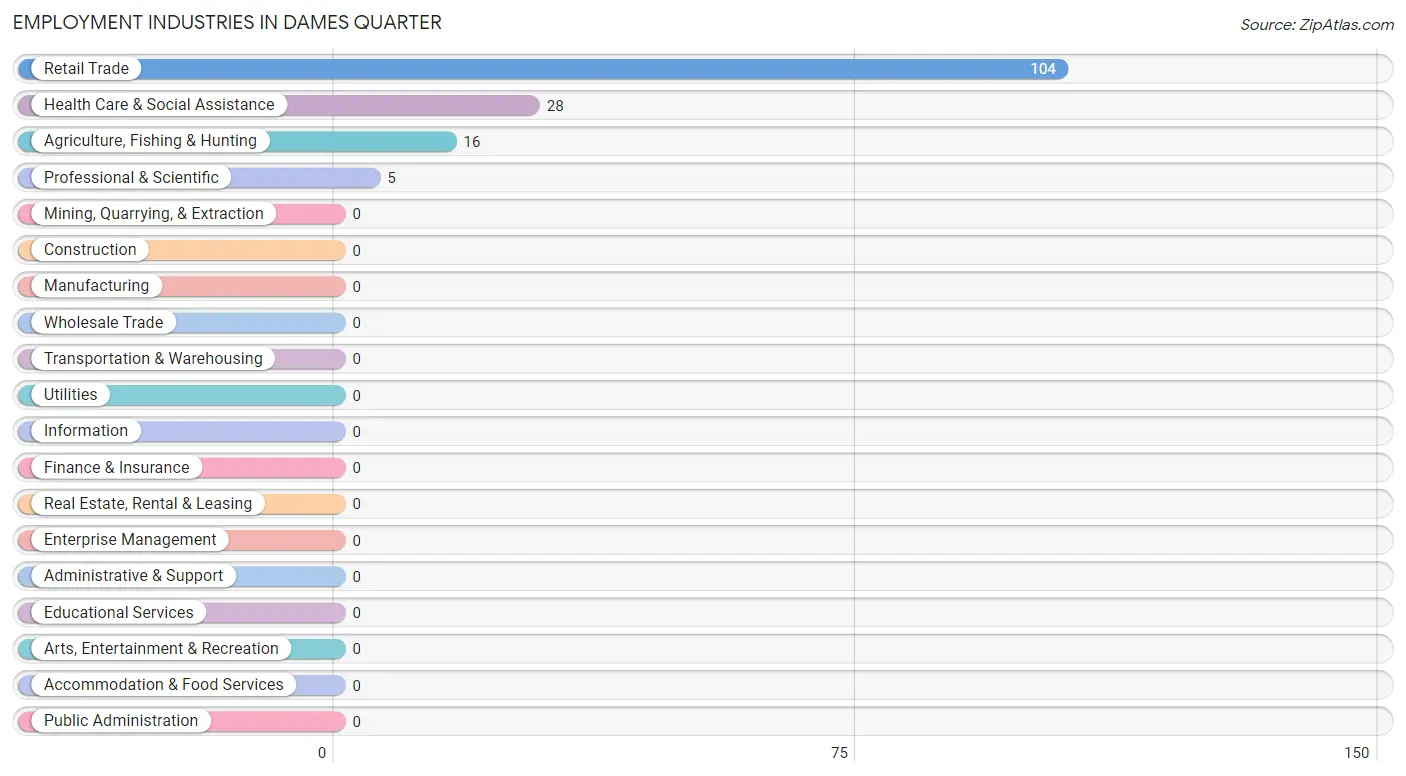
Employment Industries in Dames Quarter
The major employment industries in Dames Quarter include Retail Trade (104 | 68.0%), Health Care & Social Assistance (28 | 18.3%), Agriculture, Fishing & Hunting (16 | 10.5%), and Professional & Scientific (5 | 3.3%).
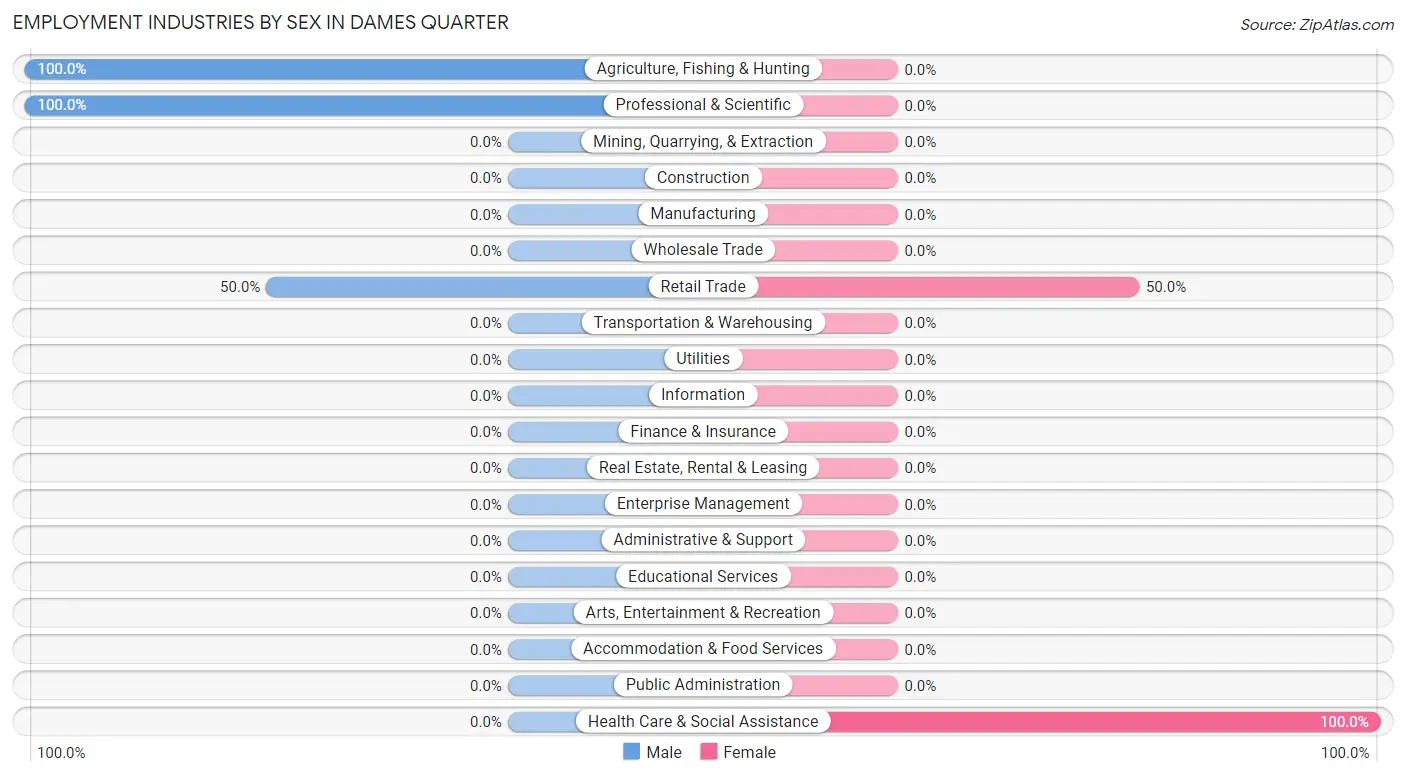
Employment Industries by Sex in Dames Quarter
The Dames Quarter industries that see more men than women are Agriculture, Fishing & Hunting (100.0%), Professional & Scientific (100.0%), and Retail Trade (50.0%), whereas the industries that tend to have a higher number of women are Health Care & Social Assistance (100.0%), and Retail Trade (50.0%).
| Industry | Male | Female |
| Agriculture, Fishing & Hunting | 16 (100.0%) | 0 (0.0%) |
| Mining, Quarrying, & Extraction | 0 (0.0%) | 0 (0.0%) |
| Construction | 0 (0.0%) | 0 (0.0%) |
| Manufacturing | 0 (0.0%) | 0 (0.0%) |
| Wholesale Trade | 0 (0.0%) | 0 (0.0%) |
| Retail Trade | 52 (50.0%) | 52 (50.0%) |
| Transportation & Warehousing | 0 (0.0%) | 0 (0.0%) |
| Utilities | 0 (0.0%) | 0 (0.0%) |
| Information | 0 (0.0%) | 0 (0.0%) |
| Finance & Insurance | 0 (0.0%) | 0 (0.0%) |
| Real Estate, Rental & Leasing | 0 (0.0%) | 0 (0.0%) |
| Professional & Scientific | 5 (100.0%) | 0 (0.0%) |
| Enterprise Management | 0 (0.0%) | 0 (0.0%) |
| Administrative & Support | 0 (0.0%) | 0 (0.0%) |
| Educational Services | 0 (0.0%) | 0 (0.0%) |
| Health Care & Social Assistance | 0 (0.0%) | 28 (100.0%) |
| Arts, Entertainment & Recreation | 0 (0.0%) | 0 (0.0%) |
| Accommodation & Food Services | 0 (0.0%) | 0 (0.0%) |
| Public Administration | 0 (0.0%) | 0 (0.0%) |
| Total | 73 (47.7%) | 80 (52.3%) |
Education in Dames Quarter
School Enrollment in Dames Quarter
The most common levels of schooling among the 30 students in Dames Quarter are college / undergraduate (19 | 63.3%), and high school (11 | 36.7%).
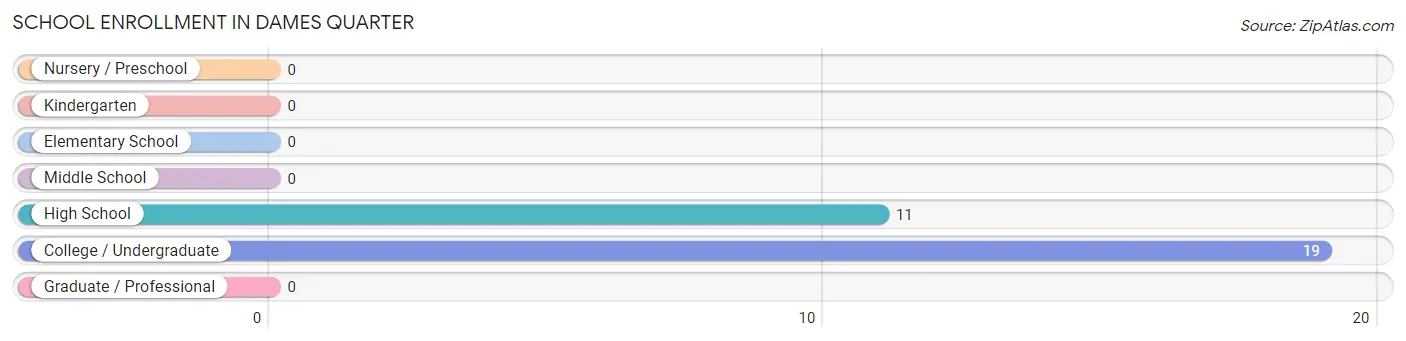
| School Level | # Students | % Students |
| Nursery / Preschool | 0 | 0.0% |
| Kindergarten | 0 | 0.0% |
| Elementary School | 0 | 0.0% |
| Middle School | 0 | 0.0% |
| High School | 11 | 36.7% |
| College / Undergraduate | 19 | 63.3% |
| Graduate / Professional | 0 | 0.0% |
| Total | 30 | 100.0% |
School Enrollment by Age by Funding Source in Dames Quarter
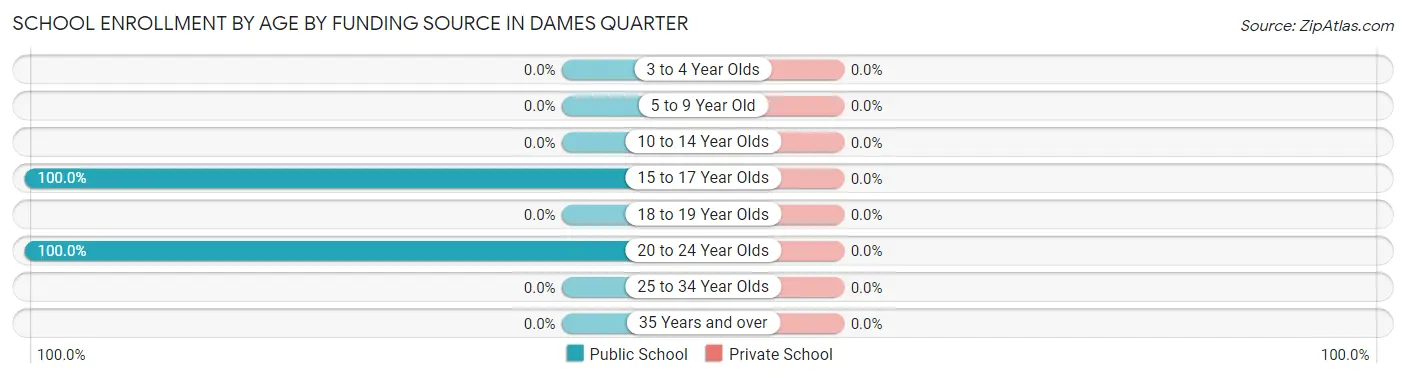
| Age Bracket | Public School | Private School |
| 3 to 4 Year Olds | 0 (0.0%) | 0 (0.0%) |
| 5 to 9 Year Old | 0 (0.0%) | 0 (0.0%) |
| 10 to 14 Year Olds | 0 (0.0%) | 0 (0.0%) |
| 15 to 17 Year Olds | 11 (100.0%) | 0 (0.0%) |
| 18 to 19 Year Olds | 0 (0.0%) | 0 (0.0%) |
| 20 to 24 Year Olds | 19 (100.0%) | 0 (0.0%) |
| 25 to 34 Year Olds | 0 (0.0%) | 0 (0.0%) |
| 35 Years and over | 0 (0.0%) | 0 (0.0%) |
| Total | 30 (100.0%) | 0 (0.0%) |
Educational Attainment by Field of Study in Dames Quarter
, and liberal arts & history (28 | 100.0%) are the most common fields of study among 28 individuals in Dames Quarter who have obtained a bachelor's degree or higher.
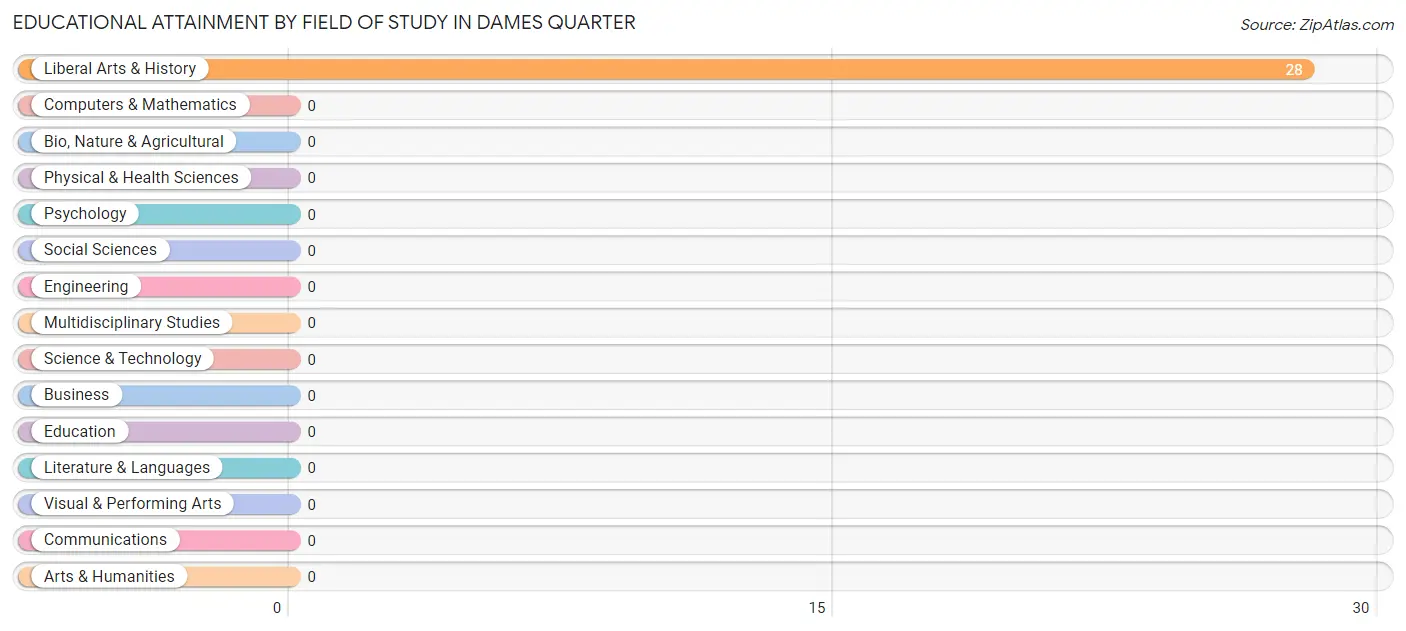
| Field of Study | # Graduates | % Graduates |
| Computers & Mathematics | 0 | 0.0% |
| Bio, Nature & Agricultural | 0 | 0.0% |
| Physical & Health Sciences | 0 | 0.0% |
| Psychology | 0 | 0.0% |
| Social Sciences | 0 | 0.0% |
| Engineering | 0 | 0.0% |
| Multidisciplinary Studies | 0 | 0.0% |
| Science & Technology | 0 | 0.0% |
| Business | 0 | 0.0% |
| Education | 0 | 0.0% |
| Literature & Languages | 0 | 0.0% |
| Liberal Arts & History | 28 | 100.0% |
| Visual & Performing Arts | 0 | 0.0% |
| Communications | 0 | 0.0% |
| Arts & Humanities | 0 | 0.0% |
| Total | 28 | 100.0% |
Transportation & Commute in Dames Quarter
Vehicle Availability by Sex in Dames Quarter
The most prevalent vehicle ownership categories in Dames Quarter are males with 2 vehicles (52, accounting for 71.2%) and females with 2 vehicles (52, making up 65.0%).
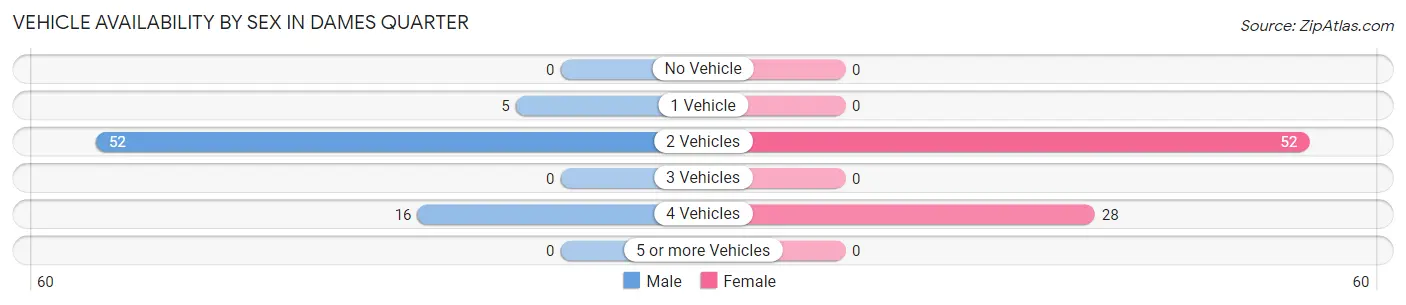
| Vehicles Available | Male | Female |
| No Vehicle | 0 (0.0%) | 0 (0.0%) |
| 1 Vehicle | 5 (6.9%) | 0 (0.0%) |
| 2 Vehicles | 52 (71.2%) | 52 (65.0%) |
| 3 Vehicles | 0 (0.0%) | 0 (0.0%) |
| 4 Vehicles | 16 (21.9%) | 28 (35.0%) |
| 5 or more Vehicles | 0 (0.0%) | 0 (0.0%) |
| Total | 73 (100.0%) | 80 (100.0%) |
Commute Time in Dames Quarter
The most frequently occuring commute durations in Dames Quarter are 30 to 34 minutes (104 commuters, 68.0%), 15 to 19 minutes (28 commuters, 18.3%), and 10 to 14 minutes (16 commuters, 10.5%).
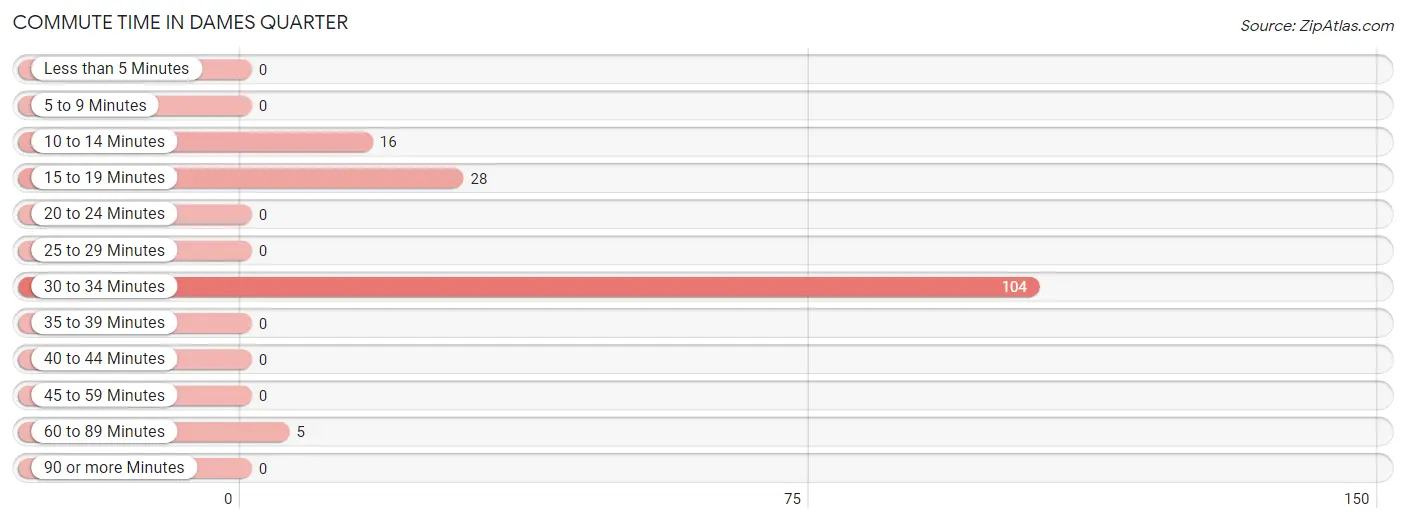
| Commute Time | # Commuters | % Commuters |
| Less than 5 Minutes | 0 | 0.0% |
| 5 to 9 Minutes | 0 | 0.0% |
| 10 to 14 Minutes | 16 | 10.5% |
| 15 to 19 Minutes | 28 | 18.3% |
| 20 to 24 Minutes | 0 | 0.0% |
| 25 to 29 Minutes | 0 | 0.0% |
| 30 to 34 Minutes | 104 | 68.0% |
| 35 to 39 Minutes | 0 | 0.0% |
| 40 to 44 Minutes | 0 | 0.0% |
| 45 to 59 Minutes | 0 | 0.0% |
| 60 to 89 Minutes | 5 | 3.3% |
| 90 or more Minutes | 0 | 0.0% |
Commute Time by Sex in Dames Quarter
The most common commute times in Dames Quarter are 30 to 34 minutes (52 commuters, 71.2%) for males and 30 to 34 minutes (52 commuters, 65.0%) for females.
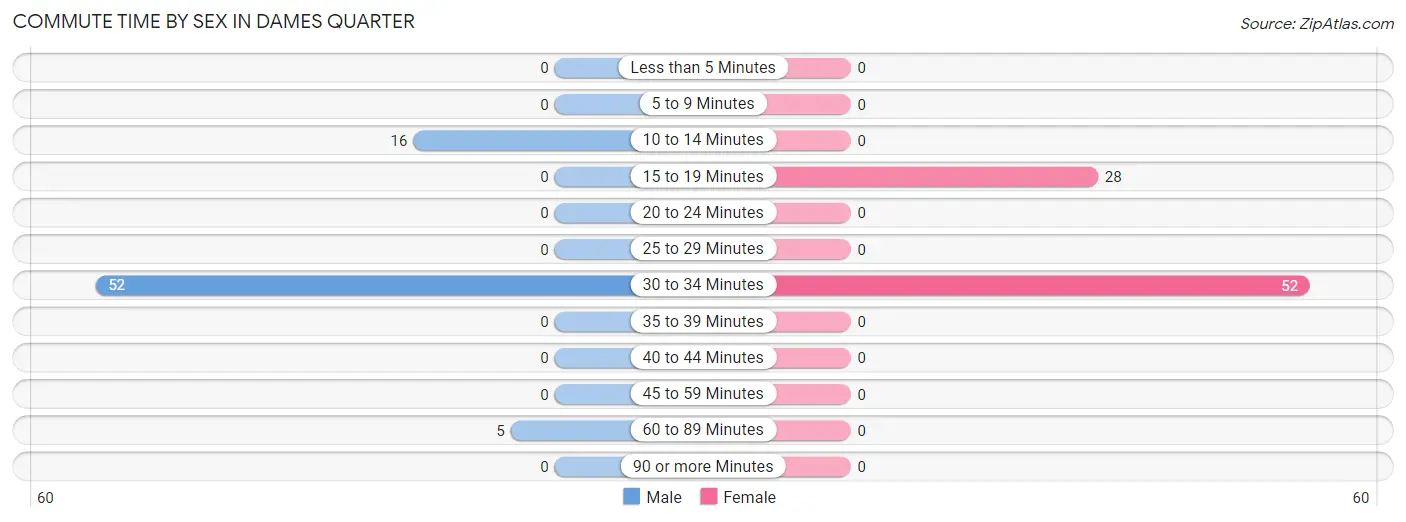
| Commute Time | Male | Female |
| Less than 5 Minutes | 0 (0.0%) | 0 (0.0%) |
| 5 to 9 Minutes | 0 (0.0%) | 0 (0.0%) |
| 10 to 14 Minutes | 16 (21.9%) | 0 (0.0%) |
| 15 to 19 Minutes | 0 (0.0%) | 28 (35.0%) |
| 20 to 24 Minutes | 0 (0.0%) | 0 (0.0%) |
| 25 to 29 Minutes | 0 (0.0%) | 0 (0.0%) |
| 30 to 34 Minutes | 52 (71.2%) | 52 (65.0%) |
| 35 to 39 Minutes | 0 (0.0%) | 0 (0.0%) |
| 40 to 44 Minutes | 0 (0.0%) | 0 (0.0%) |
| 45 to 59 Minutes | 0 (0.0%) | 0 (0.0%) |
| 60 to 89 Minutes | 5 (6.9%) | 0 (0.0%) |
| 90 or more Minutes | 0 (0.0%) | 0 (0.0%) |
Time of Departure to Work by Sex in Dames Quarter
The most frequent times of departure to work in Dames Quarter are 7:30 AM to 7:59 AM (52, 71.2%) for males and 7:30 AM to 7:59 AM (80, 100.0%) for females.
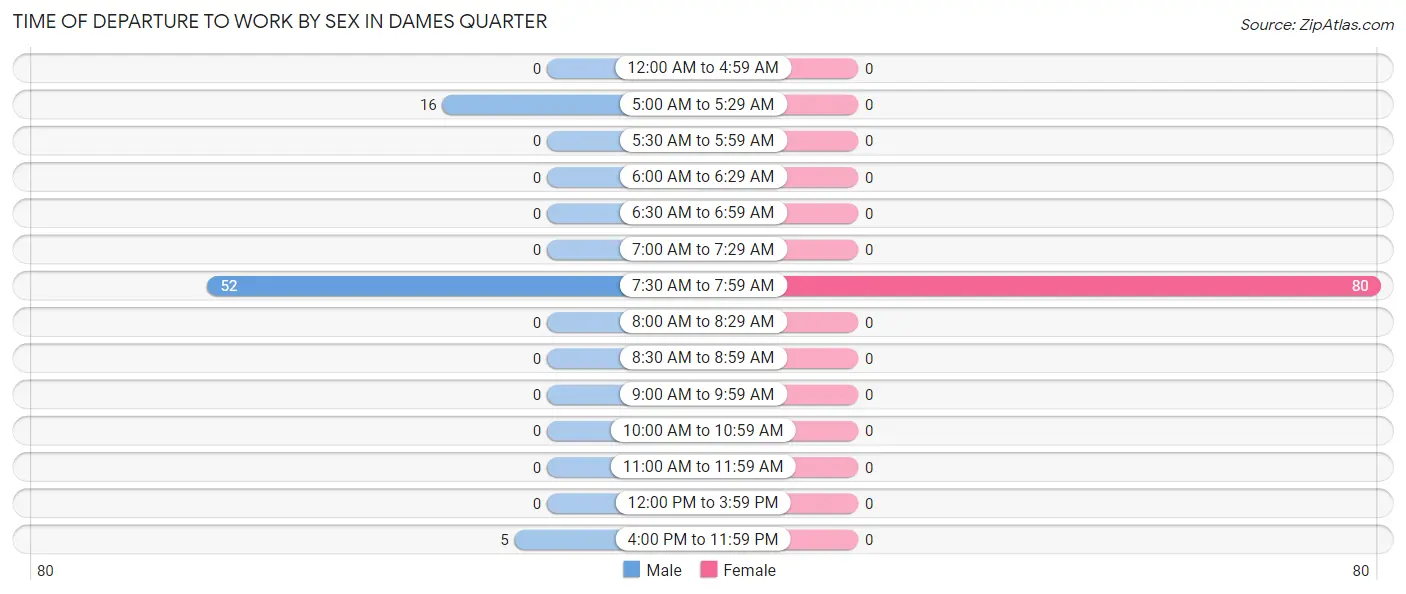
| Time of Departure | Male | Female |
| 12:00 AM to 4:59 AM | 0 (0.0%) | 0 (0.0%) |
| 5:00 AM to 5:29 AM | 16 (21.9%) | 0 (0.0%) |
| 5:30 AM to 5:59 AM | 0 (0.0%) | 0 (0.0%) |
| 6:00 AM to 6:29 AM | 0 (0.0%) | 0 (0.0%) |
| 6:30 AM to 6:59 AM | 0 (0.0%) | 0 (0.0%) |
| 7:00 AM to 7:29 AM | 0 (0.0%) | 0 (0.0%) |
| 7:30 AM to 7:59 AM | 52 (71.2%) | 80 (100.0%) |
| 8:00 AM to 8:29 AM | 0 (0.0%) | 0 (0.0%) |
| 8:30 AM to 8:59 AM | 0 (0.0%) | 0 (0.0%) |
| 9:00 AM to 9:59 AM | 0 (0.0%) | 0 (0.0%) |
| 10:00 AM to 10:59 AM | 0 (0.0%) | 0 (0.0%) |
| 11:00 AM to 11:59 AM | 0 (0.0%) | 0 (0.0%) |
| 12:00 PM to 3:59 PM | 0 (0.0%) | 0 (0.0%) |
| 4:00 PM to 11:59 PM | 5 (6.9%) | 0 (0.0%) |
| Total | 73 (100.0%) | 80 (100.0%) |
Housing Occupancy in Dames Quarter
Occupancy by Ownership in Dames Quarter
Of the total 62 dwellings in Dames Quarter, owner-occupied units account for 62 (100.0%), while renter-occupied units make up 0 (0.0%).
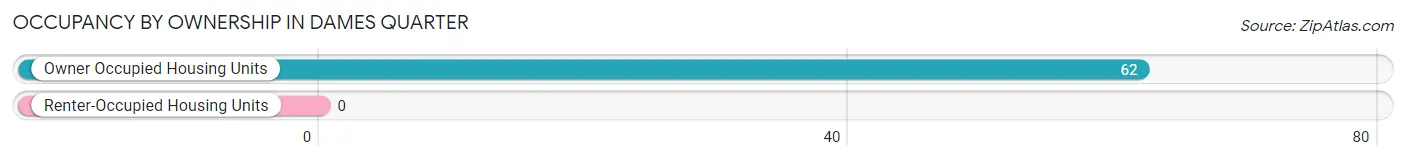
| Occupancy | # Housing Units | % Housing Units |
| Owner Occupied Housing Units | 62 | 100.0% |
| Renter-Occupied Housing Units | 0 | 0.0% |
| Total Occupied Housing Units | 62 | 100.0% |
Occupancy by Household Size in Dames Quarter
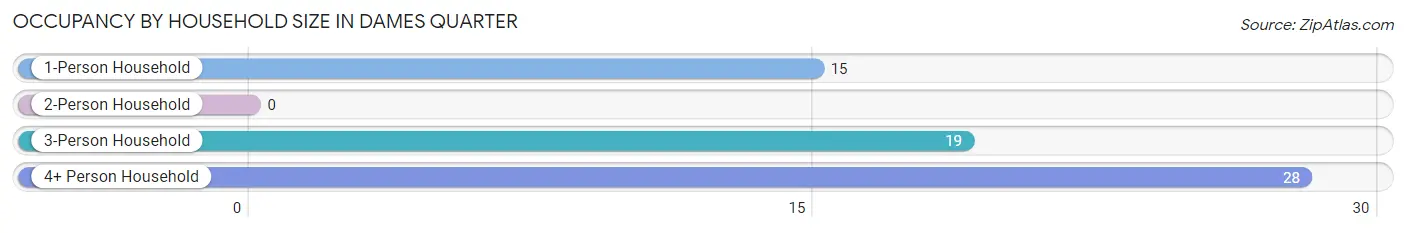
| Household Size | # Housing Units | % Housing Units |
| 1-Person Household | 15 | 24.2% |
| 2-Person Household | 0 | 0.0% |
| 3-Person Household | 19 | 30.6% |
| 4+ Person Household | 28 | 45.2% |
| Total Housing Units | 62 | 100.0% |
Occupancy by Ownership by Household Size in Dames Quarter
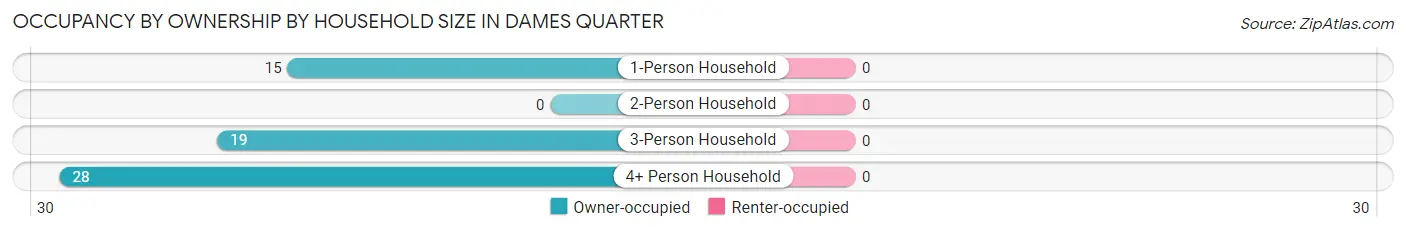
| Household Size | Owner-occupied | Renter-occupied |
| 1-Person Household | 15 (100.0%) | 0 (0.0%) |
| 2-Person Household | 0 (0.0%) | 0 (0.0%) |
| 3-Person Household | 19 (100.0%) | 0 (0.0%) |
| 4+ Person Household | 28 (100.0%) | 0 (0.0%) |
| Total Housing Units | 62 (100.0%) | 0 (0.0%) |
Occupancy by Educational Attainment in Dames Quarter
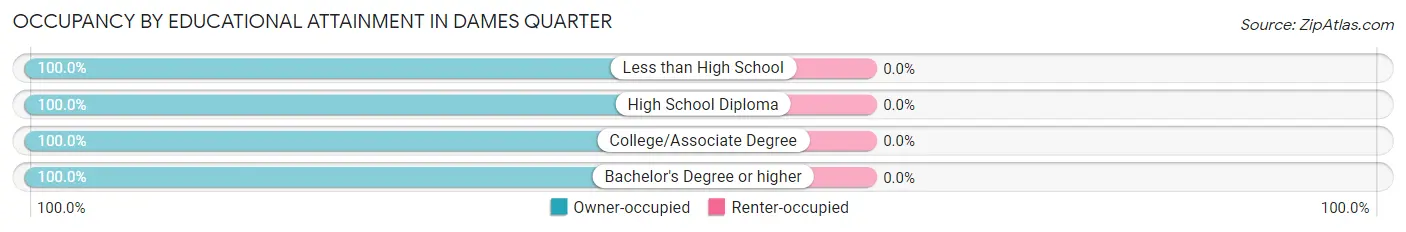
| Household Size | Owner-occupied | Renter-occupied |
| Less than High School | 5 (100.0%) | 0 (0.0%) |
| High School Diploma | 24 (100.0%) | 0 (0.0%) |
| College/Associate Degree | 5 (100.0%) | 0 (0.0%) |
| Bachelor's Degree or higher | 28 (100.0%) | 0 (0.0%) |
Occupancy by Age of Householder in Dames Quarter
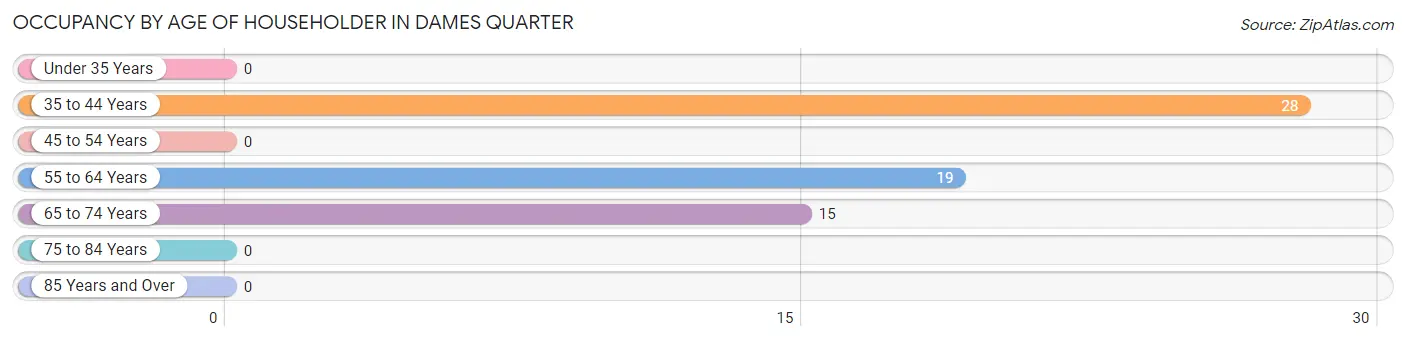
| Age Bracket | # Households | % Households |
| Under 35 Years | 0 | 0.0% |
| 35 to 44 Years | 28 | 45.2% |
| 45 to 54 Years | 0 | 0.0% |
| 55 to 64 Years | 19 | 30.6% |
| 65 to 74 Years | 15 | 24.2% |
| 75 to 84 Years | 0 | 0.0% |
| 85 Years and Over | 0 | 0.0% |
| Total | 62 | 100.0% |
Housing Finances in Dames Quarter
Median Income by Occupancy in Dames Quarter
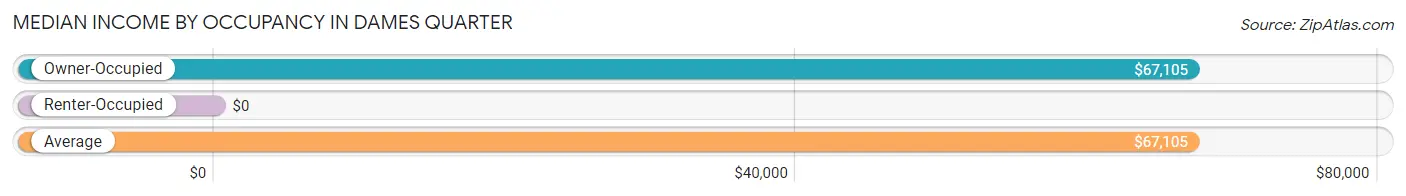
| Occupancy Type | # Households | Median Income |
| Owner-Occupied | 62 (100.0%) | $67,105 |
| Renter-Occupied | 0 (0.0%) | $0 |
| Average | 62 (100.0%) | $67,105 |
Occupancy by Householder Income Bracket in Dames Quarter
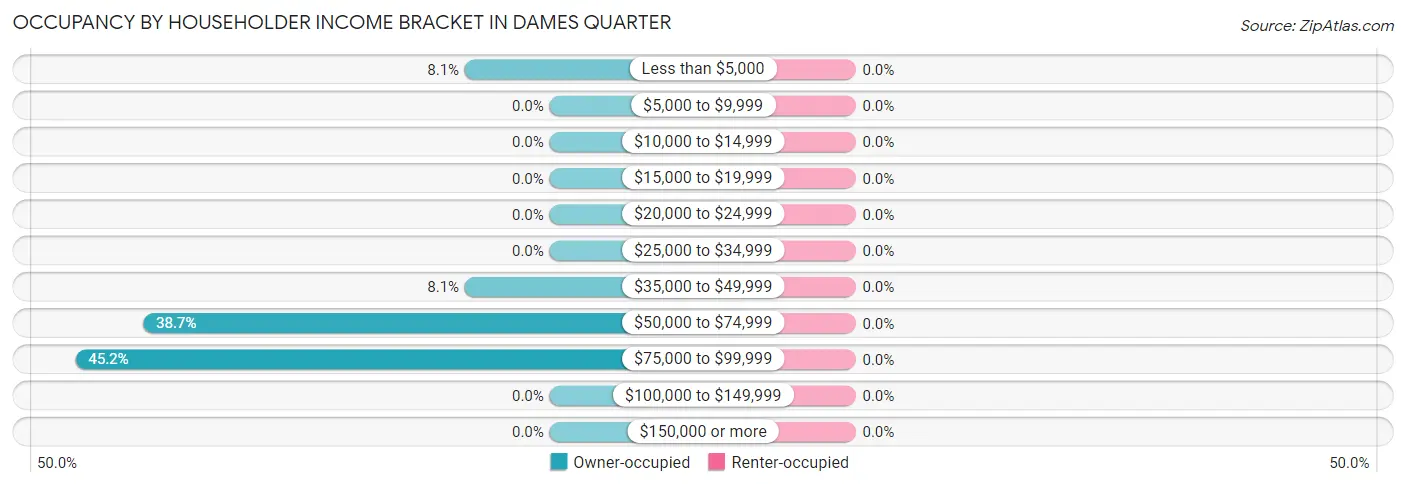
| Income Bracket | Owner-occupied | Renter-occupied |
| Less than $5,000 | 5 (8.1%) | 0 (0.0%) |
| $5,000 to $9,999 | 0 (0.0%) | 0 (0.0%) |
| $10,000 to $14,999 | 0 (0.0%) | 0 (0.0%) |
| $15,000 to $19,999 | 0 (0.0%) | 0 (0.0%) |
| $20,000 to $24,999 | 0 (0.0%) | 0 (0.0%) |
| $25,000 to $34,999 | 0 (0.0%) | 0 (0.0%) |
| $35,000 to $49,999 | 5 (8.1%) | 0 (0.0%) |
| $50,000 to $74,999 | 24 (38.7%) | 0 (0.0%) |
| $75,000 to $99,999 | 28 (45.2%) | 0 (0.0%) |
| $100,000 to $149,999 | 0 (0.0%) | 0 (0.0%) |
| $150,000 or more | 0 (0.0%) | 0 (0.0%) |
| Total | 62 (100.0%) | 0 (0.0%) |
Monthly Housing Cost Tiers in Dames Quarter
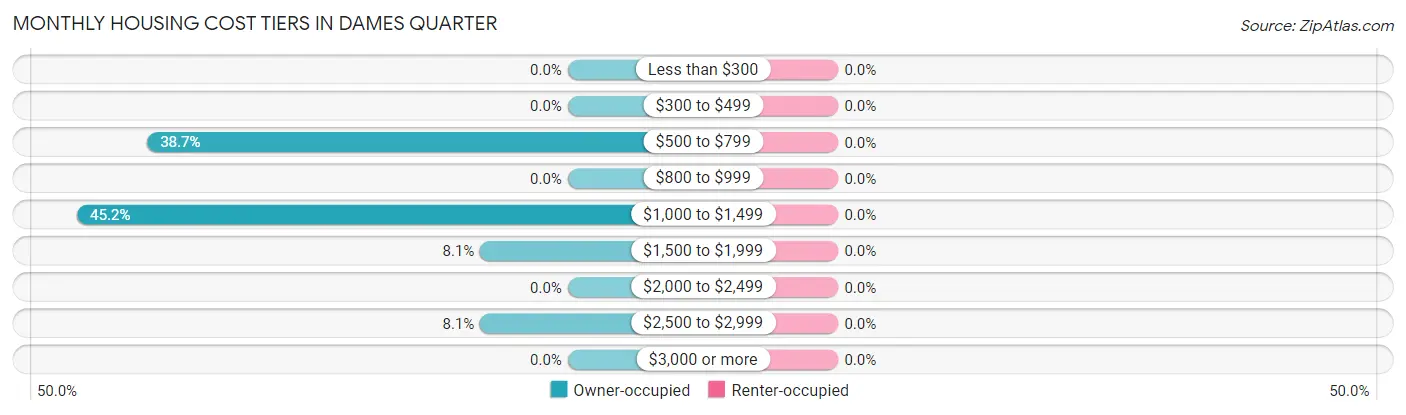
| Monthly Cost | Owner-occupied | Renter-occupied |
| Less than $300 | 0 (0.0%) | 0 (0.0%) |
| $300 to $499 | 0 (0.0%) | 0 (0.0%) |
| $500 to $799 | 24 (38.7%) | 0 (0.0%) |
| $800 to $999 | 0 (0.0%) | 0 (0.0%) |
| $1,000 to $1,499 | 28 (45.2%) | 0 (0.0%) |
| $1,500 to $1,999 | 5 (8.1%) | 0 (0.0%) |
| $2,000 to $2,499 | 0 (0.0%) | 0 (0.0%) |
| $2,500 to $2,999 | 5 (8.1%) | 0 (0.0%) |
| $3,000 or more | 0 (0.0%) | 0 (0.0%) |
| Total | 62 (100.0%) | 0 (0.0%) |
Physical Housing Characteristics in Dames Quarter
Housing Structures in Dames Quarter
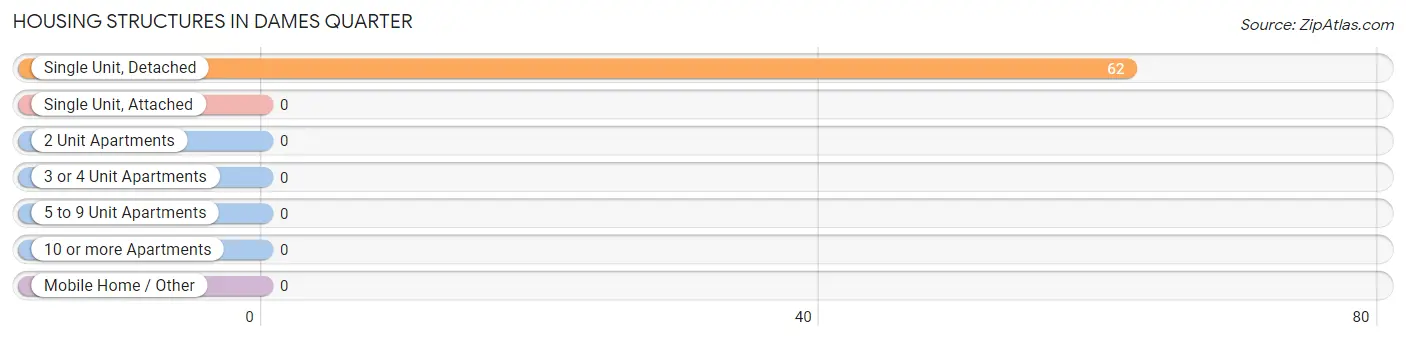
| Structure Type | # Housing Units | % Housing Units |
| Single Unit, Detached | 62 | 100.0% |
| Single Unit, Attached | 0 | 0.0% |
| 2 Unit Apartments | 0 | 0.0% |
| 3 or 4 Unit Apartments | 0 | 0.0% |
| 5 to 9 Unit Apartments | 0 | 0.0% |
| 10 or more Apartments | 0 | 0.0% |
| Mobile Home / Other | 0 | 0.0% |
| Total | 62 | 100.0% |
Housing Structures by Occupancy in Dames Quarter
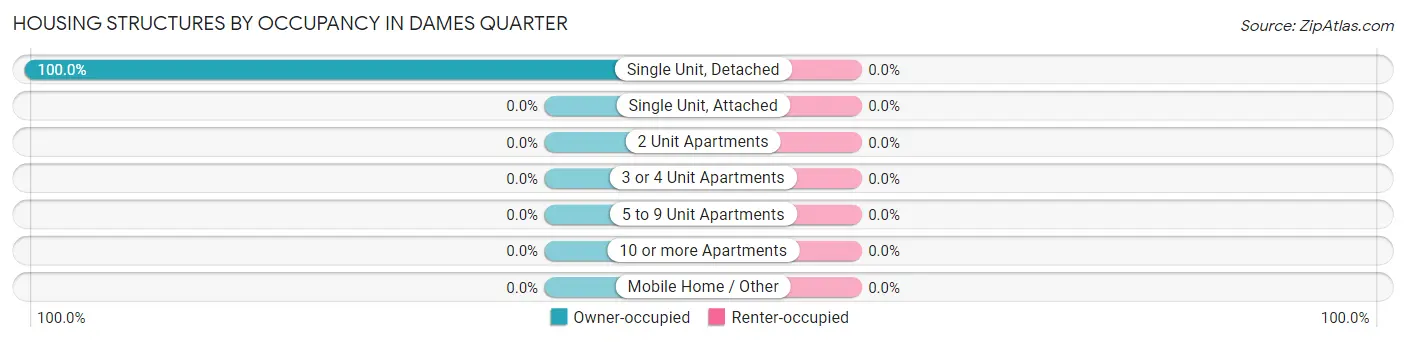
| Structure Type | Owner-occupied | Renter-occupied |
| Single Unit, Detached | 62 (100.0%) | 0 (0.0%) |
| Single Unit, Attached | 0 (0.0%) | 0 (0.0%) |
| 2 Unit Apartments | 0 (0.0%) | 0 (0.0%) |
| 3 or 4 Unit Apartments | 0 (0.0%) | 0 (0.0%) |
| 5 to 9 Unit Apartments | 0 (0.0%) | 0 (0.0%) |
| 10 or more Apartments | 0 (0.0%) | 0 (0.0%) |
| Mobile Home / Other | 0 (0.0%) | 0 (0.0%) |
| Total | 62 (100.0%) | 0 (0.0%) |
Housing Structures by Number of Rooms in Dames Quarter
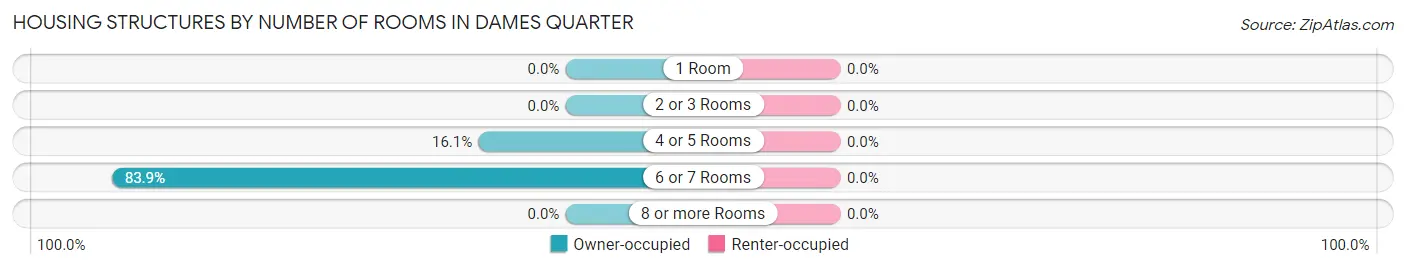
| Number of Rooms | Owner-occupied | Renter-occupied |
| 1 Room | 0 (0.0%) | 0 (0.0%) |
| 2 or 3 Rooms | 0 (0.0%) | 0 (0.0%) |
| 4 or 5 Rooms | 10 (16.1%) | 0 (0.0%) |
| 6 or 7 Rooms | 52 (83.9%) | 0 (0.0%) |
| 8 or more Rooms | 0 (0.0%) | 0 (0.0%) |
| Total | 62 (100.0%) | 0 (0.0%) |
Housing Structure by Heating Type in Dames Quarter
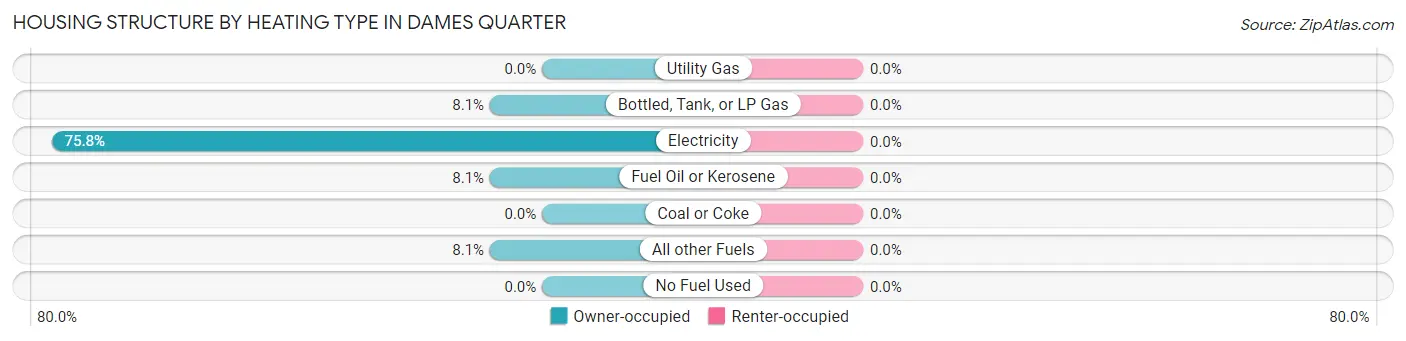
| Heating Type | Owner-occupied | Renter-occupied |
| Utility Gas | 0 (0.0%) | 0 (0.0%) |
| Bottled, Tank, or LP Gas | 5 (8.1%) | 0 (0.0%) |
| Electricity | 47 (75.8%) | 0 (0.0%) |
| Fuel Oil or Kerosene | 5 (8.1%) | 0 (0.0%) |
| Coal or Coke | 0 (0.0%) | 0 (0.0%) |
| All other Fuels | 5 (8.1%) | 0 (0.0%) |
| No Fuel Used | 0 (0.0%) | 0 (0.0%) |
| Total | 62 (100.0%) | 0 (0.0%) |
Household Vehicle Usage in Dames Quarter
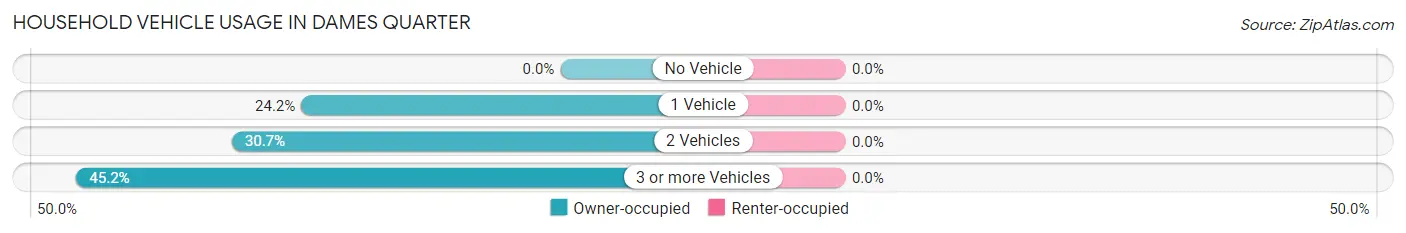
| Vehicles per Household | Owner-occupied | Renter-occupied |
| No Vehicle | 0 (0.0%) | 0 (0.0%) |
| 1 Vehicle | 15 (24.2%) | 0 (0.0%) |
| 2 Vehicles | 19 (30.6%) | 0 (0.0%) |
| 3 or more Vehicles | 28 (45.2%) | 0 (0.0%) |
| Total | 62 (100.0%) | 0 (0.0%) |
Real Estate & Mortgages in Dames Quarter
Real Estate and Mortgage Overview in Dames Quarter
| Characteristic | Without Mortgage | With Mortgage |
| Housing Units | 0 | 62 |
| Median Property Value | - | - |
| Median Household Income | - | - |
| Monthly Housing Costs | - | - |
| Real Estate Taxes | - | - |
Property Value by Mortgage Status in Dames Quarter
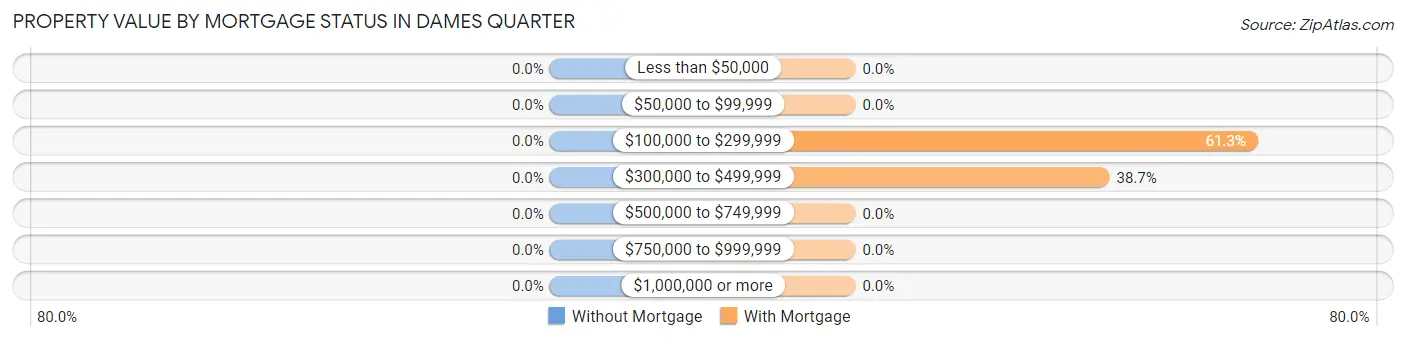
| Property Value | Without Mortgage | With Mortgage |
| Less than $50,000 | 0 (0.0%) | 0 (0.0%) |
| $50,000 to $99,999 | 0 (0.0%) | 0 (0.0%) |
| $100,000 to $299,999 | 0 (0.0%) | 38 (61.3%) |
| $300,000 to $499,999 | 0 (0.0%) | 24 (38.7%) |
| $500,000 to $749,999 | 0 (0.0%) | 0 (0.0%) |
| $750,000 to $999,999 | 0 (0.0%) | 0 (0.0%) |
| $1,000,000 or more | 0 (0.0%) | 0 (0.0%) |
| Total | 0 (0.0%) | 62 (100.0%) |
Household Income by Mortgage Status in Dames Quarter
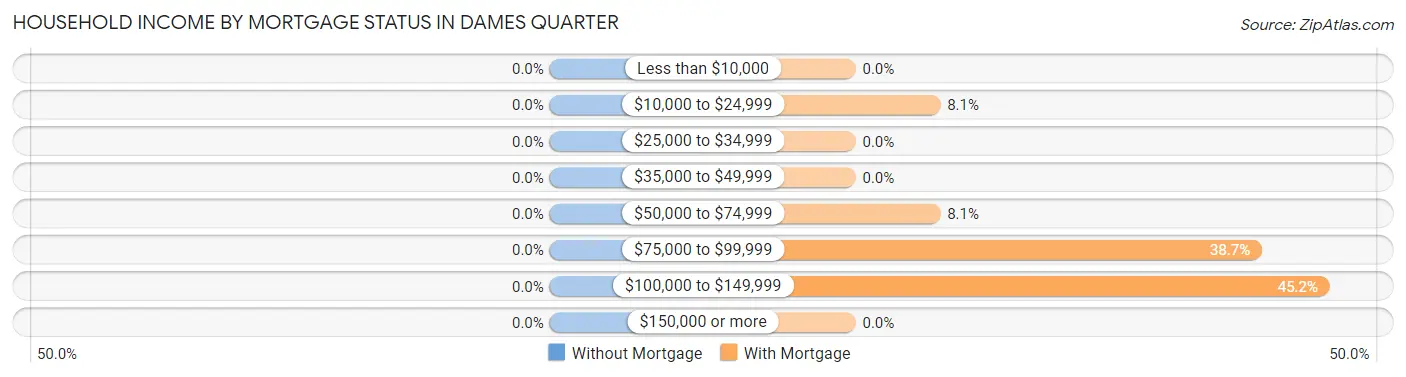
| Household Income | Without Mortgage | With Mortgage |
| Less than $10,000 | 0 (0.0%) | 0 (0.0%) |
| $10,000 to $24,999 | 0 (0.0%) | 5 (8.1%) |
| $25,000 to $34,999 | 0 (0.0%) | 0 (0.0%) |
| $35,000 to $49,999 | 0 (0.0%) | 0 (0.0%) |
| $50,000 to $74,999 | 0 (0.0%) | 5 (8.1%) |
| $75,000 to $99,999 | 0 (0.0%) | 24 (38.7%) |
| $100,000 to $149,999 | 0 (0.0%) | 28 (45.2%) |
| $150,000 or more | 0 (0.0%) | 0 (0.0%) |
| Total | 0 (0.0%) | 62 (100.0%) |
Property Value to Household Income Ratio in Dames Quarter
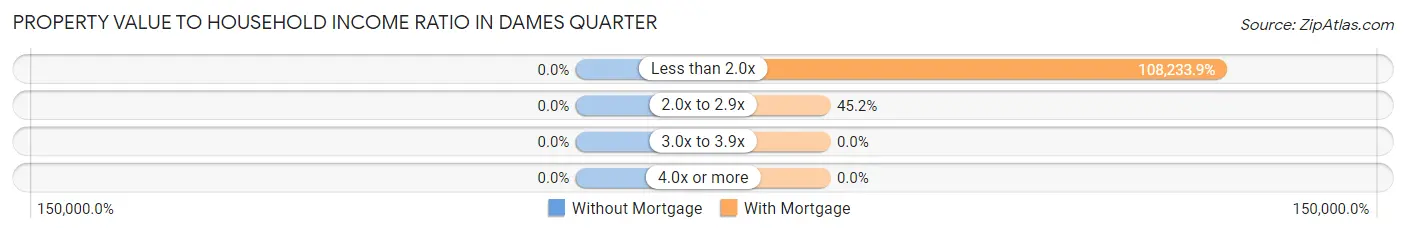
| Value-to-Income Ratio | Without Mortgage | With Mortgage |
| Less than 2.0x | 0 (0.0%) | 67,105 (108,233.9%) |
| 2.0x to 2.9x | 0 (0.0%) | 28 (45.2%) |
| 3.0x to 3.9x | 0 (0.0%) | 0 (0.0%) |
| 4.0x or more | 0 (0.0%) | 0 (0.0%) |
| Total | 0 (0.0%) | 62 (100.0%) |
Real Estate Taxes by Mortgage Status in Dames Quarter
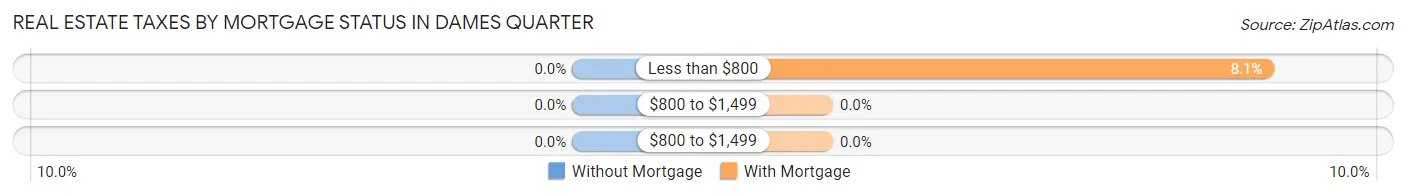
| Property Taxes | Without Mortgage | With Mortgage |
| Less than $800 | 0 (0.0%) | 5 (8.1%) |
| $800 to $1,499 | 0 (0.0%) | 0 (0.0%) |
| $800 to $1,499 | 0 (0.0%) | 0 (0.0%) |
| Total | 0 (0.0%) | 62 (100.0%) |
Health & Disability in Dames Quarter
Health Insurance Coverage by Age in Dames Quarter
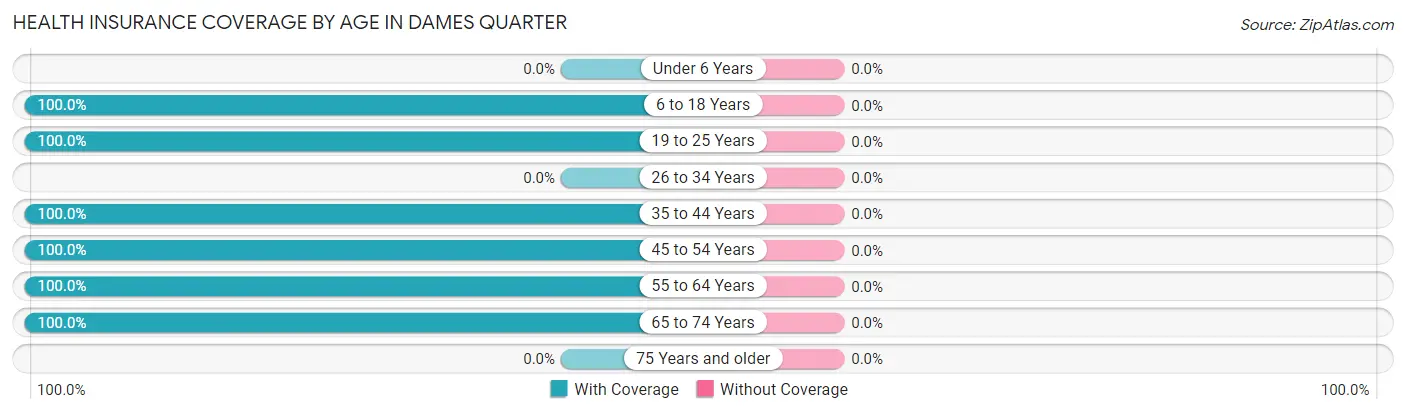
| Age Bracket | With Coverage | Without Coverage |
| Under 6 Years | 0 (0.0%) | 0 (0.0%) |
| 6 to 18 Years | 11 (100.0%) | 0 (0.0%) |
| 19 to 25 Years | 19 (100.0%) | 0 (0.0%) |
| 26 to 34 Years | 0 (0.0%) | 0 (0.0%) |
| 35 to 44 Years | 132 (100.0%) | 0 (0.0%) |
| 45 to 54 Years | 16 (100.0%) | 0 (0.0%) |
| 55 to 64 Years | 19 (100.0%) | 0 (0.0%) |
| 65 to 74 Years | 15 (100.0%) | 0 (0.0%) |
| 75 Years and older | 0 (0.0%) | 0 (0.0%) |
| Total | 212 (100.0%) | 0 (0.0%) |
Health Insurance Coverage by Citizenship Status in Dames Quarter
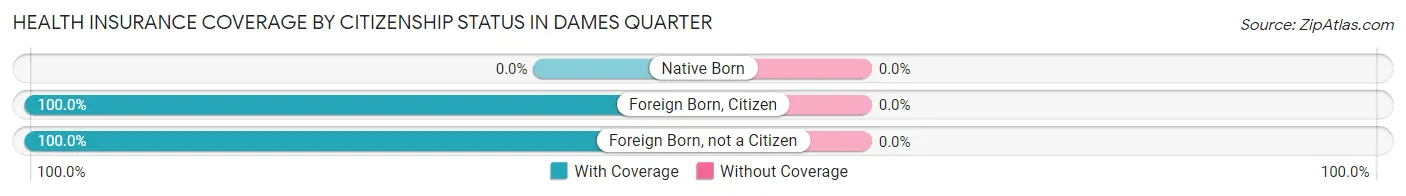
| Citizenship Status | With Coverage | Without Coverage |
| Native Born | 0 (0.0%) | 0 (0.0%) |
| Foreign Born, Citizen | 11 (100.0%) | 0 (0.0%) |
| Foreign Born, not a Citizen | 19 (100.0%) | 0 (0.0%) |
Health Insurance Coverage by Household Income in Dames Quarter
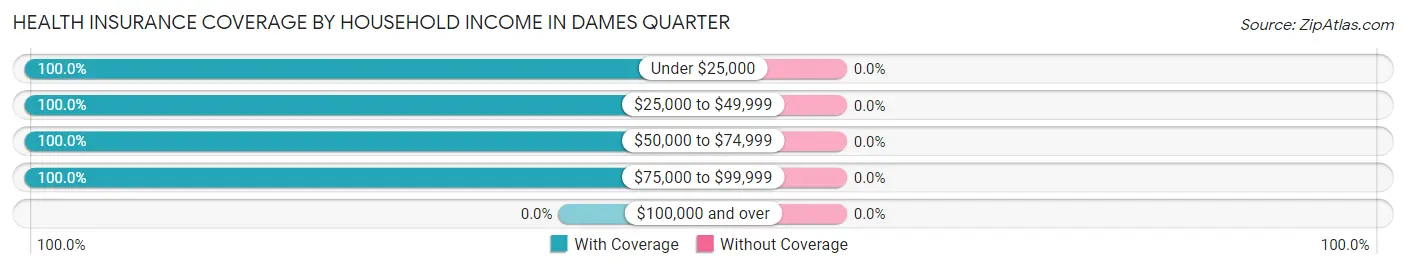
| Household Income | With Coverage | Without Coverage |
| Under $25,000 | 5 (100.0%) | 0 (0.0%) |
| $25,000 to $49,999 | 5 (100.0%) | 0 (0.0%) |
| $50,000 to $74,999 | 128 (100.0%) | 0 (0.0%) |
| $75,000 to $99,999 | 74 (100.0%) | 0 (0.0%) |
| $100,000 and over | 0 (0.0%) | 0 (0.0%) |
Public vs Private Health Insurance Coverage by Age in Dames Quarter
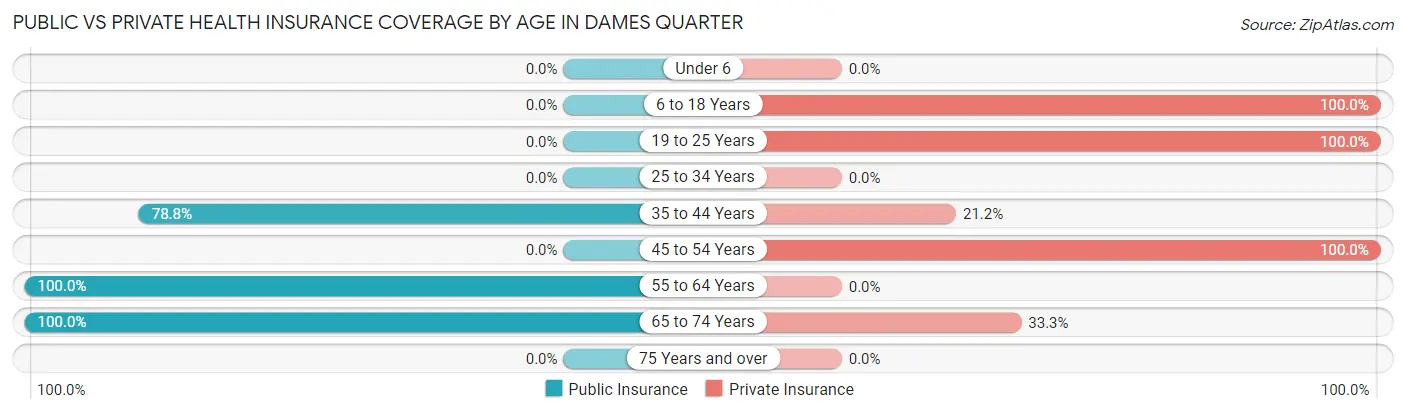
| Age Bracket | Public Insurance | Private Insurance |
| Under 6 | 0 (0.0%) | 0 (0.0%) |
| 6 to 18 Years | 0 (0.0%) | 11 (100.0%) |
| 19 to 25 Years | 0 (0.0%) | 19 (100.0%) |
| 25 to 34 Years | 0 (0.0%) | 0 (0.0%) |
| 35 to 44 Years | 104 (78.8%) | 28 (21.2%) |
| 45 to 54 Years | 0 (0.0%) | 16 (100.0%) |
| 55 to 64 Years | 19 (100.0%) | 0 (0.0%) |
| 65 to 74 Years | 15 (100.0%) | 5 (33.3%) |
| 75 Years and over | 0 (0.0%) | 0 (0.0%) |
| Total | 138 (65.1%) | 79 (37.3%) |
Disability Status by Sex by Age in Dames Quarter
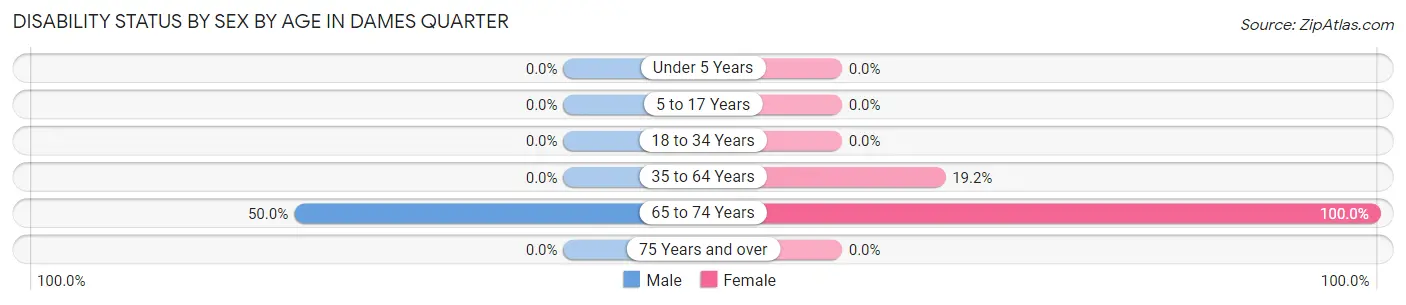
| Age Bracket | Male | Female |
| Under 5 Years | 0 (0.0%) | 0 (0.0%) |
| 5 to 17 Years | 0 (0.0%) | 0 (0.0%) |
| 18 to 34 Years | 0 (0.0%) | 0 (0.0%) |
| 35 to 64 Years | 0 (0.0%) | 19 (19.2%) |
| 65 to 74 Years | 5 (50.0%) | 5 (100.0%) |
| 75 Years and over | 0 (0.0%) | 0 (0.0%) |
Disability Class by Sex by Age in Dames Quarter
Disability Class: Hearing Difficulty
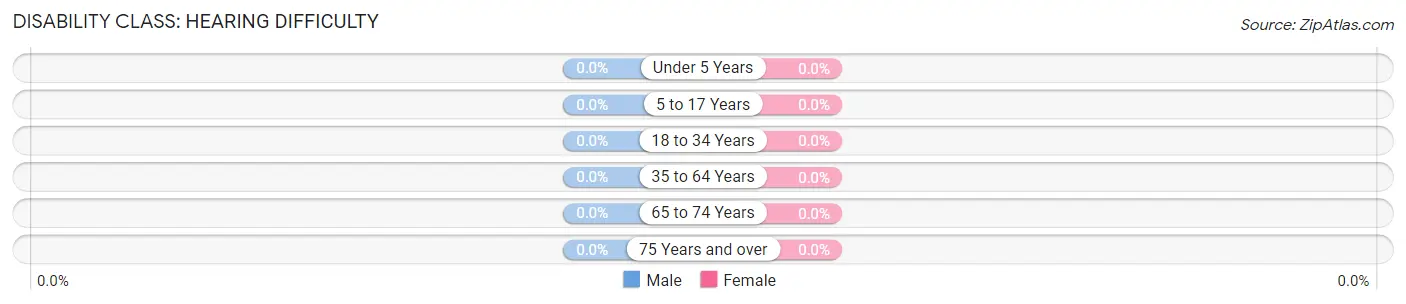
| Age Bracket | Male | Female |
| Under 5 Years | 0 (0.0%) | 0 (0.0%) |
| 5 to 17 Years | 0 (0.0%) | 0 (0.0%) |
| 18 to 34 Years | 0 (0.0%) | 0 (0.0%) |
| 35 to 64 Years | 0 (0.0%) | 0 (0.0%) |
| 65 to 74 Years | 0 (0.0%) | 0 (0.0%) |
| 75 Years and over | 0 (0.0%) | 0 (0.0%) |
Disability Class: Vision Difficulty
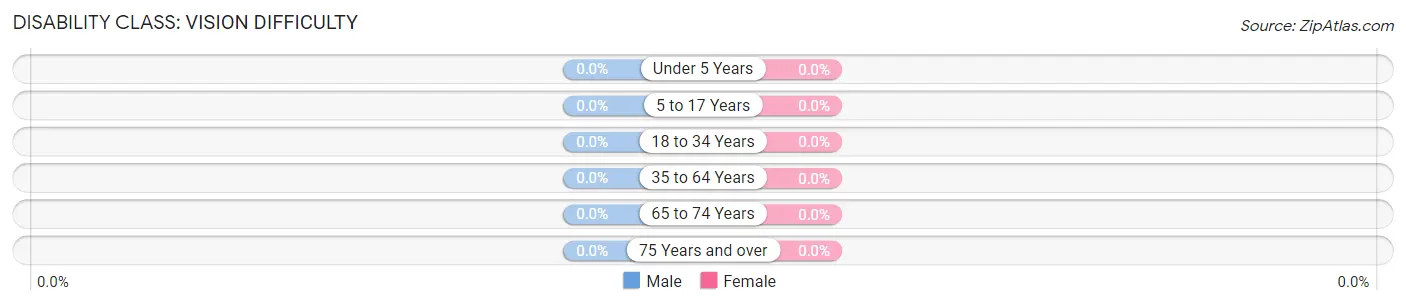
| Age Bracket | Male | Female |
| Under 5 Years | 0 (0.0%) | 0 (0.0%) |
| 5 to 17 Years | 0 (0.0%) | 0 (0.0%) |
| 18 to 34 Years | 0 (0.0%) | 0 (0.0%) |
| 35 to 64 Years | 0 (0.0%) | 0 (0.0%) |
| 65 to 74 Years | 0 (0.0%) | 0 (0.0%) |
| 75 Years and over | 0 (0.0%) | 0 (0.0%) |
Disability Class: Cognitive Difficulty
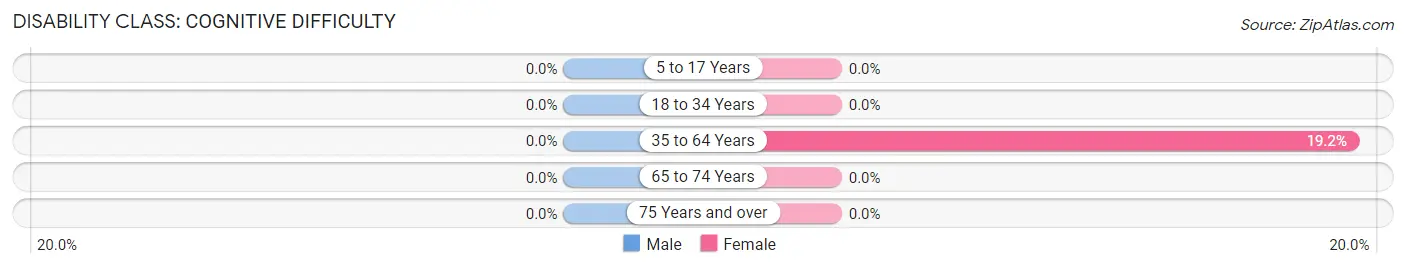
| Age Bracket | Male | Female |
| 5 to 17 Years | 0 (0.0%) | 0 (0.0%) |
| 18 to 34 Years | 0 (0.0%) | 0 (0.0%) |
| 35 to 64 Years | 0 (0.0%) | 19 (19.2%) |
| 65 to 74 Years | 0 (0.0%) | 0 (0.0%) |
| 75 Years and over | 0 (0.0%) | 0 (0.0%) |
Disability Class: Ambulatory Difficulty
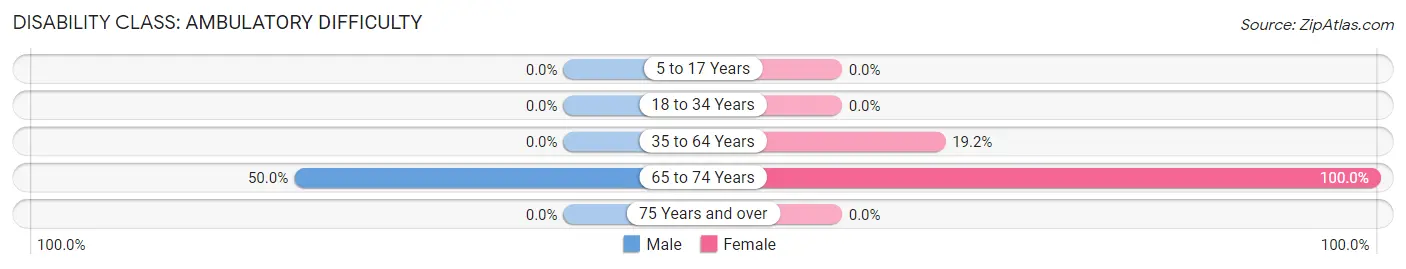
| Age Bracket | Male | Female |
| 5 to 17 Years | 0 (0.0%) | 0 (0.0%) |
| 18 to 34 Years | 0 (0.0%) | 0 (0.0%) |
| 35 to 64 Years | 0 (0.0%) | 19 (19.2%) |
| 65 to 74 Years | 5 (50.0%) | 5 (100.0%) |
| 75 Years and over | 0 (0.0%) | 0 (0.0%) |
Disability Class: Self-Care Difficulty
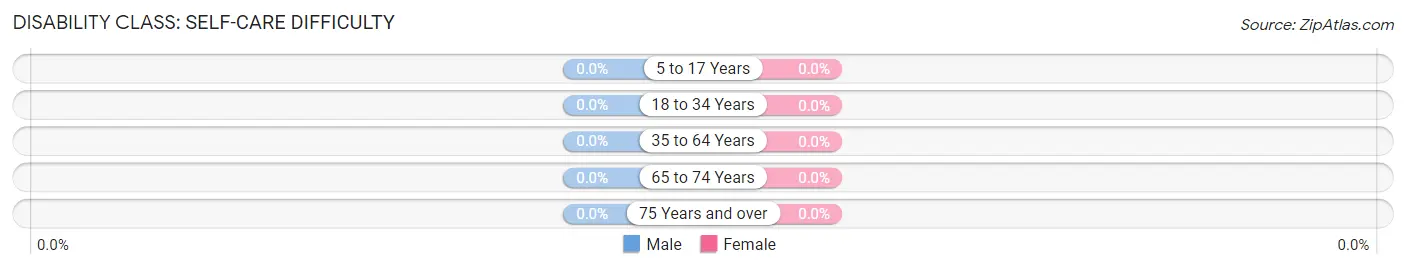
| Age Bracket | Male | Female |
| 5 to 17 Years | 0 (0.0%) | 0 (0.0%) |
| 18 to 34 Years | 0 (0.0%) | 0 (0.0%) |
| 35 to 64 Years | 0 (0.0%) | 0 (0.0%) |
| 65 to 74 Years | 0 (0.0%) | 0 (0.0%) |
| 75 Years and over | 0 (0.0%) | 0 (0.0%) |
Technology Access in Dames Quarter
Computing Device Access in Dames Quarter
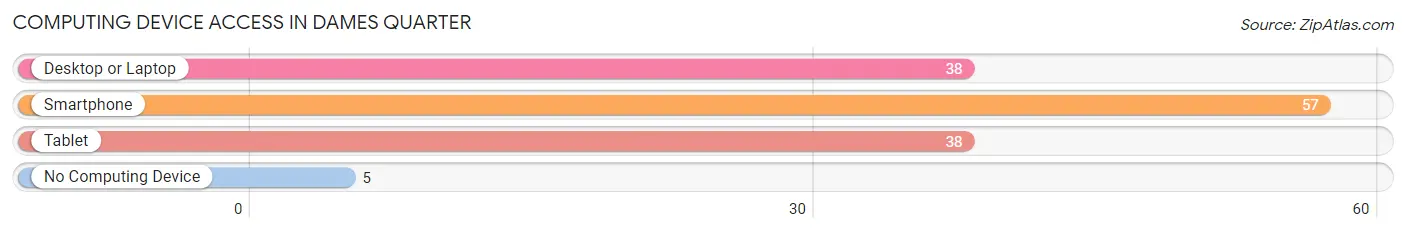
| Device Type | # Households | % Households |
| Desktop or Laptop | 38 | 61.3% |
| Smartphone | 57 | 91.9% |
| Tablet | 38 | 61.3% |
| No Computing Device | 5 | 8.1% |
| Total | 62 | 100.0% |
Internet Access in Dames Quarter
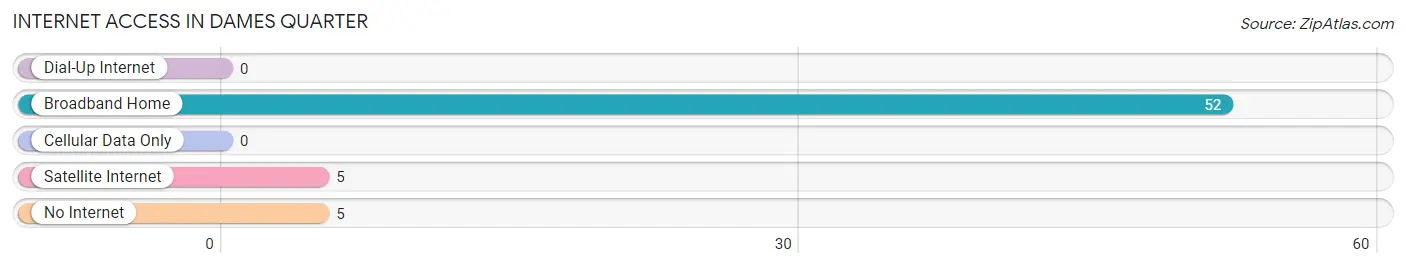
| Internet Type | # Households | % Households |
| Dial-Up Internet | 0 | 0.0% |
| Broadband Home | 52 | 83.9% |
| Cellular Data Only | 0 | 0.0% |
| Satellite Internet | 5 | 8.1% |
| No Internet | 5 | 8.1% |
| Total | 62 | 100.0% |
Dames Quarter Summary
Dames Quarter is an unincorporated community located in Somerset County, Maryland. It is situated on the eastern shore of the Chesapeake Bay, approximately 25 miles south of Salisbury. The community is bordered by the Nanticoke River to the north and the Manokin River to the south.
Geography
Dames Quarter is located at 38°17'N 75°45'W. It is situated on the eastern shore of the Chesapeake Bay, approximately 25 miles south of Salisbury. The community is bordered by the Nanticoke River to the north and the Manokin River to the south. The area is mostly rural, with a few small businesses and residential homes. The nearest major city is Salisbury, which is approximately 25 miles away.
History
Dames Quarter was first settled in the early 1700s by English settlers. The community was named after the Dames family, who were among the first settlers in the area. The community was primarily an agricultural area, with many of the residents growing corn, wheat, and other crops. In the late 1800s, the area began to develop into a small fishing village. The community was home to several seafood processing plants, which provided employment for many of the residents.
Economy
The economy of Dames Quarter is largely based on agriculture and fishing. The area is home to several farms, which produce corn, wheat, and other crops. The community is also home to several seafood processing plants, which provide employment for many of the residents. In addition, there are several small businesses in the area, including restaurants, convenience stores, and other retail establishments.
Demographics
As of the 2010 census, the population of Dames Quarter was 1,845. The racial makeup of the community was 94.3% White, 2.7% African American, 0.3% Native American, 0.7% Asian, 0.1% Pacific Islander, and 1.8% from other races. The median household income was $41,250, and the median family income was $48,750. The per capita income was $19,945.
Conclusion
Dames Quarter is a small unincorporated community located in Somerset County, Maryland. It is situated on the eastern shore of the Chesapeake Bay, approximately 25 miles south of Salisbury. The community is bordered by the Nanticoke River to the north and the Manokin River to the south. The economy of Dames Quarter is largely based on agriculture and fishing, with several farms and seafood processing plants providing employment for many of the residents. As of the 2010 census, the population of Dames Quarter was 1,845. The racial makeup of the community was 94.3% White, 2.7% African American, 0.3% Native American, 0.7% Asian, 0.1% Pacific Islander, and 1.8% from other races. The median household income was $41,250, and the median family income was $48,750. The per capita income was $19,945.
Common Questions
What is Per Capita Income in Dames Quarter?
Per Capita income in Dames Quarter is $25,147.
What is the Median Household income in Dames Quarter?
Median Household Income in Dames Quarter is $67,105.
What is Income or Wage Gap in Dames Quarter?
Income or Wage Gap in Dames Quarter is 32.5%.
Women in Dames Quarter earn 67.5 cents for every dollar earned by a man.
What is Inequality or Gini Index in Dames Quarter?
Inequality or Gini Index in Dames Quarter is 0.20.
What is the Total Population of Dames Quarter?
Total Population of Dames Quarter is 212.
What is the Total Male Population of Dames Quarter?
Total Male Population of Dames Quarter is 97.
What is the Total Female Population of Dames Quarter?
Total Female Population of Dames Quarter is 115.
What is the Ratio of Males per 100 Females in Dames Quarter?
There are 84.35 Males per 100 Females in Dames Quarter.
What is the Ratio of Females per 100 Males in Dames Quarter?
There are 118.56 Females per 100 Males in Dames Quarter.
What is the Median Population Age in Dames Quarter?
Median Population Age in Dames Quarter is 41.5 Years.
What is the Average Family Size in Dames Quarter
Average Family Size in Dames Quarter is 4.2 People.
What is the Average Household Size in Dames Quarter
Average Household Size in Dames Quarter is 3.4 People.
How Large is the Labor Force in Dames Quarter?
There are 153 People in the Labor Forcein in Dames Quarter.
What is the Percentage of People in the Labor Force in Dames Quarter?
72.2% of People are in the Labor Force in Dames Quarter.