Clermont, IN Map & Demographics
Clermont Map
Clermont Overview
$36,301
PER CAPITA INCOME
$93,698
AVG FAMILY INCOME
$81,818
AVG HOUSEHOLD INCOME
26.7%
WAGE / INCOME GAP [ % ]
73.3¢/ $1
WAGE / INCOME GAP [ $ ]
0.41
INEQUALITY / GINI INDEX
1,624
TOTAL POPULATION
836
MALE POPULATION
788
FEMALE POPULATION
106.09
MALES / 100 FEMALES
94.26
FEMALES / 100 MALES
40.0
MEDIAN AGE
3.3
AVG FAMILY SIZE
2.7
AVG HOUSEHOLD SIZE
923
LABOR FORCE [ PEOPLE ]
69.9%
PERCENT IN LABOR FORCE
3.0%
UNEMPLOYMENT RATE
Clermont Area Codes
Income in Clermont
Income Overview in Clermont
Per Capita Income in Clermont is $36,301, while median incomes of families and households are $93,698 and $81,818 respectively.
| Characteristic | Number | Measure |
| Per Capita Income | 1,624 | $36,301 |
| Median Family Income | 417 | $93,698 |
| Mean Family Income | 417 | $108,012 |
| Median Household Income | 610 | $81,818 |
| Mean Household Income | 610 | $89,124 |
| Income Deficit | 417 | $0 |
| Wage / Income Gap (%) | 1,624 | 26.69% |
| Wage / Income Gap ($) | 1,624 | 73.31¢ per $1 |
| Gini / Inequality Index | 1,624 | 0.41 |
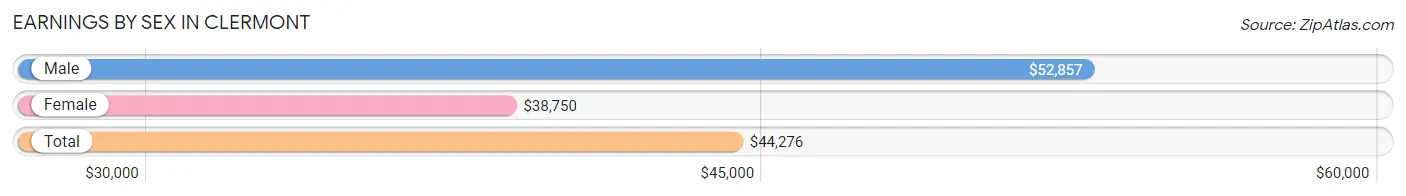
Earnings by Sex in Clermont
Average Earnings in Clermont are $44,276, $52,857 for men and $38,750 for women, a difference of 26.7%.
| Sex | Number | Average Earnings |
| Male | 464 (47.1%) | $52,857 |
| Female | 521 (52.9%) | $38,750 |
| Total | 985 (100.0%) | $44,276 |
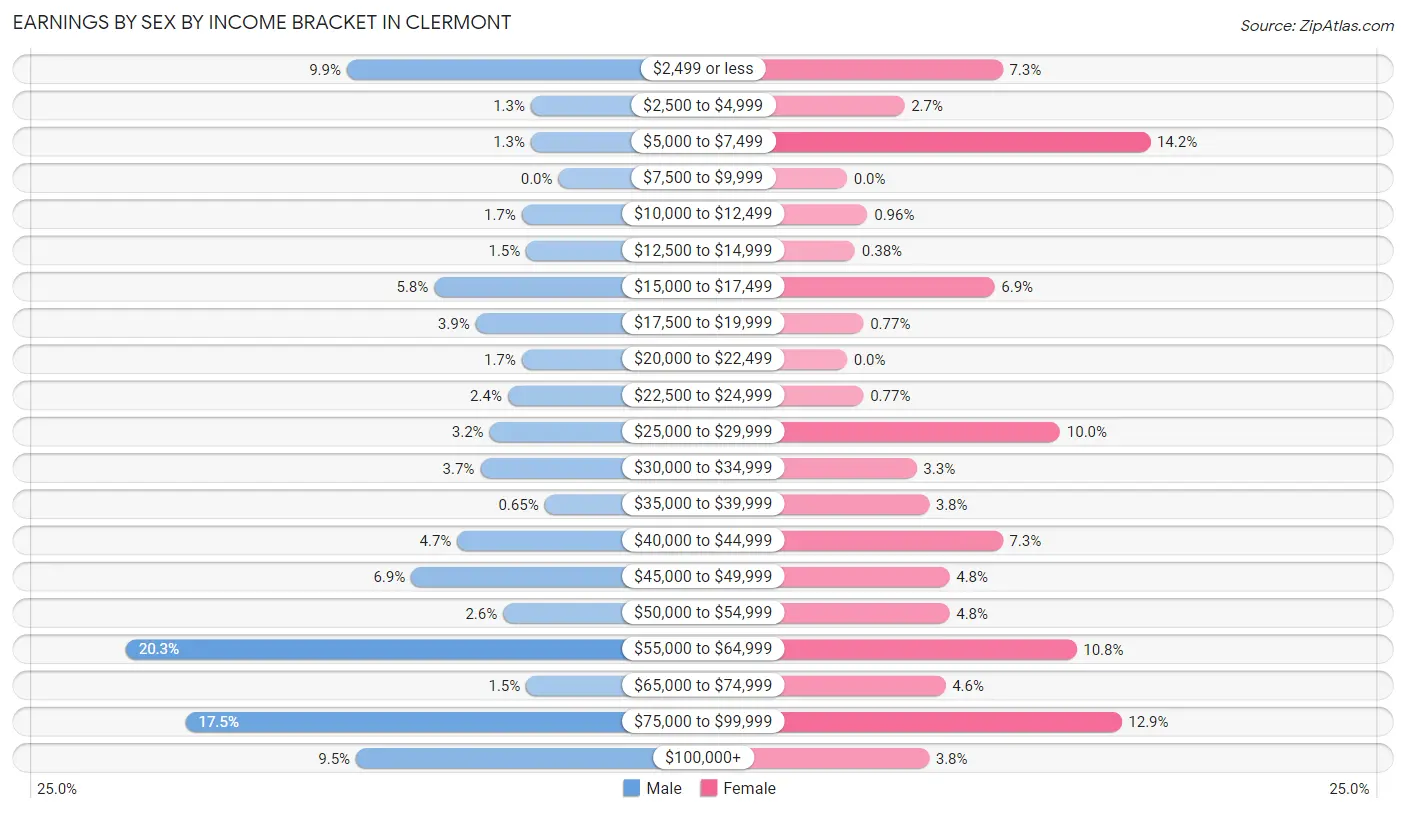
Earnings by Sex by Income Bracket in Clermont
The most common earnings brackets in Clermont are $55,000 to $64,999 for men (94 | 20.3%) and $5,000 to $7,499 for women (74 | 14.2%).
| Income | Male | Female |
| $2,499 or less | 46 (9.9%) | 38 (7.3%) |
| $2,500 to $4,999 | 6 (1.3%) | 14 (2.7%) |
| $5,000 to $7,499 | 6 (1.3%) | 74 (14.2%) |
| $7,500 to $9,999 | 0 (0.0%) | 0 (0.0%) |
| $10,000 to $12,499 | 8 (1.7%) | 5 (1.0%) |
| $12,500 to $14,999 | 7 (1.5%) | 2 (0.4%) |
| $15,000 to $17,499 | 27 (5.8%) | 36 (6.9%) |
| $17,500 to $19,999 | 18 (3.9%) | 4 (0.8%) |
| $20,000 to $22,499 | 8 (1.7%) | 0 (0.0%) |
| $22,500 to $24,999 | 11 (2.4%) | 4 (0.8%) |
| $25,000 to $29,999 | 15 (3.2%) | 52 (10.0%) |
| $30,000 to $34,999 | 17 (3.7%) | 17 (3.3%) |
| $35,000 to $39,999 | 3 (0.6%) | 20 (3.8%) |
| $40,000 to $44,999 | 22 (4.7%) | 38 (7.3%) |
| $45,000 to $49,999 | 32 (6.9%) | 25 (4.8%) |
| $50,000 to $54,999 | 12 (2.6%) | 25 (4.8%) |
| $55,000 to $64,999 | 94 (20.3%) | 56 (10.7%) |
| $65,000 to $74,999 | 7 (1.5%) | 24 (4.6%) |
| $75,000 to $99,999 | 81 (17.5%) | 67 (12.9%) |
| $100,000+ | 44 (9.5%) | 20 (3.8%) |
| Total | 464 (100.0%) | 521 (100.0%) |
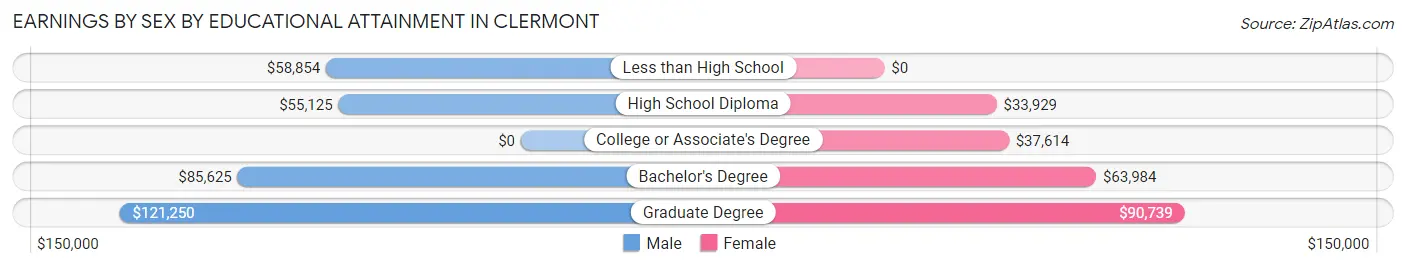
Earnings by Sex by Educational Attainment in Clermont
Average earnings in Clermont are $57,875 for men and $46,875 for women, a difference of 19.0%. Men with an educational attainment of graduate degree enjoy the highest average annual earnings of $121,250, while those with high school diploma education earn the least with $55,125. Women with an educational attainment of graduate degree earn the most with the average annual earnings of $90,739, while those with high school diploma education have the smallest earnings of $33,929.
| Educational Attainment | Male Income | Female Income |
| Less than High School | $58,854 | $0 |
| High School Diploma | $55,125 | $33,929 |
| College or Associate's Degree | - | - |
| Bachelor's Degree | $85,625 | $63,984 |
| Graduate Degree | $121,250 | $90,739 |
| Total | $57,875 | $46,875 |
Family Income in Clermont
Family Income Brackets in Clermont
According to the Clermont family income data, there are 79 families falling into the $75,000 to $99,999 income range, which is the most common income bracket and makes up 18.9% of all families.
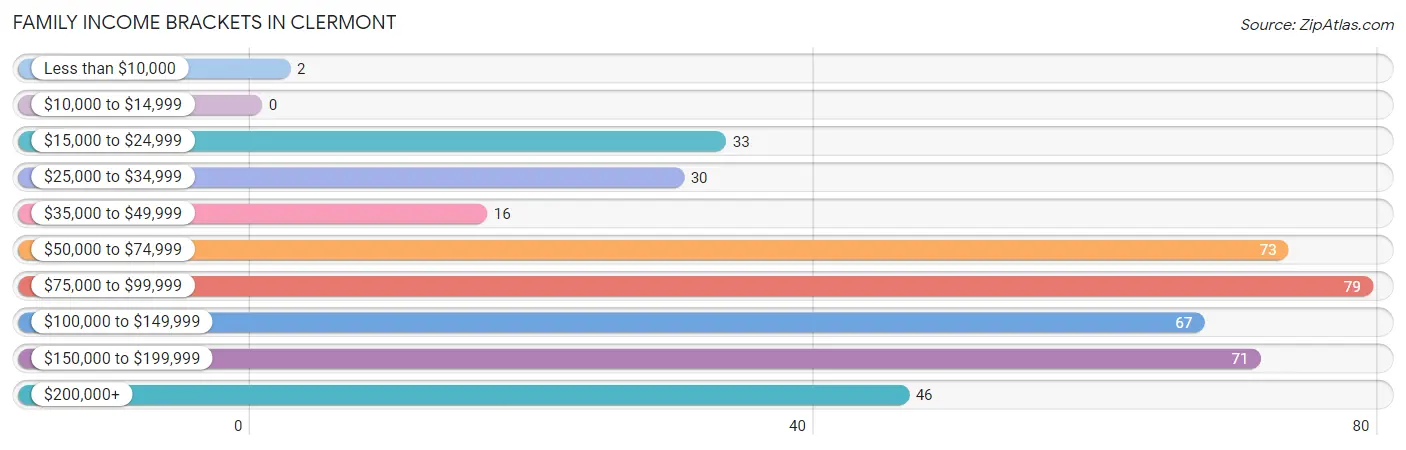
| Income Bracket | # Families | % Families |
| Less than $10,000 | 2 | 0.5% |
| $10,000 to $14,999 | 0 | 0.0% |
| $15,000 to $24,999 | 33 | 7.9% |
| $25,000 to $34,999 | 30 | 7.2% |
| $35,000 to $49,999 | 16 | 3.8% |
| $50,000 to $74,999 | 73 | 17.5% |
| $75,000 to $99,999 | 79 | 18.9% |
| $100,000 to $149,999 | 67 | 16.1% |
| $150,000 to $199,999 | 71 | 17.0% |
| $200,000+ | 46 | 11.0% |
Family Income by Famaliy Size in Clermont
5-person families (21 | 5.0%) account for the highest median family income in Clermont with $227,656 per family, while 5-person families (21 | 5.0%) have the highest median income of $45,531 per family member.
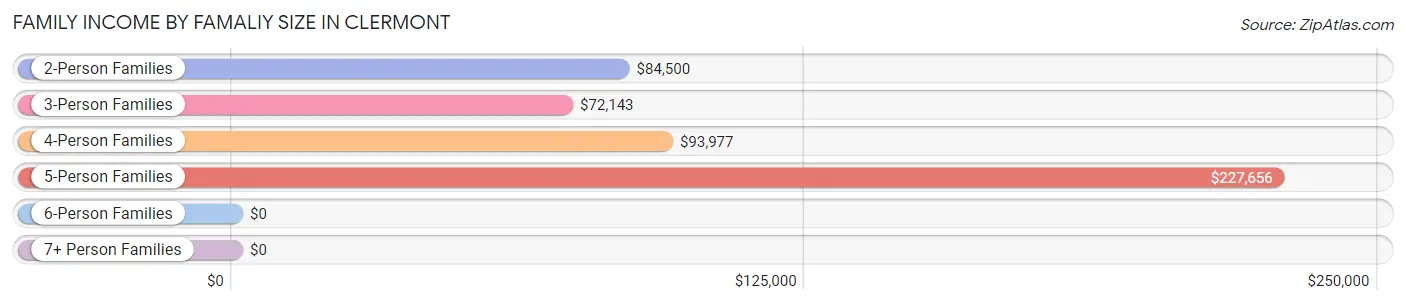
| Income Bracket | # Families | Median Income |
| 2-Person Families | 204 (48.9%) | $84,500 |
| 3-Person Families | 102 (24.5%) | $72,143 |
| 4-Person Families | 65 (15.6%) | $93,977 |
| 5-Person Families | 21 (5.0%) | $227,656 |
| 6-Person Families | 25 (6.0%) | $0 |
| 7+ Person Families | 0 (0.0%) | $0 |
| Total | 417 (100.0%) | $93,698 |
Family Income by Number of Earners in Clermont
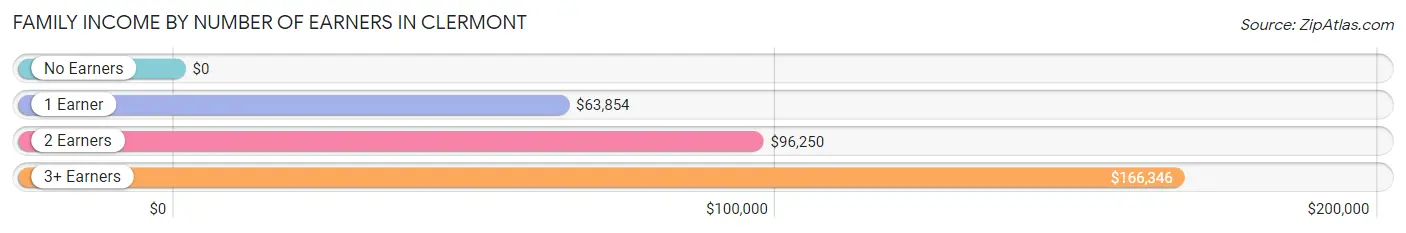
| Number of Earners | # Families | Median Income |
| No Earners | 58 (13.9%) | $0 |
| 1 Earner | 107 (25.7%) | $63,854 |
| 2 Earners | 174 (41.7%) | $96,250 |
| 3+ Earners | 78 (18.7%) | $166,346 |
| Total | 417 (100.0%) | $93,698 |
Household Income in Clermont
Household Income Brackets in Clermont
With 115 households falling in the category, the $75,000 to $99,999 income range is the most frequent in Clermont, accounting for 18.9% of all households.
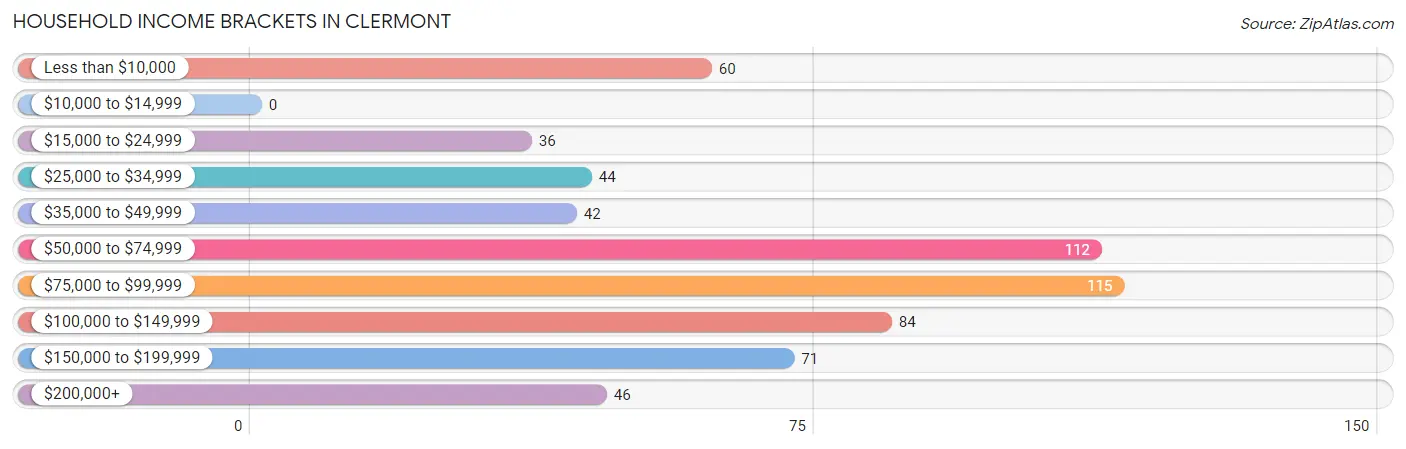
| Income Bracket | # Households | % Households |
| Less than $10,000 | 60 | 9.8% |
| $10,000 to $14,999 | 0 | 0.0% |
| $15,000 to $24,999 | 36 | 5.9% |
| $25,000 to $34,999 | 44 | 7.2% |
| $35,000 to $49,999 | 42 | 6.9% |
| $50,000 to $74,999 | 112 | 18.4% |
| $75,000 to $99,999 | 115 | 18.9% |
| $100,000 to $149,999 | 84 | 13.8% |
| $150,000 to $199,999 | 71 | 11.6% |
| $200,000+ | 46 | 7.5% |
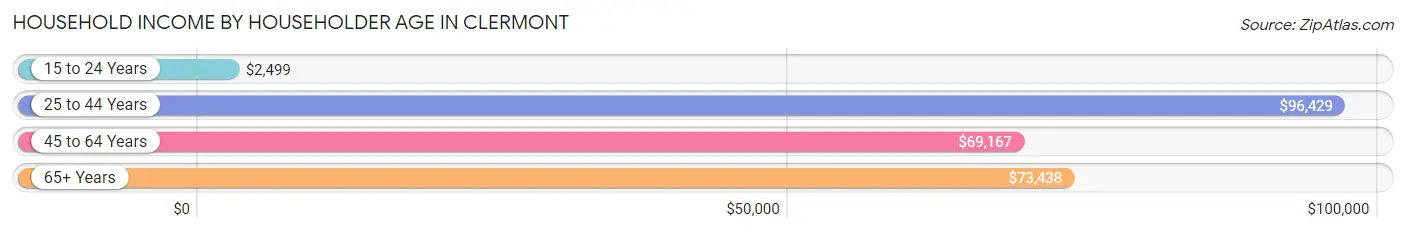
Household Income by Householder Age in Clermont
The median household income in Clermont is $81,818, with the highest median household income of $96,429 found in the 25 to 44 years age bracket for the primary householder. A total of 172 households (28.2%) fall into this category. Meanwhile, the 15 to 24 years age bracket for the primary householder has the lowest median household income of $2,499, with 21 households (3.4%) in this group.
| Income Bracket | # Households | Median Income |
| 15 to 24 Years | 21 (3.4%) | $2,499 |
| 25 to 44 Years | 172 (28.2%) | $96,429 |
| 45 to 64 Years | 296 (48.5%) | $69,167 |
| 65+ Years | 121 (19.8%) | $73,438 |
| Total | 610 (100.0%) | $81,818 |
Poverty in Clermont
Income Below Poverty by Sex and Age in Clermont
With 11.0% poverty level for males and 4.7% for females among the residents of Clermont, 55 to 64 year old males and 16 and 17 year old females are the most vulnerable to poverty, with 31 males (25.6%) and 4 females (12.1%) in their respective age groups living below the poverty level.
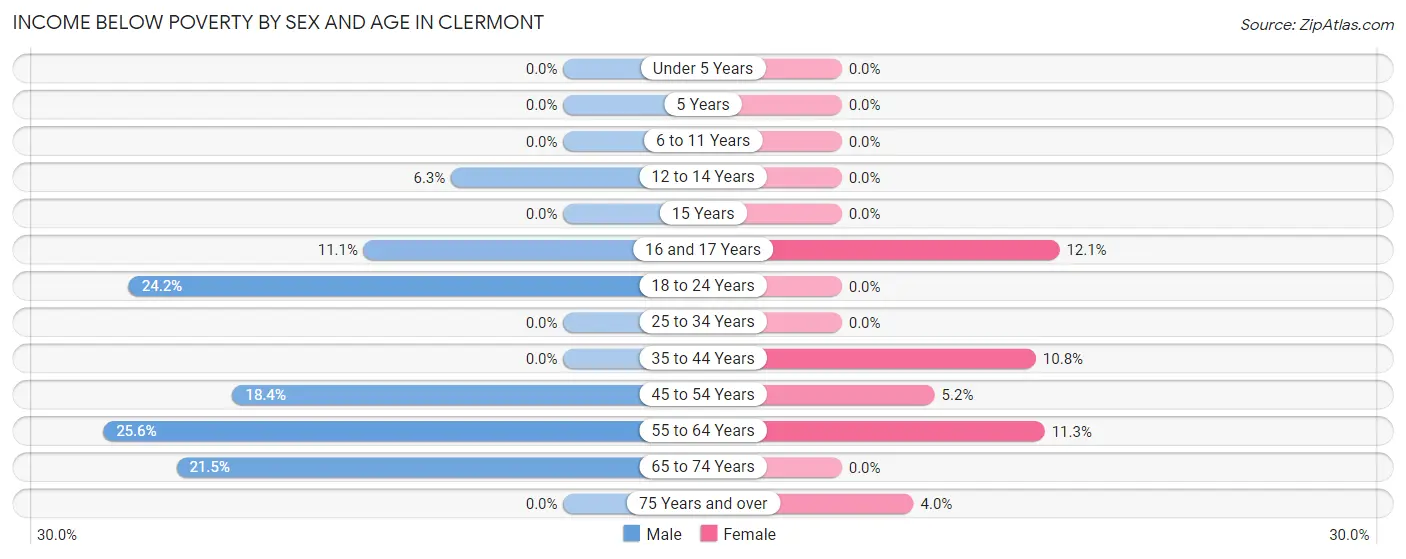
| Age Bracket | Male | Female |
| Under 5 Years | 0 (0.0%) | 0 (0.0%) |
| 5 Years | 0 (0.0%) | 0 (0.0%) |
| 6 to 11 Years | 0 (0.0%) | 0 (0.0%) |
| 12 to 14 Years | 5 (6.2%) | 0 (0.0%) |
| 15 Years | 0 (0.0%) | 0 (0.0%) |
| 16 and 17 Years | 5 (11.1%) | 4 (12.1%) |
| 18 to 24 Years | 15 (24.2%) | 0 (0.0%) |
| 25 to 34 Years | 0 (0.0%) | 0 (0.0%) |
| 35 to 44 Years | 0 (0.0%) | 12 (10.8%) |
| 45 to 54 Years | 21 (18.4%) | 6 (5.2%) |
| 55 to 64 Years | 31 (25.6%) | 13 (11.3%) |
| 65 to 74 Years | 14 (21.5%) | 0 (0.0%) |
| 75 Years and over | 0 (0.0%) | 2 (4.0%) |
| Total | 91 (11.0%) | 37 (4.7%) |
Income Above Poverty by Sex and Age in Clermont
According to the poverty statistics in Clermont, males aged under 5 years and females aged under 5 years are the age groups that are most secure financially, with 100.0% of males and 100.0% of females in these age groups living above the poverty line.
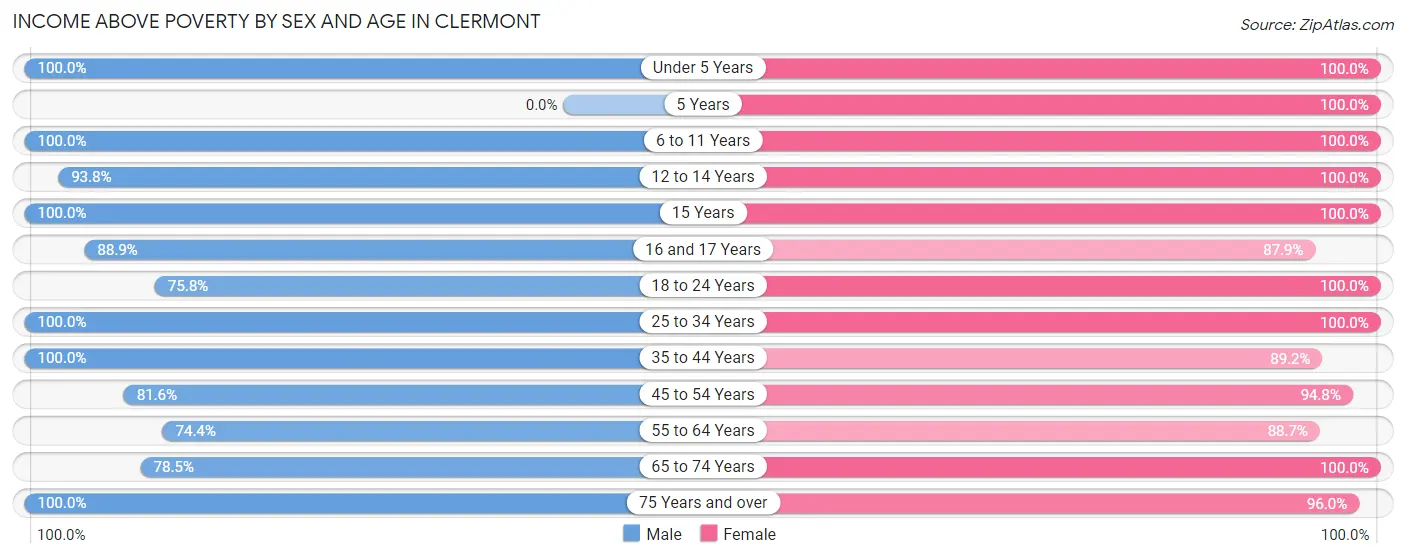
| Age Bracket | Male | Female |
| Under 5 Years | 44 (100.0%) | 43 (100.0%) |
| 5 Years | 0 (0.0%) | 6 (100.0%) |
| 6 to 11 Years | 80 (100.0%) | 30 (100.0%) |
| 12 to 14 Years | 75 (93.8%) | 3 (100.0%) |
| 15 Years | 3 (100.0%) | 10 (100.0%) |
| 16 and 17 Years | 40 (88.9%) | 29 (87.9%) |
| 18 to 24 Years | 47 (75.8%) | 100 (100.0%) |
| 25 to 34 Years | 62 (100.0%) | 118 (100.0%) |
| 35 to 44 Years | 110 (100.0%) | 99 (89.2%) |
| 45 to 54 Years | 93 (81.6%) | 110 (94.8%) |
| 55 to 64 Years | 90 (74.4%) | 102 (88.7%) |
| 65 to 74 Years | 51 (78.5%) | 53 (100.0%) |
| 75 Years and over | 45 (100.0%) | 48 (96.0%) |
| Total | 740 (89.0%) | 751 (95.3%) |
Income Below Poverty Among Married-Couple Families in Clermont
The poverty statistics for married-couple families in Clermont show that 4.4% or 13 of the total 295 families live below the poverty line. Families with no children have the highest poverty rate of 6.9%, comprising of 13 families. On the other hand, families with 1 or 2 children have the lowest poverty rate of 0.0%, which includes 0 families.
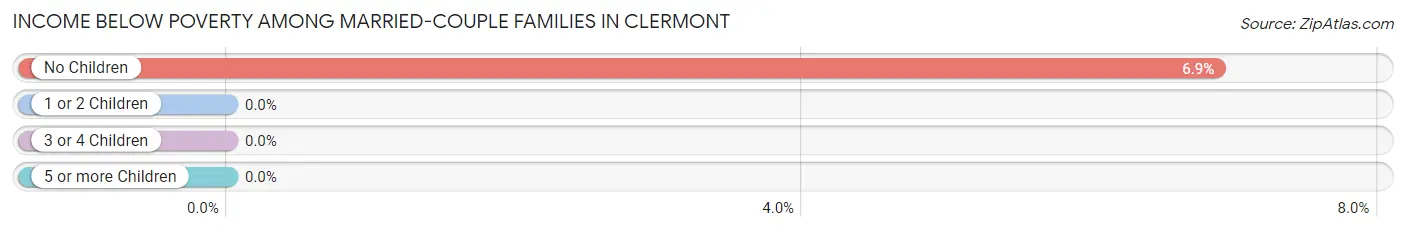
| Children | Above Poverty | Below Poverty |
| No Children | 176 (93.1%) | 13 (6.9%) |
| 1 or 2 Children | 99 (100.0%) | 0 (0.0%) |
| 3 or 4 Children | 7 (100.0%) | 0 (0.0%) |
| 5 or more Children | 0 (0.0%) | 0 (0.0%) |
| Total | 282 (95.6%) | 13 (4.4%) |
Income Below Poverty Among Single-Parent Households in Clermont
According to the poverty data in Clermont, 9.1% or 5 single-father households and 3.0% or 2 single-mother households are living below the poverty line. Among single-father households, those with 1 or 2 children have the highest poverty rate, with 5 households (18.5%) experiencing poverty. Likewise, among single-mother households, those with no children have the highest poverty rate, with 2 households (7.4%) falling below the poverty line.
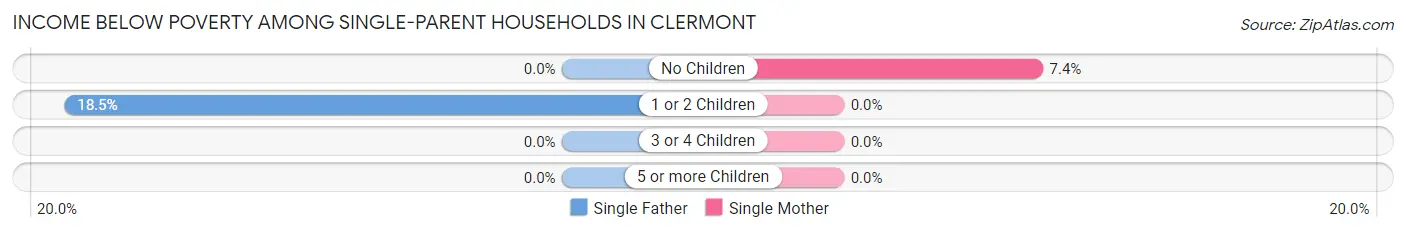
| Children | Single Father | Single Mother |
| No Children | 0 (0.0%) | 2 (7.4%) |
| 1 or 2 Children | 5 (18.5%) | 0 (0.0%) |
| 3 or 4 Children | 0 (0.0%) | 0 (0.0%) |
| 5 or more Children | 0 (0.0%) | 0 (0.0%) |
| Total | 5 (9.1%) | 2 (3.0%) |
Income Below Poverty Among Married-Couple vs Single-Parent Households in Clermont
The poverty data for Clermont shows that 13 of the married-couple family households (4.4%) and 7 of the single-parent households (5.7%) are living below the poverty level. Within the married-couple family households, those with no children have the highest poverty rate, with 13 households (6.9%) falling below the poverty line. Among the single-parent households, those with 1 or 2 children have the highest poverty rate, with 5 household (8.5%) living below poverty.
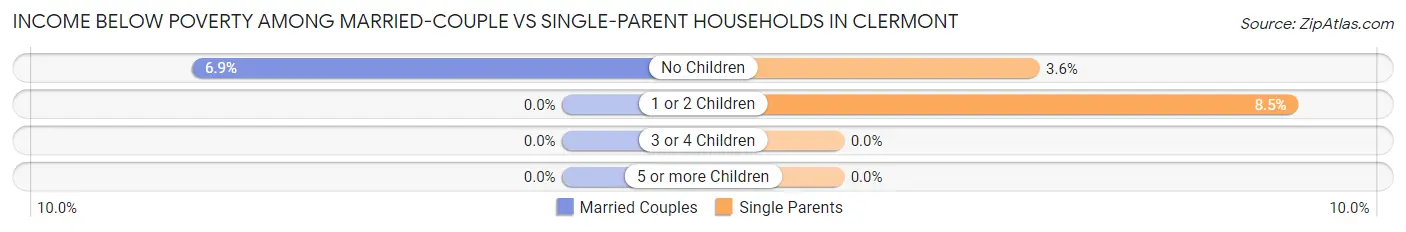
| Children | Married-Couple Families | Single-Parent Households |
| No Children | 13 (6.9%) | 2 (3.6%) |
| 1 or 2 Children | 0 (0.0%) | 5 (8.5%) |
| 3 or 4 Children | 0 (0.0%) | 0 (0.0%) |
| 5 or more Children | 0 (0.0%) | 0 (0.0%) |
| Total | 13 (4.4%) | 7 (5.7%) |
Race in Clermont
The most populous races in Clermont are White / Caucasian (1,217 | 74.9%), Hispanic or Latino (252 | 15.5%), and Some other Race (237 | 14.6%).
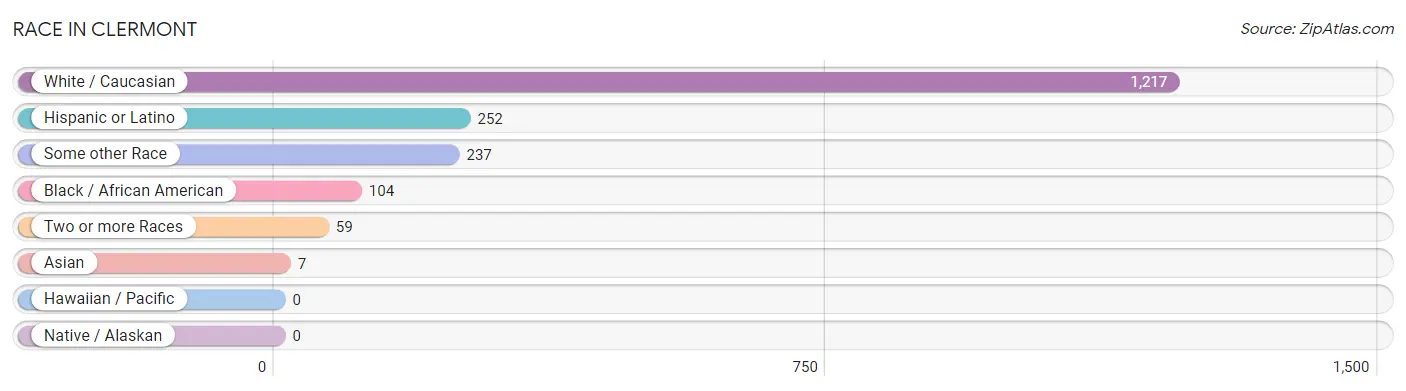
| Race | # Population | % Population |
| Asian | 7 | 0.4% |
| Black / African American | 104 | 6.4% |
| Hawaiian / Pacific | 0 | 0.0% |
| Hispanic or Latino | 252 | 15.5% |
| Native / Alaskan | 0 | 0.0% |
| White / Caucasian | 1,217 | 74.9% |
| Two or more Races | 59 | 3.6% |
| Some other Race | 237 | 14.6% |
| Total | 1,624 | 100.0% |
Ancestry in Clermont
The most populous ancestries reported in Clermont are German (330 | 20.3%), Mexican (216 | 13.3%), English (169 | 10.4%), Irish (168 | 10.3%), and American (148 | 9.1%), together accounting for 63.5% of all Clermont residents.
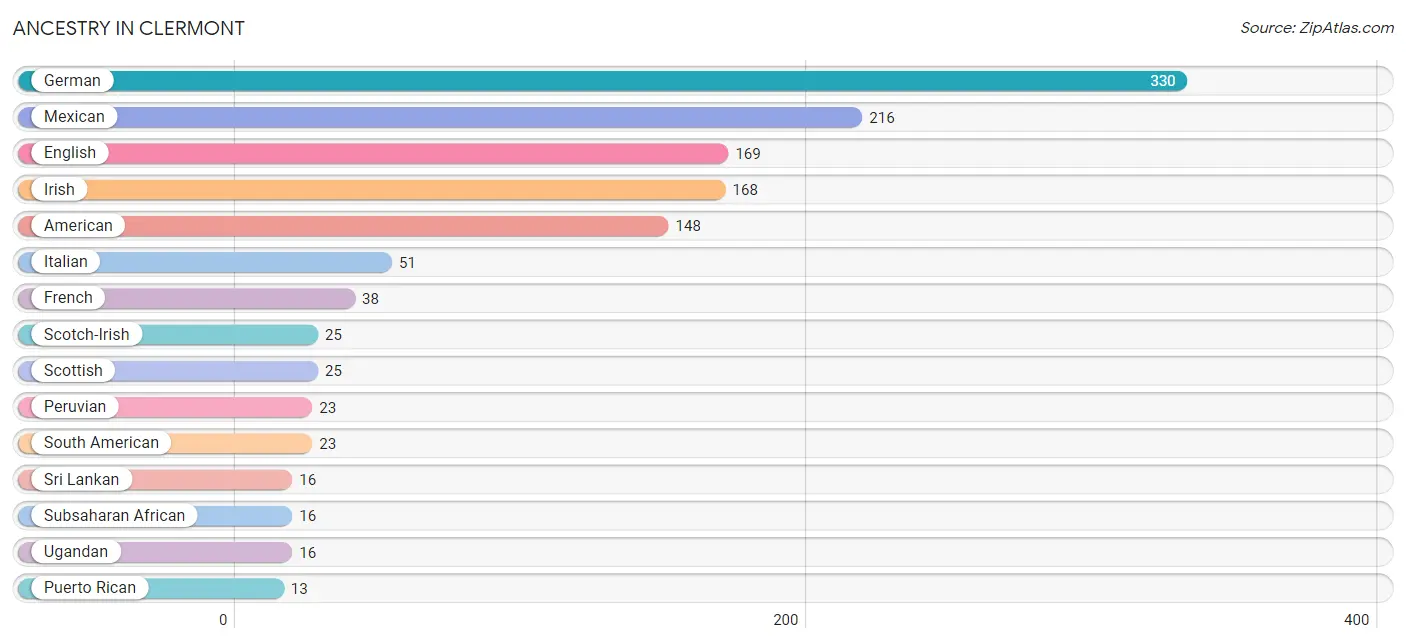
| Ancestry | # Population | % Population |
| American | 148 | 9.1% |
| Arab | 7 | 0.4% |
| Armenian | 6 | 0.4% |
| Belgian | 5 | 0.3% |
| Bhutanese | 6 | 0.4% |
| British | 8 | 0.5% |
| Cherokee | 12 | 0.7% |
| Croatian | 5 | 0.3% |
| Czechoslovakian | 3 | 0.2% |
| Danish | 11 | 0.7% |
| Dutch | 5 | 0.3% |
| Egyptian | 7 | 0.4% |
| English | 169 | 10.4% |
| European | 12 | 0.7% |
| French | 38 | 2.3% |
| German | 330 | 20.3% |
| Irish | 168 | 10.3% |
| Italian | 51 | 3.1% |
| Korean | 8 | 0.5% |
| Mexican | 216 | 13.3% |
| Northern European | 2 | 0.1% |
| Peruvian | 23 | 1.4% |
| Polish | 9 | 0.5% |
| Portuguese | 4 | 0.3% |
| Puerto Rican | 13 | 0.8% |
| Russian | 5 | 0.3% |
| Scotch-Irish | 25 | 1.5% |
| Scottish | 25 | 1.5% |
| Serbian | 7 | 0.4% |
| Slovak | 2 | 0.1% |
| Slovene | 2 | 0.1% |
| South American | 23 | 1.4% |
| Sri Lankan | 16 | 1.0% |
| Subsaharan African | 16 | 1.0% |
| Swedish | 3 | 0.2% |
| Swiss | 2 | 0.1% |
| Thai | 3 | 0.2% |
| Ugandan | 16 | 1.0% |
| Ukrainian | 13 | 0.8% | View All 39 Rows |
Immigrants in Clermont
The most numerous immigrant groups reported in Clermont came from Latin America (80 | 4.9%), Central America (57 | 3.5%), Peru (23 | 1.4%), South America (23 | 1.4%), and Honduras (22 | 1.3%), together accounting for 12.6% of all Clermont residents.
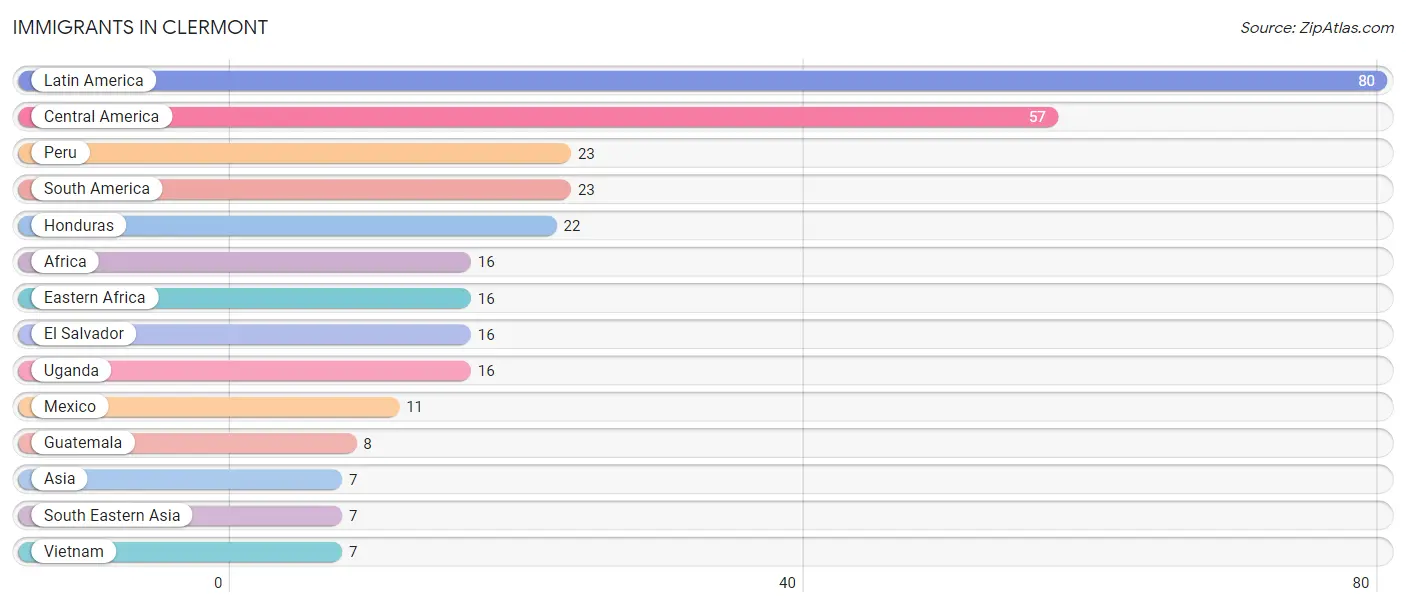
| Immigration Origin | # Population | % Population |
| Africa | 16 | 1.0% |
| Asia | 7 | 0.4% |
| Central America | 57 | 3.5% |
| Eastern Africa | 16 | 1.0% |
| El Salvador | 16 | 1.0% |
| Guatemala | 8 | 0.5% |
| Honduras | 22 | 1.3% |
| Latin America | 80 | 4.9% |
| Mexico | 11 | 0.7% |
| Peru | 23 | 1.4% |
| South America | 23 | 1.4% |
| South Eastern Asia | 7 | 0.4% |
| Uganda | 16 | 1.0% |
| Vietnam | 7 | 0.4% | View All 14 Rows |
Sex and Age in Clermont
Sex and Age in Clermont
The most populous age groups in Clermont are 10 to 14 Years (120 | 14.3%) for men and 45 to 49 Years (90 | 11.4%) for women.
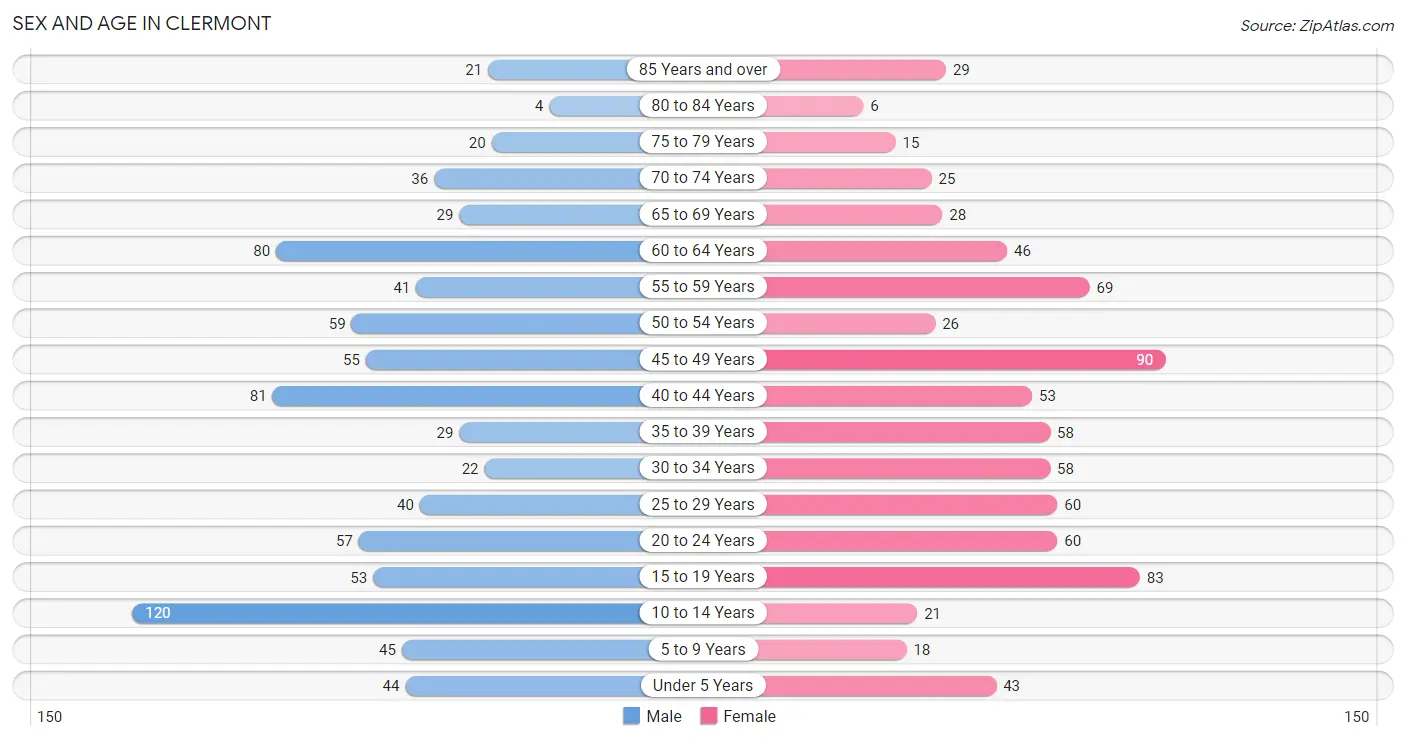
| Age Bracket | Male | Female |
| Under 5 Years | 44 (5.3%) | 43 (5.5%) |
| 5 to 9 Years | 45 (5.4%) | 18 (2.3%) |
| 10 to 14 Years | 120 (14.3%) | 21 (2.7%) |
| 15 to 19 Years | 53 (6.3%) | 83 (10.5%) |
| 20 to 24 Years | 57 (6.8%) | 60 (7.6%) |
| 25 to 29 Years | 40 (4.8%) | 60 (7.6%) |
| 30 to 34 Years | 22 (2.6%) | 58 (7.4%) |
| 35 to 39 Years | 29 (3.5%) | 58 (7.4%) |
| 40 to 44 Years | 81 (9.7%) | 53 (6.7%) |
| 45 to 49 Years | 55 (6.6%) | 90 (11.4%) |
| 50 to 54 Years | 59 (7.1%) | 26 (3.3%) |
| 55 to 59 Years | 41 (4.9%) | 69 (8.8%) |
| 60 to 64 Years | 80 (9.6%) | 46 (5.8%) |
| 65 to 69 Years | 29 (3.5%) | 28 (3.5%) |
| 70 to 74 Years | 36 (4.3%) | 25 (3.2%) |
| 75 to 79 Years | 20 (2.4%) | 15 (1.9%) |
| 80 to 84 Years | 4 (0.5%) | 6 (0.8%) |
| 85 Years and over | 21 (2.5%) | 29 (3.7%) |
| Total | 836 (100.0%) | 788 (100.0%) |
Families and Households in Clermont
Median Family Size in Clermont
The median family size in Clermont is 3.26 persons per family, with single female/mother families (67 | 16.1%) accounting for the largest median family size of 3.43 persons per family. On the other hand, single male/father families (55 | 13.2%) represent the smallest median family size with 2.87 persons per family.
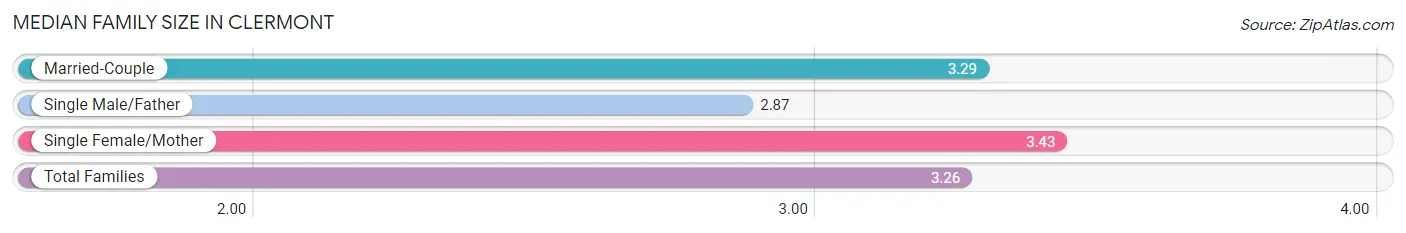
| Family Type | # Families | Family Size |
| Married-Couple | 295 (70.7%) | 3.29 |
| Single Male/Father | 55 (13.2%) | 2.87 |
| Single Female/Mother | 67 (16.1%) | 3.43 |
| Total Families | 417 (100.0%) | 3.26 |
Median Household Size in Clermont
The median household size in Clermont is 2.66 persons per household, with single female/mother households (67 | 11.0%) accounting for the largest median household size of 3.58 persons per household. non-family households (193 | 31.6%) represent the smallest median household size with 1.24 persons per household.
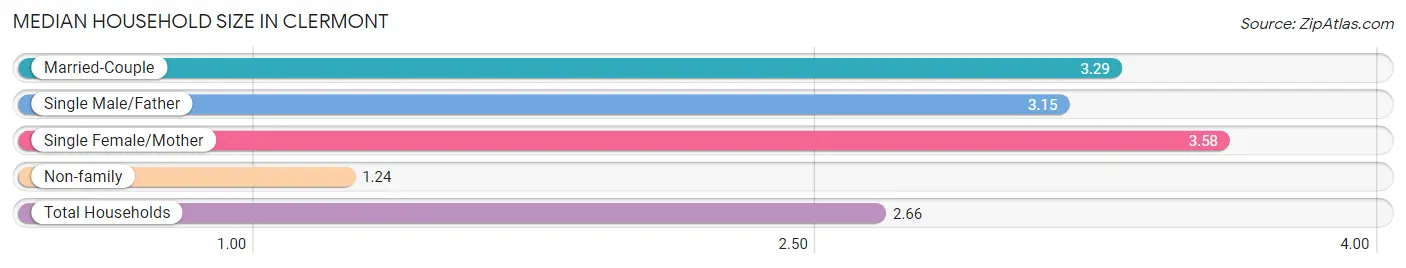
| Household Type | # Households | Household Size |
| Married-Couple | 295 (48.4%) | 3.29 |
| Single Male/Father | 55 (9.0%) | 3.15 |
| Single Female/Mother | 67 (11.0%) | 3.58 |
| Non-family | 193 (31.6%) | 1.24 |
| Total Households | 610 (100.0%) | 2.66 |
Household Size by Marriage Status in Clermont
Out of a total of 610 households in Clermont, 417 (68.4%) are family households, while 193 (31.6%) are nonfamily households. The most numerous type of family households are 2-person households, comprising 198, and the most common type of nonfamily households are 1-person households, comprising 162.
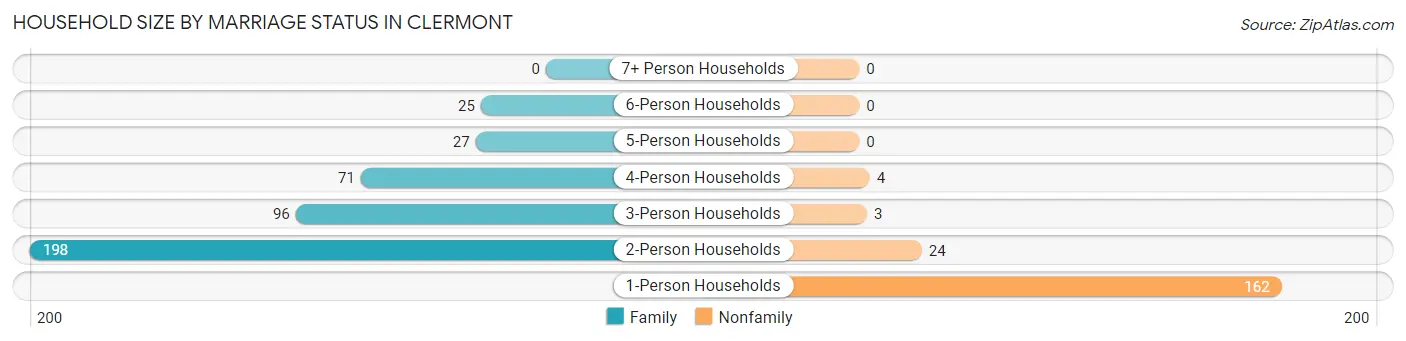
| Household Size | Family Households | Nonfamily Households |
| 1-Person Households | - | 162 (26.6%) |
| 2-Person Households | 198 (32.5%) | 24 (3.9%) |
| 3-Person Households | 96 (15.7%) | 3 (0.5%) |
| 4-Person Households | 71 (11.6%) | 4 (0.7%) |
| 5-Person Households | 27 (4.4%) | 0 (0.0%) |
| 6-Person Households | 25 (4.1%) | 0 (0.0%) |
| 7+ Person Households | 0 (0.0%) | 0 (0.0%) |
| Total | 417 (68.4%) | 193 (31.6%) |
Female Fertility in Clermont
Fertility by Age in Clermont
Average fertility rate in Clermont is 52.0 births per 1,000 women. Women in the age bracket of 20 to 34 years have the highest fertility rate with 101.0 births per 1,000 women. Women in the age bracket of 20 to 34 years acount for 75.0% of all women with births.
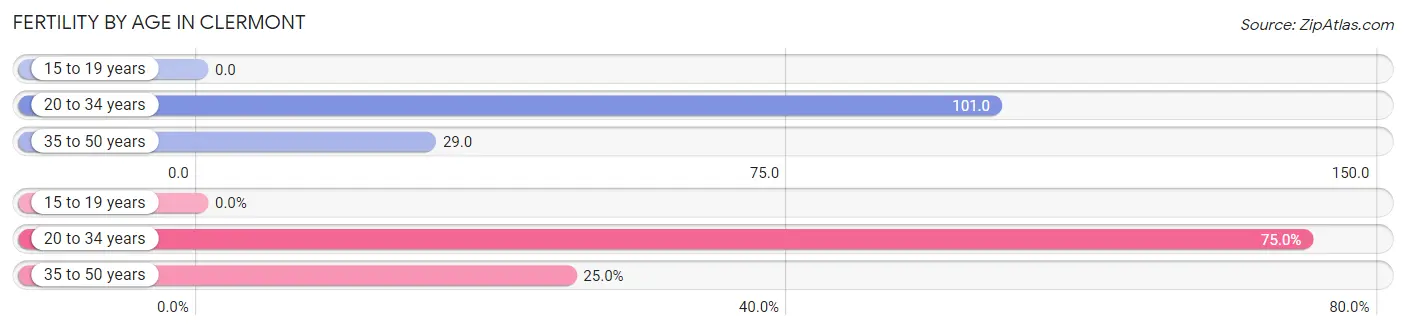
| Age Bracket | Women with Births | Births / 1,000 Women |
| 15 to 19 years | 0 (0.0%) | 0.0 |
| 20 to 34 years | 18 (75.0%) | 101.0 |
| 35 to 50 years | 6 (25.0%) | 29.0 |
| Total | 24 (100.0%) | 52.0 |
Fertility by Age by Marriage Status in Clermont
16.7% of women with births (24) in Clermont are married. The highest percentage of unmarried women with births falls into 35 to 50 years age bracket with 100.0% of them unmarried at the time of birth, while the lowest percentage of unmarried women with births belong to 20 to 34 years age bracket with 77.8% of them unmarried.
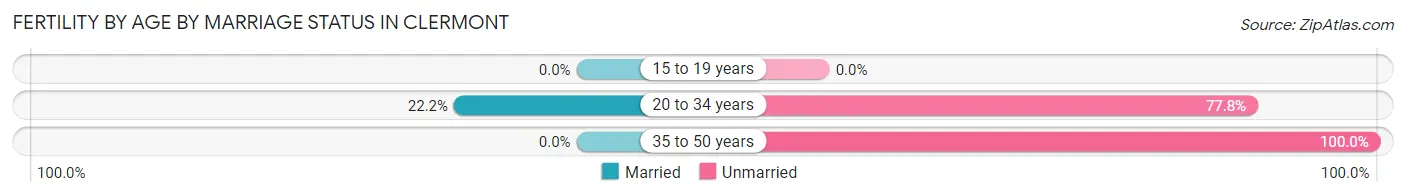
| Age Bracket | Married | Unmarried |
| 15 to 19 years | 0 (0.0%) | 0 (0.0%) |
| 20 to 34 years | 4 (22.2%) | 14 (77.8%) |
| 35 to 50 years | 0 (0.0%) | 6 (100.0%) |
| Total | 4 (16.7%) | 20 (83.3%) |
Fertility by Education in Clermont
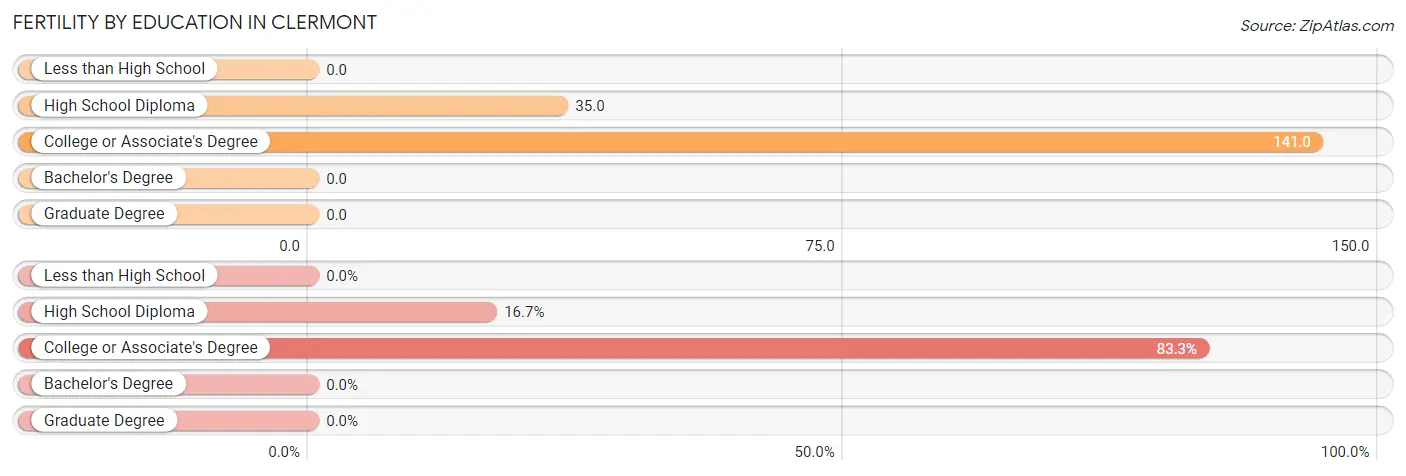
| Educational Attainment | Women with Births | Births / 1,000 Women |
| Less than High School | 0 (0.0%) | 0.0 |
| High School Diploma | 4 (16.7%) | 35.0 |
| College or Associate's Degree | 20 (83.3%) | 141.0 |
| Bachelor's Degree | 0 (0.0%) | 0.0 |
| Graduate Degree | 0 (0.0%) | 0.0 |
| Total | 24 (100.0%) | 52.0 |
Fertility by Education by Marriage Status in Clermont
83.3% of women with births in Clermont are unmarried. Women with the educational attainment of high school diploma are most likely to be married with 100.0% of them married at childbirth, while women with the educational attainment of college or associate's degree are least likely to be married with 100.0% of them unmarried at childbirth.
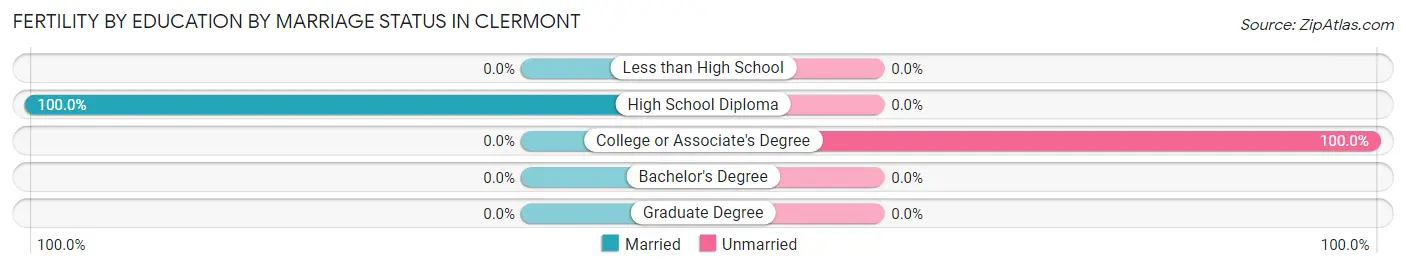
| Educational Attainment | Married | Unmarried |
| Less than High School | 0 (0.0%) | 0 (0.0%) |
| High School Diploma | 4 (100.0%) | 0 (0.0%) |
| College or Associate's Degree | 0 (0.0%) | 20 (100.0%) |
| Bachelor's Degree | 0 (0.0%) | 0 (0.0%) |
| Graduate Degree | 0 (0.0%) | 0 (0.0%) |
| Total | 4 (16.7%) | 20 (83.3%) |
Employment Characteristics in Clermont
Employment by Class of Employer in Clermont
Among the 882 employed individuals in Clermont, private company employees (637 | 72.2%), not-for-profit organizations (85 | 9.6%), and self-employed (not incorporated) (65 | 7.4%) make up the most common classes of employment.
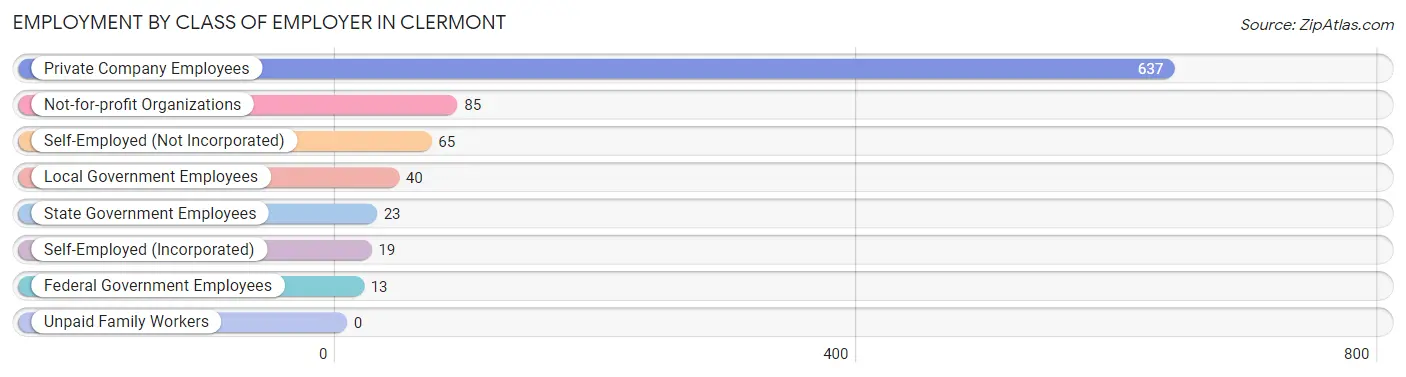
| Employer Class | # Employees | % Employees |
| Private Company Employees | 637 | 72.2% |
| Self-Employed (Incorporated) | 19 | 2.1% |
| Self-Employed (Not Incorporated) | 65 | 7.4% |
| Not-for-profit Organizations | 85 | 9.6% |
| Local Government Employees | 40 | 4.5% |
| State Government Employees | 23 | 2.6% |
| Federal Government Employees | 13 | 1.5% |
| Unpaid Family Workers | 0 | 0.0% |
| Total | 882 | 100.0% |
Employment Status by Age in Clermont
According to the labor force statistics for Clermont, out of the total population over 16 years of age (1,320), 69.9% or 923 individuals are in the labor force, with 3.0% or 28 of them unemployed. The age group with the highest labor force participation rate is 35 to 44 years, with 94.6% or 209 individuals in the labor force. Within the labor force, the 65 to 74 years age range has the highest percentage of unemployed individuals, with 22.2% or 8 of them being unemployed.
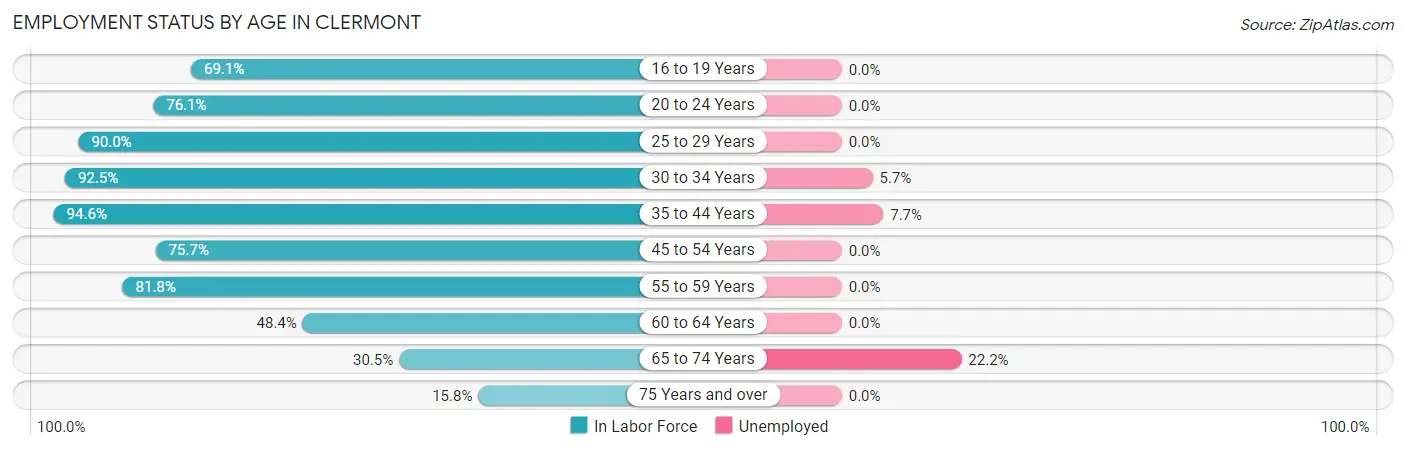
| Age Bracket | In Labor Force | Unemployed |
| 16 to 19 Years | 85 (69.1%) | 0 (0.0%) |
| 20 to 24 Years | 89 (76.1%) | 0 (0.0%) |
| 25 to 29 Years | 90 (90.0%) | 0 (0.0%) |
| 30 to 34 Years | 74 (92.5%) | 4 (5.7%) |
| 35 to 44 Years | 209 (94.6%) | 16 (7.7%) |
| 45 to 54 Years | 174 (75.7%) | 0 (0.0%) |
| 55 to 59 Years | 90 (81.8%) | 0 (0.0%) |
| 60 to 64 Years | 61 (48.4%) | 0 (0.0%) |
| 65 to 74 Years | 36 (30.5%) | 8 (22.2%) |
| 75 Years and over | 15 (15.8%) | 0 (0.0%) |
| Total | 923 (69.9%) | 28 (3.0%) |
Employment Status by Educational Attainment in Clermont
According to labor force statistics for Clermont, 80.5% of individuals (698) out of the total population between 25 and 64 years of age (867) are in the labor force, with 2.9% or 20 of them being unemployed. The group with the highest labor force participation rate are those with the educational attainment of college / associate degree, with 82.5% or 188 individuals in the labor force. Within the labor force, individuals with college / associate degree education have the highest percentage of unemployment, with 7.1% or 13 of them being unemployed.
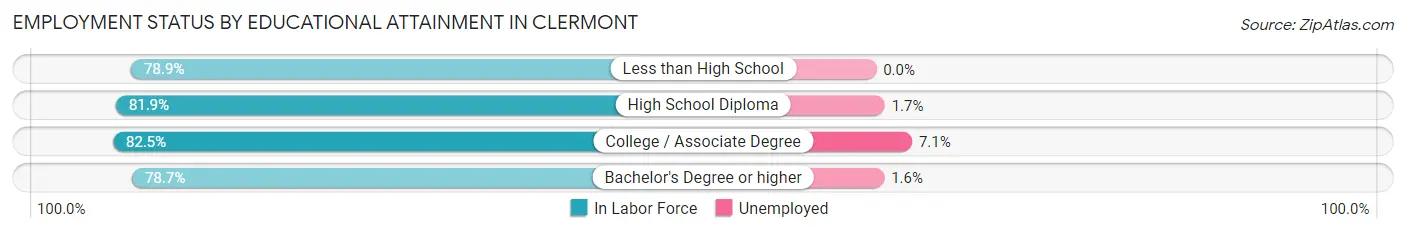
| Educational Attainment | In Labor Force | Unemployed |
| Less than High School | 71 (78.9%) | 0 (0.0%) |
| High School Diploma | 181 (81.9%) | 4 (1.7%) |
| College / Associate Degree | 188 (82.5%) | 16 (7.1%) |
| Bachelor's Degree or higher | 258 (78.7%) | 5 (1.6%) |
| Total | 698 (80.5%) | 25 (2.9%) |
Employment Occupations by Sex in Clermont
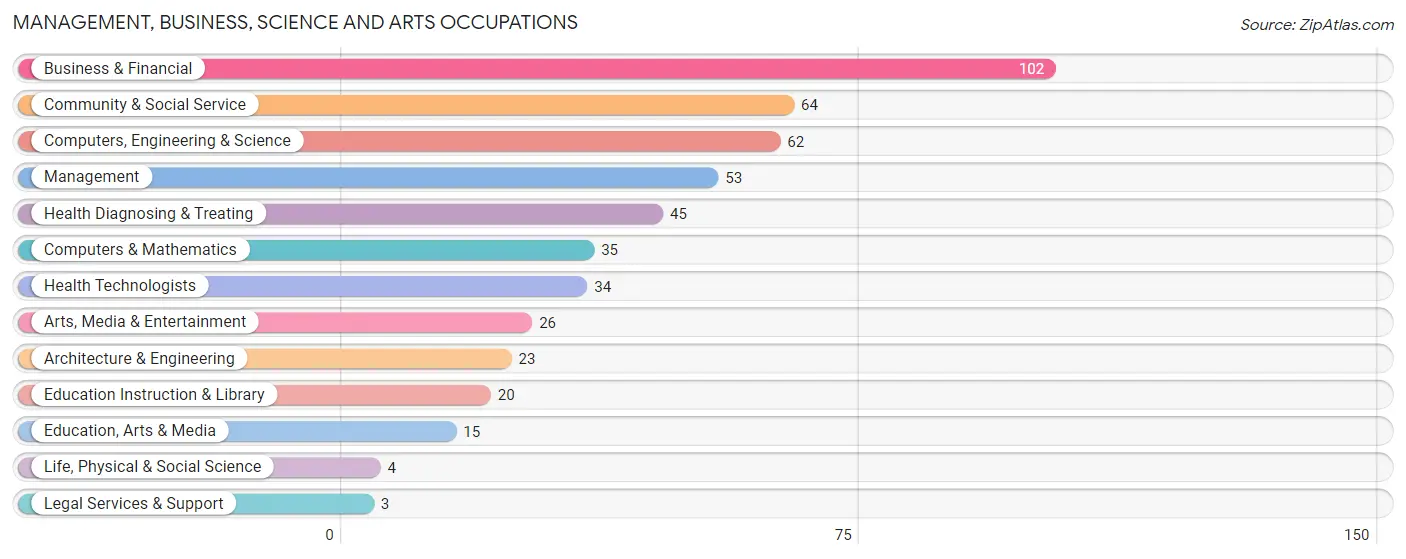
Management, Business, Science and Arts Occupations
The most common Management, Business, Science and Arts occupations in Clermont are Business & Financial (102 | 11.5%), Community & Social Service (64 | 7.2%), Computers, Engineering & Science (62 | 7.0%), Management (53 | 5.9%), and Health Diagnosing & Treating (45 | 5.1%).
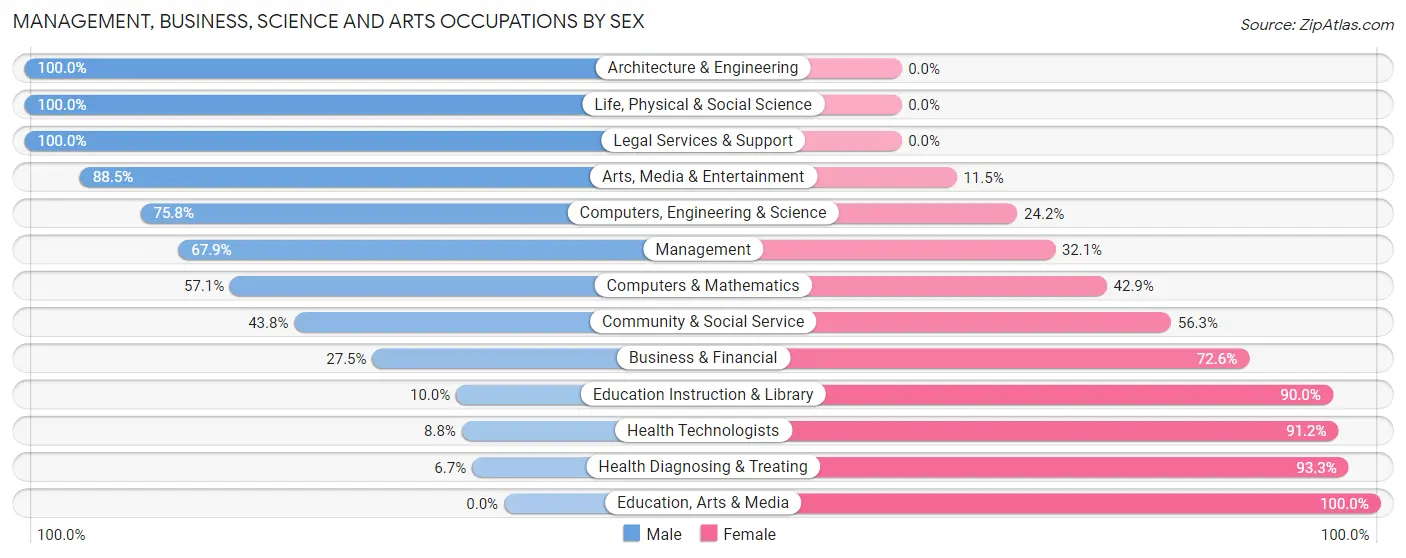
Management, Business, Science and Arts Occupations by Sex
Within the Management, Business, Science and Arts occupations in Clermont, the most male-oriented occupations are Architecture & Engineering (100.0%), Life, Physical & Social Science (100.0%), and Legal Services & Support (100.0%), while the most female-oriented occupations are Education, Arts & Media (100.0%), Health Diagnosing & Treating (93.3%), and Health Technologists (91.2%).
| Occupation | Male | Female |
| Management | 36 (67.9%) | 17 (32.1%) |
| Business & Financial | 28 (27.5%) | 74 (72.6%) |
| Computers, Engineering & Science | 47 (75.8%) | 15 (24.2%) |
| Computers & Mathematics | 20 (57.1%) | 15 (42.9%) |
| Architecture & Engineering | 23 (100.0%) | 0 (0.0%) |
| Life, Physical & Social Science | 4 (100.0%) | 0 (0.0%) |
| Community & Social Service | 28 (43.8%) | 36 (56.2%) |
| Education, Arts & Media | 0 (0.0%) | 15 (100.0%) |
| Legal Services & Support | 3 (100.0%) | 0 (0.0%) |
| Education Instruction & Library | 2 (10.0%) | 18 (90.0%) |
| Arts, Media & Entertainment | 23 (88.5%) | 3 (11.5%) |
| Health Diagnosing & Treating | 3 (6.7%) | 42 (93.3%) |
| Health Technologists | 3 (8.8%) | 31 (91.2%) |
| Total (Category) | 142 (43.6%) | 184 (56.4%) |
| Total (Overall) | 407 (45.7%) | 484 (54.3%) |
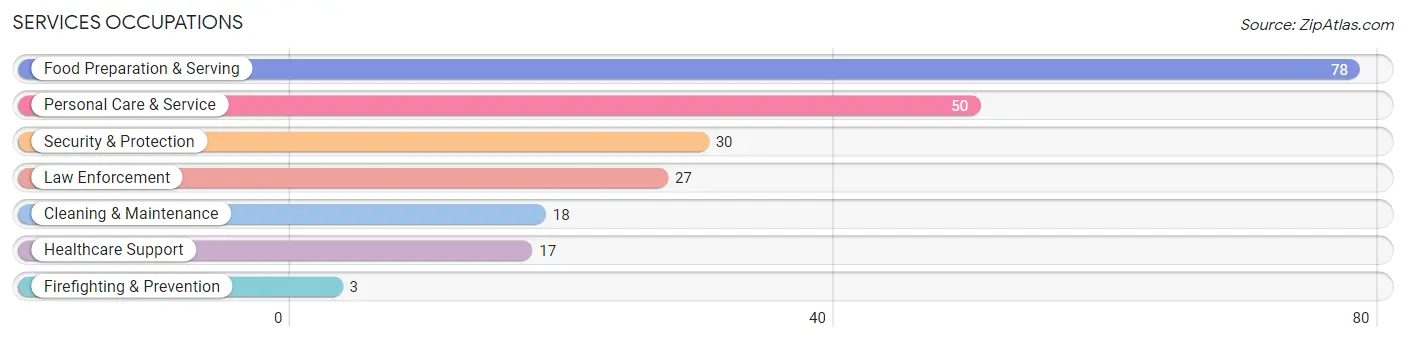
Services Occupations
The most common Services occupations in Clermont are Food Preparation & Serving (78 | 8.7%), Personal Care & Service (50 | 5.6%), Security & Protection (30 | 3.4%), Law Enforcement (27 | 3.0%), and Cleaning & Maintenance (18 | 2.0%).
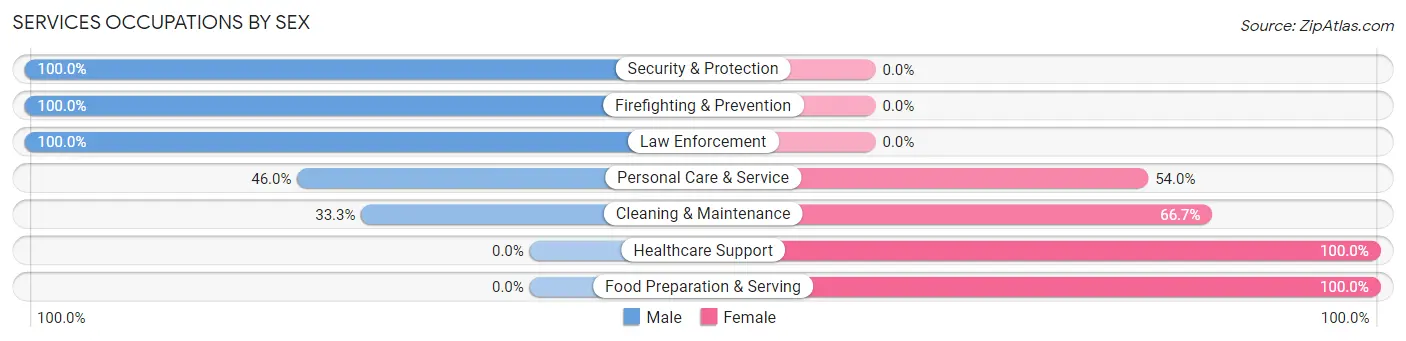
Services Occupations by Sex
Within the Services occupations in Clermont, the most male-oriented occupations are Security & Protection (100.0%), Firefighting & Prevention (100.0%), and Law Enforcement (100.0%), while the most female-oriented occupations are Healthcare Support (100.0%), Food Preparation & Serving (100.0%), and Cleaning & Maintenance (66.7%).
| Occupation | Male | Female |
| Healthcare Support | 0 (0.0%) | 17 (100.0%) |
| Security & Protection | 30 (100.0%) | 0 (0.0%) |
| Firefighting & Prevention | 3 (100.0%) | 0 (0.0%) |
| Law Enforcement | 27 (100.0%) | 0 (0.0%) |
| Food Preparation & Serving | 0 (0.0%) | 78 (100.0%) |
| Cleaning & Maintenance | 6 (33.3%) | 12 (66.7%) |
| Personal Care & Service | 23 (46.0%) | 27 (54.0%) |
| Total (Category) | 59 (30.6%) | 134 (69.4%) |
| Total (Overall) | 407 (45.7%) | 484 (54.3%) |
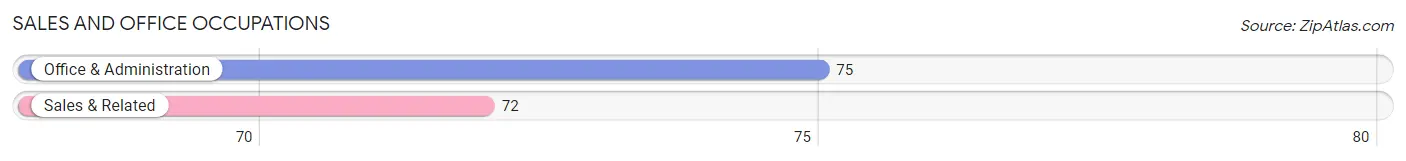
Sales and Office Occupations
The most common Sales and Office occupations in Clermont are Office & Administration (75 | 8.4%), and Sales & Related (72 | 8.1%).
Sales and Office Occupations by Sex
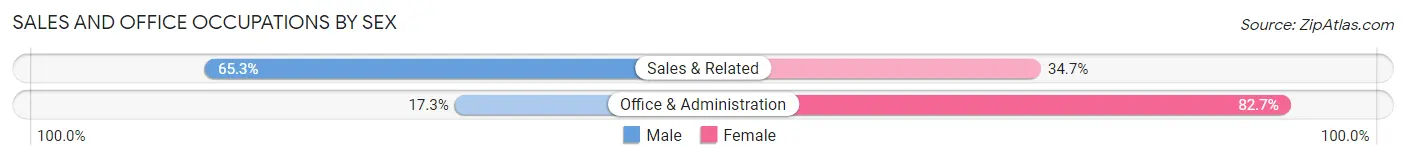
| Occupation | Male | Female |
| Sales & Related | 47 (65.3%) | 25 (34.7%) |
| Office & Administration | 13 (17.3%) | 62 (82.7%) |
| Total (Category) | 60 (40.8%) | 87 (59.2%) |
| Total (Overall) | 407 (45.7%) | 484 (54.3%) |
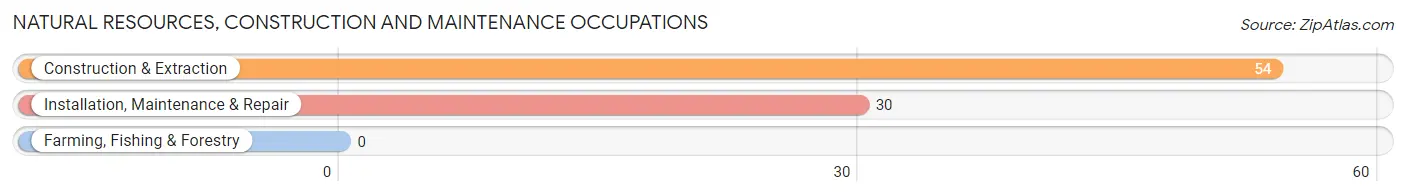
Natural Resources, Construction and Maintenance Occupations
The most common Natural Resources, Construction and Maintenance occupations in Clermont are Construction & Extraction (54 | 6.1%), and Installation, Maintenance & Repair (30 | 3.4%).
Natural Resources, Construction and Maintenance Occupations by Sex
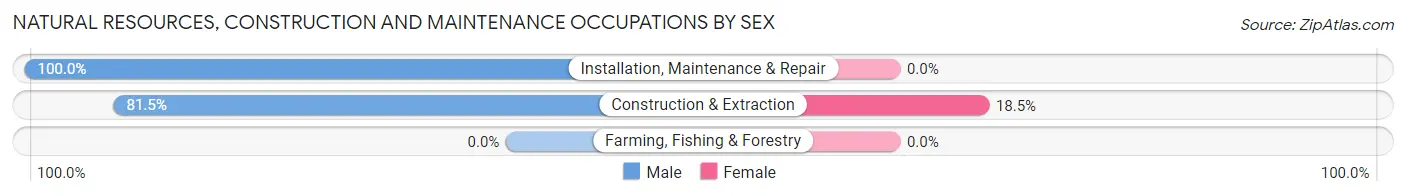
| Occupation | Male | Female |
| Farming, Fishing & Forestry | 0 (0.0%) | 0 (0.0%) |
| Construction & Extraction | 44 (81.5%) | 10 (18.5%) |
| Installation, Maintenance & Repair | 30 (100.0%) | 0 (0.0%) |
| Total (Category) | 74 (88.1%) | 10 (11.9%) |
| Total (Overall) | 407 (45.7%) | 484 (54.3%) |
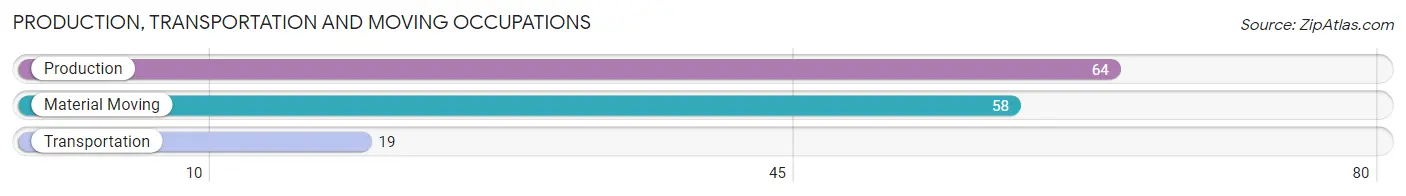
Production, Transportation and Moving Occupations
The most common Production, Transportation and Moving occupations in Clermont are Production (64 | 7.2%), Material Moving (58 | 6.5%), and Transportation (19 | 2.1%).
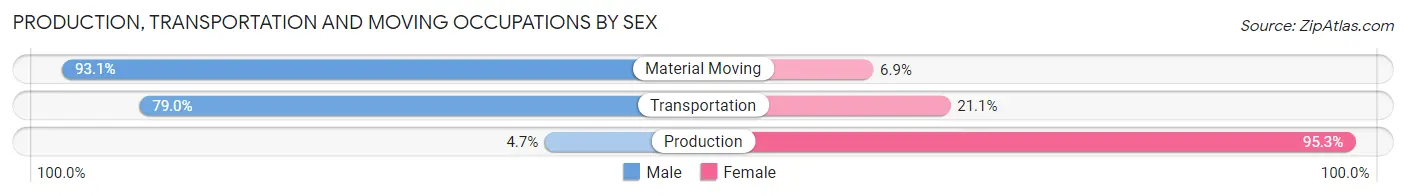
Production, Transportation and Moving Occupations by Sex
| Occupation | Male | Female |
| Production | 3 (4.7%) | 61 (95.3%) |
| Transportation | 15 (78.9%) | 4 (21.0%) |
| Material Moving | 54 (93.1%) | 4 (6.9%) |
| Total (Category) | 72 (51.1%) | 69 (48.9%) |
| Total (Overall) | 407 (45.7%) | 484 (54.3%) |
Employment Industries by Sex in Clermont
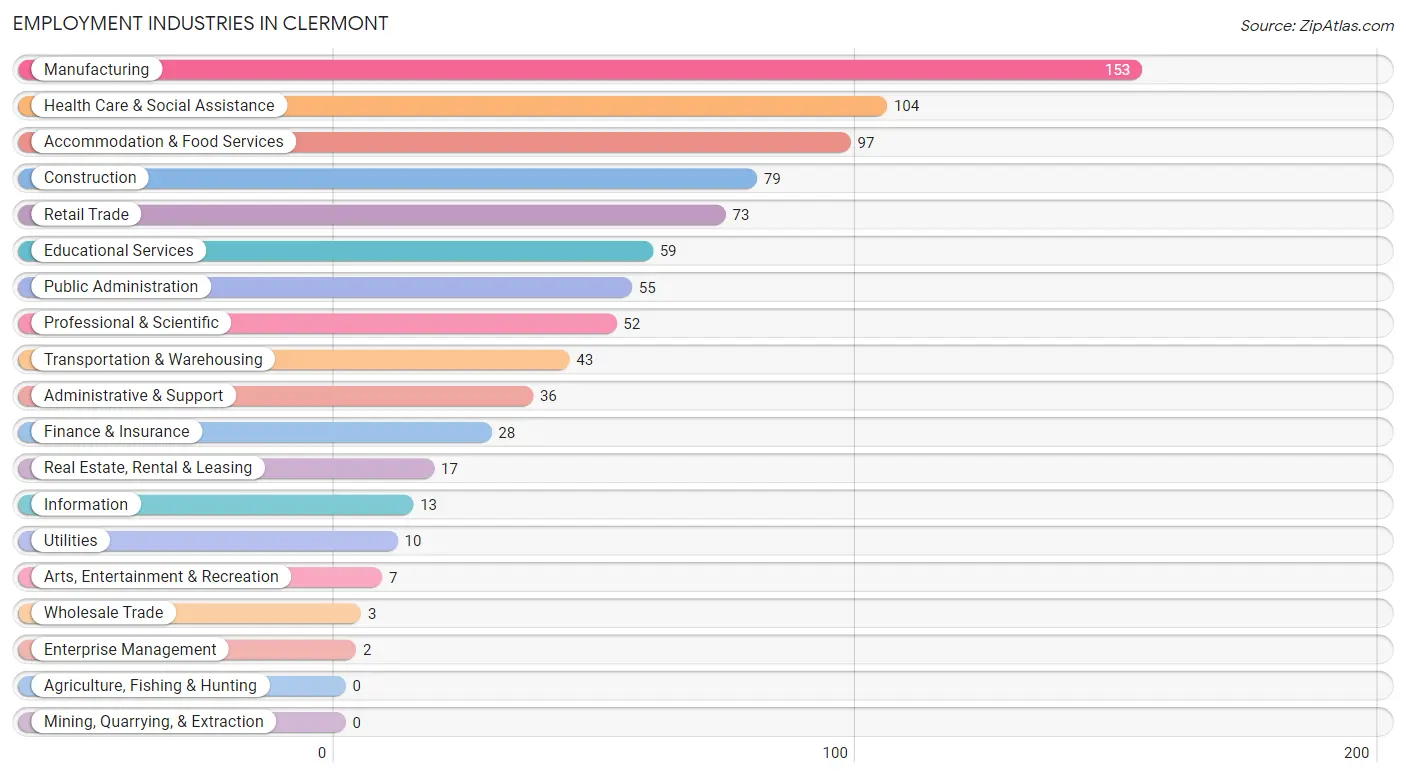
Employment Industries in Clermont
The major employment industries in Clermont include Manufacturing (153 | 17.2%), Health Care & Social Assistance (104 | 11.7%), Accommodation & Food Services (97 | 10.9%), Construction (79 | 8.9%), and Retail Trade (73 | 8.2%).
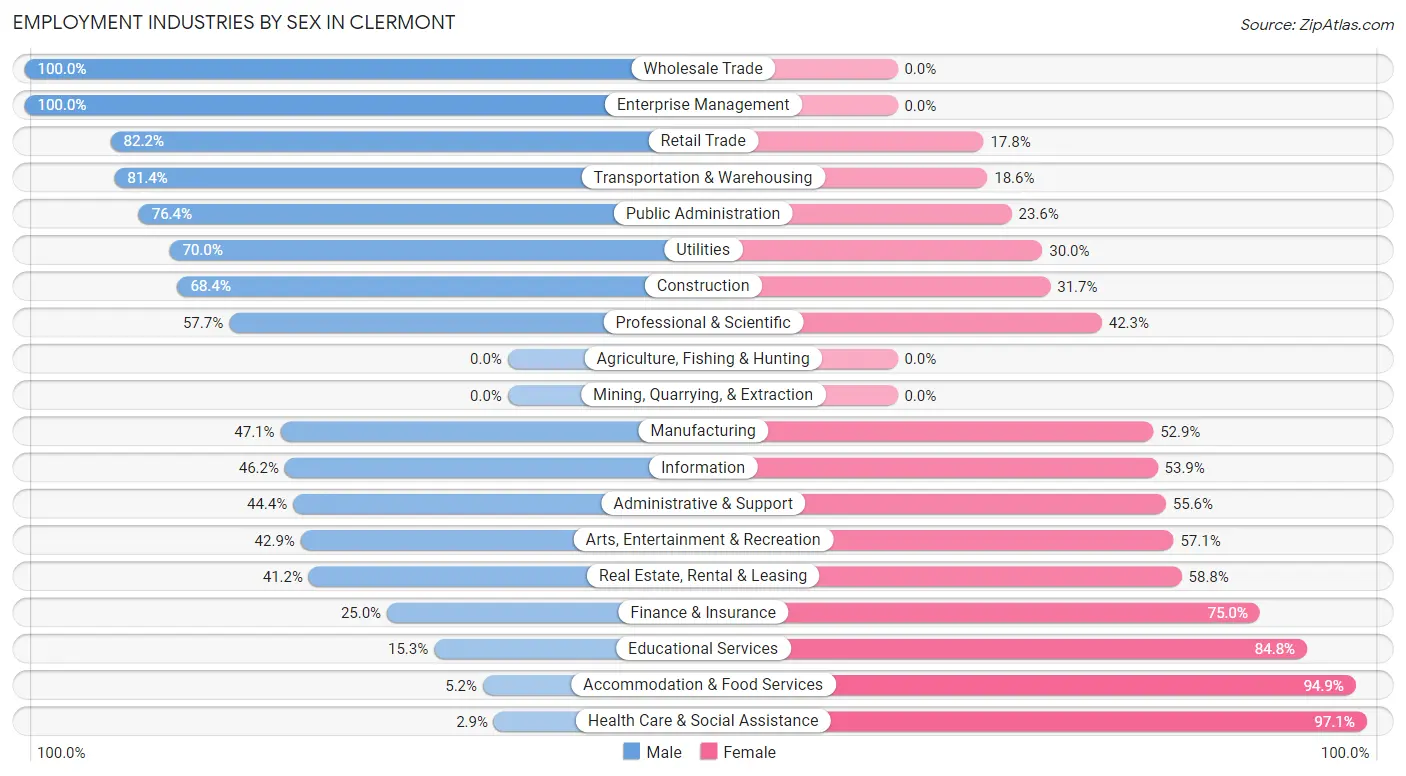
Employment Industries by Sex in Clermont
The Clermont industries that see more men than women are Wholesale Trade (100.0%), Enterprise Management (100.0%), and Retail Trade (82.2%), whereas the industries that tend to have a higher number of women are Health Care & Social Assistance (97.1%), Accommodation & Food Services (94.9%), and Educational Services (84.8%).
| Industry | Male | Female |
| Agriculture, Fishing & Hunting | 0 (0.0%) | 0 (0.0%) |
| Mining, Quarrying, & Extraction | 0 (0.0%) | 0 (0.0%) |
| Construction | 54 (68.3%) | 25 (31.7%) |
| Manufacturing | 72 (47.1%) | 81 (52.9%) |
| Wholesale Trade | 3 (100.0%) | 0 (0.0%) |
| Retail Trade | 60 (82.2%) | 13 (17.8%) |
| Transportation & Warehousing | 35 (81.4%) | 8 (18.6%) |
| Utilities | 7 (70.0%) | 3 (30.0%) |
| Information | 6 (46.2%) | 7 (53.8%) |
| Finance & Insurance | 7 (25.0%) | 21 (75.0%) |
| Real Estate, Rental & Leasing | 7 (41.2%) | 10 (58.8%) |
| Professional & Scientific | 30 (57.7%) | 22 (42.3%) |
| Enterprise Management | 2 (100.0%) | 0 (0.0%) |
| Administrative & Support | 16 (44.4%) | 20 (55.6%) |
| Educational Services | 9 (15.2%) | 50 (84.8%) |
| Health Care & Social Assistance | 3 (2.9%) | 101 (97.1%) |
| Arts, Entertainment & Recreation | 3 (42.9%) | 4 (57.1%) |
| Accommodation & Food Services | 5 (5.1%) | 92 (94.9%) |
| Public Administration | 42 (76.4%) | 13 (23.6%) |
| Total | 407 (45.7%) | 484 (54.3%) |
Education in Clermont
School Enrollment in Clermont
The most common levels of schooling among the 404 students in Clermont are middle school (141 | 34.9%), high school (100 | 24.7%), and college / undergraduate (93 | 23.0%).
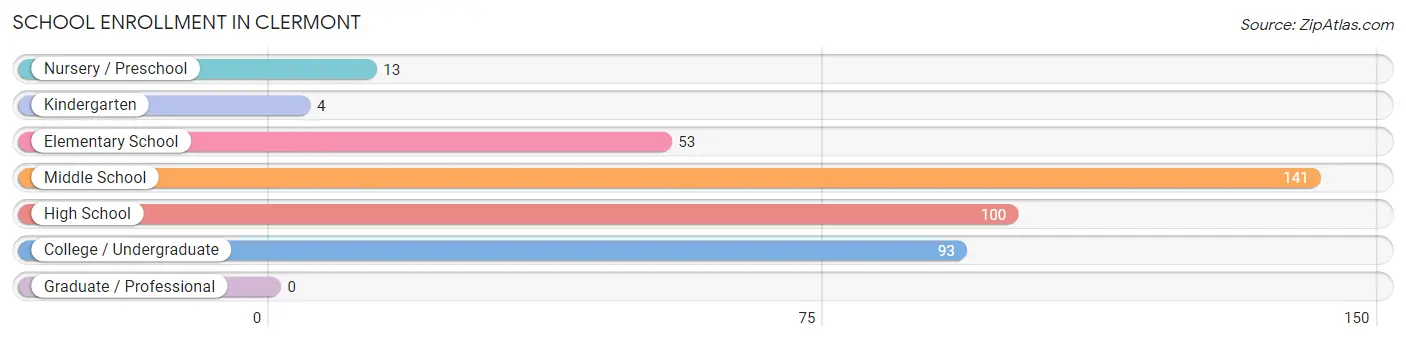
| School Level | # Students | % Students |
| Nursery / Preschool | 13 | 3.2% |
| Kindergarten | 4 | 1.0% |
| Elementary School | 53 | 13.1% |
| Middle School | 141 | 34.9% |
| High School | 100 | 24.7% |
| College / Undergraduate | 93 | 23.0% |
| Graduate / Professional | 0 | 0.0% |
| Total | 404 | 100.0% |
School Enrollment by Age by Funding Source in Clermont
Out of a total of 404 students who are enrolled in schools in Clermont, 49 (12.1%) attend a private institution, while the remaining 355 (87.9%) are enrolled in public schools. The age group of 20 to 24 year olds has the highest likelihood of being enrolled in private schools, with 14 (37.8% in the age bracket) enrolled. Conversely, the age group of 3 to 4 year olds has the lowest likelihood of being enrolled in a private school, with 10 (100.0% in the age bracket) attending a public institution.
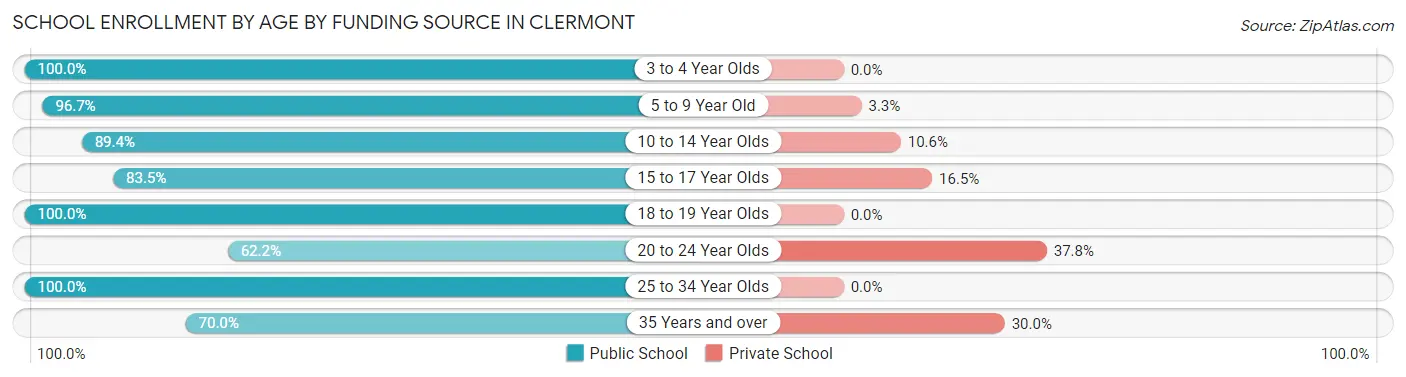
| Age Bracket | Public School | Private School |
| 3 to 4 Year Olds | 10 (100.0%) | 0 (0.0%) |
| 5 to 9 Year Old | 58 (96.7%) | 2 (3.3%) |
| 10 to 14 Year Olds | 126 (89.4%) | 15 (10.6%) |
| 15 to 17 Year Olds | 76 (83.5%) | 15 (16.5%) |
| 18 to 19 Year Olds | 45 (100.0%) | 0 (0.0%) |
| 20 to 24 Year Olds | 23 (62.2%) | 14 (37.8%) |
| 25 to 34 Year Olds | 10 (100.0%) | 0 (0.0%) |
| 35 Years and over | 7 (70.0%) | 3 (30.0%) |
| Total | 355 (87.9%) | 49 (12.1%) |
Educational Attainment by Field of Study in Clermont
Business (125 | 30.0%), communications (55 | 13.2%), science & technology (40 | 9.6%), physical & health sciences (31 | 7.4%), and arts & humanities (25 | 6.0%) are the most common fields of study among 416 individuals in Clermont who have obtained a bachelor's degree or higher.
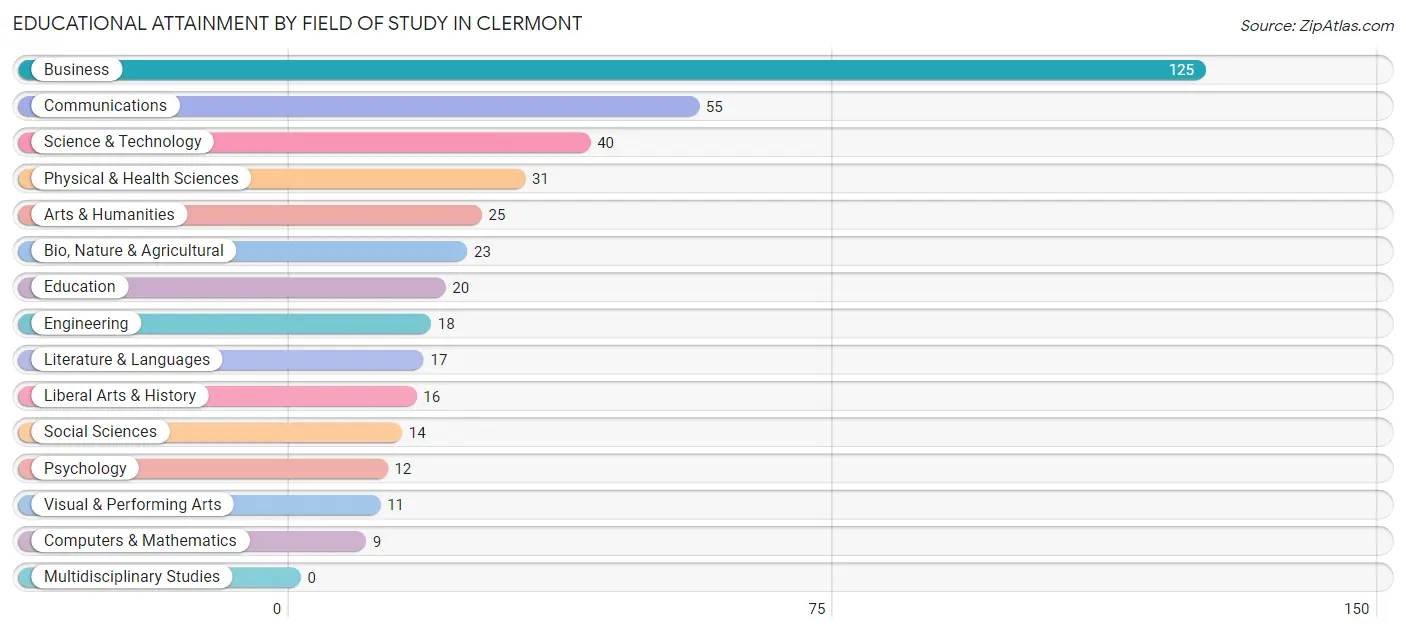
| Field of Study | # Graduates | % Graduates |
| Computers & Mathematics | 9 | 2.2% |
| Bio, Nature & Agricultural | 23 | 5.5% |
| Physical & Health Sciences | 31 | 7.4% |
| Psychology | 12 | 2.9% |
| Social Sciences | 14 | 3.4% |
| Engineering | 18 | 4.3% |
| Multidisciplinary Studies | 0 | 0.0% |
| Science & Technology | 40 | 9.6% |
| Business | 125 | 30.0% |
| Education | 20 | 4.8% |
| Literature & Languages | 17 | 4.1% |
| Liberal Arts & History | 16 | 3.8% |
| Visual & Performing Arts | 11 | 2.6% |
| Communications | 55 | 13.2% |
| Arts & Humanities | 25 | 6.0% |
| Total | 416 | 100.0% |
Transportation & Commute in Clermont
Vehicle Availability by Sex in Clermont
The most prevalent vehicle ownership categories in Clermont are males with 2 vehicles (147, accounting for 36.0%) and females with 2 vehicles (183, making up 31.0%).
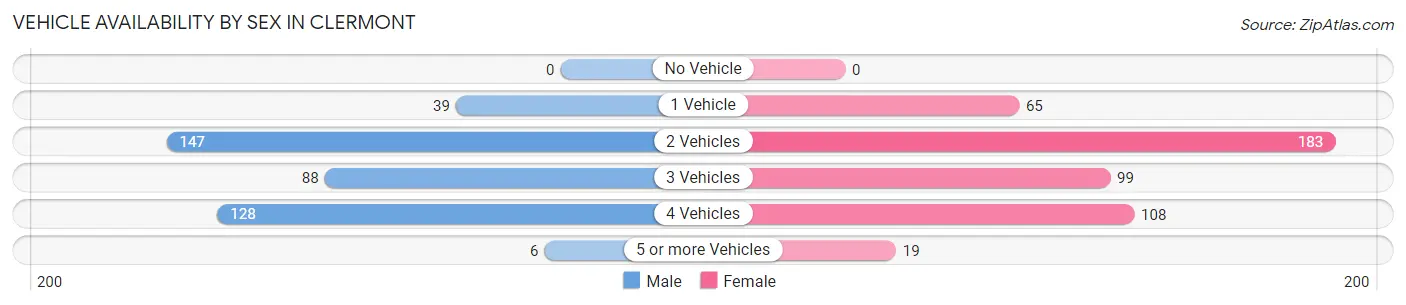
| Vehicles Available | Male | Female |
| No Vehicle | 0 (0.0%) | 0 (0.0%) |
| 1 Vehicle | 39 (9.6%) | 65 (13.7%) |
| 2 Vehicles | 147 (36.0%) | 183 (38.6%) |
| 3 Vehicles | 88 (21.6%) | 99 (20.9%) |
| 4 Vehicles | 128 (31.4%) | 108 (22.8%) |
| 5 or more Vehicles | 6 (1.5%) | 19 (4.0%) |
| Total | 408 (100.0%) | 474 (100.0%) |
Commute Time in Clermont
The most frequently occuring commute durations in Clermont are 20 to 24 minutes (196 commuters, 26.0%), 15 to 19 minutes (152 commuters, 20.1%), and 30 to 34 minutes (136 commuters, 18.0%).
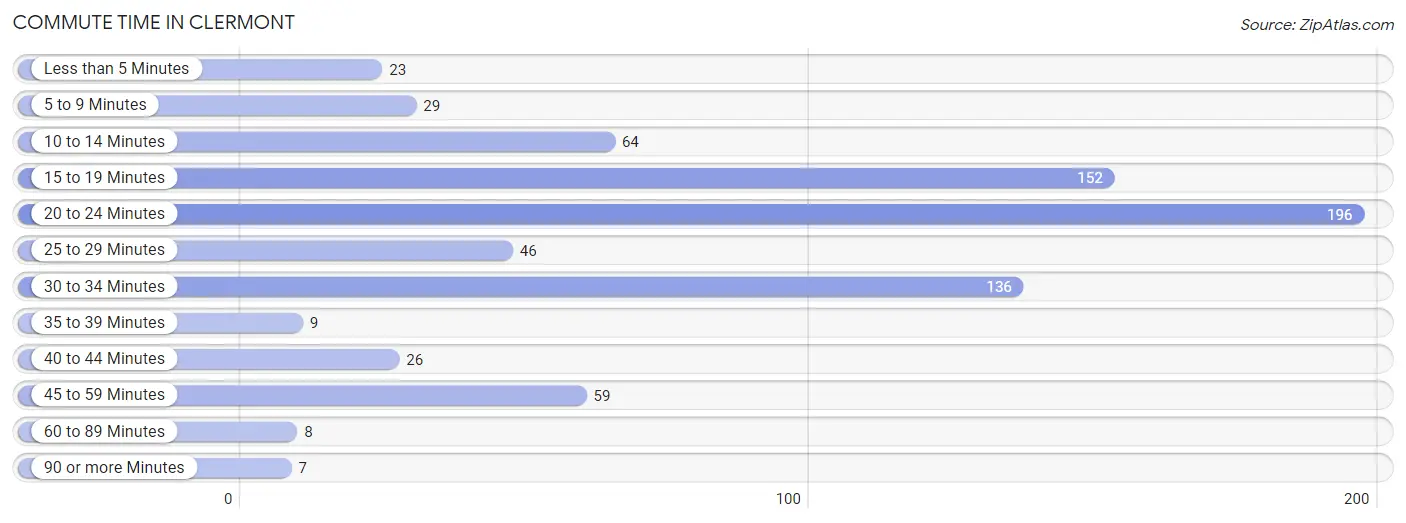
| Commute Time | # Commuters | % Commuters |
| Less than 5 Minutes | 23 | 3.0% |
| 5 to 9 Minutes | 29 | 3.8% |
| 10 to 14 Minutes | 64 | 8.5% |
| 15 to 19 Minutes | 152 | 20.1% |
| 20 to 24 Minutes | 196 | 26.0% |
| 25 to 29 Minutes | 46 | 6.1% |
| 30 to 34 Minutes | 136 | 18.0% |
| 35 to 39 Minutes | 9 | 1.2% |
| 40 to 44 Minutes | 26 | 3.4% |
| 45 to 59 Minutes | 59 | 7.8% |
| 60 to 89 Minutes | 8 | 1.1% |
| 90 or more Minutes | 7 | 0.9% |
Commute Time by Sex in Clermont
The most common commute times in Clermont are 20 to 24 minutes (91 commuters, 24.3%) for males and 20 to 24 minutes (105 commuters, 27.6%) for females.
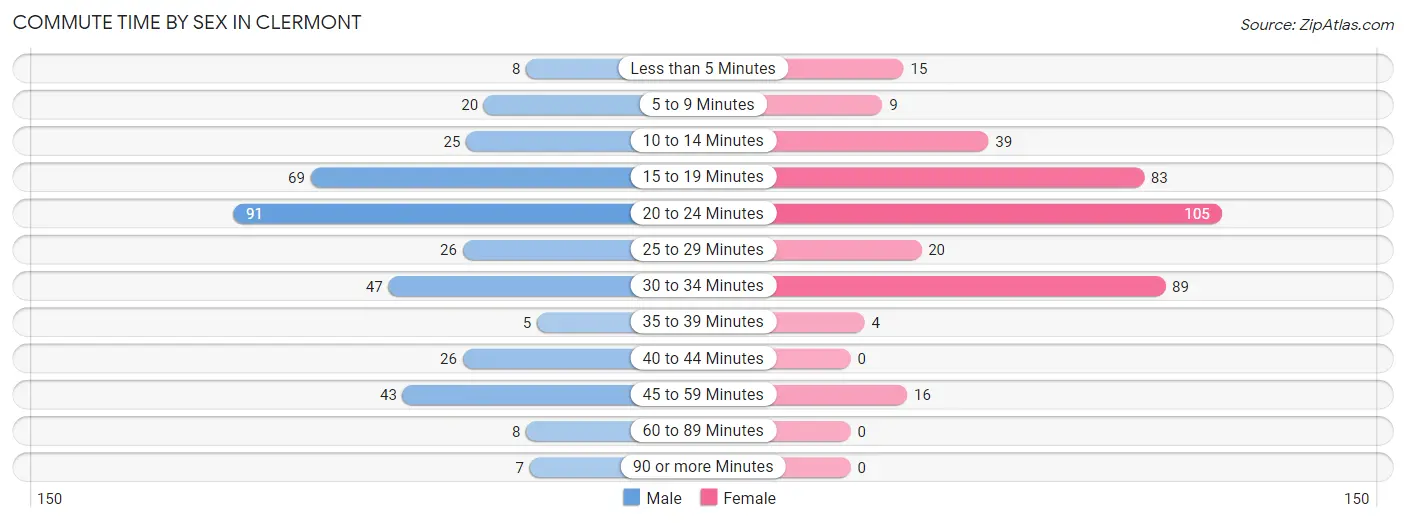
| Commute Time | Male | Female |
| Less than 5 Minutes | 8 (2.1%) | 15 (4.0%) |
| 5 to 9 Minutes | 20 (5.3%) | 9 (2.4%) |
| 10 to 14 Minutes | 25 (6.7%) | 39 (10.3%) |
| 15 to 19 Minutes | 69 (18.4%) | 83 (21.8%) |
| 20 to 24 Minutes | 91 (24.3%) | 105 (27.6%) |
| 25 to 29 Minutes | 26 (6.9%) | 20 (5.3%) |
| 30 to 34 Minutes | 47 (12.5%) | 89 (23.4%) |
| 35 to 39 Minutes | 5 (1.3%) | 4 (1.1%) |
| 40 to 44 Minutes | 26 (6.9%) | 0 (0.0%) |
| 45 to 59 Minutes | 43 (11.5%) | 16 (4.2%) |
| 60 to 89 Minutes | 8 (2.1%) | 0 (0.0%) |
| 90 or more Minutes | 7 (1.9%) | 0 (0.0%) |
Time of Departure to Work by Sex in Clermont
The most frequent times of departure to work in Clermont are 6:00 AM to 6:29 AM (73, 19.5%) for males and 8:00 AM to 8:29 AM (84, 22.1%) for females.
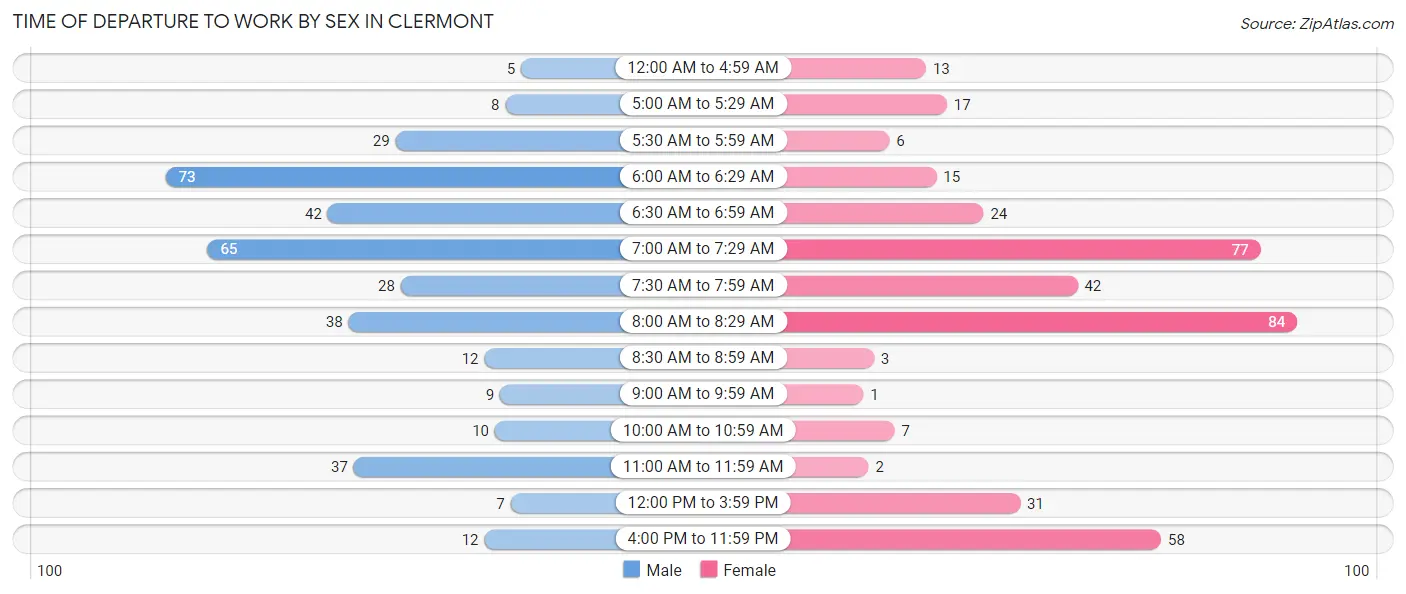
| Time of Departure | Male | Female |
| 12:00 AM to 4:59 AM | 5 (1.3%) | 13 (3.4%) |
| 5:00 AM to 5:29 AM | 8 (2.1%) | 17 (4.5%) |
| 5:30 AM to 5:59 AM | 29 (7.7%) | 6 (1.6%) |
| 6:00 AM to 6:29 AM | 73 (19.5%) | 15 (4.0%) |
| 6:30 AM to 6:59 AM | 42 (11.2%) | 24 (6.3%) |
| 7:00 AM to 7:29 AM | 65 (17.3%) | 77 (20.3%) |
| 7:30 AM to 7:59 AM | 28 (7.5%) | 42 (11.1%) |
| 8:00 AM to 8:29 AM | 38 (10.1%) | 84 (22.1%) |
| 8:30 AM to 8:59 AM | 12 (3.2%) | 3 (0.8%) |
| 9:00 AM to 9:59 AM | 9 (2.4%) | 1 (0.3%) |
| 10:00 AM to 10:59 AM | 10 (2.7%) | 7 (1.8%) |
| 11:00 AM to 11:59 AM | 37 (9.9%) | 2 (0.5%) |
| 12:00 PM to 3:59 PM | 7 (1.9%) | 31 (8.2%) |
| 4:00 PM to 11:59 PM | 12 (3.2%) | 58 (15.3%) |
| Total | 375 (100.0%) | 380 (100.0%) |
Housing Occupancy in Clermont
Occupancy by Ownership in Clermont
Of the total 610 dwellings in Clermont, owner-occupied units account for 502 (82.3%), while renter-occupied units make up 108 (17.7%).
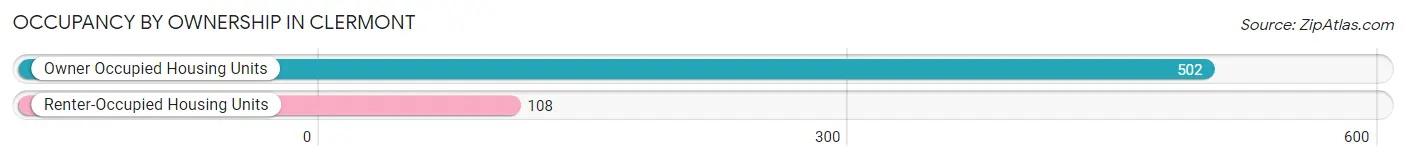
| Occupancy | # Housing Units | % Housing Units |
| Owner Occupied Housing Units | 502 | 82.3% |
| Renter-Occupied Housing Units | 108 | 17.7% |
| Total Occupied Housing Units | 610 | 100.0% |
Occupancy by Household Size in Clermont
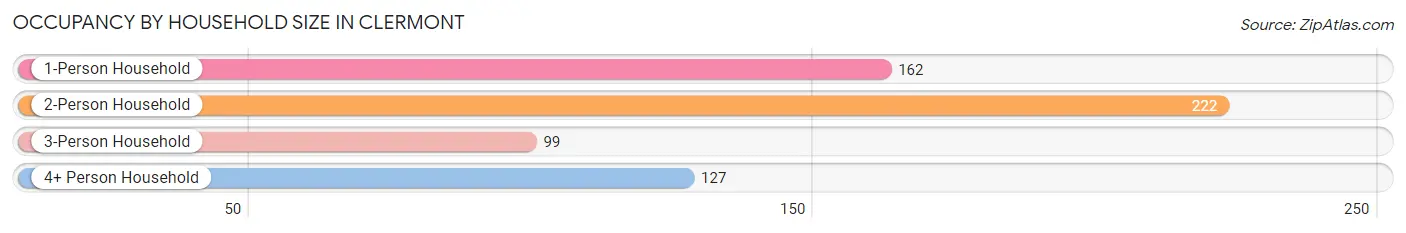
| Household Size | # Housing Units | % Housing Units |
| 1-Person Household | 162 | 26.6% |
| 2-Person Household | 222 | 36.4% |
| 3-Person Household | 99 | 16.2% |
| 4+ Person Household | 127 | 20.8% |
| Total Housing Units | 610 | 100.0% |
Occupancy by Ownership by Household Size in Clermont
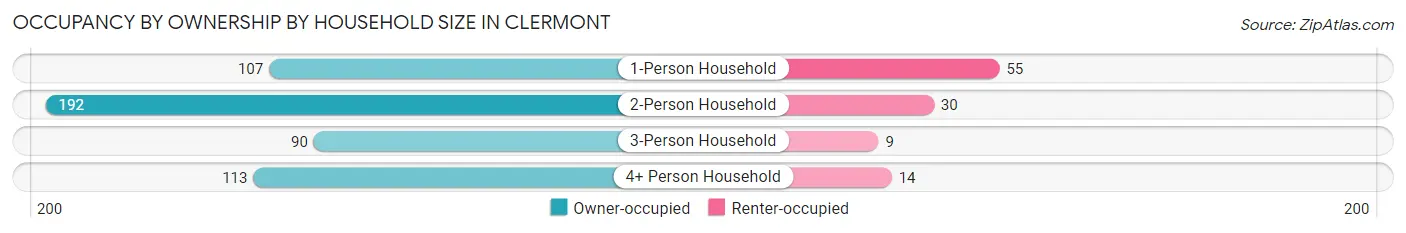
| Household Size | Owner-occupied | Renter-occupied |
| 1-Person Household | 107 (66.0%) | 55 (34.0%) |
| 2-Person Household | 192 (86.5%) | 30 (13.5%) |
| 3-Person Household | 90 (90.9%) | 9 (9.1%) |
| 4+ Person Household | 113 (89.0%) | 14 (11.0%) |
| Total Housing Units | 502 (82.3%) | 108 (17.7%) |
Occupancy by Educational Attainment in Clermont
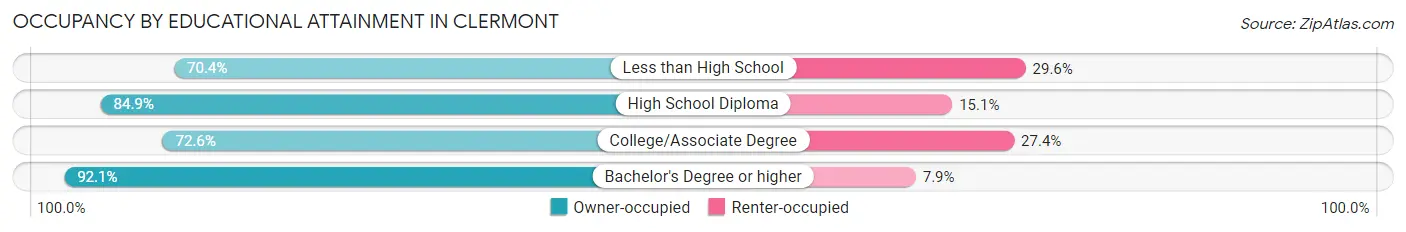
| Household Size | Owner-occupied | Renter-occupied |
| Less than High School | 38 (70.4%) | 16 (29.6%) |
| High School Diploma | 107 (84.9%) | 19 (15.1%) |
| College/Associate Degree | 146 (72.6%) | 55 (27.4%) |
| Bachelor's Degree or higher | 211 (92.1%) | 18 (7.9%) |
Occupancy by Age of Householder in Clermont
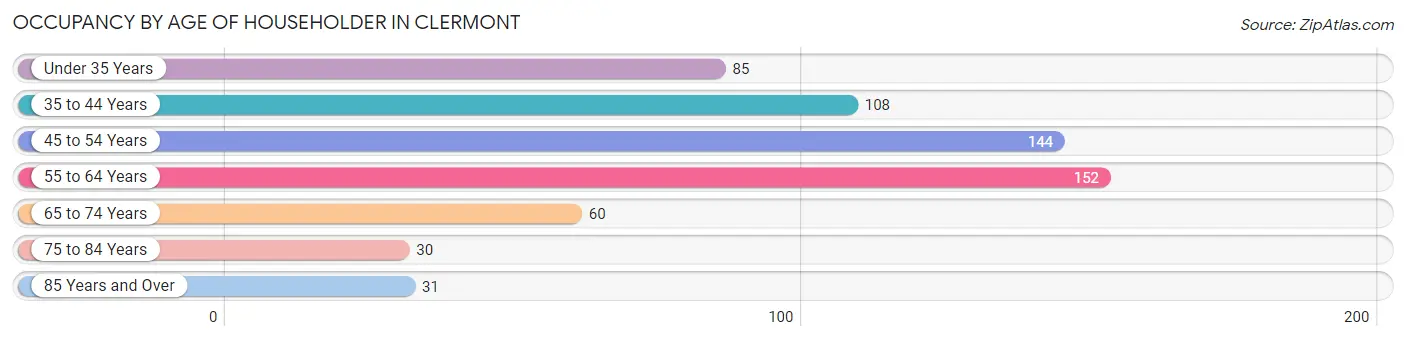
| Age Bracket | # Households | % Households |
| Under 35 Years | 85 | 13.9% |
| 35 to 44 Years | 108 | 17.7% |
| 45 to 54 Years | 144 | 23.6% |
| 55 to 64 Years | 152 | 24.9% |
| 65 to 74 Years | 60 | 9.8% |
| 75 to 84 Years | 30 | 4.9% |
| 85 Years and Over | 31 | 5.1% |
| Total | 610 | 100.0% |
Housing Finances in Clermont
Median Income by Occupancy in Clermont
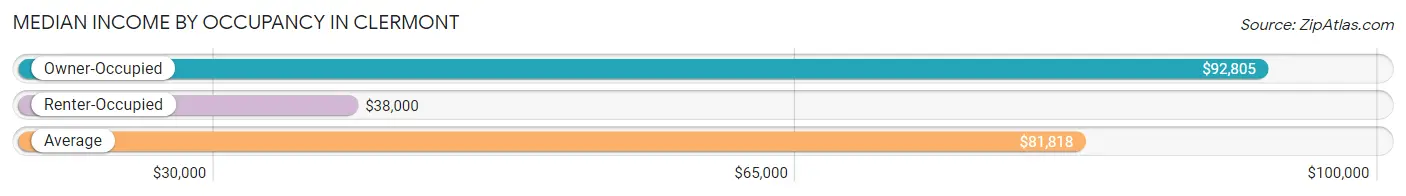
| Occupancy Type | # Households | Median Income |
| Owner-Occupied | 502 (82.3%) | $92,805 |
| Renter-Occupied | 108 (17.7%) | $38,000 |
| Average | 610 (100.0%) | $81,818 |
Occupancy by Householder Income Bracket in Clermont
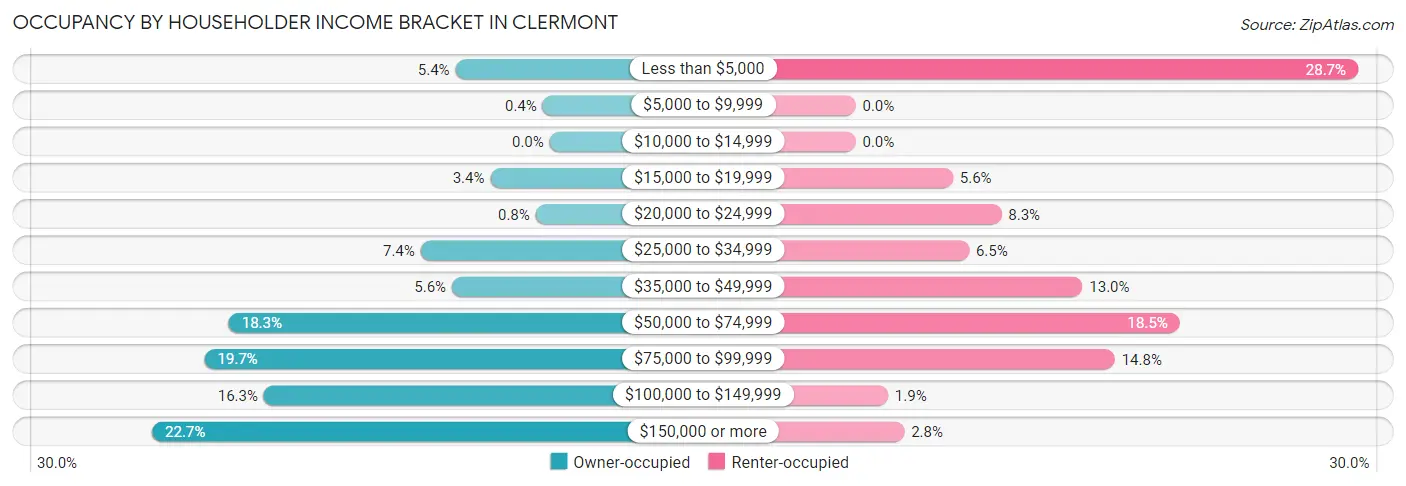
| Income Bracket | Owner-occupied | Renter-occupied |
| Less than $5,000 | 27 (5.4%) | 31 (28.7%) |
| $5,000 to $9,999 | 2 (0.4%) | 0 (0.0%) |
| $10,000 to $14,999 | 0 (0.0%) | 0 (0.0%) |
| $15,000 to $19,999 | 17 (3.4%) | 6 (5.6%) |
| $20,000 to $24,999 | 4 (0.8%) | 9 (8.3%) |
| $25,000 to $34,999 | 37 (7.4%) | 7 (6.5%) |
| $35,000 to $49,999 | 28 (5.6%) | 14 (13.0%) |
| $50,000 to $74,999 | 92 (18.3%) | 20 (18.5%) |
| $75,000 to $99,999 | 99 (19.7%) | 16 (14.8%) |
| $100,000 to $149,999 | 82 (16.3%) | 2 (1.8%) |
| $150,000 or more | 114 (22.7%) | 3 (2.8%) |
| Total | 502 (100.0%) | 108 (100.0%) |
Monthly Housing Cost Tiers in Clermont
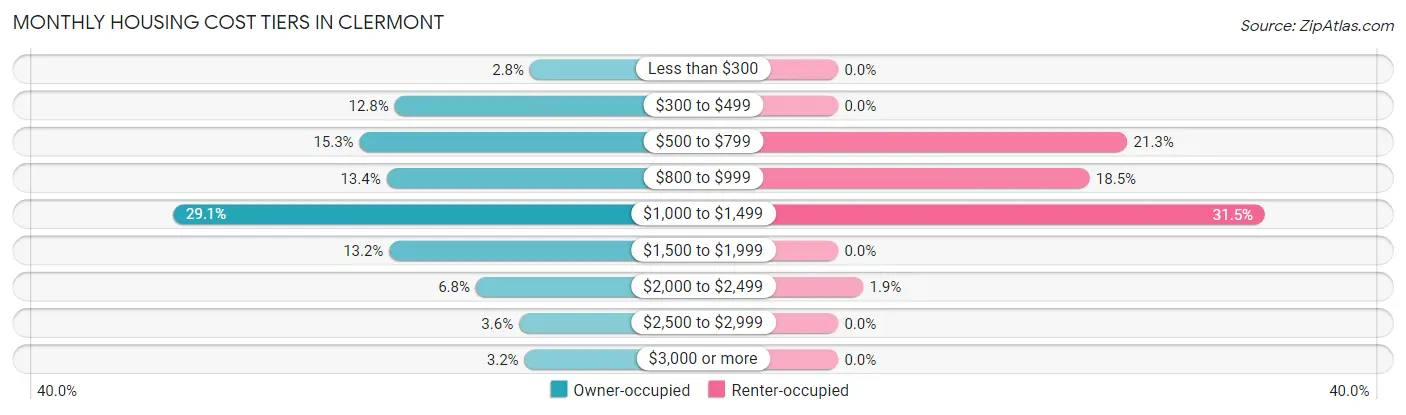
| Monthly Cost | Owner-occupied | Renter-occupied |
| Less than $300 | 14 (2.8%) | 0 (0.0%) |
| $300 to $499 | 64 (12.8%) | 0 (0.0%) |
| $500 to $799 | 77 (15.3%) | 23 (21.3%) |
| $800 to $999 | 67 (13.4%) | 20 (18.5%) |
| $1,000 to $1,499 | 146 (29.1%) | 34 (31.5%) |
| $1,500 to $1,999 | 66 (13.2%) | 0 (0.0%) |
| $2,000 to $2,499 | 34 (6.8%) | 2 (1.8%) |
| $2,500 to $2,999 | 18 (3.6%) | 0 (0.0%) |
| $3,000 or more | 16 (3.2%) | 0 (0.0%) |
| Total | 502 (100.0%) | 108 (100.0%) |
Physical Housing Characteristics in Clermont
Housing Structures in Clermont
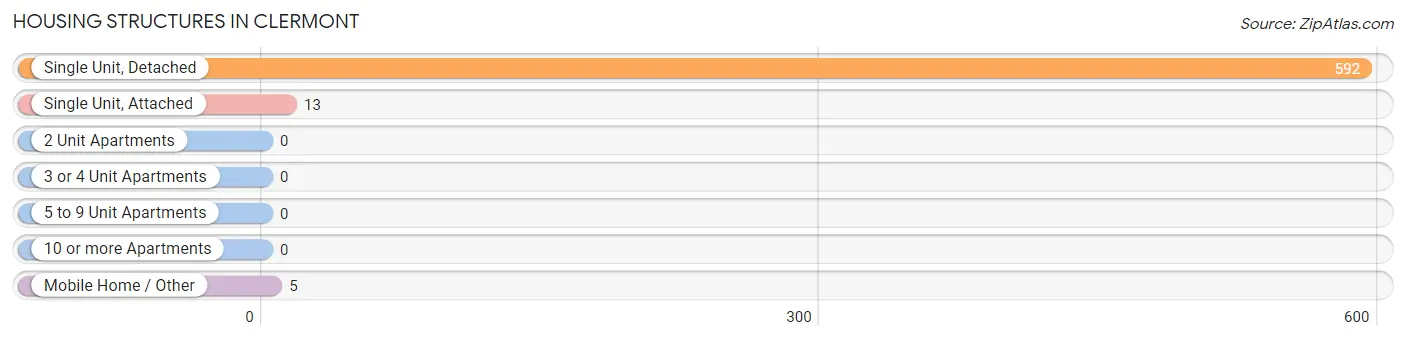
| Structure Type | # Housing Units | % Housing Units |
| Single Unit, Detached | 592 | 97.1% |
| Single Unit, Attached | 13 | 2.1% |
| 2 Unit Apartments | 0 | 0.0% |
| 3 or 4 Unit Apartments | 0 | 0.0% |
| 5 to 9 Unit Apartments | 0 | 0.0% |
| 10 or more Apartments | 0 | 0.0% |
| Mobile Home / Other | 5 | 0.8% |
| Total | 610 | 100.0% |
Housing Structures by Occupancy in Clermont
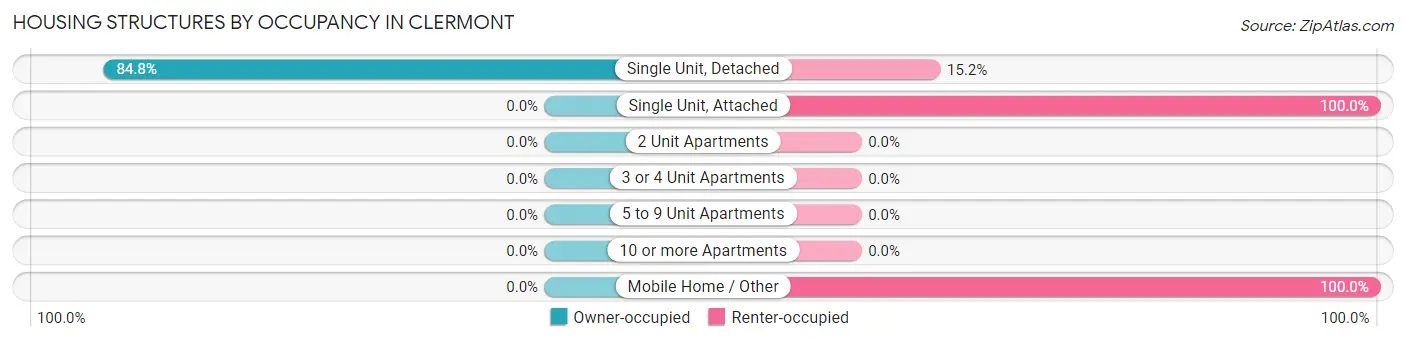
| Structure Type | Owner-occupied | Renter-occupied |
| Single Unit, Detached | 502 (84.8%) | 90 (15.2%) |
| Single Unit, Attached | 0 (0.0%) | 13 (100.0%) |
| 2 Unit Apartments | 0 (0.0%) | 0 (0.0%) |
| 3 or 4 Unit Apartments | 0 (0.0%) | 0 (0.0%) |
| 5 to 9 Unit Apartments | 0 (0.0%) | 0 (0.0%) |
| 10 or more Apartments | 0 (0.0%) | 0 (0.0%) |
| Mobile Home / Other | 0 (0.0%) | 5 (100.0%) |
| Total | 502 (82.3%) | 108 (17.7%) |
Housing Structures by Number of Rooms in Clermont
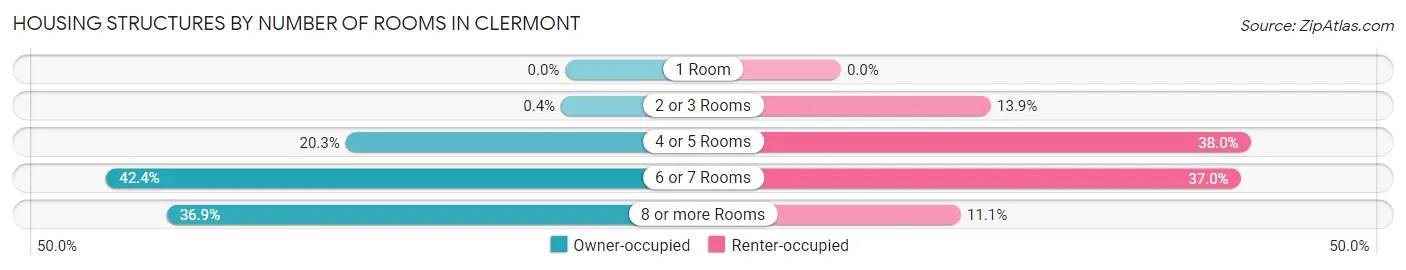
| Number of Rooms | Owner-occupied | Renter-occupied |
| 1 Room | 0 (0.0%) | 0 (0.0%) |
| 2 or 3 Rooms | 2 (0.4%) | 15 (13.9%) |
| 4 or 5 Rooms | 102 (20.3%) | 41 (38.0%) |
| 6 or 7 Rooms | 213 (42.4%) | 40 (37.0%) |
| 8 or more Rooms | 185 (36.8%) | 12 (11.1%) |
| Total | 502 (100.0%) | 108 (100.0%) |
Housing Structure by Heating Type in Clermont
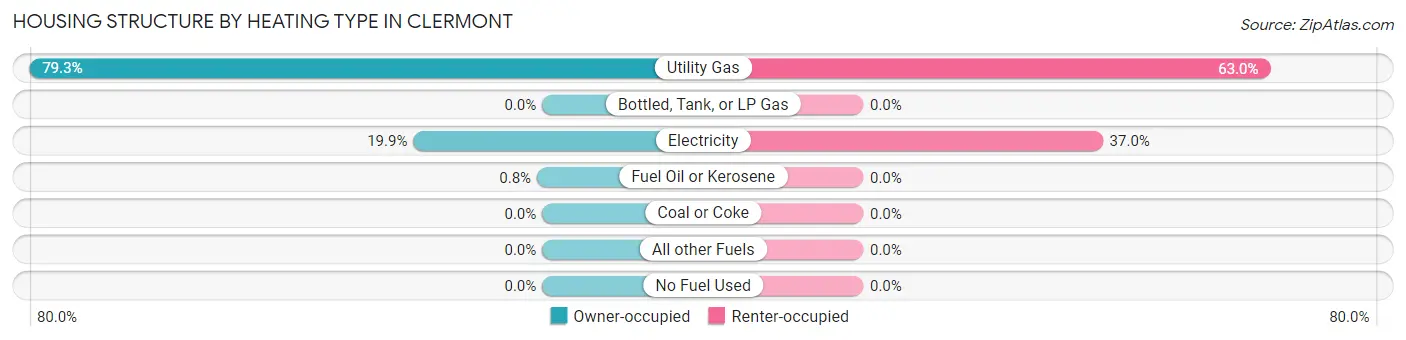
| Heating Type | Owner-occupied | Renter-occupied |
| Utility Gas | 398 (79.3%) | 68 (63.0%) |
| Bottled, Tank, or LP Gas | 0 (0.0%) | 0 (0.0%) |
| Electricity | 100 (19.9%) | 40 (37.0%) |
| Fuel Oil or Kerosene | 4 (0.8%) | 0 (0.0%) |
| Coal or Coke | 0 (0.0%) | 0 (0.0%) |
| All other Fuels | 0 (0.0%) | 0 (0.0%) |
| No Fuel Used | 0 (0.0%) | 0 (0.0%) |
| Total | 502 (100.0%) | 108 (100.0%) |
Household Vehicle Usage in Clermont
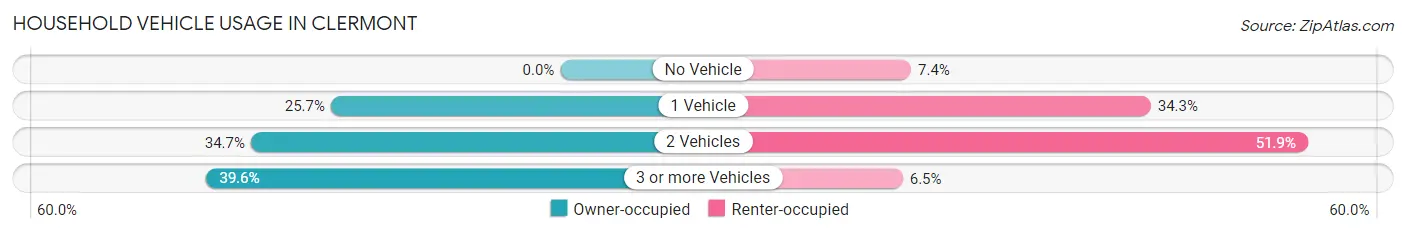
| Vehicles per Household | Owner-occupied | Renter-occupied |
| No Vehicle | 0 (0.0%) | 8 (7.4%) |
| 1 Vehicle | 129 (25.7%) | 37 (34.3%) |
| 2 Vehicles | 174 (34.7%) | 56 (51.8%) |
| 3 or more Vehicles | 199 (39.6%) | 7 (6.5%) |
| Total | 502 (100.0%) | 108 (100.0%) |
Real Estate & Mortgages in Clermont
Real Estate and Mortgage Overview in Clermont
| Characteristic | Without Mortgage | With Mortgage |
| Housing Units | 175 | 327 |
| Median Property Value | $154,300 | $175,400 |
| Median Household Income | $66,750 | $80 |
| Monthly Housing Costs | $533 | $16 |
| Real Estate Taxes | $1,955 | $16 |
Property Value by Mortgage Status in Clermont
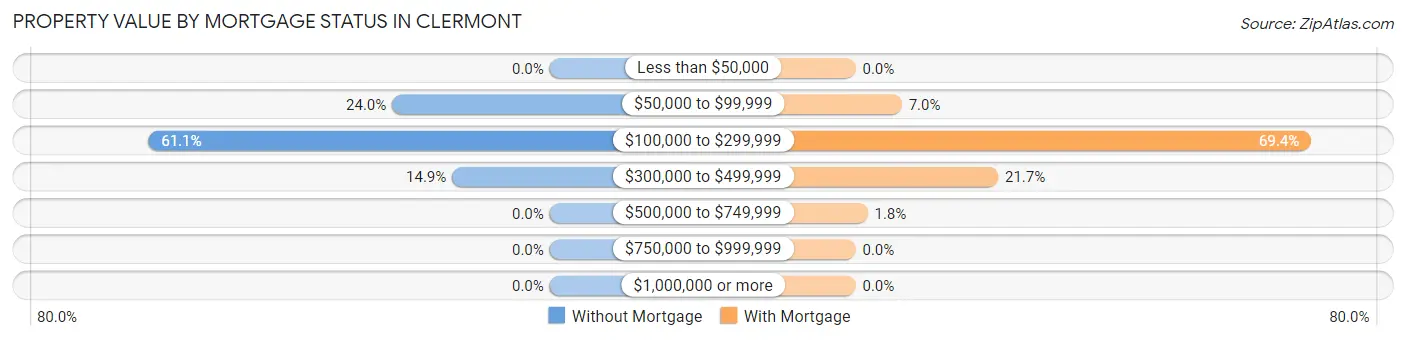
| Property Value | Without Mortgage | With Mortgage |
| Less than $50,000 | 0 (0.0%) | 0 (0.0%) |
| $50,000 to $99,999 | 42 (24.0%) | 23 (7.0%) |
| $100,000 to $299,999 | 107 (61.1%) | 227 (69.4%) |
| $300,000 to $499,999 | 26 (14.9%) | 71 (21.7%) |
| $500,000 to $749,999 | 0 (0.0%) | 6 (1.8%) |
| $750,000 to $999,999 | 0 (0.0%) | 0 (0.0%) |
| $1,000,000 or more | 0 (0.0%) | 0 (0.0%) |
| Total | 175 (100.0%) | 327 (100.0%) |
Household Income by Mortgage Status in Clermont
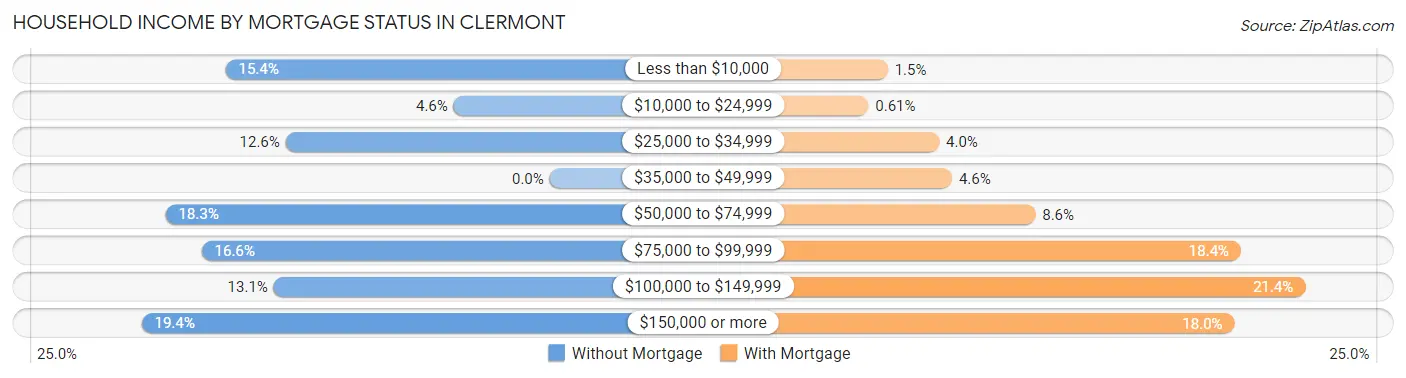
| Household Income | Without Mortgage | With Mortgage |
| Less than $10,000 | 27 (15.4%) | 5 (1.5%) |
| $10,000 to $24,999 | 8 (4.6%) | 2 (0.6%) |
| $25,000 to $34,999 | 22 (12.6%) | 13 (4.0%) |
| $35,000 to $49,999 | 0 (0.0%) | 15 (4.6%) |
| $50,000 to $74,999 | 32 (18.3%) | 28 (8.6%) |
| $75,000 to $99,999 | 29 (16.6%) | 60 (18.3%) |
| $100,000 to $149,999 | 23 (13.1%) | 70 (21.4%) |
| $150,000 or more | 34 (19.4%) | 59 (18.0%) |
| Total | 175 (100.0%) | 327 (100.0%) |
Property Value to Household Income Ratio in Clermont
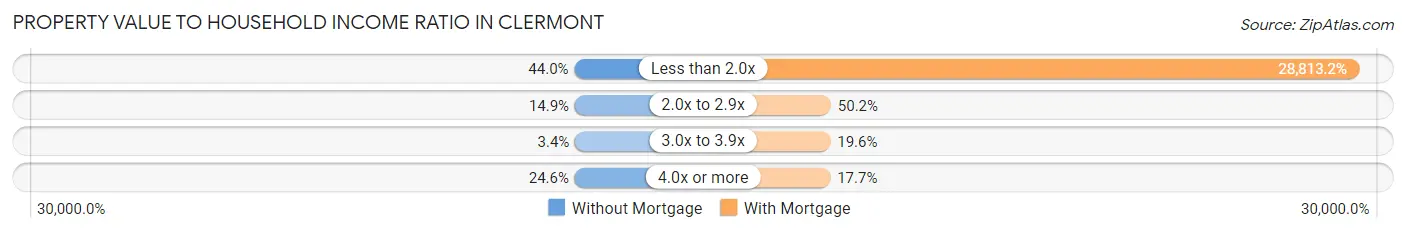
| Value-to-Income Ratio | Without Mortgage | With Mortgage |
| Less than 2.0x | 77 (44.0%) | 94,219 (28,813.2%) |
| 2.0x to 2.9x | 26 (14.9%) | 164 (50.1%) |
| 3.0x to 3.9x | 6 (3.4%) | 64 (19.6%) |
| 4.0x or more | 43 (24.6%) | 58 (17.7%) |
| Total | 175 (100.0%) | 327 (100.0%) |
Real Estate Taxes by Mortgage Status in Clermont
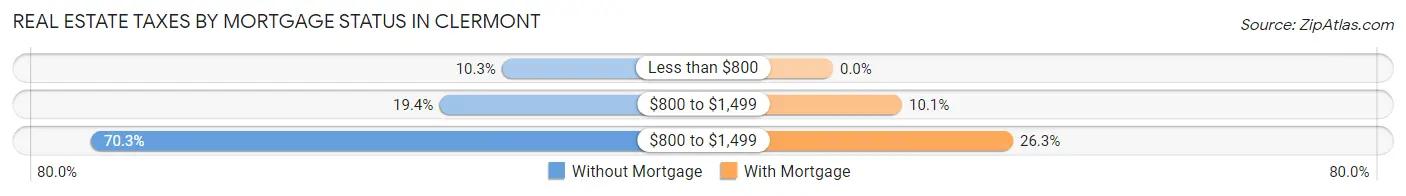
| Property Taxes | Without Mortgage | With Mortgage |
| Less than $800 | 18 (10.3%) | 0 (0.0%) |
| $800 to $1,499 | 34 (19.4%) | 33 (10.1%) |
| $800 to $1,499 | 123 (70.3%) | 86 (26.3%) |
| Total | 175 (100.0%) | 327 (100.0%) |
Health & Disability in Clermont
Health Insurance Coverage by Age in Clermont
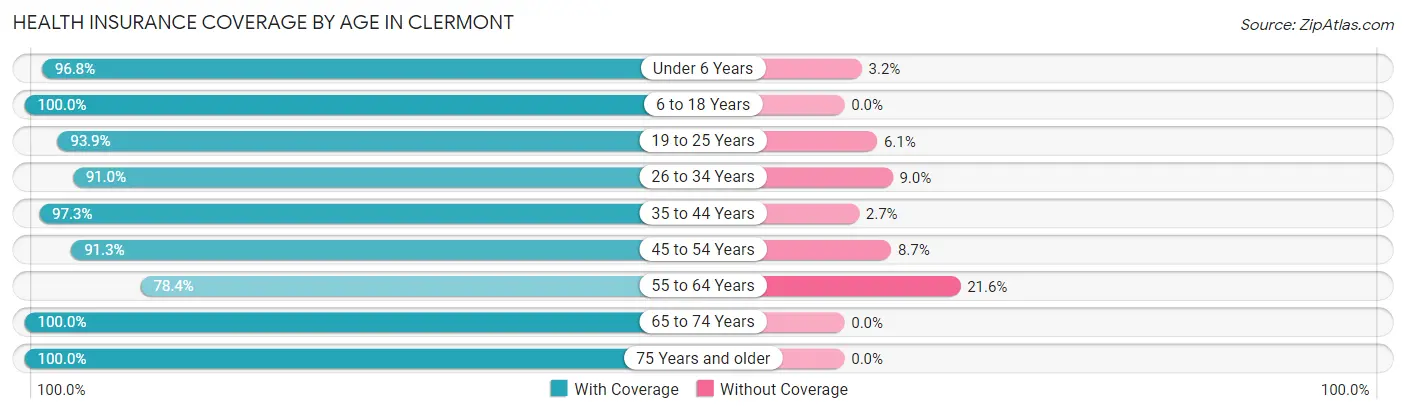
| Age Bracket | With Coverage | Without Coverage |
| Under 6 Years | 90 (96.8%) | 3 (3.2%) |
| 6 to 18 Years | 296 (100.0%) | 0 (0.0%) |
| 19 to 25 Years | 154 (93.9%) | 10 (6.1%) |
| 26 to 34 Years | 152 (91.0%) | 15 (9.0%) |
| 35 to 44 Years | 215 (97.3%) | 6 (2.7%) |
| 45 to 54 Years | 210 (91.3%) | 20 (8.7%) |
| 55 to 64 Years | 185 (78.4%) | 51 (21.6%) |
| 65 to 74 Years | 118 (100.0%) | 0 (0.0%) |
| 75 Years and older | 95 (100.0%) | 0 (0.0%) |
| Total | 1,515 (93.5%) | 105 (6.5%) |
Health Insurance Coverage by Citizenship Status in Clermont
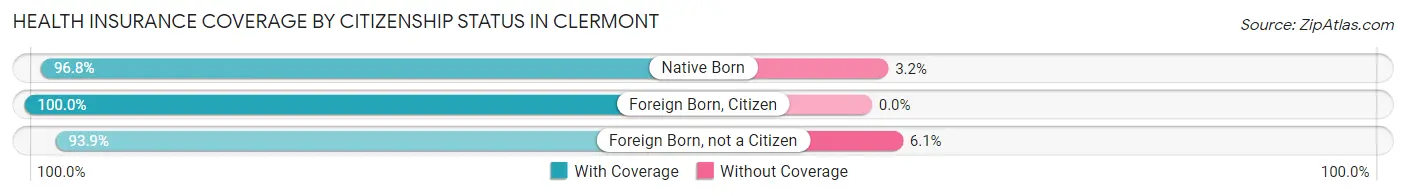
| Citizenship Status | With Coverage | Without Coverage |
| Native Born | 90 (96.8%) | 3 (3.2%) |
| Foreign Born, Citizen | 296 (100.0%) | 0 (0.0%) |
| Foreign Born, not a Citizen | 154 (93.9%) | 10 (6.1%) |
Health Insurance Coverage by Household Income in Clermont
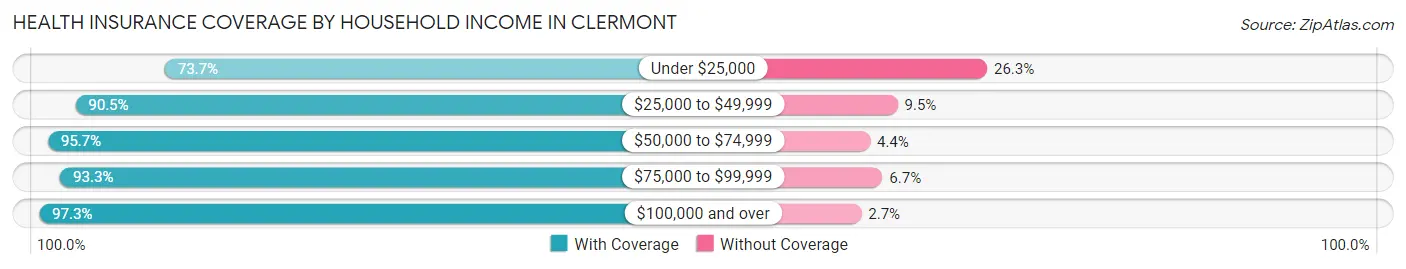
| Household Income | With Coverage | Without Coverage |
| Under $25,000 | 101 (73.7%) | 36 (26.3%) |
| $25,000 to $49,999 | 152 (90.5%) | 16 (9.5%) |
| $50,000 to $74,999 | 242 (95.7%) | 11 (4.3%) |
| $75,000 to $99,999 | 308 (93.3%) | 22 (6.7%) |
| $100,000 and over | 712 (97.3%) | 20 (2.7%) |
Public vs Private Health Insurance Coverage by Age in Clermont
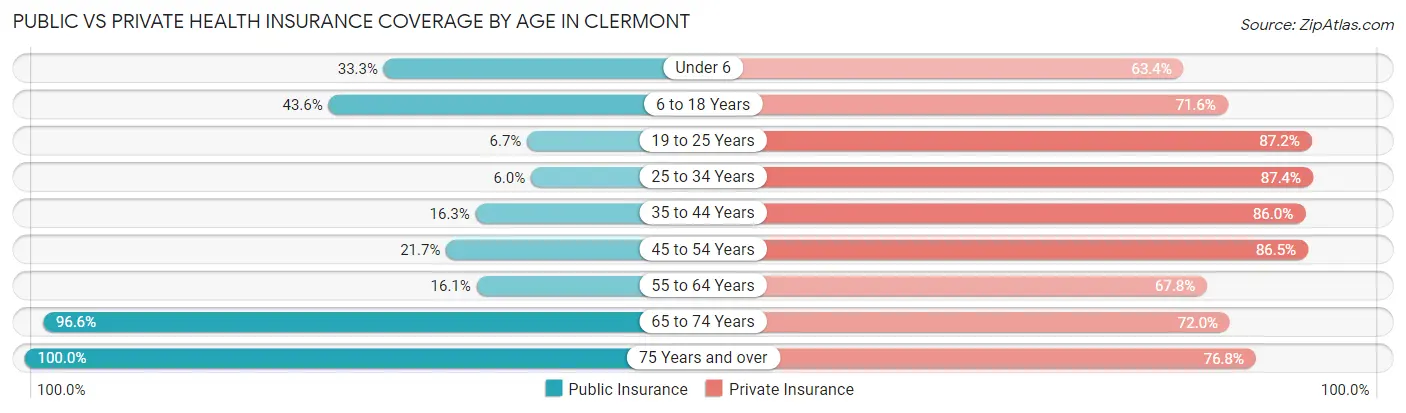
| Age Bracket | Public Insurance | Private Insurance |
| Under 6 | 31 (33.3%) | 59 (63.4%) |
| 6 to 18 Years | 129 (43.6%) | 212 (71.6%) |
| 19 to 25 Years | 11 (6.7%) | 143 (87.2%) |
| 25 to 34 Years | 10 (6.0%) | 146 (87.4%) |
| 35 to 44 Years | 36 (16.3%) | 190 (86.0%) |
| 45 to 54 Years | 50 (21.7%) | 199 (86.5%) |
| 55 to 64 Years | 38 (16.1%) | 160 (67.8%) |
| 65 to 74 Years | 114 (96.6%) | 85 (72.0%) |
| 75 Years and over | 95 (100.0%) | 73 (76.8%) |
| Total | 514 (31.7%) | 1,267 (78.2%) |
Disability Status by Sex by Age in Clermont
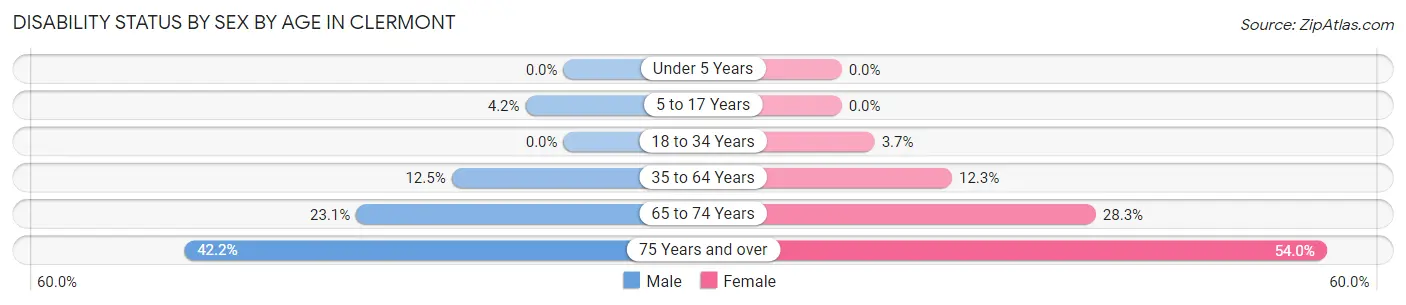
| Age Bracket | Male | Female |
| Under 5 Years | 0 (0.0%) | 0 (0.0%) |
| 5 to 17 Years | 9 (4.2%) | 0 (0.0%) |
| 18 to 34 Years | 0 (0.0%) | 8 (3.7%) |
| 35 to 64 Years | 43 (12.5%) | 42 (12.3%) |
| 65 to 74 Years | 15 (23.1%) | 15 (28.3%) |
| 75 Years and over | 19 (42.2%) | 27 (54.0%) |
Disability Class by Sex by Age in Clermont
Disability Class: Hearing Difficulty
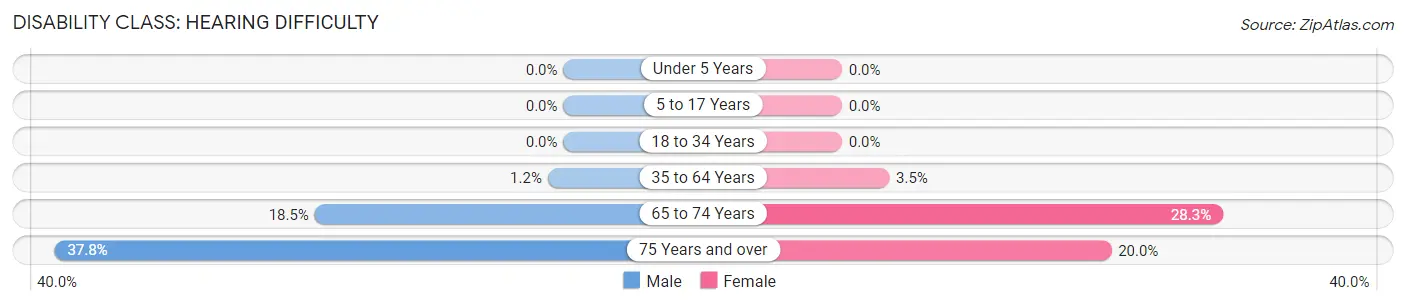
| Age Bracket | Male | Female |
| Under 5 Years | 0 (0.0%) | 0 (0.0%) |
| 5 to 17 Years | 0 (0.0%) | 0 (0.0%) |
| 18 to 34 Years | 0 (0.0%) | 0 (0.0%) |
| 35 to 64 Years | 4 (1.2%) | 12 (3.5%) |
| 65 to 74 Years | 12 (18.5%) | 15 (28.3%) |
| 75 Years and over | 17 (37.8%) | 10 (20.0%) |
Disability Class: Vision Difficulty
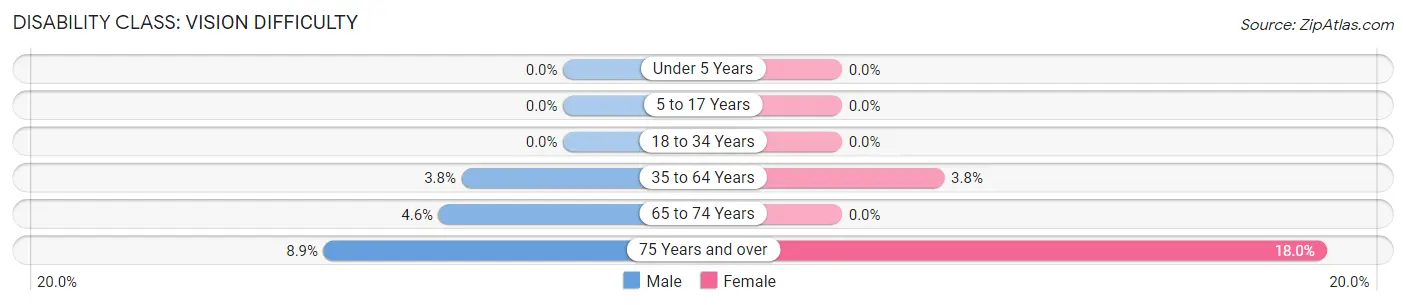
| Age Bracket | Male | Female |
| Under 5 Years | 0 (0.0%) | 0 (0.0%) |
| 5 to 17 Years | 0 (0.0%) | 0 (0.0%) |
| 18 to 34 Years | 0 (0.0%) | 0 (0.0%) |
| 35 to 64 Years | 13 (3.8%) | 13 (3.8%) |
| 65 to 74 Years | 3 (4.6%) | 0 (0.0%) |
| 75 Years and over | 4 (8.9%) | 9 (18.0%) |
Disability Class: Cognitive Difficulty
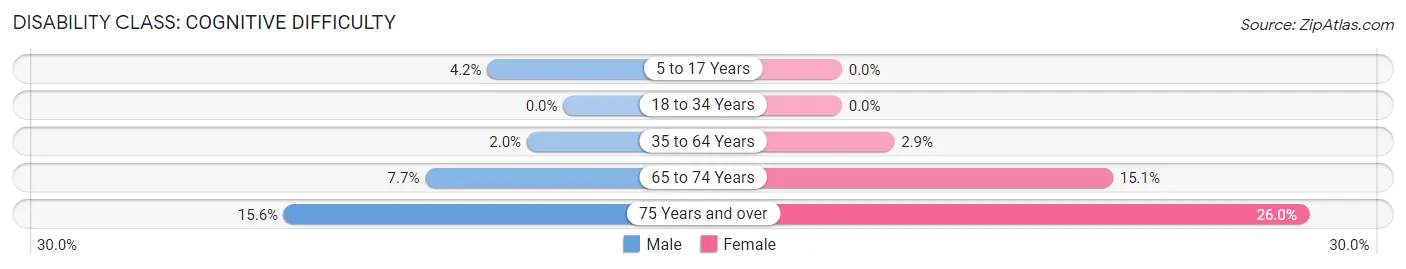
| Age Bracket | Male | Female |
| 5 to 17 Years | 9 (4.2%) | 0 (0.0%) |
| 18 to 34 Years | 0 (0.0%) | 0 (0.0%) |
| 35 to 64 Years | 7 (2.0%) | 10 (2.9%) |
| 65 to 74 Years | 5 (7.7%) | 8 (15.1%) |
| 75 Years and over | 7 (15.6%) | 13 (26.0%) |
Disability Class: Ambulatory Difficulty
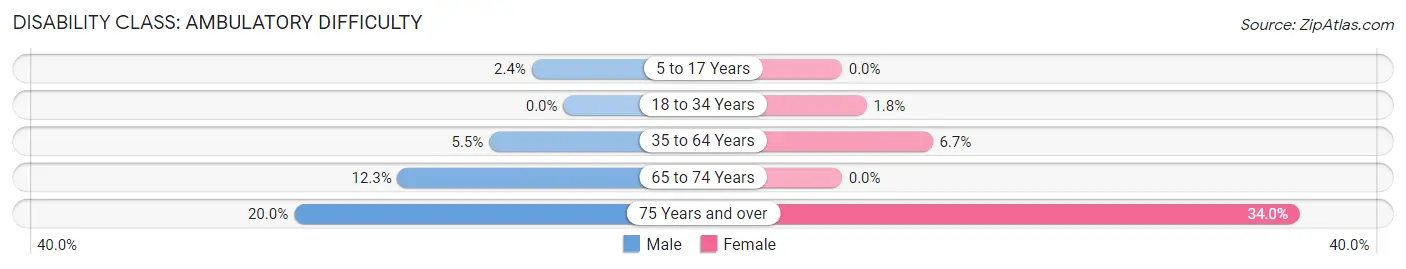
| Age Bracket | Male | Female |
| 5 to 17 Years | 5 (2.4%) | 0 (0.0%) |
| 18 to 34 Years | 0 (0.0%) | 4 (1.8%) |
| 35 to 64 Years | 19 (5.5%) | 23 (6.7%) |
| 65 to 74 Years | 8 (12.3%) | 0 (0.0%) |
| 75 Years and over | 9 (20.0%) | 17 (34.0%) |
Disability Class: Self-Care Difficulty
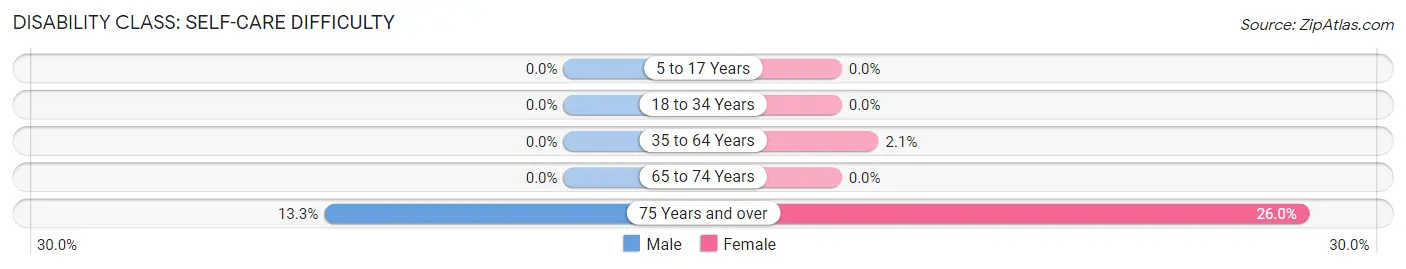
| Age Bracket | Male | Female |
| 5 to 17 Years | 0 (0.0%) | 0 (0.0%) |
| 18 to 34 Years | 0 (0.0%) | 0 (0.0%) |
| 35 to 64 Years | 0 (0.0%) | 7 (2.1%) |
| 65 to 74 Years | 0 (0.0%) | 0 (0.0%) |
| 75 Years and over | 6 (13.3%) | 13 (26.0%) |
Technology Access in Clermont
Computing Device Access in Clermont
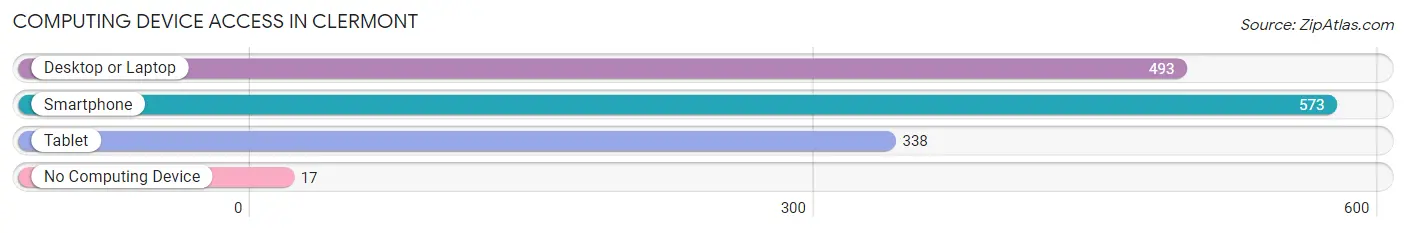
| Device Type | # Households | % Households |
| Desktop or Laptop | 493 | 80.8% |
| Smartphone | 573 | 93.9% |
| Tablet | 338 | 55.4% |
| No Computing Device | 17 | 2.8% |
| Total | 610 | 100.0% |
Internet Access in Clermont
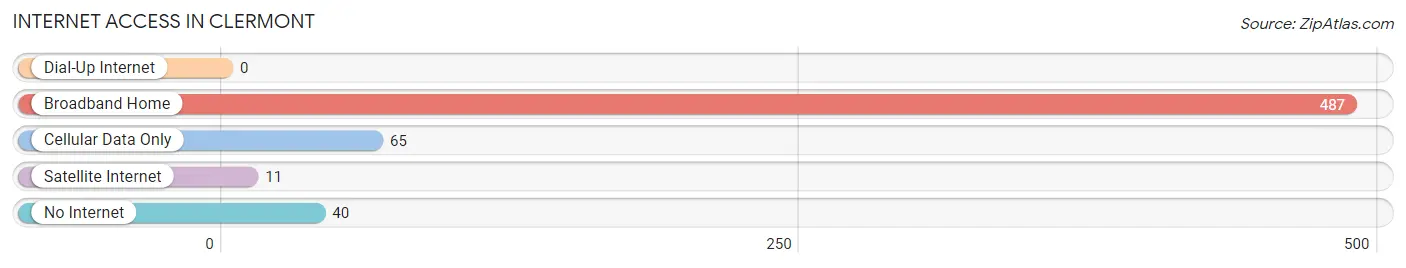
| Internet Type | # Households | % Households |
| Dial-Up Internet | 0 | 0.0% |
| Broadband Home | 487 | 79.8% |
| Cellular Data Only | 65 | 10.7% |
| Satellite Internet | 11 | 1.8% |
| No Internet | 40 | 6.6% |
| Total | 610 | 100.0% |
Clermont Summary
Clermont is a small town located in the state of Indiana, United States. It is situated in the southwestern part of the state, in the county of Clark. The town has a population of around 1,000 people, according to the 2010 census.
Geography
Clermont is located in the southwestern part of Indiana, in Clark County. It is situated on the banks of the Ohio River, and is bordered by the towns of Sellersburg to the north, Jeffersonville to the east, and New Albany to the south. The town is located at an elevation of around 500 feet above sea level.
The town has a total area of 0.7 square miles, all of which is land. The climate in Clermont is humid continental, with hot summers and cold winters. The average annual temperature is around 50 degrees Fahrenheit.
History
Clermont was founded in 1817 by a group of settlers from Kentucky. The town was named after the French city of Clermont-Ferrand. The town was originally a farming community, and the main crops grown were corn, wheat, and tobacco.
In the late 19th century, the town began to grow and develop. The railroad was built in 1881, and the town became a popular stop for travelers. The town also became a center for manufacturing, with several factories being built in the area.
In the early 20th century, the town experienced a period of growth and prosperity. The population increased from around 500 in 1900 to over 1,000 in 1930. The town also became a popular tourist destination, with several hotels and resorts being built in the area.
Economy
Clermont’s economy is largely based on agriculture and manufacturing. The town is home to several factories, including a paper mill, a furniture factory, and a plastics factory. The town also has several small businesses, including restaurants, shops, and service providers.
The town is also home to several tourist attractions, including the Clermont State Historic Site, the Clermont County Historical Museum, and the Clermont County Fairgrounds.
Demographics
According to the 2010 census, the population of Clermont was 1,000. The racial makeup of the town was 97.2% White, 0.7% African American, 0.3% Native American, 0.2% Asian, and 1.6% from other races. The median household income was $37,500, and the median age was 40.
Conclusion
Clermont is a small town located in the southwestern part of Indiana. It has a population of around 1,000 people, and is largely based on agriculture and manufacturing. The town is home to several tourist attractions, and has a median household income of $37,500.
Common Questions
What is Per Capita Income in Clermont?
Per Capita income in Clermont is $36,301.
What is the Median Family Income in Clermont?
Median Family Income in Clermont is $93,698.
What is the Median Household income in Clermont?
Median Household Income in Clermont is $81,818.
What is Income or Wage Gap in Clermont?
Income or Wage Gap in Clermont is 26.7%.
Women in Clermont earn 73.3 cents for every dollar earned by a man.
What is Inequality or Gini Index in Clermont?
Inequality or Gini Index in Clermont is 0.41.
What is the Total Population of Clermont?
Total Population of Clermont is 1,624.
What is the Total Male Population of Clermont?
Total Male Population of Clermont is 836.
What is the Total Female Population of Clermont?
Total Female Population of Clermont is 788.
What is the Ratio of Males per 100 Females in Clermont?
There are 106.09 Males per 100 Females in Clermont.
What is the Ratio of Females per 100 Males in Clermont?
There are 94.26 Females per 100 Males in Clermont.
What is the Median Population Age in Clermont?
Median Population Age in Clermont is 40.0 Years.
What is the Average Family Size in Clermont
Average Family Size in Clermont is 3.3 People.
What is the Average Household Size in Clermont
Average Household Size in Clermont is 2.7 People.
How Large is the Labor Force in Clermont?
There are 923 People in the Labor Forcein in Clermont.
What is the Percentage of People in the Labor Force in Clermont?
69.9% of People are in the Labor Force in Clermont.
What is the Unemployment Rate in Clermont?
Unemployment Rate in Clermont is 3.0%.