North Druid Hills, GA Map & Demographics
North Druid Hills Map
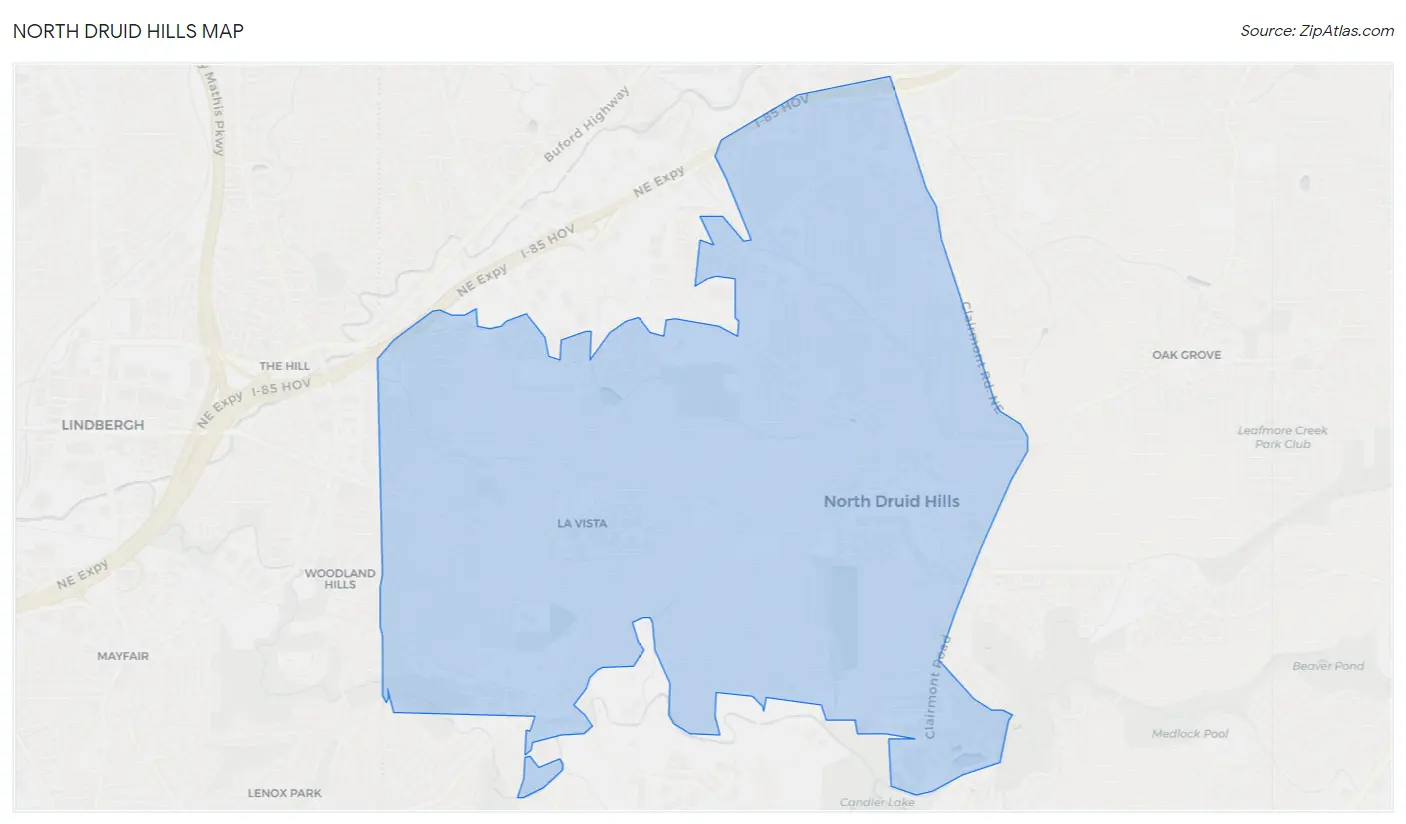
North Druid Hills Overview
$58,604
PER CAPITA INCOME
$124,132
AVG FAMILY INCOME
$92,893
AVG HOUSEHOLD INCOME
31.6%
WAGE / INCOME GAP [ % ]
68.4¢/ $1
WAGE / INCOME GAP [ $ ]
0.48
INEQUALITY / GINI INDEX
17,241
TOTAL POPULATION
8,021
MALE POPULATION
9,220
FEMALE POPULATION
87.00
MALES / 100 FEMALES
114.95
FEMALES / 100 MALES
32.5
MEDIAN AGE
3.1
AVG FAMILY SIZE
2.1
AVG HOUSEHOLD SIZE
10,655
LABOR FORCE [ PEOPLE ]
72.2%
PERCENT IN LABOR FORCE
3.8%
UNEMPLOYMENT RATE
Income in North Druid Hills
Income Overview in North Druid Hills
Per Capita Income in North Druid Hills is $58,604, while median incomes of families and households are $124,132 and $92,893 respectively.
| Characteristic | Number | Measure |
| Per Capita Income | 17,241 | $58,604 |
| Median Family Income | 3,013 | $124,132 |
| Mean Family Income | 3,013 | $176,091 |
| Median Household Income | 7,830 | $92,893 |
| Mean Household Income | 7,830 | $122,827 |
| Income Deficit | 3,013 | $0 |
| Wage / Income Gap (%) | 17,241 | 31.62% |
| Wage / Income Gap ($) | 17,241 | 68.38¢ per $1 |
| Gini / Inequality Index | 17,241 | 0.48 |
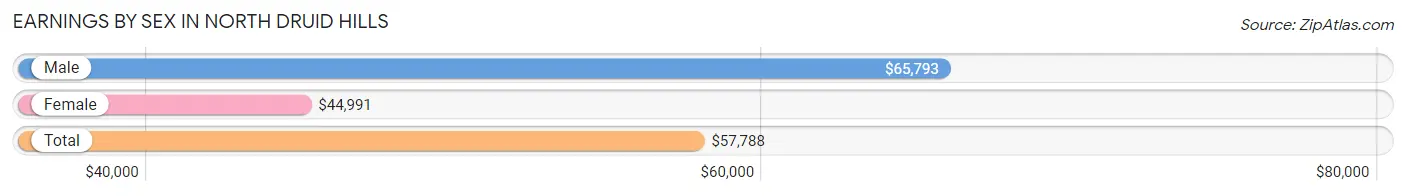
Earnings by Sex in North Druid Hills
Average Earnings in North Druid Hills are $57,788, $65,793 for men and $44,991 for women, a difference of 31.6%.
| Sex | Number | Average Earnings |
| Male | 5,526 (49.6%) | $65,793 |
| Female | 5,609 (50.4%) | $44,991 |
| Total | 11,135 (100.0%) | $57,788 |
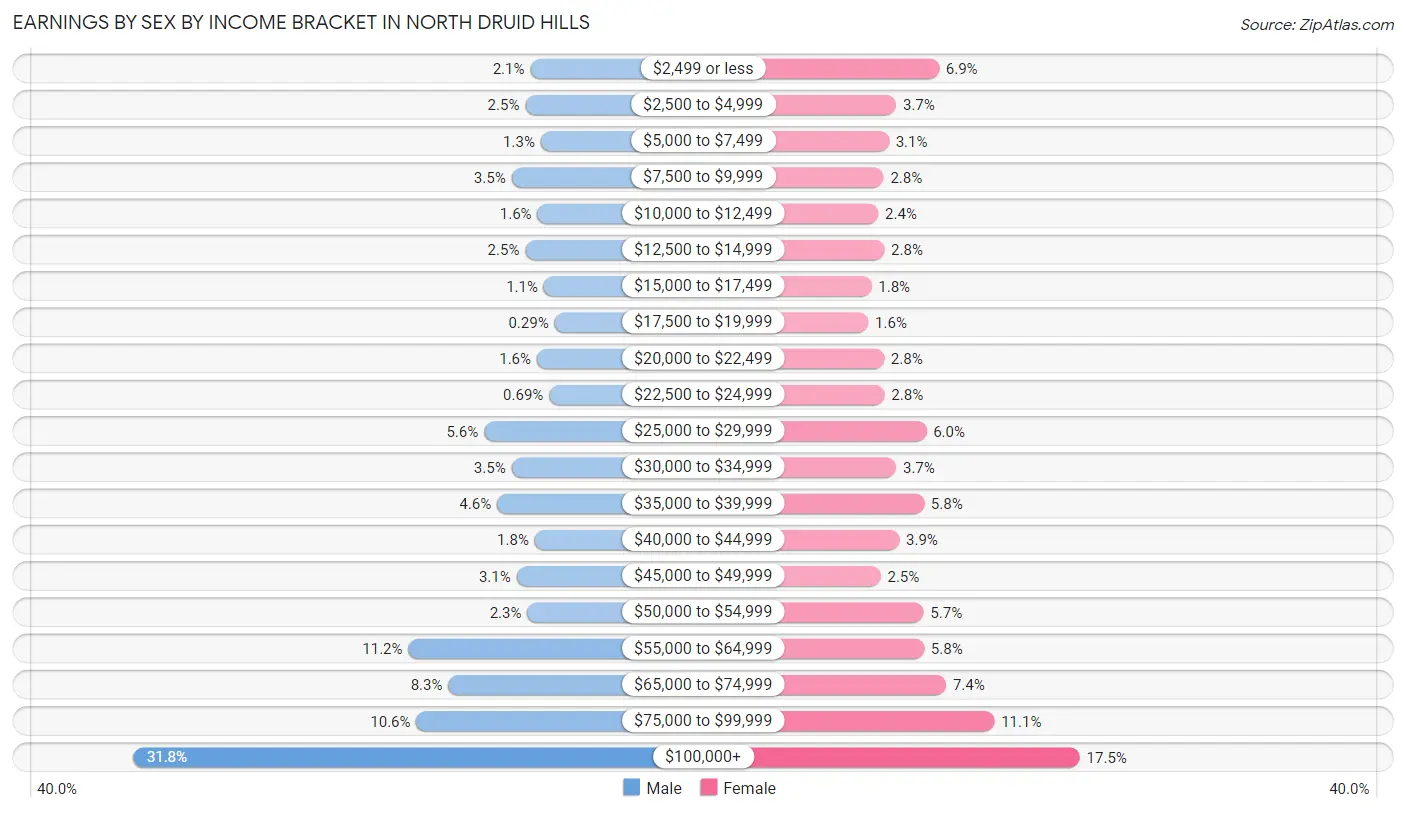
Earnings by Sex by Income Bracket in North Druid Hills
The most common earnings brackets in North Druid Hills are $100,000+ for men (1,758 | 31.8%) and $100,000+ for women (979 | 17.4%).
| Income | Male | Female |
| $2,499 or less | 116 (2.1%) | 387 (6.9%) |
| $2,500 to $4,999 | 137 (2.5%) | 207 (3.7%) |
| $5,000 to $7,499 | 73 (1.3%) | 176 (3.1%) |
| $7,500 to $9,999 | 194 (3.5%) | 154 (2.8%) |
| $10,000 to $12,499 | 87 (1.6%) | 132 (2.4%) |
| $12,500 to $14,999 | 137 (2.5%) | 157 (2.8%) |
| $15,000 to $17,499 | 60 (1.1%) | 103 (1.8%) |
| $17,500 to $19,999 | 16 (0.3%) | 90 (1.6%) |
| $20,000 to $22,499 | 89 (1.6%) | 156 (2.8%) |
| $22,500 to $24,999 | 38 (0.7%) | 158 (2.8%) |
| $25,000 to $29,999 | 308 (5.6%) | 334 (5.9%) |
| $30,000 to $34,999 | 194 (3.5%) | 207 (3.7%) |
| $35,000 to $39,999 | 254 (4.6%) | 324 (5.8%) |
| $40,000 to $44,999 | 98 (1.8%) | 220 (3.9%) |
| $45,000 to $49,999 | 173 (3.1%) | 142 (2.5%) |
| $50,000 to $54,999 | 129 (2.3%) | 322 (5.7%) |
| $55,000 to $64,999 | 621 (11.2%) | 324 (5.8%) |
| $65,000 to $74,999 | 456 (8.3%) | 417 (7.4%) |
| $75,000 to $99,999 | 588 (10.6%) | 620 (11.1%) |
| $100,000+ | 1,758 (31.8%) | 979 (17.4%) |
| Total | 5,526 (100.0%) | 5,609 (100.0%) |
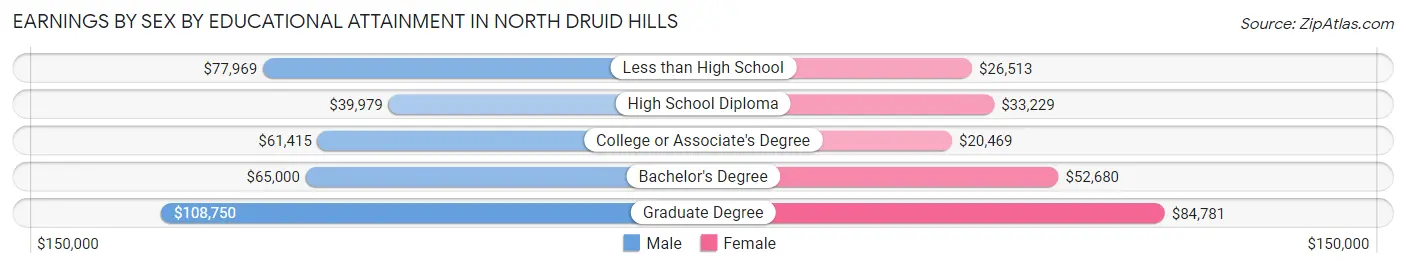
Earnings by Sex by Educational Attainment in North Druid Hills
Average earnings in North Druid Hills are $71,882 for men and $58,290 for women, a difference of 18.9%. Men with an educational attainment of graduate degree enjoy the highest average annual earnings of $108,750, while those with high school diploma education earn the least with $39,979. Women with an educational attainment of graduate degree earn the most with the average annual earnings of $84,781, while those with college or associate's degree education have the smallest earnings of $20,469.
| Educational Attainment | Male Income | Female Income |
| Less than High School | $77,969 | $26,513 |
| High School Diploma | $39,979 | $33,229 |
| College or Associate's Degree | $61,415 | $20,469 |
| Bachelor's Degree | $65,000 | $52,680 |
| Graduate Degree | $108,750 | $84,781 |
| Total | $71,882 | $58,290 |
Family Income in North Druid Hills
Family Income Brackets in North Druid Hills
According to the North Druid Hills family income data, there are 862 families falling into the $200,000+ income range, which is the most common income bracket and makes up 28.6% of all families. Conversely, the $10,000 to $14,999 income bracket is the least frequent group with only 18 families (0.6%) belonging to this category.
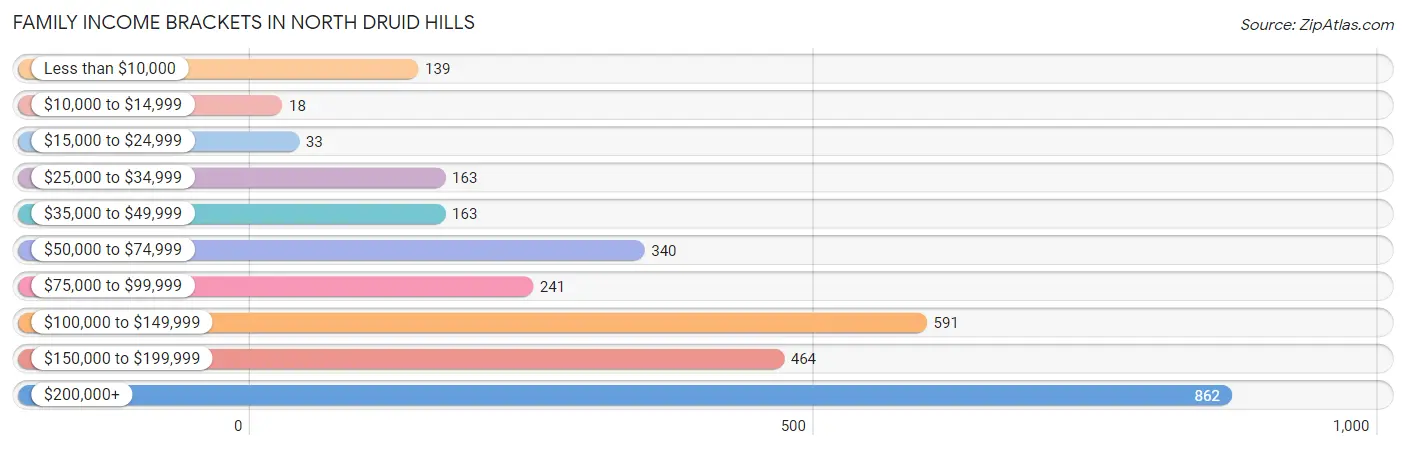
| Income Bracket | # Families | % Families |
| Less than $10,000 | 139 | 4.6% |
| $10,000 to $14,999 | 18 | 0.6% |
| $15,000 to $24,999 | 33 | 1.1% |
| $25,000 to $34,999 | 163 | 5.4% |
| $35,000 to $49,999 | 163 | 5.4% |
| $50,000 to $74,999 | 340 | 11.3% |
| $75,000 to $99,999 | 241 | 8.0% |
| $100,000 to $149,999 | 591 | 19.6% |
| $150,000 to $199,999 | 464 | 15.4% |
| $200,000+ | 862 | 28.6% |
Family Income by Famaliy Size in North Druid Hills
4-person families (266 | 8.8%) account for the highest median family income in North Druid Hills with $205,417 per family, while 2-person families (1,686 | 56.0%) have the highest median income of $56,686 per family member.
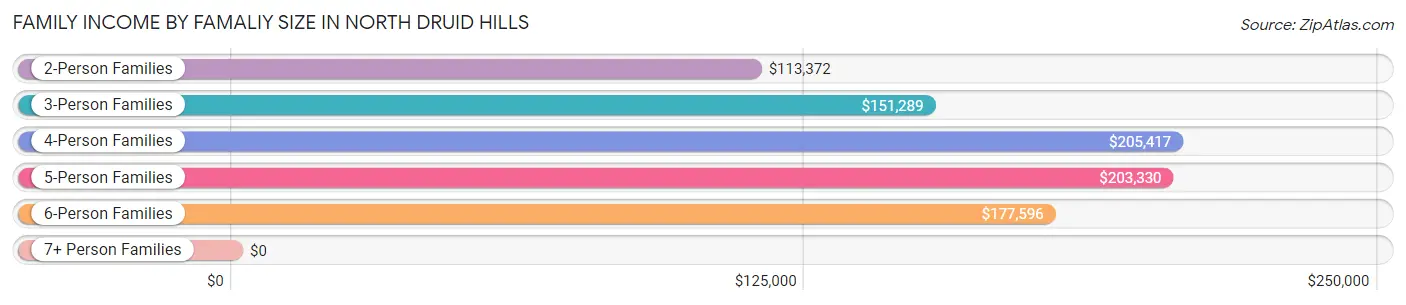
| Income Bracket | # Families | Median Income |
| 2-Person Families | 1,686 (56.0%) | $113,372 |
| 3-Person Families | 697 (23.1%) | $151,289 |
| 4-Person Families | 266 (8.8%) | $205,417 |
| 5-Person Families | 277 (9.2%) | $203,330 |
| 6-Person Families | 71 (2.4%) | $177,596 |
| 7+ Person Families | 16 (0.5%) | $0 |
| Total | 3,013 (100.0%) | $124,132 |
Family Income by Number of Earners in North Druid Hills
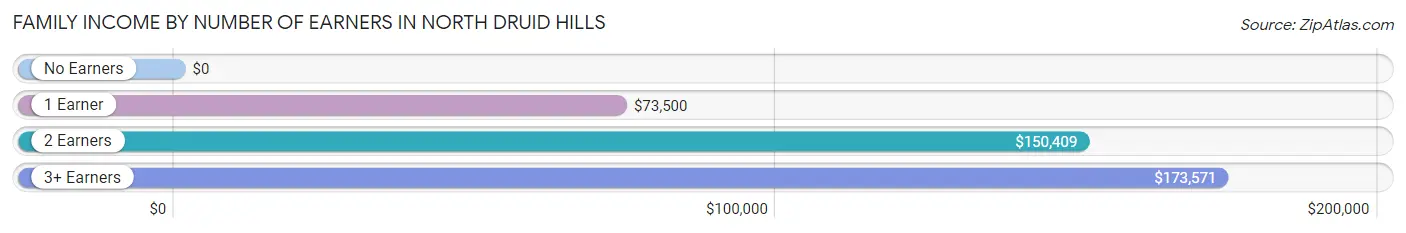
| Number of Earners | # Families | Median Income |
| No Earners | 259 (8.6%) | $0 |
| 1 Earner | 782 (26.0%) | $73,500 |
| 2 Earners | 1,848 (61.3%) | $150,409 |
| 3+ Earners | 124 (4.1%) | $173,571 |
| Total | 3,013 (100.0%) | $124,132 |
Household Income in North Druid Hills
Household Income Brackets in North Druid Hills
With 1,597 households falling in the category, the $100,000 to $149,999 income range is the most frequent in North Druid Hills, accounting for 20.4% of all households. In contrast, only 219 households (2.8%) fall into the $10,000 to $14,999 income bracket, making it the least populous group.
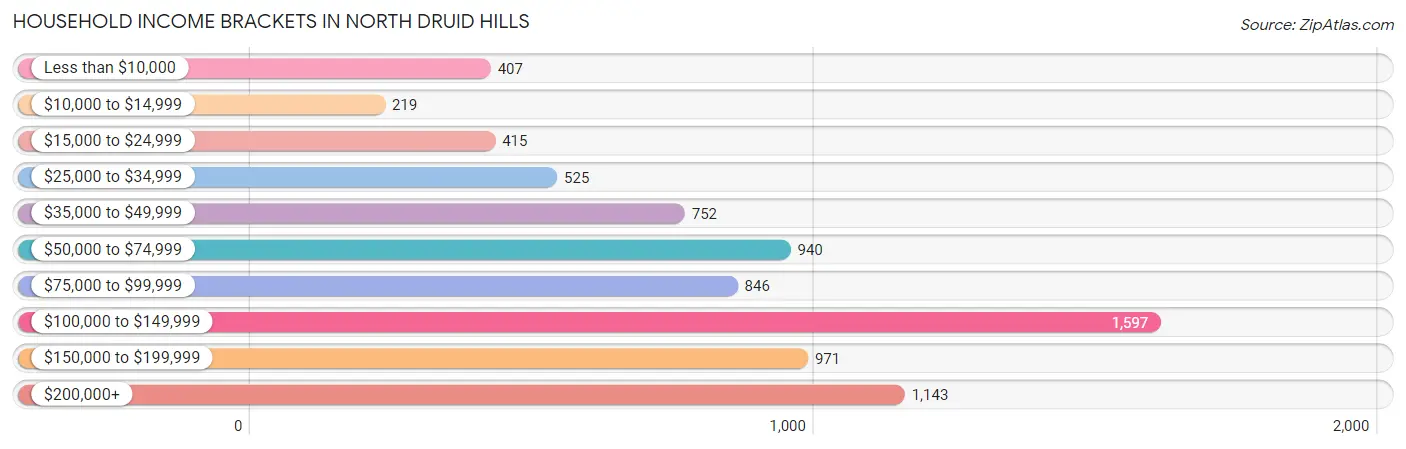
| Income Bracket | # Households | % Households |
| Less than $10,000 | 407 | 5.2% |
| $10,000 to $14,999 | 219 | 2.8% |
| $15,000 to $24,999 | 415 | 5.3% |
| $25,000 to $34,999 | 525 | 6.7% |
| $35,000 to $49,999 | 752 | 9.6% |
| $50,000 to $74,999 | 940 | 12.0% |
| $75,000 to $99,999 | 846 | 10.8% |
| $100,000 to $149,999 | 1,597 | 20.4% |
| $150,000 to $199,999 | 971 | 12.4% |
| $200,000+ | 1,143 | 14.6% |
Household Income by Householder Age in North Druid Hills
The median household income in North Druid Hills is $92,893, with the highest median household income of $108,933 found in the 25 to 44 years age bracket for the primary householder. A total of 3,934 households (50.2%) fall into this category. Meanwhile, the 15 to 24 years age bracket for the primary householder has the lowest median household income of $33,818, with 698 households (8.9%) in this group.
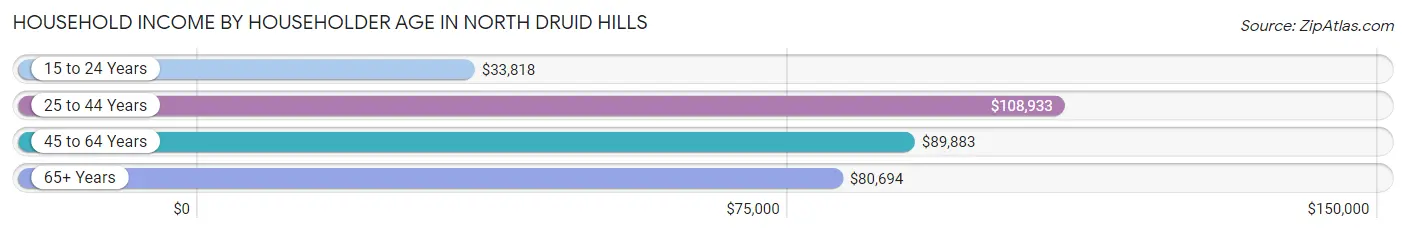
| Income Bracket | # Households | Median Income |
| 15 to 24 Years | 698 (8.9%) | $33,818 |
| 25 to 44 Years | 3,934 (50.2%) | $108,933 |
| 45 to 64 Years | 1,866 (23.8%) | $89,883 |
| 65+ Years | 1,332 (17.0%) | $80,694 |
| Total | 7,830 (100.0%) | $92,893 |
Poverty in North Druid Hills
Income Below Poverty by Sex and Age in North Druid Hills
With 10.7% poverty level for males and 17.7% for females among the residents of North Druid Hills, 18 to 24 year old males and 18 to 24 year old females are the most vulnerable to poverty, with 222 males (27.8%) and 788 females (57.0%) in their respective age groups living below the poverty level.
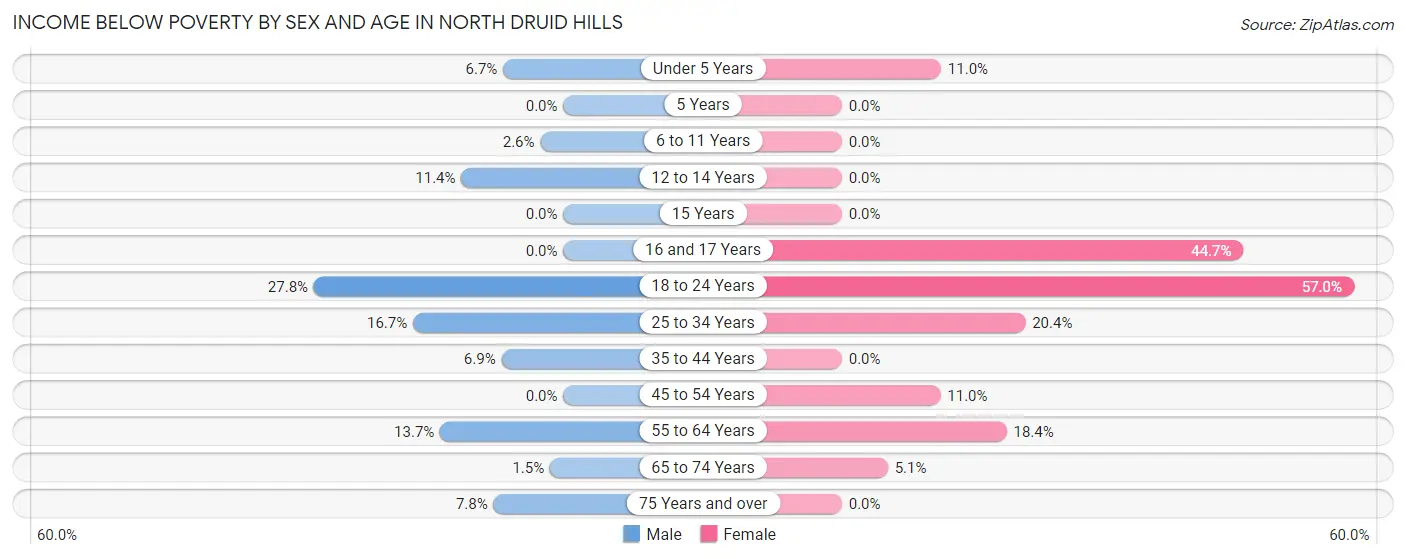
| Age Bracket | Male | Female |
| Under 5 Years | 36 (6.7%) | 71 (11.0%) |
| 5 Years | 0 (0.0%) | 0 (0.0%) |
| 6 to 11 Years | 8 (2.6%) | 0 (0.0%) |
| 12 to 14 Years | 15 (11.4%) | 0 (0.0%) |
| 15 Years | 0 (0.0%) | 0 (0.0%) |
| 16 and 17 Years | 0 (0.0%) | 55 (44.7%) |
| 18 to 24 Years | 222 (27.8%) | 788 (57.0%) |
| 25 to 34 Years | 360 (16.7%) | 464 (20.4%) |
| 35 to 44 Years | 79 (6.9%) | 0 (0.0%) |
| 45 to 54 Years | 0 (0.0%) | 66 (11.0%) |
| 55 to 64 Years | 83 (13.7%) | 131 (18.3%) |
| 65 to 74 Years | 8 (1.5%) | 29 (5.1%) |
| 75 Years and over | 29 (7.8%) | 0 (0.0%) |
| Total | 840 (10.7%) | 1,604 (17.7%) |
Income Above Poverty by Sex and Age in North Druid Hills
According to the poverty statistics in North Druid Hills, males aged 5 years and females aged 5 years are the age groups that are most secure financially, with 100.0% of males and 100.0% of females in these age groups living above the poverty line.
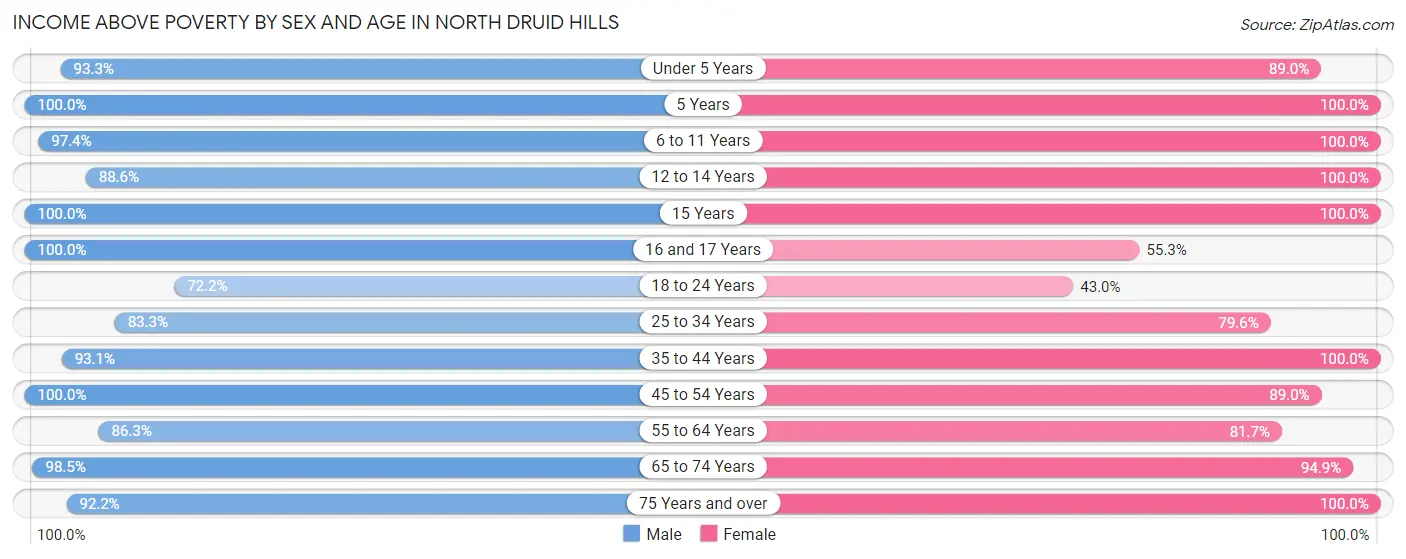
| Age Bracket | Male | Female |
| Under 5 Years | 501 (93.3%) | 572 (89.0%) |
| 5 Years | 46 (100.0%) | 11 (100.0%) |
| 6 to 11 Years | 304 (97.4%) | 526 (100.0%) |
| 12 to 14 Years | 117 (88.6%) | 140 (100.0%) |
| 15 Years | 39 (100.0%) | 96 (100.0%) |
| 16 and 17 Years | 119 (100.0%) | 68 (55.3%) |
| 18 to 24 Years | 577 (72.2%) | 594 (43.0%) |
| 25 to 34 Years | 1,791 (83.3%) | 1,807 (79.6%) |
| 35 to 44 Years | 1,068 (93.1%) | 1,347 (100.0%) |
| 45 to 54 Years | 1,053 (100.0%) | 535 (89.0%) |
| 55 to 64 Years | 522 (86.3%) | 583 (81.7%) |
| 65 to 74 Years | 532 (98.5%) | 539 (94.9%) |
| 75 Years and over | 344 (92.2%) | 663 (100.0%) |
| Total | 7,013 (89.3%) | 7,481 (82.3%) |
Income Below Poverty Among Married-Couple Families in North Druid Hills
The poverty statistics for married-couple families in North Druid Hills show that 1.7% or 38 of the total 2,247 families live below the poverty line. Families with 3 or 4 children have the highest poverty rate of 3.3%, comprising of 11 families. On the other hand, families with 5 or more children have the lowest poverty rate of 0.0%, which includes 0 families.
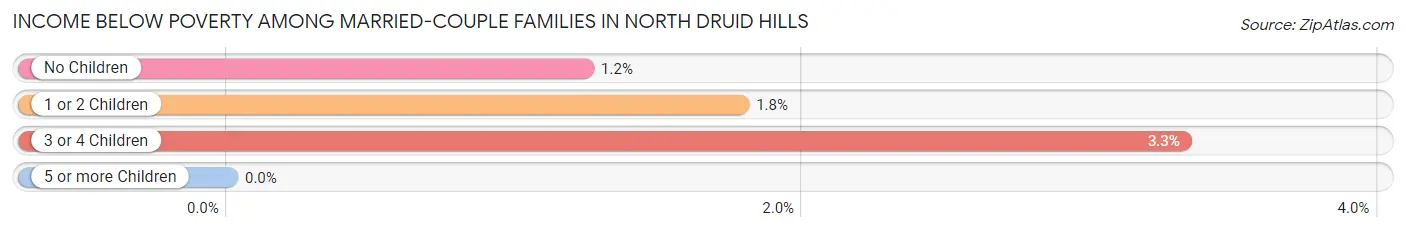
| Children | Above Poverty | Below Poverty |
| No Children | 1,277 (98.8%) | 16 (1.2%) |
| 1 or 2 Children | 607 (98.2%) | 11 (1.8%) |
| 3 or 4 Children | 320 (96.7%) | 11 (3.3%) |
| 5 or more Children | 5 (100.0%) | 0 (0.0%) |
| Total | 2,209 (98.3%) | 38 (1.7%) |
Income Below Poverty Among Single-Parent Households in North Druid Hills
According to the poverty data in North Druid Hills, 4.9% or 14 single-father households and 27.2% or 131 single-mother households are living below the poverty line. Among single-father households, those with 1 or 2 children have the highest poverty rate, with 14 households (11.6%) experiencing poverty. Likewise, among single-mother households, those with no children have the highest poverty rate, with 108 households (39.1%) falling below the poverty line.
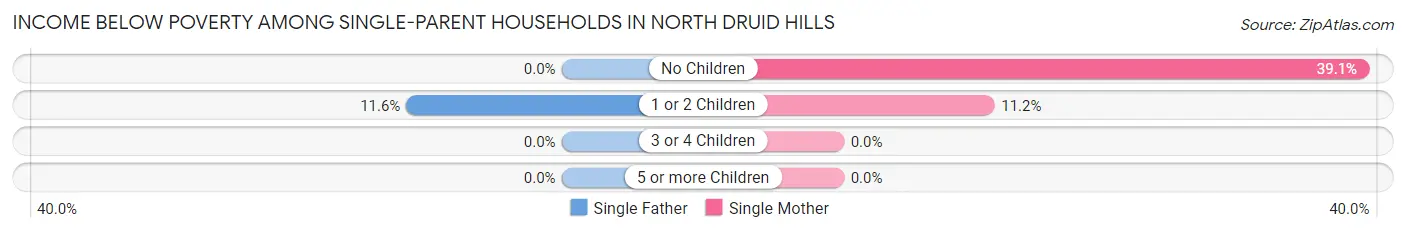
| Children | Single Father | Single Mother |
| No Children | 0 (0.0%) | 108 (39.1%) |
| 1 or 2 Children | 14 (11.6%) | 23 (11.2%) |
| 3 or 4 Children | 0 (0.0%) | 0 (0.0%) |
| 5 or more Children | 0 (0.0%) | 0 (0.0%) |
| Total | 14 (4.9%) | 131 (27.2%) |
Income Below Poverty Among Married-Couple vs Single-Parent Households in North Druid Hills
The poverty data for North Druid Hills shows that 38 of the married-couple family households (1.7%) and 145 of the single-parent households (18.9%) are living below the poverty level. Within the married-couple family households, those with 3 or 4 children have the highest poverty rate, with 11 households (3.3%) falling below the poverty line. Among the single-parent households, those with no children have the highest poverty rate, with 108 household (24.5%) living below poverty.
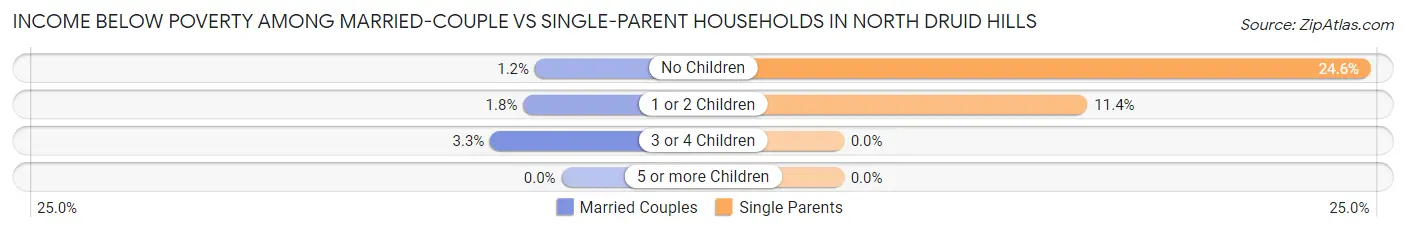
| Children | Married-Couple Families | Single-Parent Households |
| No Children | 16 (1.2%) | 108 (24.5%) |
| 1 or 2 Children | 11 (1.8%) | 37 (11.4%) |
| 3 or 4 Children | 11 (3.3%) | 0 (0.0%) |
| 5 or more Children | 0 (0.0%) | 0 (0.0%) |
| Total | 38 (1.7%) | 145 (18.9%) |
Race in North Druid Hills
The most populous races in North Druid Hills are White / Caucasian (10,547 | 61.2%), Black / African American (3,262 | 18.9%), and Asian (2,142 | 12.4%).
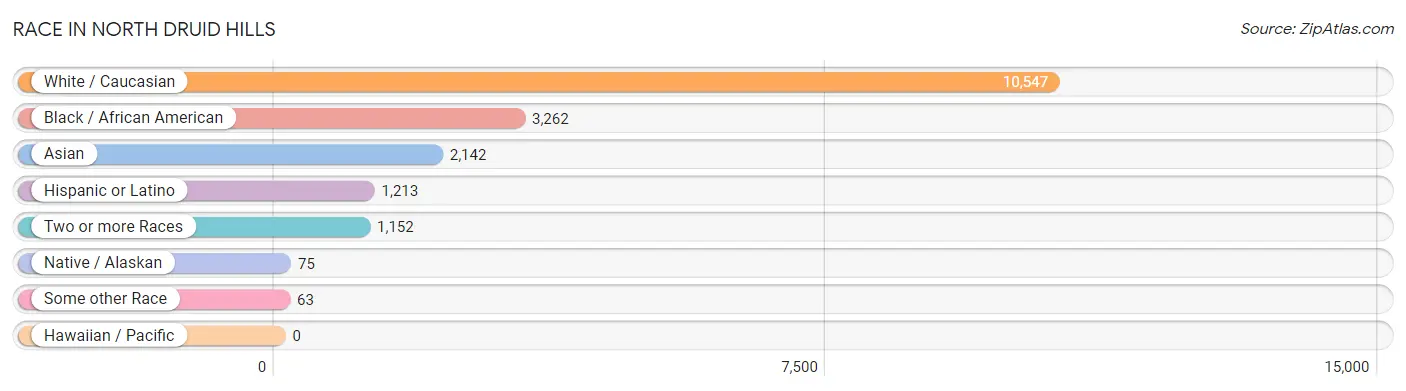
| Race | # Population | % Population |
| Asian | 2,142 | 12.4% |
| Black / African American | 3,262 | 18.9% |
| Hawaiian / Pacific | 0 | 0.0% |
| Hispanic or Latino | 1,213 | 7.0% |
| Native / Alaskan | 75 | 0.4% |
| White / Caucasian | 10,547 | 61.2% |
| Two or more Races | 1,152 | 6.7% |
| Some other Race | 63 | 0.4% |
| Total | 17,241 | 100.0% |
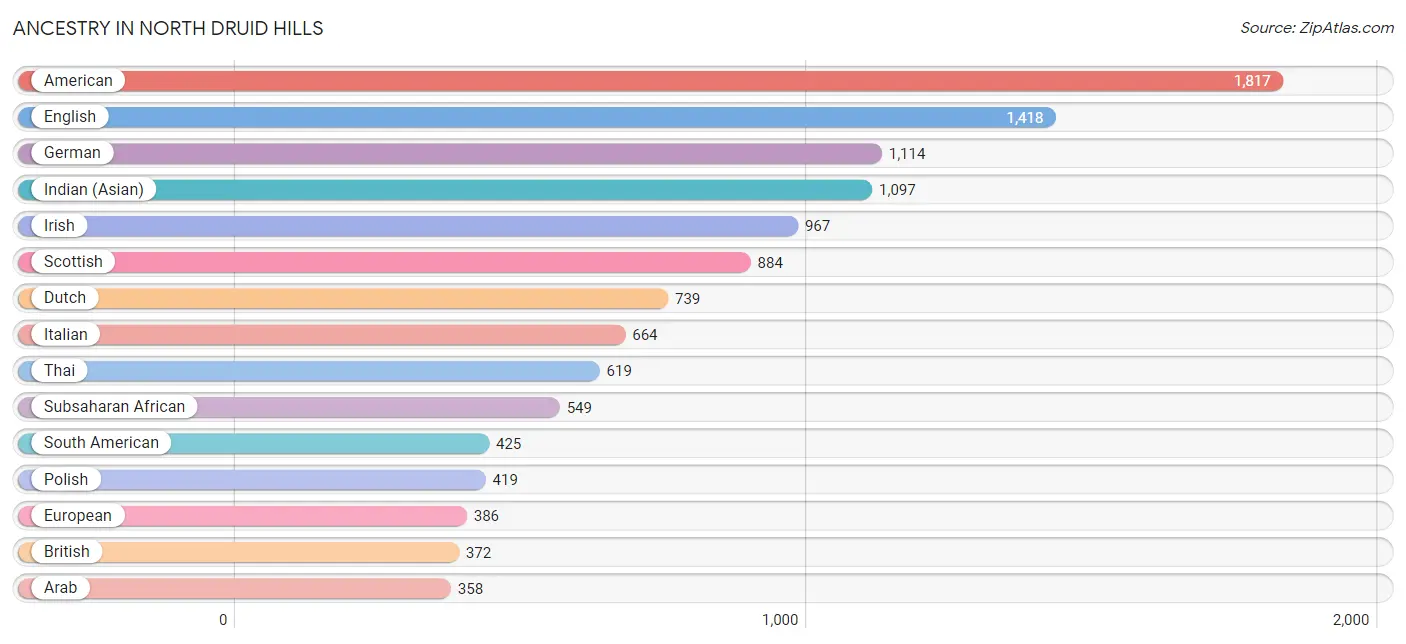
Ancestry in North Druid Hills
The most populous ancestries reported in North Druid Hills are American (1,817 | 10.5%), English (1,418 | 8.2%), German (1,114 | 6.5%), Indian (Asian) (1,097 | 6.4%), and Irish (967 | 5.6%), together accounting for 37.2% of all North Druid Hills residents.
| Ancestry | # Population | % Population |
| Afghan | 27 | 0.2% |
| African | 346 | 2.0% |
| American | 1,817 | 10.5% |
| Arab | 358 | 2.1% |
| Argentinean | 9 | 0.1% |
| Belgian | 17 | 0.1% |
| Bhutanese | 87 | 0.5% |
| Blackfeet | 25 | 0.2% |
| British | 372 | 2.2% |
| Bulgarian | 31 | 0.2% |
| Burmese | 314 | 1.8% |
| Central American | 33 | 0.2% |
| Cherokee | 49 | 0.3% |
| Choctaw | 9 | 0.1% |
| Colombian | 283 | 1.6% |
| Cuban | 143 | 0.8% |
| Czech | 44 | 0.3% |
| Czechoslovakian | 17 | 0.1% |
| Danish | 24 | 0.1% |
| Dutch | 739 | 4.3% |
| Eastern European | 201 | 1.2% |
| Egyptian | 62 | 0.4% |
| English | 1,418 | 8.2% |
| European | 386 | 2.2% |
| Filipino | 18 | 0.1% |
| Finnish | 56 | 0.3% |
| French | 303 | 1.8% |
| French Canadian | 33 | 0.2% |
| German | 1,114 | 6.5% |
| Greek | 64 | 0.4% |
| Honduran | 15 | 0.1% |
| Hungarian | 61 | 0.4% |
| Indian (Asian) | 1,097 | 6.4% |
| Iranian | 63 | 0.4% |
| Iraqi | 29 | 0.2% |
| Irish | 967 | 5.6% |
| Iroquois | 31 | 0.2% |
| Israeli | 28 | 0.2% |
| Italian | 664 | 3.8% |
| Jamaican | 77 | 0.4% |
| Japanese | 51 | 0.3% |
| Korean | 45 | 0.3% |
| Laotian | 11 | 0.1% |
| Lebanese | 90 | 0.5% |
| Lithuanian | 40 | 0.2% |
| Mexican | 252 | 1.5% |
| Mexican American Indian | 75 | 0.4% |
| New Zealander | 27 | 0.2% |
| Nigerian | 107 | 0.6% |
| Northern European | 45 | 0.3% |
| Norwegian | 293 | 1.7% |
| Pakistani | 19 | 0.1% |
| Panamanian | 18 | 0.1% |
| Peruvian | 45 | 0.3% |
| Polish | 419 | 2.4% |
| Portuguese | 64 | 0.4% |
| Puerto Rican | 313 | 1.8% |
| Romanian | 30 | 0.2% |
| Russian | 275 | 1.6% |
| Scandinavian | 30 | 0.2% |
| Scotch-Irish | 168 | 1.0% |
| Scottish | 884 | 5.1% |
| Sioux | 25 | 0.2% |
| Slavic | 29 | 0.2% |
| Slovak | 20 | 0.1% |
| South African | 14 | 0.1% |
| South American | 425 | 2.5% |
| Spaniard | 22 | 0.1% |
| Spanish | 25 | 0.2% |
| Subsaharan African | 549 | 3.2% |
| Swedish | 140 | 0.8% |
| Swiss | 20 | 0.1% |
| Syrian | 78 | 0.4% |
| Thai | 619 | 3.6% |
| Trinidadian and Tobagonian | 68 | 0.4% |
| Turkish | 51 | 0.3% |
| Ugandan | 44 | 0.3% |
| Ukrainian | 29 | 0.2% |
| Venezuelan | 88 | 0.5% |
| Vietnamese | 50 | 0.3% |
| Welsh | 250 | 1.5% |
| West Indian | 119 | 0.7% |
| Yugoslavian | 5 | 0.0% | View All 83 Rows |
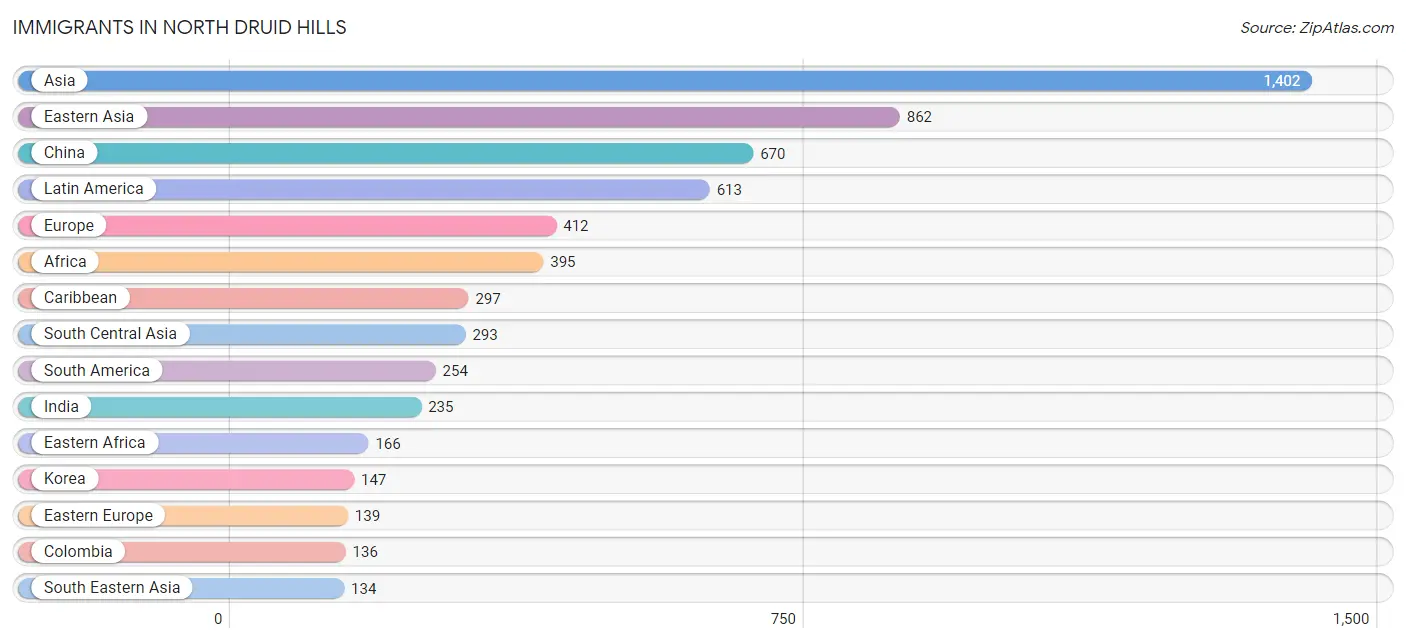
Immigrants in North Druid Hills
The most numerous immigrant groups reported in North Druid Hills came from Asia (1,402 | 8.1%), Eastern Asia (862 | 5.0%), China (670 | 3.9%), Latin America (613 | 3.6%), and Europe (412 | 2.4%), together accounting for 23.0% of all North Druid Hills residents.
| Immigration Origin | # Population | % Population |
| Africa | 395 | 2.3% |
| Argentina | 9 | 0.1% |
| Asia | 1,402 | 8.1% |
| Australia | 27 | 0.2% |
| Bangladesh | 30 | 0.2% |
| Bulgaria | 31 | 0.2% |
| Cambodia | 51 | 0.3% |
| Canada | 45 | 0.3% |
| Caribbean | 297 | 1.7% |
| Central America | 62 | 0.4% |
| China | 670 | 3.9% |
| Colombia | 136 | 0.8% |
| Congo | 20 | 0.1% |
| Cuba | 107 | 0.6% |
| Eastern Africa | 166 | 1.0% |
| Eastern Asia | 862 | 5.0% |
| Eastern Europe | 139 | 0.8% |
| Egypt | 33 | 0.2% |
| England | 33 | 0.2% |
| Ethiopia | 76 | 0.4% |
| Europe | 412 | 2.4% |
| France | 16 | 0.1% |
| Germany | 30 | 0.2% |
| Greece | 25 | 0.2% |
| Hong Kong | 67 | 0.4% |
| India | 235 | 1.4% |
| Indonesia | 11 | 0.1% |
| Iran | 28 | 0.2% |
| Iraq | 29 | 0.2% |
| Israel | 49 | 0.3% |
| Italy | 64 | 0.4% |
| Jamaica | 51 | 0.3% |
| Japan | 45 | 0.3% |
| Korea | 147 | 0.9% |
| Latin America | 613 | 3.6% |
| Lebanon | 16 | 0.1% |
| Mexico | 52 | 0.3% |
| Middle Africa | 20 | 0.1% |
| Morocco | 70 | 0.4% |
| Nigeria | 60 | 0.4% |
| Northern Africa | 103 | 0.6% |
| Northern Europe | 125 | 0.7% |
| Oceania | 27 | 0.2% |
| Panama | 10 | 0.1% |
| Peru | 21 | 0.1% |
| Philippines | 42 | 0.2% |
| Poland | 24 | 0.1% |
| Romania | 50 | 0.3% |
| Russia | 34 | 0.2% |
| South Africa | 36 | 0.2% |
| South America | 254 | 1.5% |
| South Central Asia | 293 | 1.7% |
| South Eastern Asia | 134 | 0.8% |
| Southern Europe | 102 | 0.6% |
| Spain | 13 | 0.1% |
| Sweden | 44 | 0.3% |
| Taiwan | 72 | 0.4% |
| Trinidad and Tobago | 80 | 0.5% |
| Turkey | 19 | 0.1% |
| Uganda | 64 | 0.4% |
| Venezuela | 88 | 0.5% |
| Vietnam | 30 | 0.2% |
| Western Africa | 70 | 0.4% |
| Western Asia | 113 | 0.7% |
| Western Europe | 46 | 0.3% | View All 65 Rows |
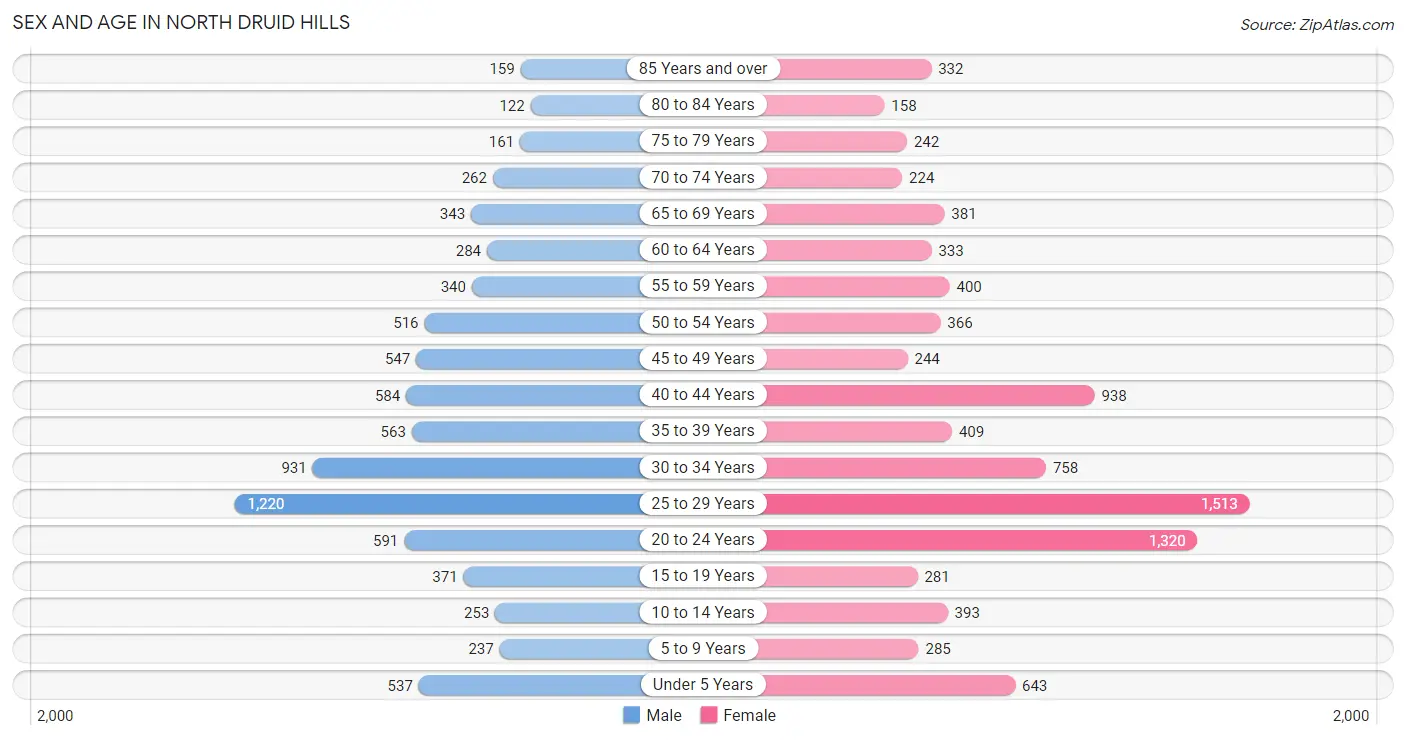
Sex and Age in North Druid Hills
Sex and Age in North Druid Hills
The most populous age groups in North Druid Hills are 25 to 29 Years (1,220 | 15.2%) for men and 25 to 29 Years (1,513 | 16.4%) for women.
| Age Bracket | Male | Female |
| Under 5 Years | 537 (6.7%) | 643 (7.0%) |
| 5 to 9 Years | 237 (2.9%) | 285 (3.1%) |
| 10 to 14 Years | 253 (3.2%) | 393 (4.3%) |
| 15 to 19 Years | 371 (4.6%) | 281 (3.0%) |
| 20 to 24 Years | 591 (7.4%) | 1,320 (14.3%) |
| 25 to 29 Years | 1,220 (15.2%) | 1,513 (16.4%) |
| 30 to 34 Years | 931 (11.6%) | 758 (8.2%) |
| 35 to 39 Years | 563 (7.0%) | 409 (4.4%) |
| 40 to 44 Years | 584 (7.3%) | 938 (10.2%) |
| 45 to 49 Years | 547 (6.8%) | 244 (2.6%) |
| 50 to 54 Years | 516 (6.4%) | 366 (4.0%) |
| 55 to 59 Years | 340 (4.2%) | 400 (4.3%) |
| 60 to 64 Years | 284 (3.5%) | 333 (3.6%) |
| 65 to 69 Years | 343 (4.3%) | 381 (4.1%) |
| 70 to 74 Years | 262 (3.3%) | 224 (2.4%) |
| 75 to 79 Years | 161 (2.0%) | 242 (2.6%) |
| 80 to 84 Years | 122 (1.5%) | 158 (1.7%) |
| 85 Years and over | 159 (2.0%) | 332 (3.6%) |
| Total | 8,021 (100.0%) | 9,220 (100.0%) |
Families and Households in North Druid Hills
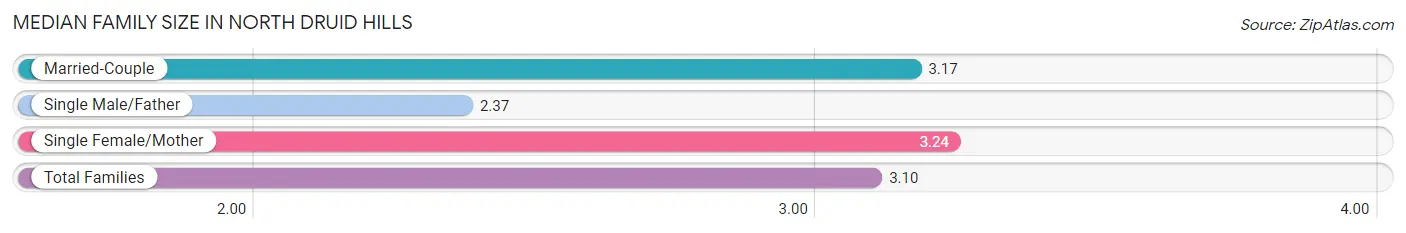
Median Family Size in North Druid Hills
The median family size in North Druid Hills is 3.10 persons per family, with single female/mother families (481 | 16.0%) accounting for the largest median family size of 3.24 persons per family. On the other hand, single male/father families (285 | 9.5%) represent the smallest median family size with 2.37 persons per family.
| Family Type | # Families | Family Size |
| Married-Couple | 2,247 (74.6%) | 3.17 |
| Single Male/Father | 285 (9.5%) | 2.37 |
| Single Female/Mother | 481 (16.0%) | 3.24 |
| Total Families | 3,013 (100.0%) | 3.10 |
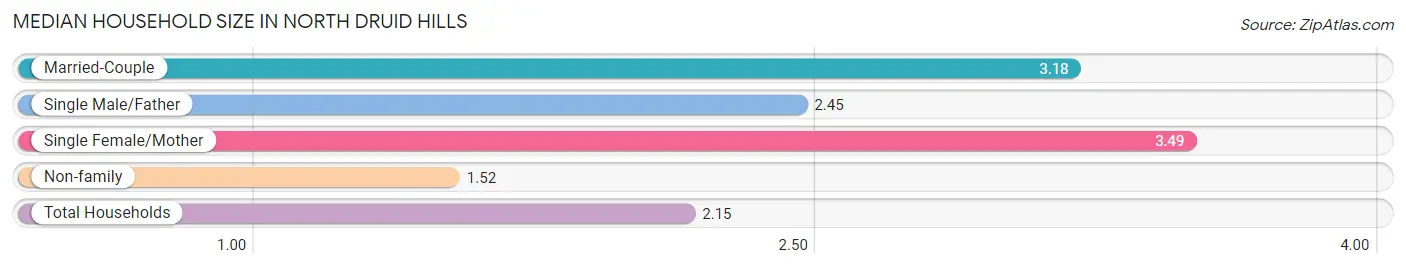
Median Household Size in North Druid Hills
The median household size in North Druid Hills is 2.15 persons per household, with single female/mother households (481 | 6.1%) accounting for the largest median household size of 3.49 persons per household. non-family households (4,817 | 61.5%) represent the smallest median household size with 1.52 persons per household.
| Household Type | # Households | Household Size |
| Married-Couple | 2,247 (28.7%) | 3.18 |
| Single Male/Father | 285 (3.6%) | 2.45 |
| Single Female/Mother | 481 (6.1%) | 3.49 |
| Non-family | 4,817 (61.5%) | 1.52 |
| Total Households | 7,830 (100.0%) | 2.15 |
Household Size by Marriage Status in North Druid Hills
Out of a total of 7,830 households in North Druid Hills, 3,013 (38.5%) are family households, while 4,817 (61.5%) are nonfamily households. The most numerous type of family households are 2-person households, comprising 1,638, and the most common type of nonfamily households are 1-person households, comprising 3,305.
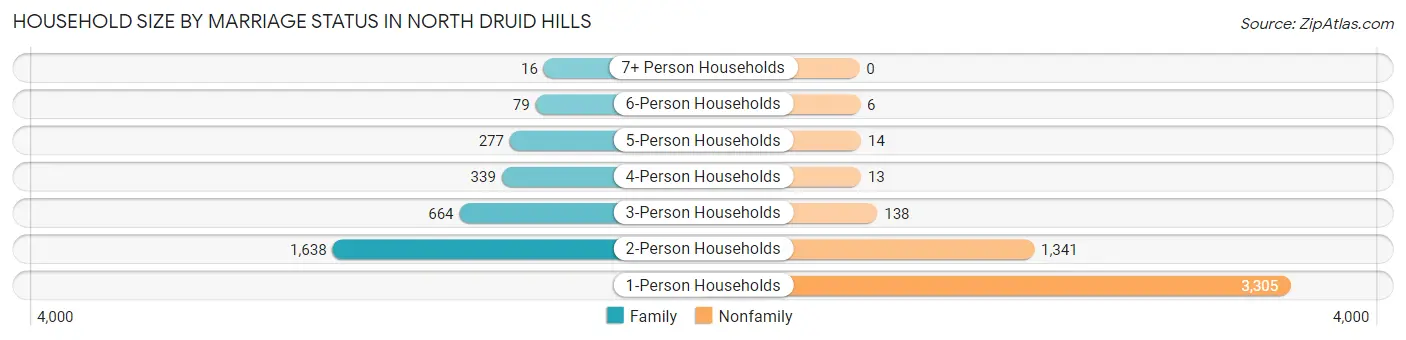
| Household Size | Family Households | Nonfamily Households |
| 1-Person Households | - | 3,305 (42.2%) |
| 2-Person Households | 1,638 (20.9%) | 1,341 (17.1%) |
| 3-Person Households | 664 (8.5%) | 138 (1.8%) |
| 4-Person Households | 339 (4.3%) | 13 (0.2%) |
| 5-Person Households | 277 (3.5%) | 14 (0.2%) |
| 6-Person Households | 79 (1.0%) | 6 (0.1%) |
| 7+ Person Households | 16 (0.2%) | 0 (0.0%) |
| Total | 3,013 (38.5%) | 4,817 (61.5%) |
Female Fertility in North Druid Hills
Fertility by Age in North Druid Hills
Average fertility rate in North Druid Hills is 40.0 births per 1,000 women. Women in the age bracket of 35 to 50 years have the highest fertility rate with 87.0 births per 1,000 women. Women in the age bracket of 35 to 50 years acount for 63.7% of all women with births.
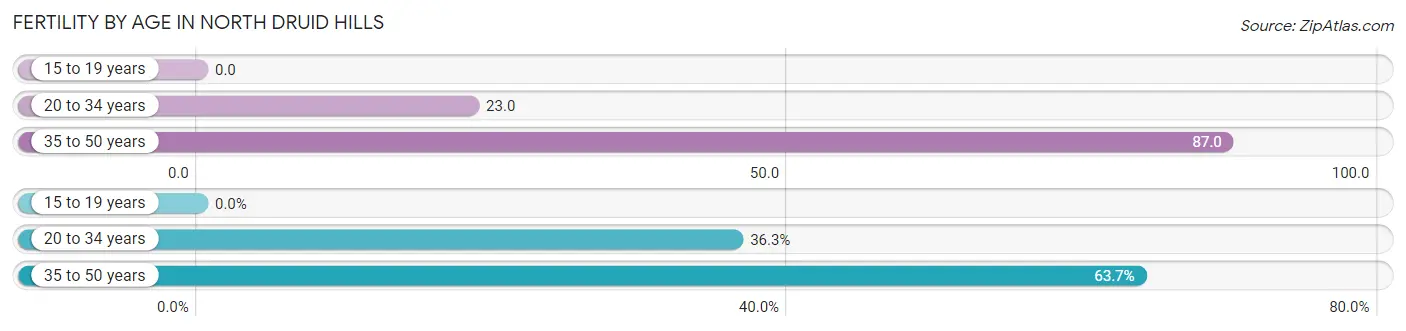
| Age Bracket | Women with Births | Births / 1,000 Women |
| 15 to 19 years | 0 (0.0%) | 0.0 |
| 20 to 34 years | 81 (36.3%) | 23.0 |
| 35 to 50 years | 142 (63.7%) | 87.0 |
| Total | 223 (100.0%) | 40.0 |
Fertility by Age by Marriage Status in North Druid Hills
84.8% of women with births (223) in North Druid Hills are married. The highest percentage of unmarried women with births falls into 35 to 50 years age bracket with 23.2% of them unmarried at the time of birth, while the lowest percentage of unmarried women with births belong to 20 to 34 years age bracket with 1.2% of them unmarried.
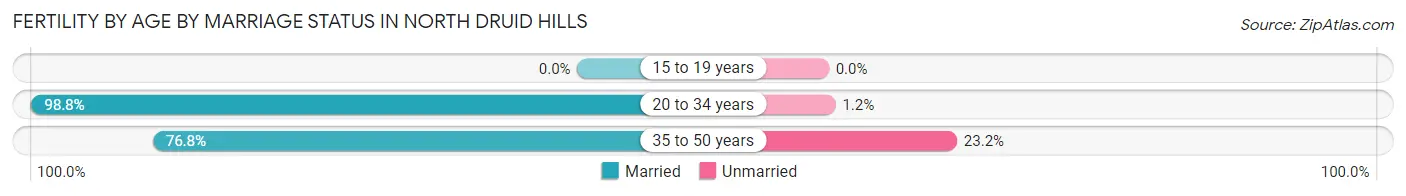
| Age Bracket | Married | Unmarried |
| 15 to 19 years | 0 (0.0%) | 0 (0.0%) |
| 20 to 34 years | 80 (98.8%) | 1 (1.2%) |
| 35 to 50 years | 109 (76.8%) | 33 (23.2%) |
| Total | 189 (84.8%) | 34 (15.2%) |
Fertility by Education in North Druid Hills
Average fertility rate in North Druid Hills is 40.0 births per 1,000 women. Women with the education attainment of graduate degree have the highest fertility rate of 76.0 births per 1,000 women, while women with the education attainment of less than high school have the lowest fertility at 4.0 births per 1,000 women. Women with the education attainment of graduate degree represent 58.3% of all women with births.
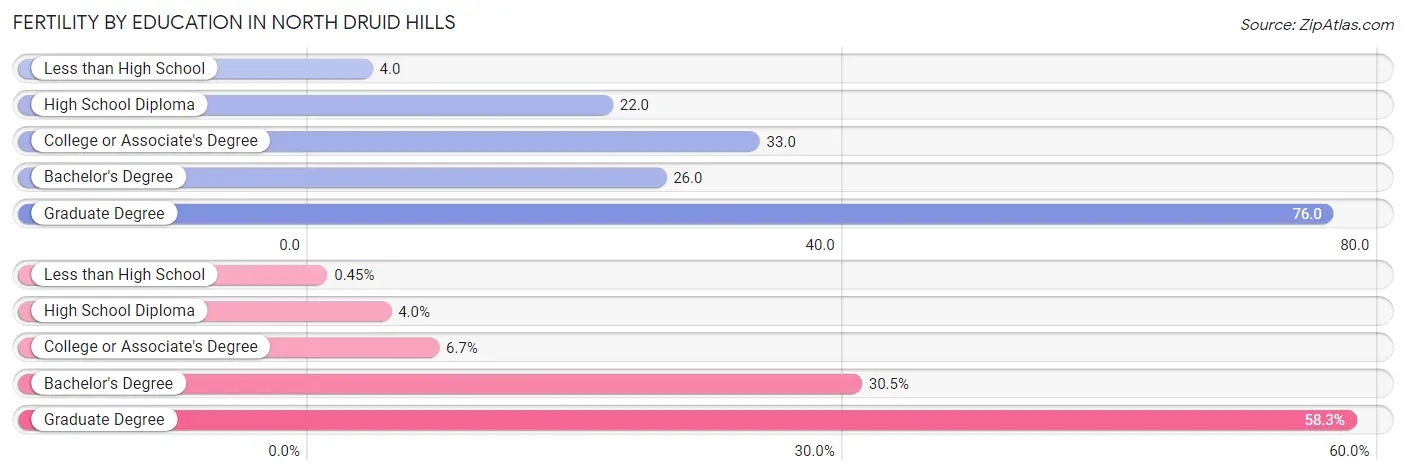
| Educational Attainment | Women with Births | Births / 1,000 Women |
| Less than High School | 1 (0.4%) | 4.0 |
| High School Diploma | 9 (4.0%) | 22.0 |
| College or Associate's Degree | 15 (6.7%) | 33.0 |
| Bachelor's Degree | 68 (30.5%) | 26.0 |
| Graduate Degree | 130 (58.3%) | 76.0 |
| Total | 223 (100.0%) | 40.0 |
Fertility by Education by Marriage Status in North Druid Hills
15.2% of women with births in North Druid Hills are unmarried. Women with the educational attainment of high school diploma are most likely to be married with 100.0% of them married at childbirth, while women with the educational attainment of less than high school are least likely to be married with 100.0% of them unmarried at childbirth.
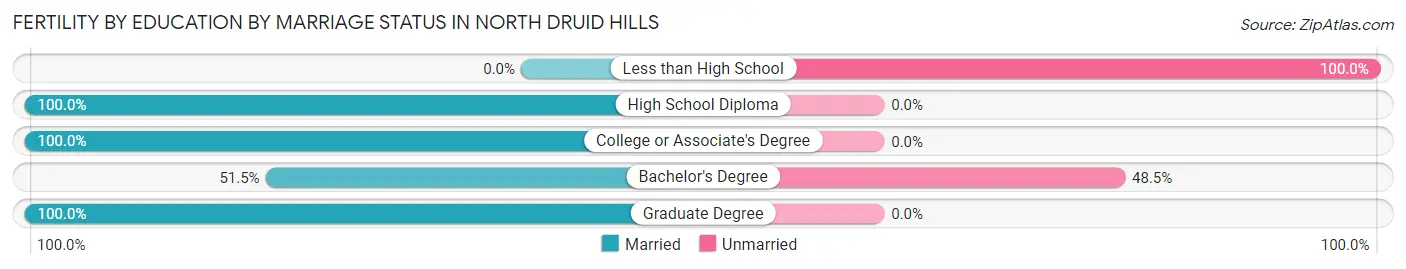
| Educational Attainment | Married | Unmarried |
| Less than High School | 0 (0.0%) | 1 (100.0%) |
| High School Diploma | 9 (100.0%) | 0 (0.0%) |
| College or Associate's Degree | 15 (100.0%) | 0 (0.0%) |
| Bachelor's Degree | 35 (51.5%) | 33 (48.5%) |
| Graduate Degree | 130 (100.0%) | 0 (0.0%) |
| Total | 189 (84.8%) | 34 (15.2%) |
Employment Characteristics in North Druid Hills
Employment by Class of Employer in North Druid Hills
Among the 9,727 employed individuals in North Druid Hills, private company employees (6,094 | 62.6%), not-for-profit organizations (1,708 | 17.6%), and state government employees (496 | 5.1%) make up the most common classes of employment.
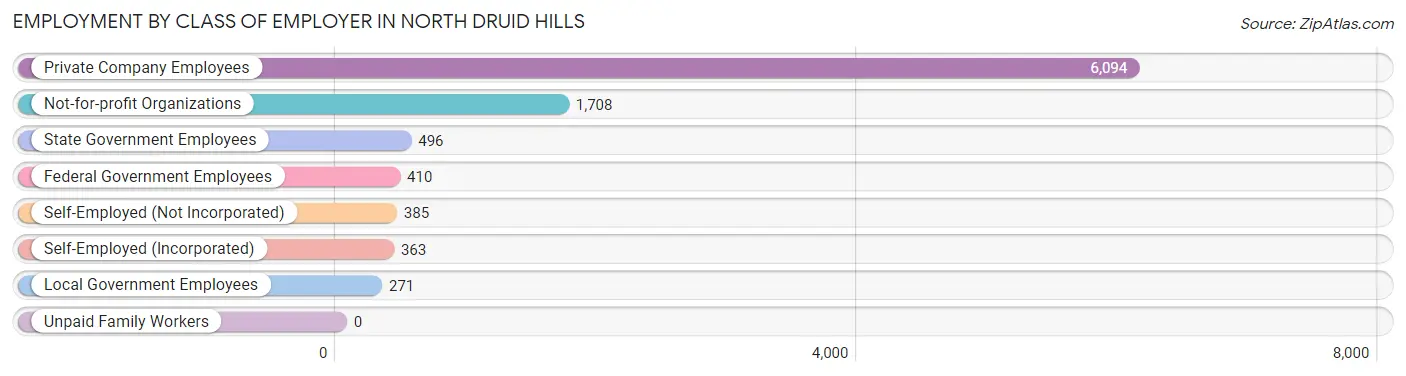
| Employer Class | # Employees | % Employees |
| Private Company Employees | 6,094 | 62.6% |
| Self-Employed (Incorporated) | 363 | 3.7% |
| Self-Employed (Not Incorporated) | 385 | 4.0% |
| Not-for-profit Organizations | 1,708 | 17.6% |
| Local Government Employees | 271 | 2.8% |
| State Government Employees | 496 | 5.1% |
| Federal Government Employees | 410 | 4.2% |
| Unpaid Family Workers | 0 | 0.0% |
| Total | 9,727 | 100.0% |
Employment Status by Age in North Druid Hills
According to the labor force statistics for North Druid Hills, out of the total population over 16 years of age (14,758), 72.2% or 10,655 individuals are in the labor force, with 3.8% or 405 of them unemployed. The age group with the highest labor force participation rate is 30 to 34 years, with 92.5% or 1,562 individuals in the labor force. Within the labor force, the 16 to 19 years age range has the highest percentage of unemployed individuals, with 17.7% or 42 of them being unemployed.
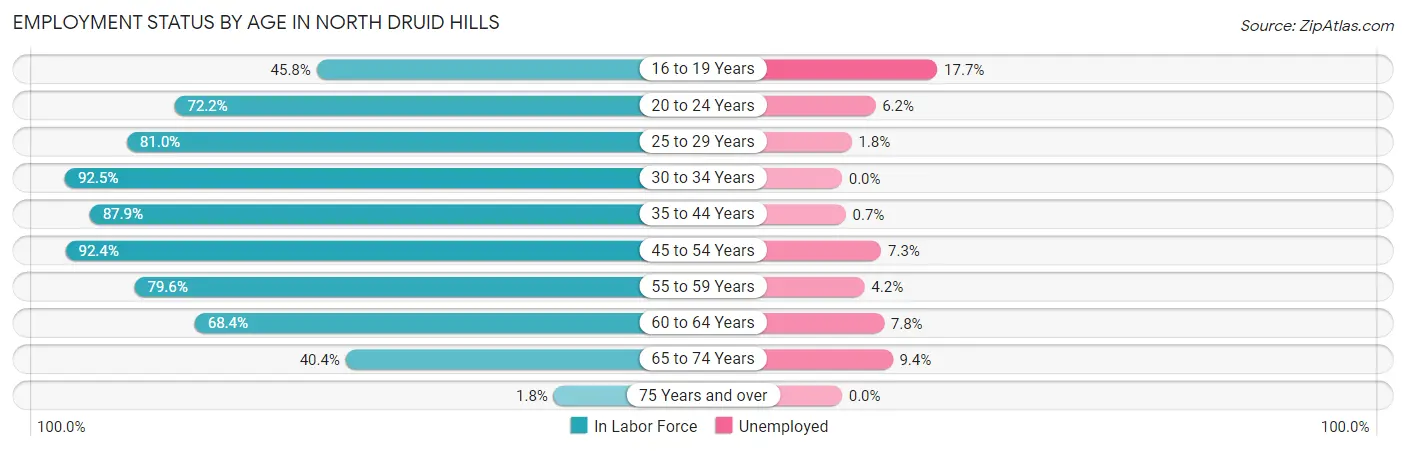
| Age Bracket | In Labor Force | Unemployed |
| 16 to 19 Years | 237 (45.8%) | 42 (17.7%) |
| 20 to 24 Years | 1,380 (72.2%) | 86 (6.2%) |
| 25 to 29 Years | 2,214 (81.0%) | 40 (1.8%) |
| 30 to 34 Years | 1,562 (92.5%) | 0 (0.0%) |
| 35 to 44 Years | 2,192 (87.9%) | 15 (0.7%) |
| 45 to 54 Years | 1,546 (92.4%) | 113 (7.3%) |
| 55 to 59 Years | 589 (79.6%) | 25 (4.2%) |
| 60 to 64 Years | 422 (68.4%) | 33 (7.8%) |
| 65 to 74 Years | 489 (40.4%) | 46 (9.4%) |
| 75 Years and over | 21 (1.8%) | 0 (0.0%) |
| Total | 10,655 (72.2%) | 405 (3.8%) |
Employment Status by Educational Attainment in North Druid Hills
According to labor force statistics for North Druid Hills, 85.7% of individuals (8,524) out of the total population between 25 and 64 years of age (9,946) are in the labor force, with 2.7% or 230 of them being unemployed. The group with the highest labor force participation rate are those with the educational attainment of college / associate degree, with 87.4% or 1,115 individuals in the labor force. Within the labor force, individuals with college / associate degree education have the highest percentage of unemployment, with 13.6% or 152 of them being unemployed.
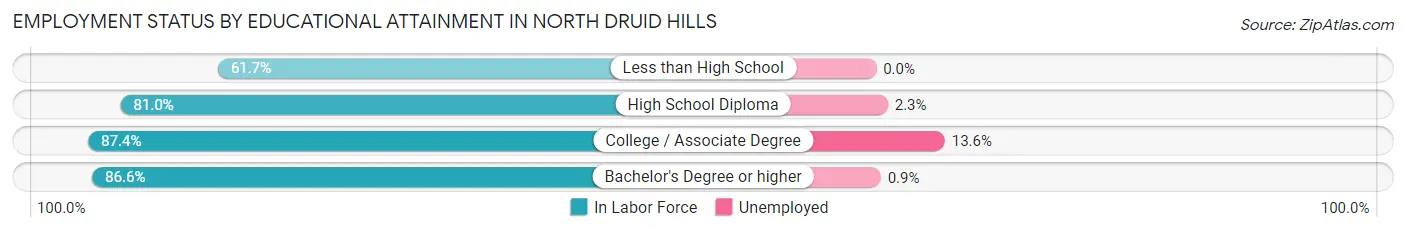
| Educational Attainment | In Labor Force | Unemployed |
| Less than High School | 137 (61.7%) | 0 (0.0%) |
| High School Diploma | 663 (81.0%) | 19 (2.3%) |
| College / Associate Degree | 1,115 (87.4%) | 174 (13.6%) |
| Bachelor's Degree or higher | 6,607 (86.6%) | 69 (0.9%) |
| Total | 8,524 (85.7%) | 269 (2.7%) |
Employment Occupations by Sex in North Druid Hills
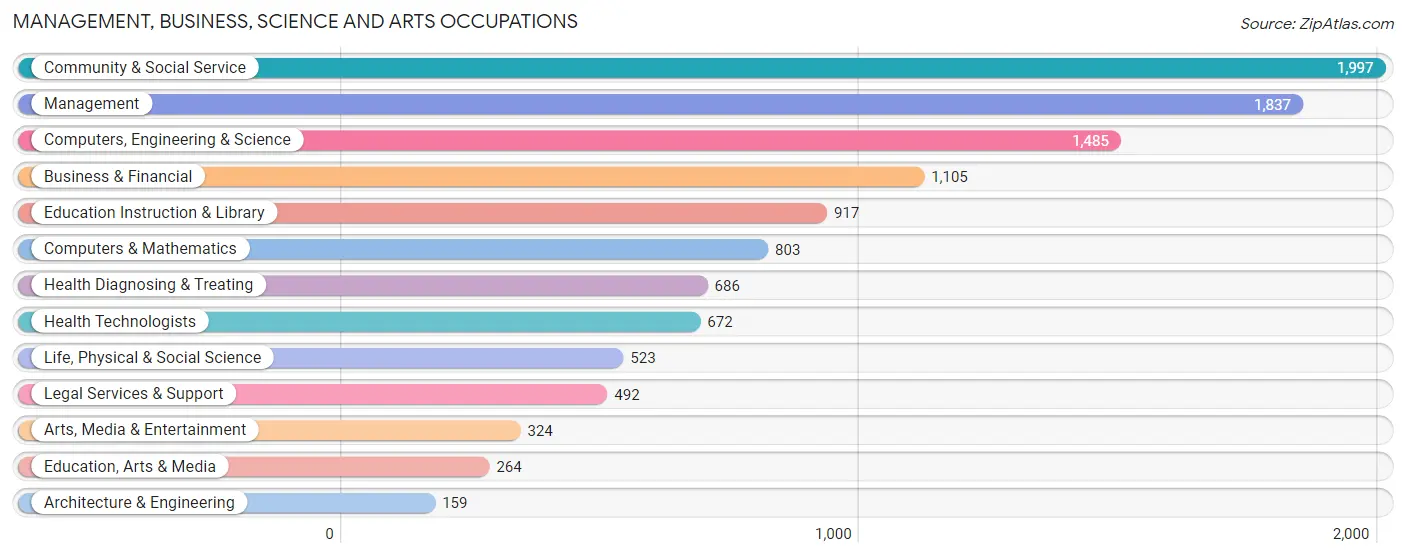
Management, Business, Science and Arts Occupations
The most common Management, Business, Science and Arts occupations in North Druid Hills are Community & Social Service (1,997 | 19.5%), Management (1,837 | 17.9%), Computers, Engineering & Science (1,485 | 14.5%), Business & Financial (1,105 | 10.8%), and Education Instruction & Library (917 | 9.0%).
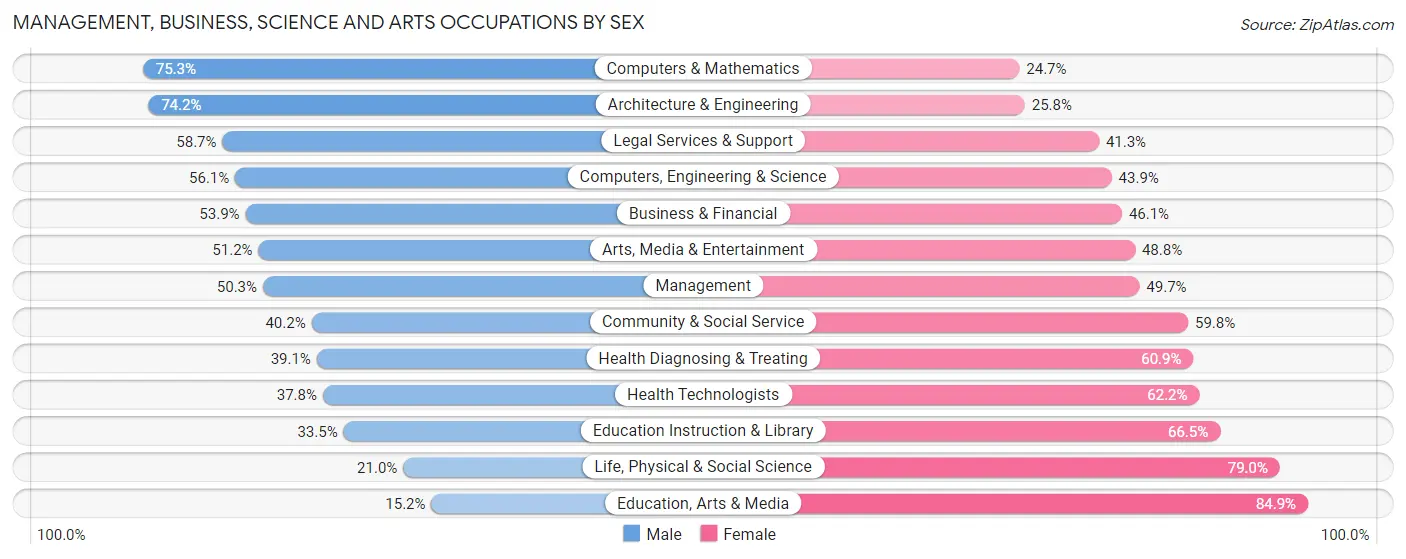
Management, Business, Science and Arts Occupations by Sex
Within the Management, Business, Science and Arts occupations in North Druid Hills, the most male-oriented occupations are Computers & Mathematics (75.3%), Architecture & Engineering (74.2%), and Legal Services & Support (58.7%), while the most female-oriented occupations are Education, Arts & Media (84.9%), Life, Physical & Social Science (79.0%), and Education Instruction & Library (66.5%).
| Occupation | Male | Female |
| Management | 924 (50.3%) | 913 (49.7%) |
| Business & Financial | 596 (53.9%) | 509 (46.1%) |
| Computers, Engineering & Science | 833 (56.1%) | 652 (43.9%) |
| Computers & Mathematics | 605 (75.3%) | 198 (24.7%) |
| Architecture & Engineering | 118 (74.2%) | 41 (25.8%) |
| Life, Physical & Social Science | 110 (21.0%) | 413 (79.0%) |
| Community & Social Service | 802 (40.2%) | 1,195 (59.8%) |
| Education, Arts & Media | 40 (15.1%) | 224 (84.9%) |
| Legal Services & Support | 289 (58.7%) | 203 (41.3%) |
| Education Instruction & Library | 307 (33.5%) | 610 (66.5%) |
| Arts, Media & Entertainment | 166 (51.2%) | 158 (48.8%) |
| Health Diagnosing & Treating | 268 (39.1%) | 418 (60.9%) |
| Health Technologists | 254 (37.8%) | 418 (62.2%) |
| Total (Category) | 3,423 (48.1%) | 3,687 (51.9%) |
| Total (Overall) | 5,267 (51.5%) | 4,968 (48.5%) |
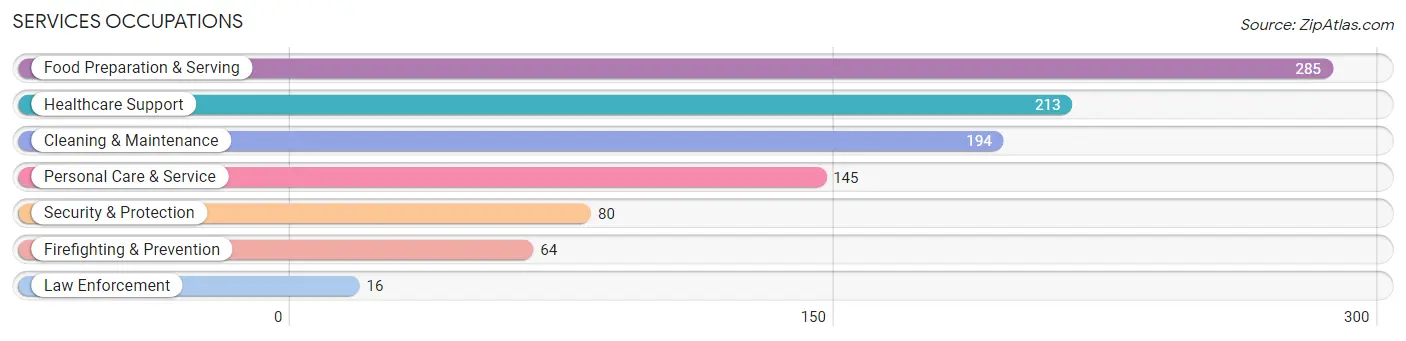
Services Occupations
The most common Services occupations in North Druid Hills are Food Preparation & Serving (285 | 2.8%), Healthcare Support (213 | 2.1%), Cleaning & Maintenance (194 | 1.9%), Personal Care & Service (145 | 1.4%), and Security & Protection (80 | 0.8%).
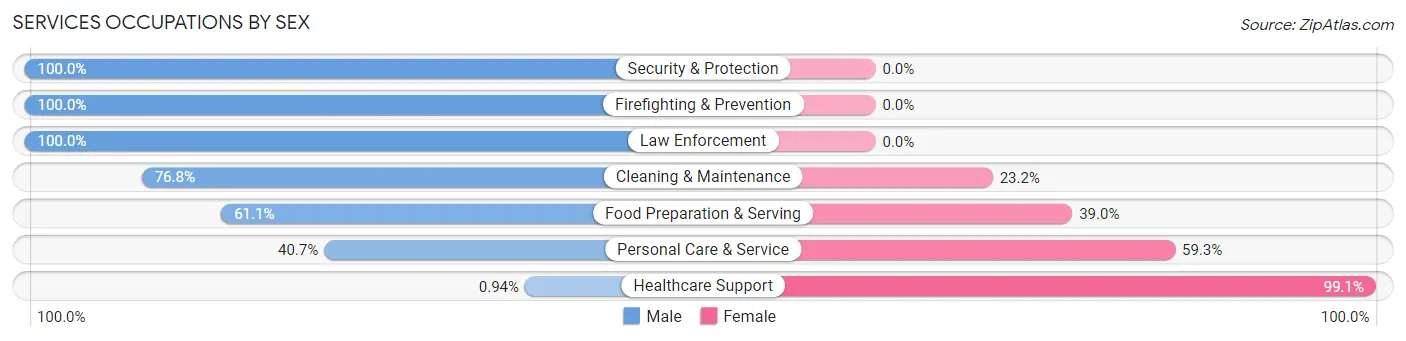
Services Occupations by Sex
Within the Services occupations in North Druid Hills, the most male-oriented occupations are Security & Protection (100.0%), Firefighting & Prevention (100.0%), and Law Enforcement (100.0%), while the most female-oriented occupations are Healthcare Support (99.1%), Personal Care & Service (59.3%), and Food Preparation & Serving (39.0%).
| Occupation | Male | Female |
| Healthcare Support | 2 (0.9%) | 211 (99.1%) |
| Security & Protection | 80 (100.0%) | 0 (0.0%) |
| Firefighting & Prevention | 64 (100.0%) | 0 (0.0%) |
| Law Enforcement | 16 (100.0%) | 0 (0.0%) |
| Food Preparation & Serving | 174 (61.1%) | 111 (39.0%) |
| Cleaning & Maintenance | 149 (76.8%) | 45 (23.2%) |
| Personal Care & Service | 59 (40.7%) | 86 (59.3%) |
| Total (Category) | 464 (50.6%) | 453 (49.4%) |
| Total (Overall) | 5,267 (51.5%) | 4,968 (48.5%) |
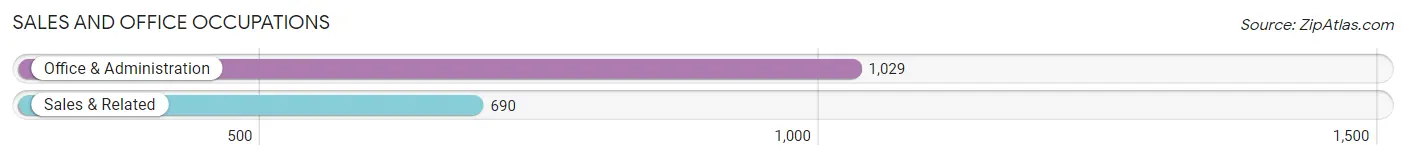
Sales and Office Occupations
The most common Sales and Office occupations in North Druid Hills are Office & Administration (1,029 | 10.1%), and Sales & Related (690 | 6.7%).
Sales and Office Occupations by Sex
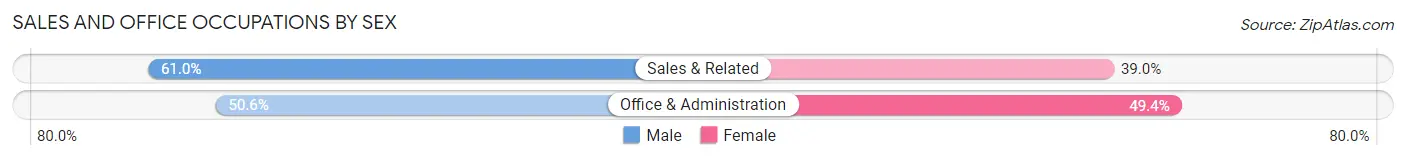
| Occupation | Male | Female |
| Sales & Related | 421 (61.0%) | 269 (39.0%) |
| Office & Administration | 521 (50.6%) | 508 (49.4%) |
| Total (Category) | 942 (54.8%) | 777 (45.2%) |
| Total (Overall) | 5,267 (51.5%) | 4,968 (48.5%) |
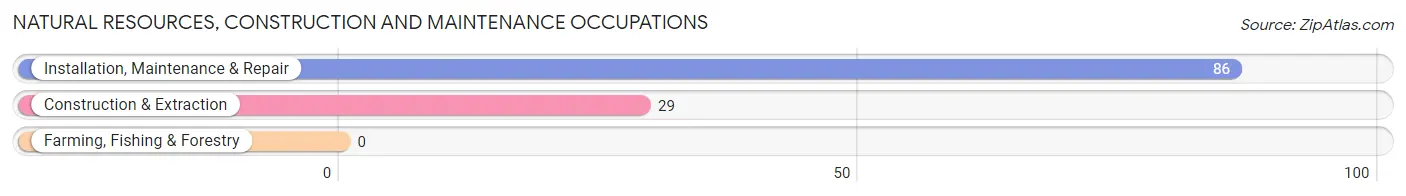
Natural Resources, Construction and Maintenance Occupations
The most common Natural Resources, Construction and Maintenance occupations in North Druid Hills are Installation, Maintenance & Repair (86 | 0.8%), and Construction & Extraction (29 | 0.3%).
Natural Resources, Construction and Maintenance Occupations by Sex
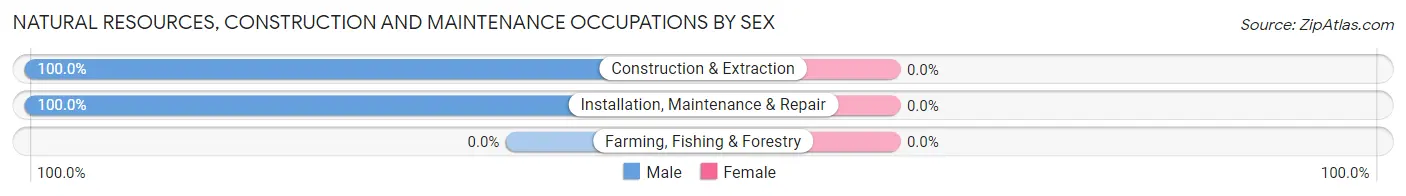
| Occupation | Male | Female |
| Farming, Fishing & Forestry | 0 (0.0%) | 0 (0.0%) |
| Construction & Extraction | 29 (100.0%) | 0 (0.0%) |
| Installation, Maintenance & Repair | 86 (100.0%) | 0 (0.0%) |
| Total (Category) | 115 (100.0%) | 0 (0.0%) |
| Total (Overall) | 5,267 (51.5%) | 4,968 (48.5%) |
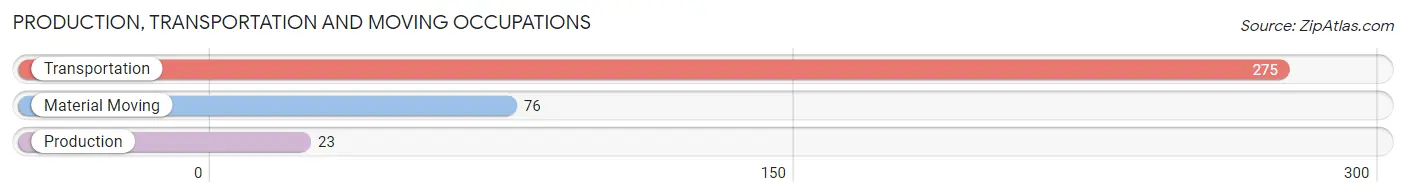
Production, Transportation and Moving Occupations
The most common Production, Transportation and Moving occupations in North Druid Hills are Transportation (275 | 2.7%), Material Moving (76 | 0.7%), and Production (23 | 0.2%).
Production, Transportation and Moving Occupations by Sex
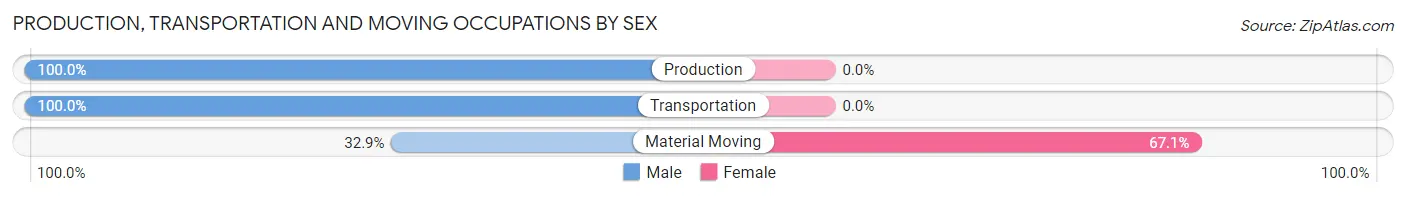
| Occupation | Male | Female |
| Production | 23 (100.0%) | 0 (0.0%) |
| Transportation | 275 (100.0%) | 0 (0.0%) |
| Material Moving | 25 (32.9%) | 51 (67.1%) |
| Total (Category) | 323 (86.4%) | 51 (13.6%) |
| Total (Overall) | 5,267 (51.5%) | 4,968 (48.5%) |
Employment Industries by Sex in North Druid Hills
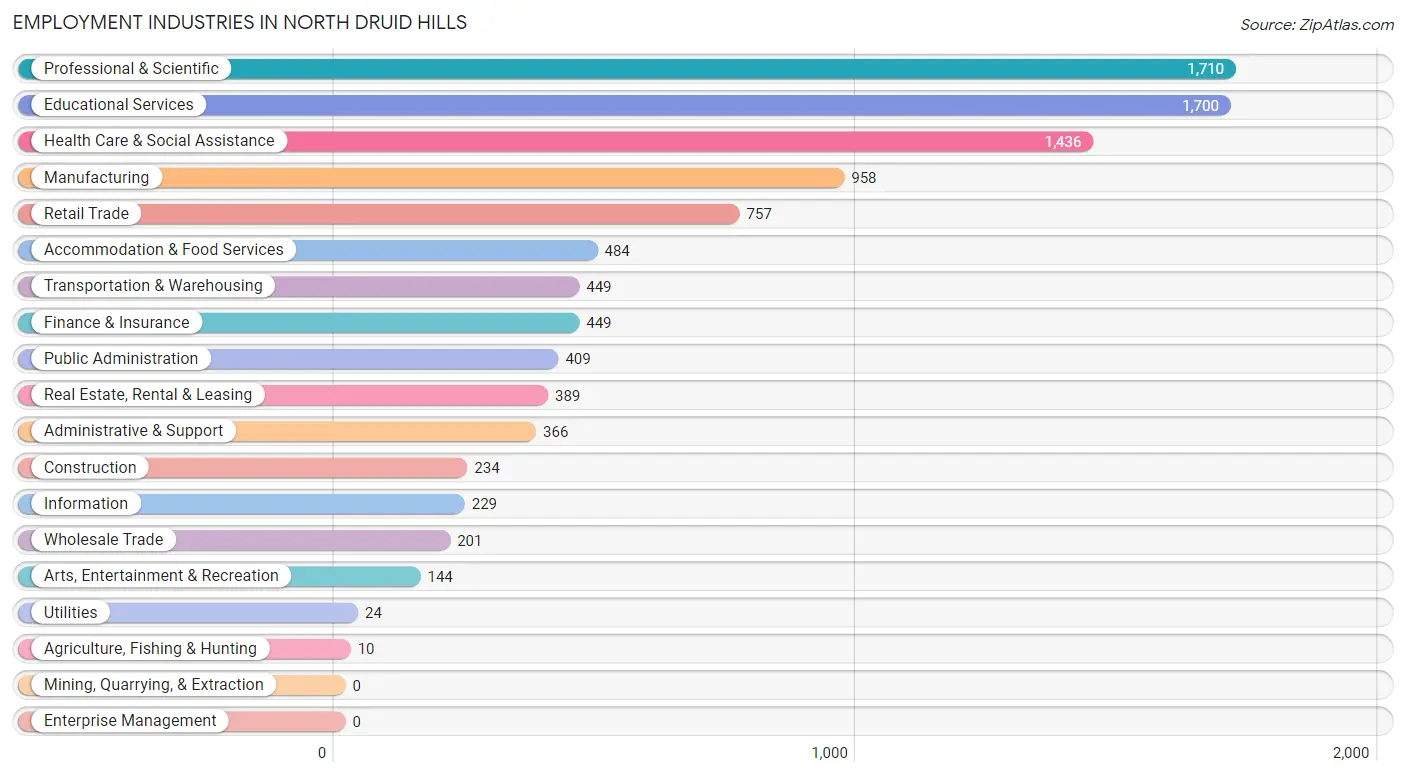
Employment Industries in North Druid Hills
The major employment industries in North Druid Hills include Professional & Scientific (1,710 | 16.7%), Educational Services (1,700 | 16.6%), Health Care & Social Assistance (1,436 | 14.0%), Manufacturing (958 | 9.4%), and Retail Trade (757 | 7.4%).
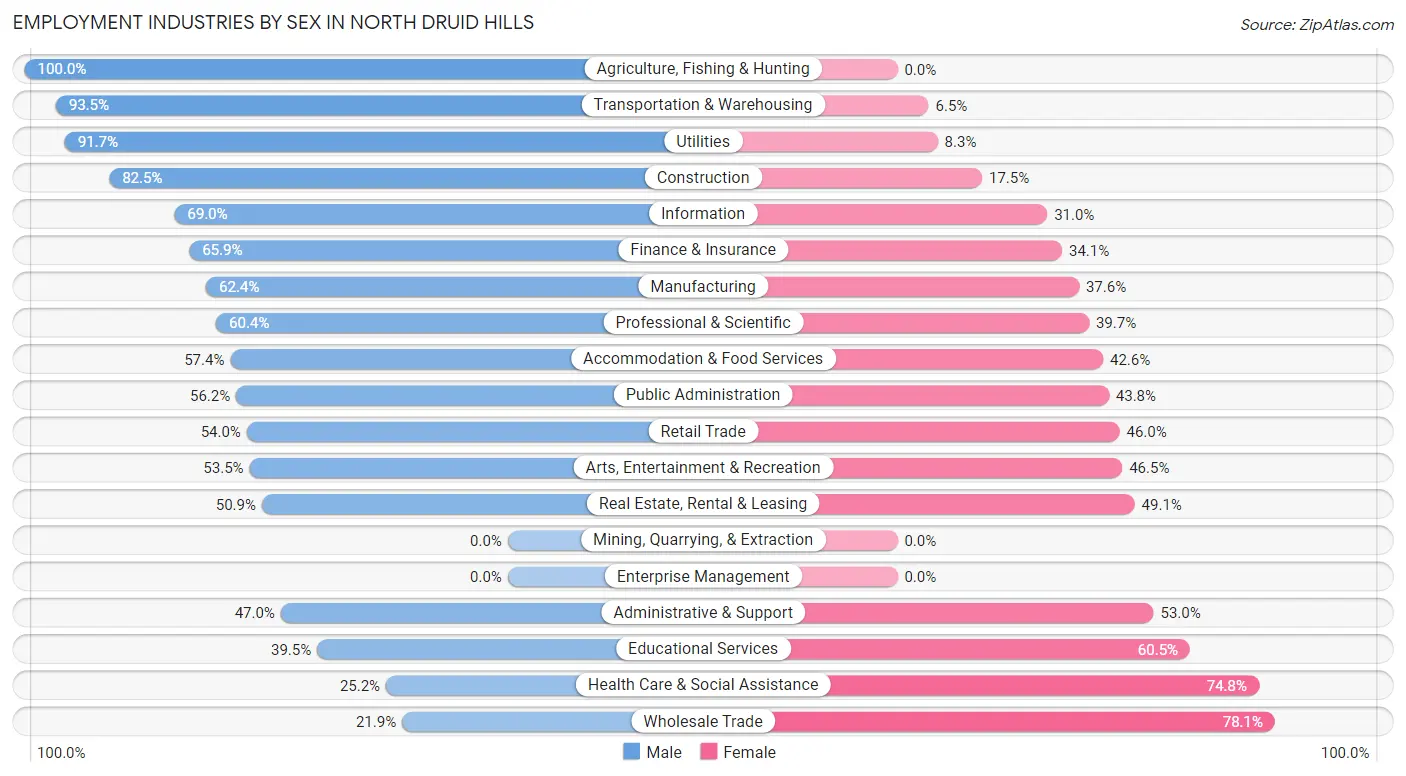
Employment Industries by Sex in North Druid Hills
The North Druid Hills industries that see more men than women are Agriculture, Fishing & Hunting (100.0%), Transportation & Warehousing (93.5%), and Utilities (91.7%), whereas the industries that tend to have a higher number of women are Wholesale Trade (78.1%), Health Care & Social Assistance (74.8%), and Educational Services (60.5%).
| Industry | Male | Female |
| Agriculture, Fishing & Hunting | 10 (100.0%) | 0 (0.0%) |
| Mining, Quarrying, & Extraction | 0 (0.0%) | 0 (0.0%) |
| Construction | 193 (82.5%) | 41 (17.5%) |
| Manufacturing | 598 (62.4%) | 360 (37.6%) |
| Wholesale Trade | 44 (21.9%) | 157 (78.1%) |
| Retail Trade | 409 (54.0%) | 348 (46.0%) |
| Transportation & Warehousing | 420 (93.5%) | 29 (6.5%) |
| Utilities | 22 (91.7%) | 2 (8.3%) |
| Information | 158 (69.0%) | 71 (31.0%) |
| Finance & Insurance | 296 (65.9%) | 153 (34.1%) |
| Real Estate, Rental & Leasing | 198 (50.9%) | 191 (49.1%) |
| Professional & Scientific | 1,032 (60.4%) | 678 (39.7%) |
| Enterprise Management | 0 (0.0%) | 0 (0.0%) |
| Administrative & Support | 172 (47.0%) | 194 (53.0%) |
| Educational Services | 671 (39.5%) | 1,029 (60.5%) |
| Health Care & Social Assistance | 362 (25.2%) | 1,074 (74.8%) |
| Arts, Entertainment & Recreation | 77 (53.5%) | 67 (46.5%) |
| Accommodation & Food Services | 278 (57.4%) | 206 (42.6%) |
| Public Administration | 230 (56.2%) | 179 (43.8%) |
| Total | 5,267 (51.5%) | 4,968 (48.5%) |
Education in North Druid Hills
School Enrollment in North Druid Hills
The most common levels of schooling among the 4,252 students in North Druid Hills are graduate / professional (1,657 | 39.0%), college / undergraduate (666 | 15.7%), and high school (603 | 14.2%).
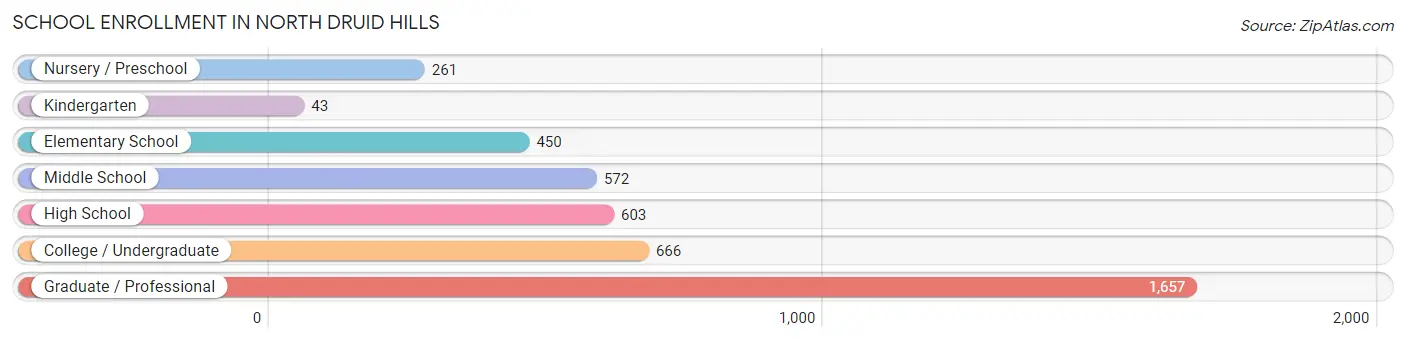
| School Level | # Students | % Students |
| Nursery / Preschool | 261 | 6.1% |
| Kindergarten | 43 | 1.0% |
| Elementary School | 450 | 10.6% |
| Middle School | 572 | 13.5% |
| High School | 603 | 14.2% |
| College / Undergraduate | 666 | 15.7% |
| Graduate / Professional | 1,657 | 39.0% |
| Total | 4,252 | 100.0% |
School Enrollment by Age by Funding Source in North Druid Hills
Out of a total of 4,252 students who are enrolled in schools in North Druid Hills, 2,568 (60.4%) attend a private institution, while the remaining 1,684 (39.6%) are enrolled in public schools. The age group of 3 to 4 year olds has the highest likelihood of being enrolled in private schools, with 205 (96.2% in the age bracket) enrolled. Conversely, the age group of 18 to 19 year olds has the lowest likelihood of being enrolled in a private school, with 171 (69.2% in the age bracket) attending a public institution.
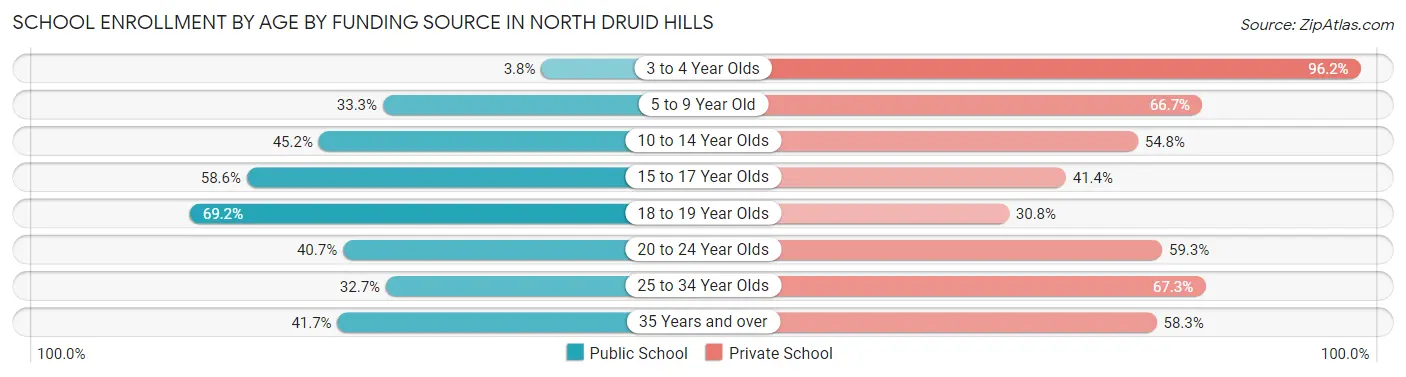
| Age Bracket | Public School | Private School |
| 3 to 4 Year Olds | 8 (3.8%) | 205 (96.2%) |
| 5 to 9 Year Old | 172 (33.3%) | 345 (66.7%) |
| 10 to 14 Year Olds | 283 (45.2%) | 343 (54.8%) |
| 15 to 17 Year Olds | 221 (58.6%) | 156 (41.4%) |
| 18 to 19 Year Olds | 171 (69.2%) | 76 (30.8%) |
| 20 to 24 Year Olds | 374 (40.7%) | 545 (59.3%) |
| 25 to 34 Year Olds | 397 (32.7%) | 817 (67.3%) |
| 35 Years and over | 58 (41.7%) | 81 (58.3%) |
| Total | 1,684 (39.6%) | 2,568 (60.4%) |
Educational Attainment by Field of Study in North Druid Hills
Business (1,887 | 19.1%), social sciences (1,146 | 11.6%), bio, nature & agricultural (874 | 8.9%), science & technology (851 | 8.6%), and physical & health sciences (760 | 7.7%) are the most common fields of study among 9,858 individuals in North Druid Hills who have obtained a bachelor's degree or higher.
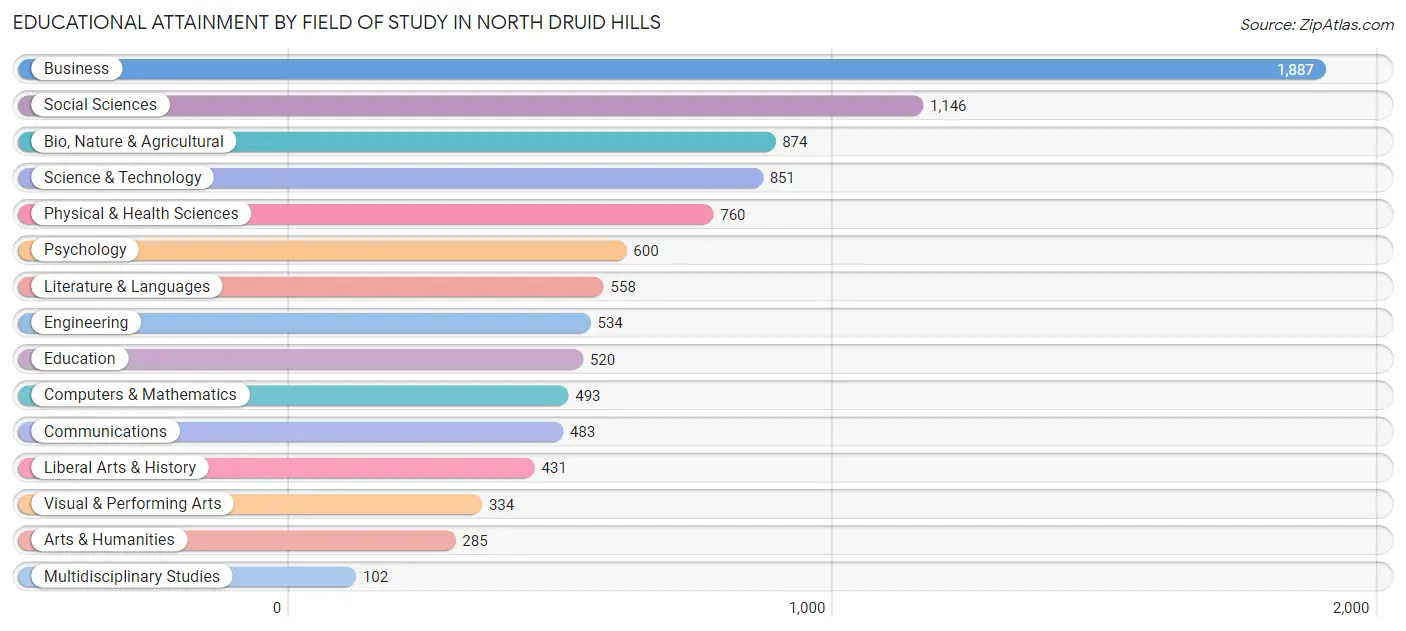
| Field of Study | # Graduates | % Graduates |
| Computers & Mathematics | 493 | 5.0% |
| Bio, Nature & Agricultural | 874 | 8.9% |
| Physical & Health Sciences | 760 | 7.7% |
| Psychology | 600 | 6.1% |
| Social Sciences | 1,146 | 11.6% |
| Engineering | 534 | 5.4% |
| Multidisciplinary Studies | 102 | 1.0% |
| Science & Technology | 851 | 8.6% |
| Business | 1,887 | 19.1% |
| Education | 520 | 5.3% |
| Literature & Languages | 558 | 5.7% |
| Liberal Arts & History | 431 | 4.4% |
| Visual & Performing Arts | 334 | 3.4% |
| Communications | 483 | 4.9% |
| Arts & Humanities | 285 | 2.9% |
| Total | 9,858 | 100.0% |
Transportation & Commute in North Druid Hills
Vehicle Availability by Sex in North Druid Hills
The most prevalent vehicle ownership categories in North Druid Hills are males with 2 vehicles (2,760, accounting for 55.8%) and females with 2 vehicles (2,160, making up 57.7%).
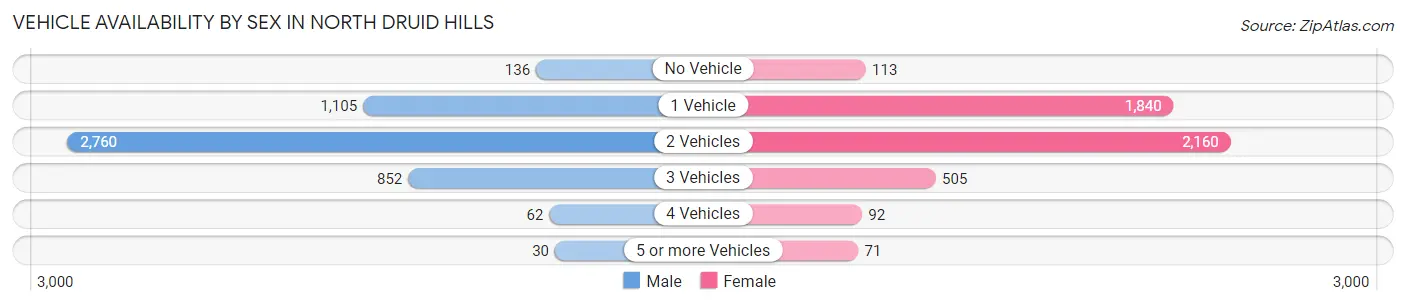
| Vehicles Available | Male | Female |
| No Vehicle | 136 (2.8%) | 113 (2.4%) |
| 1 Vehicle | 1,105 (22.4%) | 1,840 (38.5%) |
| 2 Vehicles | 2,760 (55.8%) | 2,160 (45.2%) |
| 3 Vehicles | 852 (17.2%) | 505 (10.6%) |
| 4 Vehicles | 62 (1.3%) | 92 (1.9%) |
| 5 or more Vehicles | 30 (0.6%) | 71 (1.5%) |
| Total | 4,945 (100.0%) | 4,781 (100.0%) |
Commute Time in North Druid Hills
The most frequently occuring commute durations in North Druid Hills are 20 to 24 minutes (1,508 commuters, 19.2%), 15 to 19 minutes (1,442 commuters, 18.4%), and 30 to 34 minutes (1,369 commuters, 17.4%).
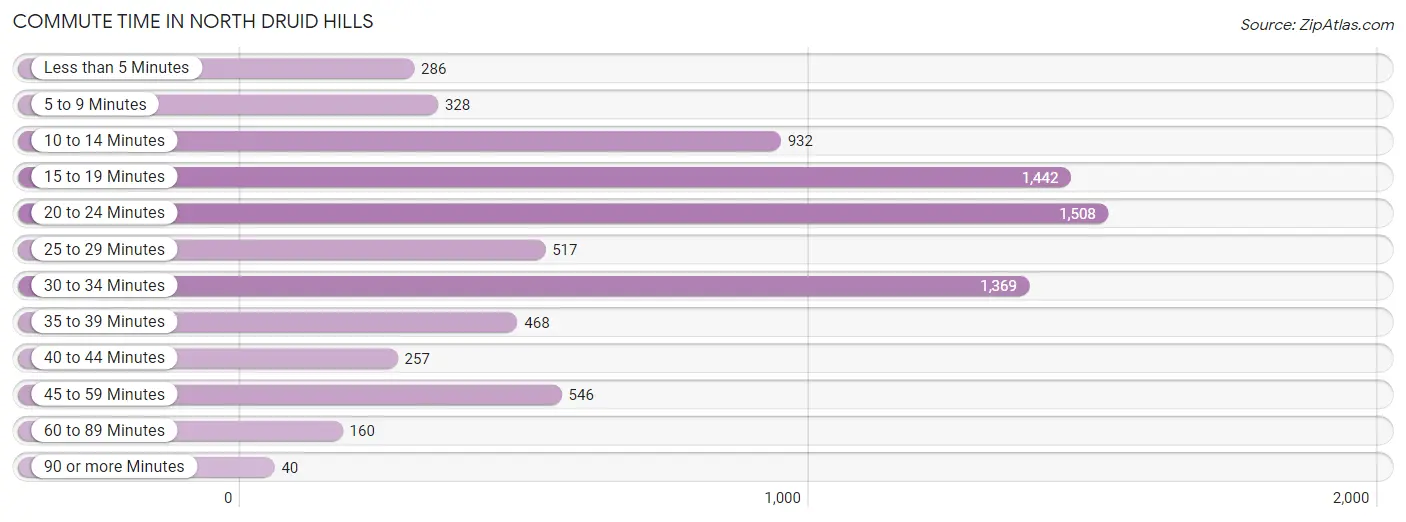
| Commute Time | # Commuters | % Commuters |
| Less than 5 Minutes | 286 | 3.6% |
| 5 to 9 Minutes | 328 | 4.2% |
| 10 to 14 Minutes | 932 | 11.9% |
| 15 to 19 Minutes | 1,442 | 18.4% |
| 20 to 24 Minutes | 1,508 | 19.2% |
| 25 to 29 Minutes | 517 | 6.6% |
| 30 to 34 Minutes | 1,369 | 17.4% |
| 35 to 39 Minutes | 468 | 6.0% |
| 40 to 44 Minutes | 257 | 3.3% |
| 45 to 59 Minutes | 546 | 7.0% |
| 60 to 89 Minutes | 160 | 2.0% |
| 90 or more Minutes | 40 | 0.5% |
Commute Time by Sex in North Druid Hills
The most common commute times in North Druid Hills are 20 to 24 minutes (788 commuters, 19.7%) for males and 20 to 24 minutes (720 commuters, 18.7%) for females.
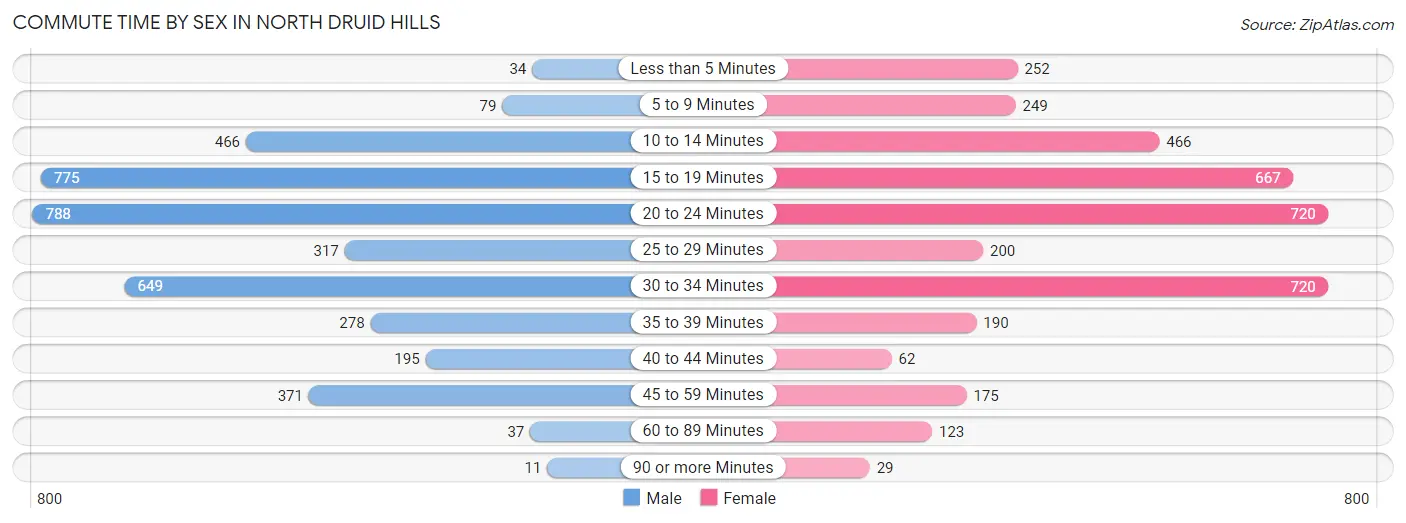
| Commute Time | Male | Female |
| Less than 5 Minutes | 34 (0.9%) | 252 (6.5%) |
| 5 to 9 Minutes | 79 (2.0%) | 249 (6.5%) |
| 10 to 14 Minutes | 466 (11.7%) | 466 (12.1%) |
| 15 to 19 Minutes | 775 (19.4%) | 667 (17.3%) |
| 20 to 24 Minutes | 788 (19.7%) | 720 (18.7%) |
| 25 to 29 Minutes | 317 (7.9%) | 200 (5.2%) |
| 30 to 34 Minutes | 649 (16.2%) | 720 (18.7%) |
| 35 to 39 Minutes | 278 (7.0%) | 190 (4.9%) |
| 40 to 44 Minutes | 195 (4.9%) | 62 (1.6%) |
| 45 to 59 Minutes | 371 (9.3%) | 175 (4.5%) |
| 60 to 89 Minutes | 37 (0.9%) | 123 (3.2%) |
| 90 or more Minutes | 11 (0.3%) | 29 (0.7%) |
Time of Departure to Work by Sex in North Druid Hills
The most frequent times of departure to work in North Druid Hills are 8:00 AM to 8:29 AM (881, 22.0%) for males and 8:30 AM to 8:59 AM (828, 21.5%) for females.
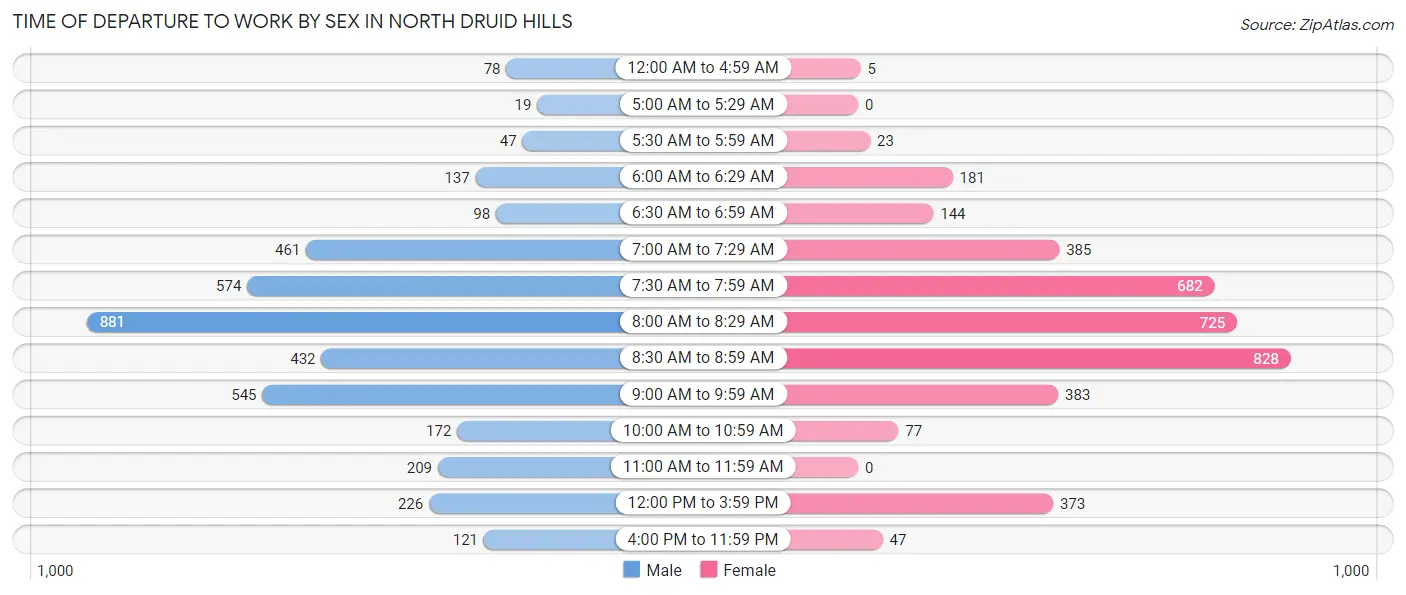
| Time of Departure | Male | Female |
| 12:00 AM to 4:59 AM | 78 (1.9%) | 5 (0.1%) |
| 5:00 AM to 5:29 AM | 19 (0.5%) | 0 (0.0%) |
| 5:30 AM to 5:59 AM | 47 (1.2%) | 23 (0.6%) |
| 6:00 AM to 6:29 AM | 137 (3.4%) | 181 (4.7%) |
| 6:30 AM to 6:59 AM | 98 (2.5%) | 144 (3.7%) |
| 7:00 AM to 7:29 AM | 461 (11.5%) | 385 (10.0%) |
| 7:30 AM to 7:59 AM | 574 (14.3%) | 682 (17.7%) |
| 8:00 AM to 8:29 AM | 881 (22.0%) | 725 (18.8%) |
| 8:30 AM to 8:59 AM | 432 (10.8%) | 828 (21.5%) |
| 9:00 AM to 9:59 AM | 545 (13.6%) | 383 (9.9%) |
| 10:00 AM to 10:59 AM | 172 (4.3%) | 77 (2.0%) |
| 11:00 AM to 11:59 AM | 209 (5.2%) | 0 (0.0%) |
| 12:00 PM to 3:59 PM | 226 (5.7%) | 373 (9.7%) |
| 4:00 PM to 11:59 PM | 121 (3.0%) | 47 (1.2%) |
| Total | 4,000 (100.0%) | 3,853 (100.0%) |
Housing Occupancy in North Druid Hills
Occupancy by Ownership in North Druid Hills
Of the total 7,830 dwellings in North Druid Hills, owner-occupied units account for 3,037 (38.8%), while renter-occupied units make up 4,793 (61.2%).
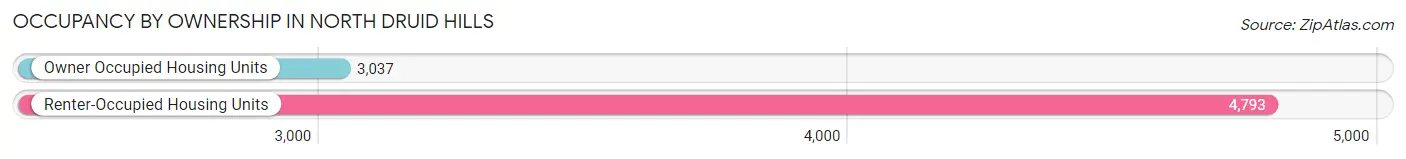
| Occupancy | # Housing Units | % Housing Units |
| Owner Occupied Housing Units | 3,037 | 38.8% |
| Renter-Occupied Housing Units | 4,793 | 61.2% |
| Total Occupied Housing Units | 7,830 | 100.0% |
Occupancy by Household Size in North Druid Hills
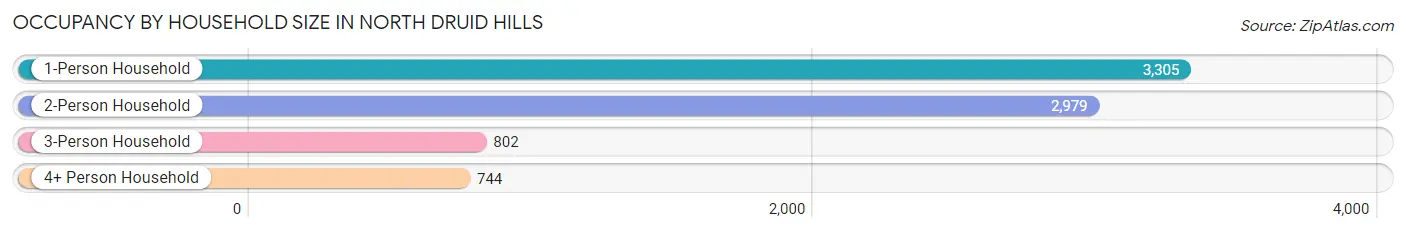
| Household Size | # Housing Units | % Housing Units |
| 1-Person Household | 3,305 | 42.2% |
| 2-Person Household | 2,979 | 38.1% |
| 3-Person Household | 802 | 10.2% |
| 4+ Person Household | 744 | 9.5% |
| Total Housing Units | 7,830 | 100.0% |
Occupancy by Ownership by Household Size in North Druid Hills
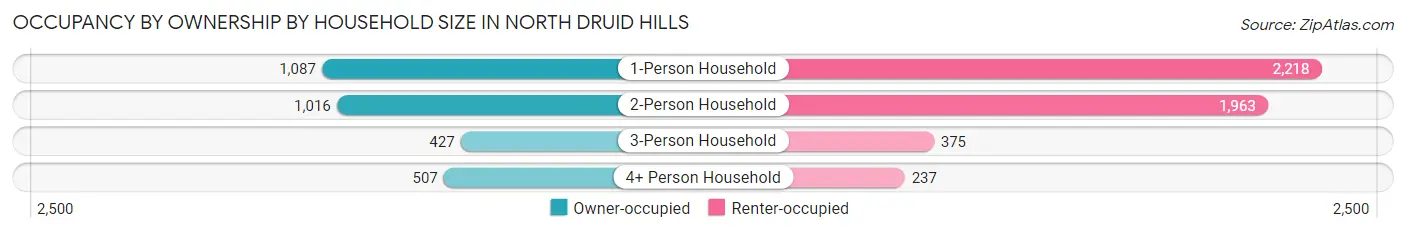
| Household Size | Owner-occupied | Renter-occupied |
| 1-Person Household | 1,087 (32.9%) | 2,218 (67.1%) |
| 2-Person Household | 1,016 (34.1%) | 1,963 (65.9%) |
| 3-Person Household | 427 (53.2%) | 375 (46.8%) |
| 4+ Person Household | 507 (68.1%) | 237 (31.9%) |
| Total Housing Units | 3,037 (38.8%) | 4,793 (61.2%) |
Occupancy by Educational Attainment in North Druid Hills
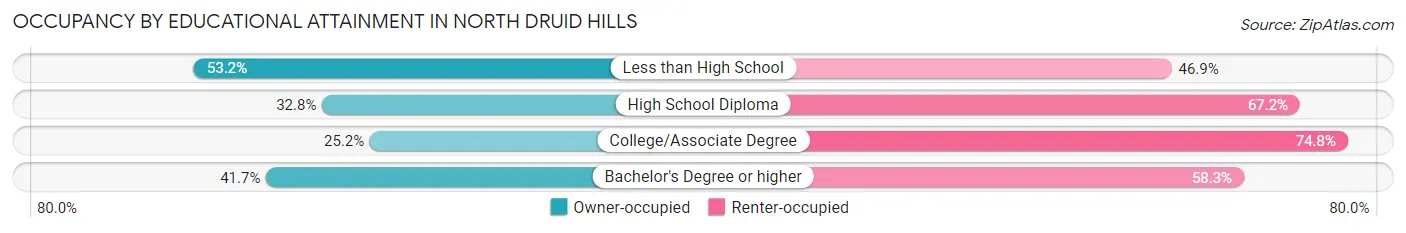
| Household Size | Owner-occupied | Renter-occupied |
| Less than High School | 59 (53.1%) | 52 (46.9%) |
| High School Diploma | 182 (32.8%) | 373 (67.2%) |
| College/Associate Degree | 289 (25.2%) | 858 (74.8%) |
| Bachelor's Degree or higher | 2,507 (41.7%) | 3,510 (58.3%) |
Occupancy by Age of Householder in North Druid Hills
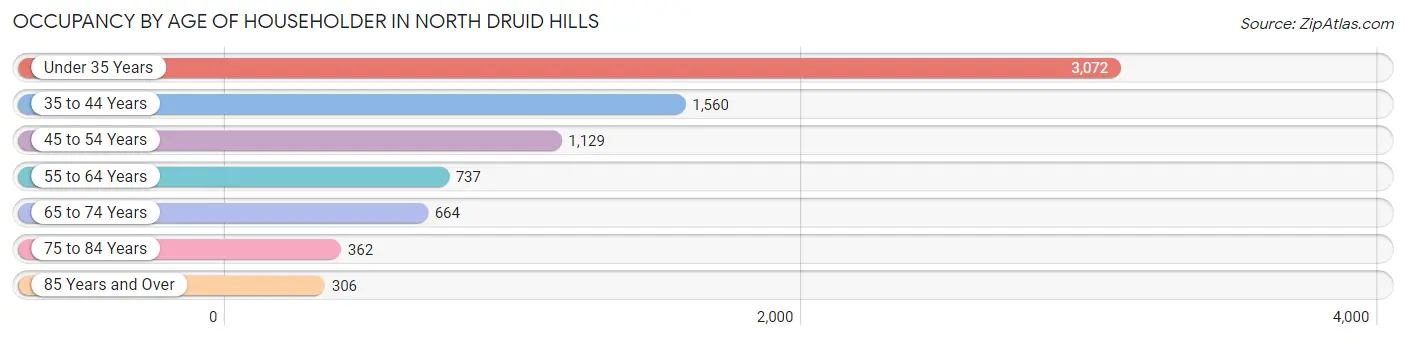
| Age Bracket | # Households | % Households |
| Under 35 Years | 3,072 | 39.2% |
| 35 to 44 Years | 1,560 | 19.9% |
| 45 to 54 Years | 1,129 | 14.4% |
| 55 to 64 Years | 737 | 9.4% |
| 65 to 74 Years | 664 | 8.5% |
| 75 to 84 Years | 362 | 4.6% |
| 85 Years and Over | 306 | 3.9% |
| Total | 7,830 | 100.0% |
Housing Finances in North Druid Hills
Median Income by Occupancy in North Druid Hills
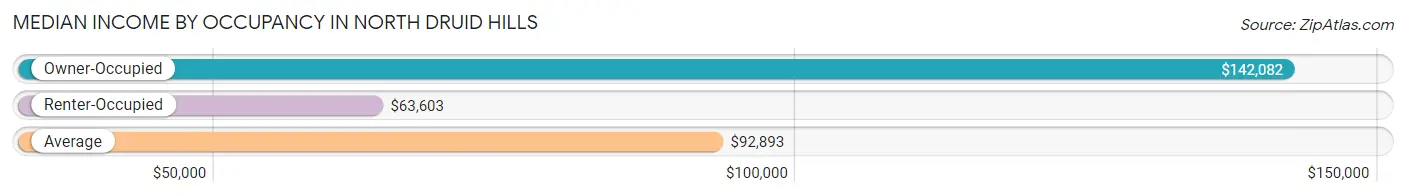
| Occupancy Type | # Households | Median Income |
| Owner-Occupied | 3,037 (38.8%) | $142,082 |
| Renter-Occupied | 4,793 (61.2%) | $63,603 |
| Average | 7,830 (100.0%) | $92,893 |
Occupancy by Householder Income Bracket in North Druid Hills
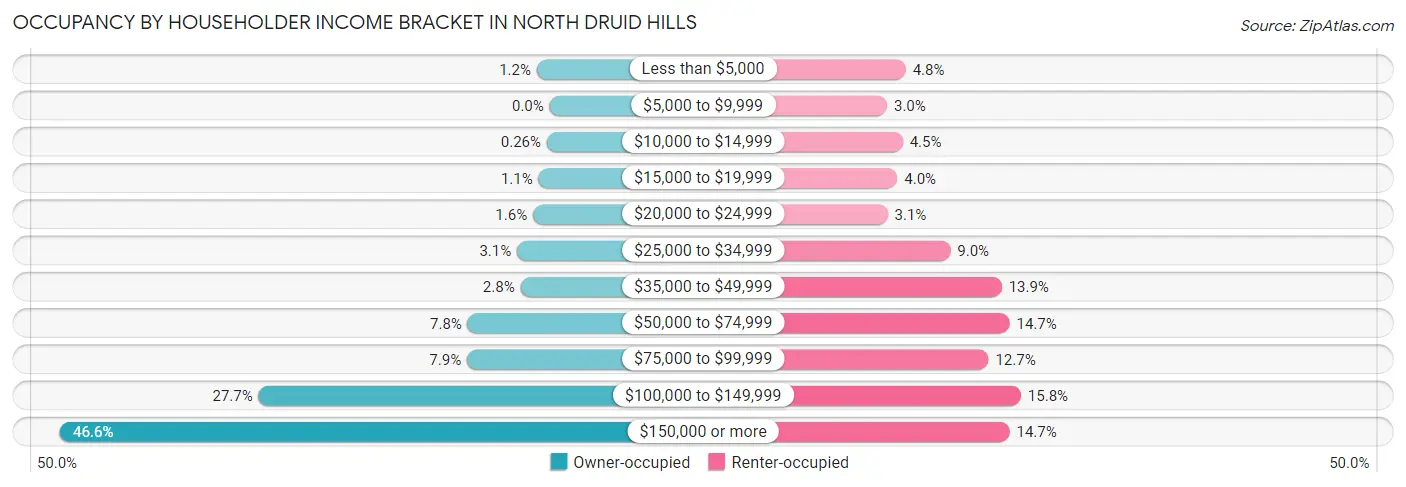
| Income Bracket | Owner-occupied | Renter-occupied |
| Less than $5,000 | 37 (1.2%) | 229 (4.8%) |
| $5,000 to $9,999 | 0 (0.0%) | 144 (3.0%) |
| $10,000 to $14,999 | 8 (0.3%) | 215 (4.5%) |
| $15,000 to $19,999 | 32 (1.1%) | 191 (4.0%) |
| $20,000 to $24,999 | 48 (1.6%) | 146 (3.0%) |
| $25,000 to $34,999 | 94 (3.1%) | 433 (9.0%) |
| $35,000 to $49,999 | 84 (2.8%) | 667 (13.9%) |
| $50,000 to $74,999 | 237 (7.8%) | 703 (14.7%) |
| $75,000 to $99,999 | 239 (7.9%) | 607 (12.7%) |
| $100,000 to $149,999 | 842 (27.7%) | 755 (15.8%) |
| $150,000 or more | 1,416 (46.6%) | 703 (14.7%) |
| Total | 3,037 (100.0%) | 4,793 (100.0%) |
Monthly Housing Cost Tiers in North Druid Hills
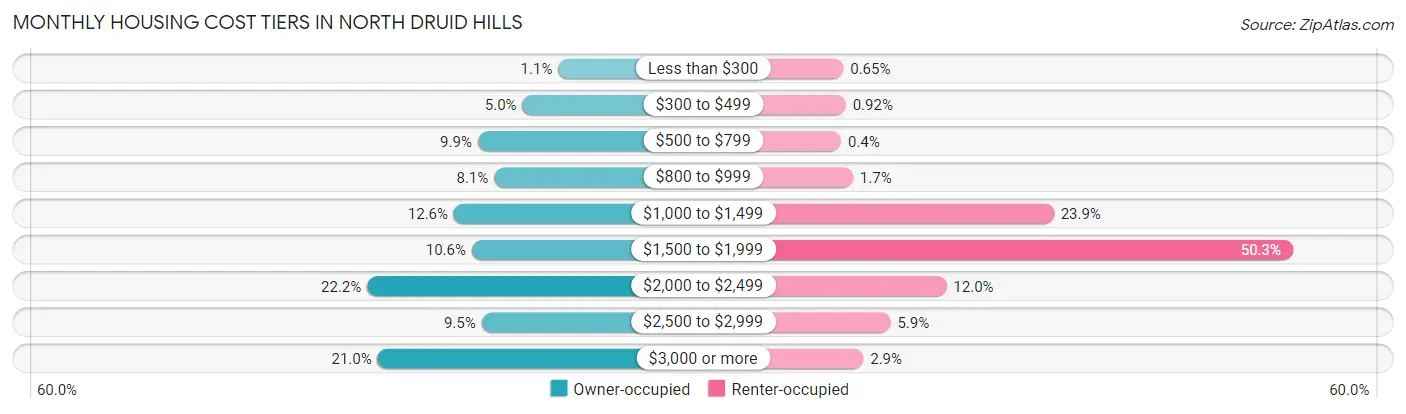
| Monthly Cost | Owner-occupied | Renter-occupied |
| Less than $300 | 32 (1.1%) | 31 (0.6%) |
| $300 to $499 | 152 (5.0%) | 44 (0.9%) |
| $500 to $799 | 302 (9.9%) | 19 (0.4%) |
| $800 to $999 | 247 (8.1%) | 82 (1.7%) |
| $1,000 to $1,499 | 382 (12.6%) | 1,145 (23.9%) |
| $1,500 to $1,999 | 322 (10.6%) | 2,411 (50.3%) |
| $2,000 to $2,499 | 673 (22.2%) | 577 (12.0%) |
| $2,500 to $2,999 | 289 (9.5%) | 281 (5.9%) |
| $3,000 or more | 638 (21.0%) | 137 (2.9%) |
| Total | 3,037 (100.0%) | 4,793 (100.0%) |
Physical Housing Characteristics in North Druid Hills
Housing Structures in North Druid Hills
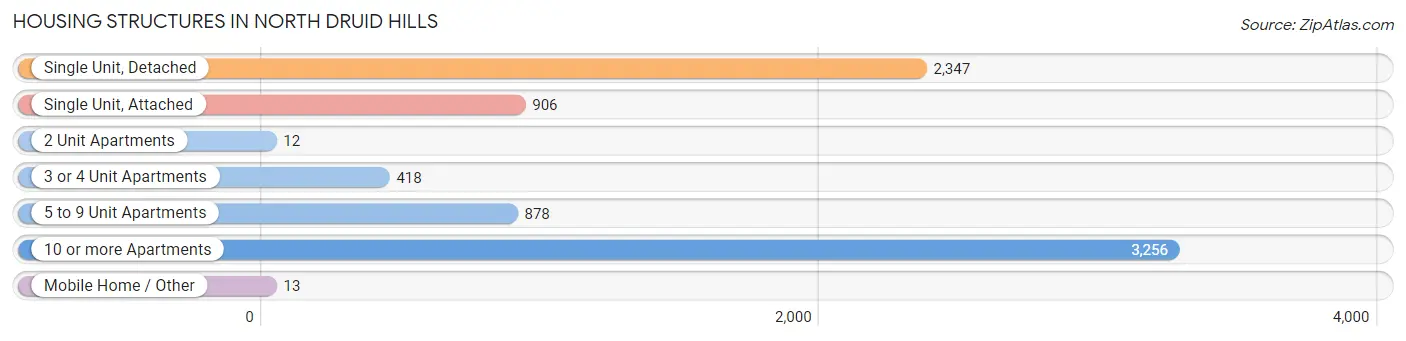
| Structure Type | # Housing Units | % Housing Units |
| Single Unit, Detached | 2,347 | 30.0% |
| Single Unit, Attached | 906 | 11.6% |
| 2 Unit Apartments | 12 | 0.2% |
| 3 or 4 Unit Apartments | 418 | 5.3% |
| 5 to 9 Unit Apartments | 878 | 11.2% |
| 10 or more Apartments | 3,256 | 41.6% |
| Mobile Home / Other | 13 | 0.2% |
| Total | 7,830 | 100.0% |
Housing Structures by Occupancy in North Druid Hills
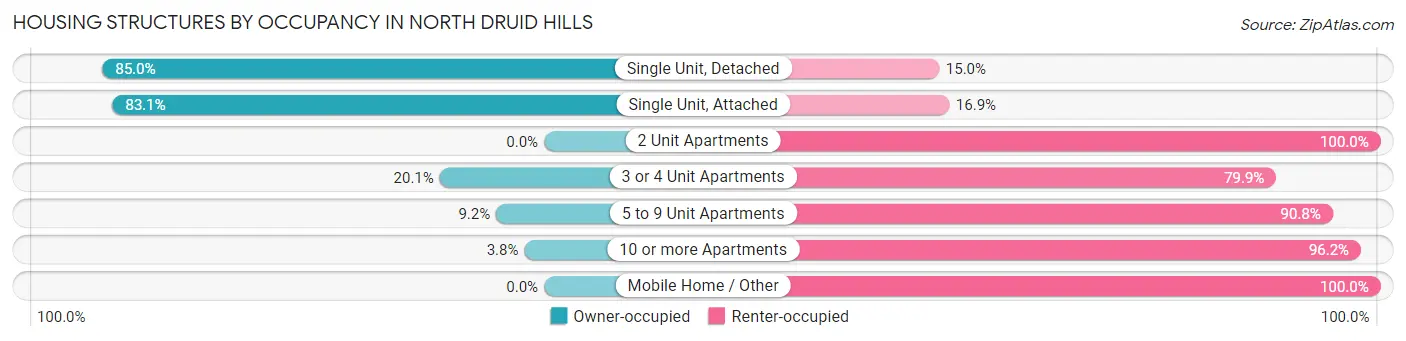
| Structure Type | Owner-occupied | Renter-occupied |
| Single Unit, Detached | 1,996 (85.0%) | 351 (15.0%) |
| Single Unit, Attached | 753 (83.1%) | 153 (16.9%) |
| 2 Unit Apartments | 0 (0.0%) | 12 (100.0%) |
| 3 or 4 Unit Apartments | 84 (20.1%) | 334 (79.9%) |
| 5 to 9 Unit Apartments | 81 (9.2%) | 797 (90.8%) |
| 10 or more Apartments | 123 (3.8%) | 3,133 (96.2%) |
| Mobile Home / Other | 0 (0.0%) | 13 (100.0%) |
| Total | 3,037 (38.8%) | 4,793 (61.2%) |
Housing Structures by Number of Rooms in North Druid Hills
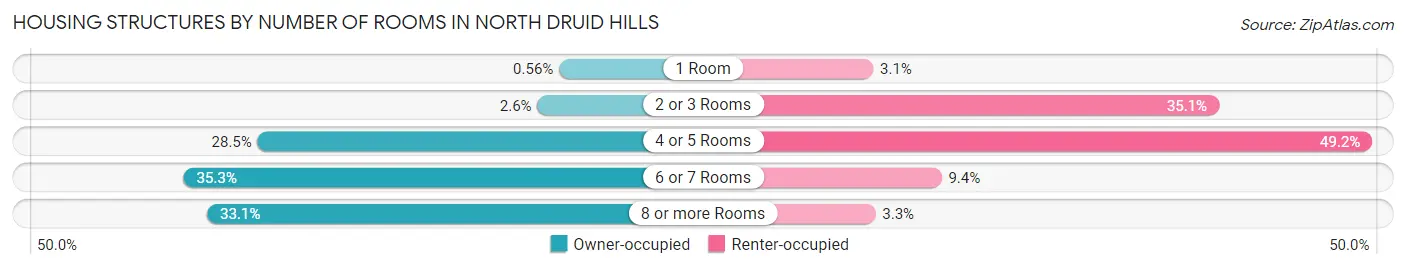
| Number of Rooms | Owner-occupied | Renter-occupied |
| 1 Room | 17 (0.6%) | 147 (3.1%) |
| 2 or 3 Rooms | 78 (2.6%) | 1,680 (35.0%) |
| 4 or 5 Rooms | 864 (28.4%) | 2,359 (49.2%) |
| 6 or 7 Rooms | 1,072 (35.3%) | 450 (9.4%) |
| 8 or more Rooms | 1,006 (33.1%) | 157 (3.3%) |
| Total | 3,037 (100.0%) | 4,793 (100.0%) |
Housing Structure by Heating Type in North Druid Hills
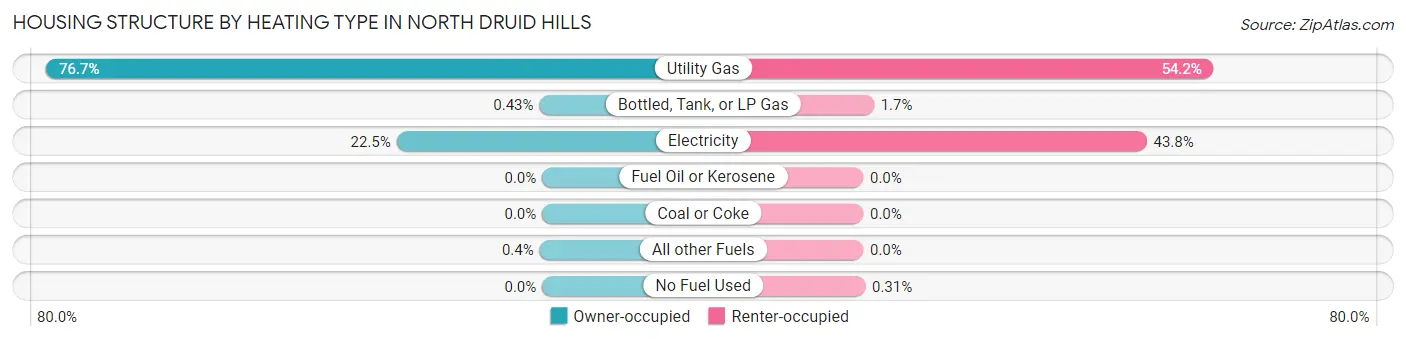
| Heating Type | Owner-occupied | Renter-occupied |
| Utility Gas | 2,329 (76.7%) | 2,598 (54.2%) |
| Bottled, Tank, or LP Gas | 13 (0.4%) | 79 (1.7%) |
| Electricity | 683 (22.5%) | 2,101 (43.8%) |
| Fuel Oil or Kerosene | 0 (0.0%) | 0 (0.0%) |
| Coal or Coke | 0 (0.0%) | 0 (0.0%) |
| All other Fuels | 12 (0.4%) | 0 (0.0%) |
| No Fuel Used | 0 (0.0%) | 15 (0.3%) |
| Total | 3,037 (100.0%) | 4,793 (100.0%) |
Household Vehicle Usage in North Druid Hills
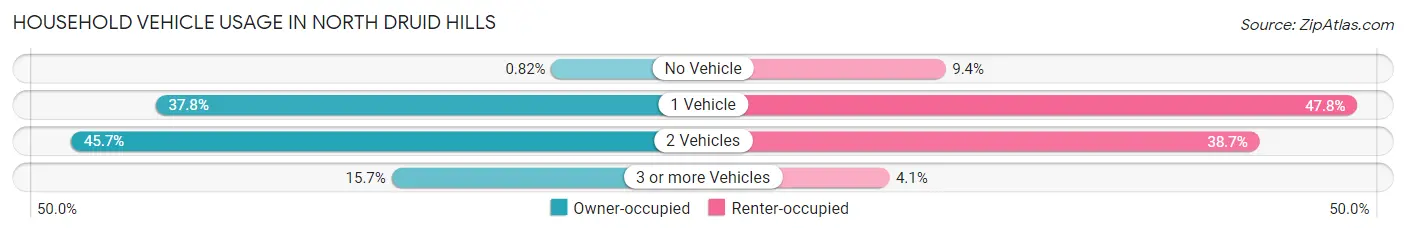
| Vehicles per Household | Owner-occupied | Renter-occupied |
| No Vehicle | 25 (0.8%) | 449 (9.4%) |
| 1 Vehicle | 1,147 (37.8%) | 2,292 (47.8%) |
| 2 Vehicles | 1,387 (45.7%) | 1,855 (38.7%) |
| 3 or more Vehicles | 478 (15.7%) | 197 (4.1%) |
| Total | 3,037 (100.0%) | 4,793 (100.0%) |
Real Estate & Mortgages in North Druid Hills
Real Estate and Mortgage Overview in North Druid Hills
| Characteristic | Without Mortgage | With Mortgage |
| Housing Units | 1,030 | 2,007 |
| Median Property Value | $441,900 | $465,600 |
| Median Household Income | $104,829 | $1,060 |
| Monthly Housing Costs | $841 | $638 |
| Real Estate Taxes | $4,107 | $11 |
Property Value by Mortgage Status in North Druid Hills
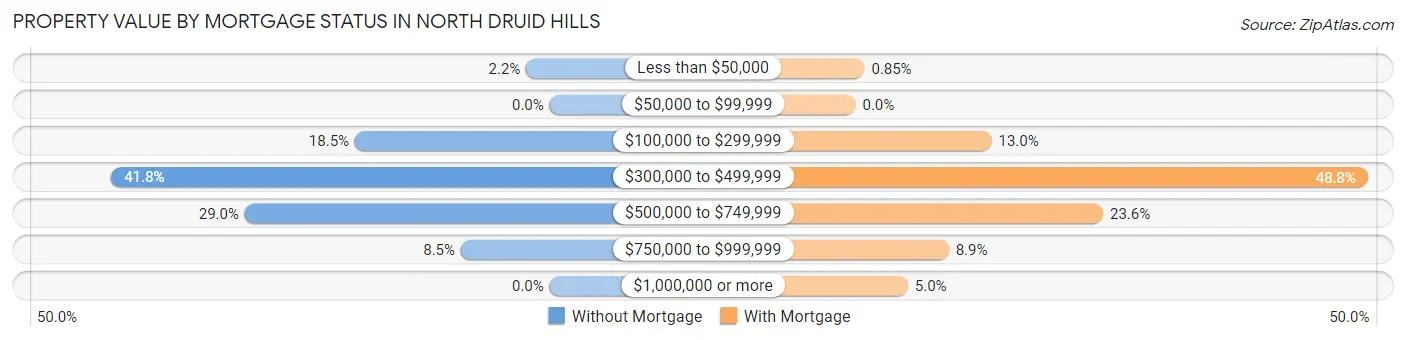
| Property Value | Without Mortgage | With Mortgage |
| Less than $50,000 | 23 (2.2%) | 17 (0.9%) |
| $50,000 to $99,999 | 0 (0.0%) | 0 (0.0%) |
| $100,000 to $299,999 | 191 (18.5%) | 260 (13.0%) |
| $300,000 to $499,999 | 430 (41.7%) | 979 (48.8%) |
| $500,000 to $749,999 | 299 (29.0%) | 473 (23.6%) |
| $750,000 to $999,999 | 87 (8.5%) | 178 (8.9%) |
| $1,000,000 or more | 0 (0.0%) | 100 (5.0%) |
| Total | 1,030 (100.0%) | 2,007 (100.0%) |
Household Income by Mortgage Status in North Druid Hills
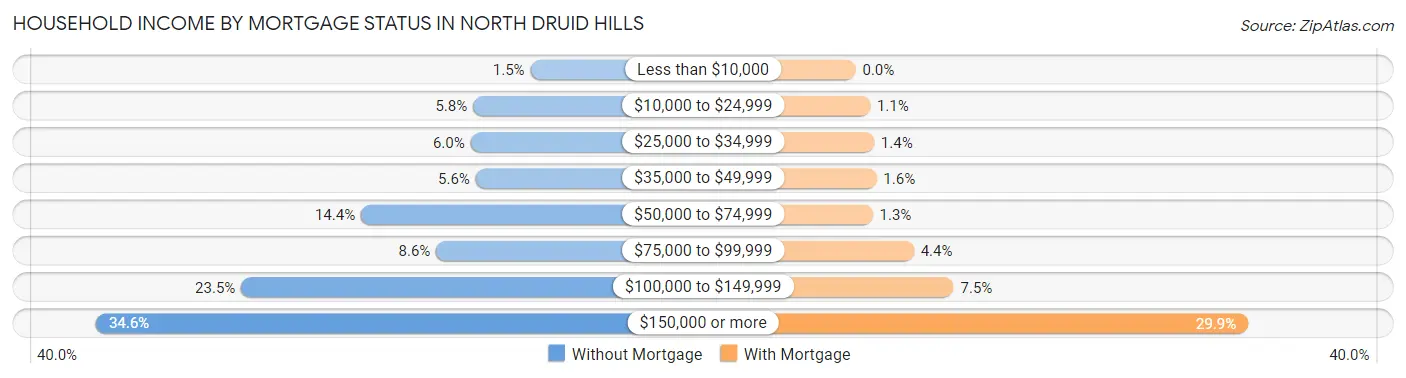
| Household Income | Without Mortgage | With Mortgage |
| Less than $10,000 | 15 (1.5%) | 0 (0.0%) |
| $10,000 to $24,999 | 60 (5.8%) | 22 (1.1%) |
| $25,000 to $34,999 | 62 (6.0%) | 28 (1.4%) |
| $35,000 to $49,999 | 58 (5.6%) | 32 (1.6%) |
| $50,000 to $74,999 | 148 (14.4%) | 26 (1.3%) |
| $75,000 to $99,999 | 89 (8.6%) | 89 (4.4%) |
| $100,000 to $149,999 | 242 (23.5%) | 150 (7.5%) |
| $150,000 or more | 356 (34.6%) | 600 (29.9%) |
| Total | 1,030 (100.0%) | 2,007 (100.0%) |
Property Value to Household Income Ratio in North Druid Hills
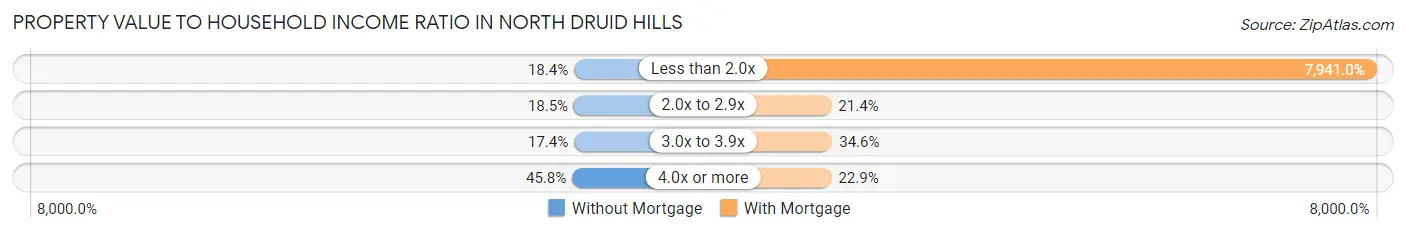
| Value-to-Income Ratio | Without Mortgage | With Mortgage |
| Less than 2.0x | 189 (18.3%) | 159,375 (7,941.0%) |
| 2.0x to 2.9x | 190 (18.4%) | 429 (21.4%) |
| 3.0x to 3.9x | 179 (17.4%) | 695 (34.6%) |
| 4.0x or more | 472 (45.8%) | 459 (22.9%) |
| Total | 1,030 (100.0%) | 2,007 (100.0%) |
Real Estate Taxes by Mortgage Status in North Druid Hills
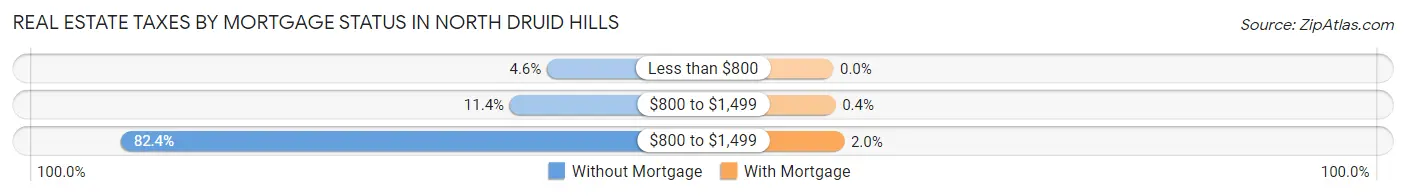
| Property Taxes | Without Mortgage | With Mortgage |
| Less than $800 | 47 (4.6%) | 0 (0.0%) |
| $800 to $1,499 | 117 (11.4%) | 8 (0.4%) |
| $800 to $1,499 | 849 (82.4%) | 40 (2.0%) |
| Total | 1,030 (100.0%) | 2,007 (100.0%) |
Health & Disability in North Druid Hills
Health Insurance Coverage by Age in North Druid Hills
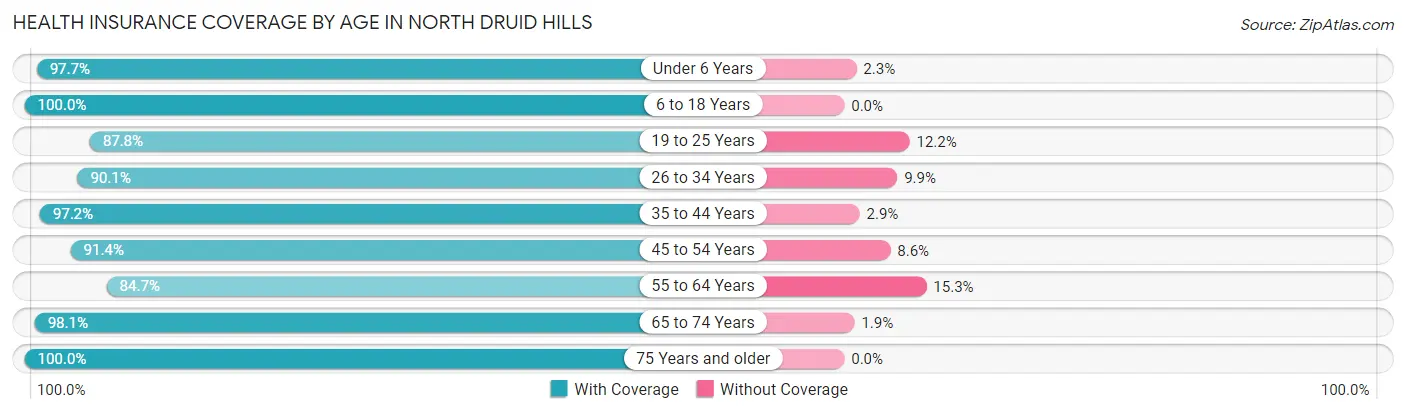
| Age Bracket | With Coverage | Without Coverage |
| Under 6 Years | 1,209 (97.7%) | 28 (2.3%) |
| 6 to 18 Years | 1,701 (100.0%) | 0 (0.0%) |
| 19 to 25 Years | 2,396 (87.8%) | 332 (12.2%) |
| 26 to 34 Years | 3,286 (90.1%) | 360 (9.9%) |
| 35 to 44 Years | 2,423 (97.2%) | 71 (2.9%) |
| 45 to 54 Years | 1,512 (91.4%) | 142 (8.6%) |
| 55 to 64 Years | 1,117 (84.7%) | 202 (15.3%) |
| 65 to 74 Years | 1,087 (98.1%) | 21 (1.9%) |
| 75 Years and older | 1,036 (100.0%) | 0 (0.0%) |
| Total | 15,767 (93.2%) | 1,156 (6.8%) |
Health Insurance Coverage by Citizenship Status in North Druid Hills
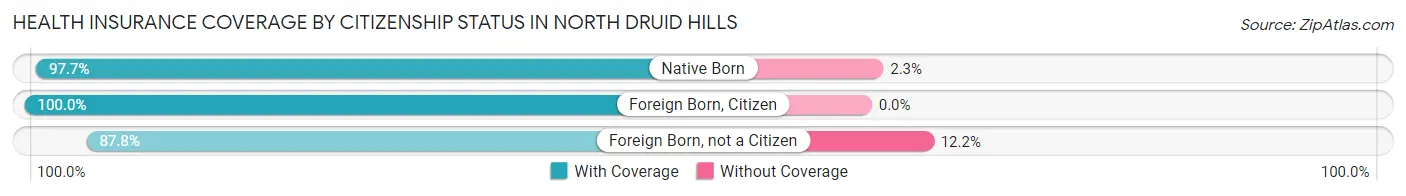
| Citizenship Status | With Coverage | Without Coverage |
| Native Born | 1,209 (97.7%) | 28 (2.3%) |
| Foreign Born, Citizen | 1,701 (100.0%) | 0 (0.0%) |
| Foreign Born, not a Citizen | 2,396 (87.8%) | 332 (12.2%) |
Health Insurance Coverage by Household Income in North Druid Hills
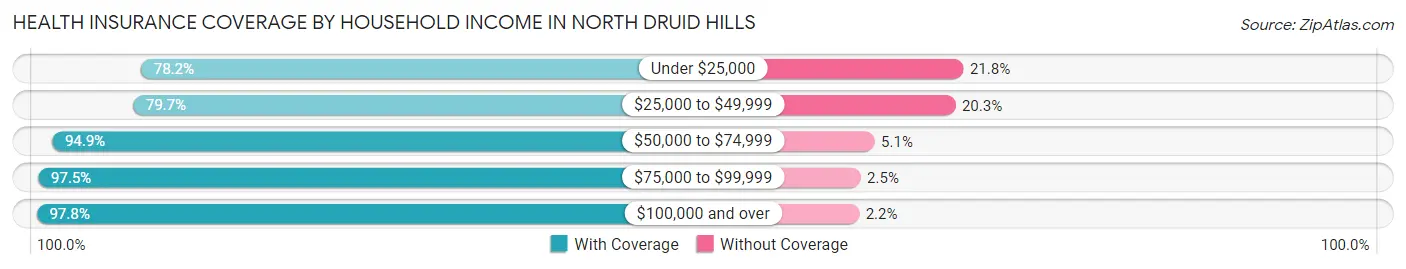
| Household Income | With Coverage | Without Coverage |
| Under $25,000 | 1,301 (78.2%) | 362 (21.8%) |
| $25,000 to $49,999 | 1,750 (79.7%) | 445 (20.3%) |
| $50,000 to $74,999 | 1,719 (94.9%) | 93 (5.1%) |
| $75,000 to $99,999 | 1,951 (97.5%) | 50 (2.5%) |
| $100,000 and over | 8,957 (97.8%) | 204 (2.2%) |
Public vs Private Health Insurance Coverage by Age in North Druid Hills
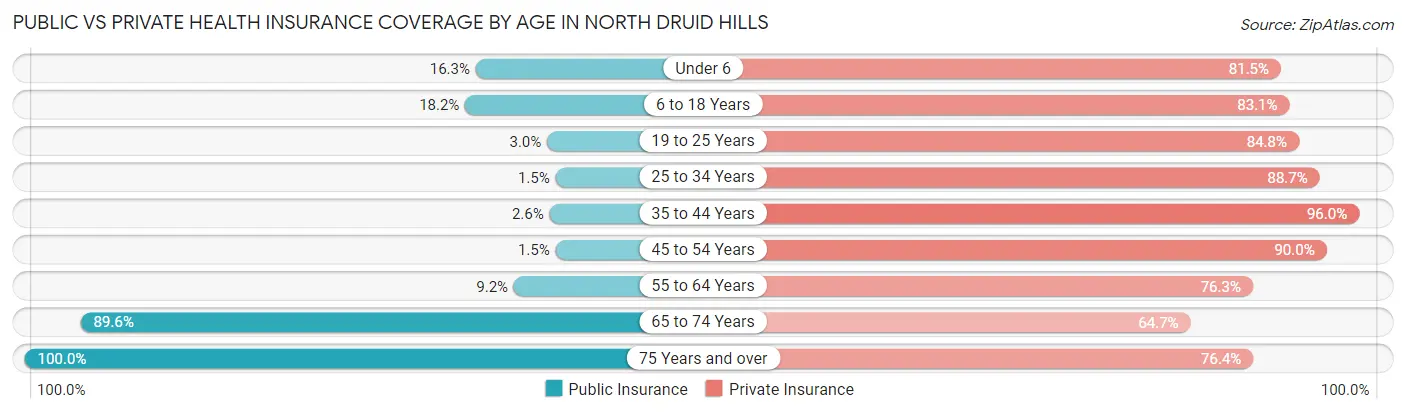
| Age Bracket | Public Insurance | Private Insurance |
| Under 6 | 201 (16.3%) | 1,008 (81.5%) |
| 6 to 18 Years | 310 (18.2%) | 1,413 (83.1%) |
| 19 to 25 Years | 82 (3.0%) | 2,314 (84.8%) |
| 25 to 34 Years | 53 (1.5%) | 3,233 (88.7%) |
| 35 to 44 Years | 64 (2.6%) | 2,394 (96.0%) |
| 45 to 54 Years | 24 (1.5%) | 1,488 (90.0%) |
| 55 to 64 Years | 121 (9.2%) | 1,006 (76.3%) |
| 65 to 74 Years | 993 (89.6%) | 717 (64.7%) |
| 75 Years and over | 1,036 (100.0%) | 791 (76.3%) |
| Total | 2,884 (17.0%) | 14,364 (84.9%) |
Disability Status by Sex by Age in North Druid Hills
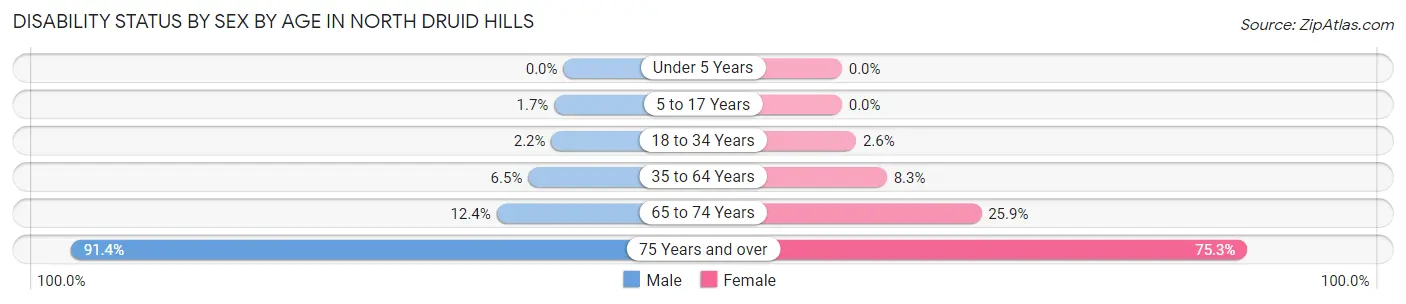
| Age Bracket | Male | Female |
| Under 5 Years | 0 (0.0%) | 0 (0.0%) |
| 5 to 17 Years | 11 (1.7%) | 0 (0.0%) |
| 18 to 34 Years | 65 (2.2%) | 96 (2.6%) |
| 35 to 64 Years | 183 (6.5%) | 222 (8.3%) |
| 65 to 74 Years | 67 (12.4%) | 147 (25.9%) |
| 75 Years and over | 341 (91.4%) | 499 (75.3%) |
Disability Class by Sex by Age in North Druid Hills
Disability Class: Hearing Difficulty
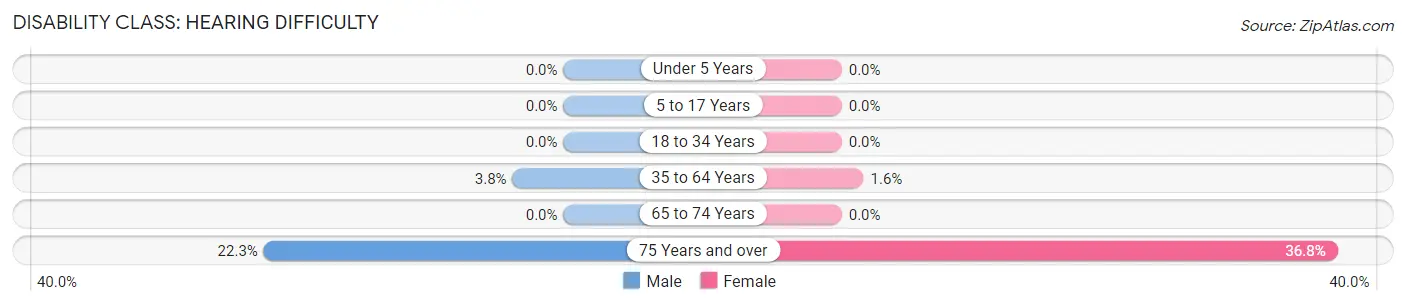
| Age Bracket | Male | Female |
| Under 5 Years | 0 (0.0%) | 0 (0.0%) |
| 5 to 17 Years | 0 (0.0%) | 0 (0.0%) |
| 18 to 34 Years | 0 (0.0%) | 0 (0.0%) |
| 35 to 64 Years | 106 (3.8%) | 43 (1.6%) |
| 65 to 74 Years | 0 (0.0%) | 0 (0.0%) |
| 75 Years and over | 83 (22.3%) | 244 (36.8%) |
Disability Class: Vision Difficulty
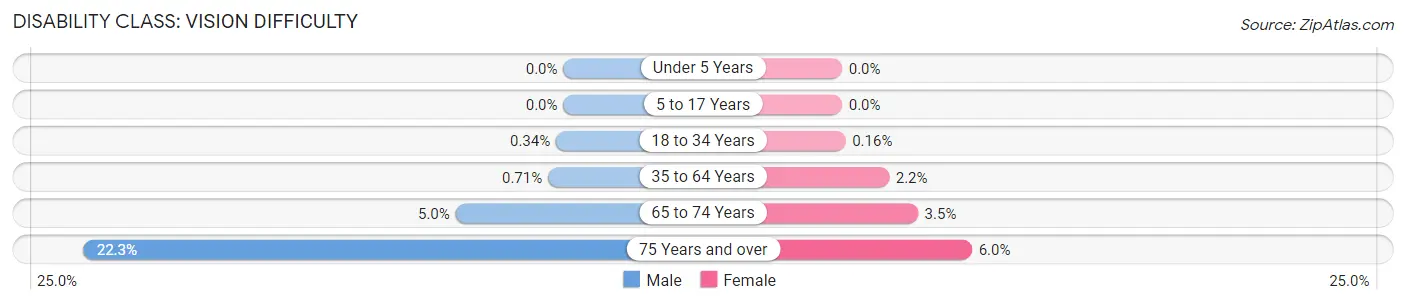
| Age Bracket | Male | Female |
| Under 5 Years | 0 (0.0%) | 0 (0.0%) |
| 5 to 17 Years | 0 (0.0%) | 0 (0.0%) |
| 18 to 34 Years | 10 (0.3%) | 6 (0.2%) |
| 35 to 64 Years | 20 (0.7%) | 58 (2.2%) |
| 65 to 74 Years | 27 (5.0%) | 20 (3.5%) |
| 75 Years and over | 83 (22.3%) | 40 (6.0%) |
Disability Class: Cognitive Difficulty
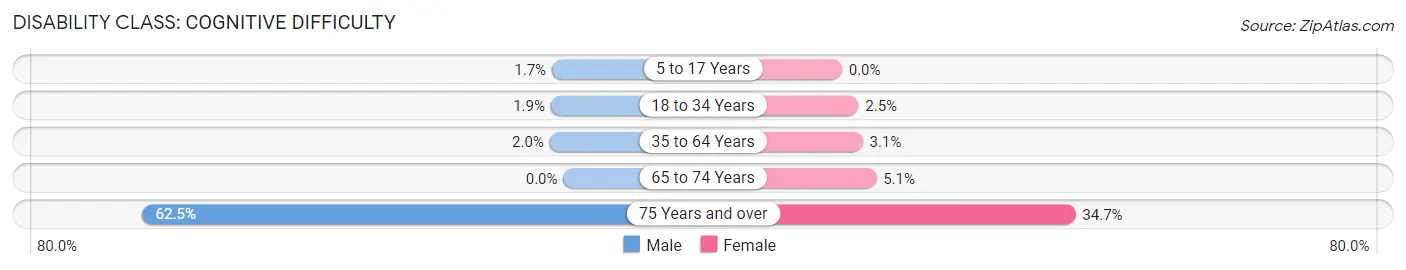
| Age Bracket | Male | Female |
| 5 to 17 Years | 11 (1.7%) | 0 (0.0%) |
| 18 to 34 Years | 55 (1.9%) | 90 (2.5%) |
| 35 to 64 Years | 57 (2.0%) | 82 (3.1%) |
| 65 to 74 Years | 0 (0.0%) | 29 (5.1%) |
| 75 Years and over | 233 (62.5%) | 230 (34.7%) |
Disability Class: Ambulatory Difficulty
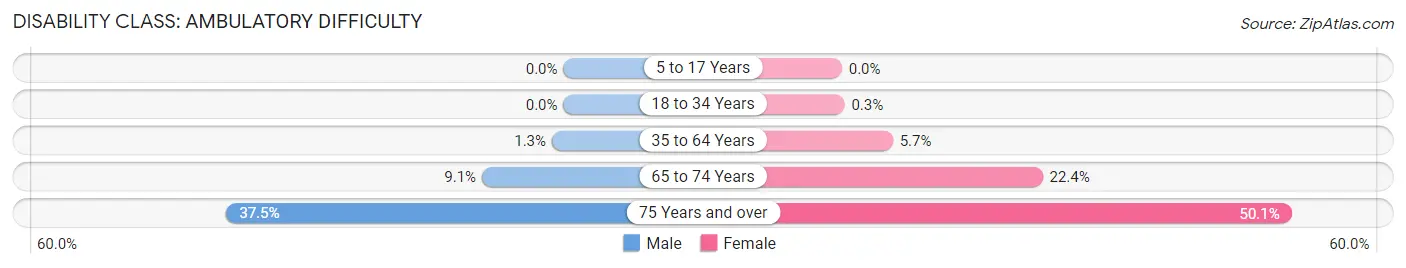
| Age Bracket | Male | Female |
| 5 to 17 Years | 0 (0.0%) | 0 (0.0%) |
| 18 to 34 Years | 0 (0.0%) | 11 (0.3%) |
| 35 to 64 Years | 36 (1.3%) | 151 (5.7%) |
| 65 to 74 Years | 49 (9.1%) | 127 (22.4%) |
| 75 Years and over | 140 (37.5%) | 332 (50.1%) |
Disability Class: Self-Care Difficulty
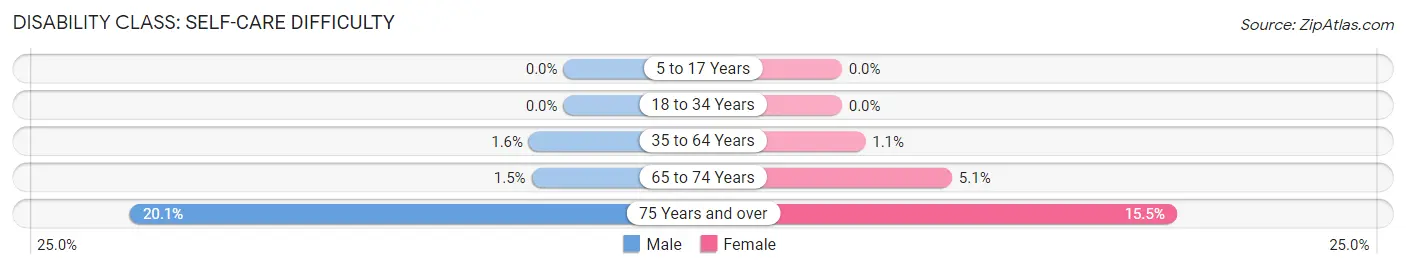
| Age Bracket | Male | Female |
| 5 to 17 Years | 0 (0.0%) | 0 (0.0%) |
| 18 to 34 Years | 0 (0.0%) | 0 (0.0%) |
| 35 to 64 Years | 45 (1.6%) | 29 (1.1%) |
| 65 to 74 Years | 8 (1.5%) | 29 (5.1%) |
| 75 Years and over | 75 (20.1%) | 103 (15.5%) |
Technology Access in North Druid Hills
Computing Device Access in North Druid Hills
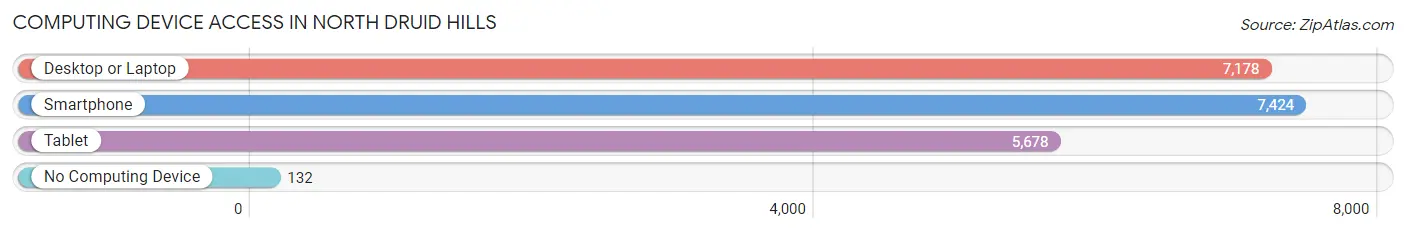
| Device Type | # Households | % Households |
| Desktop or Laptop | 7,178 | 91.7% |
| Smartphone | 7,424 | 94.8% |
| Tablet | 5,678 | 72.5% |
| No Computing Device | 132 | 1.7% |
| Total | 7,830 | 100.0% |
Internet Access in North Druid Hills
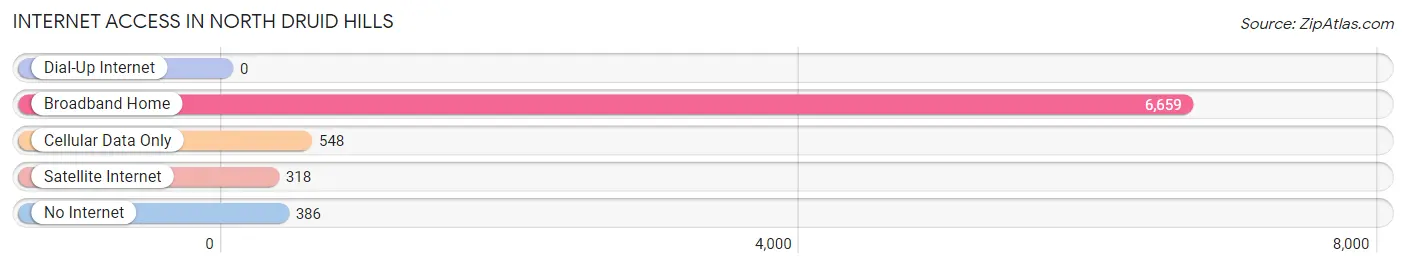
| Internet Type | # Households | % Households |
| Dial-Up Internet | 0 | 0.0% |
| Broadband Home | 6,659 | 85.0% |
| Cellular Data Only | 548 | 7.0% |
| Satellite Internet | 318 | 4.1% |
| No Internet | 386 | 4.9% |
| Total | 7,830 | 100.0% |
North Druid Hills Summary
History
North Druid Hills is a city located in DeKalb County, Georgia, United States. It is a suburb of Atlanta and is located just north of the city. The area was first settled in the early 1800s by settlers from the Cherokee Nation. The area was originally known as “Cherokee Hills” and was home to a small community of Cherokee Indians. The area was later renamed “North Druid Hills” in the late 1800s after the Druid Hills neighborhood in Atlanta.
The area was largely rural until the 1950s when it began to experience rapid growth due to its proximity to Atlanta. The area was annexed by the City of Atlanta in 1954 and became part of the city’s northern suburbs. The area experienced a population boom in the 1960s and 1970s as the city of Atlanta grew and the area became increasingly desirable for its proximity to the city.
Geography
North Druid Hills is located in DeKalb County, Georgia, just north of the city of Atlanta. It is bordered by the cities of Brookhaven, Chamblee, and Doraville to the north, and the city of Atlanta to the south. The area is located in the Piedmont region of Georgia and is characterized by rolling hills and dense forests. The area is home to several parks and recreational areas, including the North Druid Hills Nature Preserve, which is a popular destination for hikers and nature lovers.
Economy
North Druid Hills is home to a diverse economy. The area is home to a number of corporate headquarters, including the headquarters of the Coca-Cola Company, Delta Air Lines, and the Home Depot. The area is also home to a number of retail stores, restaurants, and other businesses. The area is also home to Emory University, which is one of the largest employers in the area.
Demographics
As of the 2010 census, the population of North Druid Hills was 15,845. The population is largely white (77.3%) and African American (17.2%). The median household income is $63,945 and the median home value is $310,000. The area is home to a number of educational institutions, including Emory University, Oglethorpe University, and Georgia State University. The area is also home to a number of churches, including the North Druid Hills United Methodist Church.
Common Questions
What is Per Capita Income in North Druid Hills?
Per Capita income in North Druid Hills is $58,604.
What is the Median Family Income in North Druid Hills?
Median Family Income in North Druid Hills is $124,132.
What is the Median Household income in North Druid Hills?
Median Household Income in North Druid Hills is $92,893.
What is Income or Wage Gap in North Druid Hills?
Income or Wage Gap in North Druid Hills is 31.6%.
Women in North Druid Hills earn 68.4 cents for every dollar earned by a man.
What is Inequality or Gini Index in North Druid Hills?
Inequality or Gini Index in North Druid Hills is 0.48.
What is the Total Population of North Druid Hills?
Total Population of North Druid Hills is 17,241.
What is the Total Male Population of North Druid Hills?
Total Male Population of North Druid Hills is 8,021.
What is the Total Female Population of North Druid Hills?
Total Female Population of North Druid Hills is 9,220.
What is the Ratio of Males per 100 Females in North Druid Hills?
There are 87.00 Males per 100 Females in North Druid Hills.
What is the Ratio of Females per 100 Males in North Druid Hills?
There are 114.95 Females per 100 Males in North Druid Hills.
What is the Median Population Age in North Druid Hills?
Median Population Age in North Druid Hills is 32.5 Years.
What is the Average Family Size in North Druid Hills
Average Family Size in North Druid Hills is 3.1 People.
What is the Average Household Size in North Druid Hills
Average Household Size in North Druid Hills is 2.1 People.
How Large is the Labor Force in North Druid Hills?
There are 10,655 People in the Labor Forcein in North Druid Hills.
What is the Percentage of People in the Labor Force in North Druid Hills?
72.2% of People are in the Labor Force in North Druid Hills.
What is the Unemployment Rate in North Druid Hills?
Unemployment Rate in North Druid Hills is 3.8%.