Village St George, LA Map & Demographics
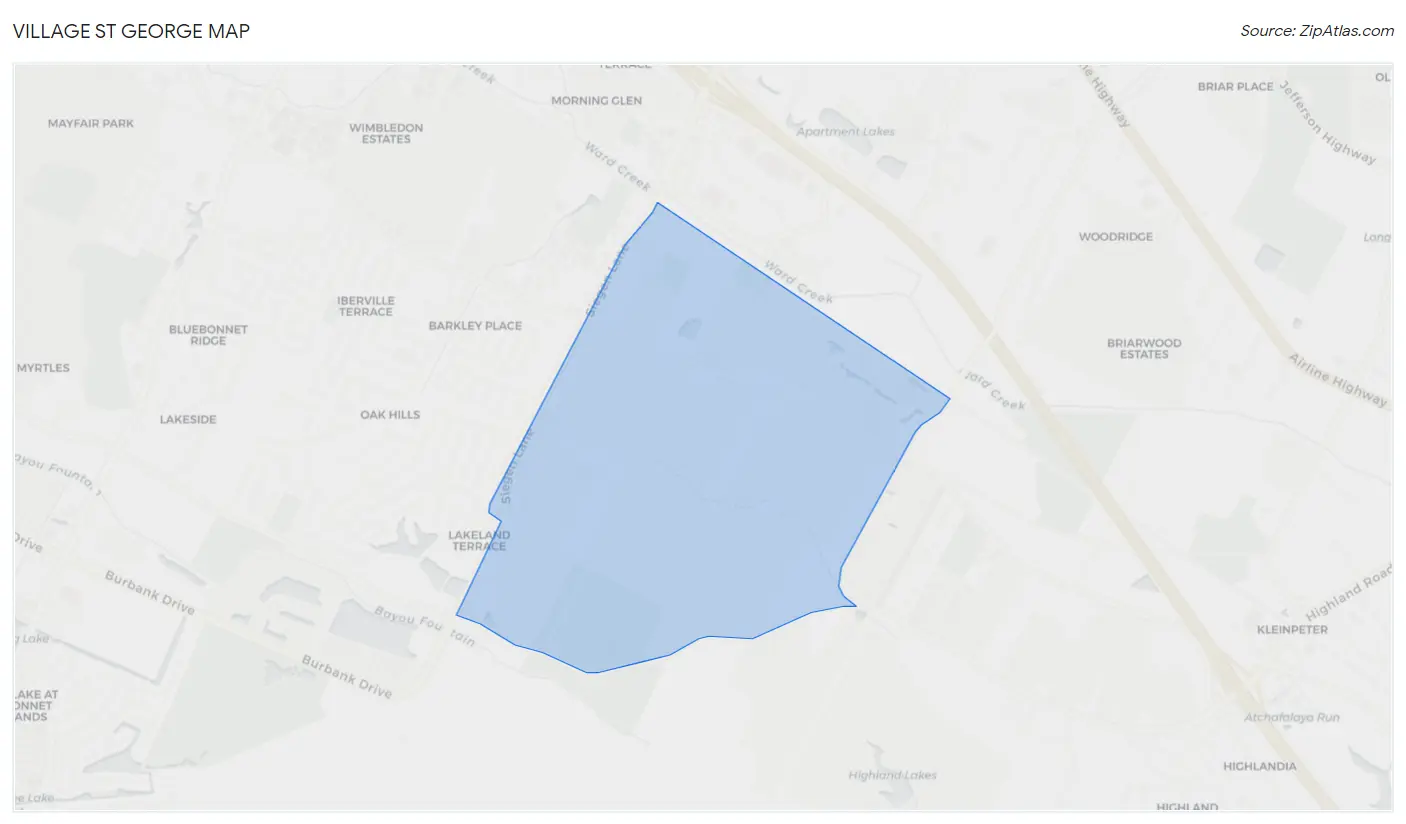
Village St George Map
Village St George Overview
$48,258
PER CAPITA INCOME
$115,179
AVG FAMILY INCOME
$96,971
AVG HOUSEHOLD INCOME
59.7%
WAGE / INCOME GAP [ % ]
40.3¢/ $1
WAGE / INCOME GAP [ $ ]
0.47
INEQUALITY / GINI INDEX
8,919
TOTAL POPULATION
4,219
MALE POPULATION
4,700
FEMALE POPULATION
89.77
MALES / 100 FEMALES
111.40
FEMALES / 100 MALES
36.8
MEDIAN AGE
3.5
AVG FAMILY SIZE
3.0
AVG HOUSEHOLD SIZE
4,796
LABOR FORCE [ PEOPLE ]
68.4%
PERCENT IN LABOR FORCE
3.5%
UNEMPLOYMENT RATE
Income in Village St George
Income Overview in Village St George
Per Capita Income in Village St George is $48,258, while median incomes of families and households are $115,179 and $96,971 respectively.
| Characteristic | Number | Measure |
| Per Capita Income | 8,919 | $48,258 |
| Median Family Income | 2,181 | $115,179 |
| Mean Family Income | 2,181 | $158,017 |
| Median Household Income | 2,924 | $96,971 |
| Mean Household Income | 2,924 | $139,187 |
| Income Deficit | 2,181 | $0 |
| Wage / Income Gap (%) | 8,919 | 59.68% |
| Wage / Income Gap ($) | 8,919 | 40.32¢ per $1 |
| Gini / Inequality Index | 8,919 | 0.47 |
Earnings by Sex in Village St George
Average Earnings in Village St George are $50,833, $78,331 for men and $31,580 for women, a difference of 59.7%.
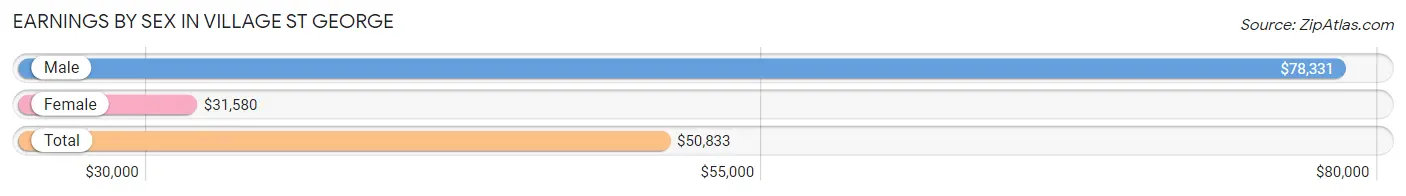
| Sex | Number | Average Earnings |
| Male | 2,513 (50.6%) | $78,331 |
| Female | 2,449 (49.4%) | $31,580 |
| Total | 4,962 (100.0%) | $50,833 |
Earnings by Sex by Income Bracket in Village St George
The most common earnings brackets in Village St George are $100,000+ for men (908 | 36.1%) and $30,000 to $34,999 for women (264 | 10.8%).
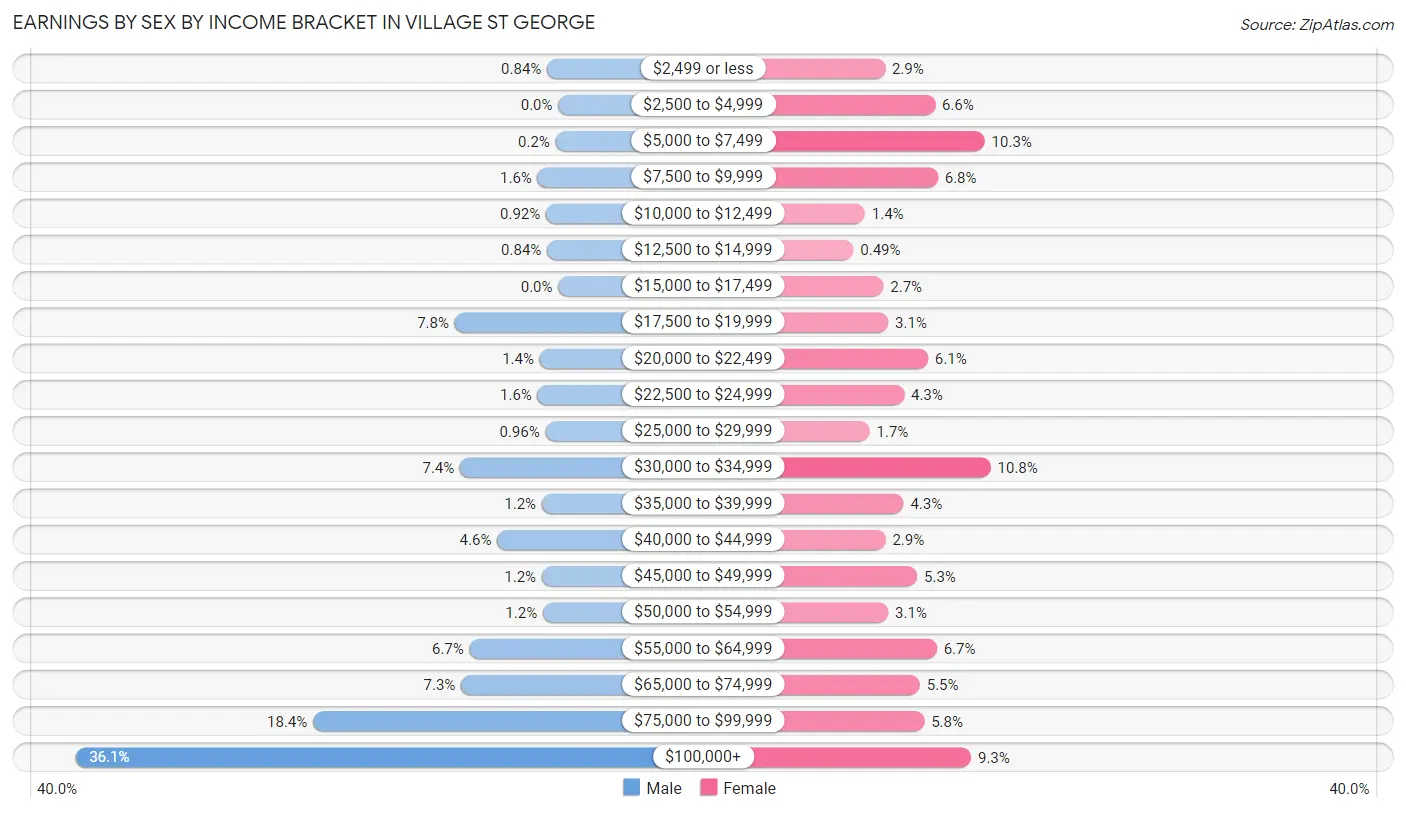
| Income | Male | Female |
| $2,499 or less | 21 (0.8%) | 70 (2.9%) |
| $2,500 to $4,999 | 0 (0.0%) | 162 (6.6%) |
| $5,000 to $7,499 | 5 (0.2%) | 253 (10.3%) |
| $7,500 to $9,999 | 39 (1.5%) | 167 (6.8%) |
| $10,000 to $12,499 | 23 (0.9%) | 33 (1.3%) |
| $12,500 to $14,999 | 21 (0.8%) | 12 (0.5%) |
| $15,000 to $17,499 | 0 (0.0%) | 67 (2.7%) |
| $17,500 to $19,999 | 195 (7.8%) | 76 (3.1%) |
| $20,000 to $22,499 | 35 (1.4%) | 149 (6.1%) |
| $22,500 to $24,999 | 39 (1.5%) | 105 (4.3%) |
| $25,000 to $29,999 | 24 (1.0%) | 42 (1.7%) |
| $30,000 to $34,999 | 185 (7.4%) | 264 (10.8%) |
| $35,000 to $39,999 | 31 (1.2%) | 104 (4.3%) |
| $40,000 to $44,999 | 115 (4.6%) | 71 (2.9%) |
| $45,000 to $49,999 | 31 (1.2%) | 129 (5.3%) |
| $50,000 to $54,999 | 29 (1.1%) | 76 (3.1%) |
| $55,000 to $64,999 | 167 (6.7%) | 165 (6.7%) |
| $65,000 to $74,999 | 183 (7.3%) | 134 (5.5%) |
| $75,000 to $99,999 | 462 (18.4%) | 142 (5.8%) |
| $100,000+ | 908 (36.1%) | 228 (9.3%) |
| Total | 2,513 (100.0%) | 2,449 (100.0%) |
Earnings by Sex by Educational Attainment in Village St George
Average earnings in Village St George are $79,802 for men and $36,799 for women, a difference of 53.9%. Men with an educational attainment of graduate degree enjoy the highest average annual earnings of $127,917, while those with college or associate's degree education earn the least with $70,417. Women with an educational attainment of graduate degree earn the most with the average annual earnings of $65,243, while those with bachelor's degree education have the smallest earnings of $36,524.
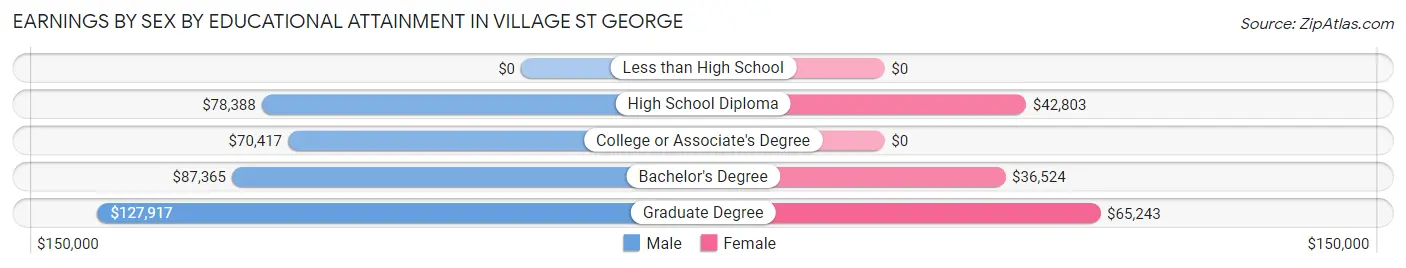
| Educational Attainment | Male Income | Female Income |
| Less than High School | - | - |
| High School Diploma | $78,388 | $42,803 |
| College or Associate's Degree | $70,417 | $0 |
| Bachelor's Degree | $87,365 | $36,524 |
| Graduate Degree | $127,917 | $65,243 |
| Total | $79,802 | $36,799 |
Family Income in Village St George
Family Income Brackets in Village St George
According to the Village St George family income data, there are 478 families falling into the $200,000+ income range, which is the most common income bracket and makes up 21.9% of all families. Conversely, the $10,000 to $14,999 income bracket is the least frequent group with only 13 families (0.6%) belonging to this category.
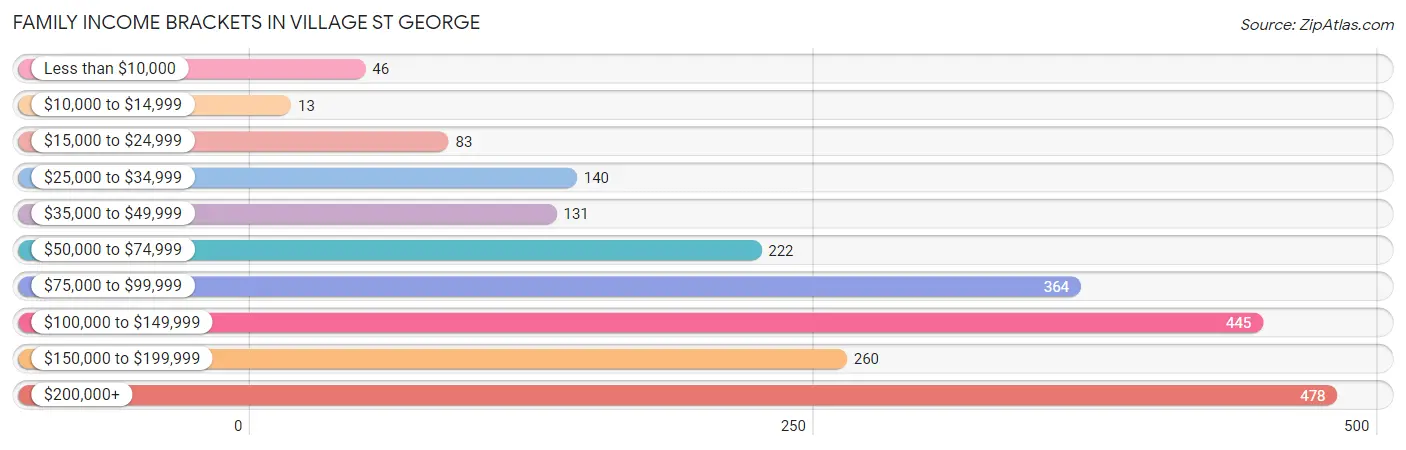
| Income Bracket | # Families | % Families |
| Less than $10,000 | 46 | 2.1% |
| $10,000 to $14,999 | 13 | 0.6% |
| $15,000 to $24,999 | 83 | 3.8% |
| $25,000 to $34,999 | 140 | 6.4% |
| $35,000 to $49,999 | 131 | 6.0% |
| $50,000 to $74,999 | 222 | 10.2% |
| $75,000 to $99,999 | 364 | 16.7% |
| $100,000 to $149,999 | 445 | 20.4% |
| $150,000 to $199,999 | 260 | 11.9% |
| $200,000+ | 478 | 21.9% |
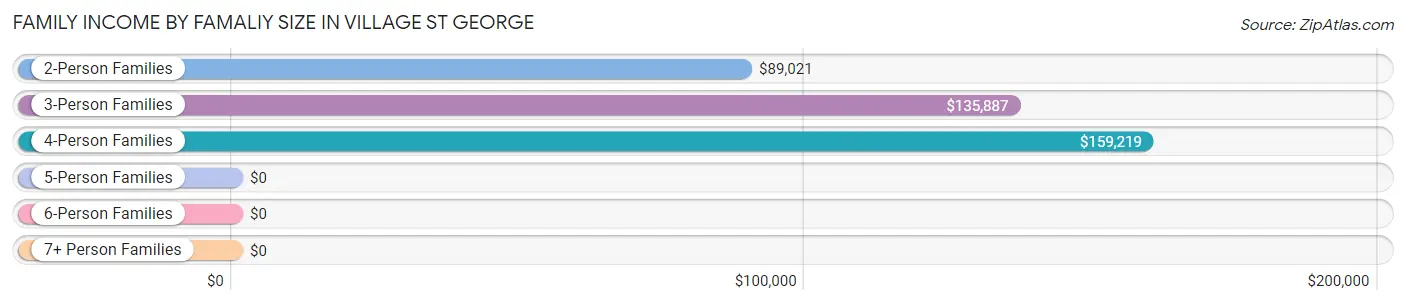
Family Income by Famaliy Size in Village St George
4-person families (445 | 20.4%) account for the highest median family income in Village St George with $159,219 per family, while 3-person families (478 | 21.9%) have the highest median income of $45,296 per family member.
| Income Bracket | # Families | Median Income |
| 2-Person Families | 957 (43.9%) | $89,021 |
| 3-Person Families | 478 (21.9%) | $135,887 |
| 4-Person Families | 445 (20.4%) | $159,219 |
| 5-Person Families | 238 (10.9%) | $0 |
| 6-Person Families | 5 (0.2%) | $0 |
| 7+ Person Families | 58 (2.7%) | $0 |
| Total | 2,181 (100.0%) | $115,179 |
Family Income by Number of Earners in Village St George
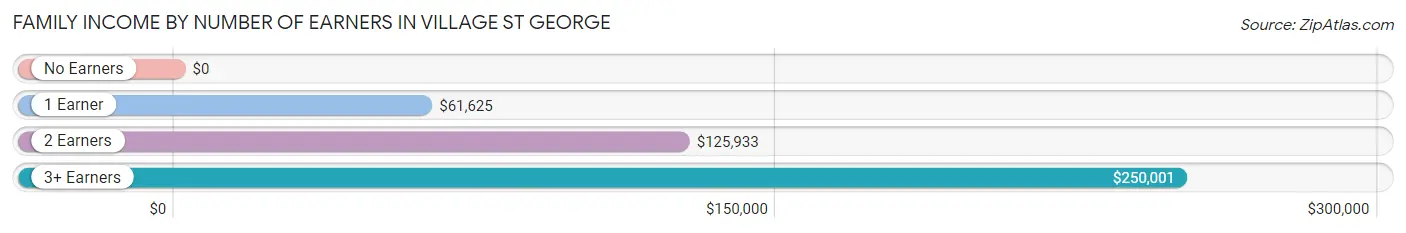
| Number of Earners | # Families | Median Income |
| No Earners | 214 (9.8%) | $0 |
| 1 Earner | 659 (30.2%) | $61,625 |
| 2 Earners | 1,028 (47.1%) | $125,933 |
| 3+ Earners | 280 (12.8%) | $250,001 |
| Total | 2,181 (100.0%) | $115,179 |
Household Income in Village St George
Household Income Brackets in Village St George
With 526 households falling in the category, the $100,000 to $149,999 income range is the most frequent in Village St George, accounting for 18.0% of all households. In contrast, only 23 households (0.8%) fall into the $10,000 to $14,999 income bracket, making it the least populous group.
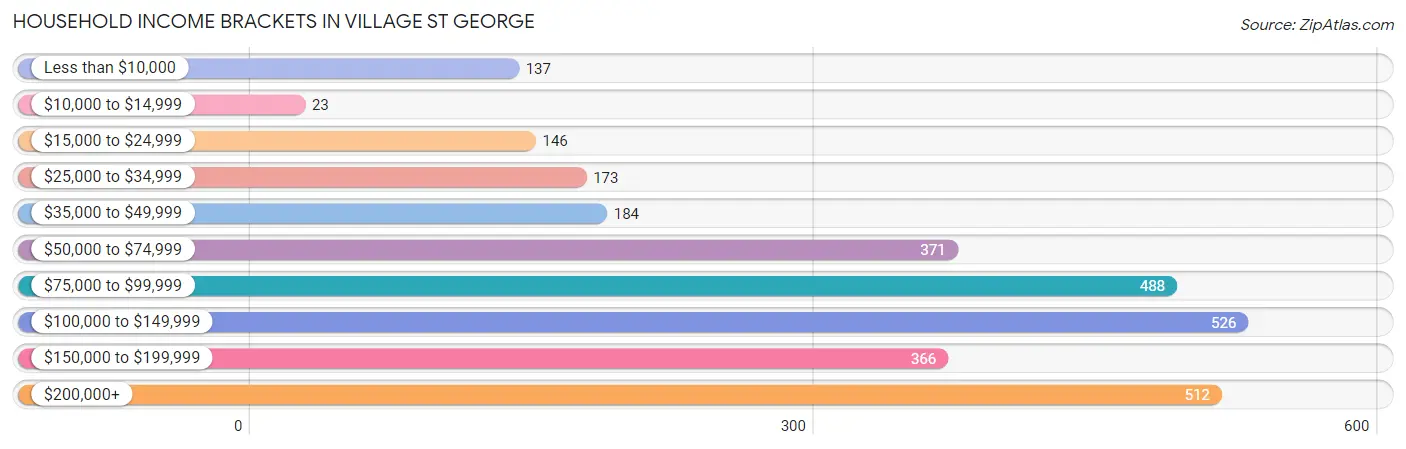
| Income Bracket | # Households | % Households |
| Less than $10,000 | 137 | 4.7% |
| $10,000 to $14,999 | 23 | 0.8% |
| $15,000 to $24,999 | 146 | 5.0% |
| $25,000 to $34,999 | 173 | 5.9% |
| $35,000 to $49,999 | 184 | 6.3% |
| $50,000 to $74,999 | 371 | 12.7% |
| $75,000 to $99,999 | 488 | 16.7% |
| $100,000 to $149,999 | 526 | 18.0% |
| $150,000 to $199,999 | 366 | 12.5% |
| $200,000+ | 512 | 17.5% |
Household Income by Householder Age in Village St George
The median household income in Village St George is $96,971, with the highest median household income of $129,750 found in the 45 to 64 years age bracket for the primary householder. A total of 1,134 households (38.8%) fall into this category. Meanwhile, the 15 to 24 years age bracket for the primary householder has the lowest median household income of $46,731, with 54 households (1.8%) in this group.
| Income Bracket | # Households | Median Income |
| 15 to 24 Years | 54 (1.8%) | $46,731 |
| 25 to 44 Years | 957 (32.7%) | $104,866 |
| 45 to 64 Years | 1,134 (38.8%) | $129,750 |
| 65+ Years | 779 (26.6%) | $66,683 |
| Total | 2,924 (100.0%) | $96,971 |
Poverty in Village St George
Income Below Poverty by Sex and Age in Village St George
With 3.5% poverty level for males and 4.6% for females among the residents of Village St George, 12 to 14 year old males and 55 to 64 year old females are the most vulnerable to poverty, with 19 males (24.4%) and 46 females (9.7%) in their respective age groups living below the poverty level.
| Age Bracket | Male | Female |
| Under 5 Years | 0 (0.0%) | 0 (0.0%) |
| 5 Years | 0 (0.0%) | 0 (0.0%) |
| 6 to 11 Years | 18 (2.6%) | 0 (0.0%) |
| 12 to 14 Years | 19 (24.4%) | 0 (0.0%) |
| 15 Years | 17 (16.8%) | 0 (0.0%) |
| 16 and 17 Years | 0 (0.0%) | 0 (0.0%) |
| 18 to 24 Years | 0 (0.0%) | 16 (2.4%) |
| 25 to 34 Years | 0 (0.0%) | 46 (8.6%) |
| 35 to 44 Years | 16 (3.1%) | 57 (9.1%) |
| 45 to 54 Years | 0 (0.0%) | 0 (0.0%) |
| 55 to 64 Years | 18 (4.2%) | 46 (9.7%) |
| 65 to 74 Years | 55 (16.6%) | 49 (7.6%) |
| 75 Years and over | 3 (2.8%) | 3 (1.5%) |
| Total | 146 (3.5%) | 217 (4.6%) |
Income Above Poverty by Sex and Age in Village St George
According to the poverty statistics in Village St George, males aged under 5 years and females aged under 5 years are the age groups that are most secure financially, with 100.0% of males and 100.0% of females in these age groups living above the poverty line.
| Age Bracket | Male | Female |
| Under 5 Years | 254 (100.0%) | 130 (100.0%) |
| 5 Years | 19 (100.0%) | 110 (100.0%) |
| 6 to 11 Years | 681 (97.4%) | 270 (100.0%) |
| 12 to 14 Years | 59 (75.6%) | 222 (100.0%) |
| 15 Years | 84 (83.2%) | 11 (100.0%) |
| 16 and 17 Years | 32 (100.0%) | 171 (100.0%) |
| 18 to 24 Years | 434 (100.0%) | 663 (97.6%) |
| 25 to 34 Years | 532 (100.0%) | 488 (91.4%) |
| 35 to 44 Years | 504 (96.9%) | 567 (90.9%) |
| 45 to 54 Years | 685 (100.0%) | 620 (100.0%) |
| 55 to 64 Years | 408 (95.8%) | 430 (90.3%) |
| 65 to 74 Years | 276 (83.4%) | 597 (92.4%) |
| 75 Years and over | 105 (97.2%) | 190 (98.5%) |
| Total | 4,073 (96.5%) | 4,469 (95.4%) |
Income Below Poverty Among Married-Couple Families in Village St George
The poverty statistics for married-couple families in Village St George show that 0.9% or 14 of the total 1,548 families live below the poverty line. Families with no children have the highest poverty rate of 1.5%, comprising of 14 families. On the other hand, families with 1 or 2 children have the lowest poverty rate of 0.0%, which includes 0 families.
| Children | Above Poverty | Below Poverty |
| No Children | 928 (98.5%) | 14 (1.5%) |
| 1 or 2 Children | 366 (100.0%) | 0 (0.0%) |
| 3 or 4 Children | 193 (100.0%) | 0 (0.0%) |
| 5 or more Children | 47 (100.0%) | 0 (0.0%) |
| Total | 1,534 (99.1%) | 14 (0.9%) |
Income Below Poverty Among Single-Parent Households in Village St George
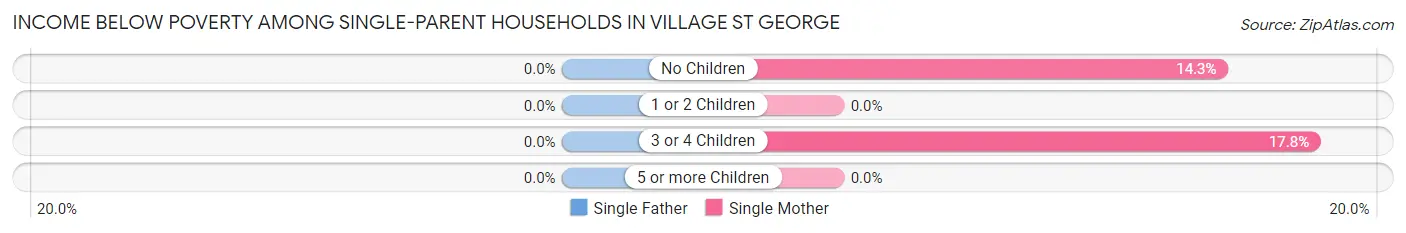
| Children | Single Father | Single Mother |
| No Children | 0 (0.0%) | 46 (14.3%) |
| 1 or 2 Children | 0 (0.0%) | 0 (0.0%) |
| 3 or 4 Children | 0 (0.0%) | 8 (17.8%) |
| 5 or more Children | 0 (0.0%) | 0 (0.0%) |
| Total | 0 (0.0%) | 54 (10.9%) |
Income Below Poverty Among Married-Couple vs Single-Parent Households in Village St George
The poverty data for Village St George shows that 14 of the married-couple family households (0.9%) and 54 of the single-parent households (8.5%) are living below the poverty level. Within the married-couple family households, those with no children have the highest poverty rate, with 14 households (1.5%) falling below the poverty line. Among the single-parent households, those with 3 or 4 children have the highest poverty rate, with 8 household (17.8%) living below poverty.
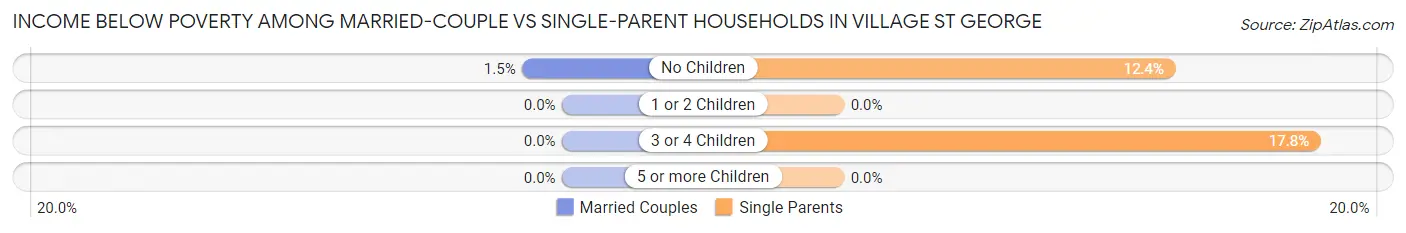
| Children | Married-Couple Families | Single-Parent Households |
| No Children | 14 (1.5%) | 46 (12.4%) |
| 1 or 2 Children | 0 (0.0%) | 0 (0.0%) |
| 3 or 4 Children | 0 (0.0%) | 8 (17.8%) |
| 5 or more Children | 0 (0.0%) | 0 (0.0%) |
| Total | 14 (0.9%) | 54 (8.5%) |
Race in Village St George
The most populous races in Village St George are White / Caucasian (4,587 | 51.4%), Black / African American (3,352 | 37.6%), and Two or more Races (506 | 5.7%).
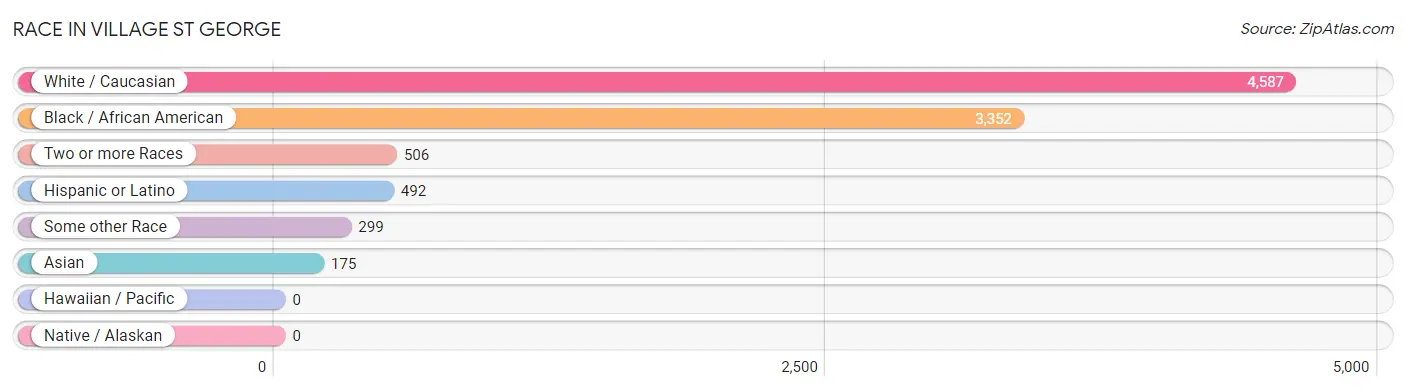
| Race | # Population | % Population |
| Asian | 175 | 2.0% |
| Black / African American | 3,352 | 37.6% |
| Hawaiian / Pacific | 0 | 0.0% |
| Hispanic or Latino | 492 | 5.5% |
| Native / Alaskan | 0 | 0.0% |
| White / Caucasian | 4,587 | 51.4% |
| Two or more Races | 506 | 5.7% |
| Some other Race | 299 | 3.4% |
| Total | 8,919 | 100.0% |
Ancestry in Village St George
The most populous ancestries reported in Village St George are American (1,377 | 15.4%), Irish (784 | 8.8%), English (655 | 7.3%), French (570 | 6.4%), and Scandinavian (523 | 5.9%), together accounting for 43.8% of all Village St George residents.
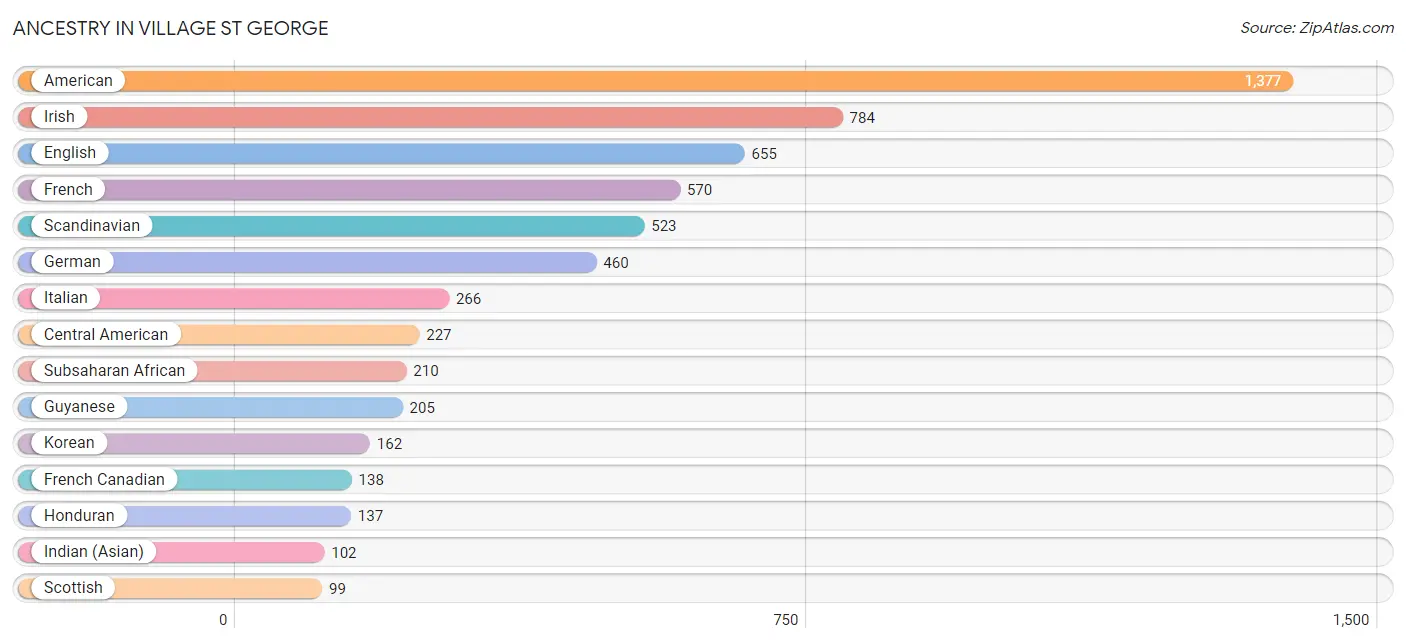
| Ancestry | # Population | % Population |
| African | 27 | 0.3% |
| American | 1,377 | 15.4% |
| Arab | 15 | 0.2% |
| Bahamian | 8 | 0.1% |
| Belgian | 15 | 0.2% |
| British | 40 | 0.4% |
| Cajun | 19 | 0.2% |
| Canadian | 18 | 0.2% |
| Central American | 227 | 2.5% |
| Choctaw | 3 | 0.0% |
| Colombian | 54 | 0.6% |
| Cuban | 48 | 0.5% |
| Czech | 8 | 0.1% |
| Dominican | 4 | 0.0% |
| Dutch | 41 | 0.5% |
| Eastern European | 8 | 0.1% |
| Ecuadorian | 7 | 0.1% |
| English | 655 | 7.3% |
| European | 76 | 0.9% |
| Finnish | 14 | 0.2% |
| French | 570 | 6.4% |
| French Canadian | 138 | 1.5% |
| German | 460 | 5.2% |
| Greek | 11 | 0.1% |
| Guatemalan | 28 | 0.3% |
| Guyanese | 205 | 2.3% |
| Haitian | 21 | 0.2% |
| Honduran | 137 | 1.5% |
| Houma | 5 | 0.1% |
| Hungarian | 7 | 0.1% |
| Indian (Asian) | 102 | 1.1% |
| Iranian | 23 | 0.3% |
| Irish | 784 | 8.8% |
| Iroquois | 9 | 0.1% |
| Italian | 266 | 3.0% |
| Korean | 162 | 1.8% |
| Latvian | 8 | 0.1% |
| Lebanese | 15 | 0.2% |
| Lithuanian | 12 | 0.1% |
| Mexican | 28 | 0.3% |
| Nicaraguan | 43 | 0.5% |
| Northern European | 2 | 0.0% |
| Norwegian | 21 | 0.2% |
| Panamanian | 7 | 0.1% |
| Peruvian | 26 | 0.3% |
| Polish | 38 | 0.4% |
| Portuguese | 11 | 0.1% |
| Puerto Rican | 73 | 0.8% |
| Russian | 15 | 0.2% |
| Salvadoran | 12 | 0.1% |
| Scandinavian | 523 | 5.9% |
| Scotch-Irish | 37 | 0.4% |
| Scottish | 99 | 1.1% |
| Slovak | 31 | 0.4% |
| South American | 87 | 1.0% |
| Spaniard | 3 | 0.0% |
| Spanish | 5 | 0.1% |
| Sri Lankan | 21 | 0.2% |
| Subsaharan African | 210 | 2.4% |
| Swedish | 28 | 0.3% |
| Ugandan | 20 | 0.2% |
| Ukrainian | 50 | 0.6% |
| Welsh | 49 | 0.5% | View All 63 Rows |
Immigrants in Village St George
The most numerous immigrant groups reported in Village St George came from Latin America (277 | 3.1%), Guyana (205 | 2.3%), South America (205 | 2.3%), Asia (169 | 1.9%), and Africa (161 | 1.8%), together accounting for 11.4% of all Village St George residents.
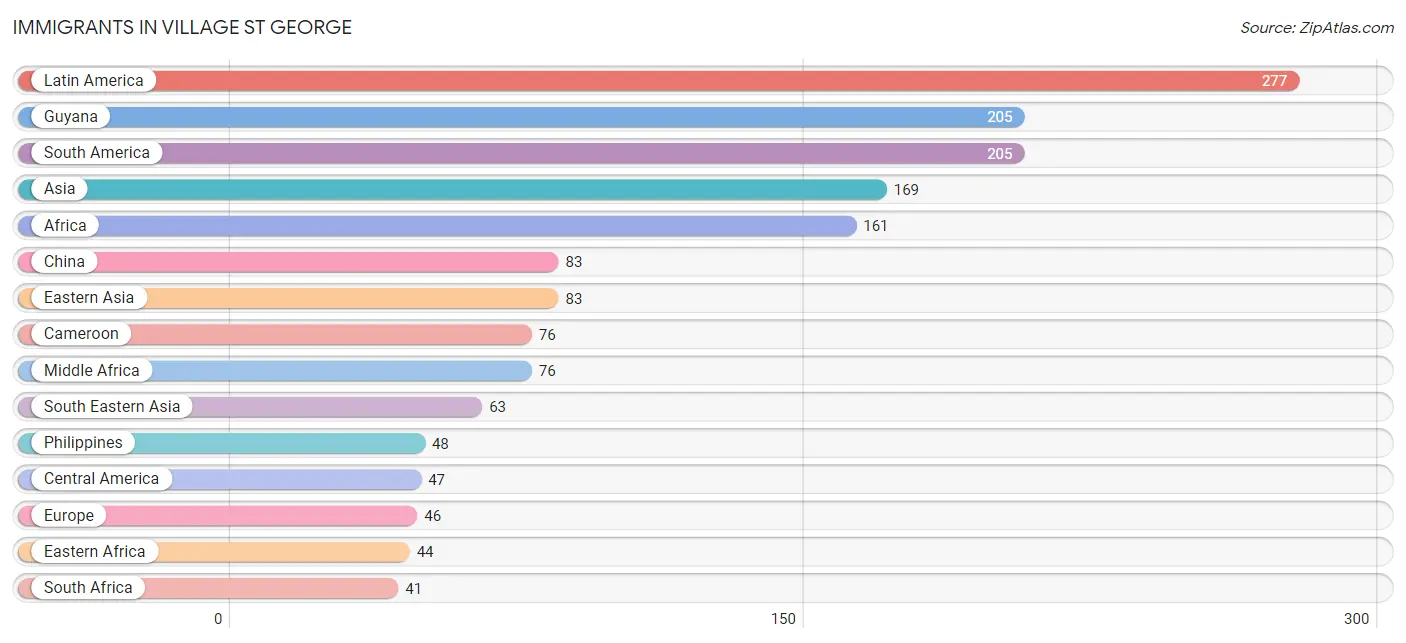
| Immigration Origin | # Population | % Population |
| Africa | 161 | 1.8% |
| Asia | 169 | 1.9% |
| Cameroon | 76 | 0.9% |
| Caribbean | 25 | 0.3% |
| Central America | 47 | 0.5% |
| China | 83 | 0.9% |
| Dominican Republic | 4 | 0.0% |
| Eastern Africa | 44 | 0.5% |
| Eastern Asia | 83 | 0.9% |
| Eastern Europe | 38 | 0.4% |
| Europe | 46 | 0.5% |
| Guatemala | 19 | 0.2% |
| Guyana | 205 | 2.3% |
| Haiti | 21 | 0.2% |
| Iran | 23 | 0.3% |
| Laos | 2 | 0.0% |
| Latin America | 277 | 3.1% |
| Lithuania | 8 | 0.1% |
| Mexico | 11 | 0.1% |
| Middle Africa | 76 | 0.9% |
| Nicaragua | 10 | 0.1% |
| Northern Europe | 8 | 0.1% |
| Panama | 7 | 0.1% |
| Philippines | 48 | 0.5% |
| Russia | 15 | 0.2% |
| Scotland | 8 | 0.1% |
| South Africa | 41 | 0.5% |
| South America | 205 | 2.3% |
| South Central Asia | 23 | 0.3% |
| South Eastern Asia | 63 | 0.7% |
| Uganda | 20 | 0.2% |
| Ukraine | 15 | 0.2% |
| Vietnam | 13 | 0.2% | View All 33 Rows |
Sex and Age in Village St George
Sex and Age in Village St George
The most populous age groups in Village St George are 50 to 54 Years (498 | 11.8%) for men and 20 to 24 Years (597 | 12.7%) for women.
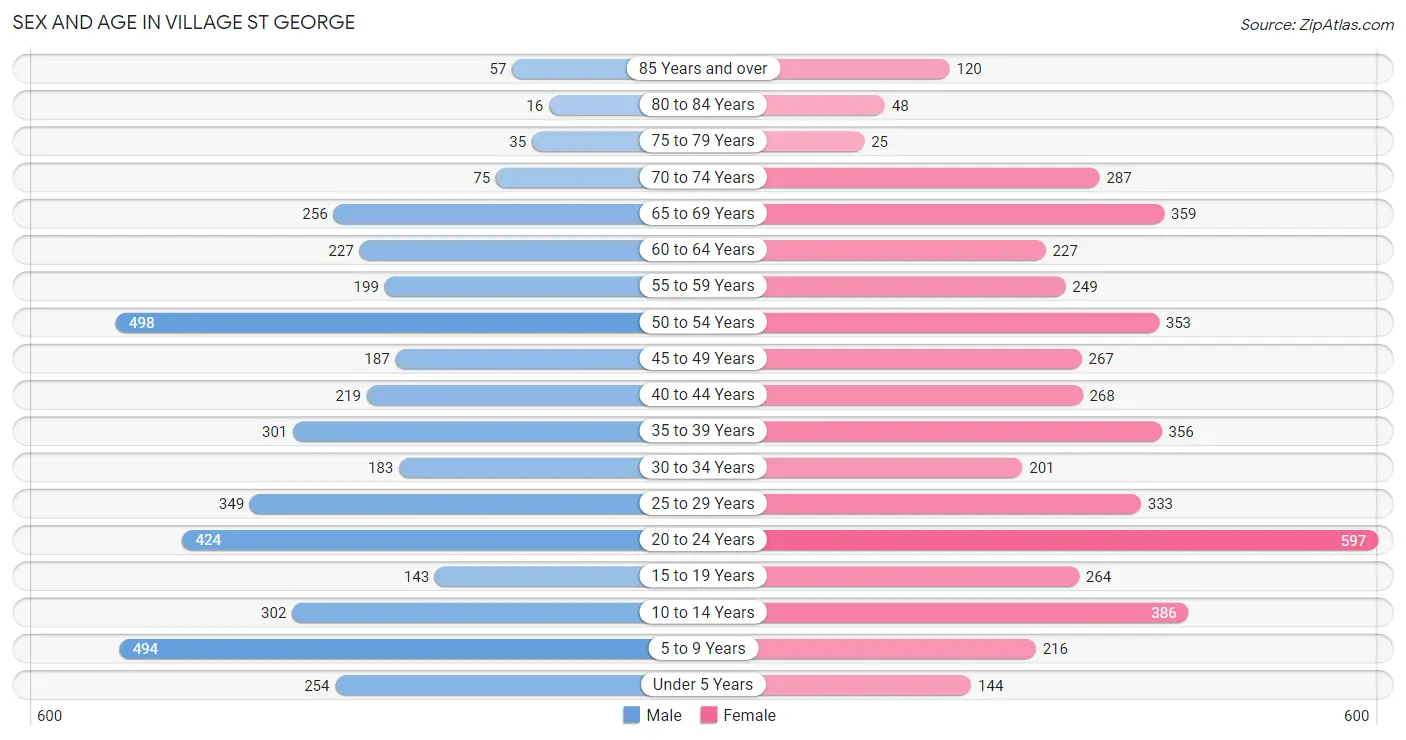
| Age Bracket | Male | Female |
| Under 5 Years | 254 (6.0%) | 144 (3.1%) |
| 5 to 9 Years | 494 (11.7%) | 216 (4.6%) |
| 10 to 14 Years | 302 (7.2%) | 386 (8.2%) |
| 15 to 19 Years | 143 (3.4%) | 264 (5.6%) |
| 20 to 24 Years | 424 (10.1%) | 597 (12.7%) |
| 25 to 29 Years | 349 (8.3%) | 333 (7.1%) |
| 30 to 34 Years | 183 (4.3%) | 201 (4.3%) |
| 35 to 39 Years | 301 (7.1%) | 356 (7.6%) |
| 40 to 44 Years | 219 (5.2%) | 268 (5.7%) |
| 45 to 49 Years | 187 (4.4%) | 267 (5.7%) |
| 50 to 54 Years | 498 (11.8%) | 353 (7.5%) |
| 55 to 59 Years | 199 (4.7%) | 249 (5.3%) |
| 60 to 64 Years | 227 (5.4%) | 227 (4.8%) |
| 65 to 69 Years | 256 (6.1%) | 359 (7.6%) |
| 70 to 74 Years | 75 (1.8%) | 287 (6.1%) |
| 75 to 79 Years | 35 (0.8%) | 25 (0.5%) |
| 80 to 84 Years | 16 (0.4%) | 48 (1.0%) |
| 85 Years and over | 57 (1.3%) | 120 (2.5%) |
| Total | 4,219 (100.0%) | 4,700 (100.0%) |
Families and Households in Village St George
Median Family Size in Village St George
The median family size in Village St George is 3.50 persons per family, with single female/mother families (497 | 22.8%) accounting for the largest median family size of 3.67 persons per family. On the other hand, single male/father families (136 | 6.2%) represent the smallest median family size with 2.75 persons per family.
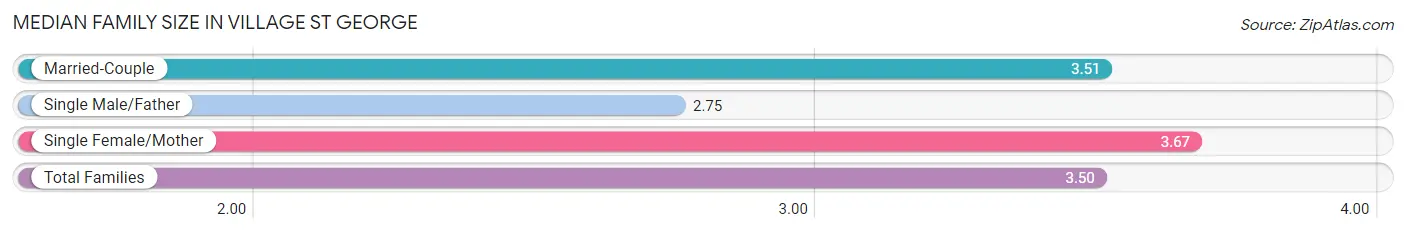
| Family Type | # Families | Family Size |
| Married-Couple | 1,548 (71.0%) | 3.51 |
| Single Male/Father | 136 (6.2%) | 2.75 |
| Single Female/Mother | 497 (22.8%) | 3.67 |
| Total Families | 2,181 (100.0%) | 3.50 |
Median Household Size in Village St George
The median household size in Village St George is 3.04 persons per household, with single male/father households (136 | 4.6%) accounting for the largest median household size of 3.76 persons per household. non-family households (743 | 25.4%) represent the smallest median household size with 1.43 persons per household.
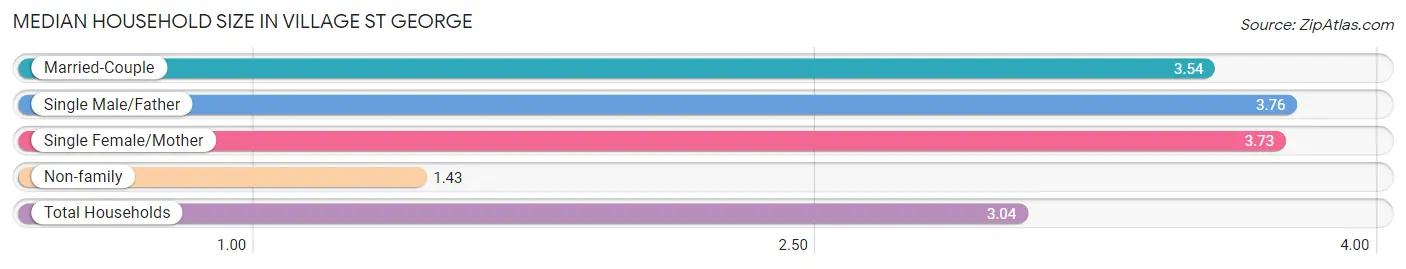
| Household Type | # Households | Household Size |
| Married-Couple | 1,548 (52.9%) | 3.54 |
| Single Male/Father | 136 (4.6%) | 3.76 |
| Single Female/Mother | 497 (17.0%) | 3.73 |
| Non-family | 743 (25.4%) | 1.43 |
| Total Households | 2,924 (100.0%) | 3.04 |
Household Size by Marriage Status in Village St George
Out of a total of 2,924 households in Village St George, 2,181 (74.6%) are family households, while 743 (25.4%) are nonfamily households. The most numerous type of family households are 2-person households, comprising 877, and the most common type of nonfamily households are 1-person households, comprising 520.
| Household Size | Family Households | Nonfamily Households |
| 1-Person Households | - | 520 (17.8%) |
| 2-Person Households | 877 (30.0%) | 194 (6.6%) |
| 3-Person Households | 516 (17.6%) | 17 (0.6%) |
| 4-Person Households | 487 (16.7%) | 12 (0.4%) |
| 5-Person Households | 238 (8.1%) | 0 (0.0%) |
| 6-Person Households | 5 (0.2%) | 0 (0.0%) |
| 7+ Person Households | 58 (2.0%) | 0 (0.0%) |
| Total | 2,181 (74.6%) | 743 (25.4%) |
Female Fertility in Village St George
Fertility by Age in Village St George
Average fertility rate in Village St George is 76.0 births per 1,000 women. Women in the age bracket of 35 to 50 years have the highest fertility rate with 87.0 births per 1,000 women. Women in the age bracket of 20 to 34 years acount for 54.3% of all women with births.
| Age Bracket | Women with Births | Births / 1,000 Women |
| 15 to 19 years | 0 (0.0%) | 0.0 |
| 20 to 34 years | 95 (54.3%) | 84.0 |
| 35 to 50 years | 80 (45.7%) | 87.0 |
| Total | 175 (100.0%) | 76.0 |
Fertility by Age by Marriage Status in Village St George
91.4% of women with births (175) in Village St George are married. The highest percentage of unmarried women with births falls into 20 to 34 years age bracket with 15.8% of them unmarried at the time of birth, while the lowest percentage of unmarried women with births belong to 35 to 50 years age bracket with 0.0% of them unmarried.
| Age Bracket | Married | Unmarried |
| 15 to 19 years | 0 (0.0%) | 0 (0.0%) |
| 20 to 34 years | 80 (84.2%) | 15 (15.8%) |
| 35 to 50 years | 80 (100.0%) | 0 (0.0%) |
| Total | 160 (91.4%) | 15 (8.6%) |
Fertility by Education in Village St George
| Educational Attainment | Women with Births | Births / 1,000 Women |
| Less than High School | 0 (0.0%) | 0.0 |
| High School Diploma | 15 (8.6%) | 34.0 |
| College or Associate's Degree | 130 (74.3%) | 161.0 |
| Bachelor's Degree | 15 (8.6%) | 25.0 |
| Graduate Degree | 15 (8.6%) | 41.0 |
| Total | 175 (100.0%) | 76.0 |
Fertility by Education by Marriage Status in Village St George
8.6% of women with births in Village St George are unmarried. Women with the educational attainment of college or associate's degree are most likely to be married with 100.0% of them married at childbirth, while women with the educational attainment of high school diploma are least likely to be married with 100.0% of them unmarried at childbirth.
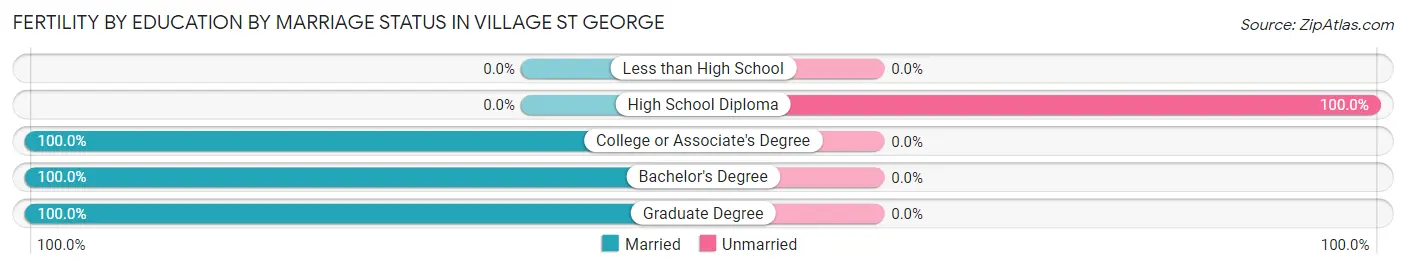
| Educational Attainment | Married | Unmarried |
| Less than High School | 0 (0.0%) | 0 (0.0%) |
| High School Diploma | 0 (0.0%) | 15 (100.0%) |
| College or Associate's Degree | 130 (100.0%) | 0 (0.0%) |
| Bachelor's Degree | 15 (100.0%) | 0 (0.0%) |
| Graduate Degree | 15 (100.0%) | 0 (0.0%) |
| Total | 160 (91.4%) | 15 (8.6%) |
Employment Characteristics in Village St George
Employment by Class of Employer in Village St George
Among the 4,568 employed individuals in Village St George, private company employees (3,418 | 74.8%), not-for-profit organizations (395 | 8.6%), and state government employees (340 | 7.4%) make up the most common classes of employment.
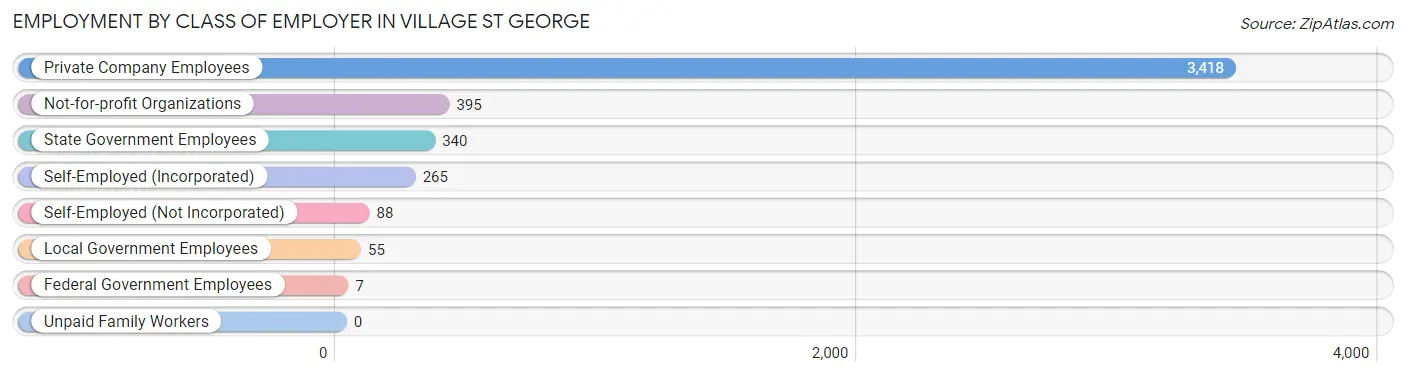
| Employer Class | # Employees | % Employees |
| Private Company Employees | 3,418 | 74.8% |
| Self-Employed (Incorporated) | 265 | 5.8% |
| Self-Employed (Not Incorporated) | 88 | 1.9% |
| Not-for-profit Organizations | 395 | 8.6% |
| Local Government Employees | 55 | 1.2% |
| State Government Employees | 340 | 7.4% |
| Federal Government Employees | 7 | 0.2% |
| Unpaid Family Workers | 0 | 0.0% |
| Total | 4,568 | 100.0% |
Employment Status by Age in Village St George
According to the labor force statistics for Village St George, out of the total population over 16 years of age (7,011), 68.4% or 4,796 individuals are in the labor force, with 3.5% or 168 of them unemployed. The age group with the highest labor force participation rate is 35 to 44 years, with 91.8% or 1,050 individuals in the labor force. Within the labor force, the 25 to 29 years age range has the highest percentage of unemployed individuals, with 14.0% or 83 of them being unemployed.
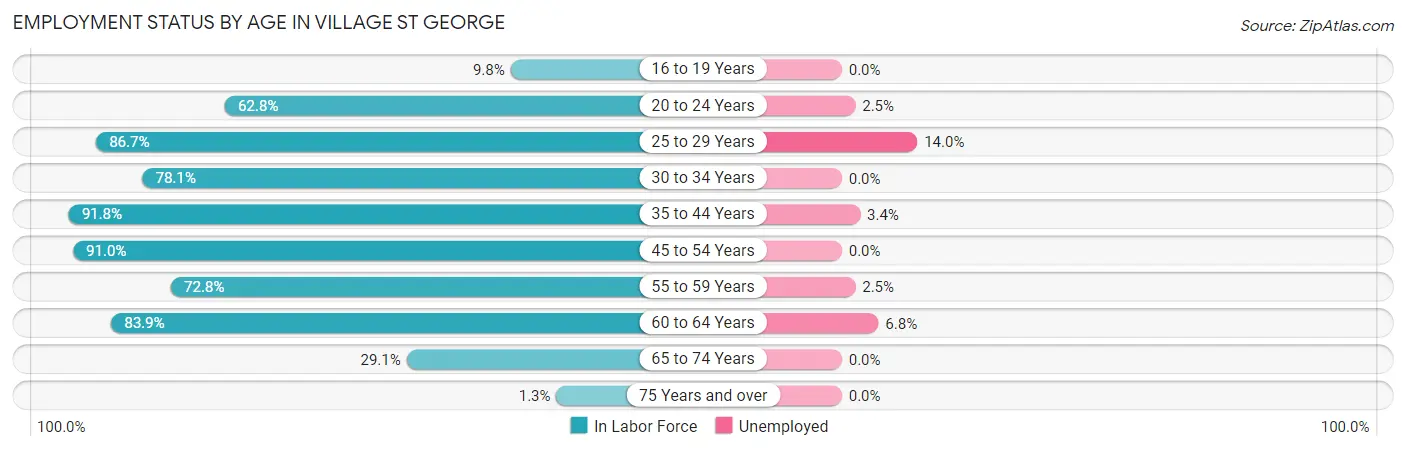
| Age Bracket | In Labor Force | Unemployed |
| 16 to 19 Years | 29 (9.8%) | 0 (0.0%) |
| 20 to 24 Years | 641 (62.8%) | 16 (2.5%) |
| 25 to 29 Years | 591 (86.7%) | 83 (14.0%) |
| 30 to 34 Years | 300 (78.1%) | 0 (0.0%) |
| 35 to 44 Years | 1,050 (91.8%) | 36 (3.4%) |
| 45 to 54 Years | 1,188 (91.0%) | 0 (0.0%) |
| 55 to 59 Years | 326 (72.8%) | 8 (2.5%) |
| 60 to 64 Years | 381 (83.9%) | 26 (6.8%) |
| 65 to 74 Years | 284 (29.1%) | 0 (0.0%) |
| 75 Years and over | 4 (1.3%) | 0 (0.0%) |
| Total | 4,796 (68.4%) | 168 (3.5%) |
Employment Status by Educational Attainment in Village St George
According to labor force statistics for Village St George, 86.8% of individuals (3,834) out of the total population between 25 and 64 years of age (4,417) are in the labor force, with 4.0% or 153 of them being unemployed. The group with the highest labor force participation rate are those with the educational attainment of bachelor's degree or higher, with 92.4% or 1,996 individuals in the labor force. Within the labor force, individuals with less than high school education have the highest percentage of unemployment, with 57.1% or 8 of them being unemployed.
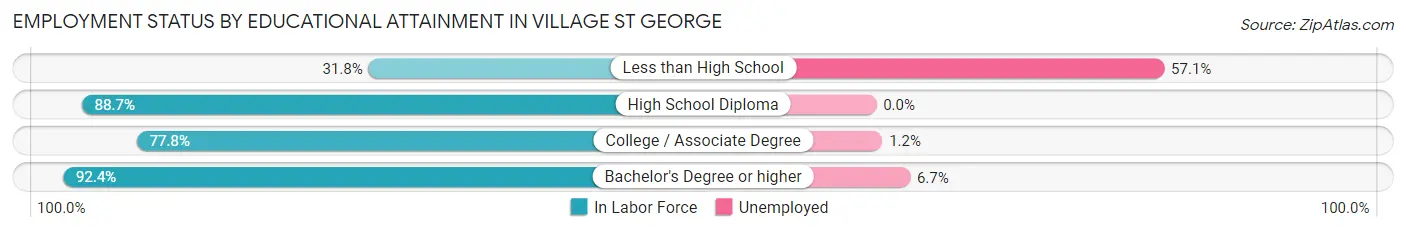
| Educational Attainment | In Labor Force | Unemployed |
| Less than High School | 14 (31.8%) | 25 (57.1%) |
| High School Diploma | 854 (88.7%) | 0 (0.0%) |
| College / Associate Degree | 972 (77.8%) | 15 (1.2%) |
| Bachelor's Degree or higher | 1,996 (92.4%) | 145 (6.7%) |
| Total | 3,834 (86.8%) | 177 (4.0%) |
Employment Occupations by Sex in Village St George
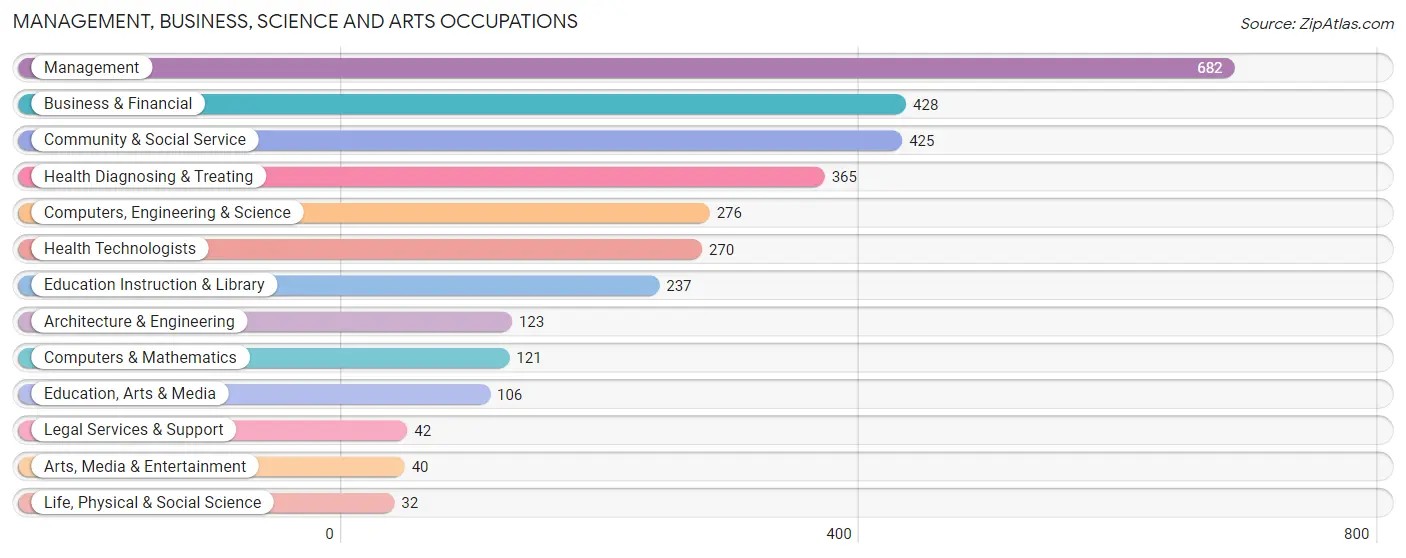
Management, Business, Science and Arts Occupations
The most common Management, Business, Science and Arts occupations in Village St George are Management (682 | 14.7%), Business & Financial (428 | 9.3%), Community & Social Service (425 | 9.2%), Health Diagnosing & Treating (365 | 7.9%), and Computers, Engineering & Science (276 | 6.0%).
Management, Business, Science and Arts Occupations by Sex
Within the Management, Business, Science and Arts occupations in Village St George, the most male-oriented occupations are Architecture & Engineering (87.8%), Computers & Mathematics (86.8%), and Management (81.7%), while the most female-oriented occupations are Arts, Media & Entertainment (100.0%), Health Technologists (88.5%), and Education Instruction & Library (83.1%).
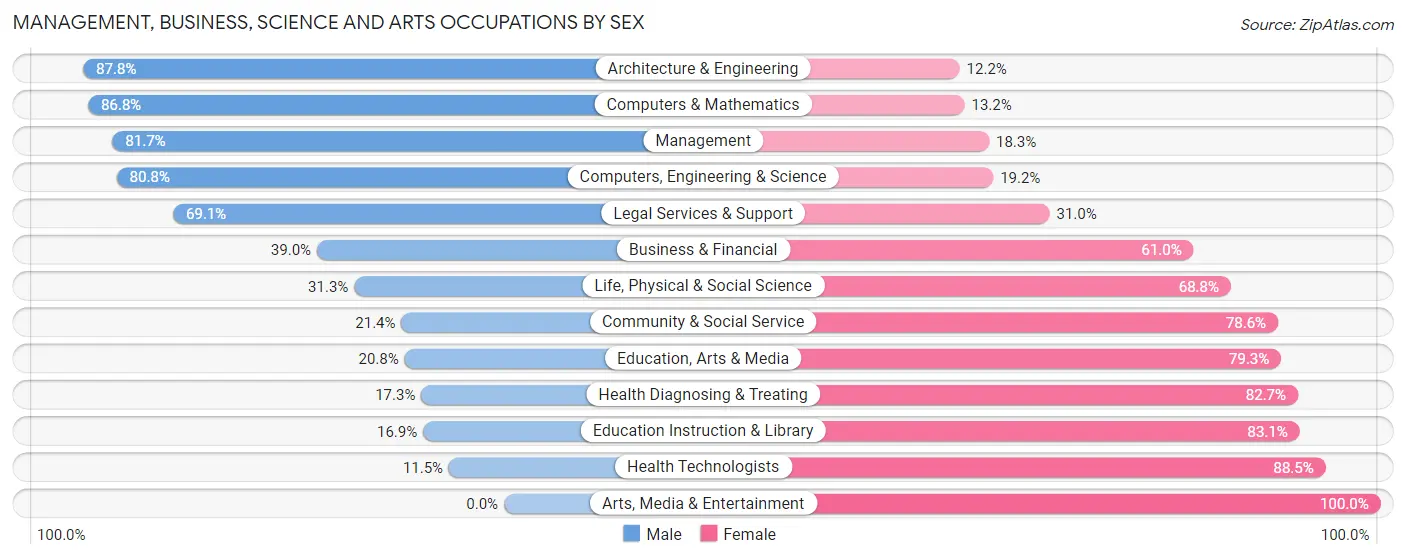
| Occupation | Male | Female |
| Management | 557 (81.7%) | 125 (18.3%) |
| Business & Financial | 167 (39.0%) | 261 (61.0%) |
| Computers, Engineering & Science | 223 (80.8%) | 53 (19.2%) |
| Computers & Mathematics | 105 (86.8%) | 16 (13.2%) |
| Architecture & Engineering | 108 (87.8%) | 15 (12.2%) |
| Life, Physical & Social Science | 10 (31.2%) | 22 (68.8%) |
| Community & Social Service | 91 (21.4%) | 334 (78.6%) |
| Education, Arts & Media | 22 (20.7%) | 84 (79.2%) |
| Legal Services & Support | 29 (69.1%) | 13 (30.9%) |
| Education Instruction & Library | 40 (16.9%) | 197 (83.1%) |
| Arts, Media & Entertainment | 0 (0.0%) | 40 (100.0%) |
| Health Diagnosing & Treating | 63 (17.3%) | 302 (82.7%) |
| Health Technologists | 31 (11.5%) | 239 (88.5%) |
| Total (Category) | 1,101 (50.6%) | 1,075 (49.4%) |
| Total (Overall) | 2,418 (52.3%) | 2,206 (47.7%) |
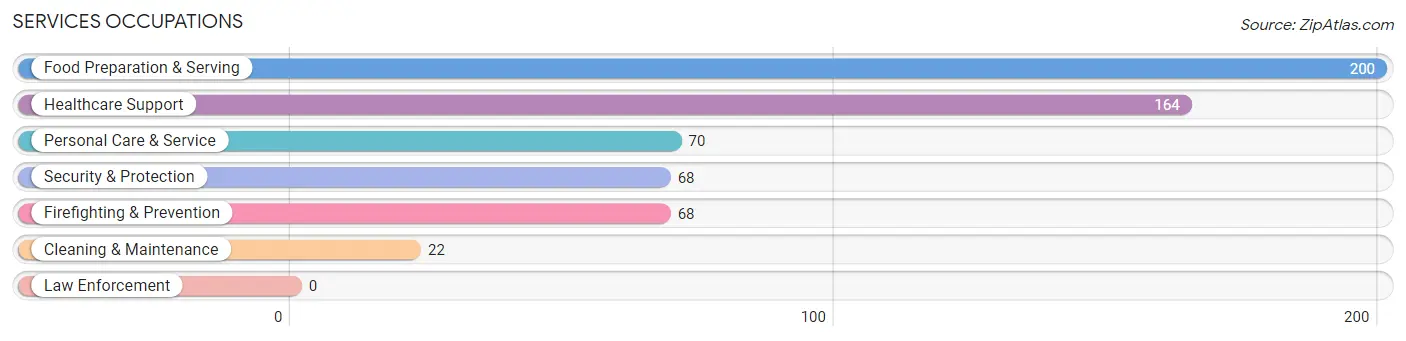
Services Occupations
The most common Services occupations in Village St George are Food Preparation & Serving (200 | 4.3%), Healthcare Support (164 | 3.5%), Personal Care & Service (70 | 1.5%), Security & Protection (68 | 1.5%), and Firefighting & Prevention (68 | 1.5%).
Services Occupations by Sex
Within the Services occupations in Village St George, the most male-oriented occupations are Cleaning & Maintenance (100.0%), Food Preparation & Serving (64.5%), and Security & Protection (19.1%), while the most female-oriented occupations are Personal Care & Service (100.0%), Healthcare Support (85.4%), and Security & Protection (80.9%).
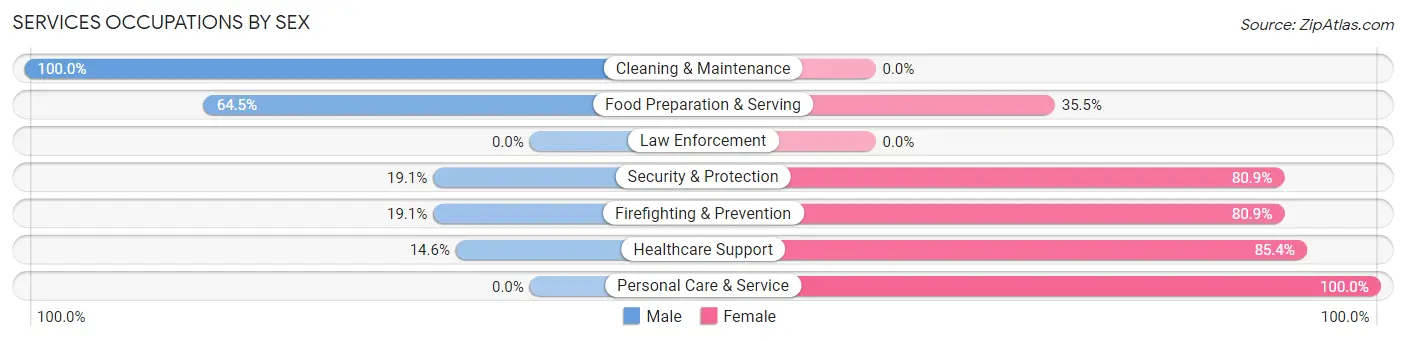
| Occupation | Male | Female |
| Healthcare Support | 24 (14.6%) | 140 (85.4%) |
| Security & Protection | 13 (19.1%) | 55 (80.9%) |
| Firefighting & Prevention | 13 (19.1%) | 55 (80.9%) |
| Law Enforcement | 0 (0.0%) | 0 (0.0%) |
| Food Preparation & Serving | 129 (64.5%) | 71 (35.5%) |
| Cleaning & Maintenance | 22 (100.0%) | 0 (0.0%) |
| Personal Care & Service | 0 (0.0%) | 70 (100.0%) |
| Total (Category) | 188 (35.9%) | 336 (64.1%) |
| Total (Overall) | 2,418 (52.3%) | 2,206 (47.7%) |
Sales and Office Occupations
The most common Sales and Office occupations in Village St George are Office & Administration (854 | 18.5%), and Sales & Related (347 | 7.5%).

Sales and Office Occupations by Sex

| Occupation | Male | Female |
| Sales & Related | 232 (66.9%) | 115 (33.1%) |
| Office & Administration | 288 (33.7%) | 566 (66.3%) |
| Total (Category) | 520 (43.3%) | 681 (56.7%) |
| Total (Overall) | 2,418 (52.3%) | 2,206 (47.7%) |
Natural Resources, Construction and Maintenance Occupations
The most common Natural Resources, Construction and Maintenance occupations in Village St George are Construction & Extraction (57 | 1.2%), and Installation, Maintenance & Repair (49 | 1.1%).

Natural Resources, Construction and Maintenance Occupations by Sex

| Occupation | Male | Female |
| Farming, Fishing & Forestry | 0 (0.0%) | 0 (0.0%) |
| Construction & Extraction | 57 (100.0%) | 0 (0.0%) |
| Installation, Maintenance & Repair | 49 (100.0%) | 0 (0.0%) |
| Total (Category) | 106 (100.0%) | 0 (0.0%) |
| Total (Overall) | 2,418 (52.3%) | 2,206 (47.7%) |
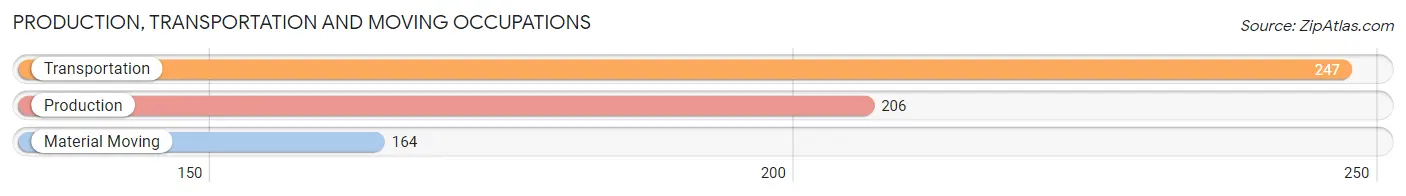
Production, Transportation and Moving Occupations
The most common Production, Transportation and Moving occupations in Village St George are Transportation (247 | 5.3%), Production (206 | 4.5%), and Material Moving (164 | 3.5%).
Production, Transportation and Moving Occupations by Sex
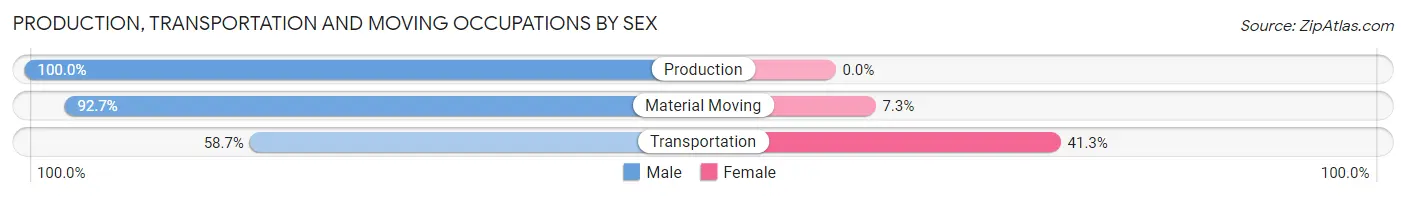
| Occupation | Male | Female |
| Production | 206 (100.0%) | 0 (0.0%) |
| Transportation | 145 (58.7%) | 102 (41.3%) |
| Material Moving | 152 (92.7%) | 12 (7.3%) |
| Total (Category) | 503 (81.5%) | 114 (18.5%) |
| Total (Overall) | 2,418 (52.3%) | 2,206 (47.7%) |
Employment Industries by Sex in Village St George
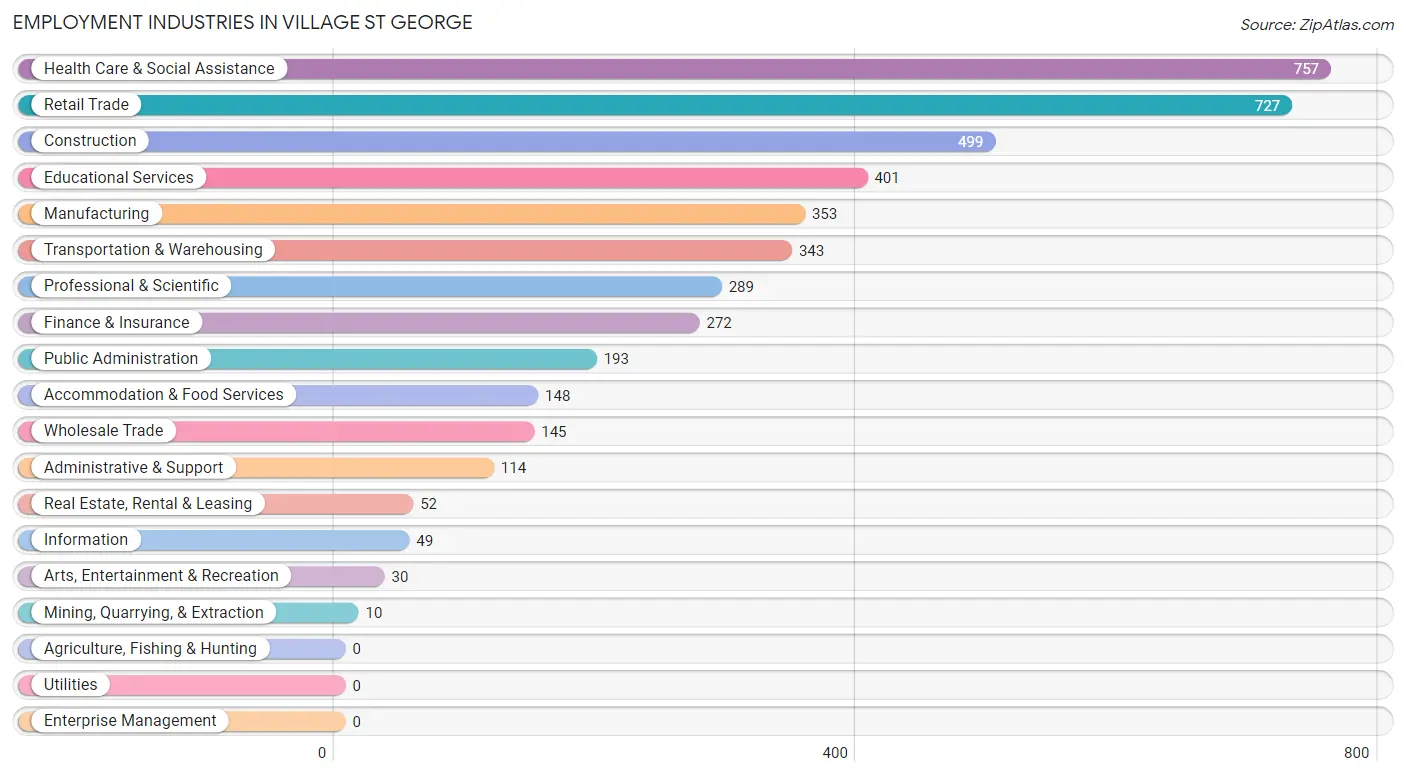
Employment Industries in Village St George
The major employment industries in Village St George include Health Care & Social Assistance (757 | 16.4%), Retail Trade (727 | 15.7%), Construction (499 | 10.8%), Educational Services (401 | 8.7%), and Manufacturing (353 | 7.6%).
Employment Industries by Sex in Village St George
The Village St George industries that see more men than women are Mining, Quarrying, & Extraction (100.0%), Information (100.0%), and Construction (87.6%), whereas the industries that tend to have a higher number of women are Educational Services (87.0%), Health Care & Social Assistance (83.8%), and Real Estate, Rental & Leasing (76.9%).
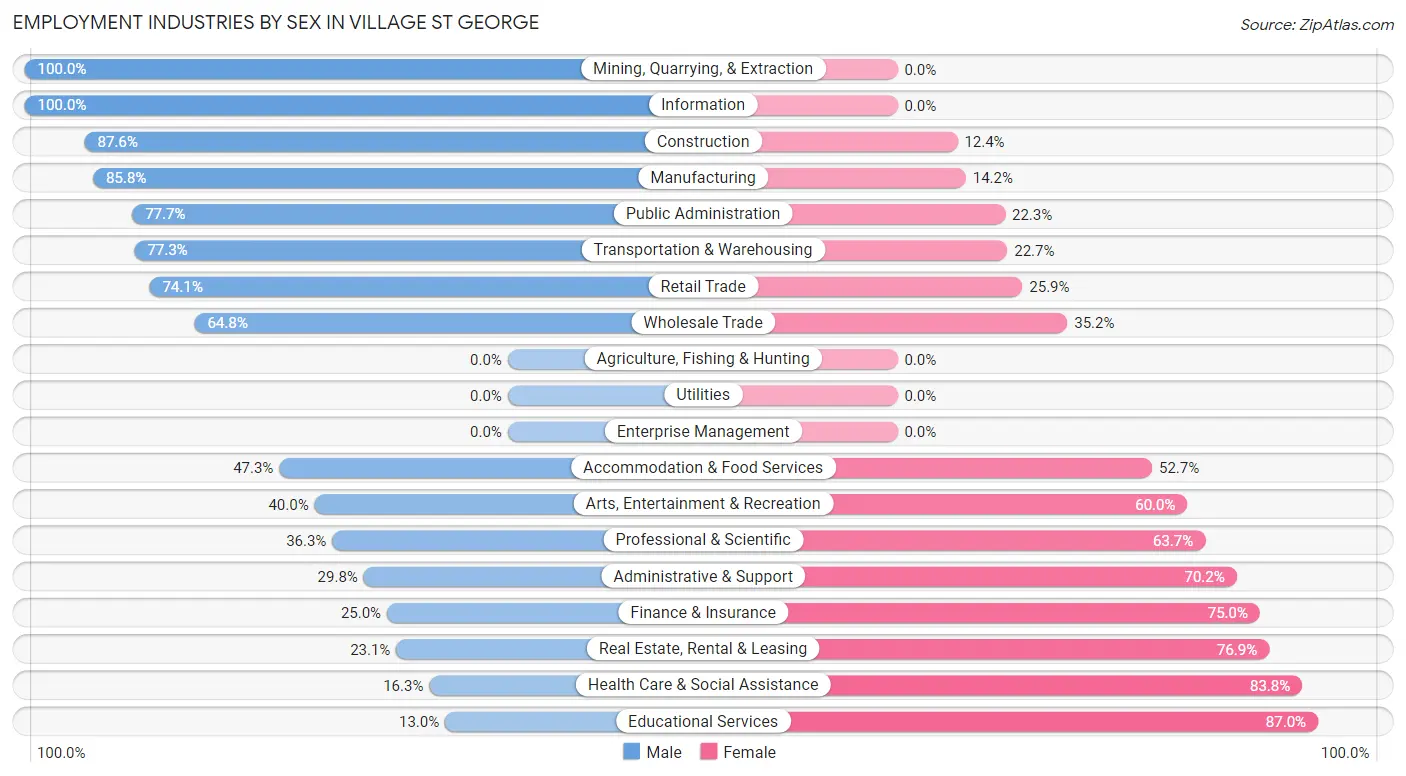
| Industry | Male | Female |
| Agriculture, Fishing & Hunting | 0 (0.0%) | 0 (0.0%) |
| Mining, Quarrying, & Extraction | 10 (100.0%) | 0 (0.0%) |
| Construction | 437 (87.6%) | 62 (12.4%) |
| Manufacturing | 303 (85.8%) | 50 (14.2%) |
| Wholesale Trade | 94 (64.8%) | 51 (35.2%) |
| Retail Trade | 539 (74.1%) | 188 (25.9%) |
| Transportation & Warehousing | 265 (77.3%) | 78 (22.7%) |
| Utilities | 0 (0.0%) | 0 (0.0%) |
| Information | 49 (100.0%) | 0 (0.0%) |
| Finance & Insurance | 68 (25.0%) | 204 (75.0%) |
| Real Estate, Rental & Leasing | 12 (23.1%) | 40 (76.9%) |
| Professional & Scientific | 105 (36.3%) | 184 (63.7%) |
| Enterprise Management | 0 (0.0%) | 0 (0.0%) |
| Administrative & Support | 34 (29.8%) | 80 (70.2%) |
| Educational Services | 52 (13.0%) | 349 (87.0%) |
| Health Care & Social Assistance | 123 (16.3%) | 634 (83.8%) |
| Arts, Entertainment & Recreation | 12 (40.0%) | 18 (60.0%) |
| Accommodation & Food Services | 70 (47.3%) | 78 (52.7%) |
| Public Administration | 150 (77.7%) | 43 (22.3%) |
| Total | 2,418 (52.3%) | 2,206 (47.7%) |
Education in Village St George
School Enrollment in Village St George
The most common levels of schooling among the 2,616 students in Village St George are elementary school (628 | 24.0%), middle school (588 | 22.5%), and college / undergraduate (473 | 18.1%).
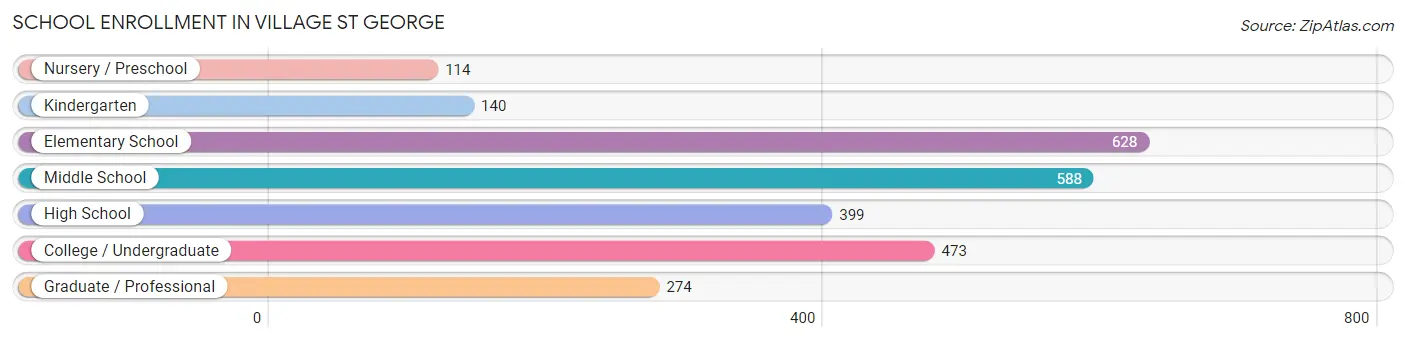
| School Level | # Students | % Students |
| Nursery / Preschool | 114 | 4.4% |
| Kindergarten | 140 | 5.3% |
| Elementary School | 628 | 24.0% |
| Middle School | 588 | 22.5% |
| High School | 399 | 15.2% |
| College / Undergraduate | 473 | 18.1% |
| Graduate / Professional | 274 | 10.5% |
| Total | 2,616 | 100.0% |
School Enrollment by Age by Funding Source in Village St George
Out of a total of 2,616 students who are enrolled in schools in Village St George, 989 (37.8%) attend a private institution, while the remaining 1,627 (62.2%) are enrolled in public schools. The age group of 3 to 4 year olds has the highest likelihood of being enrolled in private schools, with 89 (100.0% in the age bracket) enrolled. Conversely, the age group of 20 to 24 year olds has the lowest likelihood of being enrolled in a private school, with 357 (100.0% in the age bracket) attending a public institution.
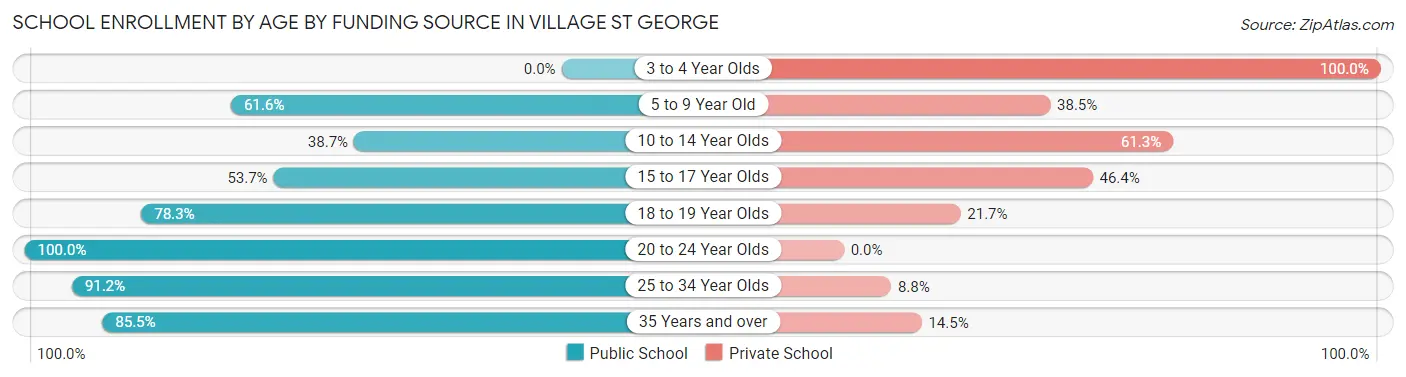
| Age Bracket | Public School | Private School |
| 3 to 4 Year Olds | 0 (0.0%) | 89 (100.0%) |
| 5 to 9 Year Old | 437 (61.6%) | 273 (38.5%) |
| 10 to 14 Year Olds | 266 (38.7%) | 422 (61.3%) |
| 15 to 17 Year Olds | 169 (53.6%) | 146 (46.4%) |
| 18 to 19 Year Olds | 72 (78.3%) | 20 (21.7%) |
| 20 to 24 Year Olds | 357 (100.0%) | 0 (0.0%) |
| 25 to 34 Year Olds | 207 (91.2%) | 20 (8.8%) |
| 35 Years and over | 118 (85.5%) | 20 (14.5%) |
| Total | 1,627 (62.2%) | 989 (37.8%) |
Educational Attainment by Field of Study in Village St George
Business (570 | 21.2%), science & technology (350 | 13.0%), education (333 | 12.4%), engineering (244 | 9.1%), and liberal arts & history (225 | 8.4%) are the most common fields of study among 2,686 individuals in Village St George who have obtained a bachelor's degree or higher.
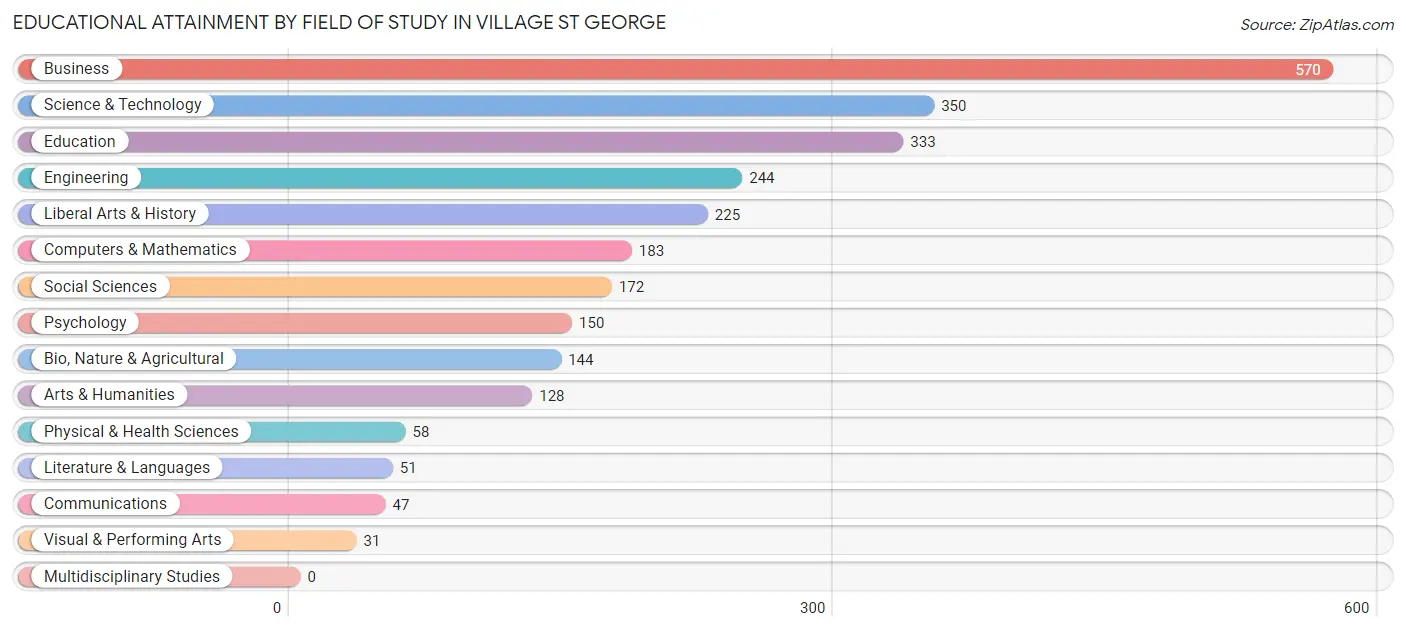
| Field of Study | # Graduates | % Graduates |
| Computers & Mathematics | 183 | 6.8% |
| Bio, Nature & Agricultural | 144 | 5.4% |
| Physical & Health Sciences | 58 | 2.2% |
| Psychology | 150 | 5.6% |
| Social Sciences | 172 | 6.4% |
| Engineering | 244 | 9.1% |
| Multidisciplinary Studies | 0 | 0.0% |
| Science & Technology | 350 | 13.0% |
| Business | 570 | 21.2% |
| Education | 333 | 12.4% |
| Literature & Languages | 51 | 1.9% |
| Liberal Arts & History | 225 | 8.4% |
| Visual & Performing Arts | 31 | 1.1% |
| Communications | 47 | 1.8% |
| Arts & Humanities | 128 | 4.8% |
| Total | 2,686 | 100.0% |
Transportation & Commute in Village St George
Vehicle Availability by Sex in Village St George
The most prevalent vehicle ownership categories in Village St George are males with 2 vehicles (1,174, accounting for 49.2%) and females with 2 vehicles (1,162, making up 53.7%).
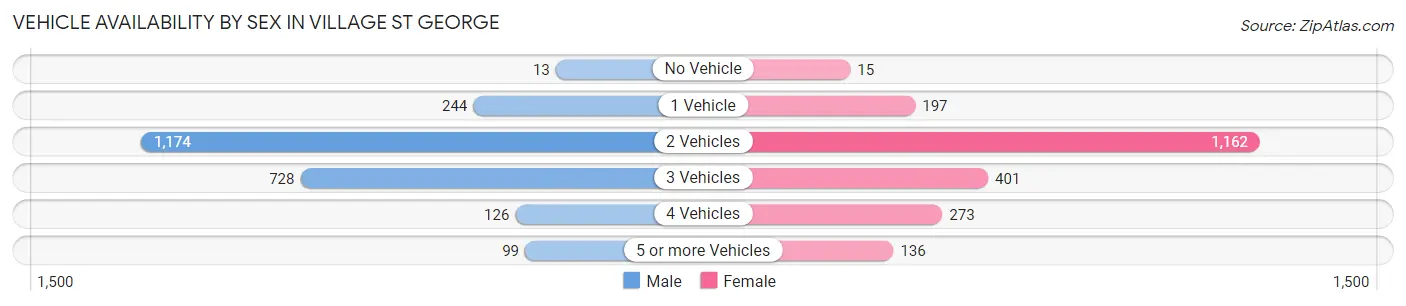
| Vehicles Available | Male | Female |
| No Vehicle | 13 (0.5%) | 15 (0.7%) |
| 1 Vehicle | 244 (10.2%) | 197 (9.0%) |
| 2 Vehicles | 1,174 (49.2%) | 1,162 (53.2%) |
| 3 Vehicles | 728 (30.5%) | 401 (18.4%) |
| 4 Vehicles | 126 (5.3%) | 273 (12.5%) |
| 5 or more Vehicles | 99 (4.2%) | 136 (6.2%) |
| Total | 2,384 (100.0%) | 2,184 (100.0%) |
Commute Time in Village St George
The most frequently occuring commute durations in Village St George are 15 to 19 minutes (987 commuters, 24.2%), 20 to 24 minutes (773 commuters, 18.9%), and 30 to 34 minutes (730 commuters, 17.9%).
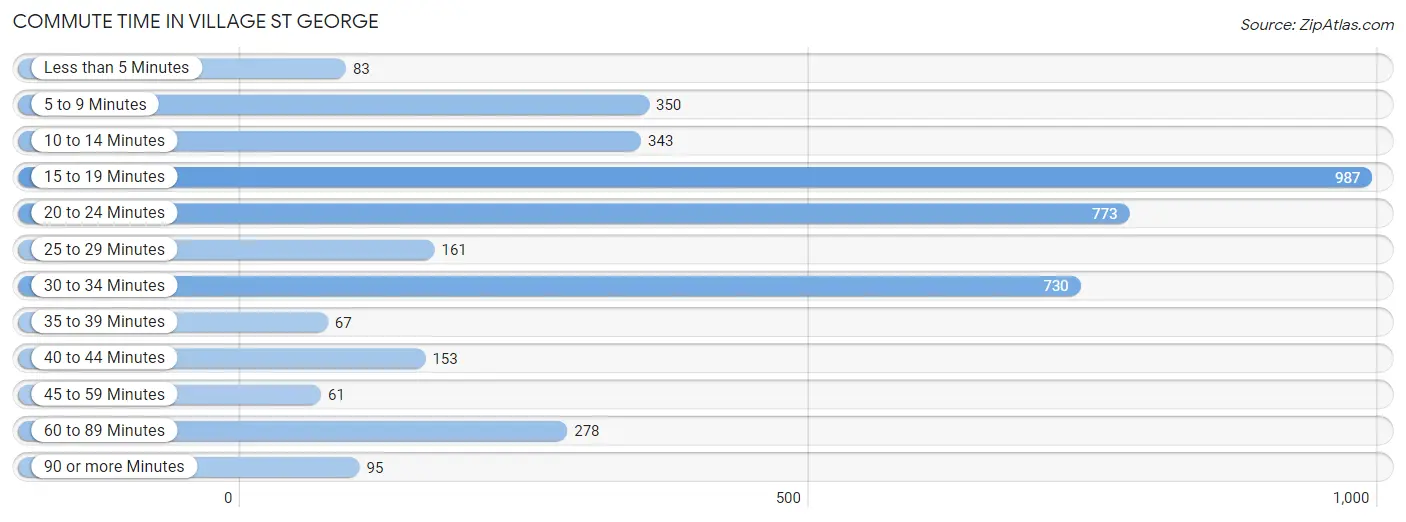
| Commute Time | # Commuters | % Commuters |
| Less than 5 Minutes | 83 | 2.0% |
| 5 to 9 Minutes | 350 | 8.6% |
| 10 to 14 Minutes | 343 | 8.4% |
| 15 to 19 Minutes | 987 | 24.2% |
| 20 to 24 Minutes | 773 | 18.9% |
| 25 to 29 Minutes | 161 | 4.0% |
| 30 to 34 Minutes | 730 | 17.9% |
| 35 to 39 Minutes | 67 | 1.6% |
| 40 to 44 Minutes | 153 | 3.7% |
| 45 to 59 Minutes | 61 | 1.5% |
| 60 to 89 Minutes | 278 | 6.8% |
| 90 or more Minutes | 95 | 2.3% |
Commute Time by Sex in Village St George
The most common commute times in Village St George are 15 to 19 minutes (641 commuters, 29.4%) for males and 20 to 24 minutes (423 commuters, 22.3%) for females.
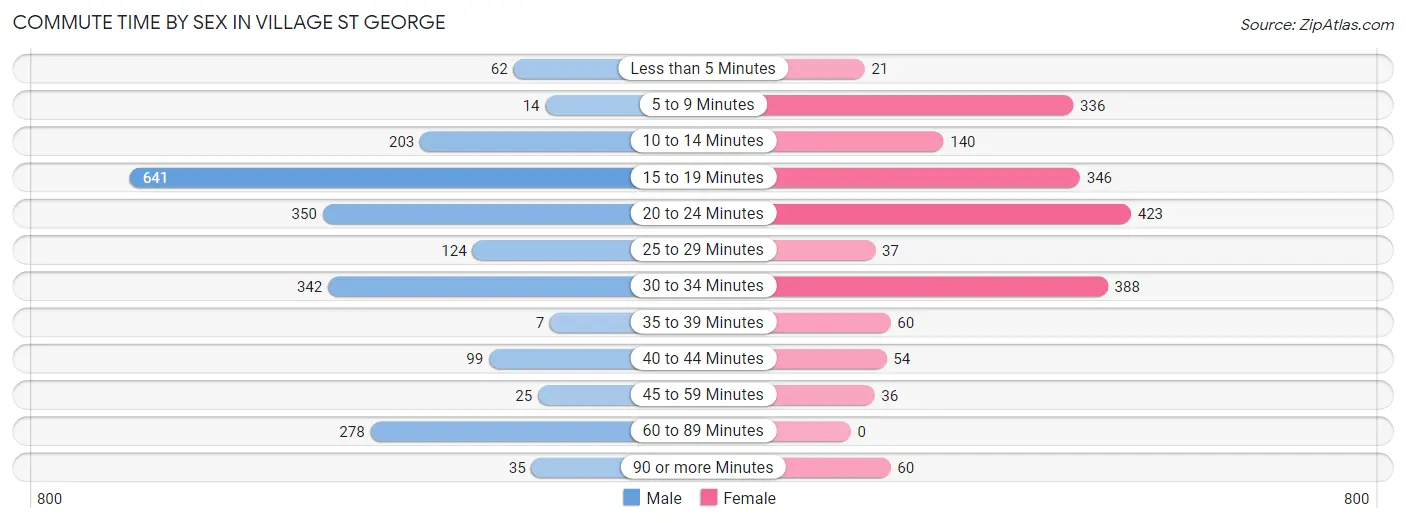
| Commute Time | Male | Female |
| Less than 5 Minutes | 62 (2.8%) | 21 (1.1%) |
| 5 to 9 Minutes | 14 (0.6%) | 336 (17.7%) |
| 10 to 14 Minutes | 203 (9.3%) | 140 (7.4%) |
| 15 to 19 Minutes | 641 (29.4%) | 346 (18.2%) |
| 20 to 24 Minutes | 350 (16.1%) | 423 (22.3%) |
| 25 to 29 Minutes | 124 (5.7%) | 37 (1.9%) |
| 30 to 34 Minutes | 342 (15.7%) | 388 (20.4%) |
| 35 to 39 Minutes | 7 (0.3%) | 60 (3.2%) |
| 40 to 44 Minutes | 99 (4.5%) | 54 (2.8%) |
| 45 to 59 Minutes | 25 (1.1%) | 36 (1.9%) |
| 60 to 89 Minutes | 278 (12.8%) | 0 (0.0%) |
| 90 or more Minutes | 35 (1.6%) | 60 (3.2%) |
Time of Departure to Work by Sex in Village St George
The most frequent times of departure to work in Village St George are 7:00 AM to 7:29 AM (784, 36.0%) for males and 7:30 AM to 7:59 AM (576, 30.3%) for females.
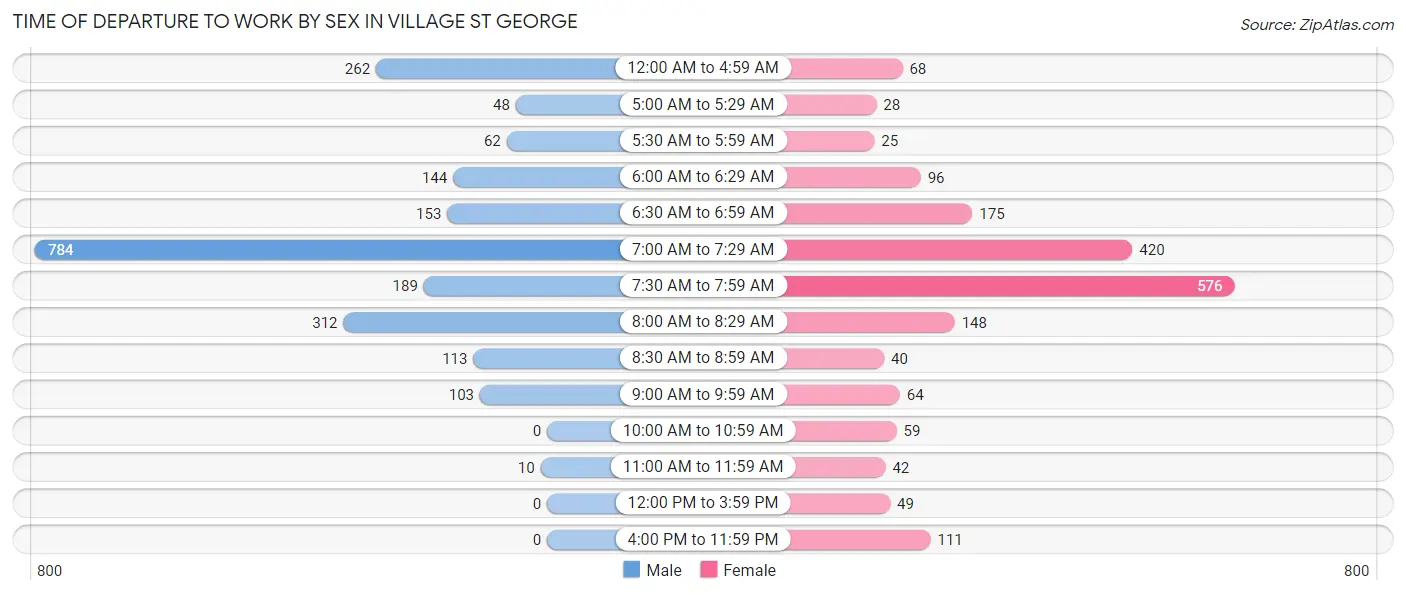
| Time of Departure | Male | Female |
| 12:00 AM to 4:59 AM | 262 (12.0%) | 68 (3.6%) |
| 5:00 AM to 5:29 AM | 48 (2.2%) | 28 (1.5%) |
| 5:30 AM to 5:59 AM | 62 (2.8%) | 25 (1.3%) |
| 6:00 AM to 6:29 AM | 144 (6.6%) | 96 (5.1%) |
| 6:30 AM to 6:59 AM | 153 (7.0%) | 175 (9.2%) |
| 7:00 AM to 7:29 AM | 784 (36.0%) | 420 (22.1%) |
| 7:30 AM to 7:59 AM | 189 (8.7%) | 576 (30.3%) |
| 8:00 AM to 8:29 AM | 312 (14.3%) | 148 (7.8%) |
| 8:30 AM to 8:59 AM | 113 (5.2%) | 40 (2.1%) |
| 9:00 AM to 9:59 AM | 103 (4.7%) | 64 (3.4%) |
| 10:00 AM to 10:59 AM | 0 (0.0%) | 59 (3.1%) |
| 11:00 AM to 11:59 AM | 10 (0.5%) | 42 (2.2%) |
| 12:00 PM to 3:59 PM | 0 (0.0%) | 49 (2.6%) |
| 4:00 PM to 11:59 PM | 0 (0.0%) | 111 (5.8%) |
| Total | 2,180 (100.0%) | 1,901 (100.0%) |
Housing Occupancy in Village St George
Occupancy by Ownership in Village St George
Of the total 2,924 dwellings in Village St George, owner-occupied units account for 2,180 (74.6%), while renter-occupied units make up 744 (25.4%).
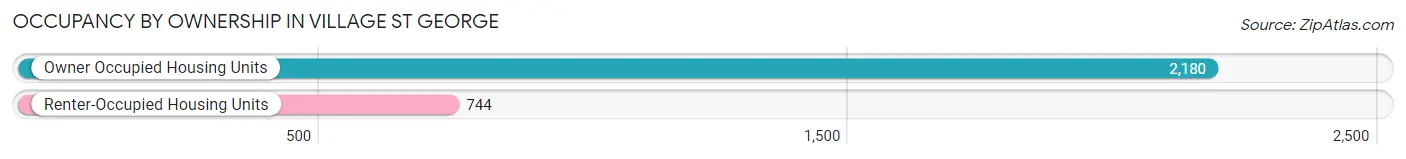
| Occupancy | # Housing Units | % Housing Units |
| Owner Occupied Housing Units | 2,180 | 74.6% |
| Renter-Occupied Housing Units | 744 | 25.4% |
| Total Occupied Housing Units | 2,924 | 100.0% |
Occupancy by Household Size in Village St George
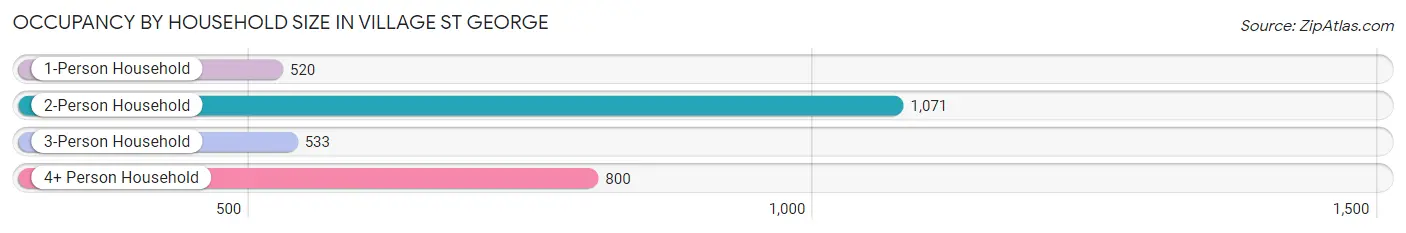
| Household Size | # Housing Units | % Housing Units |
| 1-Person Household | 520 | 17.8% |
| 2-Person Household | 1,071 | 36.6% |
| 3-Person Household | 533 | 18.2% |
| 4+ Person Household | 800 | 27.4% |
| Total Housing Units | 2,924 | 100.0% |
Occupancy by Ownership by Household Size in Village St George
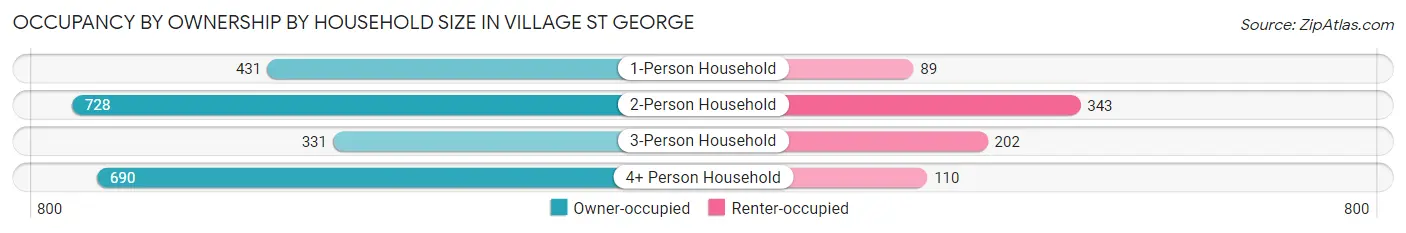
| Household Size | Owner-occupied | Renter-occupied |
| 1-Person Household | 431 (82.9%) | 89 (17.1%) |
| 2-Person Household | 728 (68.0%) | 343 (32.0%) |
| 3-Person Household | 331 (62.1%) | 202 (37.9%) |
| 4+ Person Household | 690 (86.3%) | 110 (13.8%) |
| Total Housing Units | 2,180 (74.6%) | 744 (25.4%) |
Occupancy by Educational Attainment in Village St George
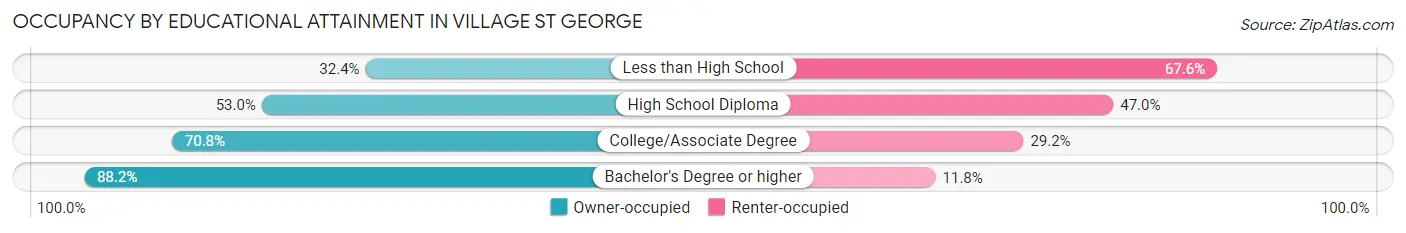
| Household Size | Owner-occupied | Renter-occupied |
| Less than High School | 48 (32.4%) | 100 (67.6%) |
| High School Diploma | 204 (53.0%) | 181 (47.0%) |
| College/Associate Degree | 737 (70.8%) | 304 (29.2%) |
| Bachelor's Degree or higher | 1,191 (88.2%) | 159 (11.8%) |
Occupancy by Age of Householder in Village St George
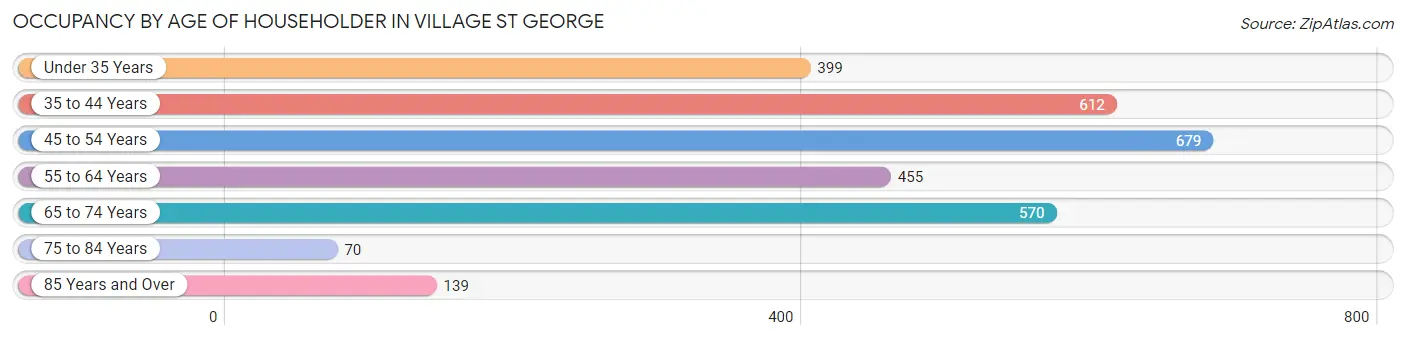
| Age Bracket | # Households | % Households |
| Under 35 Years | 399 | 13.7% |
| 35 to 44 Years | 612 | 20.9% |
| 45 to 54 Years | 679 | 23.2% |
| 55 to 64 Years | 455 | 15.6% |
| 65 to 74 Years | 570 | 19.5% |
| 75 to 84 Years | 70 | 2.4% |
| 85 Years and Over | 139 | 4.8% |
| Total | 2,924 | 100.0% |
Housing Finances in Village St George
Median Income by Occupancy in Village St George
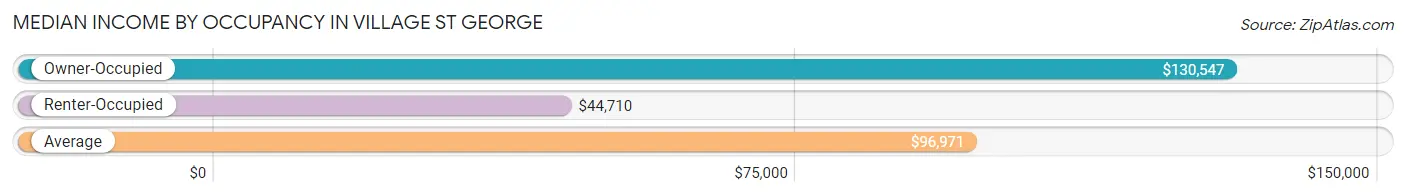
| Occupancy Type | # Households | Median Income |
| Owner-Occupied | 2,180 (74.6%) | $130,547 |
| Renter-Occupied | 744 (25.4%) | $44,710 |
| Average | 2,924 (100.0%) | $96,971 |
Occupancy by Householder Income Bracket in Village St George
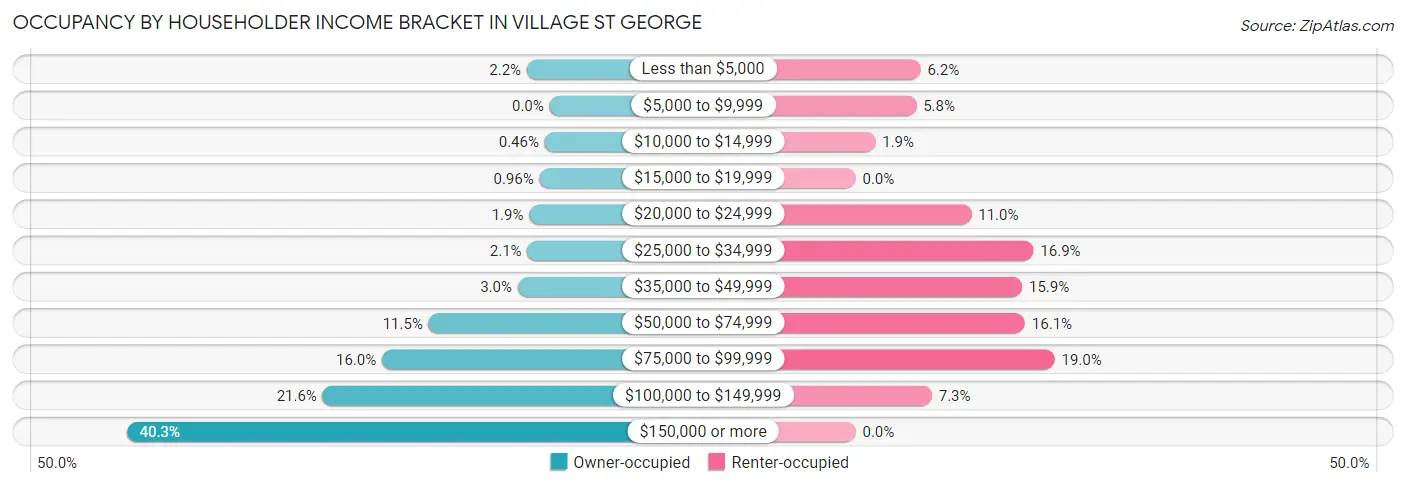
| Income Bracket | Owner-occupied | Renter-occupied |
| Less than $5,000 | 47 (2.2%) | 46 (6.2%) |
| $5,000 to $9,999 | 0 (0.0%) | 43 (5.8%) |
| $10,000 to $14,999 | 10 (0.5%) | 14 (1.9%) |
| $15,000 to $19,999 | 21 (1.0%) | 0 (0.0%) |
| $20,000 to $24,999 | 42 (1.9%) | 82 (11.0%) |
| $25,000 to $34,999 | 46 (2.1%) | 126 (16.9%) |
| $35,000 to $49,999 | 66 (3.0%) | 118 (15.9%) |
| $50,000 to $74,999 | 251 (11.5%) | 120 (16.1%) |
| $75,000 to $99,999 | 348 (16.0%) | 141 (19.0%) |
| $100,000 to $149,999 | 471 (21.6%) | 54 (7.3%) |
| $150,000 or more | 878 (40.3%) | 0 (0.0%) |
| Total | 2,180 (100.0%) | 744 (100.0%) |
Monthly Housing Cost Tiers in Village St George
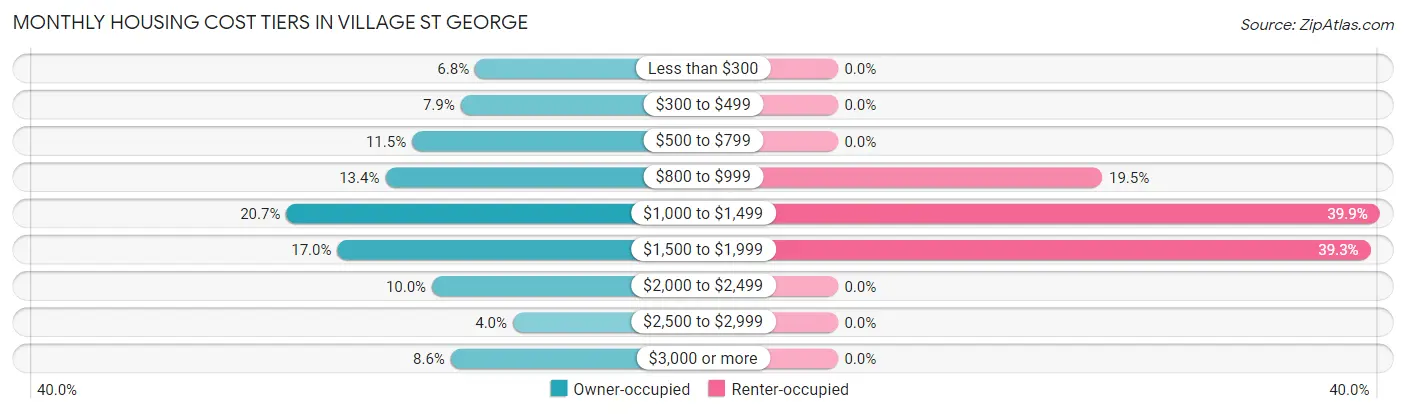
| Monthly Cost | Owner-occupied | Renter-occupied |
| Less than $300 | 149 (6.8%) | 0 (0.0%) |
| $300 to $499 | 172 (7.9%) | 0 (0.0%) |
| $500 to $799 | 250 (11.5%) | 0 (0.0%) |
| $800 to $999 | 293 (13.4%) | 145 (19.5%) |
| $1,000 to $1,499 | 452 (20.7%) | 297 (39.9%) |
| $1,500 to $1,999 | 370 (17.0%) | 292 (39.3%) |
| $2,000 to $2,499 | 218 (10.0%) | 0 (0.0%) |
| $2,500 to $2,999 | 88 (4.0%) | 0 (0.0%) |
| $3,000 or more | 188 (8.6%) | 0 (0.0%) |
| Total | 2,180 (100.0%) | 744 (100.0%) |
Physical Housing Characteristics in Village St George
Housing Structures in Village St George
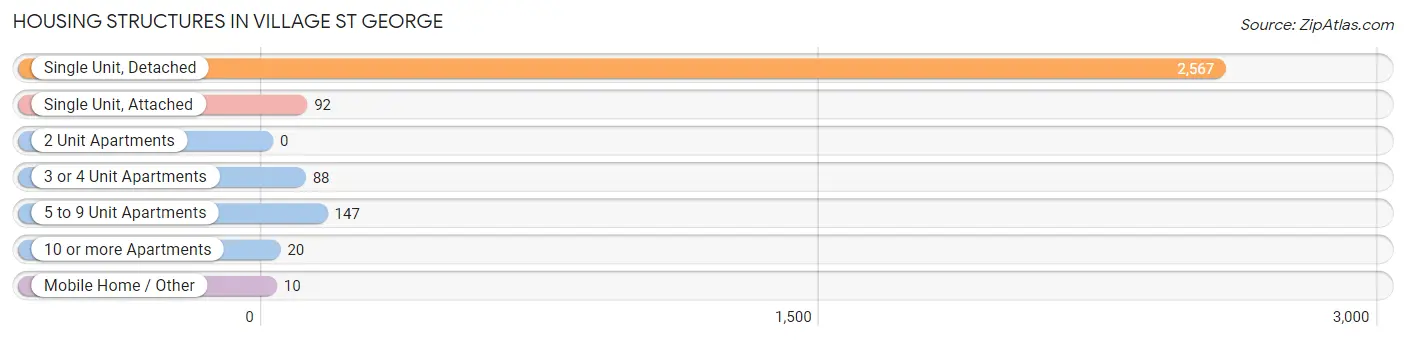
| Structure Type | # Housing Units | % Housing Units |
| Single Unit, Detached | 2,567 | 87.8% |
| Single Unit, Attached | 92 | 3.2% |
| 2 Unit Apartments | 0 | 0.0% |
| 3 or 4 Unit Apartments | 88 | 3.0% |
| 5 to 9 Unit Apartments | 147 | 5.0% |
| 10 or more Apartments | 20 | 0.7% |
| Mobile Home / Other | 10 | 0.3% |
| Total | 2,924 | 100.0% |
Housing Structures by Occupancy in Village St George
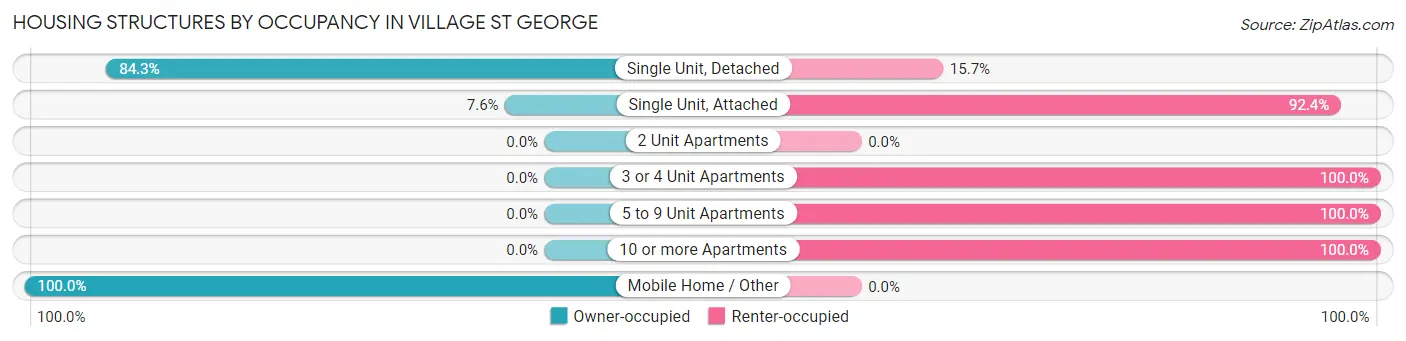
| Structure Type | Owner-occupied | Renter-occupied |
| Single Unit, Detached | 2,163 (84.3%) | 404 (15.7%) |
| Single Unit, Attached | 7 (7.6%) | 85 (92.4%) |
| 2 Unit Apartments | 0 (0.0%) | 0 (0.0%) |
| 3 or 4 Unit Apartments | 0 (0.0%) | 88 (100.0%) |
| 5 to 9 Unit Apartments | 0 (0.0%) | 147 (100.0%) |
| 10 or more Apartments | 0 (0.0%) | 20 (100.0%) |
| Mobile Home / Other | 10 (100.0%) | 0 (0.0%) |
| Total | 2,180 (74.6%) | 744 (25.4%) |
Housing Structures by Number of Rooms in Village St George
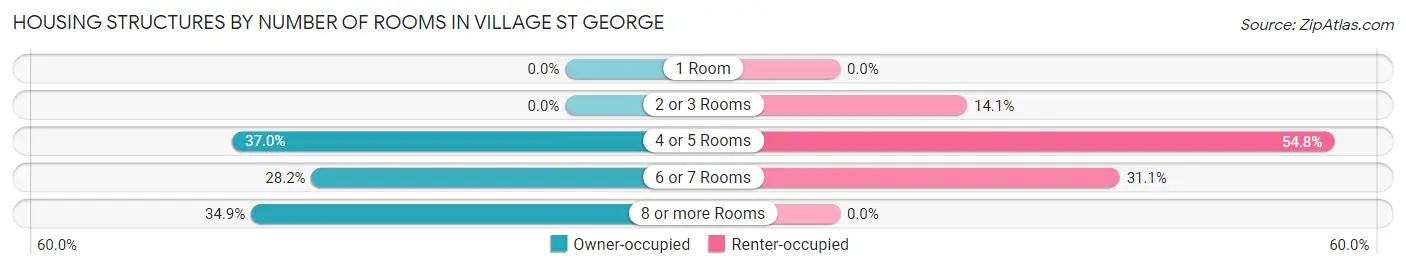
| Number of Rooms | Owner-occupied | Renter-occupied |
| 1 Room | 0 (0.0%) | 0 (0.0%) |
| 2 or 3 Rooms | 0 (0.0%) | 105 (14.1%) |
| 4 or 5 Rooms | 806 (37.0%) | 408 (54.8%) |
| 6 or 7 Rooms | 614 (28.2%) | 231 (31.0%) |
| 8 or more Rooms | 760 (34.9%) | 0 (0.0%) |
| Total | 2,180 (100.0%) | 744 (100.0%) |
Housing Structure by Heating Type in Village St George
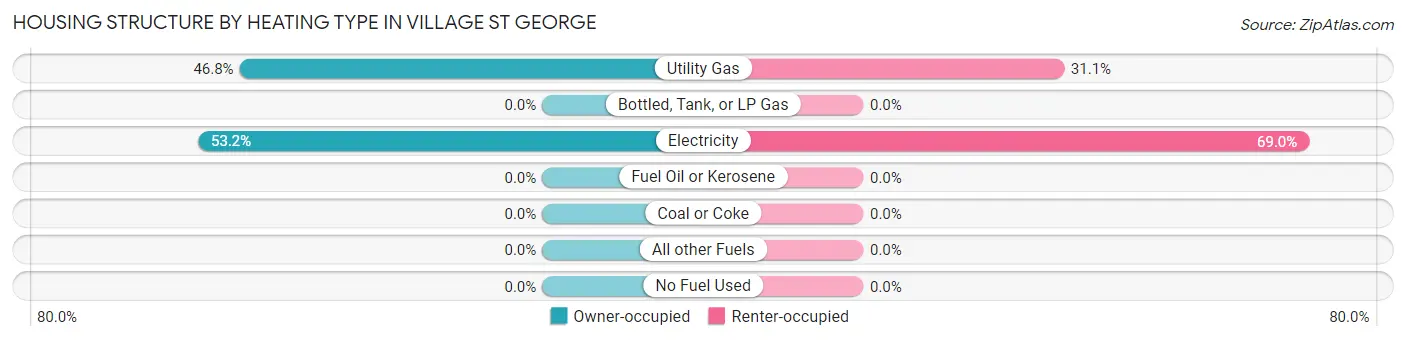
| Heating Type | Owner-occupied | Renter-occupied |
| Utility Gas | 1,020 (46.8%) | 231 (31.0%) |
| Bottled, Tank, or LP Gas | 0 (0.0%) | 0 (0.0%) |
| Electricity | 1,160 (53.2%) | 513 (69.0%) |
| Fuel Oil or Kerosene | 0 (0.0%) | 0 (0.0%) |
| Coal or Coke | 0 (0.0%) | 0 (0.0%) |
| All other Fuels | 0 (0.0%) | 0 (0.0%) |
| No Fuel Used | 0 (0.0%) | 0 (0.0%) |
| Total | 2,180 (100.0%) | 744 (100.0%) |
Household Vehicle Usage in Village St George
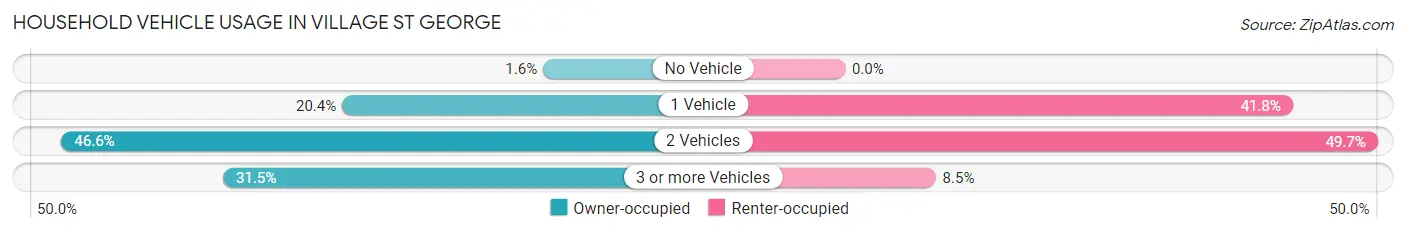
| Vehicles per Household | Owner-occupied | Renter-occupied |
| No Vehicle | 35 (1.6%) | 0 (0.0%) |
| 1 Vehicle | 444 (20.4%) | 311 (41.8%) |
| 2 Vehicles | 1,015 (46.6%) | 370 (49.7%) |
| 3 or more Vehicles | 686 (31.5%) | 63 (8.5%) |
| Total | 2,180 (100.0%) | 744 (100.0%) |
Real Estate & Mortgages in Village St George
Real Estate and Mortgage Overview in Village St George
| Characteristic | Without Mortgage | With Mortgage |
| Housing Units | 693 | 1,487 |
| Median Property Value | $236,400 | $247,000 |
| Median Household Income | $89,226 | $737 |
| Monthly Housing Costs | $522 | $182 |
| Real Estate Taxes | - | - |
Property Value by Mortgage Status in Village St George
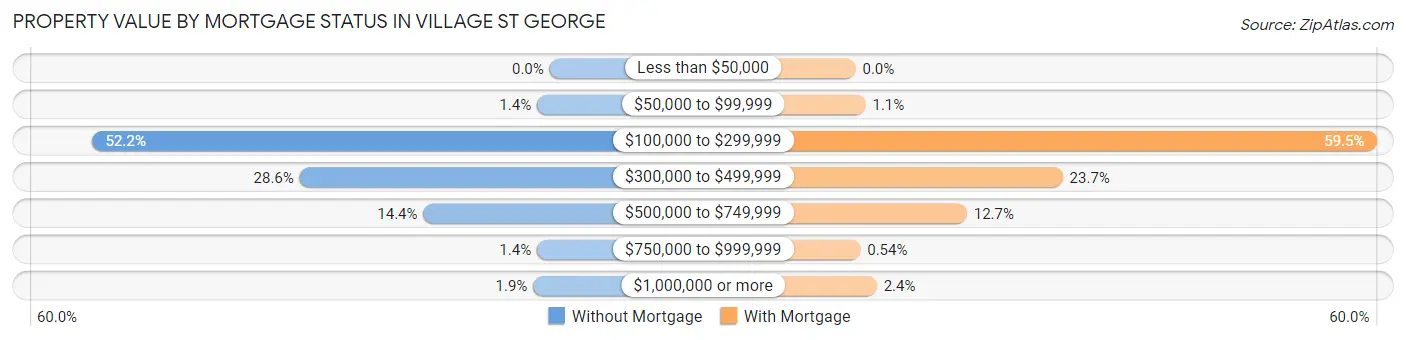
| Property Value | Without Mortgage | With Mortgage |
| Less than $50,000 | 0 (0.0%) | 0 (0.0%) |
| $50,000 to $99,999 | 10 (1.4%) | 17 (1.1%) |
| $100,000 to $299,999 | 362 (52.2%) | 885 (59.5%) |
| $300,000 to $499,999 | 198 (28.6%) | 352 (23.7%) |
| $500,000 to $749,999 | 100 (14.4%) | 189 (12.7%) |
| $750,000 to $999,999 | 10 (1.4%) | 8 (0.5%) |
| $1,000,000 or more | 13 (1.9%) | 36 (2.4%) |
| Total | 693 (100.0%) | 1,487 (100.0%) |
Household Income by Mortgage Status in Village St George
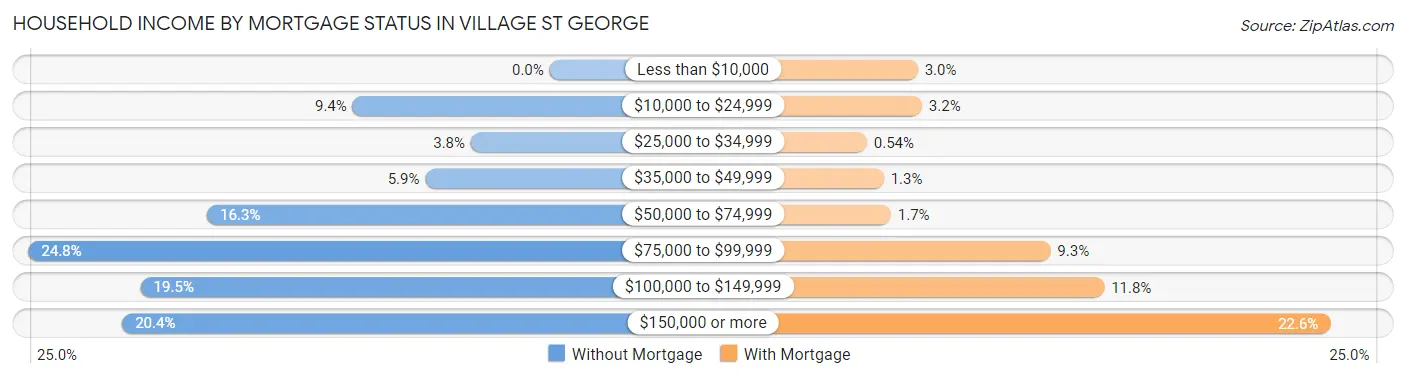
| Household Income | Without Mortgage | With Mortgage |
| Less than $10,000 | 0 (0.0%) | 44 (3.0%) |
| $10,000 to $24,999 | 65 (9.4%) | 47 (3.2%) |
| $25,000 to $34,999 | 26 (3.7%) | 8 (0.5%) |
| $35,000 to $49,999 | 41 (5.9%) | 20 (1.3%) |
| $50,000 to $74,999 | 113 (16.3%) | 25 (1.7%) |
| $75,000 to $99,999 | 172 (24.8%) | 138 (9.3%) |
| $100,000 to $149,999 | 135 (19.5%) | 176 (11.8%) |
| $150,000 or more | 141 (20.3%) | 336 (22.6%) |
| Total | 693 (100.0%) | 1,487 (100.0%) |
Property Value to Household Income Ratio in Village St George
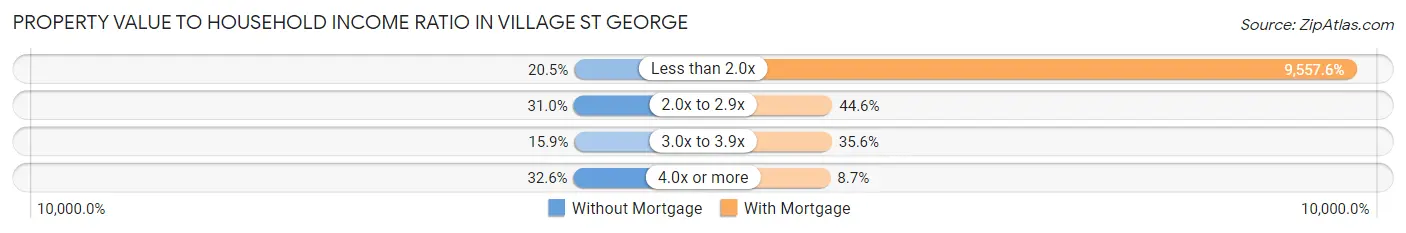
| Value-to-Income Ratio | Without Mortgage | With Mortgage |
| Less than 2.0x | 142 (20.5%) | 142,122 (9,557.6%) |
| 2.0x to 2.9x | 215 (31.0%) | 663 (44.6%) |
| 3.0x to 3.9x | 110 (15.9%) | 530 (35.6%) |
| 4.0x or more | 226 (32.6%) | 129 (8.7%) |
| Total | 693 (100.0%) | 1,487 (100.0%) |
Real Estate Taxes by Mortgage Status in Village St George
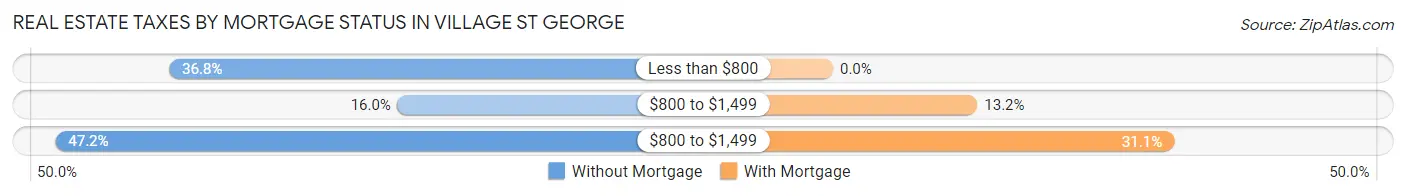
| Property Taxes | Without Mortgage | With Mortgage |
| Less than $800 | 255 (36.8%) | 0 (0.0%) |
| $800 to $1,499 | 111 (16.0%) | 196 (13.2%) |
| $800 to $1,499 | 327 (47.2%) | 463 (31.1%) |
| Total | 693 (100.0%) | 1,487 (100.0%) |
Health & Disability in Village St George
Health Insurance Coverage by Age in Village St George
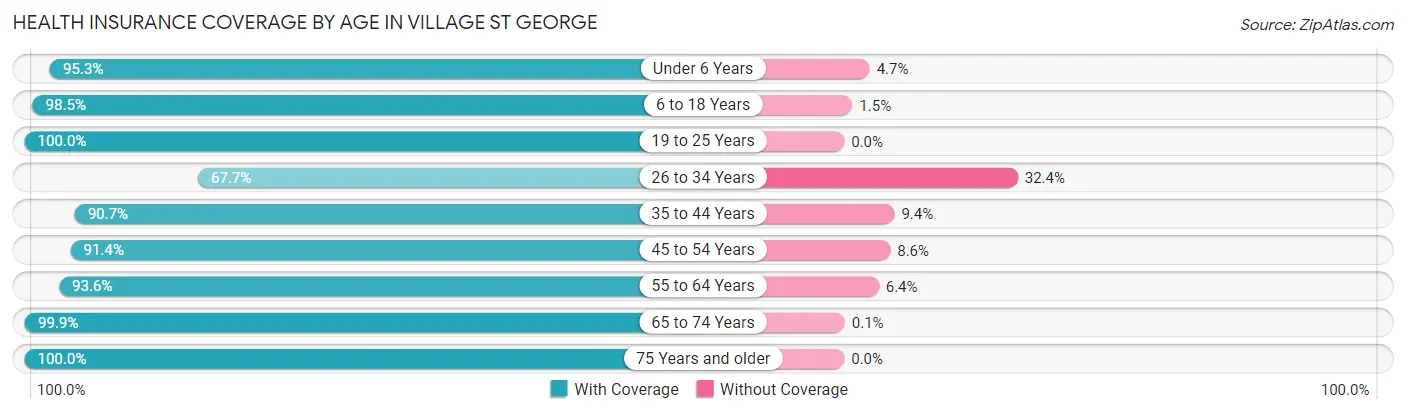
| Age Bracket | With Coverage | Without Coverage |
| Under 6 Years | 502 (95.3%) | 25 (4.7%) |
| 6 to 18 Years | 1,570 (98.5%) | 24 (1.5%) |
| 19 to 25 Years | 1,254 (100.0%) | 0 (0.0%) |
| 26 to 34 Years | 619 (67.6%) | 296 (32.4%) |
| 35 to 44 Years | 1,037 (90.6%) | 107 (9.3%) |
| 45 to 54 Years | 1,193 (91.4%) | 112 (8.6%) |
| 55 to 64 Years | 844 (93.6%) | 58 (6.4%) |
| 65 to 74 Years | 976 (99.9%) | 1 (0.1%) |
| 75 Years and older | 301 (100.0%) | 0 (0.0%) |
| Total | 8,296 (93.0%) | 623 (7.0%) |
Health Insurance Coverage by Citizenship Status in Village St George

| Citizenship Status | With Coverage | Without Coverage |
| Native Born | 502 (95.3%) | 25 (4.7%) |
| Foreign Born, Citizen | 1,570 (98.5%) | 24 (1.5%) |
| Foreign Born, not a Citizen | 1,254 (100.0%) | 0 (0.0%) |
Health Insurance Coverage by Household Income in Village St George
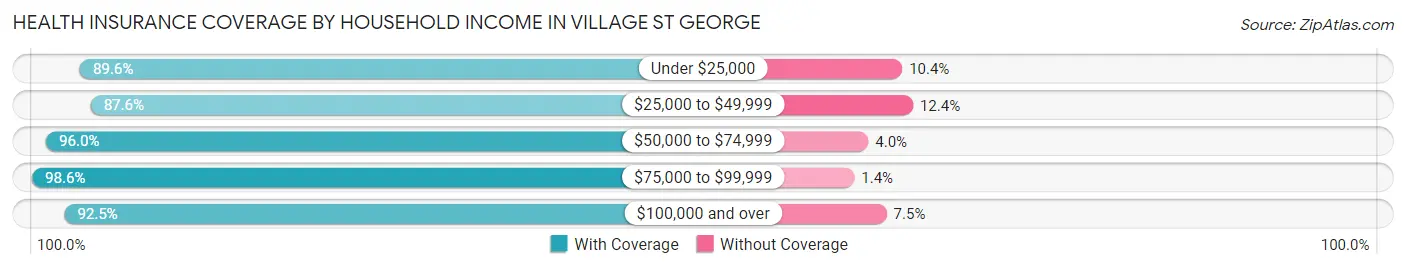
| Household Income | With Coverage | Without Coverage |
| Under $25,000 | 561 (89.6%) | 65 (10.4%) |
| $25,000 to $49,999 | 855 (87.6%) | 121 (12.4%) |
| $50,000 to $74,999 | 902 (96.0%) | 38 (4.0%) |
| $75,000 to $99,999 | 1,252 (98.6%) | 18 (1.4%) |
| $100,000 and over | 4,708 (92.5%) | 380 (7.5%) |
Public vs Private Health Insurance Coverage by Age in Village St George
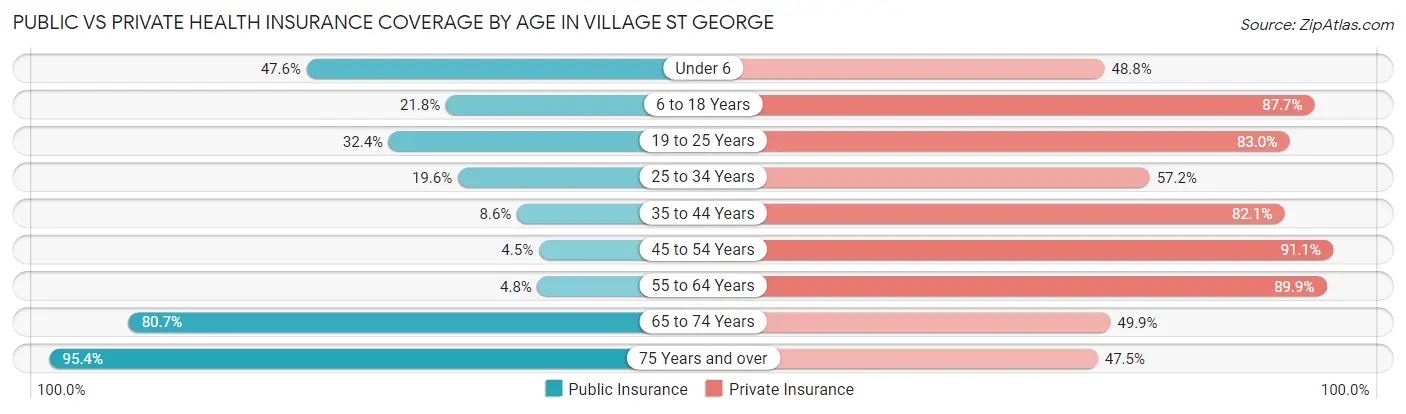
| Age Bracket | Public Insurance | Private Insurance |
| Under 6 | 251 (47.6%) | 257 (48.8%) |
| 6 to 18 Years | 347 (21.8%) | 1,398 (87.7%) |
| 19 to 25 Years | 406 (32.4%) | 1,041 (83.0%) |
| 25 to 34 Years | 179 (19.6%) | 523 (57.2%) |
| 35 to 44 Years | 98 (8.6%) | 939 (82.1%) |
| 45 to 54 Years | 59 (4.5%) | 1,189 (91.1%) |
| 55 to 64 Years | 43 (4.8%) | 811 (89.9%) |
| 65 to 74 Years | 788 (80.7%) | 487 (49.8%) |
| 75 Years and over | 287 (95.4%) | 143 (47.5%) |
| Total | 2,458 (27.6%) | 6,788 (76.1%) |
Disability Status by Sex by Age in Village St George
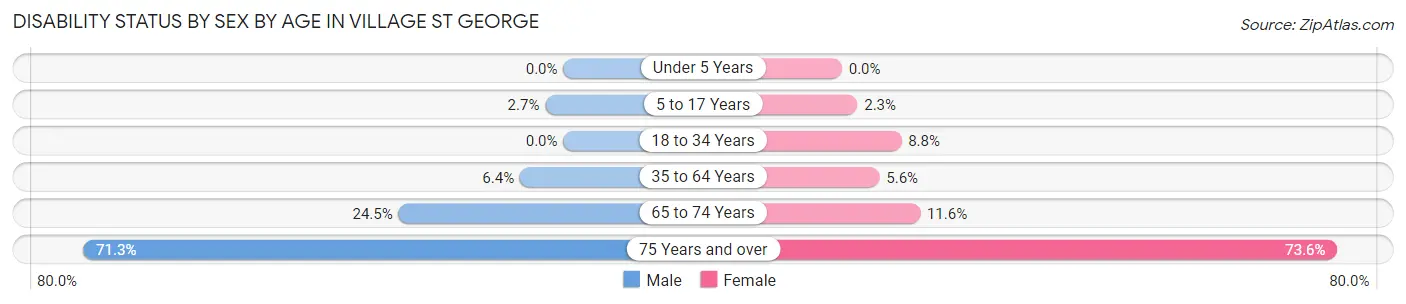
| Age Bracket | Male | Female |
| Under 5 Years | 0 (0.0%) | 0 (0.0%) |
| 5 to 17 Years | 25 (2.7%) | 18 (2.3%) |
| 18 to 34 Years | 0 (0.0%) | 107 (8.8%) |
| 35 to 64 Years | 105 (6.4%) | 96 (5.6%) |
| 65 to 74 Years | 81 (24.5%) | 75 (11.6%) |
| 75 Years and over | 77 (71.3%) | 142 (73.6%) |
Disability Class by Sex by Age in Village St George
Disability Class: Hearing Difficulty
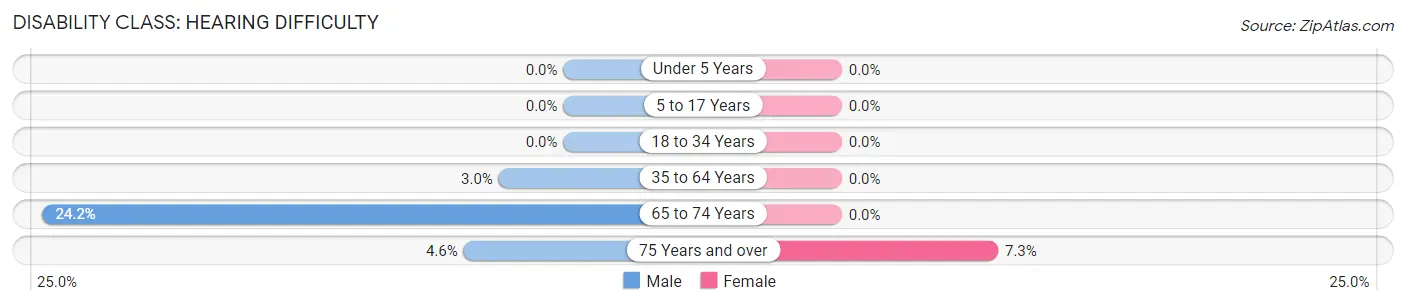
| Age Bracket | Male | Female |
| Under 5 Years | 0 (0.0%) | 0 (0.0%) |
| 5 to 17 Years | 0 (0.0%) | 0 (0.0%) |
| 18 to 34 Years | 0 (0.0%) | 0 (0.0%) |
| 35 to 64 Years | 49 (3.0%) | 0 (0.0%) |
| 65 to 74 Years | 80 (24.2%) | 0 (0.0%) |
| 75 Years and over | 5 (4.6%) | 14 (7.2%) |
Disability Class: Vision Difficulty
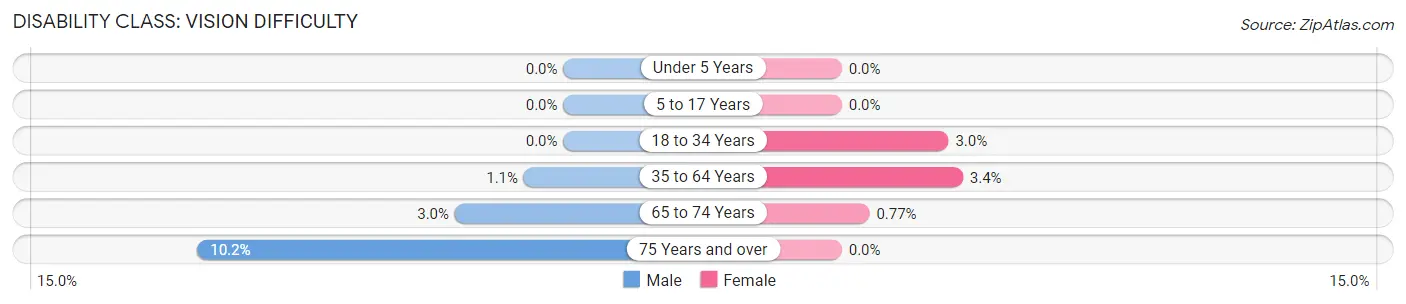
| Age Bracket | Male | Female |
| Under 5 Years | 0 (0.0%) | 0 (0.0%) |
| 5 to 17 Years | 0 (0.0%) | 0 (0.0%) |
| 18 to 34 Years | 0 (0.0%) | 36 (3.0%) |
| 35 to 64 Years | 18 (1.1%) | 58 (3.4%) |
| 65 to 74 Years | 10 (3.0%) | 5 (0.8%) |
| 75 Years and over | 11 (10.2%) | 0 (0.0%) |
Disability Class: Cognitive Difficulty
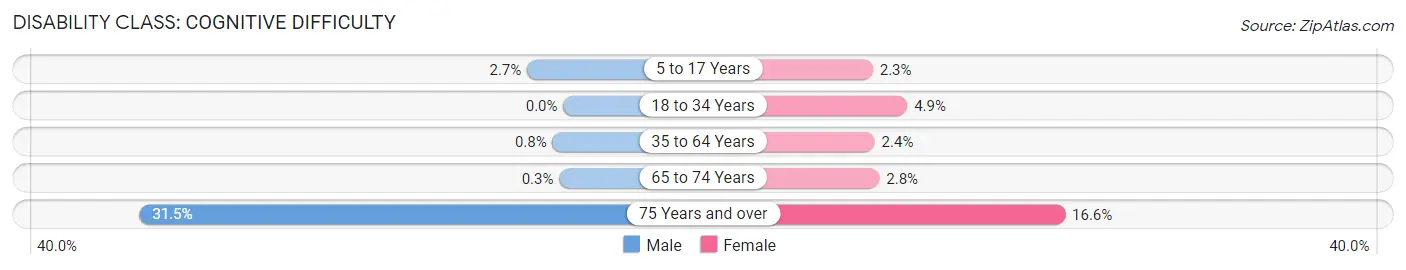
| Age Bracket | Male | Female |
| 5 to 17 Years | 25 (2.7%) | 18 (2.3%) |
| 18 to 34 Years | 0 (0.0%) | 59 (4.9%) |
| 35 to 64 Years | 13 (0.8%) | 42 (2.4%) |
| 65 to 74 Years | 1 (0.3%) | 18 (2.8%) |
| 75 Years and over | 34 (31.5%) | 32 (16.6%) |
Disability Class: Ambulatory Difficulty
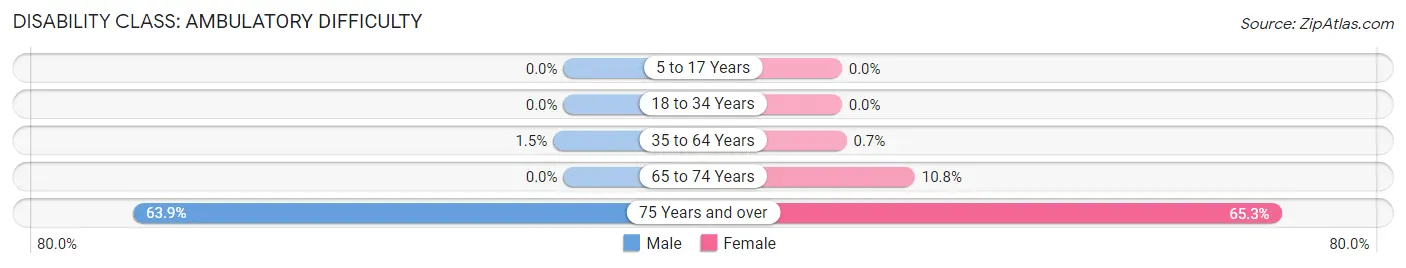
| Age Bracket | Male | Female |
| 5 to 17 Years | 0 (0.0%) | 0 (0.0%) |
| 18 to 34 Years | 0 (0.0%) | 0 (0.0%) |
| 35 to 64 Years | 25 (1.5%) | 12 (0.7%) |
| 65 to 74 Years | 0 (0.0%) | 70 (10.8%) |
| 75 Years and over | 69 (63.9%) | 126 (65.3%) |
Disability Class: Self-Care Difficulty
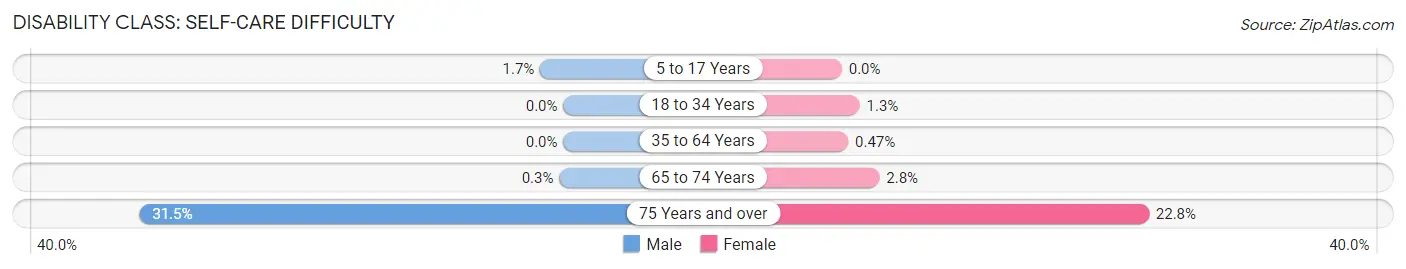
| Age Bracket | Male | Female |
| 5 to 17 Years | 16 (1.7%) | 0 (0.0%) |
| 18 to 34 Years | 0 (0.0%) | 16 (1.3%) |
| 35 to 64 Years | 0 (0.0%) | 8 (0.5%) |
| 65 to 74 Years | 1 (0.3%) | 18 (2.8%) |
| 75 Years and over | 34 (31.5%) | 44 (22.8%) |
Technology Access in Village St George
Computing Device Access in Village St George
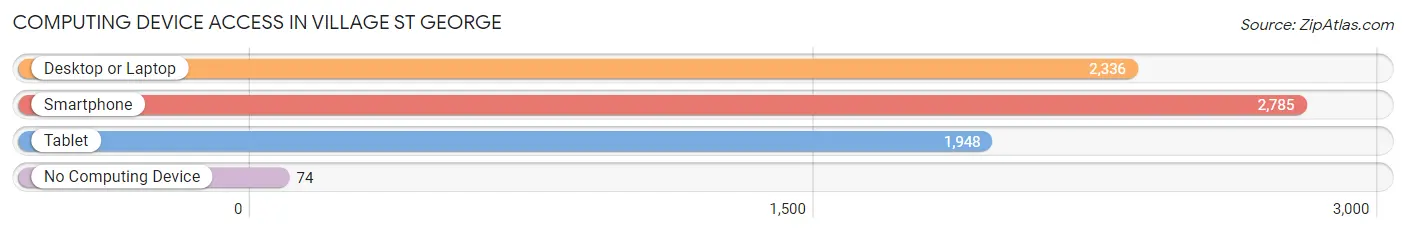
| Device Type | # Households | % Households |
| Desktop or Laptop | 2,336 | 79.9% |
| Smartphone | 2,785 | 95.3% |
| Tablet | 1,948 | 66.6% |
| No Computing Device | 74 | 2.5% |
| Total | 2,924 | 100.0% |
Internet Access in Village St George
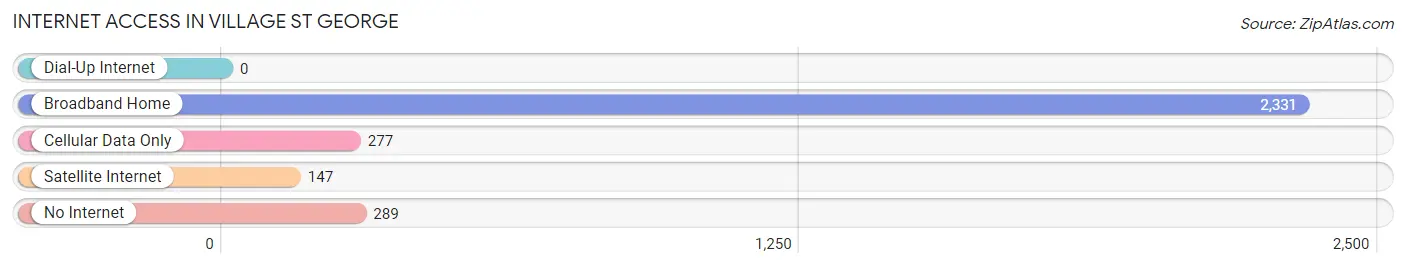
| Internet Type | # Households | % Households |
| Dial-Up Internet | 0 | 0.0% |
| Broadband Home | 2,331 | 79.7% |
| Cellular Data Only | 277 | 9.5% |
| Satellite Internet | 147 | 5.0% |
| No Internet | 289 | 9.9% |
| Total | 2,924 | 100.0% |
Village St George Summary
Village St. George is a small unincorporated community located in the parish of St. John the Baptist, Louisiana. It is situated on the banks of the Mississippi River, approximately 25 miles west of New Orleans. The village is home to a diverse population of approximately 1,000 people, and is known for its unique culture and history.
History
Village St. George was founded in the early 1800s by French settlers who were attracted to the area by its fertile soil and abundant natural resources. The village was originally known as “St. George’s Landing” and was a popular trading post for local farmers and merchants. In the mid-1800s, the village was renamed “Village St. George” and became a popular destination for travelers and tourists.
In the late 1800s, the village was home to a thriving sugar cane industry, and many of the local residents were employed in the industry. The village also had a thriving fishing industry, and many of the local residents were employed in the industry as well.
In the early 1900s, the village was home to a large population of African Americans, many of whom were employed in the sugar cane and fishing industries. The village was also home to a large population of Italian immigrants, many of whom were employed in the local brick-making industry.
Geography
Village St. George is located in the parish of St. John the Baptist, Louisiana. It is situated on the banks of the Mississippi River, approximately 25 miles west of New Orleans. The village is surrounded by lush wetlands and is home to a variety of wildlife, including alligators, turtles, and birds.
The village is located in a humid subtropical climate zone, and experiences hot and humid summers and mild winters. The average annual temperature is around 70 degrees Fahrenheit, and the average annual precipitation is around 60 inches.
Economy
The economy of Village St. George is largely based on agriculture and fishing. The village is home to a variety of farms, including sugar cane, cotton, and soybean farms. The village also has a thriving fishing industry, and many of the local residents are employed in the industry.
The village is also home to a variety of small businesses, including restaurants, grocery stores, and retail stores. The village is also home to a variety of tourist attractions, including the St. John the Baptist Parish Museum and the St. George’s Landing Historic Site.
Demographics
As of the 2010 census, the population of Village St. George was 1,000 people. The racial makeup of the village was 79.2% White, 15.2% African American, 0.7% Native American, 0.3% Asian, and 4.6% from other races. The median household income was $37,500, and the median age was 37 years.
Conclusion
Village St. George is a small unincorporated community located in the parish of St. John the Baptist, Louisiana. It is situated on the banks of the Mississippi River, approximately 25 miles west of New Orleans. The village is home to a diverse population of approximately 1,000 people, and is known for its unique culture and history. The economy of Village St. George is largely based on agriculture and fishing, and the village is home to a variety of small businesses. The village is also home to a variety of tourist attractions, including the St. John the Baptist Parish Museum and the St. George’s Landing Historic Site.
Common Questions
What is Per Capita Income in Village St George?
Per Capita income in Village St George is $48,258.
What is the Median Family Income in Village St George?
Median Family Income in Village St George is $115,179.
What is the Median Household income in Village St George?
Median Household Income in Village St George is $96,971.
What is Income or Wage Gap in Village St George?
Income or Wage Gap in Village St George is 59.7%.
Women in Village St George earn 40.3 cents for every dollar earned by a man.
What is Inequality or Gini Index in Village St George?
Inequality or Gini Index in Village St George is 0.47.
What is the Total Population of Village St George?
Total Population of Village St George is 8,919.
What is the Total Male Population of Village St George?
Total Male Population of Village St George is 4,219.
What is the Total Female Population of Village St George?
Total Female Population of Village St George is 4,700.
What is the Ratio of Males per 100 Females in Village St George?
There are 89.77 Males per 100 Females in Village St George.
What is the Ratio of Females per 100 Males in Village St George?
There are 111.40 Females per 100 Males in Village St George.
What is the Median Population Age in Village St George?
Median Population Age in Village St George is 36.8 Years.
What is the Average Family Size in Village St George
Average Family Size in Village St George is 3.5 People.
What is the Average Household Size in Village St George
Average Household Size in Village St George is 3.0 People.
How Large is the Labor Force in Village St George?
There are 4,796 People in the Labor Forcein in Village St George.
What is the Percentage of People in the Labor Force in Village St George?
68.4% of People are in the Labor Force in Village St George.
What is the Unemployment Rate in Village St George?
Unemployment Rate in Village St George is 3.5%.