Little Elm, TX Map & Demographics
Little Elm Map
Little Elm Overview
$43,823
PER CAPITA INCOME
$115,670
AVG FAMILY INCOME
$110,218
AVG HOUSEHOLD INCOME
25.7%
WAGE / INCOME GAP [ % ]
74.3¢/ $1
WAGE / INCOME GAP [ $ ]
$15,772
FAMILY INCOME DEFICIT
0.36
INEQUALITY / GINI INDEX
48,241
TOTAL POPULATION
24,741
MALE POPULATION
23,500
FEMALE POPULATION
105.28
MALES / 100 FEMALES
94.98
FEMALES / 100 MALES
35.9
MEDIAN AGE
3.3
AVG FAMILY SIZE
2.9
AVG HOUSEHOLD SIZE
27,311
LABOR FORCE [ PEOPLE ]
75.1%
PERCENT IN LABOR FORCE
6.5%
UNEMPLOYMENT RATE
Little Elm Zip Codes
Little Elm Area Codes
Income in Little Elm
Income Overview in Little Elm
Per Capita Income in Little Elm is $43,823, while median incomes of families and households are $115,670 and $110,218 respectively.
| Characteristic | Number | Measure |
| Per Capita Income | 48,241 | $43,823 |
| Median Family Income | 12,727 | $115,670 |
| Mean Family Income | 12,727 | $134,075 |
| Median Household Income | 16,752 | $110,218 |
| Mean Household Income | 16,752 | $123,129 |
| Income Deficit | 12,727 | $15,772 |
| Wage / Income Gap (%) | 48,241 | 25.75% |
| Wage / Income Gap ($) | 48,241 | 74.25¢ per $1 |
| Gini / Inequality Index | 48,241 | 0.36 |
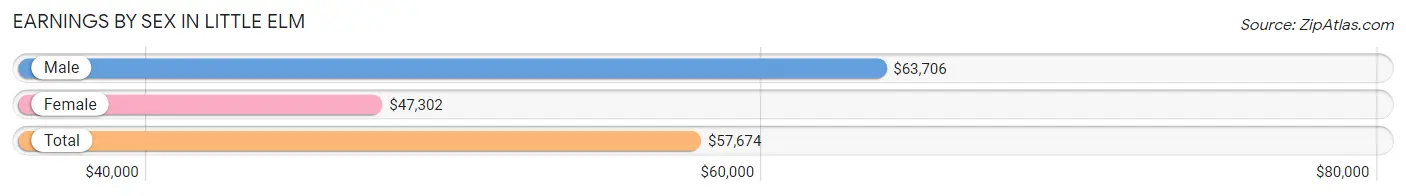
Earnings by Sex in Little Elm
Average Earnings in Little Elm are $57,674, $63,706 for men and $47,302 for women, a difference of 25.8%.
| Sex | Number | Average Earnings |
| Male | 15,747 (56.1%) | $63,706 |
| Female | 12,344 (43.9%) | $47,302 |
| Total | 28,091 (100.0%) | $57,674 |
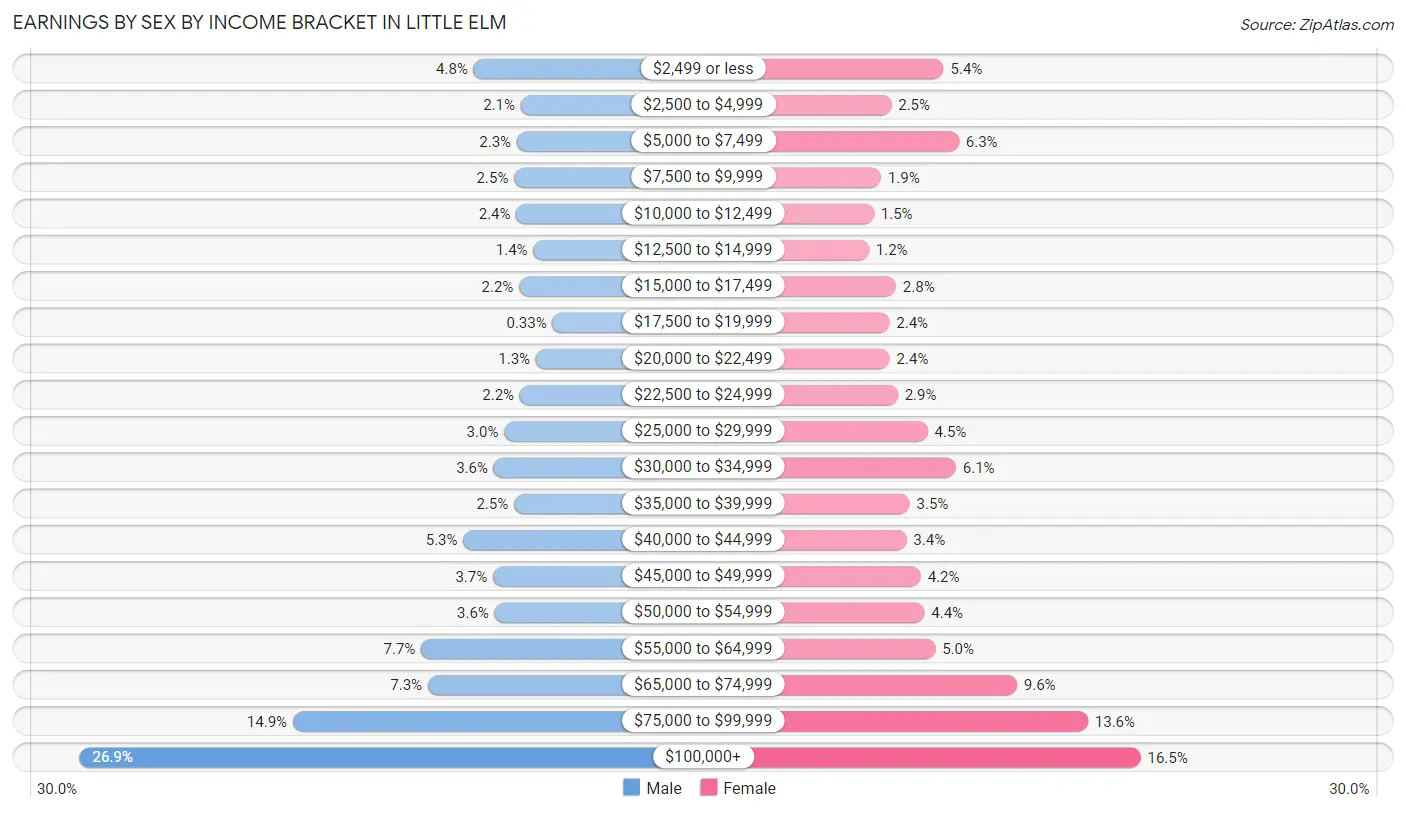
Earnings by Sex by Income Bracket in Little Elm
The most common earnings brackets in Little Elm are $100,000+ for men (4,237 | 26.9%) and $100,000+ for women (2,038 | 16.5%).
| Income | Male | Female |
| $2,499 or less | 750 (4.8%) | 671 (5.4%) |
| $2,500 to $4,999 | 332 (2.1%) | 308 (2.5%) |
| $5,000 to $7,499 | 367 (2.3%) | 778 (6.3%) |
| $7,500 to $9,999 | 390 (2.5%) | 237 (1.9%) |
| $10,000 to $12,499 | 372 (2.4%) | 188 (1.5%) |
| $12,500 to $14,999 | 220 (1.4%) | 153 (1.2%) |
| $15,000 to $17,499 | 346 (2.2%) | 341 (2.8%) |
| $17,500 to $19,999 | 52 (0.3%) | 295 (2.4%) |
| $20,000 to $22,499 | 198 (1.3%) | 297 (2.4%) |
| $22,500 to $24,999 | 340 (2.2%) | 353 (2.9%) |
| $25,000 to $29,999 | 478 (3.0%) | 560 (4.5%) |
| $30,000 to $34,999 | 572 (3.6%) | 757 (6.1%) |
| $35,000 to $39,999 | 392 (2.5%) | 436 (3.5%) |
| $40,000 to $44,999 | 841 (5.3%) | 414 (3.4%) |
| $45,000 to $49,999 | 578 (3.7%) | 514 (4.2%) |
| $50,000 to $54,999 | 563 (3.6%) | 538 (4.4%) |
| $55,000 to $64,999 | 1,214 (7.7%) | 613 (5.0%) |
| $65,000 to $74,999 | 1,155 (7.3%) | 1,180 (9.6%) |
| $75,000 to $99,999 | 2,350 (14.9%) | 1,673 (13.6%) |
| $100,000+ | 4,237 (26.9%) | 2,038 (16.5%) |
| Total | 15,747 (100.0%) | 12,344 (100.0%) |
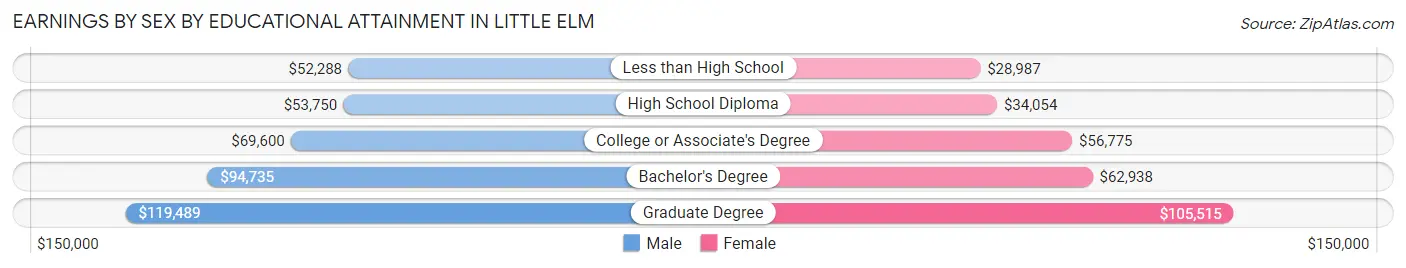
Earnings by Sex by Educational Attainment in Little Elm
Average earnings in Little Elm are $73,453 for men and $56,326 for women, a difference of 23.3%. Men with an educational attainment of graduate degree enjoy the highest average annual earnings of $119,489, while those with less than high school education earn the least with $52,288. Women with an educational attainment of graduate degree earn the most with the average annual earnings of $105,515, while those with less than high school education have the smallest earnings of $28,987.
| Educational Attainment | Male Income | Female Income |
| Less than High School | $52,288 | $28,987 |
| High School Diploma | $53,750 | $34,054 |
| College or Associate's Degree | $69,600 | $56,775 |
| Bachelor's Degree | $94,735 | $62,938 |
| Graduate Degree | $119,489 | $105,515 |
| Total | $73,453 | $56,326 |
Family Income in Little Elm
Family Income Brackets in Little Elm
According to the Little Elm family income data, there are 3,334 families falling into the $100,000 to $149,999 income range, which is the most common income bracket and makes up 26.2% of all families. Conversely, the $10,000 to $14,999 income bracket is the least frequent group with only 165 families (1.3%) belonging to this category.
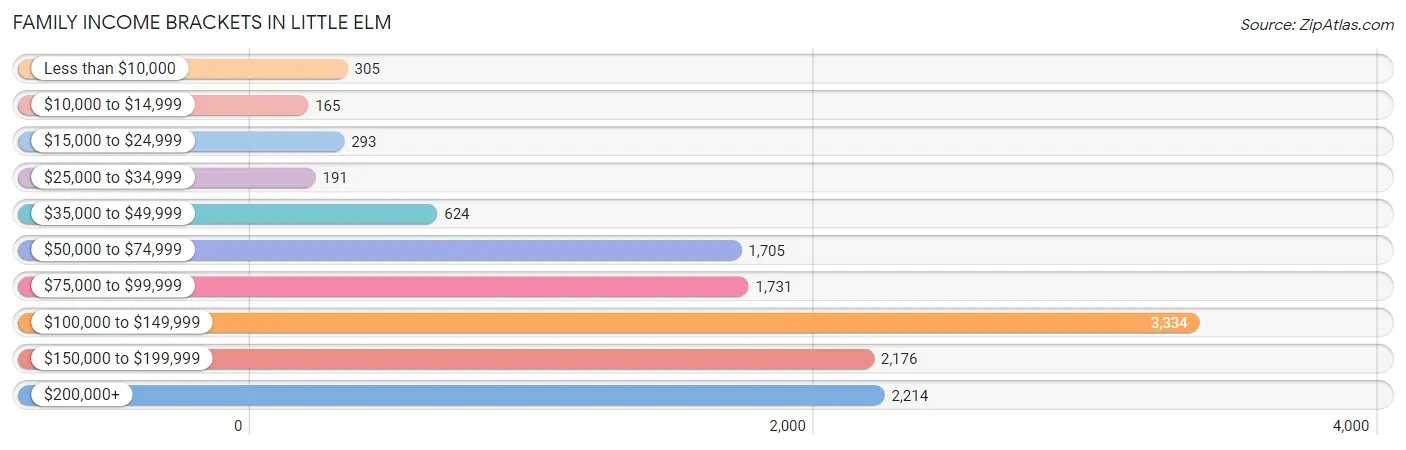
| Income Bracket | # Families | % Families |
| Less than $10,000 | 305 | 2.4% |
| $10,000 to $14,999 | 165 | 1.3% |
| $15,000 to $24,999 | 293 | 2.3% |
| $25,000 to $34,999 | 191 | 1.5% |
| $35,000 to $49,999 | 624 | 4.9% |
| $50,000 to $74,999 | 1,705 | 13.4% |
| $75,000 to $99,999 | 1,731 | 13.6% |
| $100,000 to $149,999 | 3,334 | 26.2% |
| $150,000 to $199,999 | 2,176 | 17.1% |
| $200,000+ | 2,214 | 17.4% |
Family Income by Famaliy Size in Little Elm
7+ person families (209 | 1.6%) account for the highest median family income in Little Elm with $250,001 per family, while 2-person families (4,634 | 36.4%) have the highest median income of $53,254 per family member.
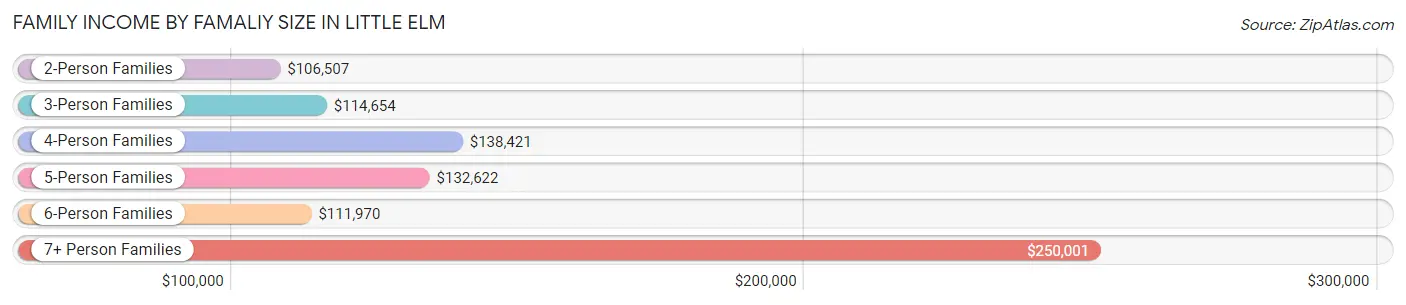
| Income Bracket | # Families | Median Income |
| 2-Person Families | 4,634 (36.4%) | $106,507 |
| 3-Person Families | 3,198 (25.1%) | $114,654 |
| 4-Person Families | 2,989 (23.5%) | $138,421 |
| 5-Person Families | 1,181 (9.3%) | $132,622 |
| 6-Person Families | 516 (4.1%) | $111,970 |
| 7+ Person Families | 209 (1.6%) | $250,001 |
| Total | 12,727 (100.0%) | $115,670 |
Family Income by Number of Earners in Little Elm
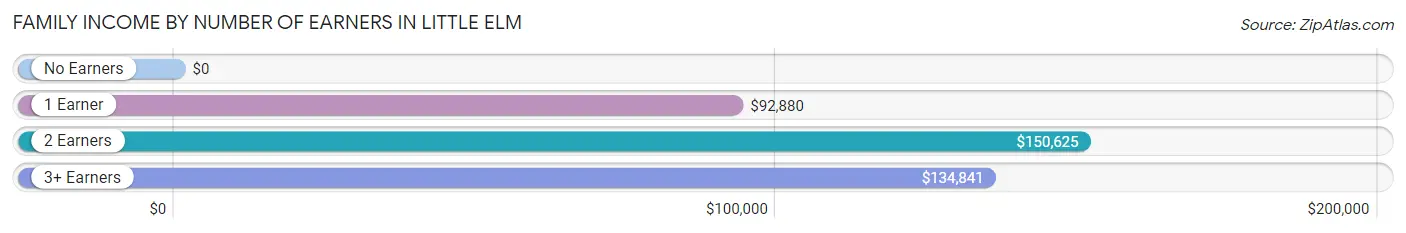
| Number of Earners | # Families | Median Income |
| No Earners | 611 (4.8%) | $0 |
| 1 Earner | 4,474 (35.1%) | $92,880 |
| 2 Earners | 5,903 (46.4%) | $150,625 |
| 3+ Earners | 1,739 (13.7%) | $134,841 |
| Total | 12,727 (100.0%) | $115,670 |
Household Income in Little Elm
Household Income Brackets in Little Elm
With 4,289 households falling in the category, the $100,000 to $149,999 income range is the most frequent in Little Elm, accounting for 25.6% of all households. In contrast, only 285 households (1.7%) fall into the less than $10,000 income bracket, making it the least populous group.
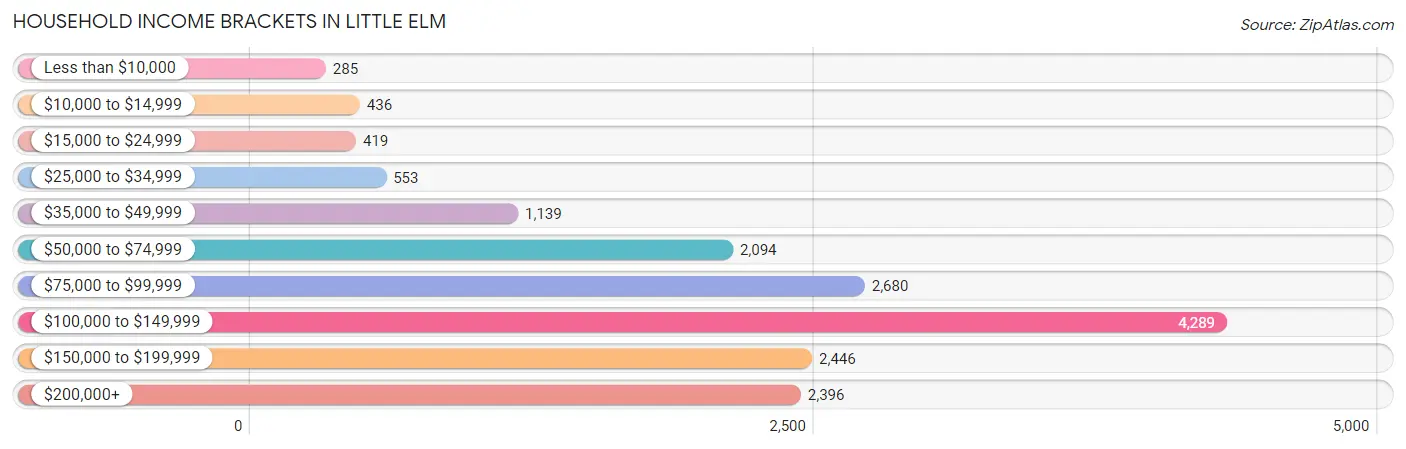
| Income Bracket | # Households | % Households |
| Less than $10,000 | 285 | 1.7% |
| $10,000 to $14,999 | 436 | 2.6% |
| $15,000 to $24,999 | 419 | 2.5% |
| $25,000 to $34,999 | 553 | 3.3% |
| $35,000 to $49,999 | 1,139 | 6.8% |
| $50,000 to $74,999 | 2,094 | 12.5% |
| $75,000 to $99,999 | 2,680 | 16.0% |
| $100,000 to $149,999 | 4,289 | 25.6% |
| $150,000 to $199,999 | 2,446 | 14.6% |
| $200,000+ | 2,396 | 14.3% |
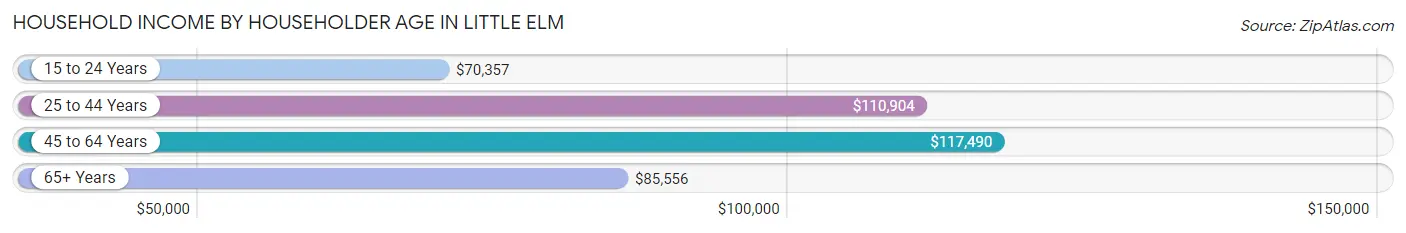
Household Income by Householder Age in Little Elm
The median household income in Little Elm is $110,218, with the highest median household income of $117,490 found in the 45 to 64 years age bracket for the primary householder. A total of 6,925 households (41.3%) fall into this category. Meanwhile, the 15 to 24 years age bracket for the primary householder has the lowest median household income of $70,357, with 678 households (4.1%) in this group.
| Income Bracket | # Households | Median Income |
| 15 to 24 Years | 678 (4.1%) | $70,357 |
| 25 to 44 Years | 7,521 (44.9%) | $110,904 |
| 45 to 64 Years | 6,925 (41.3%) | $117,490 |
| 65+ Years | 1,628 (9.7%) | $85,556 |
| Total | 16,752 (100.0%) | $110,218 |
Poverty in Little Elm
Income Below Poverty by Sex and Age in Little Elm
With 9.8% poverty level for males and 7.0% for females among the residents of Little Elm, 15 year old males and 12 to 14 year old females are the most vulnerable to poverty, with 262 males (39.8%) and 238 females (20.8%) in their respective age groups living below the poverty level.
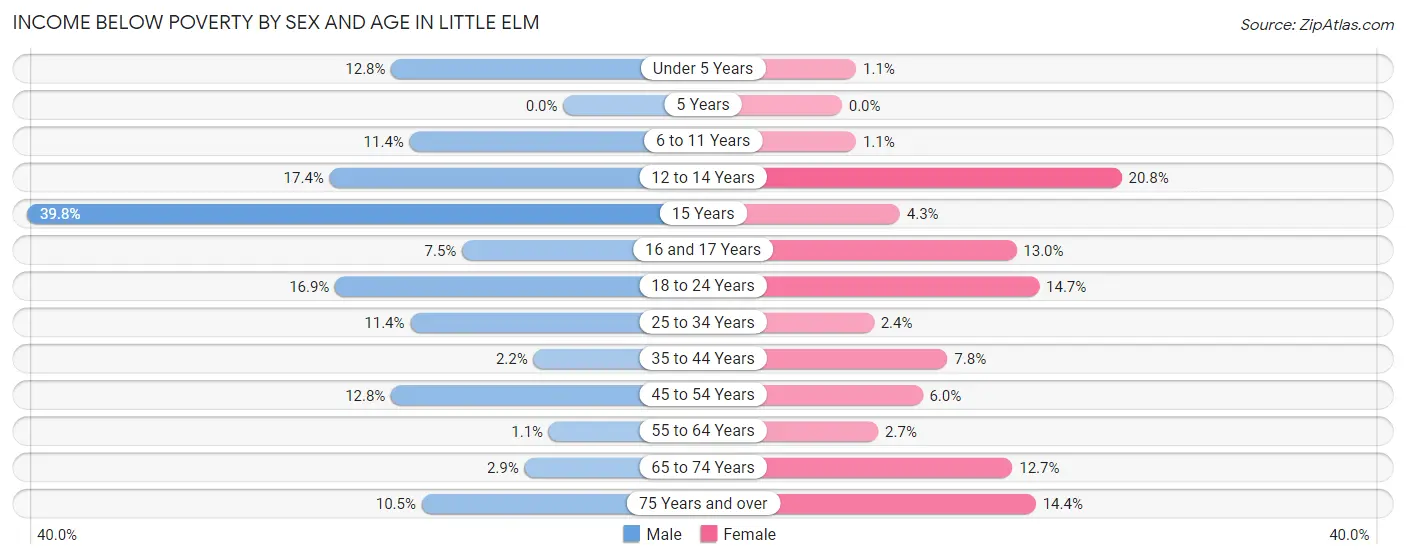
| Age Bracket | Male | Female |
| Under 5 Years | 202 (12.8%) | 10 (1.1%) |
| 5 Years | 0 (0.0%) | 0 (0.0%) |
| 6 to 11 Years | 280 (11.4%) | 22 (1.1%) |
| 12 to 14 Years | 283 (17.3%) | 238 (20.8%) |
| 15 Years | 262 (39.8%) | 24 (4.3%) |
| 16 and 17 Years | 72 (7.5%) | 140 (13.0%) |
| 18 to 24 Years | 346 (16.9%) | 251 (14.6%) |
| 25 to 34 Years | 305 (11.4%) | 72 (2.4%) |
| 35 to 44 Years | 113 (2.2%) | 388 (7.8%) |
| 45 to 54 Years | 471 (12.8%) | 213 (6.0%) |
| 55 to 64 Years | 23 (1.1%) | 62 (2.7%) |
| 65 to 74 Years | 26 (2.9%) | 147 (12.7%) |
| 75 Years and over | 45 (10.5%) | 89 (14.4%) |
| Total | 2,428 (9.8%) | 1,656 (7.0%) |
Income Above Poverty by Sex and Age in Little Elm
According to the poverty statistics in Little Elm, males aged 5 years and females aged 5 years are the age groups that are most secure financially, with 100.0% of males and 100.0% of females in these age groups living above the poverty line.
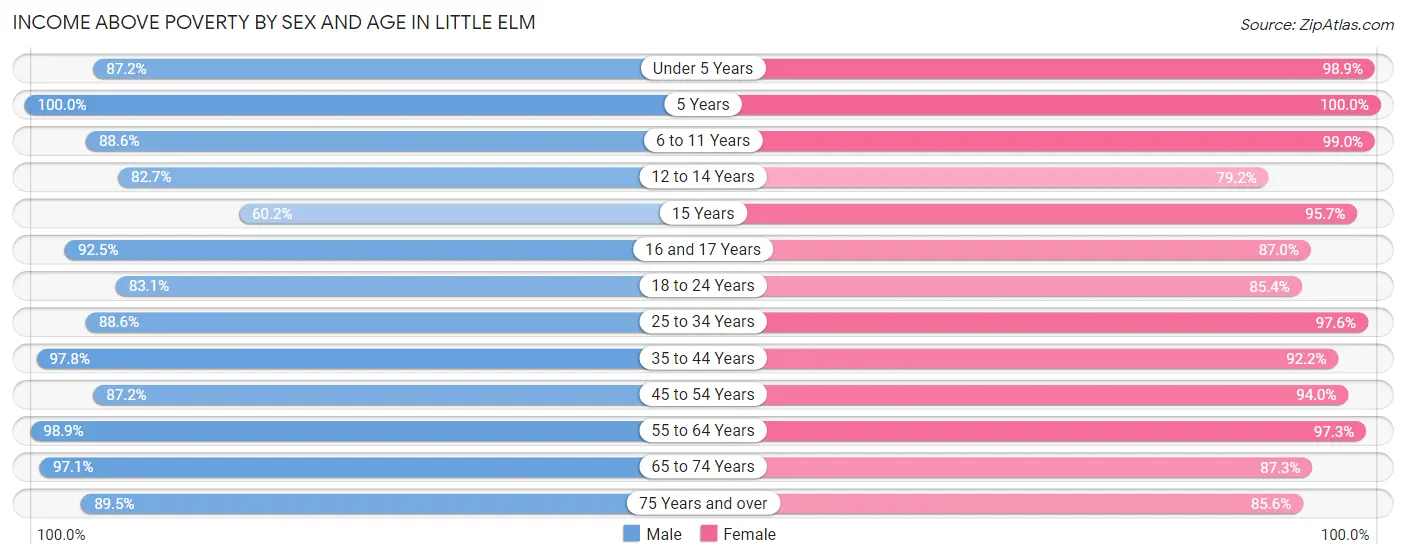
| Age Bracket | Male | Female |
| Under 5 Years | 1,380 (87.2%) | 934 (98.9%) |
| 5 Years | 388 (100.0%) | 342 (100.0%) |
| 6 to 11 Years | 2,173 (88.6%) | 2,079 (99.0%) |
| 12 to 14 Years | 1,348 (82.7%) | 908 (79.2%) |
| 15 Years | 396 (60.2%) | 533 (95.7%) |
| 16 and 17 Years | 887 (92.5%) | 940 (87.0%) |
| 18 to 24 Years | 1,696 (83.1%) | 1,462 (85.4%) |
| 25 to 34 Years | 2,379 (88.6%) | 2,963 (97.6%) |
| 35 to 44 Years | 4,990 (97.8%) | 4,563 (92.2%) |
| 45 to 54 Years | 3,214 (87.2%) | 3,343 (94.0%) |
| 55 to 64 Years | 2,129 (98.9%) | 2,234 (97.3%) |
| 65 to 74 Years | 877 (97.1%) | 1,014 (87.3%) |
| 75 Years and over | 383 (89.5%) | 529 (85.6%) |
| Total | 22,240 (90.2%) | 21,844 (92.9%) |
Income Below Poverty Among Married-Couple Families in Little Elm
The poverty statistics for married-couple families in Little Elm show that 4.3% or 406 of the total 9,454 families live below the poverty line. Families with 3 or 4 children have the highest poverty rate of 20.4%, comprising of 200 families. On the other hand, families with 5 or more children have the lowest poverty rate of 0.0%, which includes 0 families.
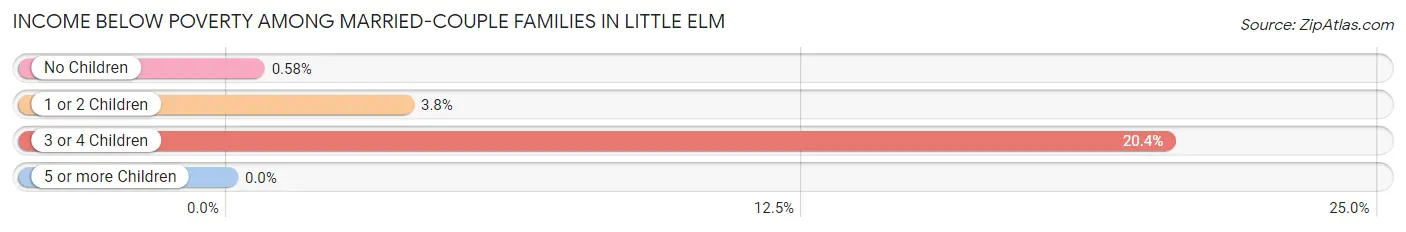
| Children | Above Poverty | Below Poverty |
| No Children | 3,595 (99.4%) | 21 (0.6%) |
| 1 or 2 Children | 4,651 (96.2%) | 185 (3.8%) |
| 3 or 4 Children | 781 (79.6%) | 200 (20.4%) |
| 5 or more Children | 21 (100.0%) | 0 (0.0%) |
| Total | 9,048 (95.7%) | 406 (4.3%) |
Income Below Poverty Among Single-Parent Households in Little Elm
According to the poverty data in Little Elm, 9.7% or 117 single-father households and 10.4% or 215 single-mother households are living below the poverty line. Among single-father households, those with 5 or more children have the highest poverty rate, with 25 households (100.0%) experiencing poverty. Likewise, among single-mother households, those with 1 or 2 children have the highest poverty rate, with 196 households (14.1%) falling below the poverty line.
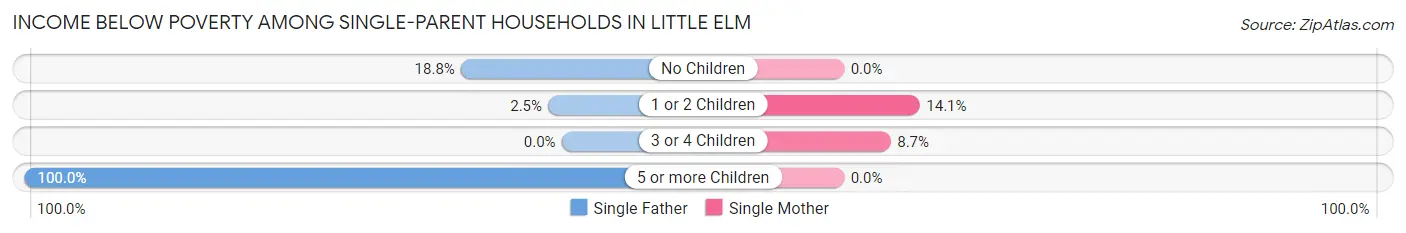
| Children | Single Father | Single Mother |
| No Children | 74 (18.8%) | 0 (0.0%) |
| 1 or 2 Children | 18 (2.5%) | 196 (14.1%) |
| 3 or 4 Children | 0 (0.0%) | 19 (8.7%) |
| 5 or more Children | 25 (100.0%) | 0 (0.0%) |
| Total | 117 (9.7%) | 215 (10.4%) |
Income Below Poverty Among Married-Couple vs Single-Parent Households in Little Elm
The poverty data for Little Elm shows that 406 of the married-couple family households (4.3%) and 332 of the single-parent households (10.1%) are living below the poverty level. Within the married-couple family households, those with 3 or 4 children have the highest poverty rate, with 200 households (20.4%) falling below the poverty line. Among the single-parent households, those with 5 or more children have the highest poverty rate, with 25 household (100.0%) living below poverty.
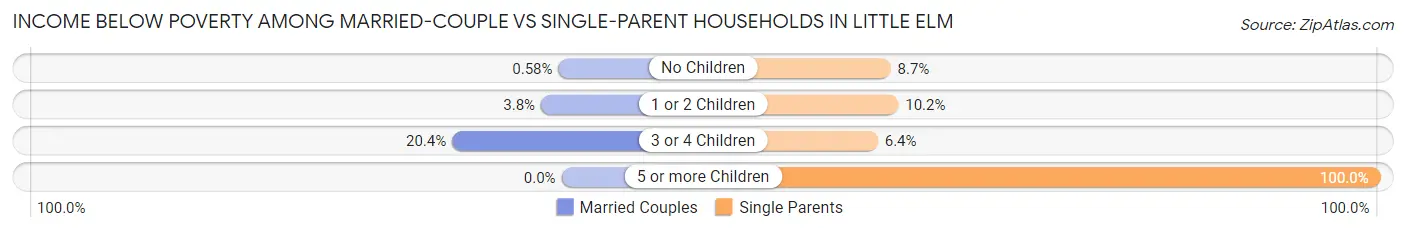
| Children | Married-Couple Families | Single-Parent Households |
| No Children | 21 (0.6%) | 74 (8.7%) |
| 1 or 2 Children | 185 (3.8%) | 214 (10.2%) |
| 3 or 4 Children | 200 (20.4%) | 19 (6.4%) |
| 5 or more Children | 0 (0.0%) | 25 (100.0%) |
| Total | 406 (4.3%) | 332 (10.1%) |
Race in Little Elm
The most populous races in Little Elm are White / Caucasian (26,101 | 54.1%), Hispanic or Latino (9,872 | 20.5%), and Black / African American (8,755 | 18.1%).
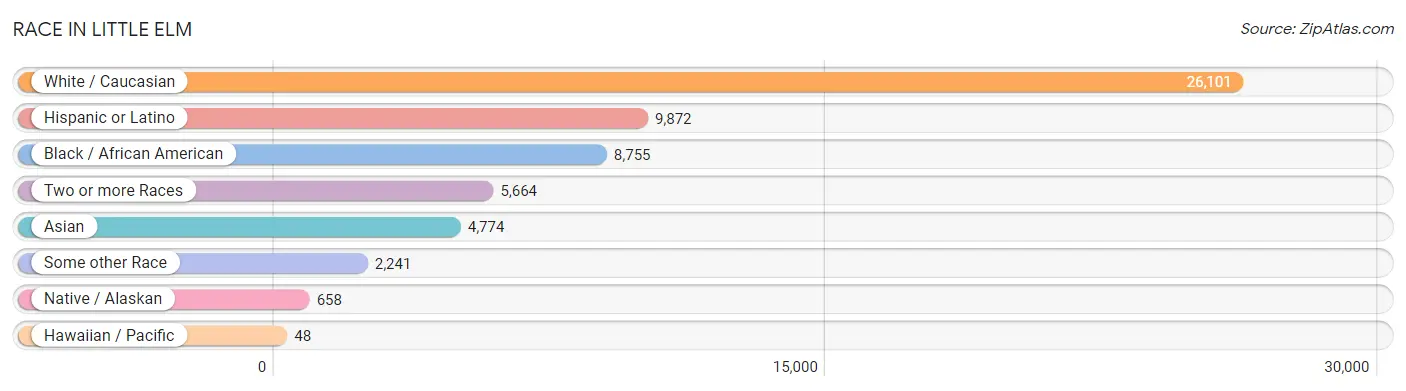
| Race | # Population | % Population |
| Asian | 4,774 | 9.9% |
| Black / African American | 8,755 | 18.1% |
| Hawaiian / Pacific | 48 | 0.1% |
| Hispanic or Latino | 9,872 | 20.5% |
| Native / Alaskan | 658 | 1.4% |
| White / Caucasian | 26,101 | 54.1% |
| Two or more Races | 5,664 | 11.7% |
| Some other Race | 2,241 | 4.6% |
| Total | 48,241 | 100.0% |
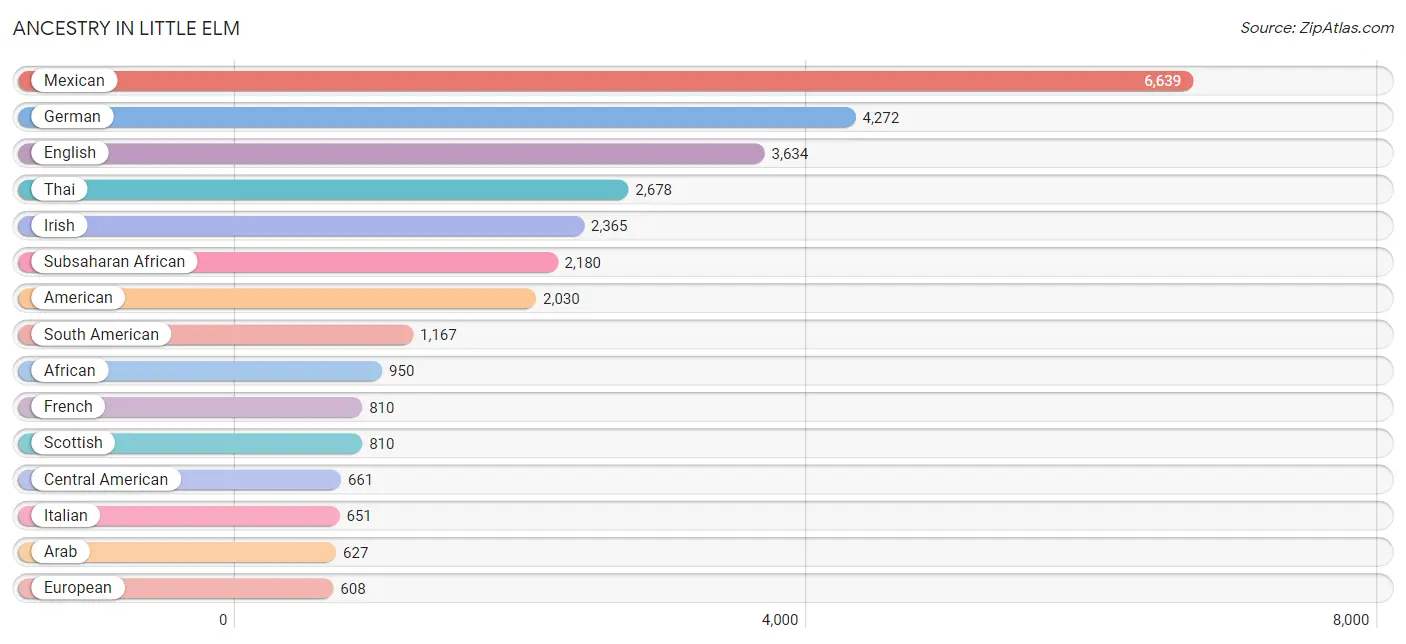
Ancestry in Little Elm
The most populous ancestries reported in Little Elm are Mexican (6,639 | 13.8%), German (4,272 | 8.9%), English (3,634 | 7.5%), Thai (2,678 | 5.6%), and Irish (2,365 | 4.9%), together accounting for 40.6% of all Little Elm residents.
| Ancestry | # Population | % Population |
| African | 950 | 2.0% |
| Alaska Native | 12 | 0.0% |
| American | 2,030 | 4.2% |
| Apache | 12 | 0.0% |
| Arab | 627 | 1.3% |
| Argentinean | 58 | 0.1% |
| Armenian | 30 | 0.1% |
| Bangladeshi | 11 | 0.0% |
| Basque | 23 | 0.1% |
| Bhutanese | 157 | 0.3% |
| Blackfeet | 21 | 0.0% |
| Brazilian | 12 | 0.0% |
| British | 139 | 0.3% |
| British West Indian | 12 | 0.0% |
| Bulgarian | 20 | 0.0% |
| Burmese | 536 | 1.1% |
| Canadian | 29 | 0.1% |
| Central American | 661 | 1.4% |
| Cherokee | 97 | 0.2% |
| Chickasaw | 10 | 0.0% |
| Choctaw | 112 | 0.2% |
| Colombian | 600 | 1.2% |
| Crow | 3 | 0.0% |
| Cuban | 218 | 0.4% |
| Czech | 193 | 0.4% |
| Danish | 94 | 0.2% |
| Dutch | 217 | 0.4% |
| Eastern European | 10 | 0.0% |
| Ecuadorian | 205 | 0.4% |
| English | 3,634 | 7.5% |
| Ethiopian | 313 | 0.6% |
| European | 608 | 1.3% |
| Finnish | 33 | 0.1% |
| French | 810 | 1.7% |
| French American Indian | 13 | 0.0% |
| French Canadian | 51 | 0.1% |
| German | 4,272 | 8.9% |
| Greek | 113 | 0.2% |
| Guamanian / Chamorro | 61 | 0.1% |
| Guatemalan | 21 | 0.0% |
| Honduran | 71 | 0.2% |
| Hungarian | 147 | 0.3% |
| Indian (Asian) | 379 | 0.8% |
| Iranian | 47 | 0.1% |
| Irish | 2,365 | 4.9% |
| Italian | 651 | 1.3% |
| Jamaican | 103 | 0.2% |
| Japanese | 25 | 0.1% |
| Kenyan | 58 | 0.1% |
| Korean | 242 | 0.5% |
| Laotian | 15 | 0.0% |
| Lebanese | 140 | 0.3% |
| Lithuanian | 30 | 0.1% |
| Mexican | 6,639 | 13.8% |
| Mexican American Indian | 564 | 1.2% |
| Moroccan | 279 | 0.6% |
| Nicaraguan | 286 | 0.6% |
| Nigerian | 438 | 0.9% |
| Northern European | 18 | 0.0% |
| Norwegian | 255 | 0.5% |
| Pakistani | 20 | 0.0% |
| Peruvian | 18 | 0.0% |
| Polish | 576 | 1.2% |
| Portuguese | 119 | 0.3% |
| Puerto Rican | 341 | 0.7% |
| Romanian | 90 | 0.2% |
| Russian | 121 | 0.3% |
| Salvadoran | 283 | 0.6% |
| Scandinavian | 264 | 0.5% |
| Scotch-Irish | 230 | 0.5% |
| Scottish | 810 | 1.7% |
| Serbian | 30 | 0.1% |
| Slavic | 42 | 0.1% |
| Slovak | 3 | 0.0% |
| Slovene | 49 | 0.1% |
| South African | 26 | 0.1% |
| South American | 1,167 | 2.4% |
| South American Indian | 163 | 0.3% |
| Spaniard | 216 | 0.4% |
| Spanish | 363 | 0.7% |
| Sri Lankan | 248 | 0.5% |
| Subsaharan African | 2,180 | 4.5% |
| Swedish | 172 | 0.4% |
| Swiss | 148 | 0.3% |
| Thai | 2,678 | 5.6% |
| Turkish | 84 | 0.2% |
| Ugandan | 312 | 0.6% |
| Ukrainian | 39 | 0.1% |
| Venezuelan | 286 | 0.6% |
| Welsh | 46 | 0.1% |
| Yugoslavian | 13 | 0.0% | View All 91 Rows |
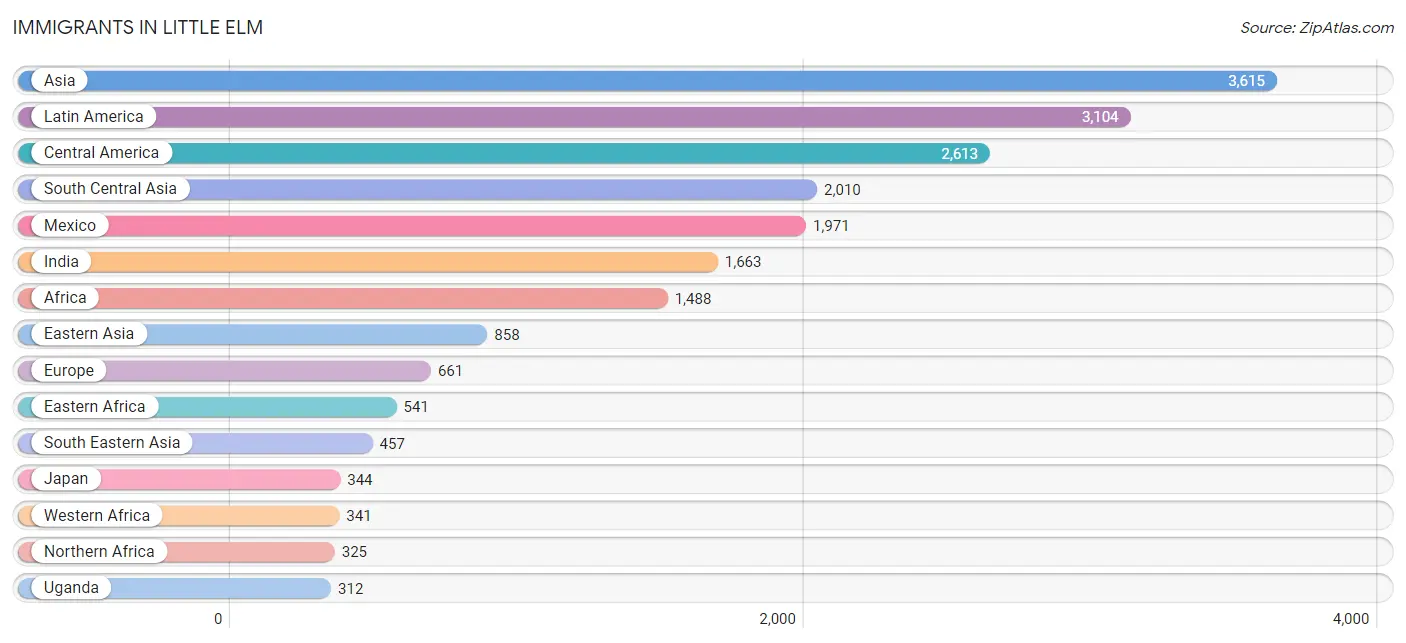
Immigrants in Little Elm
The most numerous immigrant groups reported in Little Elm came from Asia (3,615 | 7.5%), Latin America (3,104 | 6.4%), Central America (2,613 | 5.4%), South Central Asia (2,010 | 4.2%), and Mexico (1,971 | 4.1%), together accounting for 27.6% of all Little Elm residents.
| Immigration Origin | # Population | % Population |
| Africa | 1,488 | 3.1% |
| Argentina | 31 | 0.1% |
| Asia | 3,615 | 7.5% |
| Bangladesh | 8 | 0.0% |
| Bosnia and Herzegovina | 59 | 0.1% |
| Brazil | 12 | 0.0% |
| Bulgaria | 20 | 0.0% |
| Cameroon | 255 | 0.5% |
| Canada | 103 | 0.2% |
| Caribbean | 227 | 0.5% |
| Central America | 2,613 | 5.4% |
| China | 205 | 0.4% |
| Colombia | 141 | 0.3% |
| Cuba | 149 | 0.3% |
| Eastern Africa | 541 | 1.1% |
| Eastern Asia | 858 | 1.8% |
| Eastern Europe | 292 | 0.6% |
| Egypt | 70 | 0.2% |
| El Salvador | 263 | 0.5% |
| England | 9 | 0.0% |
| Ethiopia | 165 | 0.3% |
| Europe | 661 | 1.4% |
| France | 9 | 0.0% |
| Germany | 29 | 0.1% |
| Greece | 35 | 0.1% |
| Guatemala | 21 | 0.0% |
| Honduras | 71 | 0.2% |
| India | 1,663 | 3.5% |
| Indonesia | 15 | 0.0% |
| Iran | 31 | 0.1% |
| Iraq | 57 | 0.1% |
| Jamaica | 66 | 0.1% |
| Japan | 344 | 0.7% |
| Jordan | 30 | 0.1% |
| Kenya | 64 | 0.1% |
| Korea | 309 | 0.6% |
| Latin America | 3,104 | 6.4% |
| Lebanon | 79 | 0.2% |
| Malaysia | 4 | 0.0% |
| Mexico | 1,971 | 4.1% |
| Middle Africa | 255 | 0.5% |
| Moldova | 82 | 0.2% |
| Morocco | 153 | 0.3% |
| Nicaragua | 287 | 0.6% |
| Nigeria | 221 | 0.5% |
| Northern Africa | 325 | 0.7% |
| Northern Europe | 28 | 0.1% |
| Oceania | 10 | 0.0% |
| Pakistan | 219 | 0.4% |
| Peru | 32 | 0.1% |
| Philippines | 249 | 0.5% |
| Romania | 86 | 0.2% |
| Russia | 45 | 0.1% |
| Saudi Arabia | 29 | 0.1% |
| South Africa | 26 | 0.1% |
| South America | 264 | 0.5% |
| South Central Asia | 2,010 | 4.2% |
| South Eastern Asia | 457 | 0.9% |
| Southern Europe | 303 | 0.6% |
| Spain | 268 | 0.6% |
| Sri Lanka | 45 | 0.1% |
| Sudan | 102 | 0.2% |
| Taiwan | 9 | 0.0% |
| Thailand | 31 | 0.1% |
| Turkey | 84 | 0.2% |
| Uganda | 312 | 0.6% |
| Uzbekistan | 44 | 0.1% |
| Venezuela | 48 | 0.1% |
| Vietnam | 158 | 0.3% |
| Western Africa | 341 | 0.7% |
| Western Asia | 290 | 0.6% |
| Western Europe | 38 | 0.1% | View All 72 Rows |
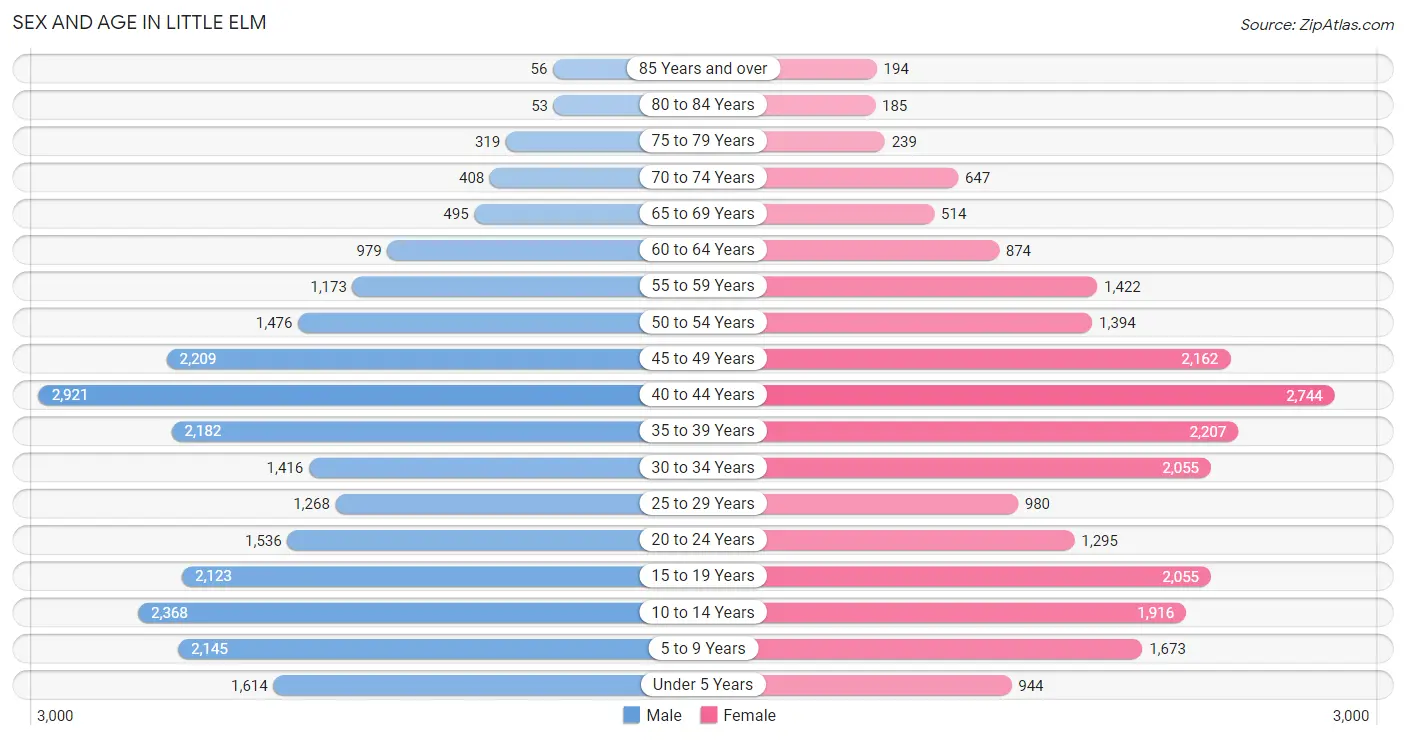
Sex and Age in Little Elm
Sex and Age in Little Elm
The most populous age groups in Little Elm are 40 to 44 Years (2,921 | 11.8%) for men and 40 to 44 Years (2,744 | 11.7%) for women.
| Age Bracket | Male | Female |
| Under 5 Years | 1,614 (6.5%) | 944 (4.0%) |
| 5 to 9 Years | 2,145 (8.7%) | 1,673 (7.1%) |
| 10 to 14 Years | 2,368 (9.6%) | 1,916 (8.2%) |
| 15 to 19 Years | 2,123 (8.6%) | 2,055 (8.7%) |
| 20 to 24 Years | 1,536 (6.2%) | 1,295 (5.5%) |
| 25 to 29 Years | 1,268 (5.1%) | 980 (4.2%) |
| 30 to 34 Years | 1,416 (5.7%) | 2,055 (8.7%) |
| 35 to 39 Years | 2,182 (8.8%) | 2,207 (9.4%) |
| 40 to 44 Years | 2,921 (11.8%) | 2,744 (11.7%) |
| 45 to 49 Years | 2,209 (8.9%) | 2,162 (9.2%) |
| 50 to 54 Years | 1,476 (6.0%) | 1,394 (5.9%) |
| 55 to 59 Years | 1,173 (4.7%) | 1,422 (6.0%) |
| 60 to 64 Years | 979 (4.0%) | 874 (3.7%) |
| 65 to 69 Years | 495 (2.0%) | 514 (2.2%) |
| 70 to 74 Years | 408 (1.7%) | 647 (2.8%) |
| 75 to 79 Years | 319 (1.3%) | 239 (1.0%) |
| 80 to 84 Years | 53 (0.2%) | 185 (0.8%) |
| 85 Years and over | 56 (0.2%) | 194 (0.8%) |
| Total | 24,741 (100.0%) | 23,500 (100.0%) |
Families and Households in Little Elm
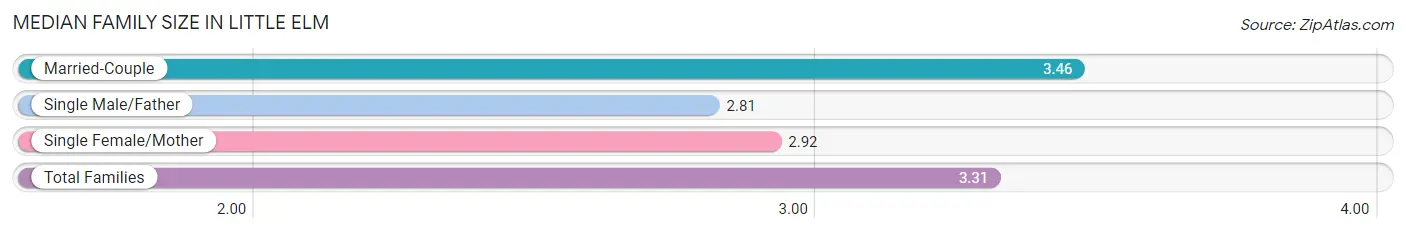
Median Family Size in Little Elm
The median family size in Little Elm is 3.31 persons per family, with married-couple families (9,454 | 74.3%) accounting for the largest median family size of 3.46 persons per family. On the other hand, single male/father families (1,211 | 9.5%) represent the smallest median family size with 2.81 persons per family.
| Family Type | # Families | Family Size |
| Married-Couple | 9,454 (74.3%) | 3.46 |
| Single Male/Father | 1,211 (9.5%) | 2.81 |
| Single Female/Mother | 2,062 (16.2%) | 2.92 |
| Total Families | 12,727 (100.0%) | 3.31 |
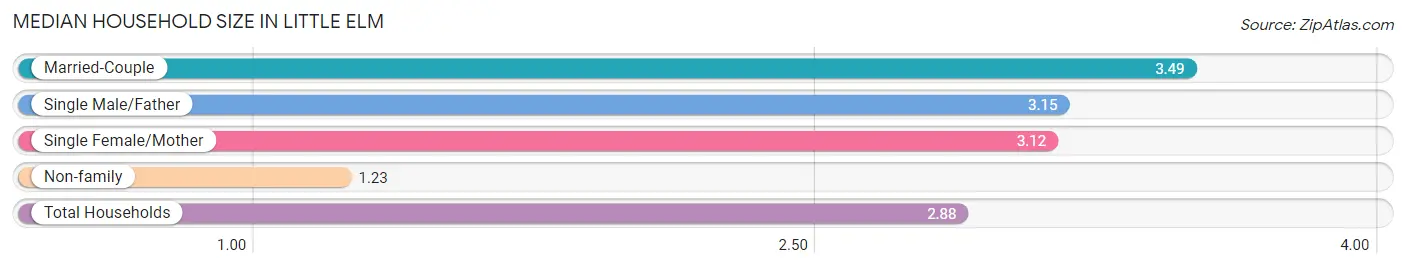
Median Household Size in Little Elm
The median household size in Little Elm is 2.88 persons per household, with married-couple households (9,454 | 56.4%) accounting for the largest median household size of 3.49 persons per household. non-family households (4,025 | 24.0%) represent the smallest median household size with 1.23 persons per household.
| Household Type | # Households | Household Size |
| Married-Couple | 9,454 (56.4%) | 3.49 |
| Single Male/Father | 1,211 (7.2%) | 3.15 |
| Single Female/Mother | 2,062 (12.3%) | 3.12 |
| Non-family | 4,025 (24.0%) | 1.23 |
| Total Households | 16,752 (100.0%) | 2.88 |
Household Size by Marriage Status in Little Elm
Out of a total of 16,752 households in Little Elm, 12,727 (76.0%) are family households, while 4,025 (24.0%) are nonfamily households. The most numerous type of family households are 2-person households, comprising 4,294, and the most common type of nonfamily households are 1-person households, comprising 3,397.
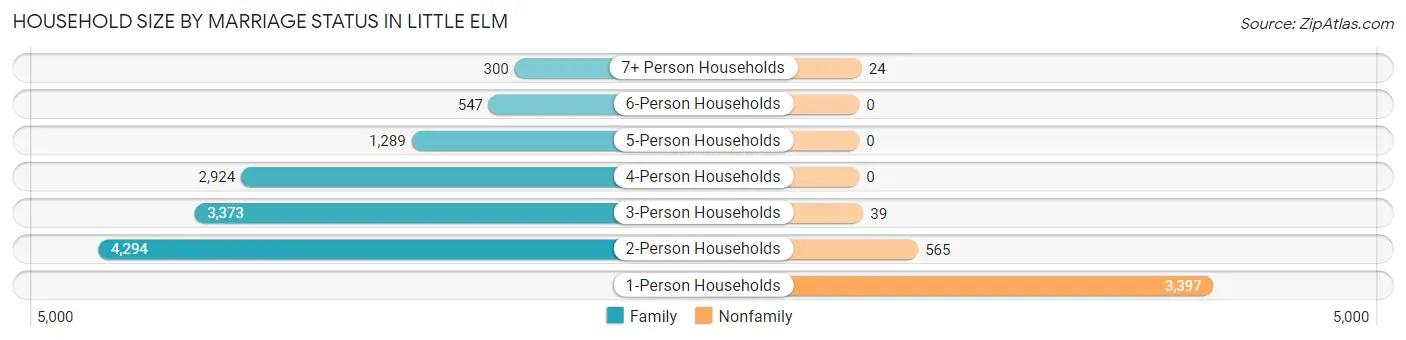
| Household Size | Family Households | Nonfamily Households |
| 1-Person Households | - | 3,397 (20.3%) |
| 2-Person Households | 4,294 (25.6%) | 565 (3.4%) |
| 3-Person Households | 3,373 (20.1%) | 39 (0.2%) |
| 4-Person Households | 2,924 (17.4%) | 0 (0.0%) |
| 5-Person Households | 1,289 (7.7%) | 0 (0.0%) |
| 6-Person Households | 547 (3.3%) | 0 (0.0%) |
| 7+ Person Households | 300 (1.8%) | 24 (0.1%) |
| Total | 12,727 (76.0%) | 4,025 (24.0%) |
Female Fertility in Little Elm
Fertility by Age in Little Elm
Average fertility rate in Little Elm is 62.0 births per 1,000 women. Women in the age bracket of 20 to 34 years have the highest fertility rate with 69.0 births per 1,000 women. Women in the age bracket of 35 to 50 years acount for 60.1% of all women with births.
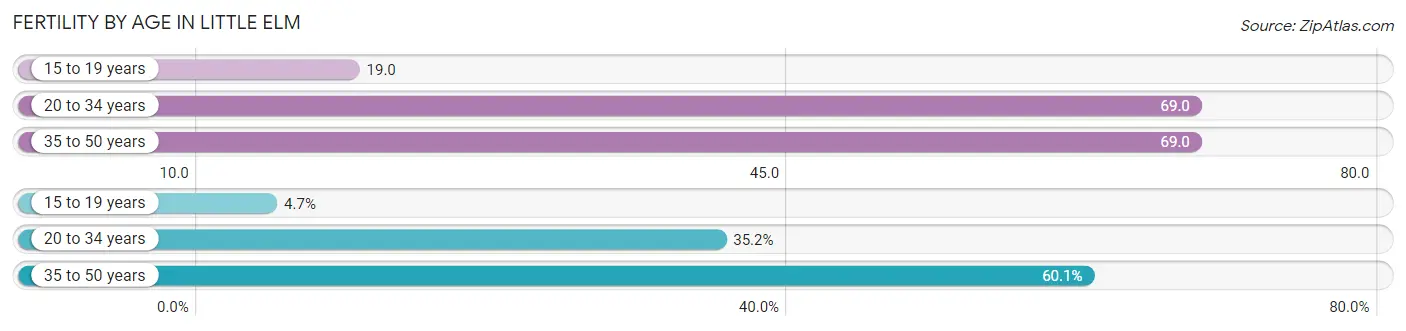
| Age Bracket | Women with Births | Births / 1,000 Women |
| 15 to 19 years | 40 (4.7%) | 19.0 |
| 20 to 34 years | 300 (35.2%) | 69.0 |
| 35 to 50 years | 513 (60.1%) | 69.0 |
| Total | 853 (100.0%) | 62.0 |
Fertility by Age by Marriage Status in Little Elm
83.8% of women with births (853) in Little Elm are married. The highest percentage of unmarried women with births falls into 35 to 50 years age bracket with 24.9% of them unmarried at the time of birth, while the lowest percentage of unmarried women with births belong to 15 to 19 years age bracket with 0.0% of them unmarried.
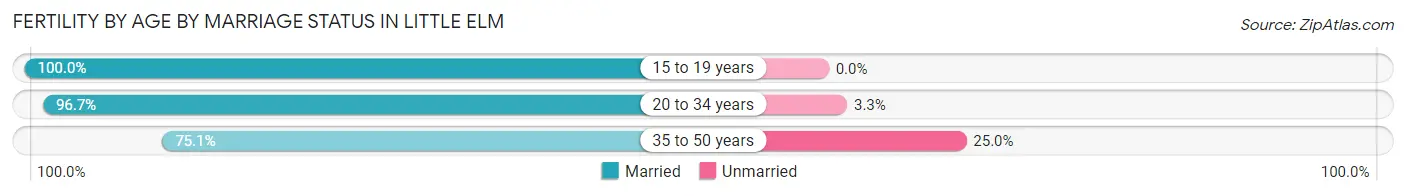
| Age Bracket | Married | Unmarried |
| 15 to 19 years | 40 (100.0%) | 0 (0.0%) |
| 20 to 34 years | 290 (96.7%) | 10 (3.3%) |
| 35 to 50 years | 385 (75.0%) | 128 (24.9%) |
| Total | 715 (83.8%) | 138 (16.2%) |
Fertility by Education in Little Elm
Average fertility rate in Little Elm is 62.0 births per 1,000 women. Women with the education attainment of graduate degree have the highest fertility rate of 130.0 births per 1,000 women, while women with the education attainment of bachelor's degree have the lowest fertility at 27.0 births per 1,000 women. Women with the education attainment of graduate degree represent 35.8% of all women with births.
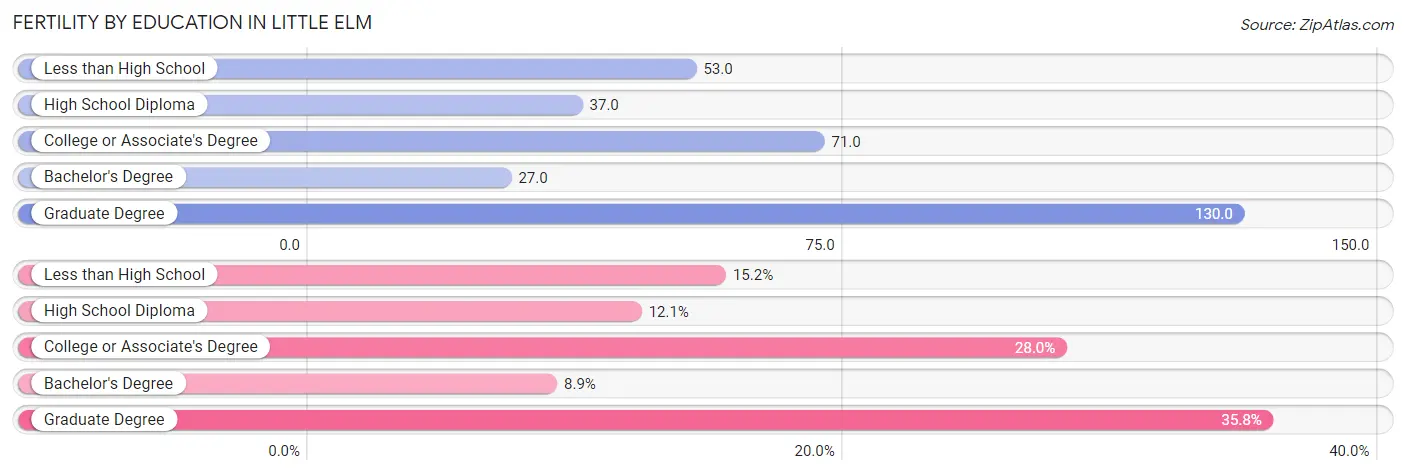
| Educational Attainment | Women with Births | Births / 1,000 Women |
| Less than High School | 130 (15.2%) | 53.0 |
| High School Diploma | 103 (12.1%) | 37.0 |
| College or Associate's Degree | 239 (28.0%) | 71.0 |
| Bachelor's Degree | 76 (8.9%) | 27.0 |
| Graduate Degree | 305 (35.8%) | 130.0 |
| Total | 853 (100.0%) | 62.0 |
Fertility by Education by Marriage Status in Little Elm
16.2% of women with births in Little Elm are unmarried. Women with the educational attainment of bachelor's degree are most likely to be married with 100.0% of them married at childbirth, while women with the educational attainment of less than high school are least likely to be married with 69.2% of them unmarried at childbirth.
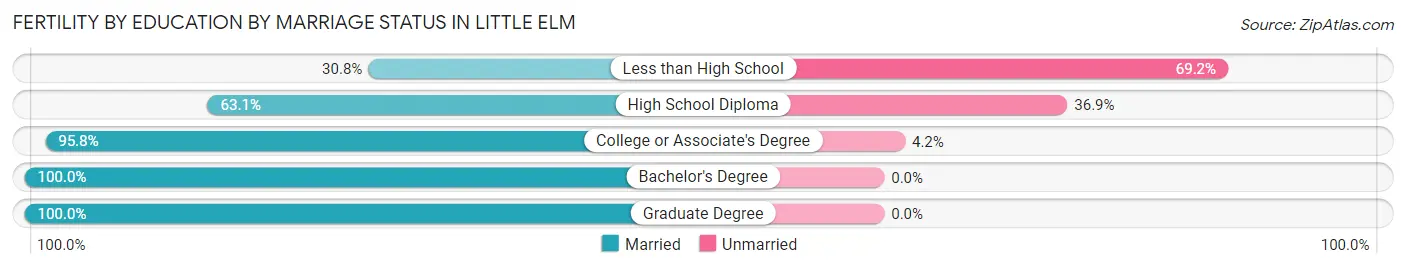
| Educational Attainment | Married | Unmarried |
| Less than High School | 40 (30.8%) | 90 (69.2%) |
| High School Diploma | 65 (63.1%) | 38 (36.9%) |
| College or Associate's Degree | 229 (95.8%) | 10 (4.2%) |
| Bachelor's Degree | 76 (100.0%) | 0 (0.0%) |
| Graduate Degree | 305 (100.0%) | 0 (0.0%) |
| Total | 715 (83.8%) | 138 (16.2%) |
Employment Characteristics in Little Elm
Employment by Class of Employer in Little Elm
Among the 25,083 employed individuals in Little Elm, private company employees (19,439 | 77.5%), local government employees (1,554 | 6.2%), and not-for-profit organizations (1,326 | 5.3%) make up the most common classes of employment.
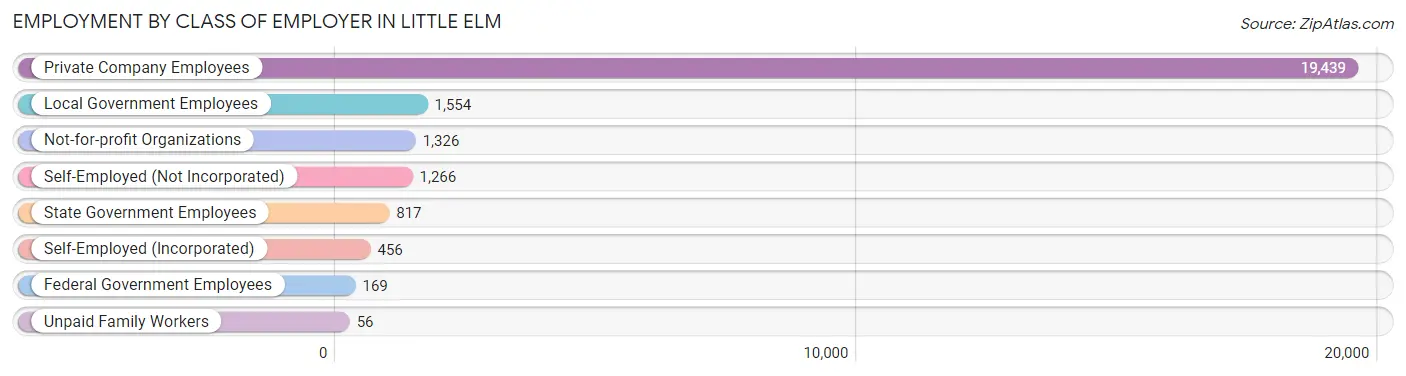
| Employer Class | # Employees | % Employees |
| Private Company Employees | 19,439 | 77.5% |
| Self-Employed (Incorporated) | 456 | 1.8% |
| Self-Employed (Not Incorporated) | 1,266 | 5.1% |
| Not-for-profit Organizations | 1,326 | 5.3% |
| Local Government Employees | 1,554 | 6.2% |
| State Government Employees | 817 | 3.3% |
| Federal Government Employees | 169 | 0.7% |
| Unpaid Family Workers | 56 | 0.2% |
| Total | 25,083 | 100.0% |
Employment Status by Age in Little Elm
According to the labor force statistics for Little Elm, out of the total population over 16 years of age (36,366), 75.1% or 27,311 individuals are in the labor force, with 6.5% or 1,775 of them unemployed. The age group with the highest labor force participation rate is 45 to 54 years, with 88.0% or 6,372 individuals in the labor force. Within the labor force, the 65 to 74 years age range has the highest percentage of unemployed individuals, with 10.8% or 65 of them being unemployed.
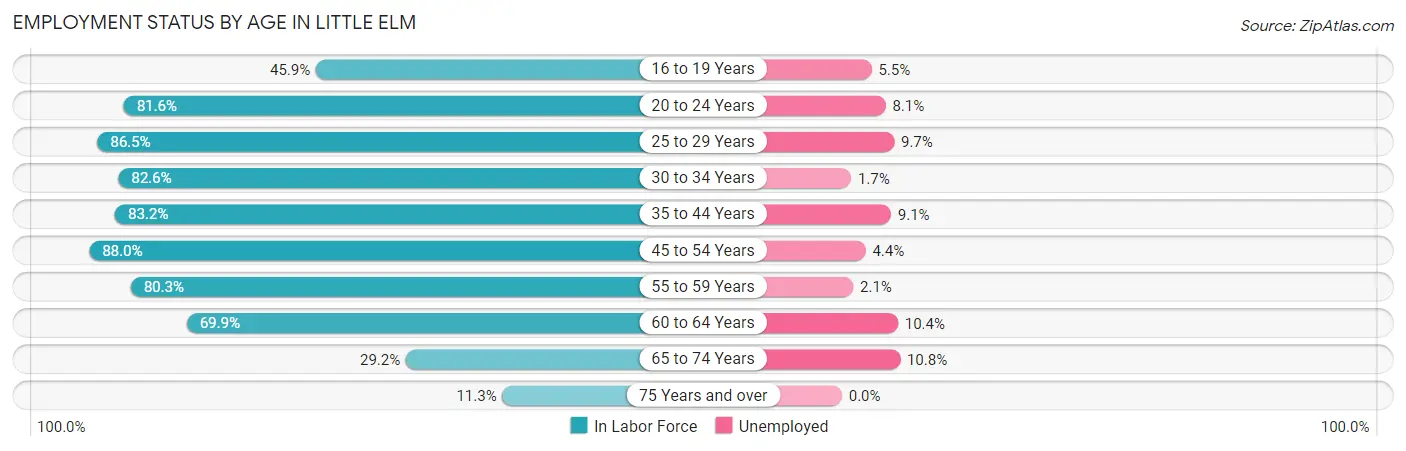
| Age Bracket | In Labor Force | Unemployed |
| 16 to 19 Years | 1,360 (45.9%) | 75 (5.5%) |
| 20 to 24 Years | 2,310 (81.6%) | 187 (8.1%) |
| 25 to 29 Years | 1,945 (86.5%) | 189 (9.7%) |
| 30 to 34 Years | 2,867 (82.6%) | 49 (1.7%) |
| 35 to 44 Years | 8,365 (83.2%) | 761 (9.1%) |
| 45 to 54 Years | 6,372 (88.0%) | 280 (4.4%) |
| 55 to 59 Years | 2,084 (80.3%) | 44 (2.1%) |
| 60 to 64 Years | 1,295 (69.9%) | 135 (10.4%) |
| 65 to 74 Years | 603 (29.2%) | 65 (10.8%) |
| 75 Years and over | 118 (11.3%) | 0 (0.0%) |
| Total | 27,311 (75.1%) | 1,775 (6.5%) |
Employment Status by Educational Attainment in Little Elm
According to labor force statistics for Little Elm, 83.5% of individuals (22,931) out of the total population between 25 and 64 years of age (27,462) are in the labor force, with 6.3% or 1,445 of them being unemployed. The group with the highest labor force participation rate are those with the educational attainment of college / associate degree, with 88.6% or 7,784 individuals in the labor force. Within the labor force, individuals with high school diploma education have the highest percentage of unemployment, with 12.9% or 580 of them being unemployed.
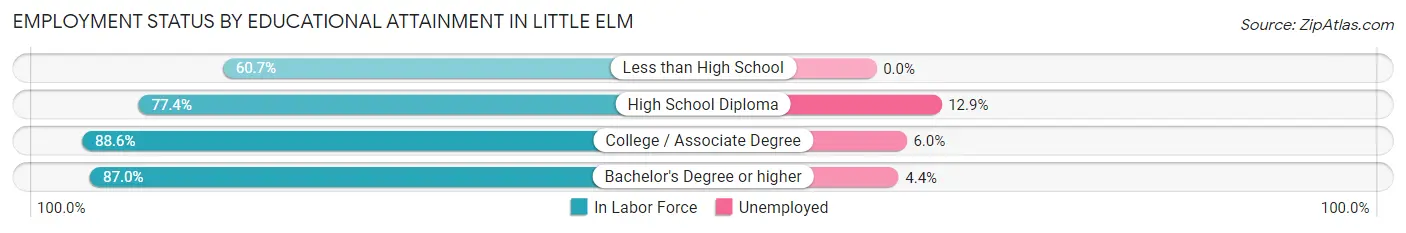
| Educational Attainment | In Labor Force | Unemployed |
| Less than High School | 1,285 (60.7%) | 0 (0.0%) |
| High School Diploma | 4,495 (77.4%) | 749 (12.9%) |
| College / Associate Degree | 7,784 (88.6%) | 527 (6.0%) |
| Bachelor's Degree or higher | 9,354 (87.0%) | 473 (4.4%) |
| Total | 22,931 (83.5%) | 1,730 (6.3%) |
Employment Occupations by Sex in Little Elm
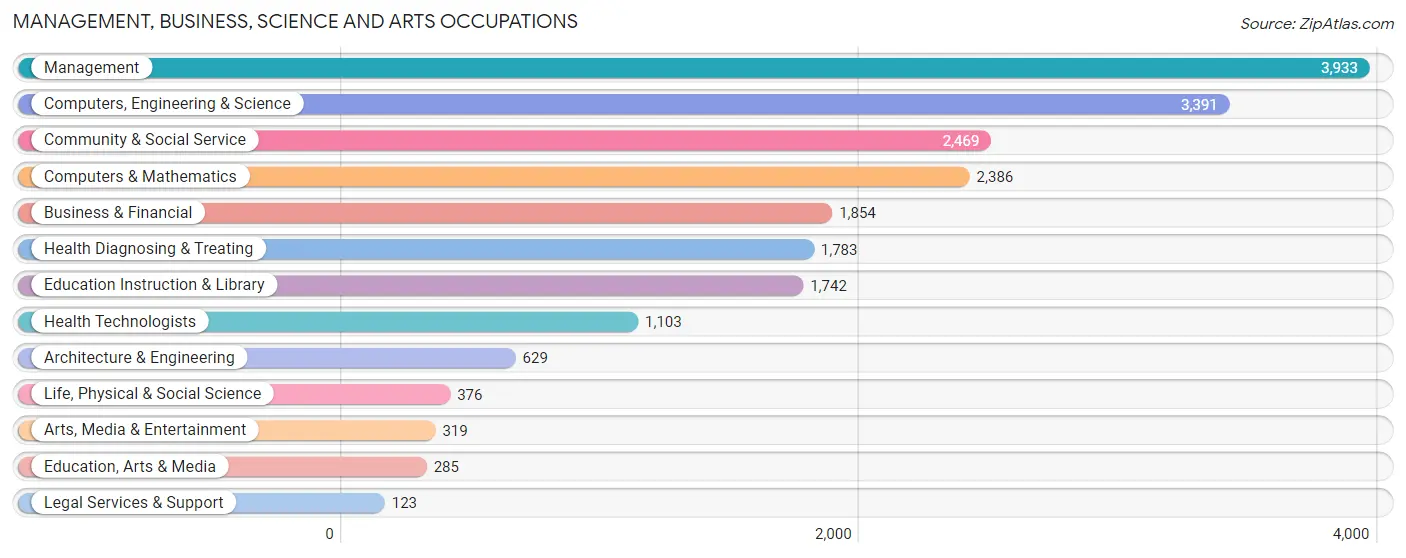
Management, Business, Science and Arts Occupations
The most common Management, Business, Science and Arts occupations in Little Elm are Management (3,933 | 15.4%), Computers, Engineering & Science (3,391 | 13.3%), Community & Social Service (2,469 | 9.7%), Computers & Mathematics (2,386 | 9.3%), and Business & Financial (1,854 | 7.3%).
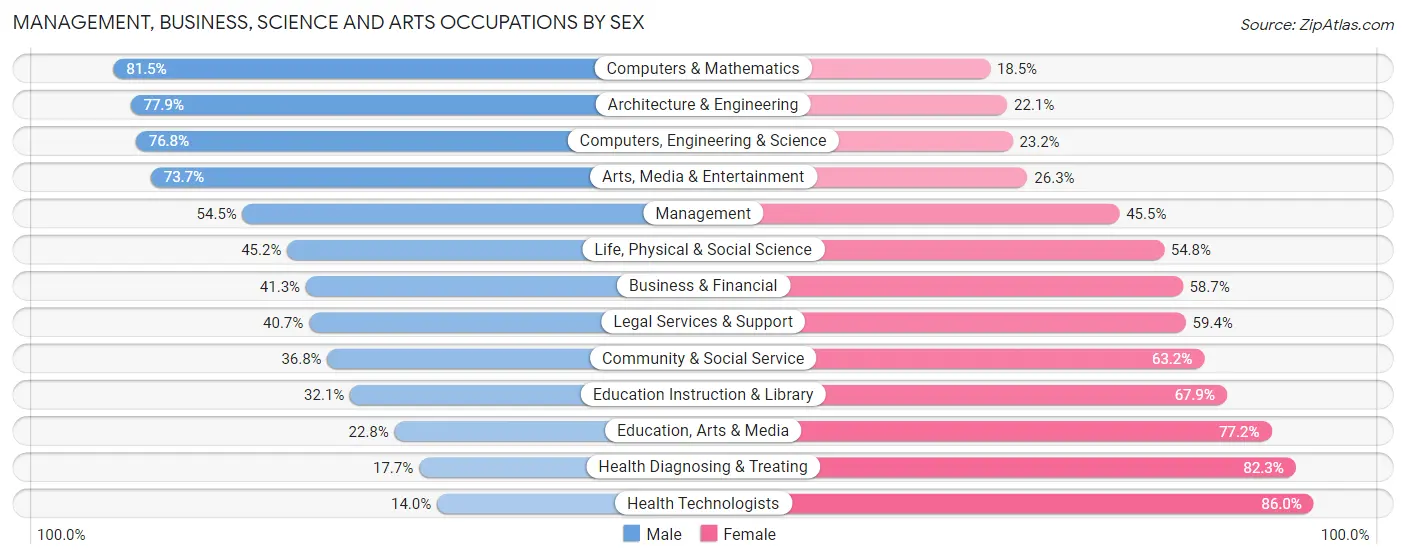
Management, Business, Science and Arts Occupations by Sex
Within the Management, Business, Science and Arts occupations in Little Elm, the most male-oriented occupations are Computers & Mathematics (81.5%), Architecture & Engineering (77.9%), and Computers, Engineering & Science (76.8%), while the most female-oriented occupations are Health Technologists (86.0%), Health Diagnosing & Treating (82.3%), and Education, Arts & Media (77.2%).
| Occupation | Male | Female |
| Management | 2,144 (54.5%) | 1,789 (45.5%) |
| Business & Financial | 766 (41.3%) | 1,088 (58.7%) |
| Computers, Engineering & Science | 2,604 (76.8%) | 787 (23.2%) |
| Computers & Mathematics | 1,944 (81.5%) | 442 (18.5%) |
| Architecture & Engineering | 490 (77.9%) | 139 (22.1%) |
| Life, Physical & Social Science | 170 (45.2%) | 206 (54.8%) |
| Community & Social Service | 909 (36.8%) | 1,560 (63.2%) |
| Education, Arts & Media | 65 (22.8%) | 220 (77.2%) |
| Legal Services & Support | 50 (40.6%) | 73 (59.4%) |
| Education Instruction & Library | 559 (32.1%) | 1,183 (67.9%) |
| Arts, Media & Entertainment | 235 (73.7%) | 84 (26.3%) |
| Health Diagnosing & Treating | 316 (17.7%) | 1,467 (82.3%) |
| Health Technologists | 154 (14.0%) | 949 (86.0%) |
| Total (Category) | 6,739 (50.2%) | 6,691 (49.8%) |
| Total (Overall) | 14,363 (56.3%) | 11,148 (43.7%) |
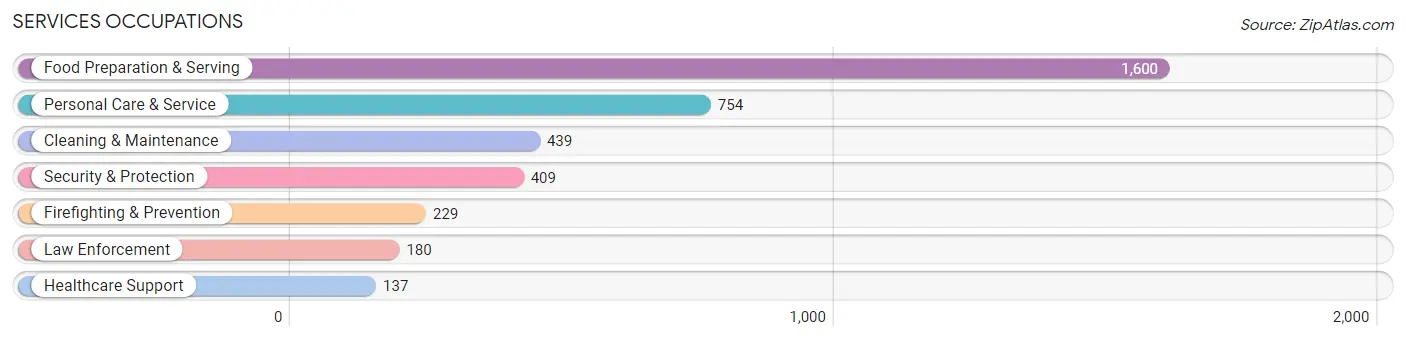
Services Occupations
The most common Services occupations in Little Elm are Food Preparation & Serving (1,600 | 6.3%), Personal Care & Service (754 | 3.0%), Cleaning & Maintenance (439 | 1.7%), Security & Protection (409 | 1.6%), and Firefighting & Prevention (229 | 0.9%).
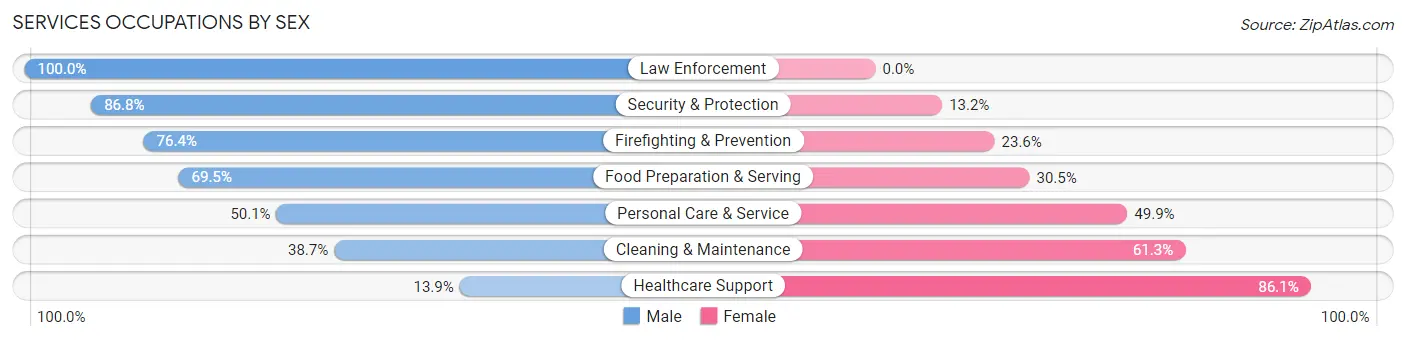
Services Occupations by Sex
Within the Services occupations in Little Elm, the most male-oriented occupations are Law Enforcement (100.0%), Security & Protection (86.8%), and Firefighting & Prevention (76.4%), while the most female-oriented occupations are Healthcare Support (86.1%), Cleaning & Maintenance (61.3%), and Personal Care & Service (49.9%).
| Occupation | Male | Female |
| Healthcare Support | 19 (13.9%) | 118 (86.1%) |
| Security & Protection | 355 (86.8%) | 54 (13.2%) |
| Firefighting & Prevention | 175 (76.4%) | 54 (23.6%) |
| Law Enforcement | 180 (100.0%) | 0 (0.0%) |
| Food Preparation & Serving | 1,112 (69.5%) | 488 (30.5%) |
| Cleaning & Maintenance | 170 (38.7%) | 269 (61.3%) |
| Personal Care & Service | 378 (50.1%) | 376 (49.9%) |
| Total (Category) | 2,034 (60.9%) | 1,305 (39.1%) |
| Total (Overall) | 14,363 (56.3%) | 11,148 (43.7%) |
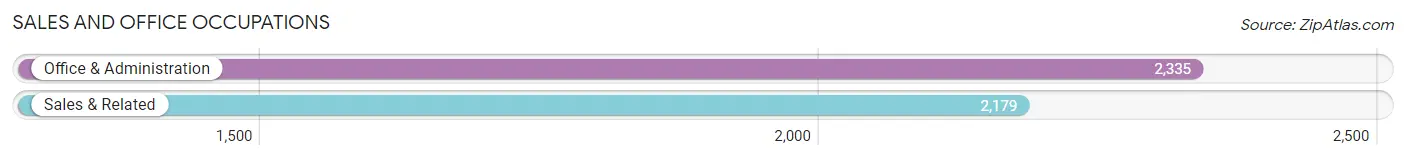
Sales and Office Occupations
The most common Sales and Office occupations in Little Elm are Office & Administration (2,335 | 9.1%), and Sales & Related (2,179 | 8.5%).
Sales and Office Occupations by Sex
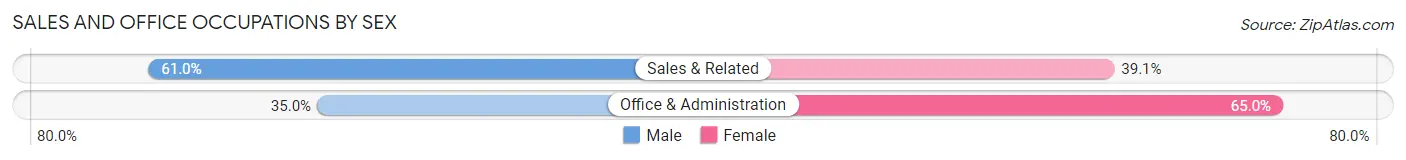
| Occupation | Male | Female |
| Sales & Related | 1,328 (61.0%) | 851 (39.1%) |
| Office & Administration | 818 (35.0%) | 1,517 (65.0%) |
| Total (Category) | 2,146 (47.5%) | 2,368 (52.5%) |
| Total (Overall) | 14,363 (56.3%) | 11,148 (43.7%) |
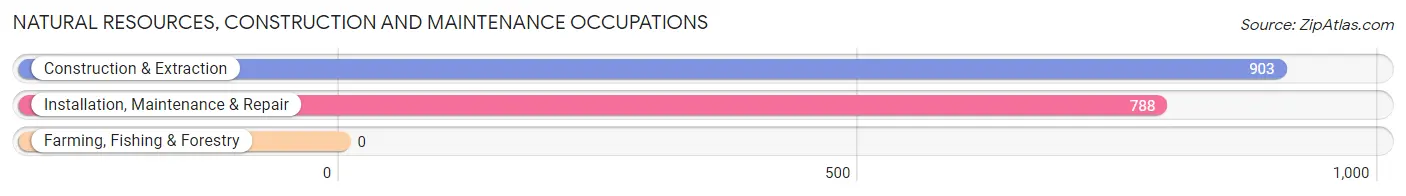
Natural Resources, Construction and Maintenance Occupations
The most common Natural Resources, Construction and Maintenance occupations in Little Elm are Construction & Extraction (903 | 3.5%), and Installation, Maintenance & Repair (788 | 3.1%).
Natural Resources, Construction and Maintenance Occupations by Sex
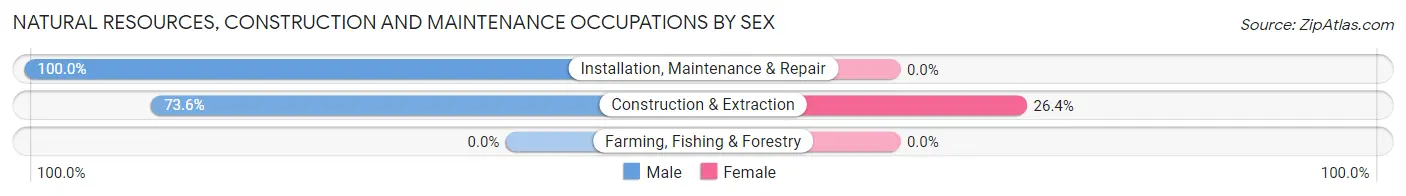
| Occupation | Male | Female |
| Farming, Fishing & Forestry | 0 (0.0%) | 0 (0.0%) |
| Construction & Extraction | 665 (73.6%) | 238 (26.4%) |
| Installation, Maintenance & Repair | 788 (100.0%) | 0 (0.0%) |
| Total (Category) | 1,453 (85.9%) | 238 (14.1%) |
| Total (Overall) | 14,363 (56.3%) | 11,148 (43.7%) |
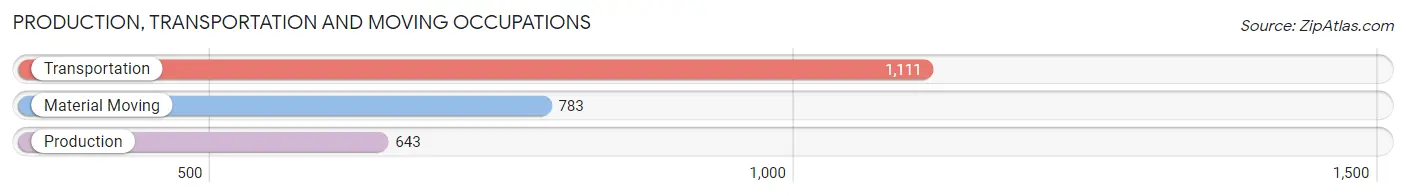
Production, Transportation and Moving Occupations
The most common Production, Transportation and Moving occupations in Little Elm are Transportation (1,111 | 4.3%), Material Moving (783 | 3.1%), and Production (643 | 2.5%).
Production, Transportation and Moving Occupations by Sex
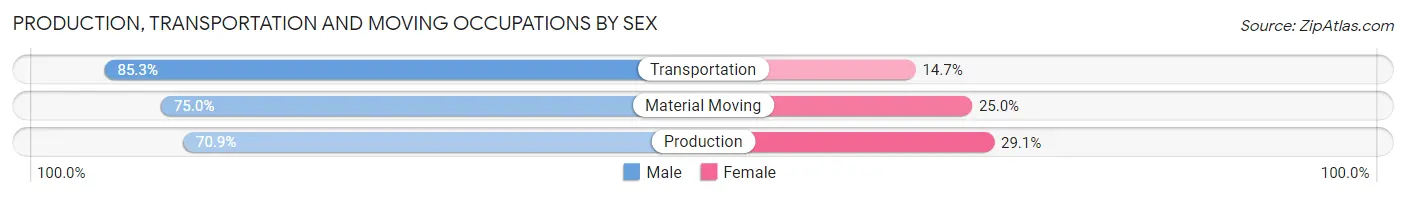
| Occupation | Male | Female |
| Production | 456 (70.9%) | 187 (29.1%) |
| Transportation | 948 (85.3%) | 163 (14.7%) |
| Material Moving | 587 (75.0%) | 196 (25.0%) |
| Total (Category) | 1,991 (78.5%) | 546 (21.5%) |
| Total (Overall) | 14,363 (56.3%) | 11,148 (43.7%) |
Employment Industries by Sex in Little Elm
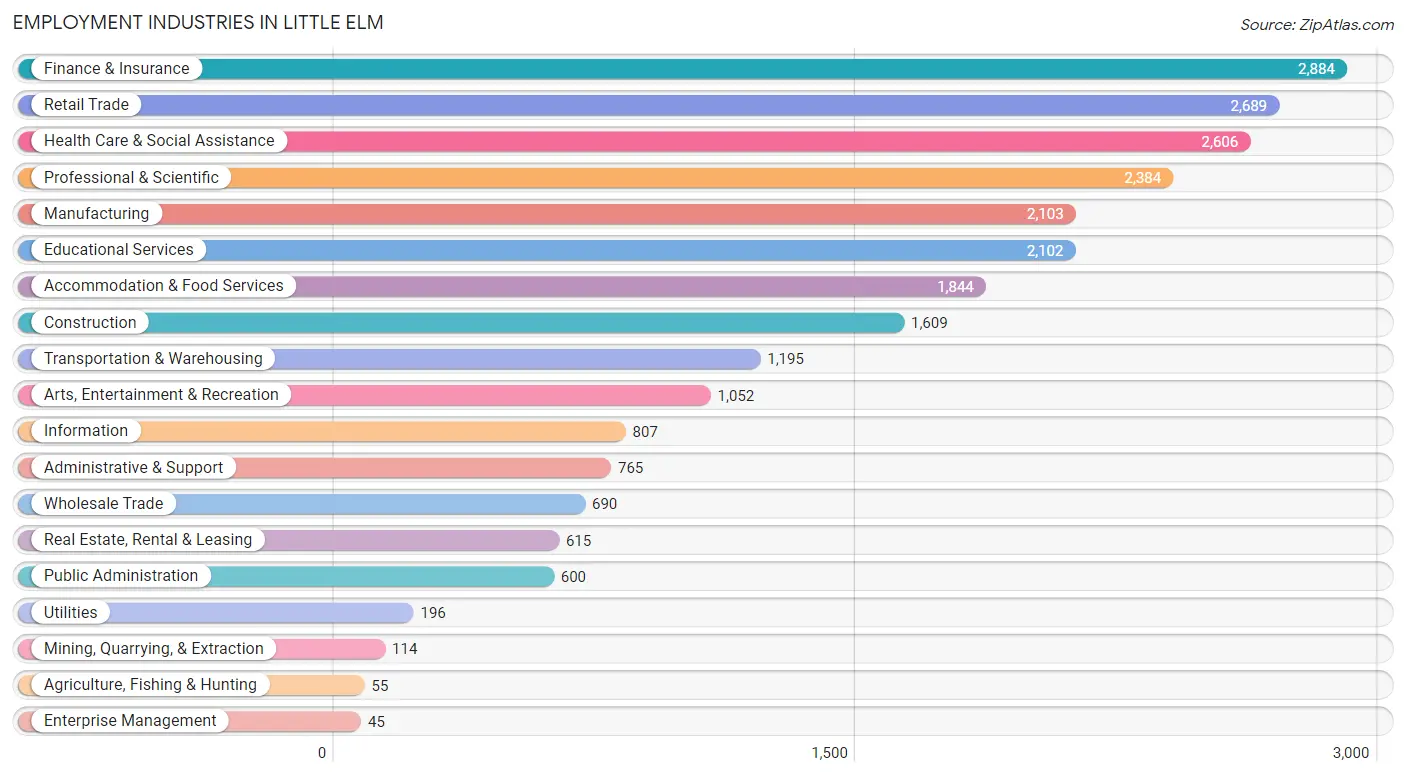
Employment Industries in Little Elm
The major employment industries in Little Elm include Finance & Insurance (2,884 | 11.3%), Retail Trade (2,689 | 10.5%), Health Care & Social Assistance (2,606 | 10.2%), Professional & Scientific (2,384 | 9.3%), and Manufacturing (2,103 | 8.2%).
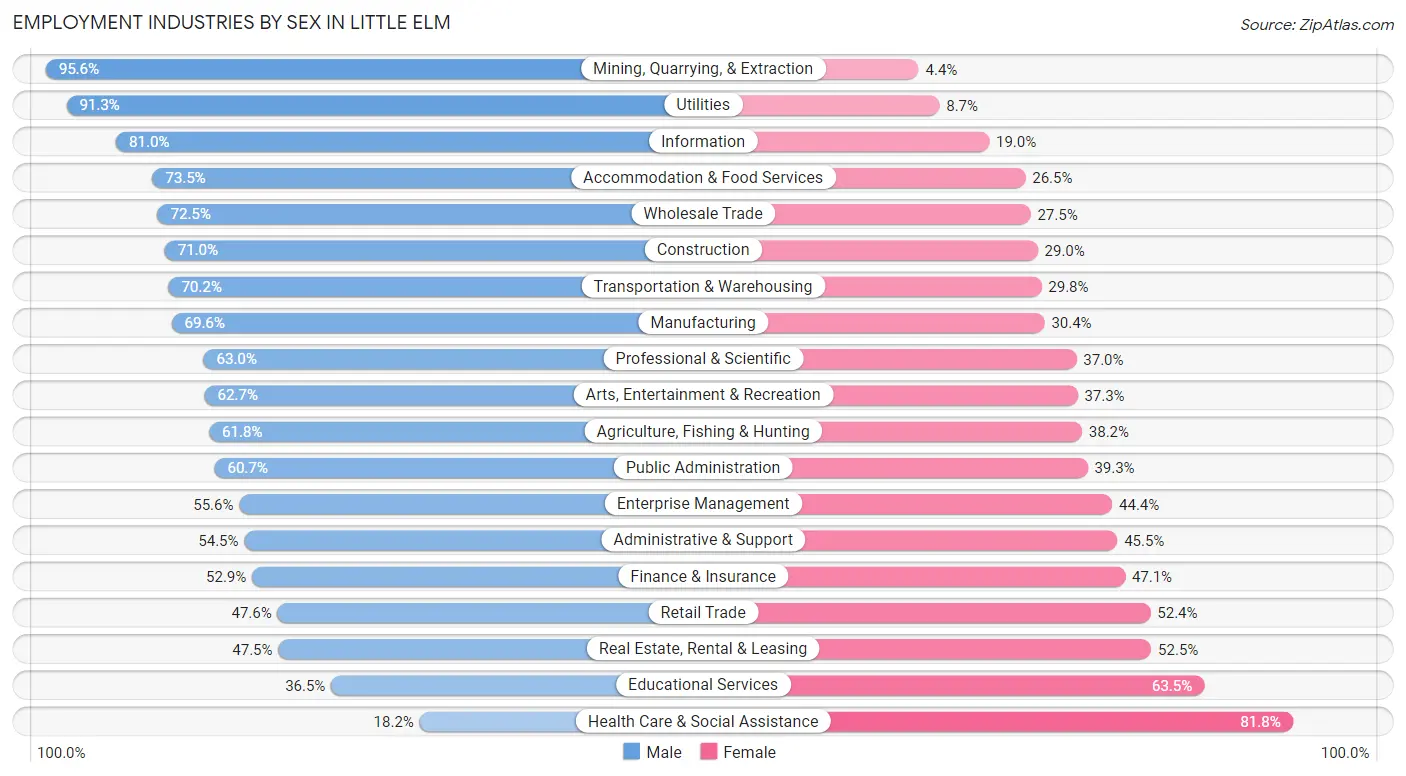
Employment Industries by Sex in Little Elm
The Little Elm industries that see more men than women are Mining, Quarrying, & Extraction (95.6%), Utilities (91.3%), and Information (81.0%), whereas the industries that tend to have a higher number of women are Health Care & Social Assistance (81.8%), Educational Services (63.5%), and Real Estate, Rental & Leasing (52.5%).
| Industry | Male | Female |
| Agriculture, Fishing & Hunting | 34 (61.8%) | 21 (38.2%) |
| Mining, Quarrying, & Extraction | 109 (95.6%) | 5 (4.4%) |
| Construction | 1,142 (71.0%) | 467 (29.0%) |
| Manufacturing | 1,463 (69.6%) | 640 (30.4%) |
| Wholesale Trade | 500 (72.5%) | 190 (27.5%) |
| Retail Trade | 1,281 (47.6%) | 1,408 (52.4%) |
| Transportation & Warehousing | 839 (70.2%) | 356 (29.8%) |
| Utilities | 179 (91.3%) | 17 (8.7%) |
| Information | 654 (81.0%) | 153 (19.0%) |
| Finance & Insurance | 1,526 (52.9%) | 1,358 (47.1%) |
| Real Estate, Rental & Leasing | 292 (47.5%) | 323 (52.5%) |
| Professional & Scientific | 1,501 (63.0%) | 883 (37.0%) |
| Enterprise Management | 25 (55.6%) | 20 (44.4%) |
| Administrative & Support | 417 (54.5%) | 348 (45.5%) |
| Educational Services | 768 (36.5%) | 1,334 (63.5%) |
| Health Care & Social Assistance | 475 (18.2%) | 2,131 (81.8%) |
| Arts, Entertainment & Recreation | 660 (62.7%) | 392 (37.3%) |
| Accommodation & Food Services | 1,356 (73.5%) | 488 (26.5%) |
| Public Administration | 364 (60.7%) | 236 (39.3%) |
| Total | 14,363 (56.3%) | 11,148 (43.7%) |
Education in Little Elm
School Enrollment in Little Elm
The most common levels of schooling among the 13,906 students in Little Elm are high school (3,944 | 28.4%), middle school (3,149 | 22.6%), and elementary school (2,579 | 18.5%).
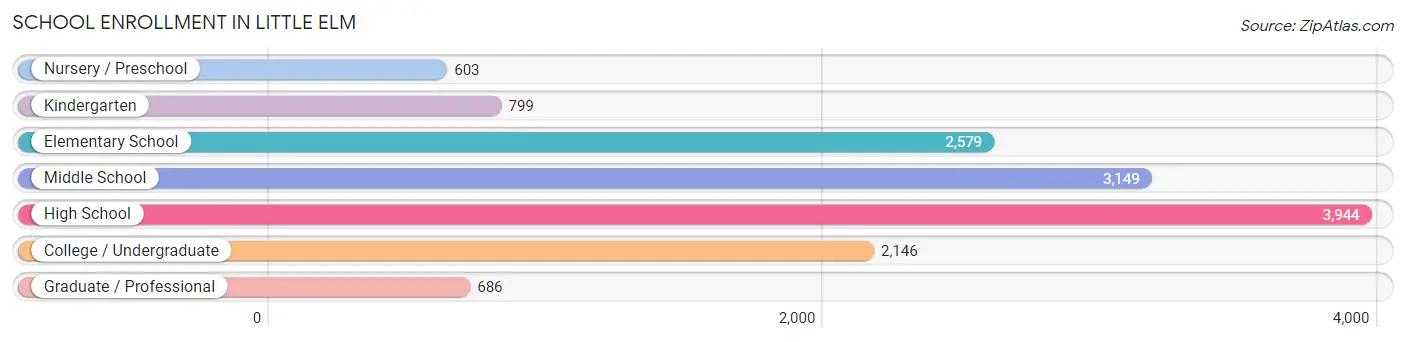
| School Level | # Students | % Students |
| Nursery / Preschool | 603 | 4.3% |
| Kindergarten | 799 | 5.8% |
| Elementary School | 2,579 | 18.5% |
| Middle School | 3,149 | 22.6% |
| High School | 3,944 | 28.4% |
| College / Undergraduate | 2,146 | 15.4% |
| Graduate / Professional | 686 | 4.9% |
| Total | 13,906 | 100.0% |
School Enrollment by Age by Funding Source in Little Elm
Out of a total of 13,906 students who are enrolled in schools in Little Elm, 1,252 (9.0%) attend a private institution, while the remaining 12,654 (91.0%) are enrolled in public schools. The age group of 3 to 4 year olds has the highest likelihood of being enrolled in private schools, with 180 (58.1% in the age bracket) enrolled. Conversely, the age group of 10 to 14 year olds has the lowest likelihood of being enrolled in a private school, with 3,860 (94.3% in the age bracket) attending a public institution.
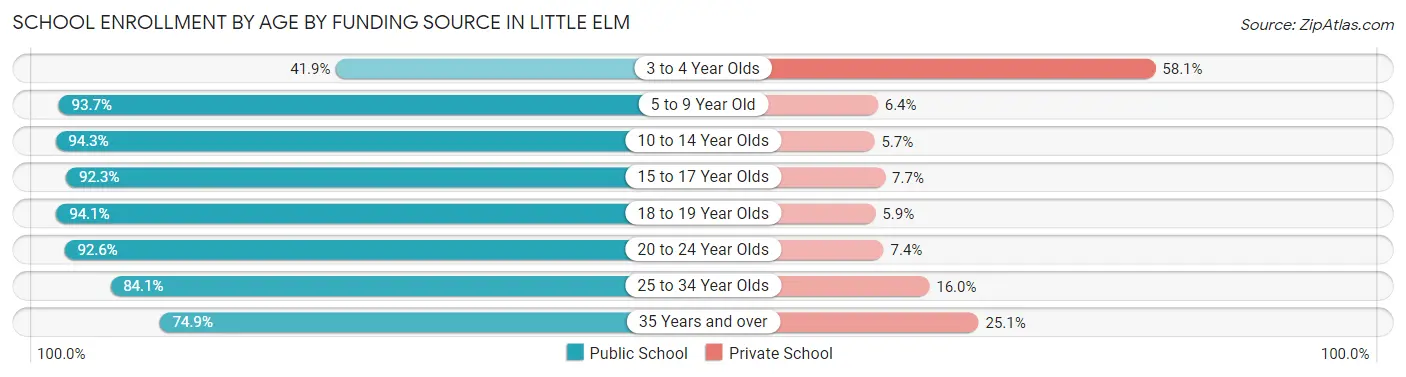
| Age Bracket | Public School | Private School |
| 3 to 4 Year Olds | 130 (41.9%) | 180 (58.1%) |
| 5 to 9 Year Old | 3,022 (93.6%) | 205 (6.4%) |
| 10 to 14 Year Olds | 3,860 (94.3%) | 235 (5.7%) |
| 15 to 17 Year Olds | 2,769 (92.3%) | 232 (7.7%) |
| 18 to 19 Year Olds | 732 (94.1%) | 46 (5.9%) |
| 20 to 24 Year Olds | 1,122 (92.6%) | 90 (7.4%) |
| 25 to 34 Year Olds | 590 (84.1%) | 112 (16.0%) |
| 35 Years and over | 435 (74.9%) | 146 (25.1%) |
| Total | 12,654 (91.0%) | 1,252 (9.0%) |
Educational Attainment by Field of Study in Little Elm
Business (3,150 | 24.5%), engineering (1,216 | 9.5%), computers & mathematics (1,087 | 8.5%), science & technology (980 | 7.6%), and arts & humanities (870 | 6.8%) are the most common fields of study among 12,849 individuals in Little Elm who have obtained a bachelor's degree or higher.
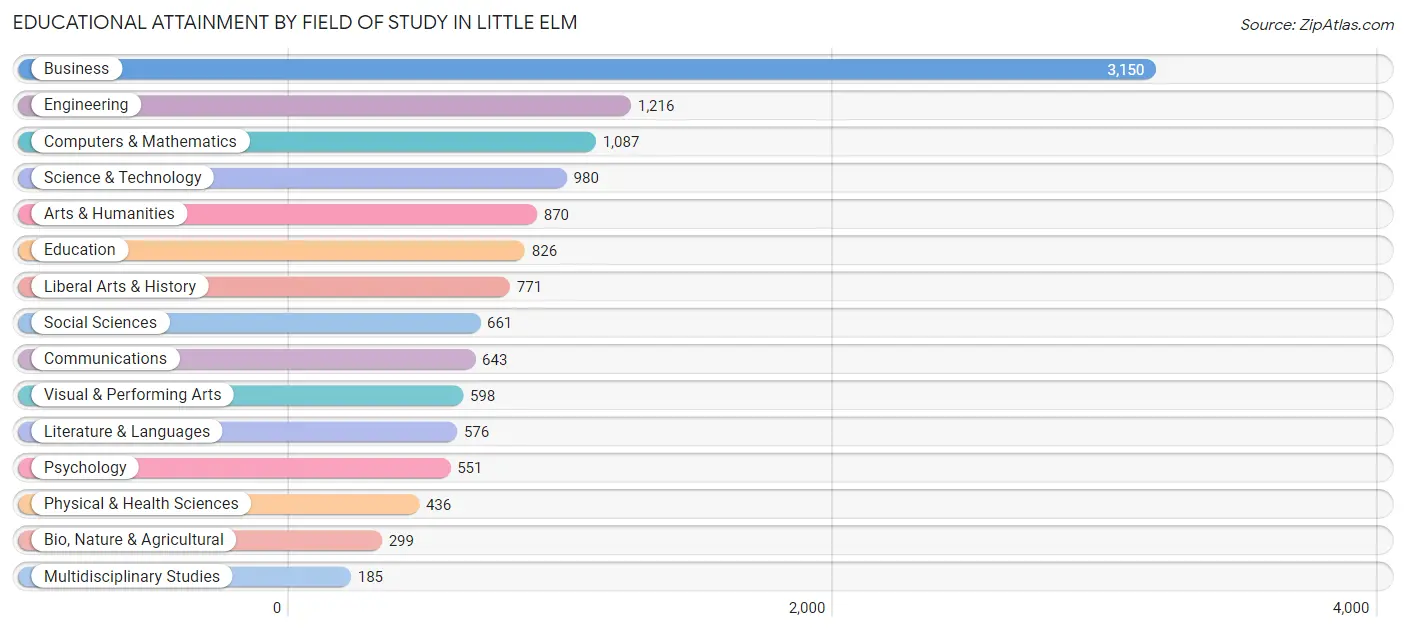
| Field of Study | # Graduates | % Graduates |
| Computers & Mathematics | 1,087 | 8.5% |
| Bio, Nature & Agricultural | 299 | 2.3% |
| Physical & Health Sciences | 436 | 3.4% |
| Psychology | 551 | 4.3% |
| Social Sciences | 661 | 5.1% |
| Engineering | 1,216 | 9.5% |
| Multidisciplinary Studies | 185 | 1.4% |
| Science & Technology | 980 | 7.6% |
| Business | 3,150 | 24.5% |
| Education | 826 | 6.4% |
| Literature & Languages | 576 | 4.5% |
| Liberal Arts & History | 771 | 6.0% |
| Visual & Performing Arts | 598 | 4.6% |
| Communications | 643 | 5.0% |
| Arts & Humanities | 870 | 6.8% |
| Total | 12,849 | 100.0% |
Transportation & Commute in Little Elm
Vehicle Availability by Sex in Little Elm
The most prevalent vehicle ownership categories in Little Elm are males with 2 vehicles (6,624, accounting for 46.7%) and females with 2 vehicles (5,406, making up 60.8%).
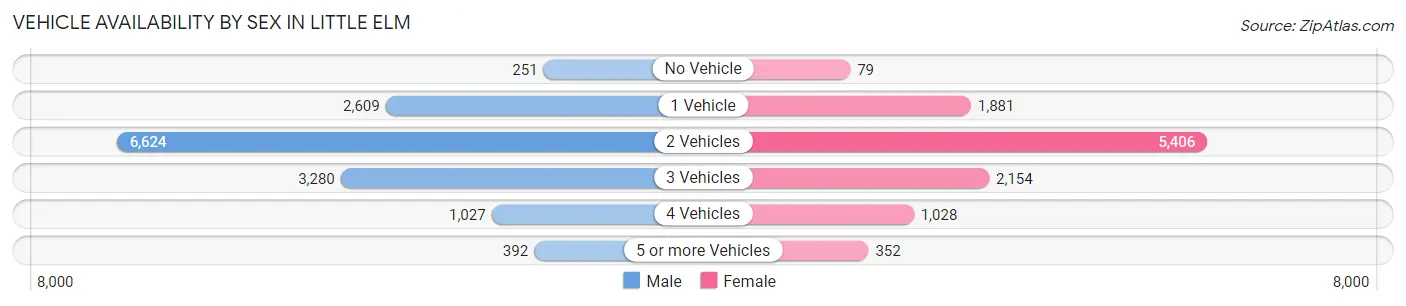
| Vehicles Available | Male | Female |
| No Vehicle | 251 (1.8%) | 79 (0.7%) |
| 1 Vehicle | 2,609 (18.4%) | 1,881 (17.3%) |
| 2 Vehicles | 6,624 (46.7%) | 5,406 (49.6%) |
| 3 Vehicles | 3,280 (23.1%) | 2,154 (19.8%) |
| 4 Vehicles | 1,027 (7.2%) | 1,028 (9.4%) |
| 5 or more Vehicles | 392 (2.8%) | 352 (3.2%) |
| Total | 14,183 (100.0%) | 10,900 (100.0%) |
Commute Time in Little Elm
The most frequently occuring commute durations in Little Elm are 30 to 34 minutes (3,061 commuters, 15.4%), 45 to 59 minutes (2,860 commuters, 14.4%), and 20 to 24 minutes (2,858 commuters, 14.3%).
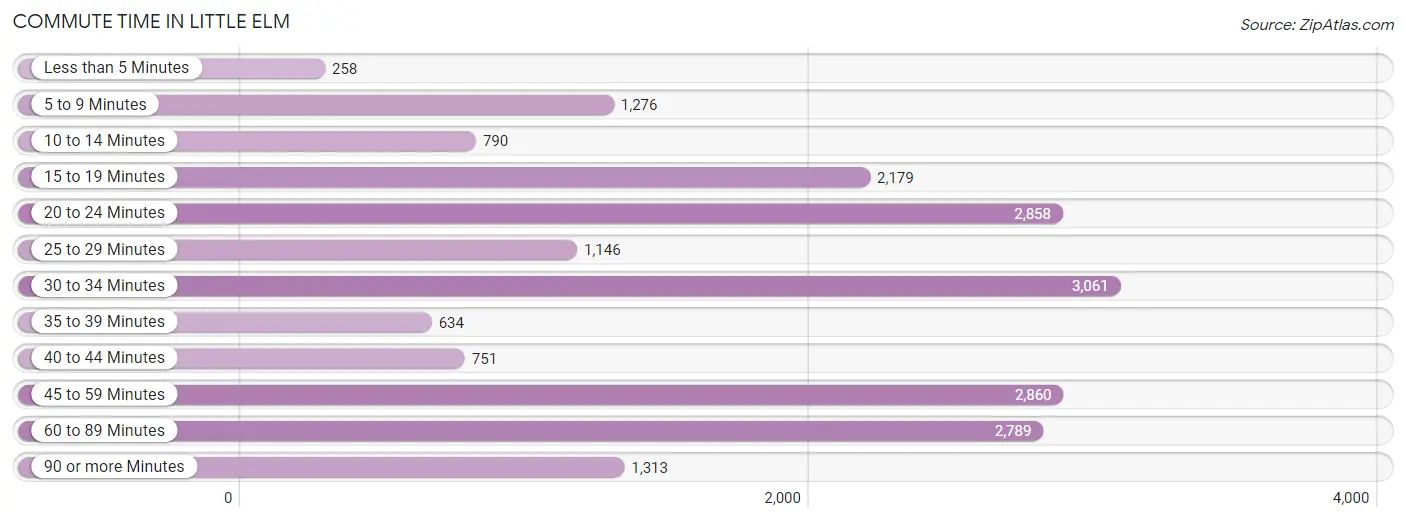
| Commute Time | # Commuters | % Commuters |
| Less than 5 Minutes | 258 | 1.3% |
| 5 to 9 Minutes | 1,276 | 6.4% |
| 10 to 14 Minutes | 790 | 4.0% |
| 15 to 19 Minutes | 2,179 | 10.9% |
| 20 to 24 Minutes | 2,858 | 14.3% |
| 25 to 29 Minutes | 1,146 | 5.8% |
| 30 to 34 Minutes | 3,061 | 15.4% |
| 35 to 39 Minutes | 634 | 3.2% |
| 40 to 44 Minutes | 751 | 3.8% |
| 45 to 59 Minutes | 2,860 | 14.4% |
| 60 to 89 Minutes | 2,789 | 14.0% |
| 90 or more Minutes | 1,313 | 6.6% |
Commute Time by Sex in Little Elm
The most common commute times in Little Elm are 20 to 24 minutes (1,900 commuters, 17.0%) for males and 30 to 34 minutes (1,549 commuters, 17.7%) for females.
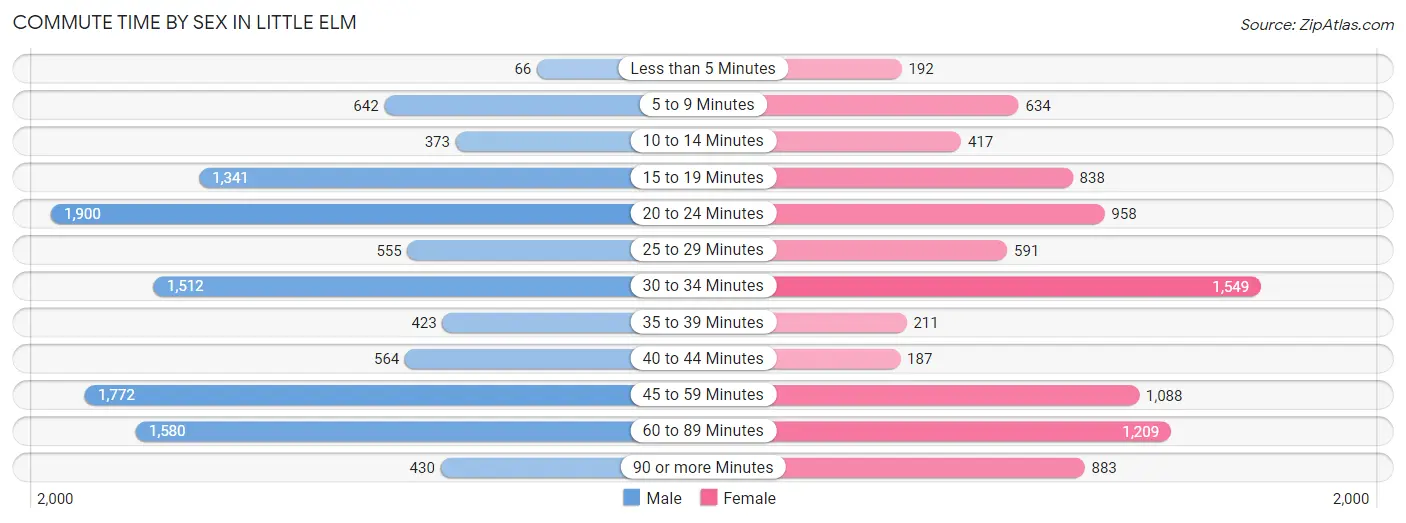
| Commute Time | Male | Female |
| Less than 5 Minutes | 66 (0.6%) | 192 (2.2%) |
| 5 to 9 Minutes | 642 (5.8%) | 634 (7.2%) |
| 10 to 14 Minutes | 373 (3.3%) | 417 (4.8%) |
| 15 to 19 Minutes | 1,341 (12.0%) | 838 (9.6%) |
| 20 to 24 Minutes | 1,900 (17.0%) | 958 (10.9%) |
| 25 to 29 Minutes | 555 (5.0%) | 591 (6.8%) |
| 30 to 34 Minutes | 1,512 (13.6%) | 1,549 (17.7%) |
| 35 to 39 Minutes | 423 (3.8%) | 211 (2.4%) |
| 40 to 44 Minutes | 564 (5.1%) | 187 (2.1%) |
| 45 to 59 Minutes | 1,772 (15.9%) | 1,088 (12.4%) |
| 60 to 89 Minutes | 1,580 (14.2%) | 1,209 (13.8%) |
| 90 or more Minutes | 430 (3.8%) | 883 (10.1%) |
Time of Departure to Work by Sex in Little Elm
The most frequent times of departure to work in Little Elm are 7:00 AM to 7:29 AM (1,515, 13.6%) for males and 7:00 AM to 7:29 AM (1,435, 16.4%) for females.
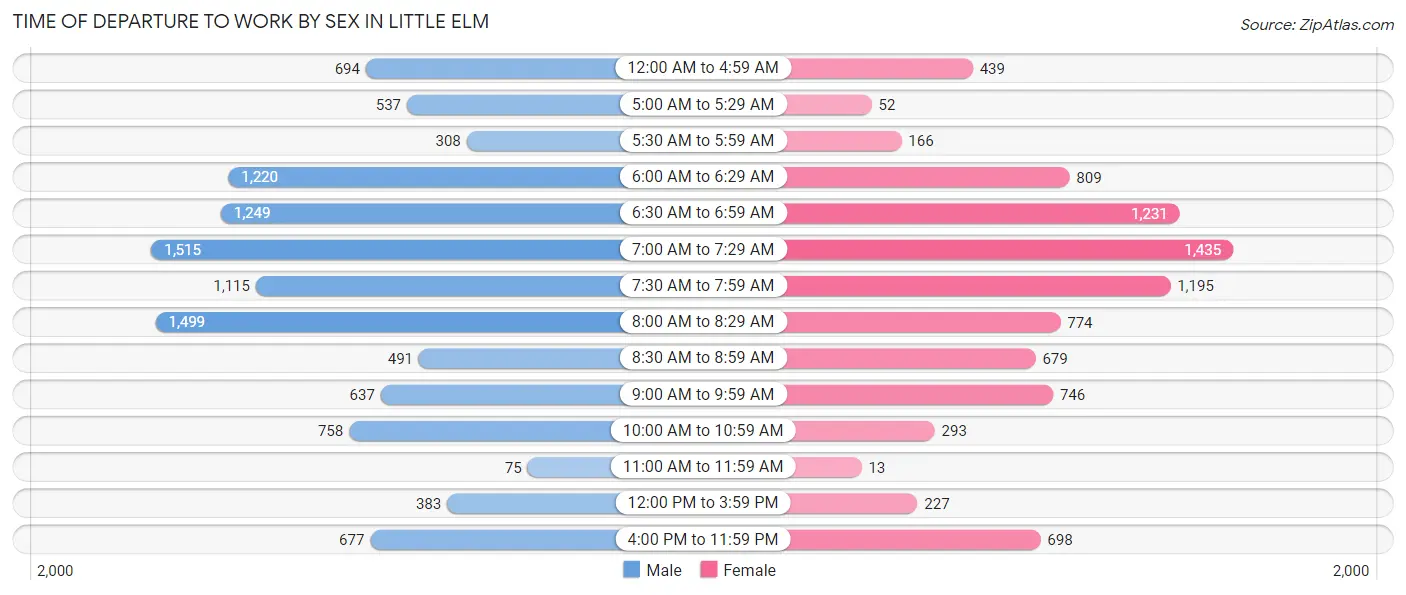
| Time of Departure | Male | Female |
| 12:00 AM to 4:59 AM | 694 (6.2%) | 439 (5.0%) |
| 5:00 AM to 5:29 AM | 537 (4.8%) | 52 (0.6%) |
| 5:30 AM to 5:59 AM | 308 (2.8%) | 166 (1.9%) |
| 6:00 AM to 6:29 AM | 1,220 (10.9%) | 809 (9.2%) |
| 6:30 AM to 6:59 AM | 1,249 (11.2%) | 1,231 (14.1%) |
| 7:00 AM to 7:29 AM | 1,515 (13.6%) | 1,435 (16.4%) |
| 7:30 AM to 7:59 AM | 1,115 (10.0%) | 1,195 (13.7%) |
| 8:00 AM to 8:29 AM | 1,499 (13.4%) | 774 (8.8%) |
| 8:30 AM to 8:59 AM | 491 (4.4%) | 679 (7.7%) |
| 9:00 AM to 9:59 AM | 637 (5.7%) | 746 (8.5%) |
| 10:00 AM to 10:59 AM | 758 (6.8%) | 293 (3.4%) |
| 11:00 AM to 11:59 AM | 75 (0.7%) | 13 (0.2%) |
| 12:00 PM to 3:59 PM | 383 (3.4%) | 227 (2.6%) |
| 4:00 PM to 11:59 PM | 677 (6.1%) | 698 (8.0%) |
| Total | 11,158 (100.0%) | 8,757 (100.0%) |
Housing Occupancy in Little Elm
Occupancy by Ownership in Little Elm
Of the total 16,752 dwellings in Little Elm, owner-occupied units account for 11,356 (67.8%), while renter-occupied units make up 5,396 (32.2%).
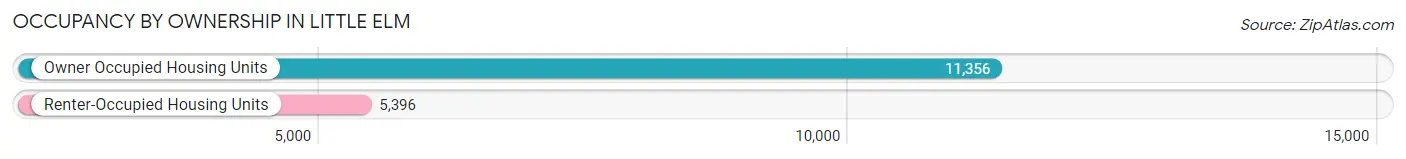
| Occupancy | # Housing Units | % Housing Units |
| Owner Occupied Housing Units | 11,356 | 67.8% |
| Renter-Occupied Housing Units | 5,396 | 32.2% |
| Total Occupied Housing Units | 16,752 | 100.0% |
Occupancy by Household Size in Little Elm
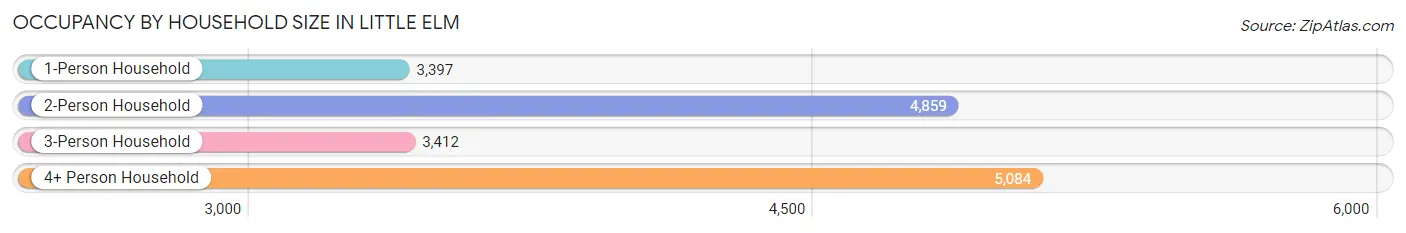
| Household Size | # Housing Units | % Housing Units |
| 1-Person Household | 3,397 | 20.3% |
| 2-Person Household | 4,859 | 29.0% |
| 3-Person Household | 3,412 | 20.4% |
| 4+ Person Household | 5,084 | 30.3% |
| Total Housing Units | 16,752 | 100.0% |
Occupancy by Ownership by Household Size in Little Elm
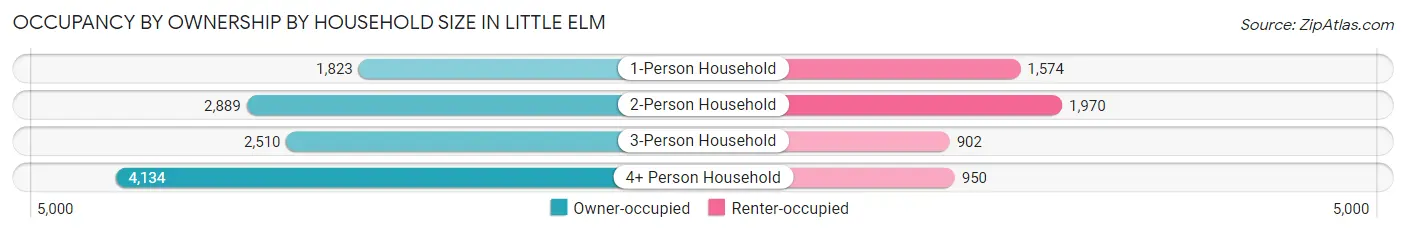
| Household Size | Owner-occupied | Renter-occupied |
| 1-Person Household | 1,823 (53.7%) | 1,574 (46.3%) |
| 2-Person Household | 2,889 (59.5%) | 1,970 (40.5%) |
| 3-Person Household | 2,510 (73.6%) | 902 (26.4%) |
| 4+ Person Household | 4,134 (81.3%) | 950 (18.7%) |
| Total Housing Units | 11,356 (67.8%) | 5,396 (32.2%) |
Occupancy by Educational Attainment in Little Elm
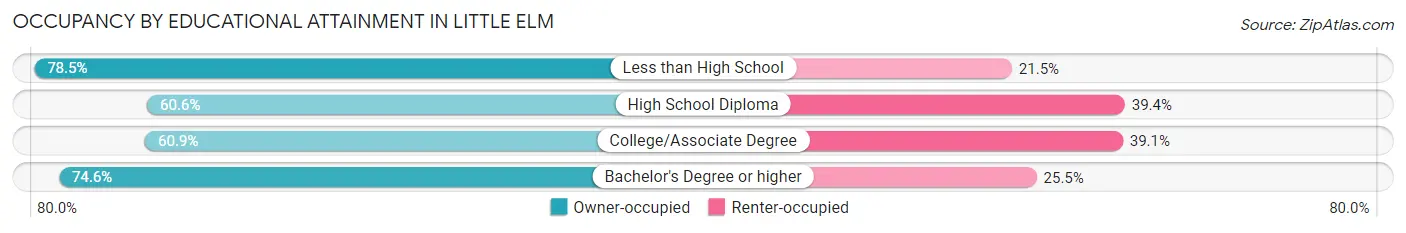
| Household Size | Owner-occupied | Renter-occupied |
| Less than High School | 718 (78.5%) | 197 (21.5%) |
| High School Diploma | 1,768 (60.6%) | 1,151 (39.4%) |
| College/Associate Degree | 3,386 (60.9%) | 2,176 (39.1%) |
| Bachelor's Degree or higher | 5,484 (74.6%) | 1,872 (25.5%) |
Occupancy by Age of Householder in Little Elm
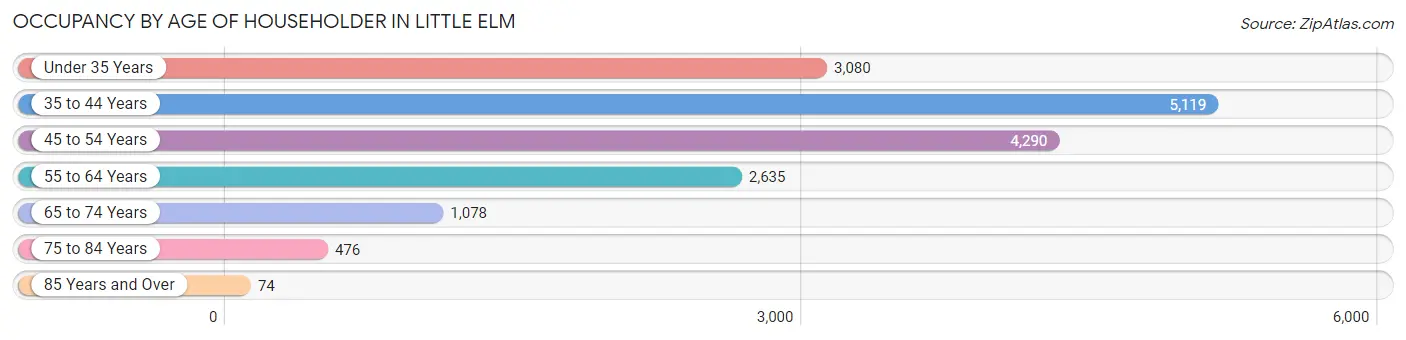
| Age Bracket | # Households | % Households |
| Under 35 Years | 3,080 | 18.4% |
| 35 to 44 Years | 5,119 | 30.6% |
| 45 to 54 Years | 4,290 | 25.6% |
| 55 to 64 Years | 2,635 | 15.7% |
| 65 to 74 Years | 1,078 | 6.4% |
| 75 to 84 Years | 476 | 2.8% |
| 85 Years and Over | 74 | 0.4% |
| Total | 16,752 | 100.0% |
Housing Finances in Little Elm
Median Income by Occupancy in Little Elm
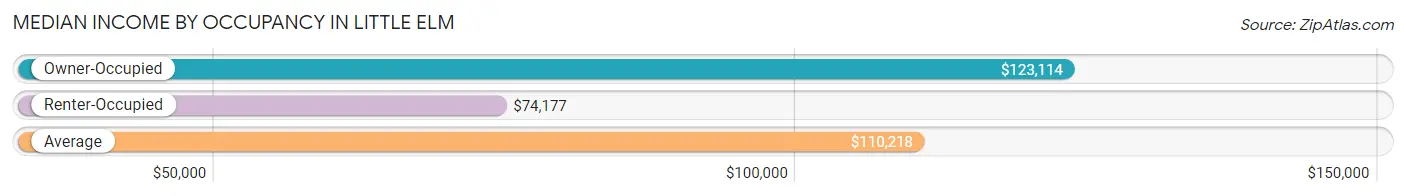
| Occupancy Type | # Households | Median Income |
| Owner-Occupied | 11,356 (67.8%) | $123,114 |
| Renter-Occupied | 5,396 (32.2%) | $74,177 |
| Average | 16,752 (100.0%) | $110,218 |
Occupancy by Householder Income Bracket in Little Elm
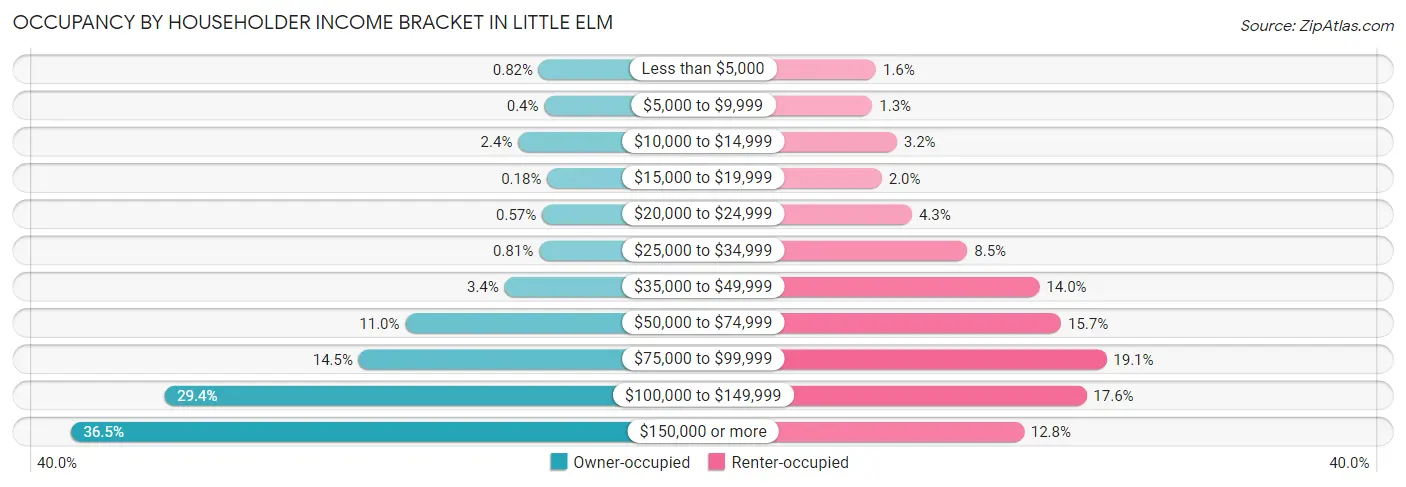
| Income Bracket | Owner-occupied | Renter-occupied |
| Less than $5,000 | 93 (0.8%) | 84 (1.6%) |
| $5,000 to $9,999 | 45 (0.4%) | 69 (1.3%) |
| $10,000 to $14,999 | 271 (2.4%) | 170 (3.2%) |
| $15,000 to $19,999 | 21 (0.2%) | 108 (2.0%) |
| $20,000 to $24,999 | 65 (0.6%) | 232 (4.3%) |
| $25,000 to $34,999 | 92 (0.8%) | 460 (8.5%) |
| $35,000 to $49,999 | 390 (3.4%) | 756 (14.0%) |
| $50,000 to $74,999 | 1,248 (11.0%) | 845 (15.7%) |
| $75,000 to $99,999 | 1,651 (14.5%) | 1,031 (19.1%) |
| $100,000 to $149,999 | 3,335 (29.4%) | 949 (17.6%) |
| $150,000 or more | 4,145 (36.5%) | 692 (12.8%) |
| Total | 11,356 (100.0%) | 5,396 (100.0%) |
Monthly Housing Cost Tiers in Little Elm
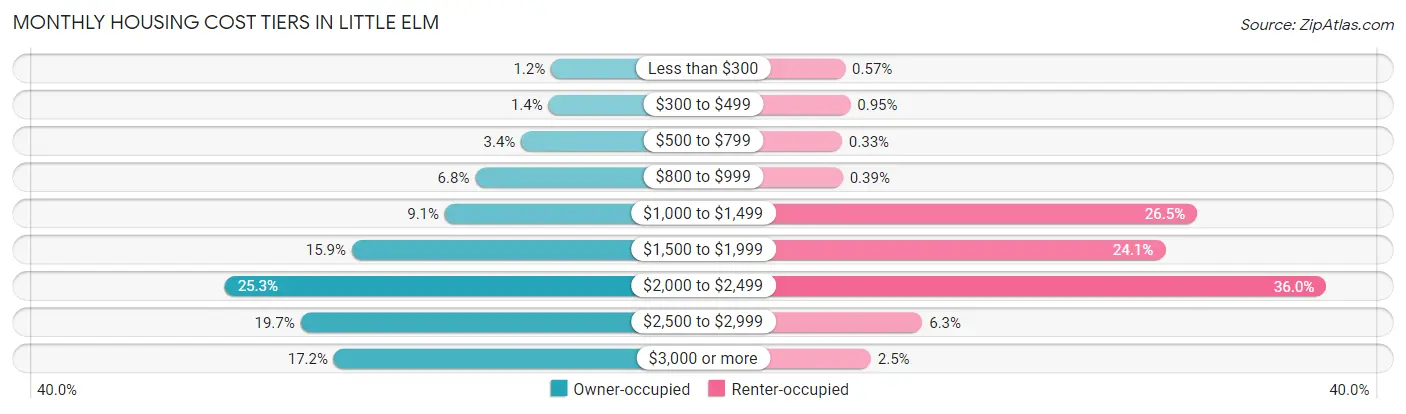
| Monthly Cost | Owner-occupied | Renter-occupied |
| Less than $300 | 140 (1.2%) | 31 (0.6%) |
| $300 to $499 | 160 (1.4%) | 51 (0.9%) |
| $500 to $799 | 389 (3.4%) | 18 (0.3%) |
| $800 to $999 | 773 (6.8%) | 21 (0.4%) |
| $1,000 to $1,499 | 1,028 (9.0%) | 1,429 (26.5%) |
| $1,500 to $1,999 | 1,806 (15.9%) | 1,302 (24.1%) |
| $2,000 to $2,499 | 2,868 (25.3%) | 1,942 (36.0%) |
| $2,500 to $2,999 | 2,235 (19.7%) | 337 (6.2%) |
| $3,000 or more | 1,957 (17.2%) | 133 (2.5%) |
| Total | 11,356 (100.0%) | 5,396 (100.0%) |
Physical Housing Characteristics in Little Elm
Housing Structures in Little Elm
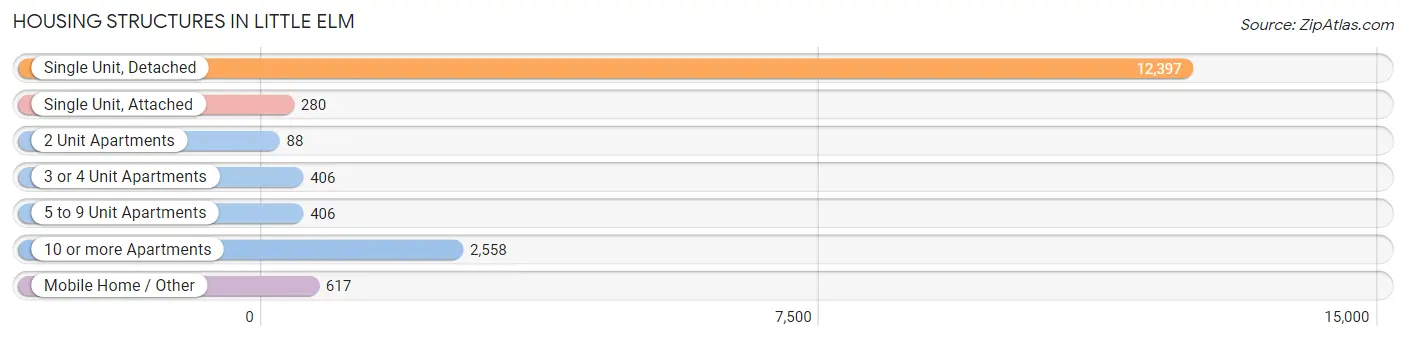
| Structure Type | # Housing Units | % Housing Units |
| Single Unit, Detached | 12,397 | 74.0% |
| Single Unit, Attached | 280 | 1.7% |
| 2 Unit Apartments | 88 | 0.5% |
| 3 or 4 Unit Apartments | 406 | 2.4% |
| 5 to 9 Unit Apartments | 406 | 2.4% |
| 10 or more Apartments | 2,558 | 15.3% |
| Mobile Home / Other | 617 | 3.7% |
| Total | 16,752 | 100.0% |
Housing Structures by Occupancy in Little Elm
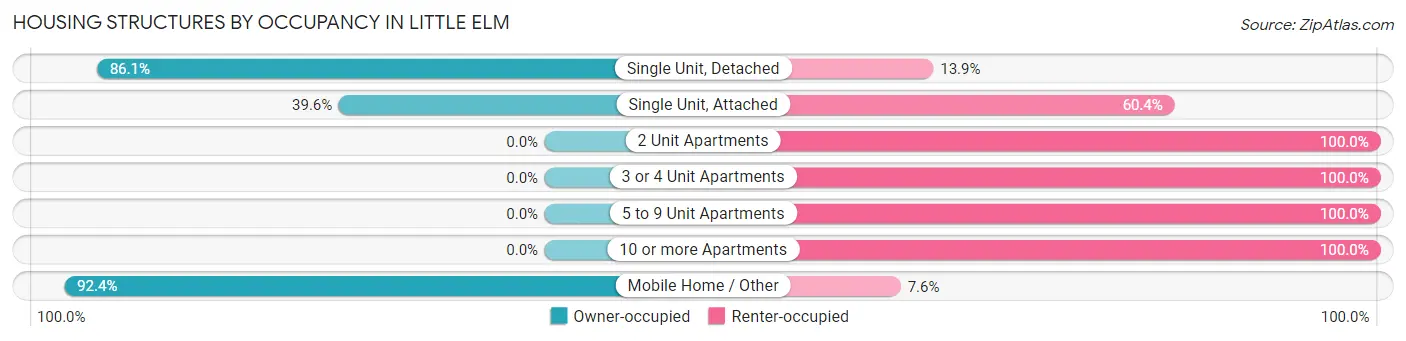
| Structure Type | Owner-occupied | Renter-occupied |
| Single Unit, Detached | 10,675 (86.1%) | 1,722 (13.9%) |
| Single Unit, Attached | 111 (39.6%) | 169 (60.4%) |
| 2 Unit Apartments | 0 (0.0%) | 88 (100.0%) |
| 3 or 4 Unit Apartments | 0 (0.0%) | 406 (100.0%) |
| 5 to 9 Unit Apartments | 0 (0.0%) | 406 (100.0%) |
| 10 or more Apartments | 0 (0.0%) | 2,558 (100.0%) |
| Mobile Home / Other | 570 (92.4%) | 47 (7.6%) |
| Total | 11,356 (67.8%) | 5,396 (32.2%) |
Housing Structures by Number of Rooms in Little Elm
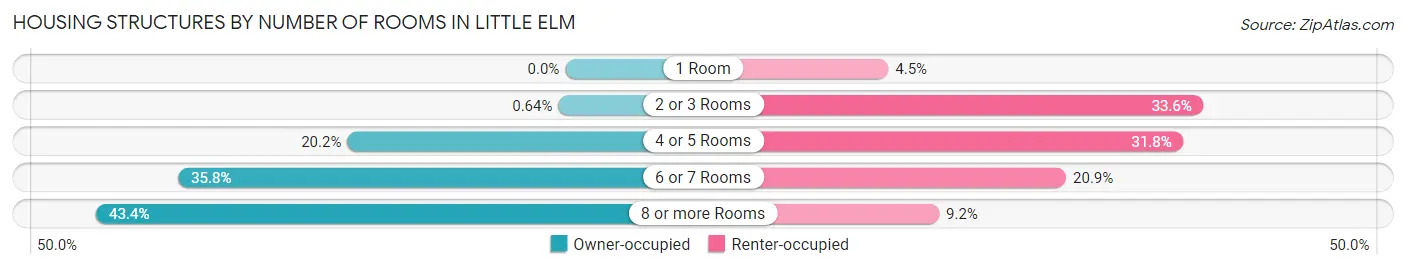
| Number of Rooms | Owner-occupied | Renter-occupied |
| 1 Room | 0 (0.0%) | 242 (4.5%) |
| 2 or 3 Rooms | 73 (0.6%) | 1,815 (33.6%) |
| 4 or 5 Rooms | 2,289 (20.2%) | 1,715 (31.8%) |
| 6 or 7 Rooms | 4,067 (35.8%) | 1,129 (20.9%) |
| 8 or more Rooms | 4,927 (43.4%) | 495 (9.2%) |
| Total | 11,356 (100.0%) | 5,396 (100.0%) |
Housing Structure by Heating Type in Little Elm
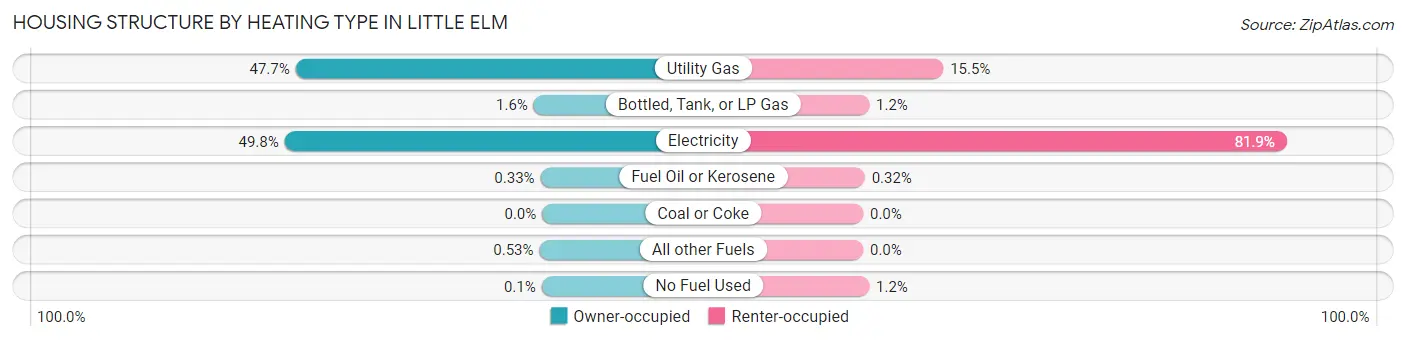
| Heating Type | Owner-occupied | Renter-occupied |
| Utility Gas | 5,411 (47.6%) | 836 (15.5%) |
| Bottled, Tank, or LP Gas | 185 (1.6%) | 63 (1.2%) |
| Electricity | 5,652 (49.8%) | 4,417 (81.9%) |
| Fuel Oil or Kerosene | 37 (0.3%) | 17 (0.3%) |
| Coal or Coke | 0 (0.0%) | 0 (0.0%) |
| All other Fuels | 60 (0.5%) | 0 (0.0%) |
| No Fuel Used | 11 (0.1%) | 63 (1.2%) |
| Total | 11,356 (100.0%) | 5,396 (100.0%) |
Household Vehicle Usage in Little Elm
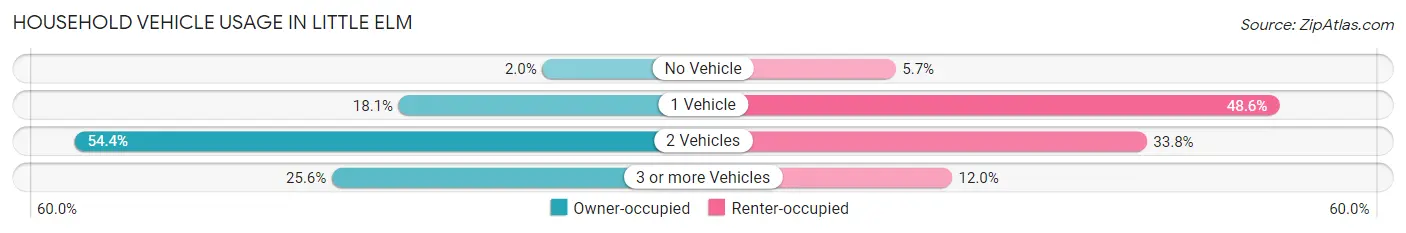
| Vehicles per Household | Owner-occupied | Renter-occupied |
| No Vehicle | 225 (2.0%) | 305 (5.7%) |
| 1 Vehicle | 2,052 (18.1%) | 2,624 (48.6%) |
| 2 Vehicles | 6,177 (54.4%) | 1,822 (33.8%) |
| 3 or more Vehicles | 2,902 (25.6%) | 645 (11.9%) |
| Total | 11,356 (100.0%) | 5,396 (100.0%) |
Real Estate & Mortgages in Little Elm
Real Estate and Mortgage Overview in Little Elm
| Characteristic | Without Mortgage | With Mortgage |
| Housing Units | 2,026 | 9,330 |
| Median Property Value | $309,100 | $369,600 |
| Median Household Income | $97,763 | $3,702 |
| Monthly Housing Costs | $919 | $1,856 |
| Real Estate Taxes | $6,085 | $240 |
Property Value by Mortgage Status in Little Elm
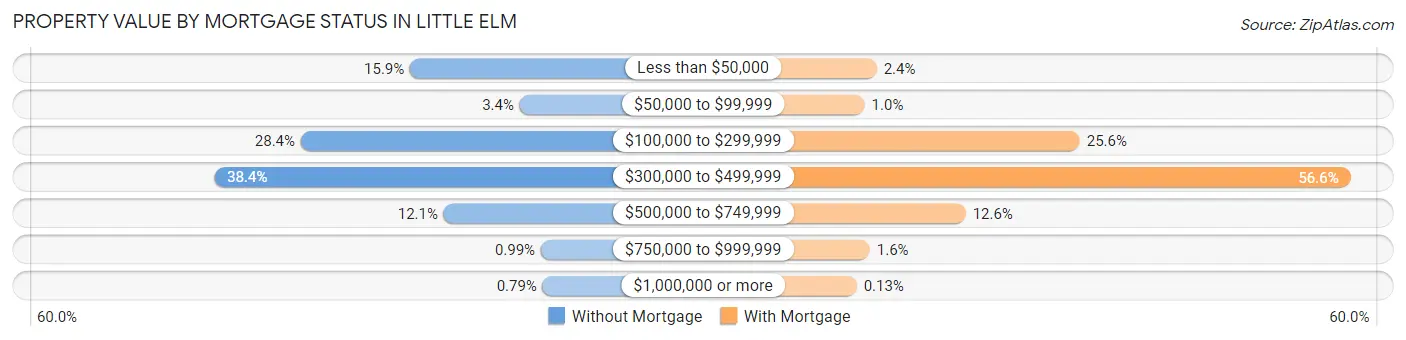
| Property Value | Without Mortgage | With Mortgage |
| Less than $50,000 | 323 (15.9%) | 226 (2.4%) |
| $50,000 to $99,999 | 69 (3.4%) | 97 (1.0%) |
| $100,000 to $299,999 | 576 (28.4%) | 2,391 (25.6%) |
| $300,000 to $499,999 | 777 (38.4%) | 5,277 (56.6%) |
| $500,000 to $749,999 | 245 (12.1%) | 1,175 (12.6%) |
| $750,000 to $999,999 | 20 (1.0%) | 152 (1.6%) |
| $1,000,000 or more | 16 (0.8%) | 12 (0.1%) |
| Total | 2,026 (100.0%) | 9,330 (100.0%) |
Household Income by Mortgage Status in Little Elm
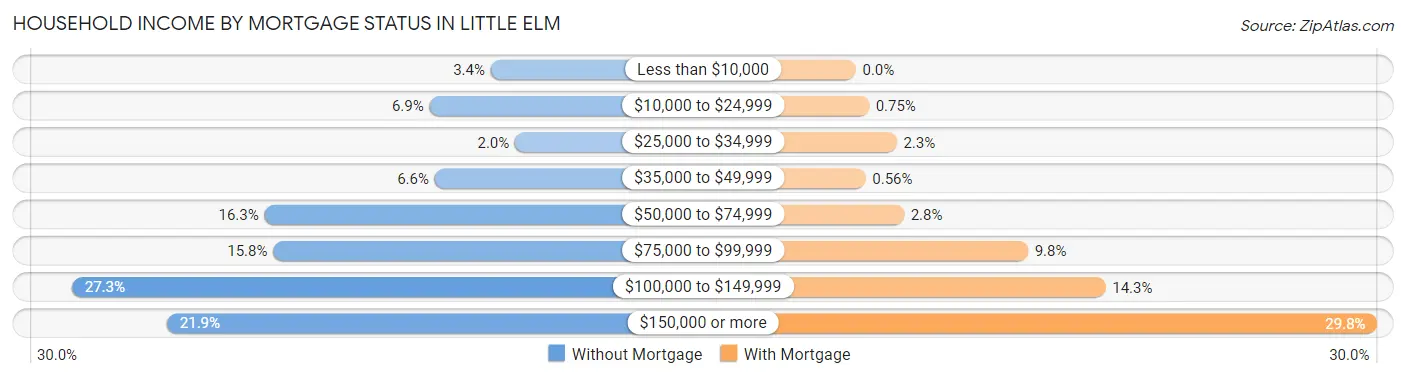
| Household Income | Without Mortgage | With Mortgage |
| Less than $10,000 | 68 (3.4%) | 0 (0.0%) |
| $10,000 to $24,999 | 139 (6.9%) | 70 (0.7%) |
| $25,000 to $34,999 | 40 (2.0%) | 218 (2.3%) |
| $35,000 to $49,999 | 133 (6.6%) | 52 (0.6%) |
| $50,000 to $74,999 | 330 (16.3%) | 257 (2.8%) |
| $75,000 to $99,999 | 320 (15.8%) | 918 (9.8%) |
| $100,000 to $149,999 | 553 (27.3%) | 1,331 (14.3%) |
| $150,000 or more | 443 (21.9%) | 2,782 (29.8%) |
| Total | 2,026 (100.0%) | 9,330 (100.0%) |
Property Value to Household Income Ratio in Little Elm
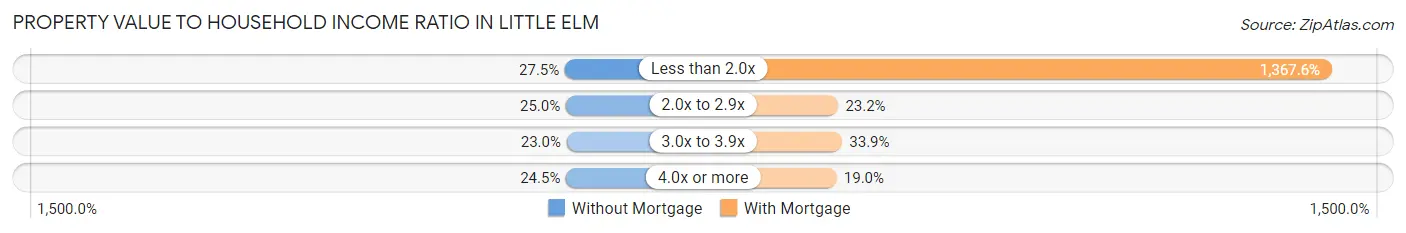
| Value-to-Income Ratio | Without Mortgage | With Mortgage |
| Less than 2.0x | 558 (27.5%) | 127,592 (1,367.5%) |
| 2.0x to 2.9x | 506 (25.0%) | 2,165 (23.2%) |
| 3.0x to 3.9x | 466 (23.0%) | 3,161 (33.9%) |
| 4.0x or more | 496 (24.5%) | 1,768 (19.0%) |
| Total | 2,026 (100.0%) | 9,330 (100.0%) |
Real Estate Taxes by Mortgage Status in Little Elm
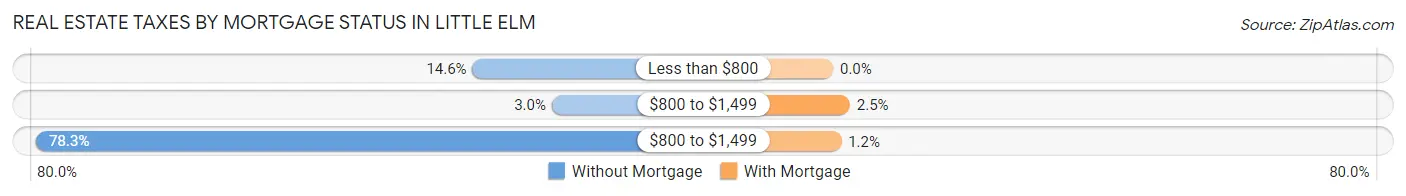
| Property Taxes | Without Mortgage | With Mortgage |
| Less than $800 | 295 (14.6%) | 0 (0.0%) |
| $800 to $1,499 | 60 (3.0%) | 229 (2.5%) |
| $800 to $1,499 | 1,587 (78.3%) | 111 (1.2%) |
| Total | 2,026 (100.0%) | 9,330 (100.0%) |
Health & Disability in Little Elm
Health Insurance Coverage by Age in Little Elm
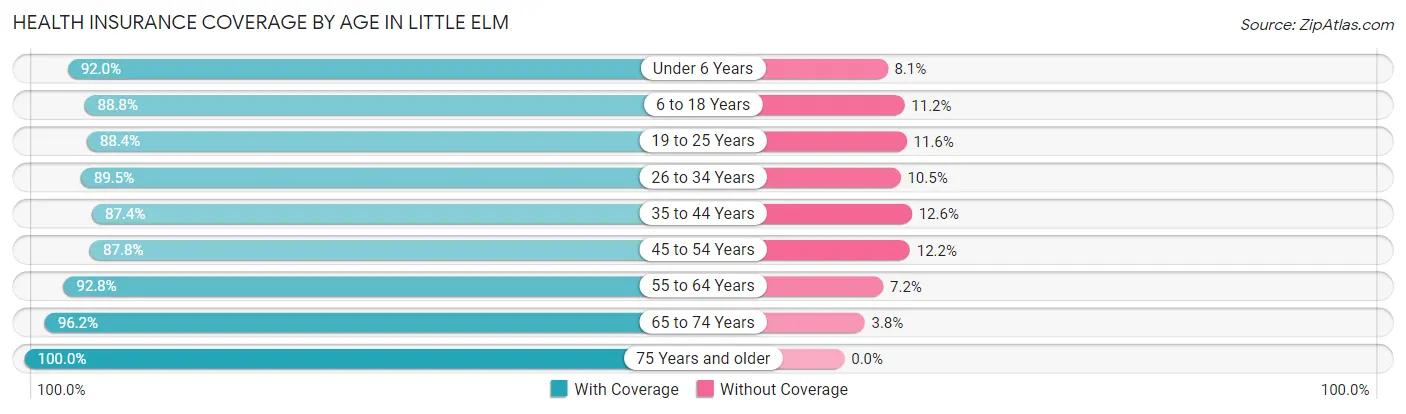
| Age Bracket | With Coverage | Without Coverage |
| Under 6 Years | 3,049 (91.9%) | 267 (8.1%) |
| 6 to 18 Years | 9,906 (88.8%) | 1,250 (11.2%) |
| 19 to 25 Years | 3,173 (88.4%) | 417 (11.6%) |
| 26 to 34 Years | 4,749 (89.5%) | 556 (10.5%) |
| 35 to 44 Years | 8,789 (87.4%) | 1,265 (12.6%) |
| 45 to 54 Years | 6,357 (87.8%) | 884 (12.2%) |
| 55 to 64 Years | 4,126 (92.8%) | 322 (7.2%) |
| 65 to 74 Years | 1,986 (96.2%) | 78 (3.8%) |
| 75 Years and older | 1,046 (100.0%) | 0 (0.0%) |
| Total | 43,181 (89.5%) | 5,039 (10.4%) |
Health Insurance Coverage by Citizenship Status in Little Elm
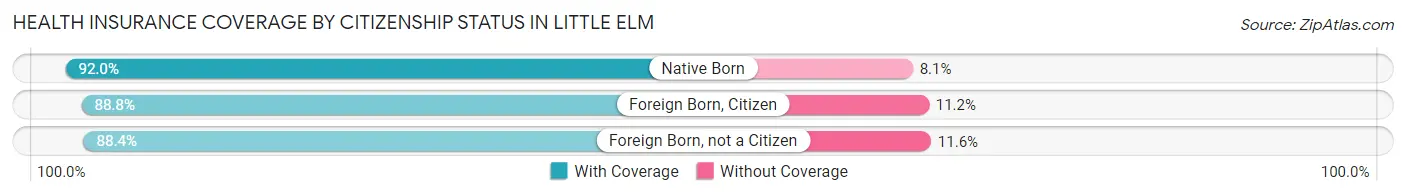
| Citizenship Status | With Coverage | Without Coverage |
| Native Born | 3,049 (91.9%) | 267 (8.1%) |
| Foreign Born, Citizen | 9,906 (88.8%) | 1,250 (11.2%) |
| Foreign Born, not a Citizen | 3,173 (88.4%) | 417 (11.6%) |
Health Insurance Coverage by Household Income in Little Elm
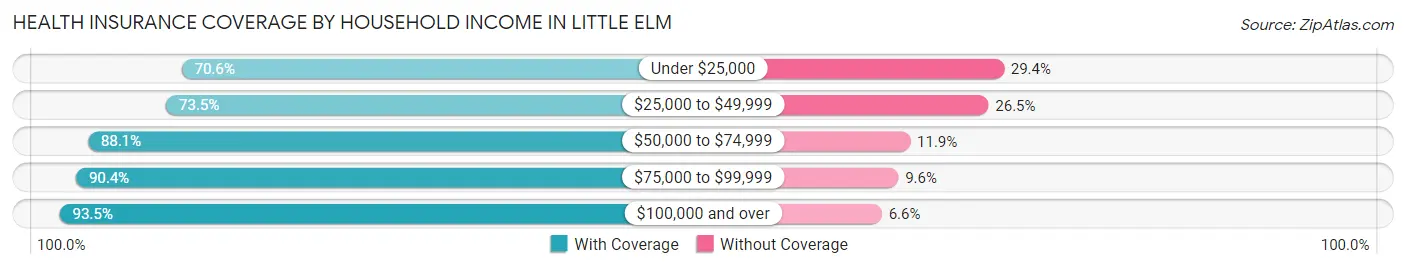
| Household Income | With Coverage | Without Coverage |
| Under $25,000 | 1,771 (70.6%) | 738 (29.4%) |
| $25,000 to $49,999 | 2,954 (73.5%) | 1,066 (26.5%) |
| $50,000 to $74,999 | 4,705 (88.1%) | 633 (11.9%) |
| $75,000 to $99,999 | 6,474 (90.4%) | 690 (9.6%) |
| $100,000 and over | 27,277 (93.4%) | 1,912 (6.6%) |
Public vs Private Health Insurance Coverage by Age in Little Elm
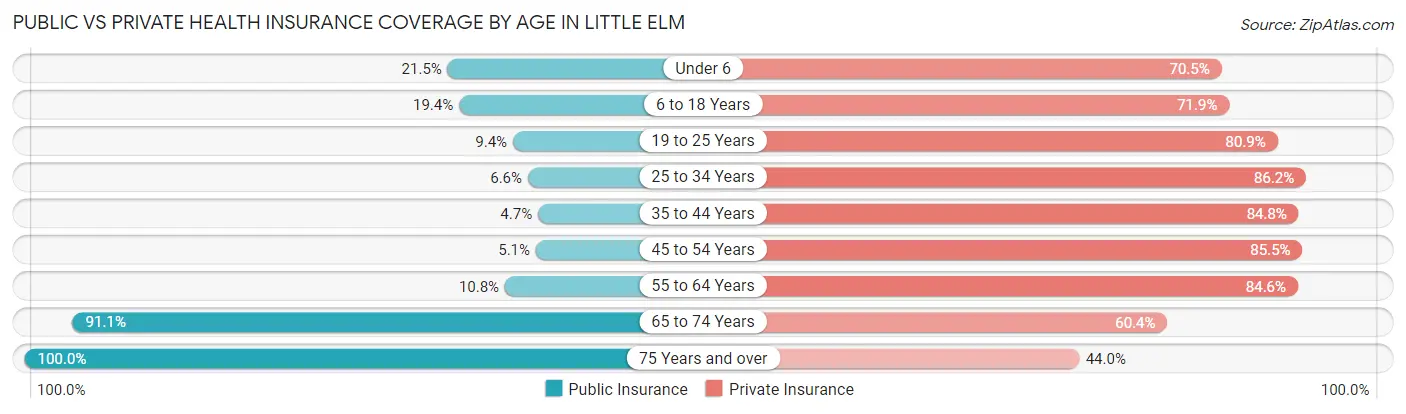
| Age Bracket | Public Insurance | Private Insurance |
| Under 6 | 712 (21.5%) | 2,337 (70.5%) |
| 6 to 18 Years | 2,160 (19.4%) | 8,022 (71.9%) |
| 19 to 25 Years | 336 (9.4%) | 2,904 (80.9%) |
| 25 to 34 Years | 349 (6.6%) | 4,572 (86.2%) |
| 35 to 44 Years | 474 (4.7%) | 8,526 (84.8%) |
| 45 to 54 Years | 369 (5.1%) | 6,190 (85.5%) |
| 55 to 64 Years | 482 (10.8%) | 3,765 (84.6%) |
| 65 to 74 Years | 1,880 (91.1%) | 1,247 (60.4%) |
| 75 Years and over | 1,046 (100.0%) | 460 (44.0%) |
| Total | 7,808 (16.2%) | 38,023 (78.8%) |
Disability Status by Sex by Age in Little Elm
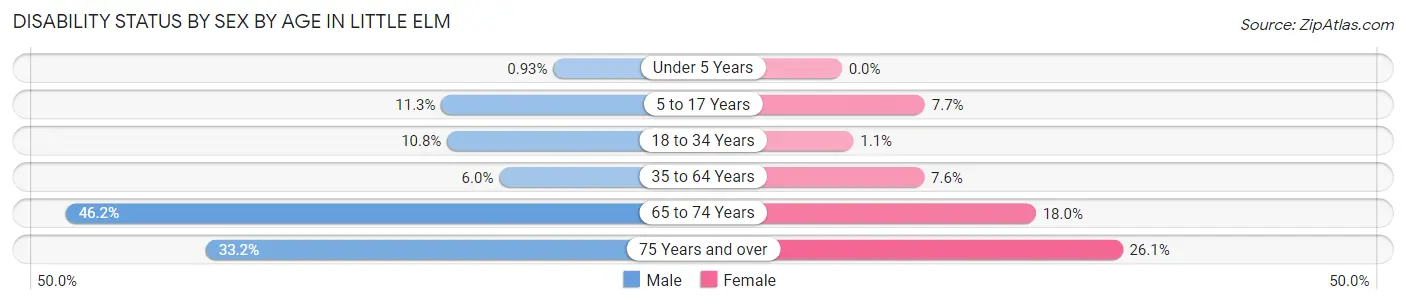
| Age Bracket | Male | Female |
| Under 5 Years | 15 (0.9%) | 0 (0.0%) |
| 5 to 17 Years | 694 (11.3%) | 403 (7.7%) |
| 18 to 34 Years | 507 (10.8%) | 51 (1.1%) |
| 35 to 64 Years | 651 (5.9%) | 825 (7.6%) |
| 65 to 74 Years | 417 (46.2%) | 209 (18.0%) |
| 75 Years and over | 142 (33.2%) | 161 (26.1%) |
Disability Class by Sex by Age in Little Elm
Disability Class: Hearing Difficulty
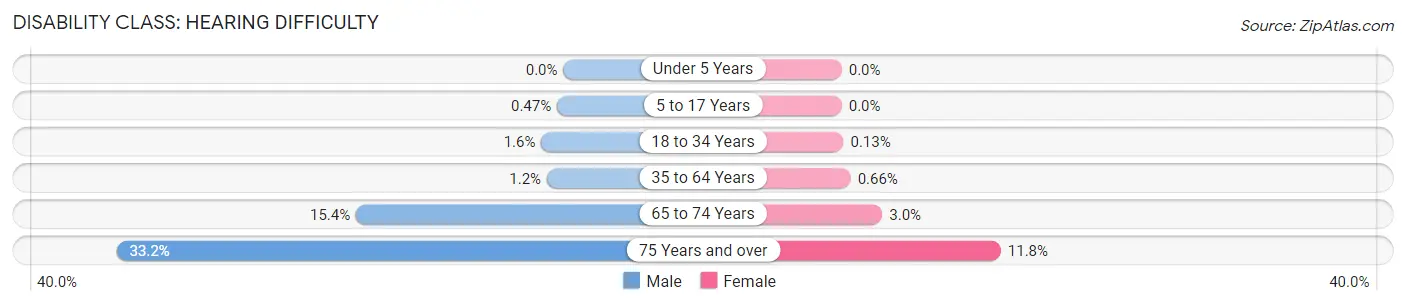
| Age Bracket | Male | Female |
| Under 5 Years | 0 (0.0%) | 0 (0.0%) |
| 5 to 17 Years | 29 (0.5%) | 0 (0.0%) |
| 18 to 34 Years | 77 (1.6%) | 6 (0.1%) |
| 35 to 64 Years | 134 (1.2%) | 71 (0.7%) |
| 65 to 74 Years | 139 (15.4%) | 35 (3.0%) |
| 75 Years and over | 142 (33.2%) | 73 (11.8%) |
Disability Class: Vision Difficulty
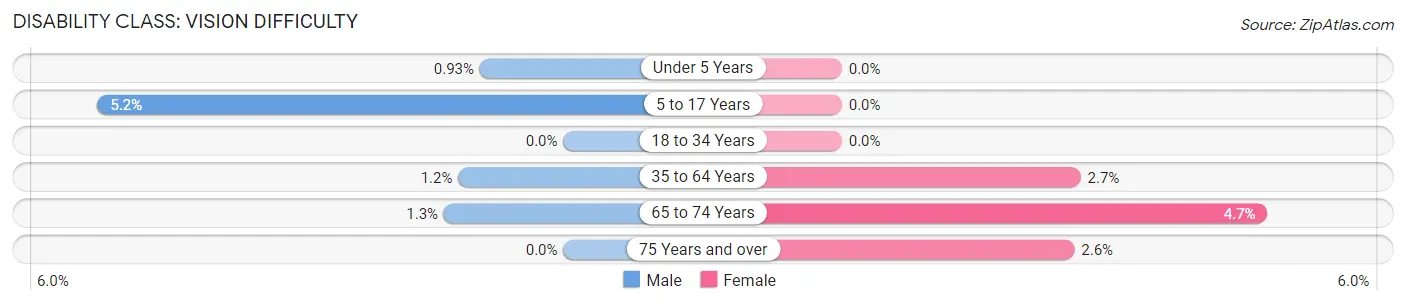
| Age Bracket | Male | Female |
| Under 5 Years | 15 (0.9%) | 0 (0.0%) |
| 5 to 17 Years | 318 (5.2%) | 0 (0.0%) |
| 18 to 34 Years | 0 (0.0%) | 0 (0.0%) |
| 35 to 64 Years | 128 (1.2%) | 287 (2.7%) |
| 65 to 74 Years | 12 (1.3%) | 55 (4.7%) |
| 75 Years and over | 0 (0.0%) | 16 (2.6%) |
Disability Class: Cognitive Difficulty
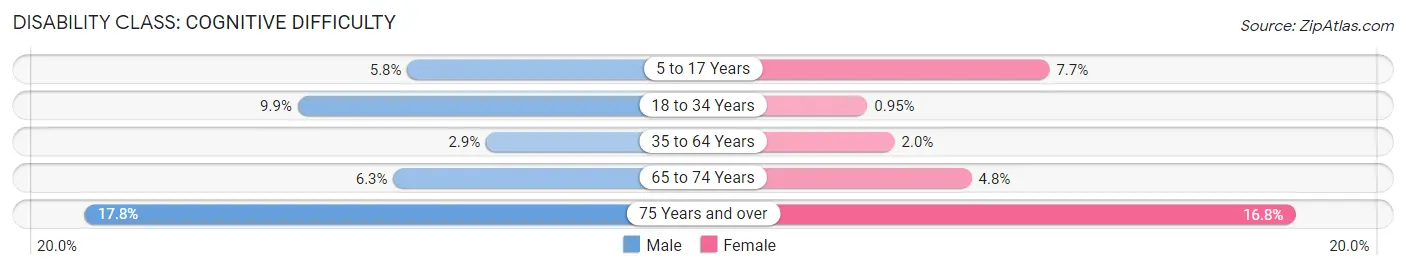
| Age Bracket | Male | Female |
| 5 to 17 Years | 355 (5.8%) | 403 (7.7%) |
| 18 to 34 Years | 464 (9.9%) | 45 (0.9%) |
| 35 to 64 Years | 314 (2.9%) | 212 (2.0%) |
| 65 to 74 Years | 57 (6.3%) | 56 (4.8%) |
| 75 Years and over | 76 (17.8%) | 104 (16.8%) |
Disability Class: Ambulatory Difficulty
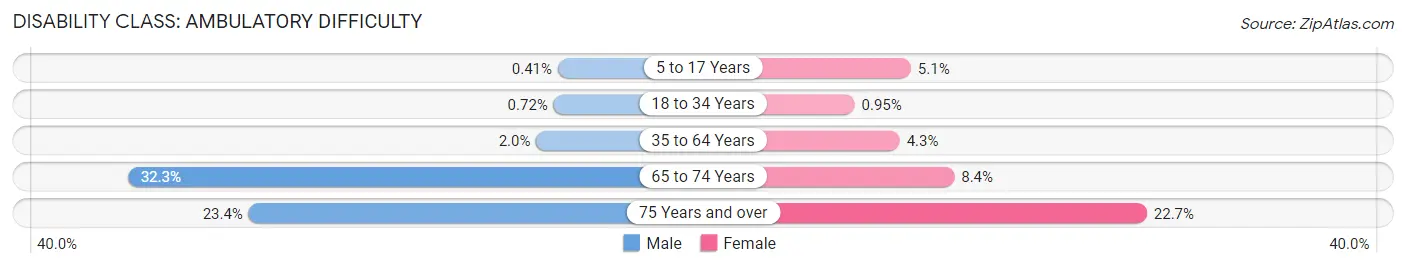
| Age Bracket | Male | Female |
| 5 to 17 Years | 25 (0.4%) | 268 (5.1%) |
| 18 to 34 Years | 34 (0.7%) | 45 (0.9%) |
| 35 to 64 Years | 220 (2.0%) | 464 (4.3%) |
| 65 to 74 Years | 292 (32.3%) | 97 (8.4%) |
| 75 Years and over | 100 (23.4%) | 140 (22.7%) |
Disability Class: Self-Care Difficulty
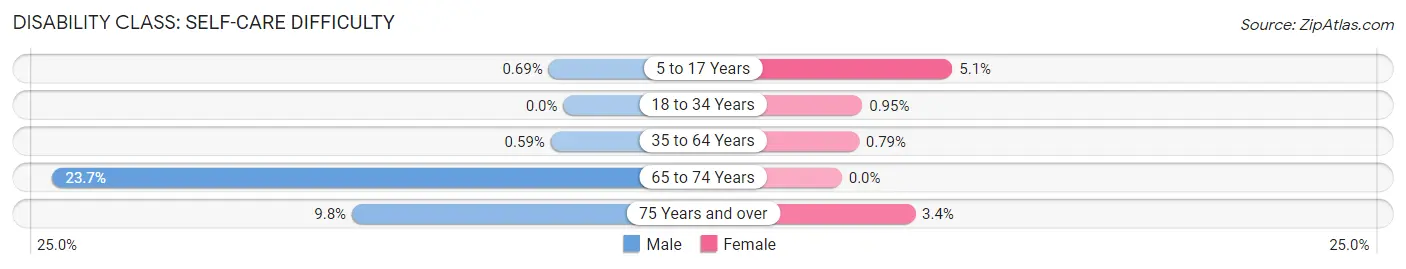
| Age Bracket | Male | Female |
| 5 to 17 Years | 42 (0.7%) | 268 (5.1%) |
| 18 to 34 Years | 0 (0.0%) | 45 (0.9%) |
| 35 to 64 Years | 64 (0.6%) | 85 (0.8%) |
| 65 to 74 Years | 214 (23.7%) | 0 (0.0%) |
| 75 Years and over | 42 (9.8%) | 21 (3.4%) |
Technology Access in Little Elm
Computing Device Access in Little Elm
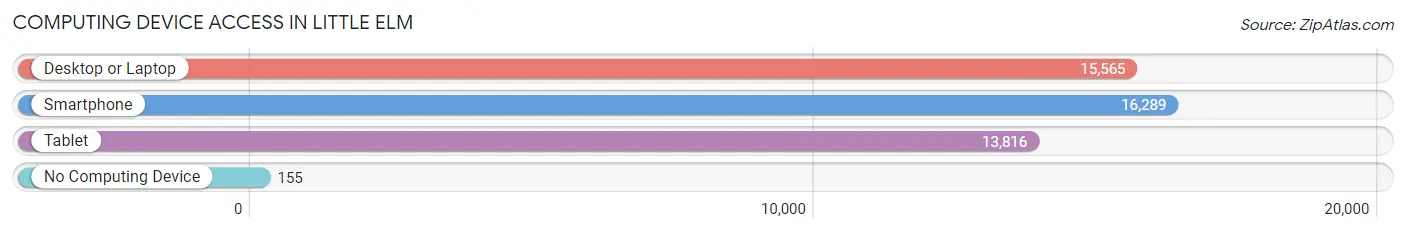
| Device Type | # Households | % Households |
| Desktop or Laptop | 15,565 | 92.9% |
| Smartphone | 16,289 | 97.2% |
| Tablet | 13,816 | 82.5% |
| No Computing Device | 155 | 0.9% |
| Total | 16,752 | 100.0% |
Internet Access in Little Elm
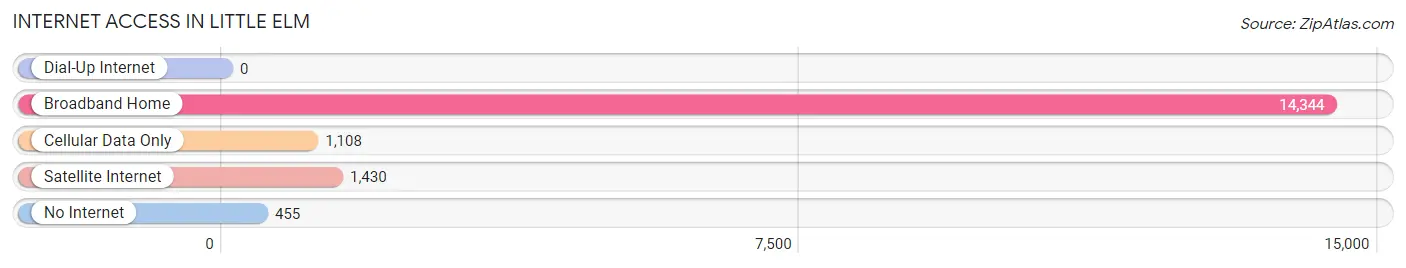
| Internet Type | # Households | % Households |
| Dial-Up Internet | 0 | 0.0% |
| Broadband Home | 14,344 | 85.6% |
| Cellular Data Only | 1,108 | 6.6% |
| Satellite Internet | 1,430 | 8.5% |
| No Internet | 455 | 2.7% |
| Total | 16,752 | 100.0% |
Little Elm Summary
History
Little Elm, Texas is a small town located in Denton County, Texas. It is situated on the eastern shore of Lake Lewisville, approximately 30 miles north of Dallas. The town was founded in 1845 by a group of settlers from Kentucky and Tennessee. The town was originally known as “Little Elm Creek”, and was later shortened to “Little Elm”.
The town was originally a farming community, and the main crops grown were cotton, corn, and wheat. The town also had a few small businesses, such as a general store, a blacksmith, and a post office. In the late 1800s, the town began to grow and develop, and by the early 1900s, it had become a thriving community.
In the 1950s, the town began to experience a population boom, as many people moved to the area to take advantage of the booming economy. This growth continued into the 1960s and 1970s, and by the 1980s, the town had become a bedroom community for Dallas.
Geography
Little Elm is located in Denton County, Texas, approximately 30 miles north of Dallas. The town is situated on the eastern shore of Lake Lewisville, and is bordered by the cities of Frisco, The Colony, and Oak Point. The town covers an area of approximately 10 square miles, and has a population of approximately 33,000 people.
The town is located in a humid subtropical climate zone, and experiences hot, humid summers and mild winters. The average annual temperature is around 70 degrees Fahrenheit, and the average annual precipitation is around 40 inches.
Economy
Little Elm’s economy is largely based on the service industry, with many businesses providing services to the surrounding area. The town is home to a number of retail stores, restaurants, and other businesses. The town also has a number of manufacturing and industrial businesses, including a large plastics manufacturing plant.
The town is also home to a number of technology companies, including a software development firm and a telecommunications company. The town is also home to a number of medical facilities, including a hospital and several clinics.
Demographics
As of the 2010 census, the population of Little Elm was 33,343. The racial makeup of the town was 75.3% White, 11.2% African American, 0.7% Native American, 4.2% Asian, 0.1% Pacific Islander, and 8.5% from other races. Hispanic or Latino of any race were 18.3% of the population.
The median income for a household in the town was $63,945, and the median income for a family was $71,945. The per capita income for the town was $27,945. About 6.3% of families and 8.2% of the population were below the poverty line, including 10.2% of those under age 18 and 6.2% of those age 65 or over.
Common Questions
What is Per Capita Income in Little Elm?
Per Capita income in Little Elm is $43,823.
What is the Median Family Income in Little Elm?
Median Family Income in Little Elm is $115,670.
What is the Median Household income in Little Elm?
Median Household Income in Little Elm is $110,218.
What is Income or Wage Gap in Little Elm?
Income or Wage Gap in Little Elm is 25.7%.
Women in Little Elm earn 74.3 cents for every dollar earned by a man.
What is Family Income Deficit in Little Elm?
Family Income Deficit in Little Elm is $15,772.
Families that are below poverty line in Little Elm earn $15,772 less on average than the poverty threshold level.
What is Inequality or Gini Index in Little Elm?
Inequality or Gini Index in Little Elm is 0.36.
What is the Total Population of Little Elm?
Total Population of Little Elm is 48,241.
What is the Total Male Population of Little Elm?
Total Male Population of Little Elm is 24,741.
What is the Total Female Population of Little Elm?
Total Female Population of Little Elm is 23,500.
What is the Ratio of Males per 100 Females in Little Elm?
There are 105.28 Males per 100 Females in Little Elm.
What is the Ratio of Females per 100 Males in Little Elm?
There are 94.98 Females per 100 Males in Little Elm.
What is the Median Population Age in Little Elm?
Median Population Age in Little Elm is 35.9 Years.
What is the Average Family Size in Little Elm
Average Family Size in Little Elm is 3.3 People.
What is the Average Household Size in Little Elm
Average Household Size in Little Elm is 2.9 People.
How Large is the Labor Force in Little Elm?
There are 27,311 People in the Labor Forcein in Little Elm.
What is the Percentage of People in the Labor Force in Little Elm?
75.1% of People are in the Labor Force in Little Elm.
What is the Unemployment Rate in Little Elm?
Unemployment Rate in Little Elm is 6.5%.