Vinings, GA Map & Demographics
Vinings Map
Vinings Overview
$80,167
PER CAPITA INCOME
$144,469
AVG FAMILY INCOME
$91,071
AVG HOUSEHOLD INCOME
21.2%
WAGE / INCOME GAP [ % ]
78.8¢/ $1
WAGE / INCOME GAP [ $ ]
0.48
INEQUALITY / GINI INDEX
12,947
TOTAL POPULATION
6,375
MALE POPULATION
6,572
FEMALE POPULATION
97.00
MALES / 100 FEMALES
103.09
FEMALES / 100 MALES
33.3
MEDIAN AGE
2.7
AVG FAMILY SIZE
1.8
AVG HOUSEHOLD SIZE
9,104
LABOR FORCE [ PEOPLE ]
80.9%
PERCENT IN LABOR FORCE
2.1%
UNEMPLOYMENT RATE
Income in Vinings
Income Overview in Vinings
Per Capita Income in Vinings is $80,167, while median incomes of families and households are $144,469 and $91,071 respectively.
| Characteristic | Number | Measure |
| Per Capita Income | 12,947 | $80,167 |
| Median Family Income | 2,565 | $144,469 |
| Mean Family Income | 2,565 | $230,107 |
| Median Household Income | 7,240 | $91,071 |
| Mean Household Income | 7,240 | $143,149 |
| Income Deficit | 2,565 | $0 |
| Wage / Income Gap (%) | 12,947 | 21.19% |
| Wage / Income Gap ($) | 12,947 | 78.81¢ per $1 |
| Gini / Inequality Index | 12,947 | 0.48 |
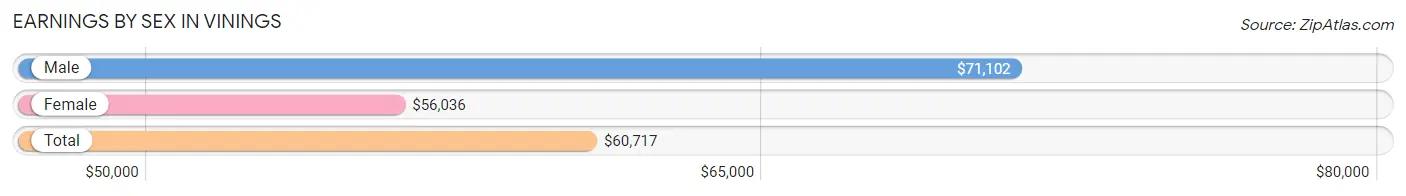
Earnings by Sex in Vinings
Average Earnings in Vinings are $60,717, $71,102 for men and $56,036 for women, a difference of 21.2%.
| Sex | Number | Average Earnings |
| Male | 4,970 (53.9%) | $71,102 |
| Female | 4,247 (46.1%) | $56,036 |
| Total | 9,217 (100.0%) | $60,717 |
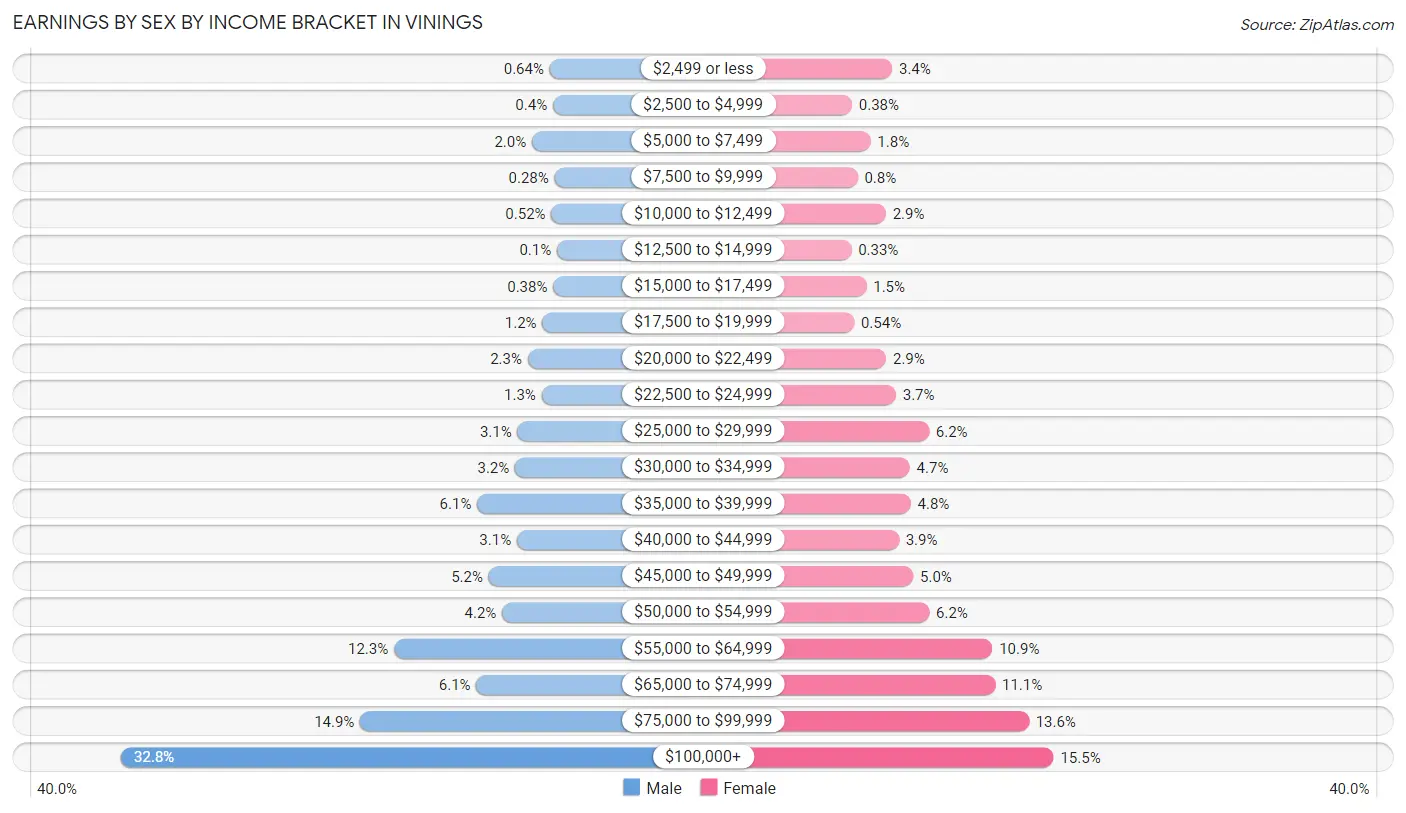
Earnings by Sex by Income Bracket in Vinings
The most common earnings brackets in Vinings are $100,000+ for men (1,629 | 32.8%) and $100,000+ for women (658 | 15.5%).
| Income | Male | Female |
| $2,499 or less | 32 (0.6%) | 144 (3.4%) |
| $2,500 to $4,999 | 20 (0.4%) | 16 (0.4%) |
| $5,000 to $7,499 | 98 (2.0%) | 75 (1.8%) |
| $7,500 to $9,999 | 14 (0.3%) | 34 (0.8%) |
| $10,000 to $12,499 | 26 (0.5%) | 124 (2.9%) |
| $12,500 to $14,999 | 5 (0.1%) | 14 (0.3%) |
| $15,000 to $17,499 | 19 (0.4%) | 62 (1.5%) |
| $17,500 to $19,999 | 59 (1.2%) | 23 (0.5%) |
| $20,000 to $22,499 | 114 (2.3%) | 125 (2.9%) |
| $22,500 to $24,999 | 62 (1.3%) | 156 (3.7%) |
| $25,000 to $29,999 | 152 (3.1%) | 261 (6.1%) |
| $30,000 to $34,999 | 161 (3.2%) | 200 (4.7%) |
| $35,000 to $39,999 | 302 (6.1%) | 203 (4.8%) |
| $40,000 to $44,999 | 154 (3.1%) | 165 (3.9%) |
| $45,000 to $49,999 | 259 (5.2%) | 211 (5.0%) |
| $50,000 to $54,999 | 209 (4.2%) | 262 (6.2%) |
| $55,000 to $64,999 | 612 (12.3%) | 463 (10.9%) |
| $65,000 to $74,999 | 305 (6.1%) | 472 (11.1%) |
| $75,000 to $99,999 | 738 (14.8%) | 579 (13.6%) |
| $100,000+ | 1,629 (32.8%) | 658 (15.5%) |
| Total | 4,970 (100.0%) | 4,247 (100.0%) |
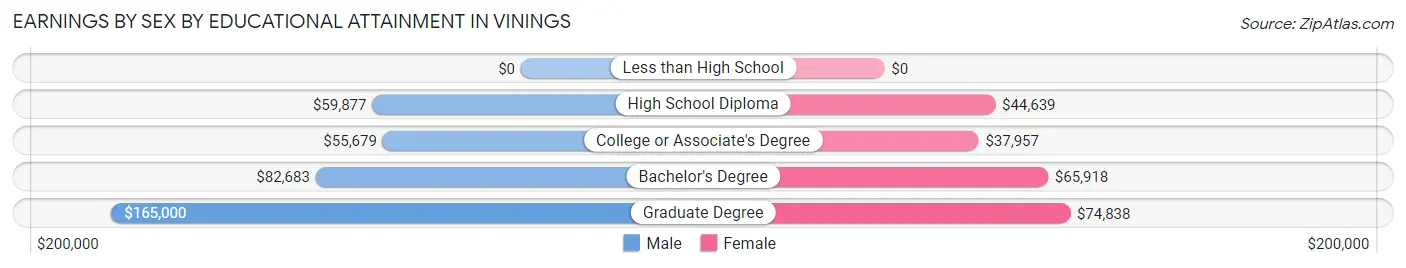
Earnings by Sex by Educational Attainment in Vinings
Average earnings in Vinings are $76,094 for men and $58,820 for women, a difference of 22.7%. Men with an educational attainment of graduate degree enjoy the highest average annual earnings of $165,000, while those with college or associate's degree education earn the least with $55,679. Women with an educational attainment of graduate degree earn the most with the average annual earnings of $74,838, while those with college or associate's degree education have the smallest earnings of $37,957.
| Educational Attainment | Male Income | Female Income |
| Less than High School | - | - |
| High School Diploma | $59,877 | $44,639 |
| College or Associate's Degree | $55,679 | $37,957 |
| Bachelor's Degree | $82,683 | $65,918 |
| Graduate Degree | $165,000 | $74,838 |
| Total | $76,094 | $58,820 |
Family Income in Vinings
Family Income Brackets in Vinings
According to the Vinings family income data, there are 1,039 families falling into the $200,000+ income range, which is the most common income bracket and makes up 40.5% of all families. Conversely, the $10,000 to $14,999 income bracket is the least frequent group with only 10 families (0.4%) belonging to this category.
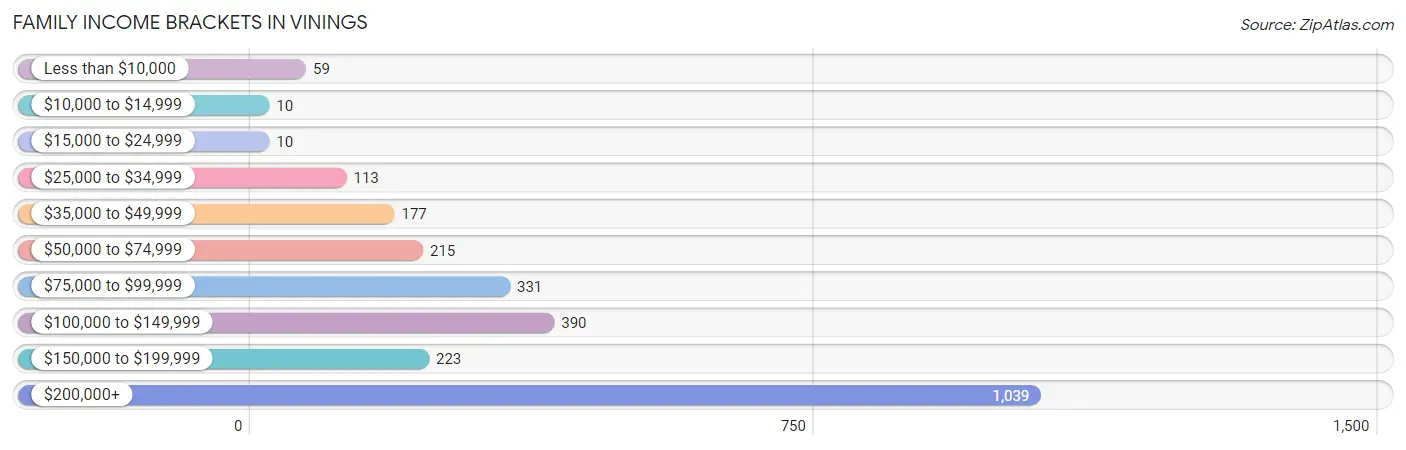
| Income Bracket | # Families | % Families |
| Less than $10,000 | 59 | 2.3% |
| $10,000 to $14,999 | 10 | 0.4% |
| $15,000 to $24,999 | 10 | 0.4% |
| $25,000 to $34,999 | 113 | 4.4% |
| $35,000 to $49,999 | 177 | 6.9% |
| $50,000 to $74,999 | 215 | 8.4% |
| $75,000 to $99,999 | 331 | 12.9% |
| $100,000 to $149,999 | 390 | 15.2% |
| $150,000 to $199,999 | 223 | 8.7% |
| $200,000+ | 1,039 | 40.5% |
Family Income by Famaliy Size in Vinings
4-person families (157 | 6.1%) account for the highest median family income in Vinings with $250,001 per family, while 2-person families (1,757 | 68.5%) have the highest median income of $83,990 per family member.
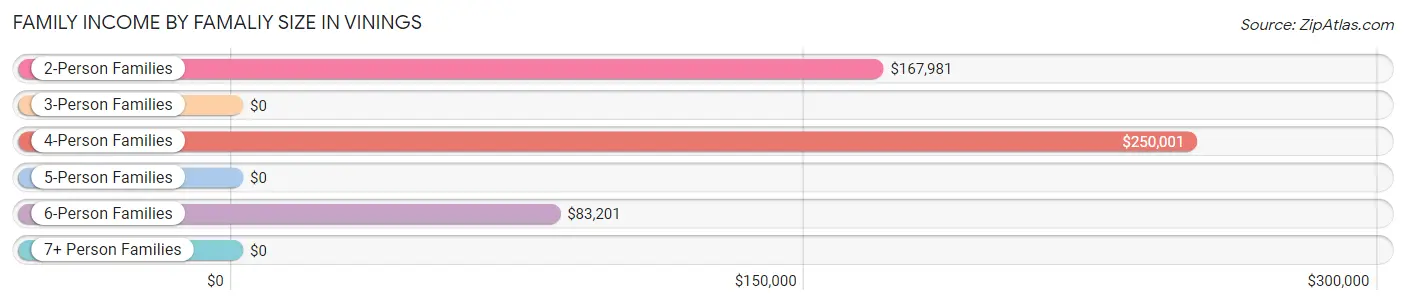
| Income Bracket | # Families | Median Income |
| 2-Person Families | 1,757 (68.5%) | $167,981 |
| 3-Person Families | 375 (14.6%) | $0 |
| 4-Person Families | 157 (6.1%) | $250,001 |
| 5-Person Families | 129 (5.0%) | $0 |
| 6-Person Families | 147 (5.7%) | $83,201 |
| 7+ Person Families | 0 (0.0%) | $0 |
| Total | 2,565 (100.0%) | $144,469 |
Family Income by Number of Earners in Vinings
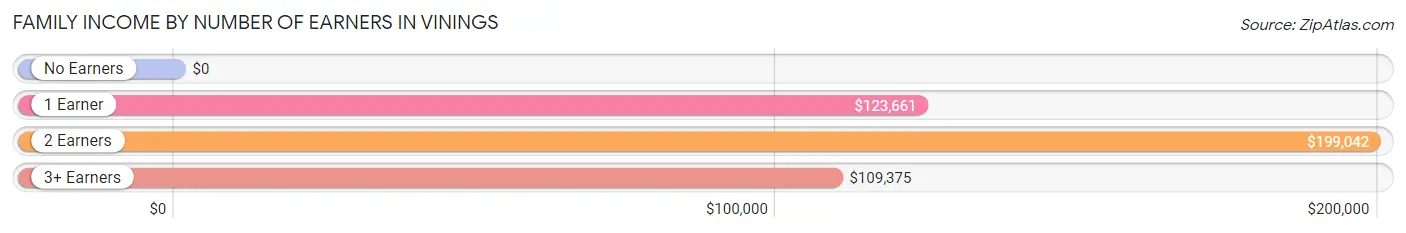
| Number of Earners | # Families | Median Income |
| No Earners | 231 (9.0%) | $0 |
| 1 Earner | 1,032 (40.2%) | $123,661 |
| 2 Earners | 1,206 (47.0%) | $199,042 |
| 3+ Earners | 96 (3.7%) | $109,375 |
| Total | 2,565 (100.0%) | $144,469 |
Household Income in Vinings
Household Income Brackets in Vinings
With 1,513 households falling in the category, the $100,000 to $149,999 income range is the most frequent in Vinings, accounting for 20.9% of all households. In contrast, only 43 households (0.6%) fall into the less than $10,000 income bracket, making it the least populous group.
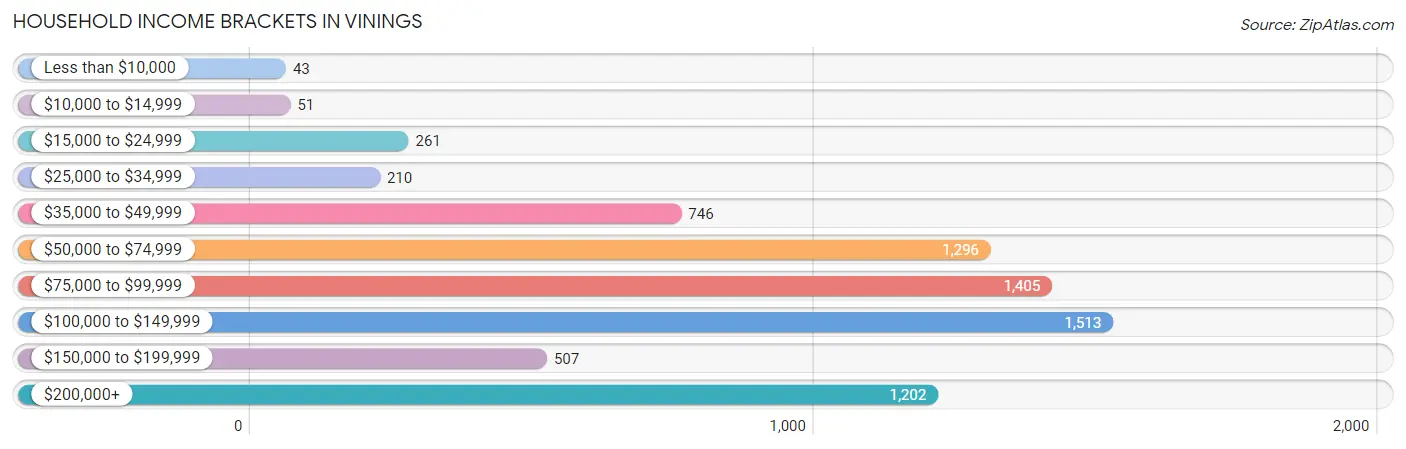
| Income Bracket | # Households | % Households |
| Less than $10,000 | 43 | 0.6% |
| $10,000 to $14,999 | 51 | 0.7% |
| $15,000 to $24,999 | 261 | 3.6% |
| $25,000 to $34,999 | 210 | 2.9% |
| $35,000 to $49,999 | 746 | 10.3% |
| $50,000 to $74,999 | 1,296 | 17.9% |
| $75,000 to $99,999 | 1,405 | 19.4% |
| $100,000 to $149,999 | 1,513 | 20.9% |
| $150,000 to $199,999 | 507 | 7.0% |
| $200,000+ | 1,202 | 16.6% |
Household Income by Householder Age in Vinings
The median household income in Vinings is $91,071, with the highest median household income of $119,450 found in the 65+ years age bracket for the primary householder. A total of 1,131 households (15.6%) fall into this category. Meanwhile, the 25 to 44 years age bracket for the primary householder has the lowest median household income of $79,512, with 3,748 households (51.8%) in this group.
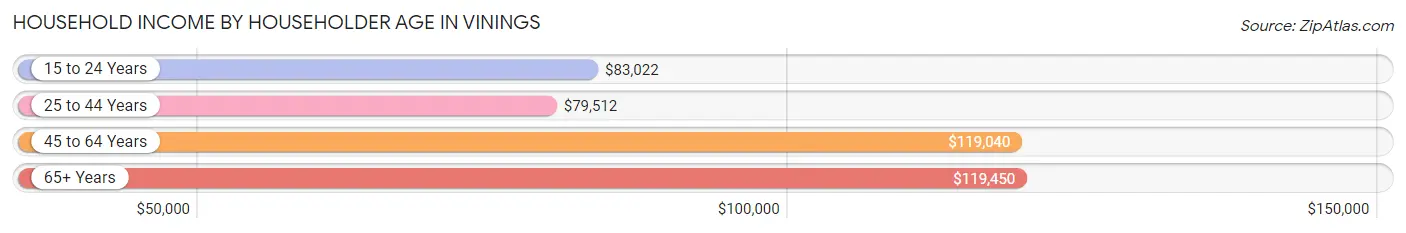
| Income Bracket | # Households | Median Income |
| 15 to 24 Years | 432 (6.0%) | $83,022 |
| 25 to 44 Years | 3,748 (51.8%) | $79,512 |
| 45 to 64 Years | 1,929 (26.6%) | $119,040 |
| 65+ Years | 1,131 (15.6%) | $119,450 |
| Total | 7,240 (100.0%) | $91,071 |
Poverty in Vinings
Income Below Poverty by Sex and Age in Vinings
With 5.1% poverty level for males and 5.9% for females among the residents of Vinings, 15 year old males and 6 to 11 year old females are the most vulnerable to poverty, with 51 males (77.3%) and 98 females (46.7%) in their respective age groups living below the poverty level.
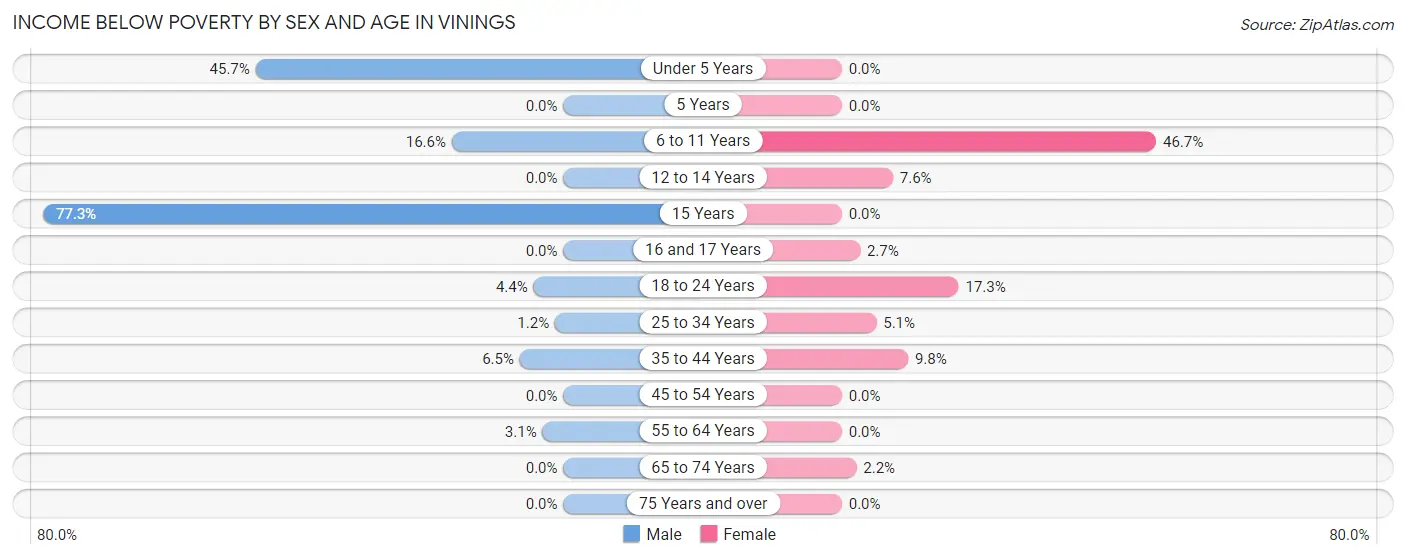
| Age Bracket | Male | Female |
| Under 5 Years | 101 (45.7%) | 0 (0.0%) |
| 5 Years | 0 (0.0%) | 0 (0.0%) |
| 6 to 11 Years | 58 (16.6%) | 98 (46.7%) |
| 12 to 14 Years | 0 (0.0%) | 10 (7.6%) |
| 15 Years | 51 (77.3%) | 0 (0.0%) |
| 16 and 17 Years | 0 (0.0%) | 1 (2.7%) |
| 18 to 24 Years | 18 (4.4%) | 111 (17.3%) |
| 25 to 34 Years | 28 (1.2%) | 100 (5.1%) |
| 35 to 44 Years | 50 (6.5%) | 57 (9.8%) |
| 45 to 54 Years | 0 (0.0%) | 0 (0.0%) |
| 55 to 64 Years | 17 (3.1%) | 0 (0.0%) |
| 65 to 74 Years | 0 (0.0%) | 12 (2.2%) |
| 75 Years and over | 0 (0.0%) | 0 (0.0%) |
| Total | 323 (5.1%) | 389 (5.9%) |
Income Above Poverty by Sex and Age in Vinings
According to the poverty statistics in Vinings, males aged 5 years and females aged under 5 years are the age groups that are most secure financially, with 100.0% of males and 100.0% of females in these age groups living above the poverty line.
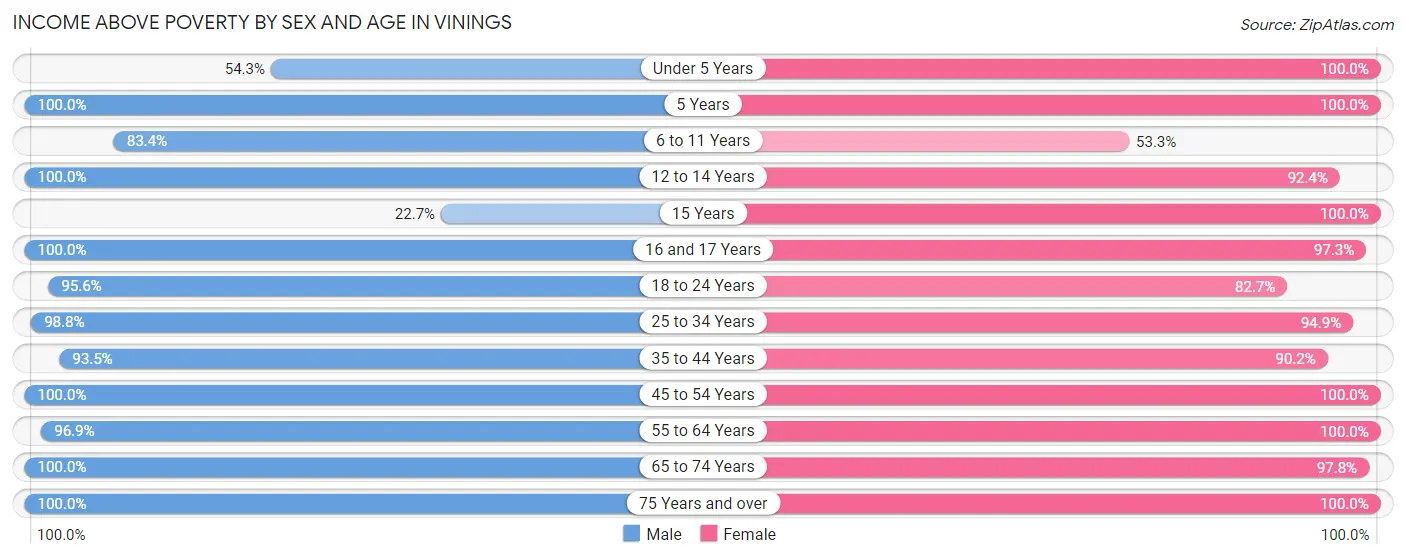
| Age Bracket | Male | Female |
| Under 5 Years | 120 (54.3%) | 431 (100.0%) |
| 5 Years | 82 (100.0%) | 104 (100.0%) |
| 6 to 11 Years | 292 (83.4%) | 112 (53.3%) |
| 12 to 14 Years | 65 (100.0%) | 122 (92.4%) |
| 15 Years | 15 (22.7%) | 32 (100.0%) |
| 16 and 17 Years | 41 (100.0%) | 36 (97.3%) |
| 18 to 24 Years | 388 (95.6%) | 529 (82.7%) |
| 25 to 34 Years | 2,226 (98.8%) | 1,854 (94.9%) |
| 35 to 44 Years | 723 (93.5%) | 523 (90.2%) |
| 45 to 54 Years | 797 (100.0%) | 787 (100.0%) |
| 55 to 64 Years | 532 (96.9%) | 753 (100.0%) |
| 65 to 74 Years | 418 (100.0%) | 543 (97.8%) |
| 75 Years and over | 353 (100.0%) | 352 (100.0%) |
| Total | 6,052 (94.9%) | 6,178 (94.1%) |
Income Below Poverty Among Married-Couple Families in Vinings
The poverty statistics for married-couple families in Vinings show that 2.7% or 48 of the total 1,770 families live below the poverty line. Families with 3 or 4 children have the highest poverty rate of 41.0%, comprising of 48 families. On the other hand, families with no children have the lowest poverty rate of 0.0%, which includes 0 families.
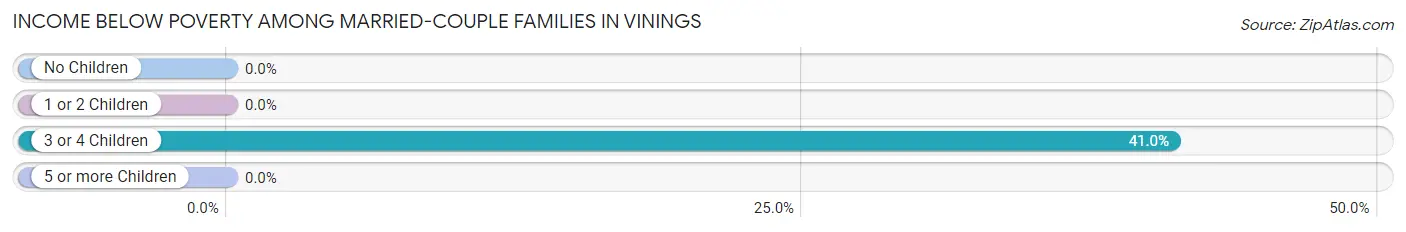
| Children | Above Poverty | Below Poverty |
| No Children | 1,294 (100.0%) | 0 (0.0%) |
| 1 or 2 Children | 359 (100.0%) | 0 (0.0%) |
| 3 or 4 Children | 69 (59.0%) | 48 (41.0%) |
| 5 or more Children | 0 (0.0%) | 0 (0.0%) |
| Total | 1,722 (97.3%) | 48 (2.7%) |
Income Below Poverty Among Single-Parent Households in Vinings
According to the poverty data in Vinings, 11.8% or 18 single-father households and 9.3% or 60 single-mother households are living below the poverty line. Among single-father households, those with no children have the highest poverty rate, with 18 households (14.4%) experiencing poverty. Likewise, among single-mother households, those with 1 or 2 children have the highest poverty rate, with 60 households (17.4%) falling below the poverty line.
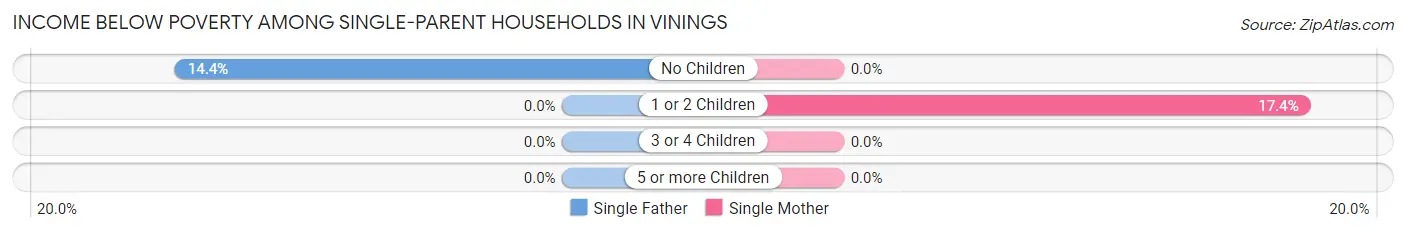
| Children | Single Father | Single Mother |
| No Children | 18 (14.4%) | 0 (0.0%) |
| 1 or 2 Children | 0 (0.0%) | 60 (17.4%) |
| 3 or 4 Children | 0 (0.0%) | 0 (0.0%) |
| 5 or more Children | 0 (0.0%) | 0 (0.0%) |
| Total | 18 (11.8%) | 60 (9.3%) |
Income Below Poverty Among Married-Couple vs Single-Parent Households in Vinings
The poverty data for Vinings shows that 48 of the married-couple family households (2.7%) and 78 of the single-parent households (9.8%) are living below the poverty level. Within the married-couple family households, those with 3 or 4 children have the highest poverty rate, with 48 households (41.0%) falling below the poverty line. Among the single-parent households, those with 1 or 2 children have the highest poverty rate, with 60 household (16.1%) living below poverty.
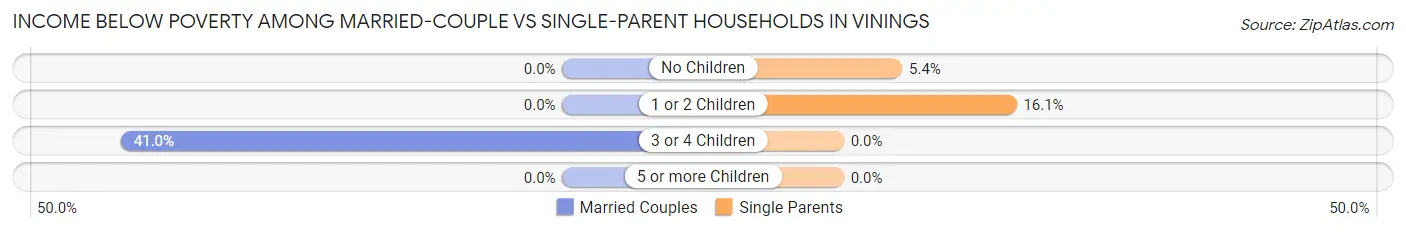
| Children | Married-Couple Families | Single-Parent Households |
| No Children | 0 (0.0%) | 18 (5.4%) |
| 1 or 2 Children | 0 (0.0%) | 60 (16.1%) |
| 3 or 4 Children | 48 (41.0%) | 0 (0.0%) |
| 5 or more Children | 0 (0.0%) | 0 (0.0%) |
| Total | 48 (2.7%) | 78 (9.8%) |
Race in Vinings
The most populous races in Vinings are White / Caucasian (7,166 | 55.3%), Black / African American (3,834 | 29.6%), and Two or more Races (1,310 | 10.1%).
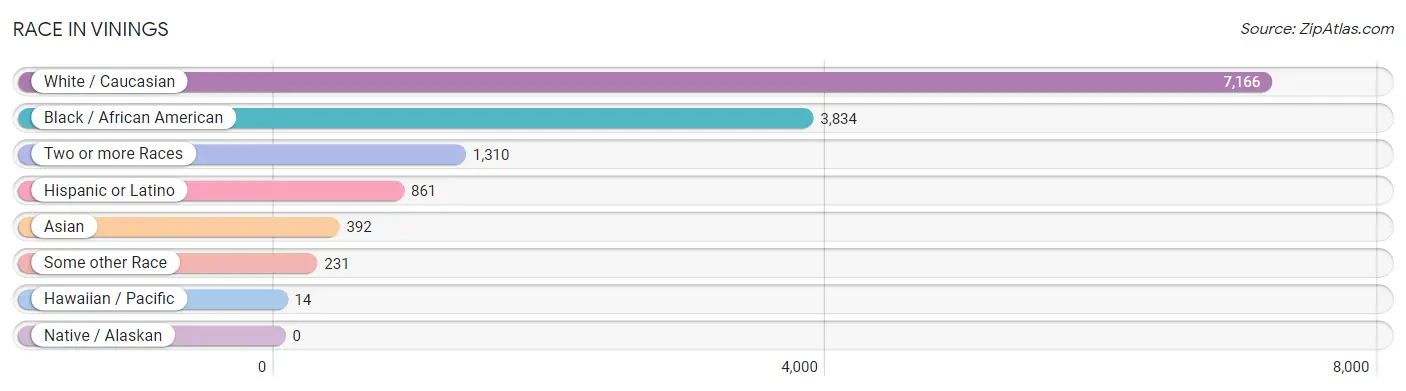
| Race | # Population | % Population |
| Asian | 392 | 3.0% |
| Black / African American | 3,834 | 29.6% |
| Hawaiian / Pacific | 14 | 0.1% |
| Hispanic or Latino | 861 | 6.7% |
| Native / Alaskan | 0 | 0.0% |
| White / Caucasian | 7,166 | 55.3% |
| Two or more Races | 1,310 | 10.1% |
| Some other Race | 231 | 1.8% |
| Total | 12,947 | 100.0% |
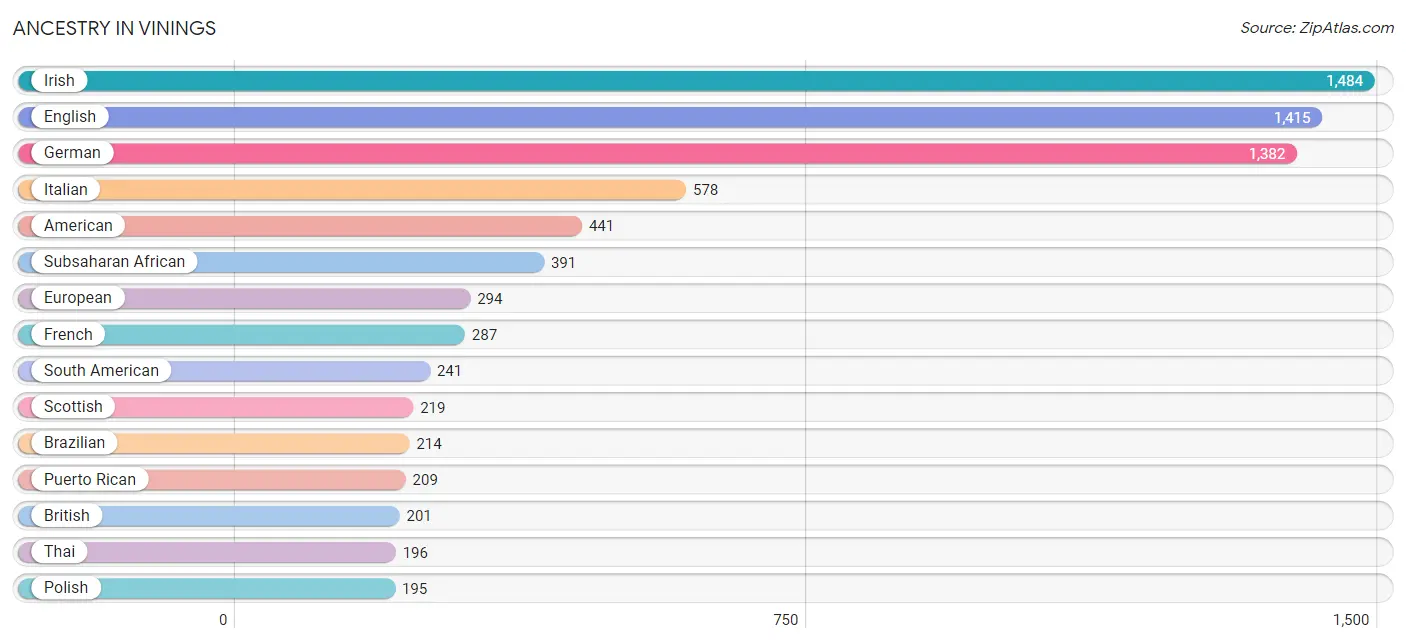
Ancestry in Vinings
The most populous ancestries reported in Vinings are Irish (1,484 | 11.5%), English (1,415 | 10.9%), German (1,382 | 10.7%), Italian (578 | 4.5%), and American (441 | 3.4%), together accounting for 40.9% of all Vinings residents.
| Ancestry | # Population | % Population |
| African | 115 | 0.9% |
| American | 441 | 3.4% |
| Arab | 5 | 0.0% |
| Armenian | 12 | 0.1% |
| Austrian | 37 | 0.3% |
| Bhutanese | 20 | 0.2% |
| Brazilian | 214 | 1.7% |
| British | 201 | 1.5% |
| Burmese | 124 | 1.0% |
| Celtic | 3 | 0.0% |
| Central American | 62 | 0.5% |
| Cherokee | 15 | 0.1% |
| Colombian | 69 | 0.5% |
| Croatian | 14 | 0.1% |
| Cuban | 140 | 1.1% |
| Czech | 10 | 0.1% |
| Czechoslovakian | 14 | 0.1% |
| Danish | 57 | 0.4% |
| Dutch | 49 | 0.4% |
| Eastern European | 62 | 0.5% |
| Ecuadorian | 9 | 0.1% |
| English | 1,415 | 10.9% |
| Ethiopian | 55 | 0.4% |
| European | 294 | 2.3% |
| Finnish | 12 | 0.1% |
| French | 287 | 2.2% |
| French Canadian | 36 | 0.3% |
| German | 1,382 | 10.7% |
| Ghanaian | 36 | 0.3% |
| Greek | 26 | 0.2% |
| Guatemalan | 21 | 0.2% |
| Guyanese | 13 | 0.1% |
| Haitian | 19 | 0.2% |
| Hungarian | 15 | 0.1% |
| Indian (Asian) | 29 | 0.2% |
| Iranian | 15 | 0.1% |
| Irish | 1,484 | 11.5% |
| Israeli | 22 | 0.2% |
| Italian | 578 | 4.5% |
| Jamaican | 137 | 1.1% |
| Korean | 19 | 0.2% |
| Laotian | 5 | 0.0% |
| Lithuanian | 20 | 0.2% |
| Malaysian | 25 | 0.2% |
| Mexican | 118 | 0.9% |
| Native Hawaiian | 14 | 0.1% |
| Nigerian | 74 | 0.6% |
| Northern European | 12 | 0.1% |
| Norwegian | 86 | 0.7% |
| Pakistani | 9 | 0.1% |
| Panamanian | 41 | 0.3% |
| Polish | 195 | 1.5% |
| Portuguese | 72 | 0.6% |
| Puerto Rican | 209 | 1.6% |
| Romanian | 104 | 0.8% |
| Russian | 80 | 0.6% |
| Scandinavian | 40 | 0.3% |
| Scotch-Irish | 162 | 1.3% |
| Scottish | 219 | 1.7% |
| South African | 15 | 0.1% |
| South American | 241 | 1.9% |
| Spaniard | 76 | 0.6% |
| Spanish | 15 | 0.1% |
| Sri Lankan | 54 | 0.4% |
| Subsaharan African | 391 | 3.0% |
| Swedish | 63 | 0.5% |
| Swiss | 22 | 0.2% |
| Syrian | 5 | 0.0% |
| Thai | 196 | 1.5% |
| Turkish | 4 | 0.0% |
| Ugandan | 37 | 0.3% |
| Ukrainian | 66 | 0.5% |
| Venezuelan | 163 | 1.3% |
| Welsh | 35 | 0.3% | View All 74 Rows |
Immigrants in Vinings
The most numerous immigrant groups reported in Vinings came from Latin America (652 | 5.0%), South America (410 | 3.2%), Asia (304 | 2.4%), Africa (228 | 1.8%), and Brazil (214 | 1.7%), together accounting for 14.0% of all Vinings residents.
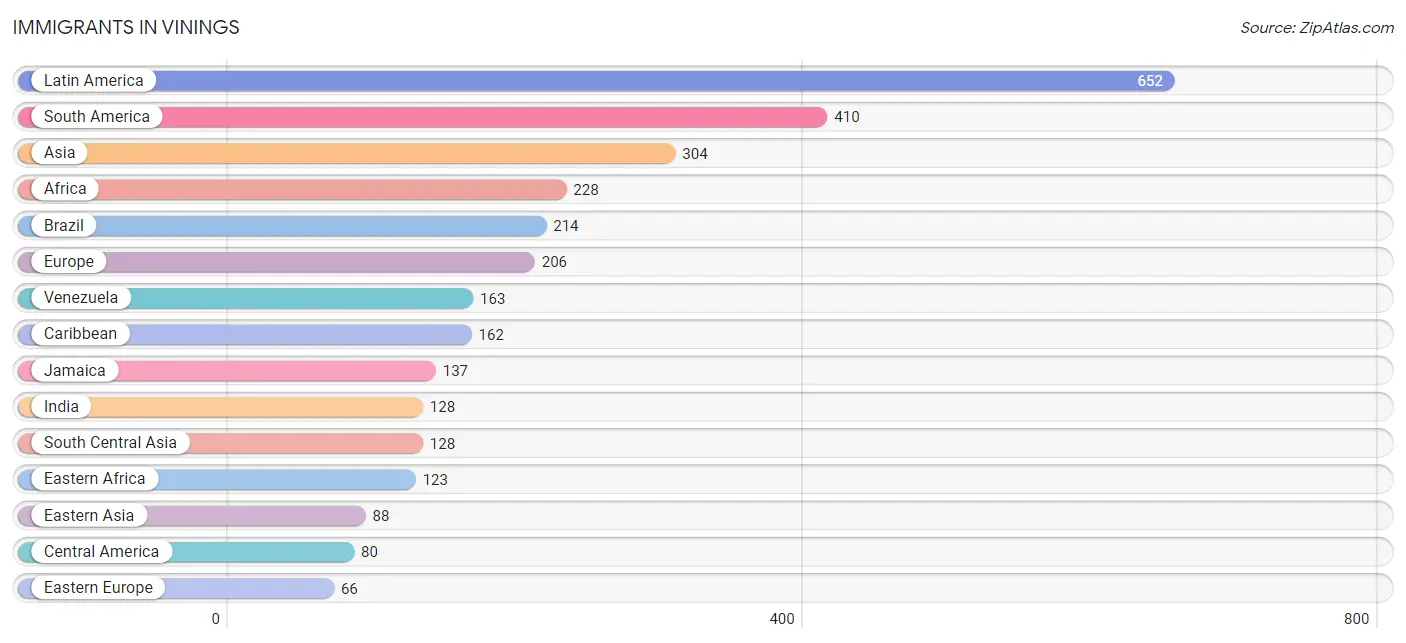
| Immigration Origin | # Population | % Population |
| Africa | 228 | 1.8% |
| Argentina | 4 | 0.0% |
| Asia | 304 | 2.4% |
| Brazil | 214 | 1.7% |
| Canada | 7 | 0.1% |
| Caribbean | 162 | 1.3% |
| Central America | 80 | 0.6% |
| China | 29 | 0.2% |
| Colombia | 20 | 0.2% |
| Cuba | 25 | 0.2% |
| Denmark | 5 | 0.0% |
| Eastern Africa | 123 | 0.9% |
| Eastern Asia | 88 | 0.7% |
| Eastern Europe | 66 | 0.5% |
| Ecuador | 9 | 0.1% |
| England | 56 | 0.4% |
| Ethiopia | 55 | 0.4% |
| Europe | 206 | 1.6% |
| France | 15 | 0.1% |
| Germany | 21 | 0.2% |
| Ghana | 36 | 0.3% |
| India | 128 | 1.0% |
| Indonesia | 5 | 0.0% |
| Israel | 22 | 0.2% |
| Jamaica | 137 | 1.1% |
| Kenya | 28 | 0.2% |
| Korea | 59 | 0.5% |
| Latin America | 652 | 5.0% |
| Mexico | 39 | 0.3% |
| Nigeria | 18 | 0.1% |
| Northern Europe | 66 | 0.5% |
| Panama | 41 | 0.3% |
| South Africa | 51 | 0.4% |
| South America | 410 | 3.2% |
| South Central Asia | 128 | 1.0% |
| South Eastern Asia | 62 | 0.5% |
| Southern Europe | 38 | 0.3% |
| Spain | 38 | 0.3% |
| Thailand | 20 | 0.2% |
| Turkey | 4 | 0.0% |
| Uganda | 21 | 0.2% |
| Ukraine | 66 | 0.5% |
| Venezuela | 163 | 1.3% |
| Vietnam | 37 | 0.3% |
| Western Africa | 54 | 0.4% |
| Western Asia | 26 | 0.2% |
| Western Europe | 36 | 0.3% | View All 47 Rows |
Sex and Age in Vinings
Sex and Age in Vinings
The most populous age groups in Vinings are 25 to 29 Years (1,270 | 19.9%) for men and 25 to 29 Years (1,106 | 16.8%) for women.
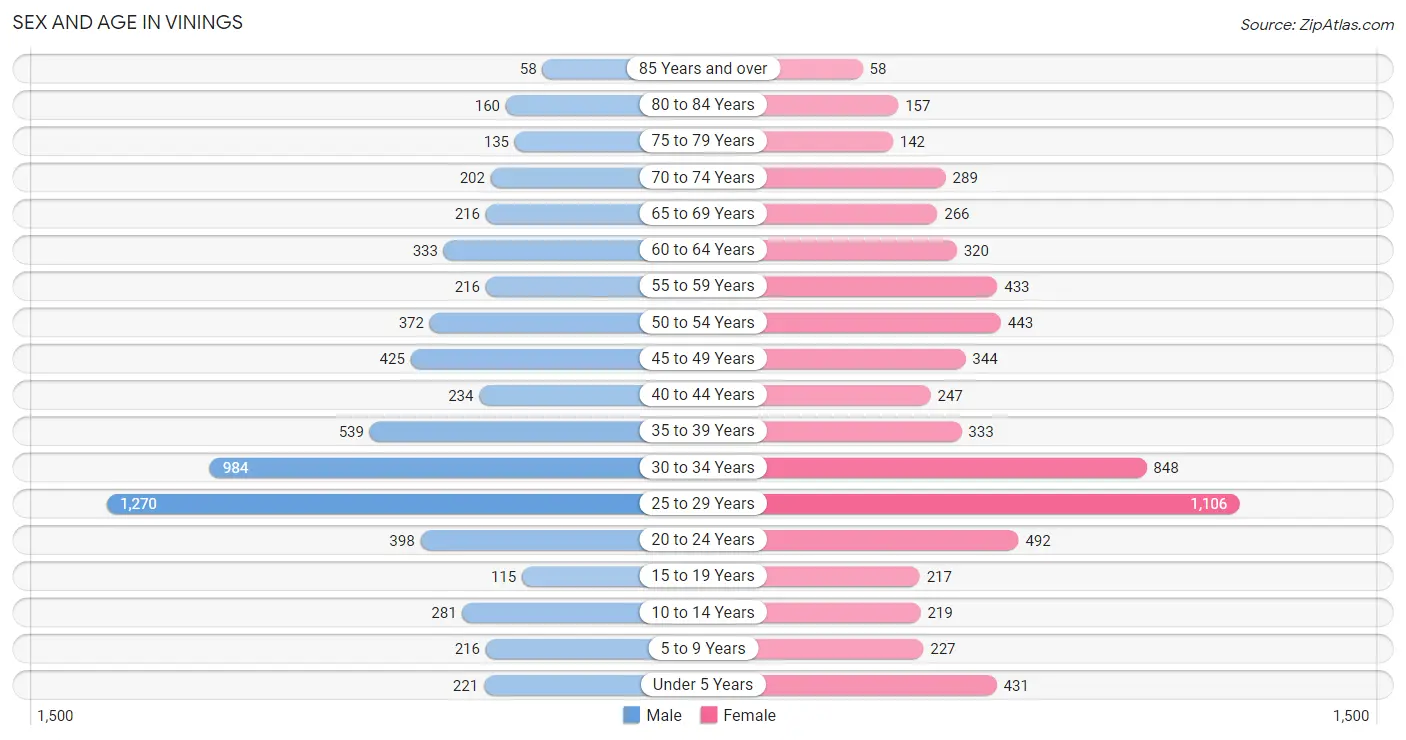
| Age Bracket | Male | Female |
| Under 5 Years | 221 (3.5%) | 431 (6.6%) |
| 5 to 9 Years | 216 (3.4%) | 227 (3.5%) |
| 10 to 14 Years | 281 (4.4%) | 219 (3.3%) |
| 15 to 19 Years | 115 (1.8%) | 217 (3.3%) |
| 20 to 24 Years | 398 (6.2%) | 492 (7.5%) |
| 25 to 29 Years | 1,270 (19.9%) | 1,106 (16.8%) |
| 30 to 34 Years | 984 (15.4%) | 848 (12.9%) |
| 35 to 39 Years | 539 (8.5%) | 333 (5.1%) |
| 40 to 44 Years | 234 (3.7%) | 247 (3.8%) |
| 45 to 49 Years | 425 (6.7%) | 344 (5.2%) |
| 50 to 54 Years | 372 (5.8%) | 443 (6.7%) |
| 55 to 59 Years | 216 (3.4%) | 433 (6.6%) |
| 60 to 64 Years | 333 (5.2%) | 320 (4.9%) |
| 65 to 69 Years | 216 (3.4%) | 266 (4.1%) |
| 70 to 74 Years | 202 (3.2%) | 289 (4.4%) |
| 75 to 79 Years | 135 (2.1%) | 142 (2.2%) |
| 80 to 84 Years | 160 (2.5%) | 157 (2.4%) |
| 85 Years and over | 58 (0.9%) | 58 (0.9%) |
| Total | 6,375 (100.0%) | 6,572 (100.0%) |
Families and Households in Vinings
Median Family Size in Vinings
The median family size in Vinings is 2.68 persons per family, with single female/mother families (642 | 25.0%) accounting for the largest median family size of 2.83 persons per family. On the other hand, single male/father families (153 | 6.0%) represent the smallest median family size with 2.27 persons per family.
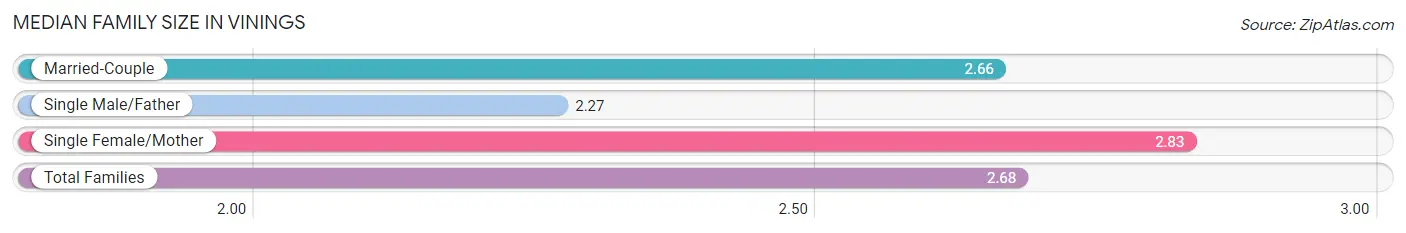
| Family Type | # Families | Family Size |
| Married-Couple | 1,770 (69.0%) | 2.66 |
| Single Male/Father | 153 (6.0%) | 2.27 |
| Single Female/Mother | 642 (25.0%) | 2.83 |
| Total Families | 2,565 (100.0%) | 2.68 |
Median Household Size in Vinings
The median household size in Vinings is 1.79 persons per household, with single female/mother households (642 | 8.9%) accounting for the largest median household size of 2.99 persons per household. non-family households (4,675 | 64.6%) represent the smallest median household size with 1.27 persons per household.
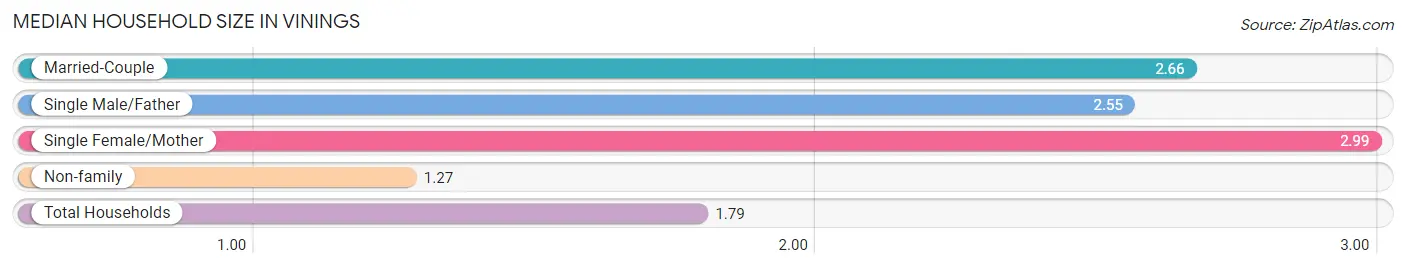
| Household Type | # Households | Household Size |
| Married-Couple | 1,770 (24.4%) | 2.66 |
| Single Male/Father | 153 (2.1%) | 2.55 |
| Single Female/Mother | 642 (8.9%) | 2.99 |
| Non-family | 4,675 (64.6%) | 1.27 |
| Total Households | 7,240 (100.0%) | 1.79 |
Household Size by Marriage Status in Vinings
Out of a total of 7,240 households in Vinings, 2,565 (35.4%) are family households, while 4,675 (64.6%) are nonfamily households. The most numerous type of family households are 2-person households, comprising 1,692, and the most common type of nonfamily households are 1-person households, comprising 3,609.
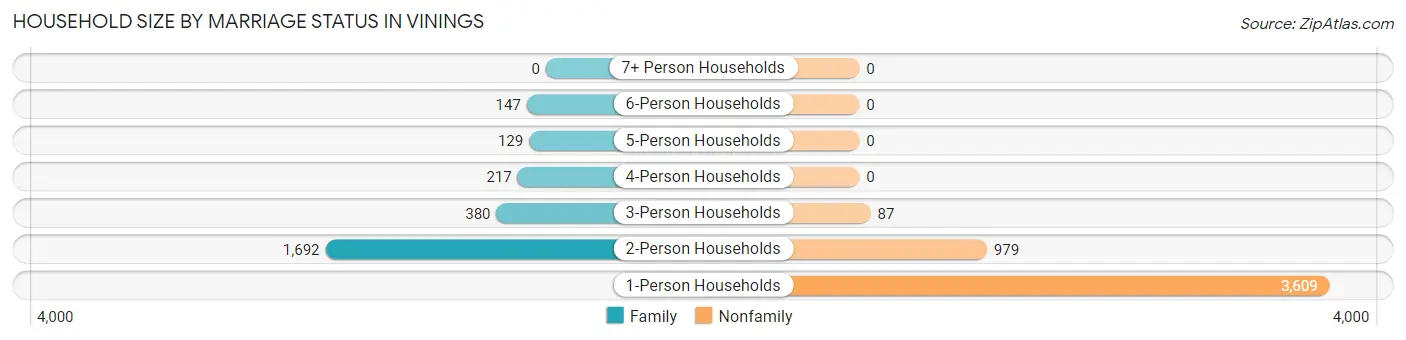
| Household Size | Family Households | Nonfamily Households |
| 1-Person Households | - | 3,609 (49.8%) |
| 2-Person Households | 1,692 (23.4%) | 979 (13.5%) |
| 3-Person Households | 380 (5.2%) | 87 (1.2%) |
| 4-Person Households | 217 (3.0%) | 0 (0.0%) |
| 5-Person Households | 129 (1.8%) | 0 (0.0%) |
| 6-Person Households | 147 (2.0%) | 0 (0.0%) |
| 7+ Person Households | 0 (0.0%) | 0 (0.0%) |
| Total | 2,565 (35.4%) | 4,675 (64.6%) |
Female Fertility in Vinings
Fertility by Age in Vinings
Average fertility rate in Vinings is 2.0 births per 1,000 women. Women in the age bracket of 35 to 50 years have the highest fertility rate with 6.0 births per 1,000 women. Women in the age bracket of 35 to 50 years acount for 100.0% of all women with births.
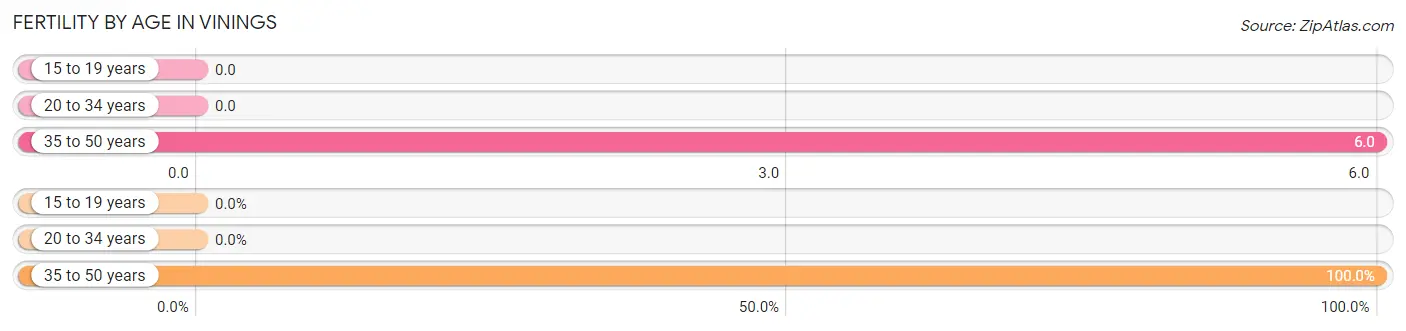
| Age Bracket | Women with Births | Births / 1,000 Women |
| 15 to 19 years | 0 (0.0%) | 0.0 |
| 20 to 34 years | 0 (0.0%) | 0.0 |
| 35 to 50 years | 6 (100.0%) | 6.0 |
| Total | 6 (100.0%) | 2.0 |
Fertility by Age by Marriage Status in Vinings
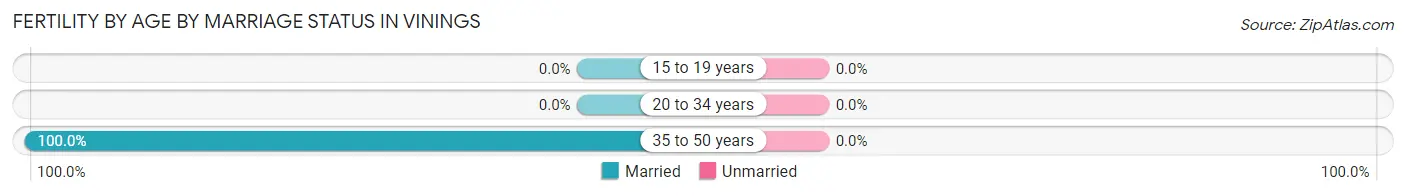
| Age Bracket | Married | Unmarried |
| 15 to 19 years | 0 (0.0%) | 0 (0.0%) |
| 20 to 34 years | 0 (0.0%) | 0 (0.0%) |
| 35 to 50 years | 6 (100.0%) | 0 (0.0%) |
| Total | 6 (100.0%) | 0 (0.0%) |
Fertility by Education in Vinings
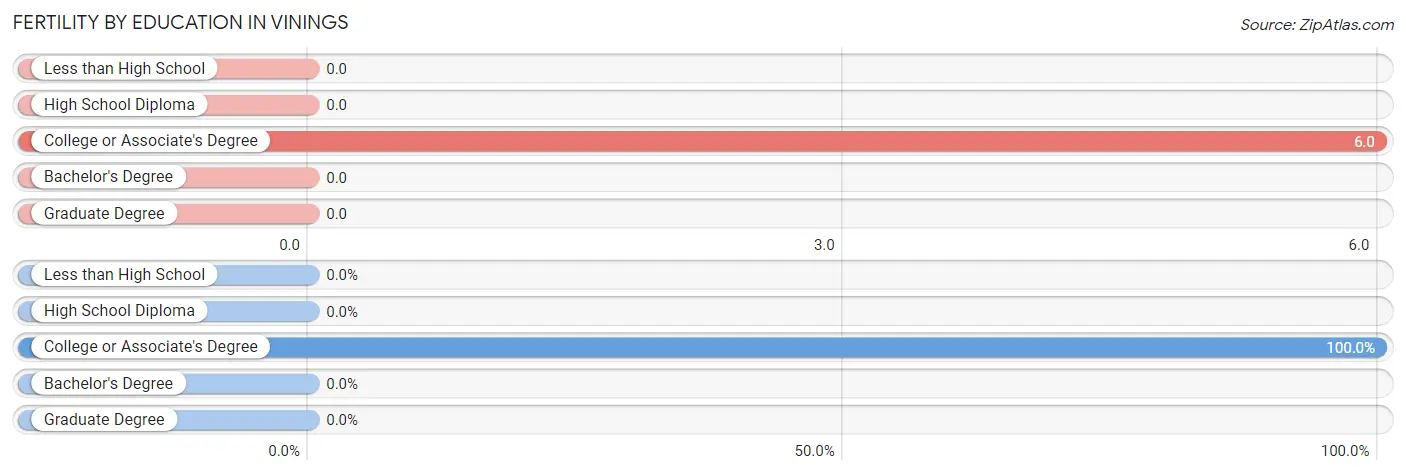
| Educational Attainment | Women with Births | Births / 1,000 Women |
| Less than High School | 0 (0.0%) | 0.0 |
| High School Diploma | 0 (0.0%) | 0.0 |
| College or Associate's Degree | 6 (100.0%) | 6.0 |
| Bachelor's Degree | 0 (0.0%) | 0.0 |
| Graduate Degree | 0 (0.0%) | 0.0 |
| Total | 6 (100.0%) | 2.0 |
Fertility by Education by Marriage Status in Vinings
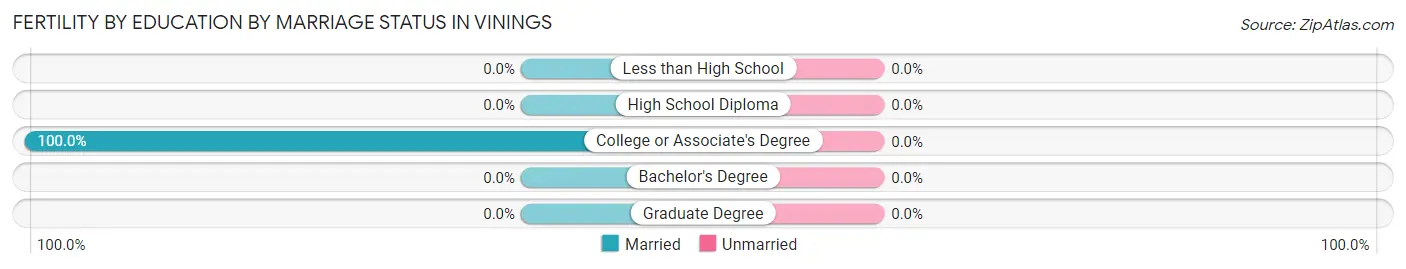
| Educational Attainment | Married | Unmarried |
| Less than High School | 0 (0.0%) | 0 (0.0%) |
| High School Diploma | 0 (0.0%) | 0 (0.0%) |
| College or Associate's Degree | 6 (100.0%) | 0 (0.0%) |
| Bachelor's Degree | 0 (0.0%) | 0 (0.0%) |
| Graduate Degree | 0 (0.0%) | 0 (0.0%) |
| Total | 6 (100.0%) | 0 (0.0%) |
Employment Characteristics in Vinings
Employment by Class of Employer in Vinings
Among the 8,653 employed individuals in Vinings, private company employees (6,584 | 76.1%), not-for-profit organizations (718 | 8.3%), and self-employed (incorporated) (414 | 4.8%) make up the most common classes of employment.
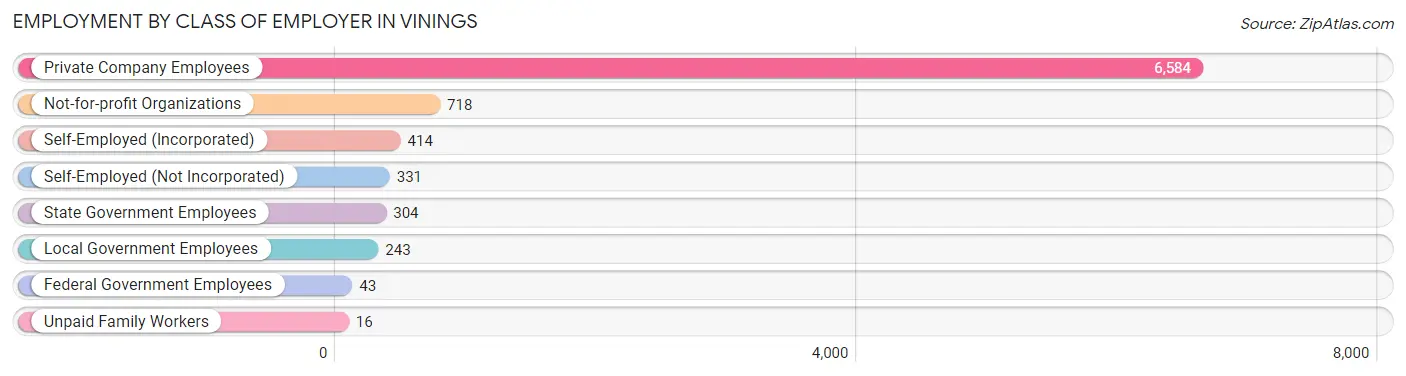
| Employer Class | # Employees | % Employees |
| Private Company Employees | 6,584 | 76.1% |
| Self-Employed (Incorporated) | 414 | 4.8% |
| Self-Employed (Not Incorporated) | 331 | 3.8% |
| Not-for-profit Organizations | 718 | 8.3% |
| Local Government Employees | 243 | 2.8% |
| State Government Employees | 304 | 3.5% |
| Federal Government Employees | 43 | 0.5% |
| Unpaid Family Workers | 16 | 0.2% |
| Total | 8,653 | 100.0% |
Employment Status by Age in Vinings
According to the labor force statistics for Vinings, out of the total population over 16 years of age (11,254), 80.9% or 9,104 individuals are in the labor force, with 2.1% or 191 of them unemployed. The age group with the highest labor force participation rate is 25 to 29 years, with 98.4% or 2,338 individuals in the labor force. Within the labor force, the 60 to 64 years age range has the highest percentage of unemployed individuals, with 6.2% or 30 of them being unemployed.
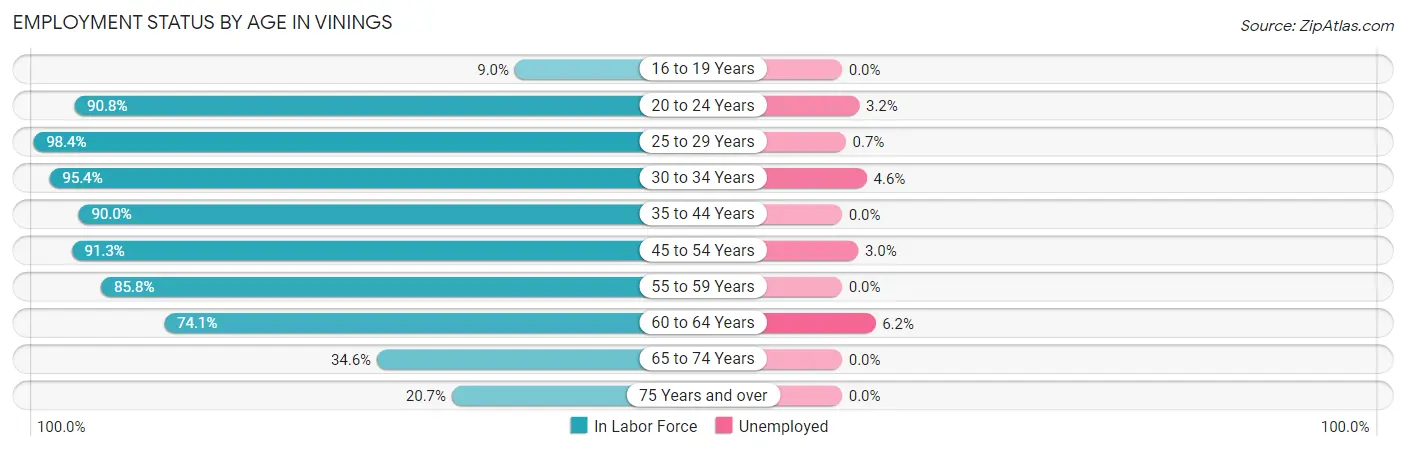
| Age Bracket | In Labor Force | Unemployed |
| 16 to 19 Years | 21 (9.0%) | 0 (0.0%) |
| 20 to 24 Years | 808 (90.8%) | 26 (3.2%) |
| 25 to 29 Years | 2,338 (98.4%) | 16 (0.7%) |
| 30 to 34 Years | 1,748 (95.4%) | 80 (4.6%) |
| 35 to 44 Years | 1,218 (90.0%) | 0 (0.0%) |
| 45 to 54 Years | 1,446 (91.3%) | 43 (3.0%) |
| 55 to 59 Years | 557 (85.8%) | 0 (0.0%) |
| 60 to 64 Years | 484 (74.1%) | 30 (6.2%) |
| 65 to 74 Years | 337 (34.6%) | 0 (0.0%) |
| 75 Years and over | 147 (20.7%) | 0 (0.0%) |
| Total | 9,104 (80.9%) | 191 (2.1%) |
Employment Status by Educational Attainment in Vinings
According to labor force statistics for Vinings, 92.2% of individuals (7,788) out of the total population between 25 and 64 years of age (8,447) are in the labor force, with 2.2% or 171 of them being unemployed. The group with the highest labor force participation rate are those with the educational attainment of high school diploma, with 94.8% or 801 individuals in the labor force. Within the labor force, individuals with bachelor's degree or higher education have the highest percentage of unemployment, with 2.8% or 141 of them being unemployed.
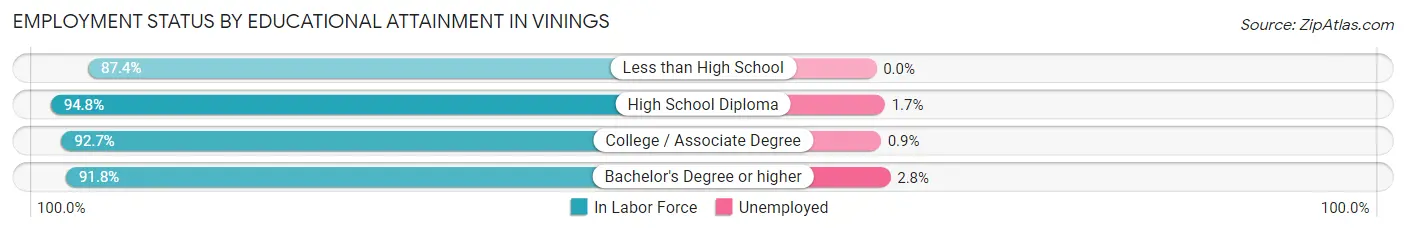
| Educational Attainment | In Labor Force | Unemployed |
| Less than High School | 76 (87.4%) | 0 (0.0%) |
| High School Diploma | 801 (94.8%) | 14 (1.7%) |
| College / Associate Degree | 1,864 (92.7%) | 18 (0.9%) |
| Bachelor's Degree or higher | 5,053 (91.8%) | 154 (2.8%) |
| Total | 7,788 (92.2%) | 186 (2.2%) |
Employment Occupations by Sex in Vinings
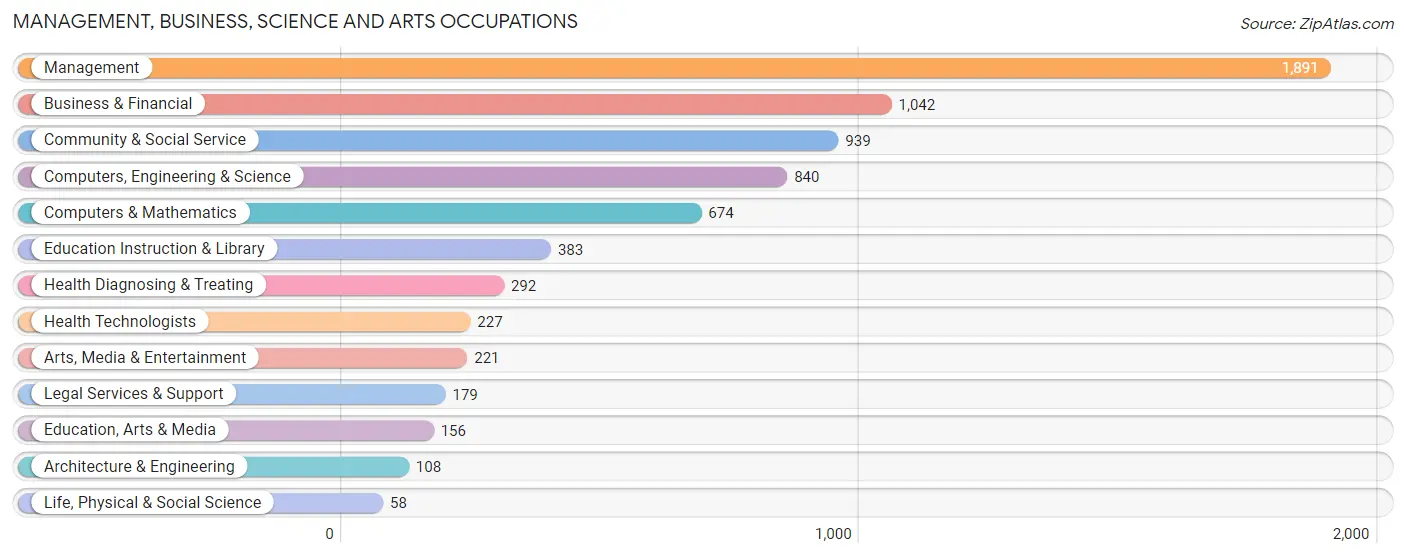
Management, Business, Science and Arts Occupations
The most common Management, Business, Science and Arts occupations in Vinings are Management (1,891 | 21.3%), Business & Financial (1,042 | 11.7%), Community & Social Service (939 | 10.6%), Computers, Engineering & Science (840 | 9.5%), and Computers & Mathematics (674 | 7.6%).
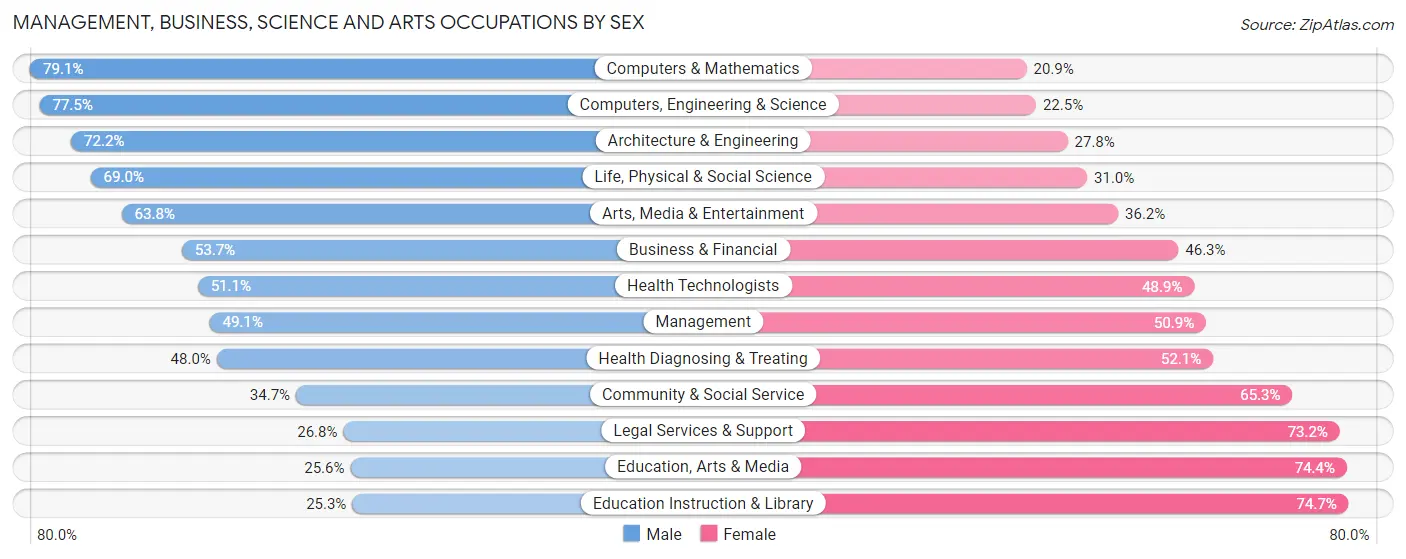
Management, Business, Science and Arts Occupations by Sex
Within the Management, Business, Science and Arts occupations in Vinings, the most male-oriented occupations are Computers & Mathematics (79.1%), Computers, Engineering & Science (77.5%), and Architecture & Engineering (72.2%), while the most female-oriented occupations are Education Instruction & Library (74.7%), Education, Arts & Media (74.4%), and Legal Services & Support (73.2%).
| Occupation | Male | Female |
| Management | 929 (49.1%) | 962 (50.9%) |
| Business & Financial | 560 (53.7%) | 482 (46.3%) |
| Computers, Engineering & Science | 651 (77.5%) | 189 (22.5%) |
| Computers & Mathematics | 533 (79.1%) | 141 (20.9%) |
| Architecture & Engineering | 78 (72.2%) | 30 (27.8%) |
| Life, Physical & Social Science | 40 (69.0%) | 18 (31.0%) |
| Community & Social Service | 326 (34.7%) | 613 (65.3%) |
| Education, Arts & Media | 40 (25.6%) | 116 (74.4%) |
| Legal Services & Support | 48 (26.8%) | 131 (73.2%) |
| Education Instruction & Library | 97 (25.3%) | 286 (74.7%) |
| Arts, Media & Entertainment | 141 (63.8%) | 80 (36.2%) |
| Health Diagnosing & Treating | 140 (47.9%) | 152 (52.0%) |
| Health Technologists | 116 (51.1%) | 111 (48.9%) |
| Total (Category) | 2,606 (52.1%) | 2,398 (47.9%) |
| Total (Overall) | 4,784 (53.8%) | 4,106 (46.2%) |
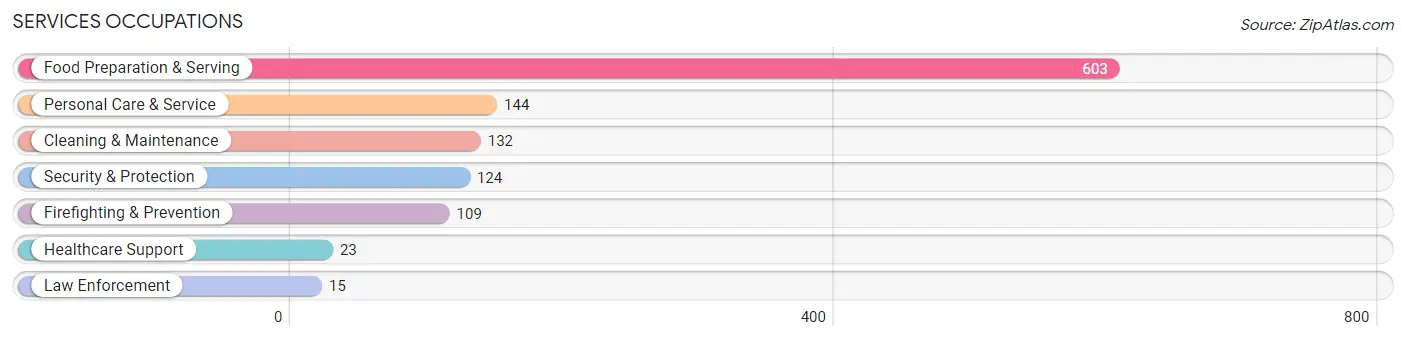
Services Occupations
The most common Services occupations in Vinings are Food Preparation & Serving (603 | 6.8%), Personal Care & Service (144 | 1.6%), Cleaning & Maintenance (132 | 1.5%), Security & Protection (124 | 1.4%), and Firefighting & Prevention (109 | 1.2%).
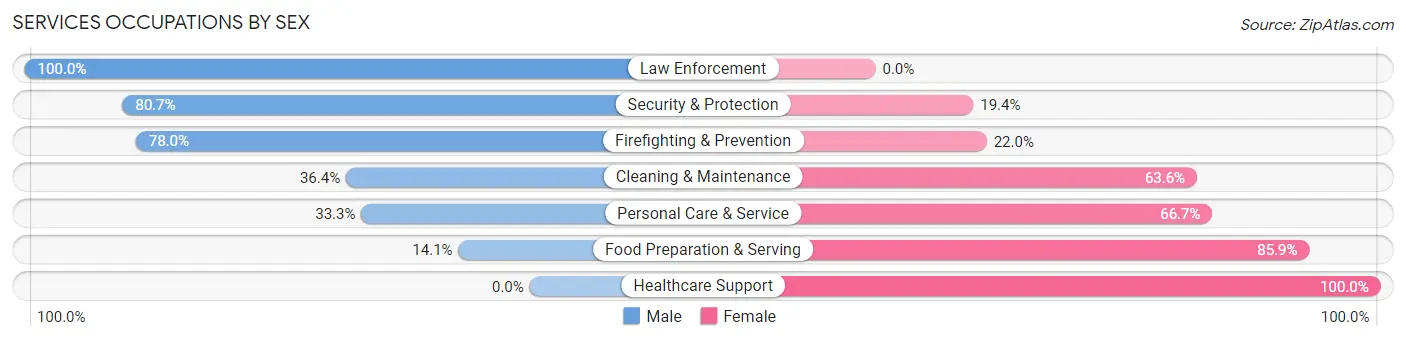
Services Occupations by Sex
Within the Services occupations in Vinings, the most male-oriented occupations are Law Enforcement (100.0%), Security & Protection (80.6%), and Firefighting & Prevention (78.0%), while the most female-oriented occupations are Healthcare Support (100.0%), Food Preparation & Serving (85.9%), and Personal Care & Service (66.7%).
| Occupation | Male | Female |
| Healthcare Support | 0 (0.0%) | 23 (100.0%) |
| Security & Protection | 100 (80.6%) | 24 (19.4%) |
| Firefighting & Prevention | 85 (78.0%) | 24 (22.0%) |
| Law Enforcement | 15 (100.0%) | 0 (0.0%) |
| Food Preparation & Serving | 85 (14.1%) | 518 (85.9%) |
| Cleaning & Maintenance | 48 (36.4%) | 84 (63.6%) |
| Personal Care & Service | 48 (33.3%) | 96 (66.7%) |
| Total (Category) | 281 (27.4%) | 745 (72.6%) |
| Total (Overall) | 4,784 (53.8%) | 4,106 (46.2%) |
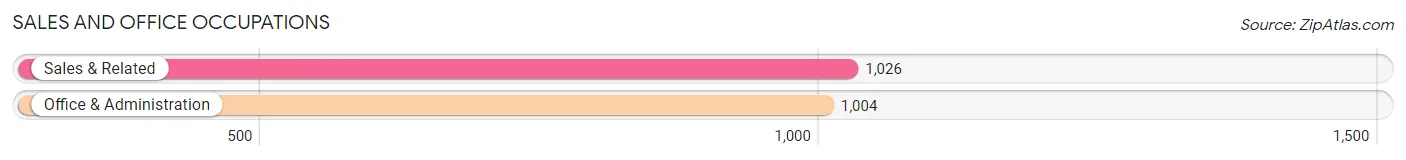
Sales and Office Occupations
The most common Sales and Office occupations in Vinings are Sales & Related (1,026 | 11.5%), and Office & Administration (1,004 | 11.3%).
Sales and Office Occupations by Sex
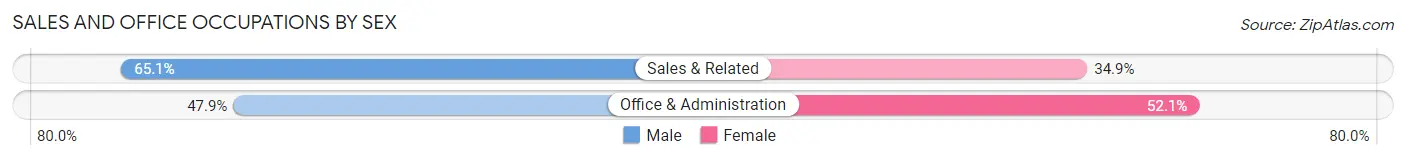
| Occupation | Male | Female |
| Sales & Related | 668 (65.1%) | 358 (34.9%) |
| Office & Administration | 481 (47.9%) | 523 (52.1%) |
| Total (Category) | 1,149 (56.6%) | 881 (43.4%) |
| Total (Overall) | 4,784 (53.8%) | 4,106 (46.2%) |
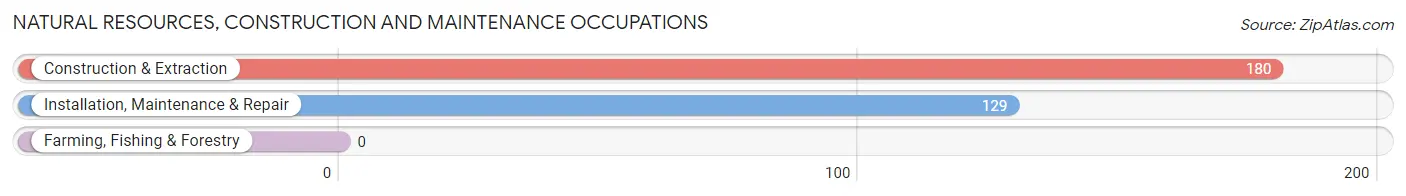
Natural Resources, Construction and Maintenance Occupations
The most common Natural Resources, Construction and Maintenance occupations in Vinings are Construction & Extraction (180 | 2.0%), and Installation, Maintenance & Repair (129 | 1.5%).
Natural Resources, Construction and Maintenance Occupations by Sex
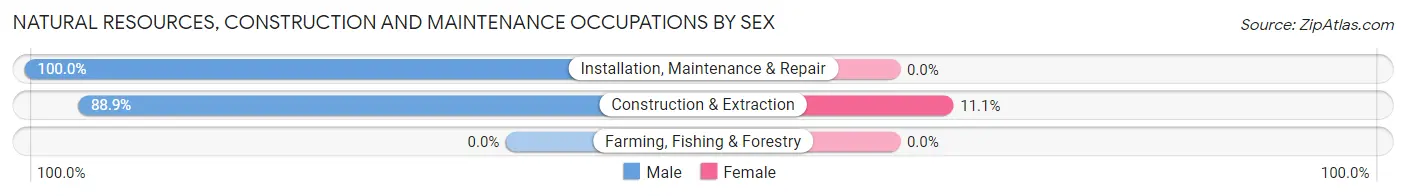
| Occupation | Male | Female |
| Farming, Fishing & Forestry | 0 (0.0%) | 0 (0.0%) |
| Construction & Extraction | 160 (88.9%) | 20 (11.1%) |
| Installation, Maintenance & Repair | 129 (100.0%) | 0 (0.0%) |
| Total (Category) | 289 (93.5%) | 20 (6.5%) |
| Total (Overall) | 4,784 (53.8%) | 4,106 (46.2%) |
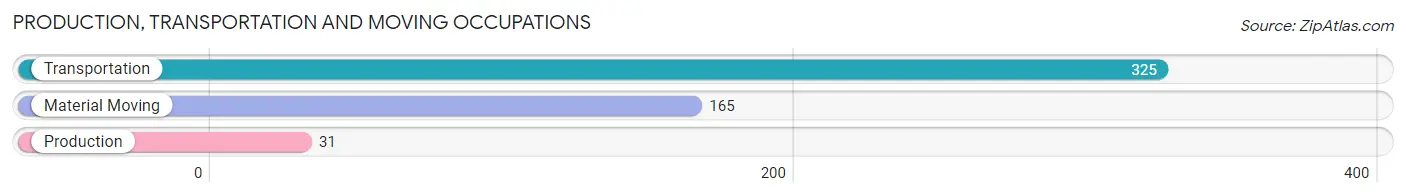
Production, Transportation and Moving Occupations
The most common Production, Transportation and Moving occupations in Vinings are Transportation (325 | 3.7%), Material Moving (165 | 1.9%), and Production (31 | 0.4%).
Production, Transportation and Moving Occupations by Sex
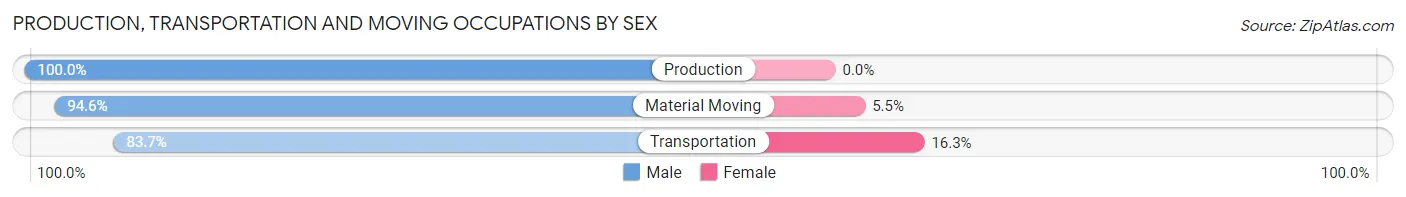
| Occupation | Male | Female |
| Production | 31 (100.0%) | 0 (0.0%) |
| Transportation | 272 (83.7%) | 53 (16.3%) |
| Material Moving | 156 (94.6%) | 9 (5.4%) |
| Total (Category) | 459 (88.1%) | 62 (11.9%) |
| Total (Overall) | 4,784 (53.8%) | 4,106 (46.2%) |
Employment Industries by Sex in Vinings
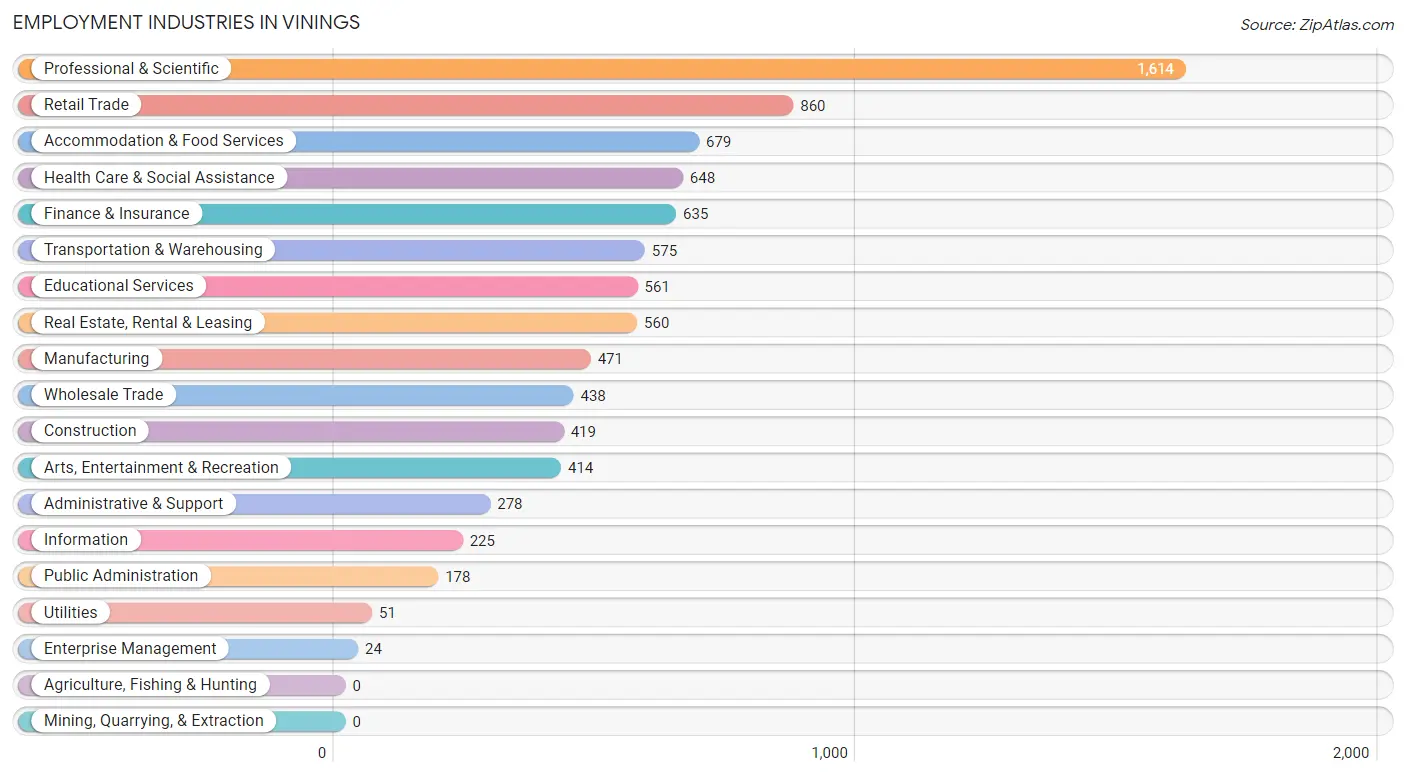
Employment Industries in Vinings
The major employment industries in Vinings include Professional & Scientific (1,614 | 18.2%), Retail Trade (860 | 9.7%), Accommodation & Food Services (679 | 7.6%), Health Care & Social Assistance (648 | 7.3%), and Finance & Insurance (635 | 7.1%).
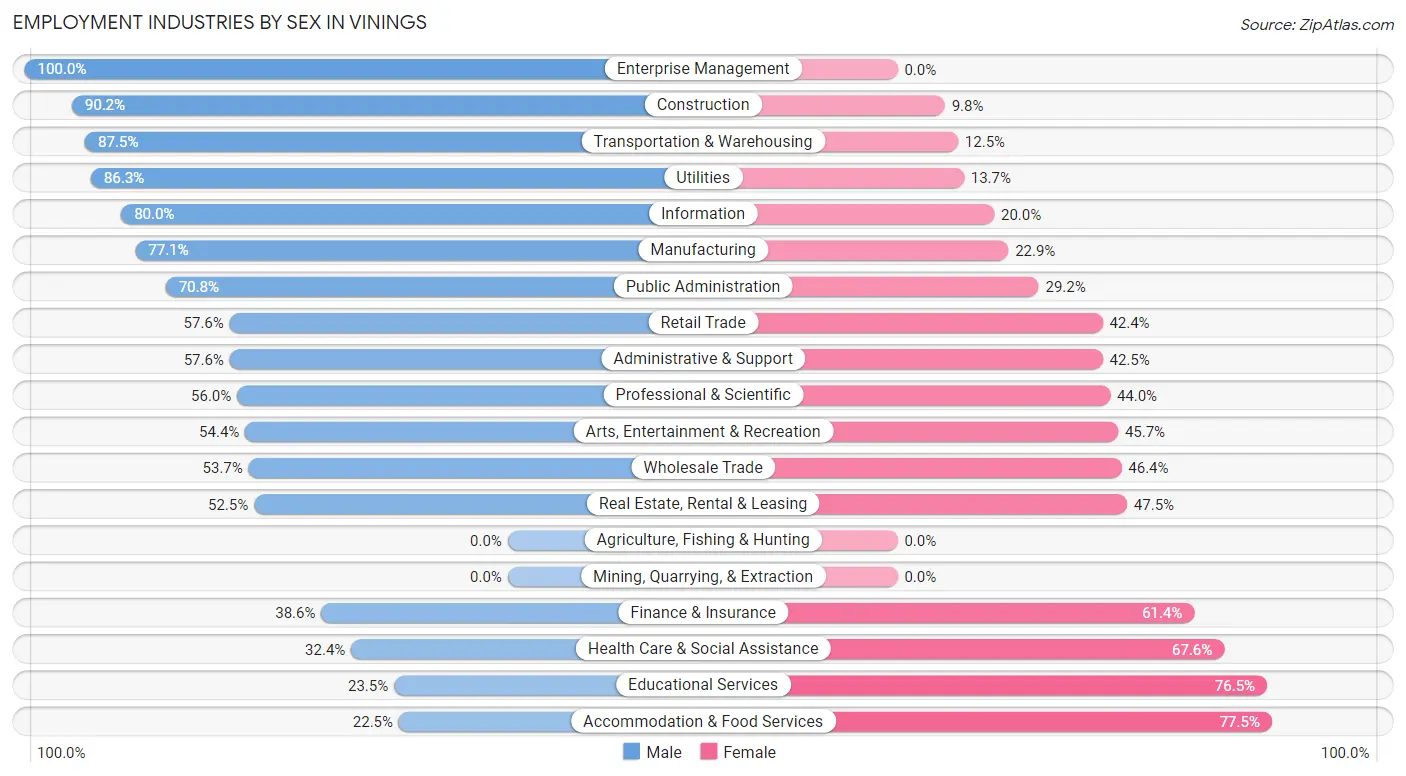
Employment Industries by Sex in Vinings
The Vinings industries that see more men than women are Enterprise Management (100.0%), Construction (90.2%), and Transportation & Warehousing (87.5%), whereas the industries that tend to have a higher number of women are Accommodation & Food Services (77.5%), Educational Services (76.5%), and Health Care & Social Assistance (67.6%).
| Industry | Male | Female |
| Agriculture, Fishing & Hunting | 0 (0.0%) | 0 (0.0%) |
| Mining, Quarrying, & Extraction | 0 (0.0%) | 0 (0.0%) |
| Construction | 378 (90.2%) | 41 (9.8%) |
| Manufacturing | 363 (77.1%) | 108 (22.9%) |
| Wholesale Trade | 235 (53.6%) | 203 (46.4%) |
| Retail Trade | 495 (57.6%) | 365 (42.4%) |
| Transportation & Warehousing | 503 (87.5%) | 72 (12.5%) |
| Utilities | 44 (86.3%) | 7 (13.7%) |
| Information | 180 (80.0%) | 45 (20.0%) |
| Finance & Insurance | 245 (38.6%) | 390 (61.4%) |
| Real Estate, Rental & Leasing | 294 (52.5%) | 266 (47.5%) |
| Professional & Scientific | 904 (56.0%) | 710 (44.0%) |
| Enterprise Management | 24 (100.0%) | 0 (0.0%) |
| Administrative & Support | 160 (57.6%) | 118 (42.4%) |
| Educational Services | 132 (23.5%) | 429 (76.5%) |
| Health Care & Social Assistance | 210 (32.4%) | 438 (67.6%) |
| Arts, Entertainment & Recreation | 225 (54.3%) | 189 (45.7%) |
| Accommodation & Food Services | 153 (22.5%) | 526 (77.5%) |
| Public Administration | 126 (70.8%) | 52 (29.2%) |
| Total | 4,784 (53.8%) | 4,106 (46.2%) |
Education in Vinings
School Enrollment in Vinings
The most common levels of schooling among the 2,160 students in Vinings are college / undergraduate (670 | 31.0%), elementary school (361 | 16.7%), and middle school (294 | 13.6%).
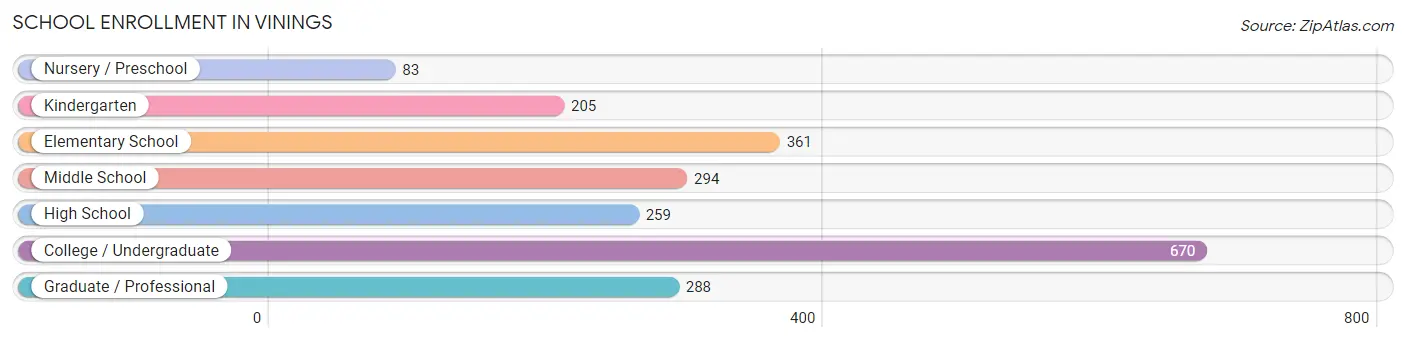
| School Level | # Students | % Students |
| Nursery / Preschool | 83 | 3.8% |
| Kindergarten | 205 | 9.5% |
| Elementary School | 361 | 16.7% |
| Middle School | 294 | 13.6% |
| High School | 259 | 12.0% |
| College / Undergraduate | 670 | 31.0% |
| Graduate / Professional | 288 | 13.3% |
| Total | 2,160 | 100.0% |
School Enrollment by Age by Funding Source in Vinings
Out of a total of 2,160 students who are enrolled in schools in Vinings, 484 (22.4%) attend a private institution, while the remaining 1,676 (77.6%) are enrolled in public schools. The age group of 10 to 14 year olds has the highest likelihood of being enrolled in private schools, with 218 (43.6% in the age bracket) enrolled. Conversely, the age group of 3 to 4 year olds has the lowest likelihood of being enrolled in a private school, with 83 (100.0% in the age bracket) attending a public institution.
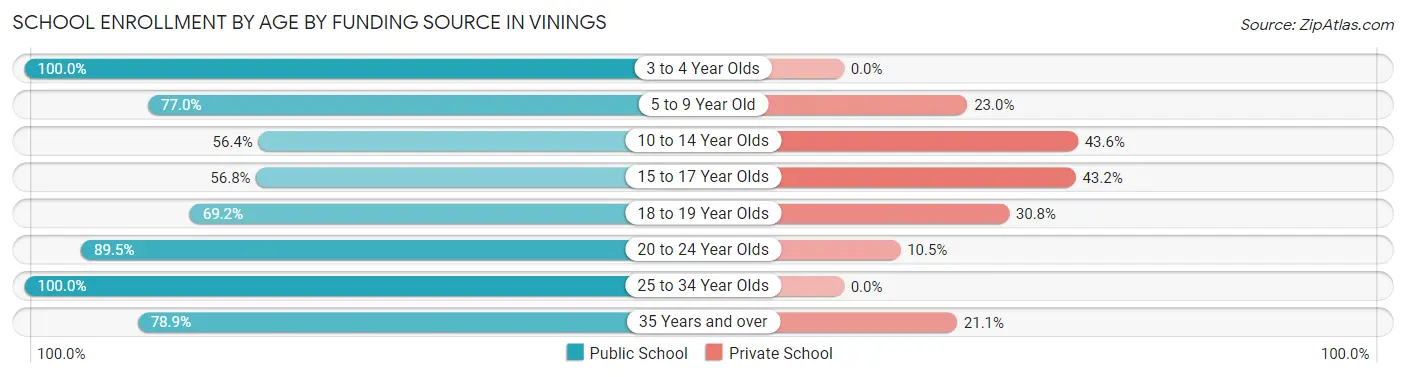
| Age Bracket | Public School | Private School |
| 3 to 4 Year Olds | 83 (100.0%) | 0 (0.0%) |
| 5 to 9 Year Old | 341 (77.0%) | 102 (23.0%) |
| 10 to 14 Year Olds | 282 (56.4%) | 218 (43.6%) |
| 15 to 17 Year Olds | 100 (56.8%) | 76 (43.2%) |
| 18 to 19 Year Olds | 45 (69.2%) | 20 (30.8%) |
| 20 to 24 Year Olds | 170 (89.5%) | 20 (10.5%) |
| 25 to 34 Year Olds | 480 (100.0%) | 0 (0.0%) |
| 35 Years and over | 176 (78.9%) | 47 (21.1%) |
| Total | 1,676 (77.6%) | 484 (22.4%) |
Educational Attainment by Field of Study in Vinings
Business (2,199 | 29.9%), social sciences (681 | 9.3%), arts & humanities (521 | 7.1%), science & technology (513 | 7.0%), and education (512 | 7.0%) are the most common fields of study among 7,344 individuals in Vinings who have obtained a bachelor's degree or higher.
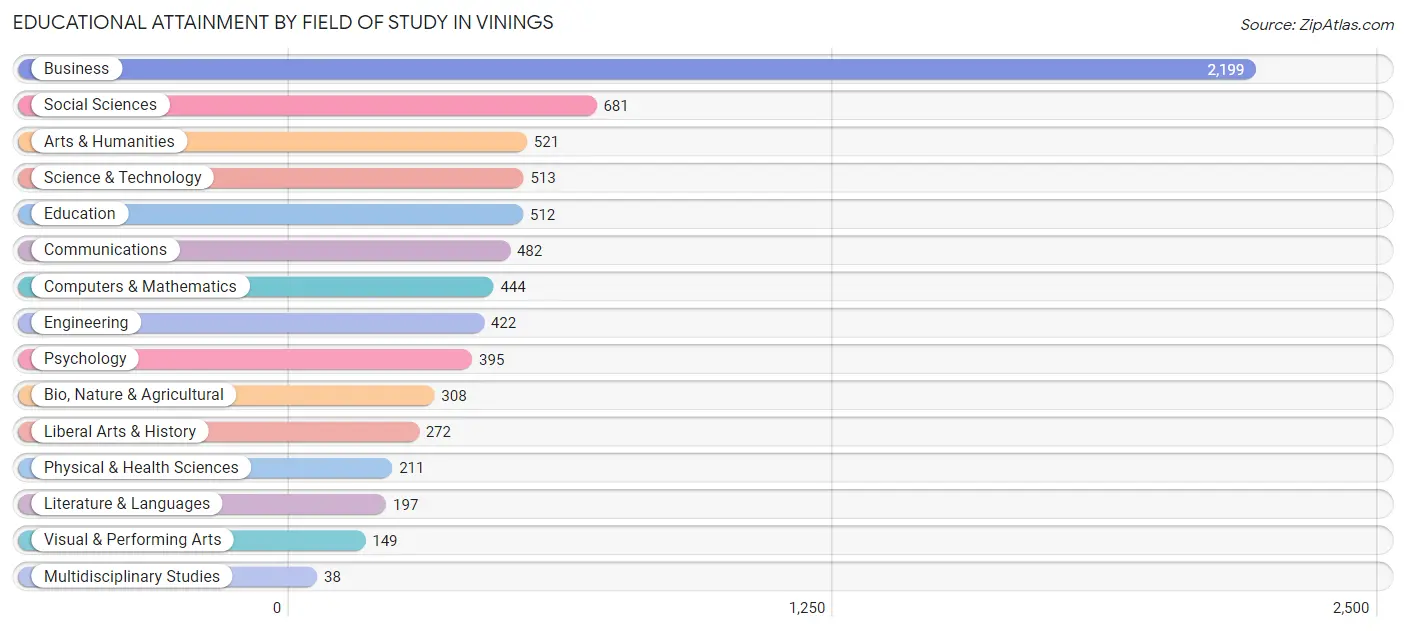
| Field of Study | # Graduates | % Graduates |
| Computers & Mathematics | 444 | 6.0% |
| Bio, Nature & Agricultural | 308 | 4.2% |
| Physical & Health Sciences | 211 | 2.9% |
| Psychology | 395 | 5.4% |
| Social Sciences | 681 | 9.3% |
| Engineering | 422 | 5.8% |
| Multidisciplinary Studies | 38 | 0.5% |
| Science & Technology | 513 | 7.0% |
| Business | 2,199 | 29.9% |
| Education | 512 | 7.0% |
| Literature & Languages | 197 | 2.7% |
| Liberal Arts & History | 272 | 3.7% |
| Visual & Performing Arts | 149 | 2.0% |
| Communications | 482 | 6.6% |
| Arts & Humanities | 521 | 7.1% |
| Total | 7,344 | 100.0% |
Transportation & Commute in Vinings
Vehicle Availability by Sex in Vinings
The most prevalent vehicle ownership categories in Vinings are males with 2 vehicles (2,147, accounting for 47.2%) and females with 2 vehicles (1,827, making up 52.3%).
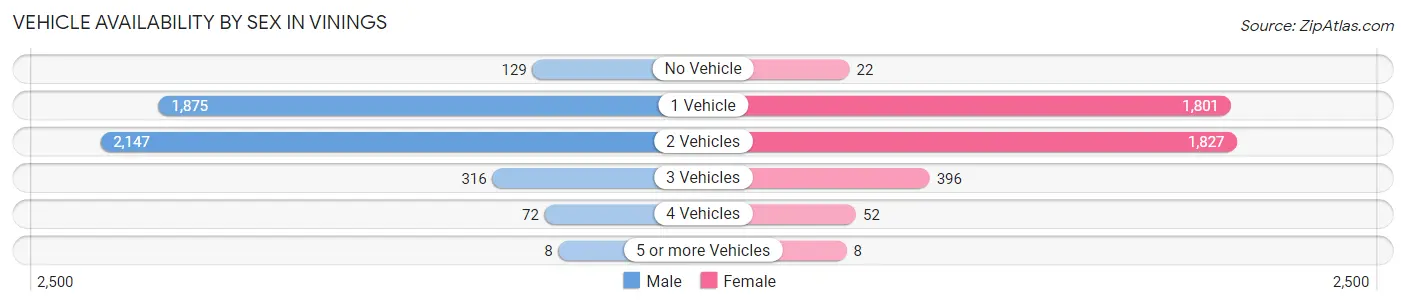
| Vehicles Available | Male | Female |
| No Vehicle | 129 (2.8%) | 22 (0.5%) |
| 1 Vehicle | 1,875 (41.2%) | 1,801 (43.9%) |
| 2 Vehicles | 2,147 (47.2%) | 1,827 (44.5%) |
| 3 Vehicles | 316 (7.0%) | 396 (9.6%) |
| 4 Vehicles | 72 (1.6%) | 52 (1.3%) |
| 5 or more Vehicles | 8 (0.2%) | 8 (0.2%) |
| Total | 4,547 (100.0%) | 4,106 (100.0%) |
Commute Time in Vinings
The most frequently occuring commute durations in Vinings are 30 to 34 minutes (1,087 commuters, 17.1%), 20 to 24 minutes (992 commuters, 15.6%), and 15 to 19 minutes (979 commuters, 15.4%).
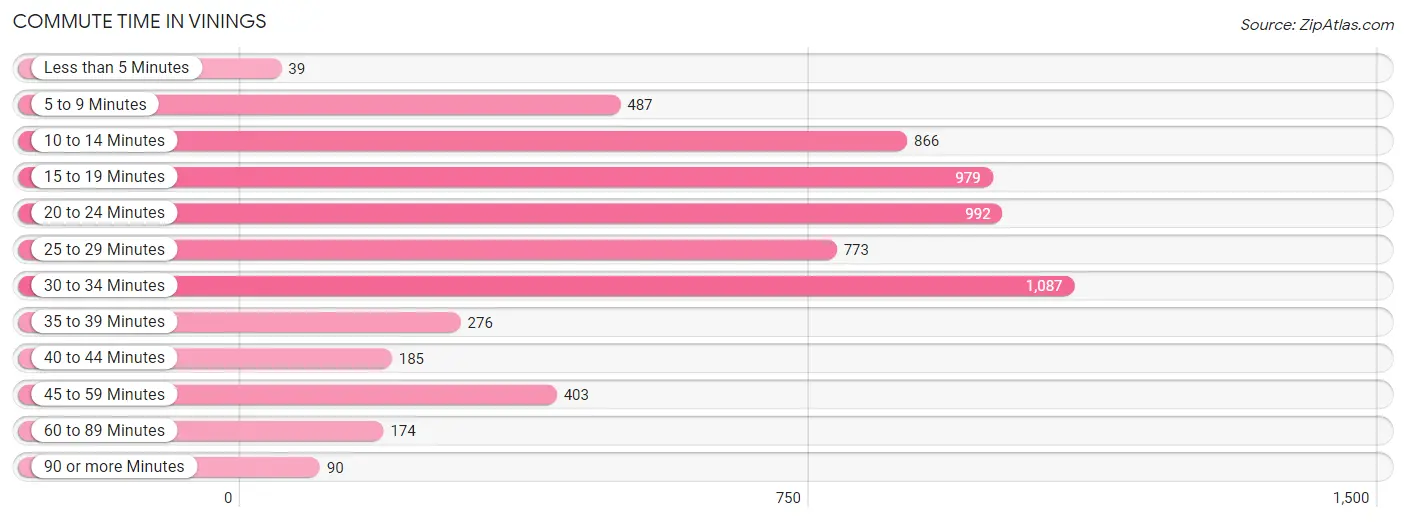
| Commute Time | # Commuters | % Commuters |
| Less than 5 Minutes | 39 | 0.6% |
| 5 to 9 Minutes | 487 | 7.7% |
| 10 to 14 Minutes | 866 | 13.6% |
| 15 to 19 Minutes | 979 | 15.4% |
| 20 to 24 Minutes | 992 | 15.6% |
| 25 to 29 Minutes | 773 | 12.2% |
| 30 to 34 Minutes | 1,087 | 17.1% |
| 35 to 39 Minutes | 276 | 4.3% |
| 40 to 44 Minutes | 185 | 2.9% |
| 45 to 59 Minutes | 403 | 6.4% |
| 60 to 89 Minutes | 174 | 2.7% |
| 90 or more Minutes | 90 | 1.4% |
Commute Time by Sex in Vinings
The most common commute times in Vinings are 30 to 34 minutes (751 commuters, 21.7%) for males and 10 to 14 minutes (493 commuters, 17.1%) for females.
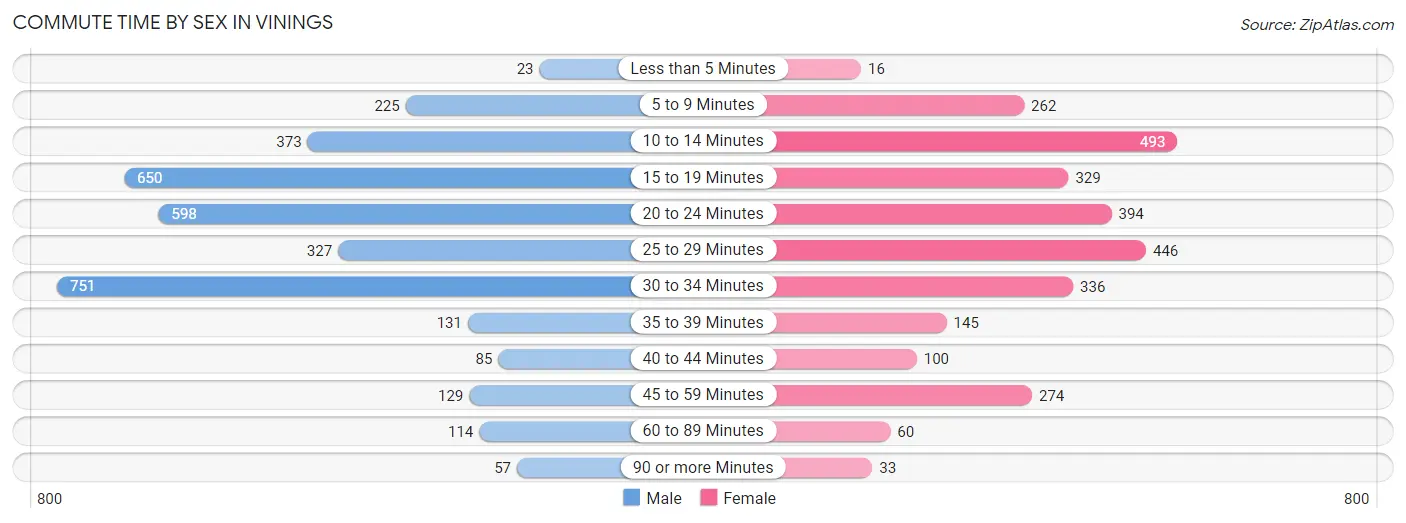
| Commute Time | Male | Female |
| Less than 5 Minutes | 23 (0.7%) | 16 (0.5%) |
| 5 to 9 Minutes | 225 (6.5%) | 262 (9.1%) |
| 10 to 14 Minutes | 373 (10.8%) | 493 (17.1%) |
| 15 to 19 Minutes | 650 (18.8%) | 329 (11.4%) |
| 20 to 24 Minutes | 598 (17.3%) | 394 (13.6%) |
| 25 to 29 Minutes | 327 (9.4%) | 446 (15.4%) |
| 30 to 34 Minutes | 751 (21.7%) | 336 (11.6%) |
| 35 to 39 Minutes | 131 (3.8%) | 145 (5.0%) |
| 40 to 44 Minutes | 85 (2.5%) | 100 (3.5%) |
| 45 to 59 Minutes | 129 (3.7%) | 274 (9.5%) |
| 60 to 89 Minutes | 114 (3.3%) | 60 (2.1%) |
| 90 or more Minutes | 57 (1.7%) | 33 (1.1%) |
Time of Departure to Work by Sex in Vinings
The most frequent times of departure to work in Vinings are 8:30 AM to 8:59 AM (721, 20.8%) for males and 7:00 AM to 7:29 AM (535, 18.5%) for females.
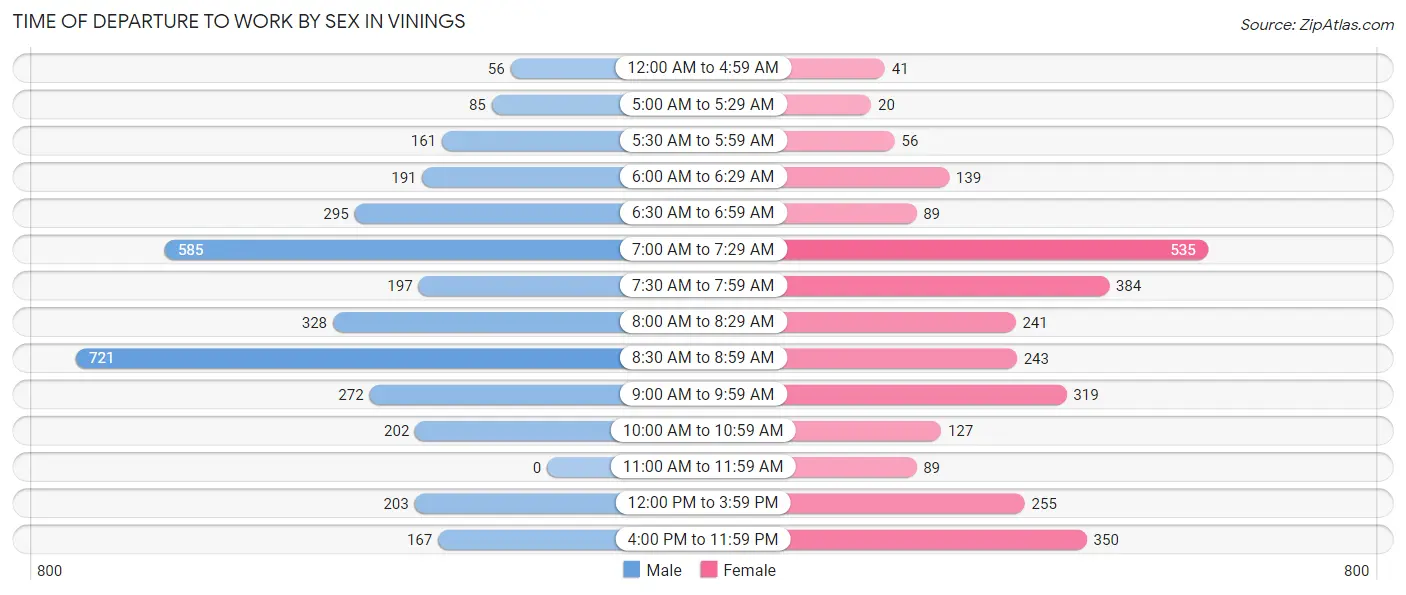
| Time of Departure | Male | Female |
| 12:00 AM to 4:59 AM | 56 (1.6%) | 41 (1.4%) |
| 5:00 AM to 5:29 AM | 85 (2.5%) | 20 (0.7%) |
| 5:30 AM to 5:59 AM | 161 (4.6%) | 56 (1.9%) |
| 6:00 AM to 6:29 AM | 191 (5.5%) | 139 (4.8%) |
| 6:30 AM to 6:59 AM | 295 (8.5%) | 89 (3.1%) |
| 7:00 AM to 7:29 AM | 585 (16.9%) | 535 (18.5%) |
| 7:30 AM to 7:59 AM | 197 (5.7%) | 384 (13.3%) |
| 8:00 AM to 8:29 AM | 328 (9.5%) | 241 (8.3%) |
| 8:30 AM to 8:59 AM | 721 (20.8%) | 243 (8.4%) |
| 9:00 AM to 9:59 AM | 272 (7.9%) | 319 (11.1%) |
| 10:00 AM to 10:59 AM | 202 (5.8%) | 127 (4.4%) |
| 11:00 AM to 11:59 AM | 0 (0.0%) | 89 (3.1%) |
| 12:00 PM to 3:59 PM | 203 (5.9%) | 255 (8.8%) |
| 4:00 PM to 11:59 PM | 167 (4.8%) | 350 (12.1%) |
| Total | 3,463 (100.0%) | 2,888 (100.0%) |
Housing Occupancy in Vinings
Occupancy by Ownership in Vinings
Of the total 7,240 dwellings in Vinings, owner-occupied units account for 2,600 (35.9%), while renter-occupied units make up 4,640 (64.1%).
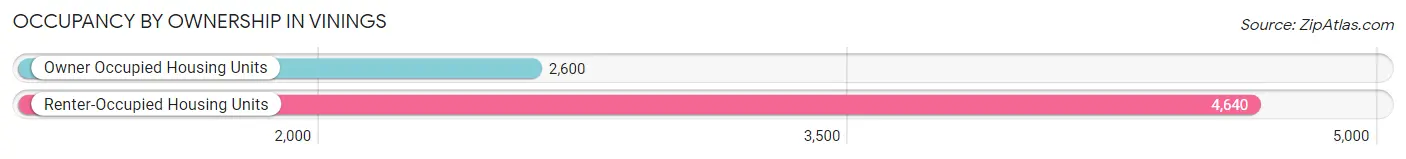
| Occupancy | # Housing Units | % Housing Units |
| Owner Occupied Housing Units | 2,600 | 35.9% |
| Renter-Occupied Housing Units | 4,640 | 64.1% |
| Total Occupied Housing Units | 7,240 | 100.0% |
Occupancy by Household Size in Vinings
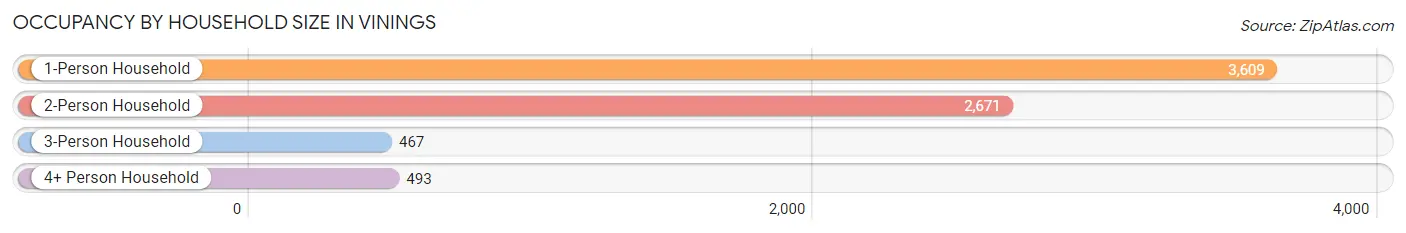
| Household Size | # Housing Units | % Housing Units |
| 1-Person Household | 3,609 | 49.8% |
| 2-Person Household | 2,671 | 36.9% |
| 3-Person Household | 467 | 6.5% |
| 4+ Person Household | 493 | 6.8% |
| Total Housing Units | 7,240 | 100.0% |
Occupancy by Ownership by Household Size in Vinings
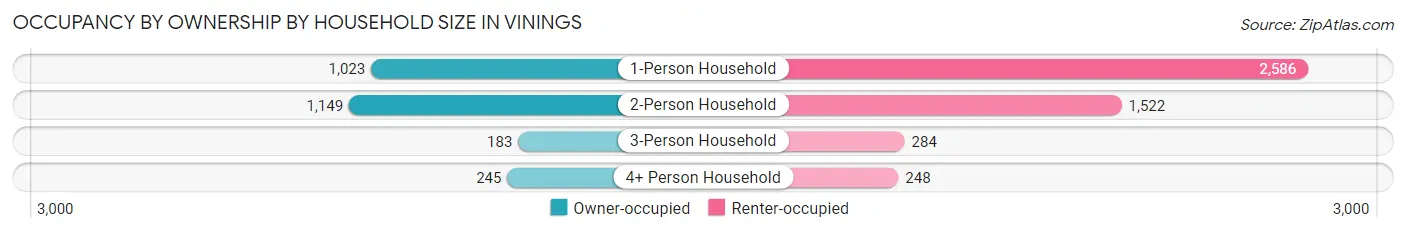
| Household Size | Owner-occupied | Renter-occupied |
| 1-Person Household | 1,023 (28.3%) | 2,586 (71.7%) |
| 2-Person Household | 1,149 (43.0%) | 1,522 (57.0%) |
| 3-Person Household | 183 (39.2%) | 284 (60.8%) |
| 4+ Person Household | 245 (49.7%) | 248 (50.3%) |
| Total Housing Units | 2,600 (35.9%) | 4,640 (64.1%) |
Occupancy by Educational Attainment in Vinings
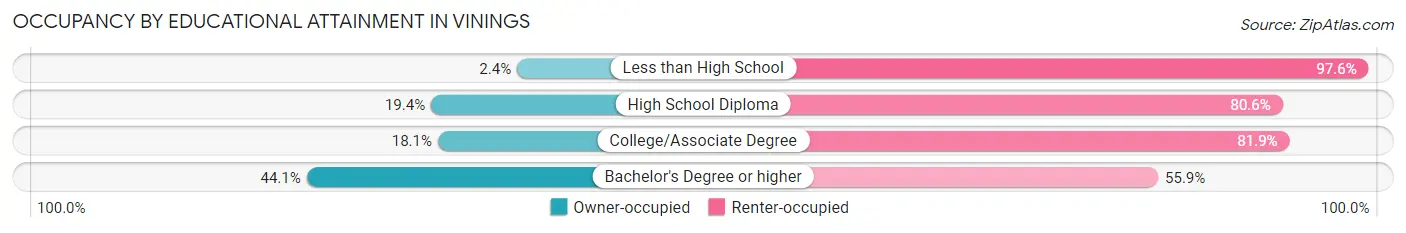
| Household Size | Owner-occupied | Renter-occupied |
| Less than High School | 1 (2.4%) | 41 (97.6%) |
| High School Diploma | 149 (19.4%) | 618 (80.6%) |
| College/Associate Degree | 268 (18.1%) | 1,215 (81.9%) |
| Bachelor's Degree or higher | 2,182 (44.1%) | 2,766 (55.9%) |
Occupancy by Age of Householder in Vinings
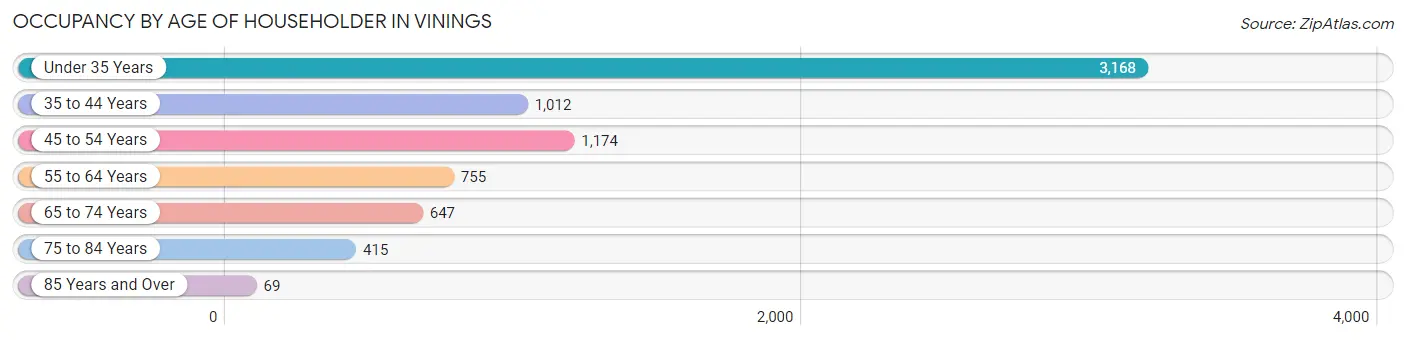
| Age Bracket | # Households | % Households |
| Under 35 Years | 3,168 | 43.8% |
| 35 to 44 Years | 1,012 | 14.0% |
| 45 to 54 Years | 1,174 | 16.2% |
| 55 to 64 Years | 755 | 10.4% |
| 65 to 74 Years | 647 | 8.9% |
| 75 to 84 Years | 415 | 5.7% |
| 85 Years and Over | 69 | 0.9% |
| Total | 7,240 | 100.0% |
Housing Finances in Vinings
Median Income by Occupancy in Vinings
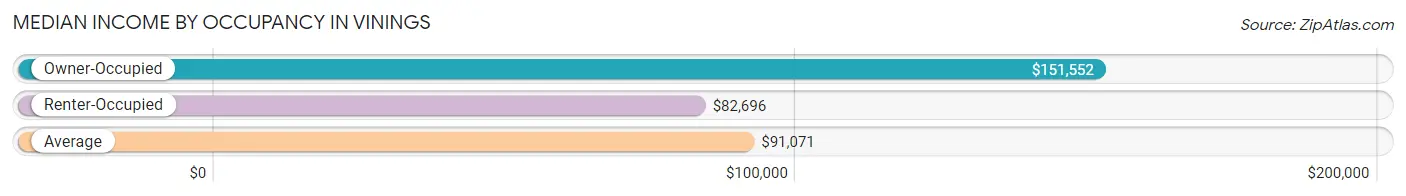
| Occupancy Type | # Households | Median Income |
| Owner-Occupied | 2,600 (35.9%) | $151,552 |
| Renter-Occupied | 4,640 (64.1%) | $82,696 |
| Average | 7,240 (100.0%) | $91,071 |
Occupancy by Householder Income Bracket in Vinings
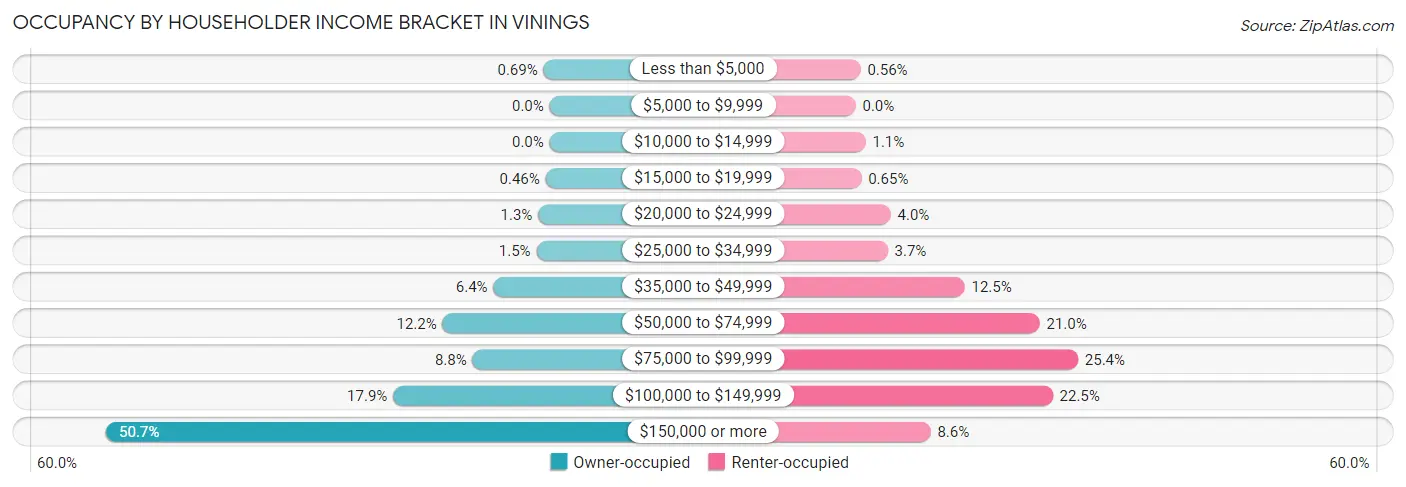
| Income Bracket | Owner-occupied | Renter-occupied |
| Less than $5,000 | 18 (0.7%) | 26 (0.6%) |
| $5,000 to $9,999 | 0 (0.0%) | 0 (0.0%) |
| $10,000 to $14,999 | 0 (0.0%) | 53 (1.1%) |
| $15,000 to $19,999 | 12 (0.5%) | 30 (0.6%) |
| $20,000 to $24,999 | 34 (1.3%) | 186 (4.0%) |
| $25,000 to $34,999 | 39 (1.5%) | 170 (3.7%) |
| $35,000 to $49,999 | 167 (6.4%) | 578 (12.5%) |
| $50,000 to $74,999 | 318 (12.2%) | 976 (21.0%) |
| $75,000 to $99,999 | 229 (8.8%) | 1,179 (25.4%) |
| $100,000 to $149,999 | 465 (17.9%) | 1,045 (22.5%) |
| $150,000 or more | 1,318 (50.7%) | 397 (8.6%) |
| Total | 2,600 (100.0%) | 4,640 (100.0%) |
Monthly Housing Cost Tiers in Vinings
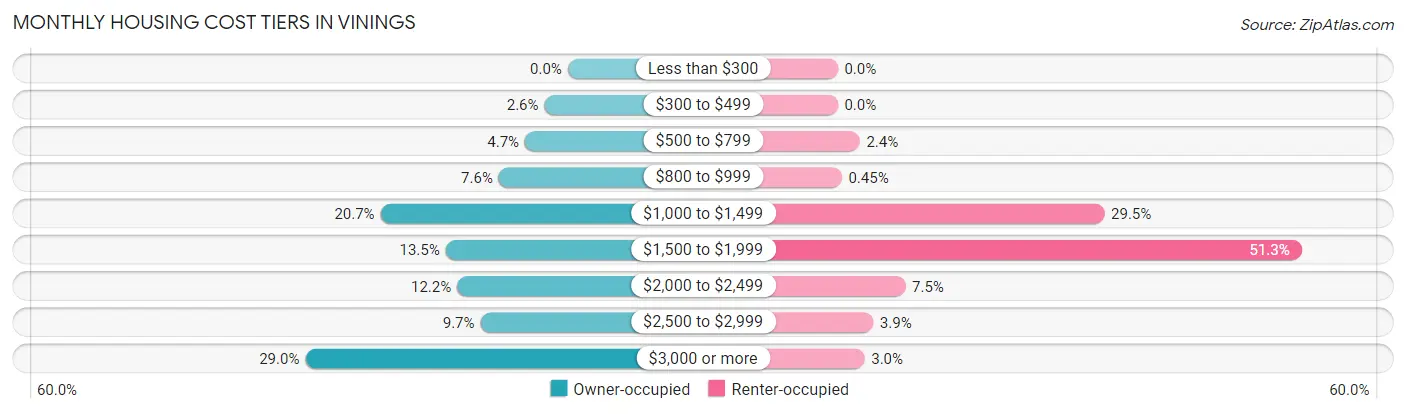
| Monthly Cost | Owner-occupied | Renter-occupied |
| Less than $300 | 0 (0.0%) | 0 (0.0%) |
| $300 to $499 | 67 (2.6%) | 0 (0.0%) |
| $500 to $799 | 123 (4.7%) | 113 (2.4%) |
| $800 to $999 | 198 (7.6%) | 21 (0.4%) |
| $1,000 to $1,499 | 538 (20.7%) | 1,367 (29.5%) |
| $1,500 to $1,999 | 351 (13.5%) | 2,379 (51.3%) |
| $2,000 to $2,499 | 318 (12.2%) | 347 (7.5%) |
| $2,500 to $2,999 | 251 (9.7%) | 182 (3.9%) |
| $3,000 or more | 754 (29.0%) | 138 (3.0%) |
| Total | 2,600 (100.0%) | 4,640 (100.0%) |
Physical Housing Characteristics in Vinings
Housing Structures in Vinings
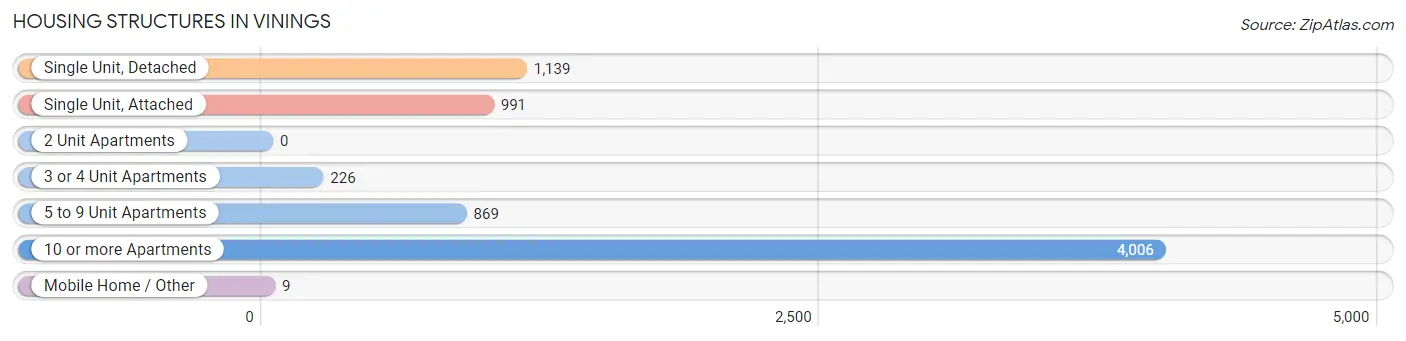
| Structure Type | # Housing Units | % Housing Units |
| Single Unit, Detached | 1,139 | 15.7% |
| Single Unit, Attached | 991 | 13.7% |
| 2 Unit Apartments | 0 | 0.0% |
| 3 or 4 Unit Apartments | 226 | 3.1% |
| 5 to 9 Unit Apartments | 869 | 12.0% |
| 10 or more Apartments | 4,006 | 55.3% |
| Mobile Home / Other | 9 | 0.1% |
| Total | 7,240 | 100.0% |
Housing Structures by Occupancy in Vinings
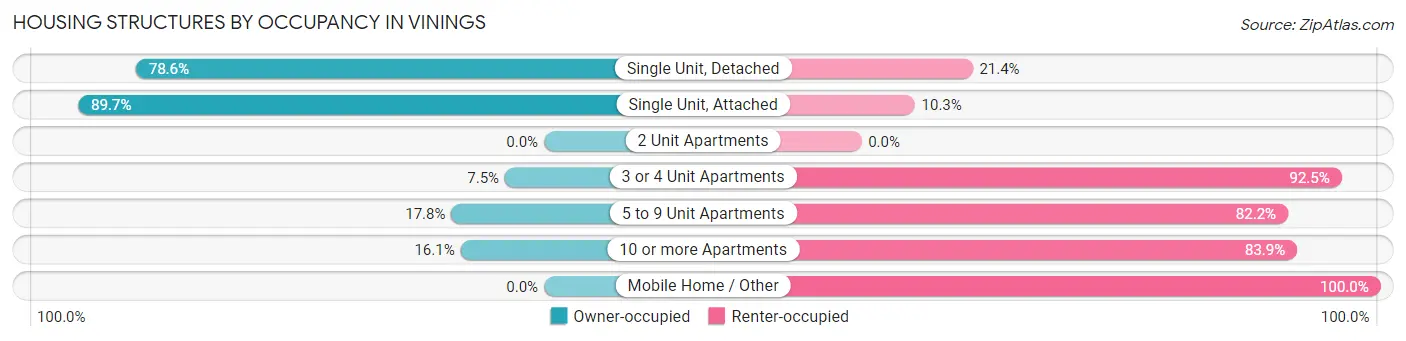
| Structure Type | Owner-occupied | Renter-occupied |
| Single Unit, Detached | 895 (78.6%) | 244 (21.4%) |
| Single Unit, Attached | 889 (89.7%) | 102 (10.3%) |
| 2 Unit Apartments | 0 (0.0%) | 0 (0.0%) |
| 3 or 4 Unit Apartments | 17 (7.5%) | 209 (92.5%) |
| 5 to 9 Unit Apartments | 155 (17.8%) | 714 (82.2%) |
| 10 or more Apartments | 644 (16.1%) | 3,362 (83.9%) |
| Mobile Home / Other | 0 (0.0%) | 9 (100.0%) |
| Total | 2,600 (35.9%) | 4,640 (64.1%) |
Housing Structures by Number of Rooms in Vinings
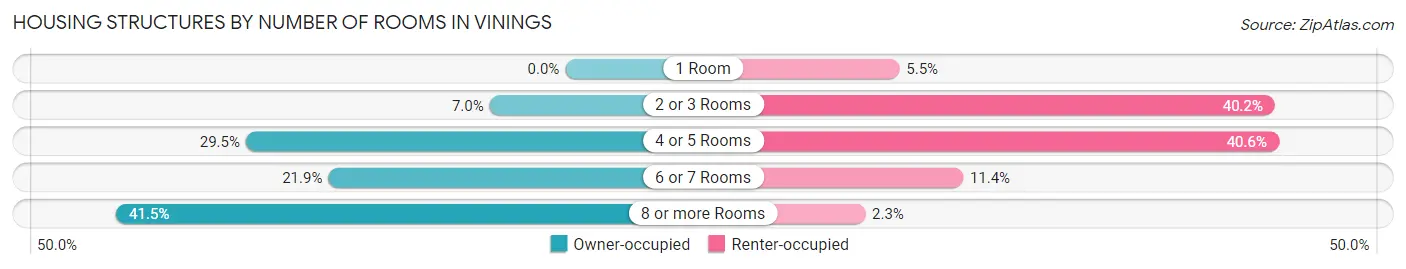
| Number of Rooms | Owner-occupied | Renter-occupied |
| 1 Room | 0 (0.0%) | 255 (5.5%) |
| 2 or 3 Rooms | 182 (7.0%) | 1,866 (40.2%) |
| 4 or 5 Rooms | 768 (29.5%) | 1,883 (40.6%) |
| 6 or 7 Rooms | 570 (21.9%) | 528 (11.4%) |
| 8 or more Rooms | 1,080 (41.5%) | 108 (2.3%) |
| Total | 2,600 (100.0%) | 4,640 (100.0%) |
Housing Structure by Heating Type in Vinings
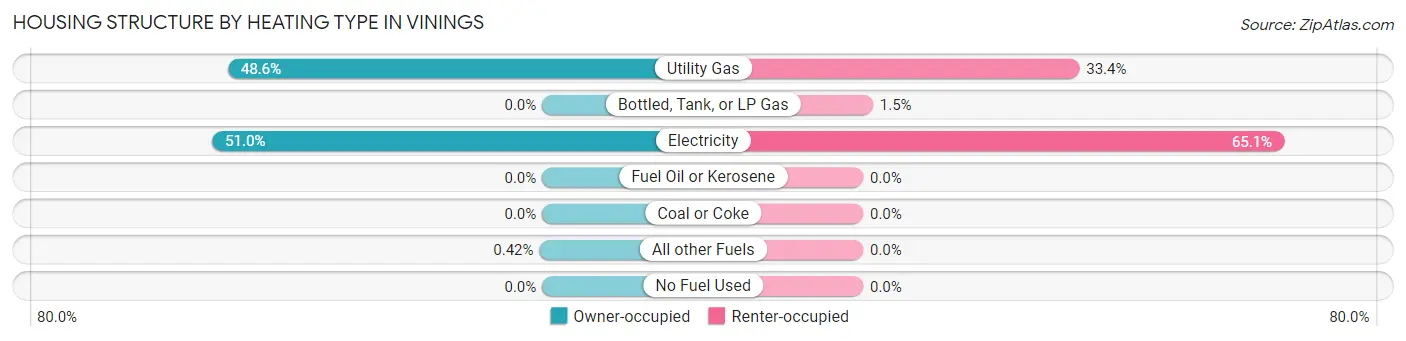
| Heating Type | Owner-occupied | Renter-occupied |
| Utility Gas | 1,263 (48.6%) | 1,551 (33.4%) |
| Bottled, Tank, or LP Gas | 0 (0.0%) | 70 (1.5%) |
| Electricity | 1,326 (51.0%) | 3,019 (65.1%) |
| Fuel Oil or Kerosene | 0 (0.0%) | 0 (0.0%) |
| Coal or Coke | 0 (0.0%) | 0 (0.0%) |
| All other Fuels | 11 (0.4%) | 0 (0.0%) |
| No Fuel Used | 0 (0.0%) | 0 (0.0%) |
| Total | 2,600 (100.0%) | 4,640 (100.0%) |
Household Vehicle Usage in Vinings
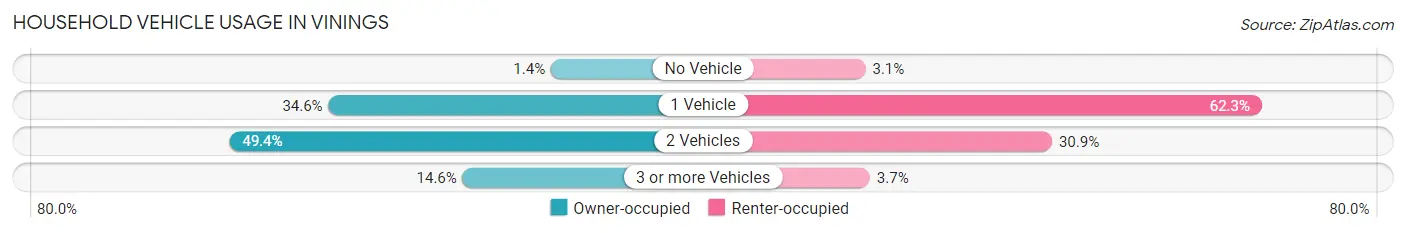
| Vehicles per Household | Owner-occupied | Renter-occupied |
| No Vehicle | 36 (1.4%) | 143 (3.1%) |
| 1 Vehicle | 900 (34.6%) | 2,889 (62.3%) |
| 2 Vehicles | 1,285 (49.4%) | 1,435 (30.9%) |
| 3 or more Vehicles | 379 (14.6%) | 173 (3.7%) |
| Total | 2,600 (100.0%) | 4,640 (100.0%) |
Real Estate & Mortgages in Vinings
Real Estate and Mortgage Overview in Vinings
| Characteristic | Without Mortgage | With Mortgage |
| Housing Units | 719 | 1,881 |
| Median Property Value | $644,800 | $531,800 |
| Median Household Income | $114,583 | $1,014 |
| Monthly Housing Costs | $995 | $747 |
| Real Estate Taxes | $2,232 | $0 |
Property Value by Mortgage Status in Vinings
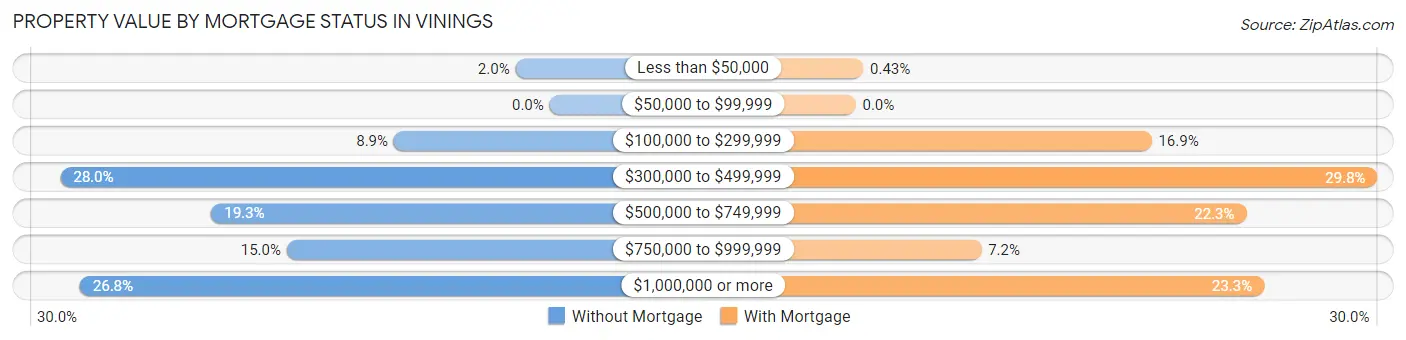
| Property Value | Without Mortgage | With Mortgage |
| Less than $50,000 | 14 (1.9%) | 8 (0.4%) |
| $50,000 to $99,999 | 0 (0.0%) | 0 (0.0%) |
| $100,000 to $299,999 | 64 (8.9%) | 318 (16.9%) |
| $300,000 to $499,999 | 201 (28.0%) | 561 (29.8%) |
| $500,000 to $749,999 | 139 (19.3%) | 420 (22.3%) |
| $750,000 to $999,999 | 108 (15.0%) | 135 (7.2%) |
| $1,000,000 or more | 193 (26.8%) | 439 (23.3%) |
| Total | 719 (100.0%) | 1,881 (100.0%) |
Household Income by Mortgage Status in Vinings
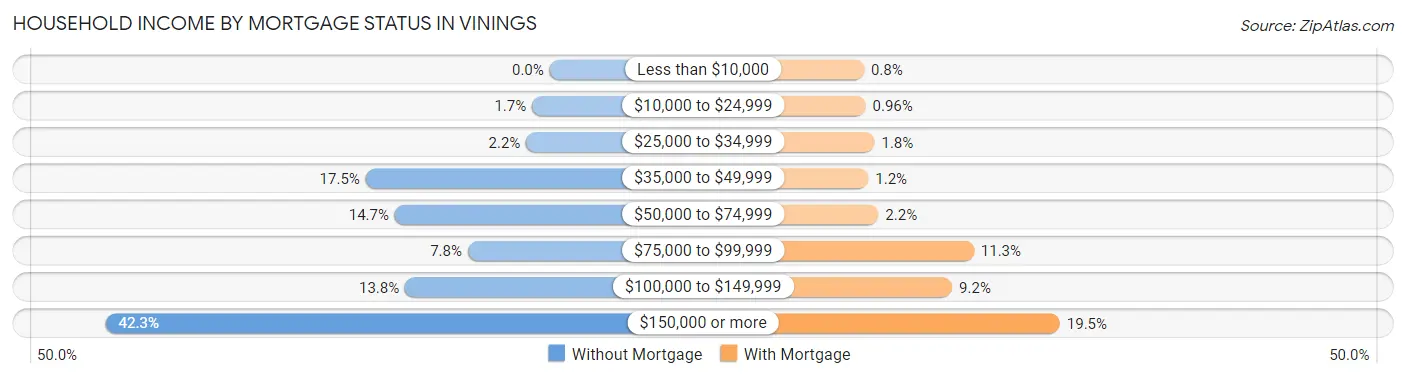
| Household Income | Without Mortgage | With Mortgage |
| Less than $10,000 | 0 (0.0%) | 15 (0.8%) |
| $10,000 to $24,999 | 12 (1.7%) | 18 (1.0%) |
| $25,000 to $34,999 | 16 (2.2%) | 34 (1.8%) |
| $35,000 to $49,999 | 126 (17.5%) | 23 (1.2%) |
| $50,000 to $74,999 | 106 (14.7%) | 41 (2.2%) |
| $75,000 to $99,999 | 56 (7.8%) | 212 (11.3%) |
| $100,000 to $149,999 | 99 (13.8%) | 173 (9.2%) |
| $150,000 or more | 304 (42.3%) | 366 (19.5%) |
| Total | 719 (100.0%) | 1,881 (100.0%) |
Property Value to Household Income Ratio in Vinings
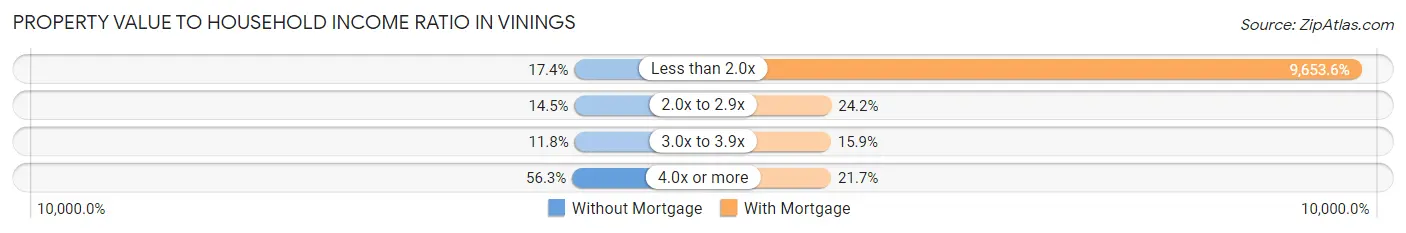
| Value-to-Income Ratio | Without Mortgage | With Mortgage |
| Less than 2.0x | 125 (17.4%) | 181,585 (9,653.6%) |
| 2.0x to 2.9x | 104 (14.5%) | 455 (24.2%) |
| 3.0x to 3.9x | 85 (11.8%) | 299 (15.9%) |
| 4.0x or more | 405 (56.3%) | 409 (21.7%) |
| Total | 719 (100.0%) | 1,881 (100.0%) |
Real Estate Taxes by Mortgage Status in Vinings
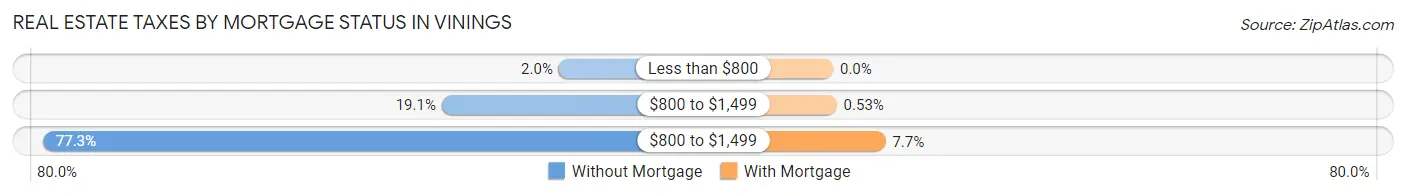
| Property Taxes | Without Mortgage | With Mortgage |
| Less than $800 | 14 (1.9%) | 0 (0.0%) |
| $800 to $1,499 | 137 (19.1%) | 10 (0.5%) |
| $800 to $1,499 | 556 (77.3%) | 144 (7.7%) |
| Total | 719 (100.0%) | 1,881 (100.0%) |
Health & Disability in Vinings
Health Insurance Coverage by Age in Vinings
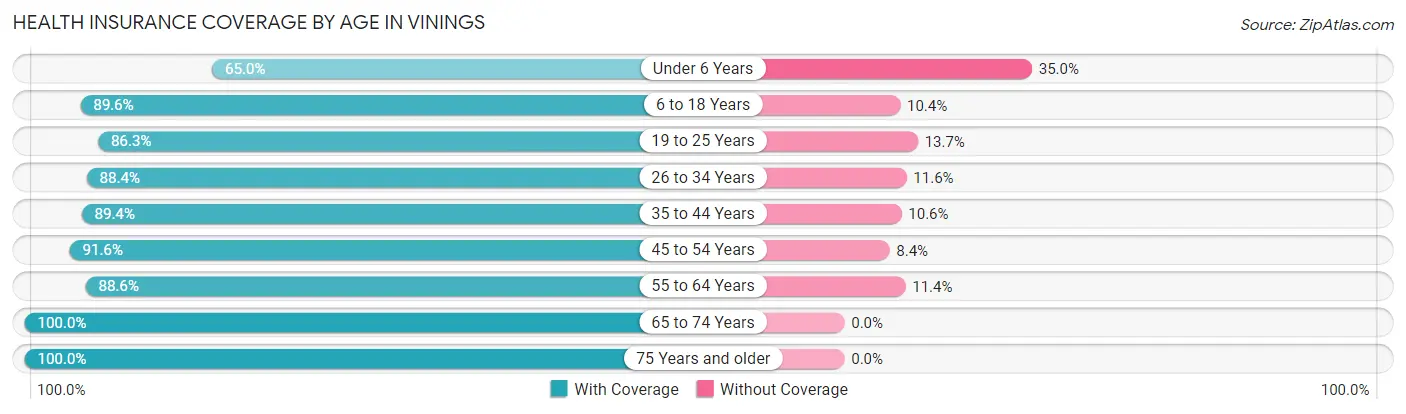
| Age Bracket | With Coverage | Without Coverage |
| Under 6 Years | 545 (65.0%) | 293 (35.0%) |
| 6 to 18 Years | 854 (89.6%) | 99 (10.4%) |
| 19 to 25 Years | 1,356 (86.3%) | 215 (13.7%) |
| 26 to 34 Years | 3,222 (88.4%) | 422 (11.6%) |
| 35 to 44 Years | 1,209 (89.4%) | 144 (10.6%) |
| 45 to 54 Years | 1,451 (91.6%) | 133 (8.4%) |
| 55 to 64 Years | 1,154 (88.6%) | 148 (11.4%) |
| 65 to 74 Years | 973 (100.0%) | 0 (0.0%) |
| 75 Years and older | 705 (100.0%) | 0 (0.0%) |
| Total | 11,469 (88.7%) | 1,454 (11.3%) |
Health Insurance Coverage by Citizenship Status in Vinings
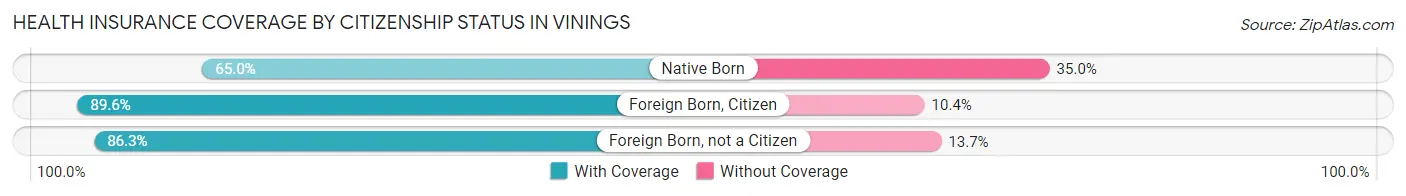
| Citizenship Status | With Coverage | Without Coverage |
| Native Born | 545 (65.0%) | 293 (35.0%) |
| Foreign Born, Citizen | 854 (89.6%) | 99 (10.4%) |
| Foreign Born, not a Citizen | 1,356 (86.3%) | 215 (13.7%) |
Health Insurance Coverage by Household Income in Vinings
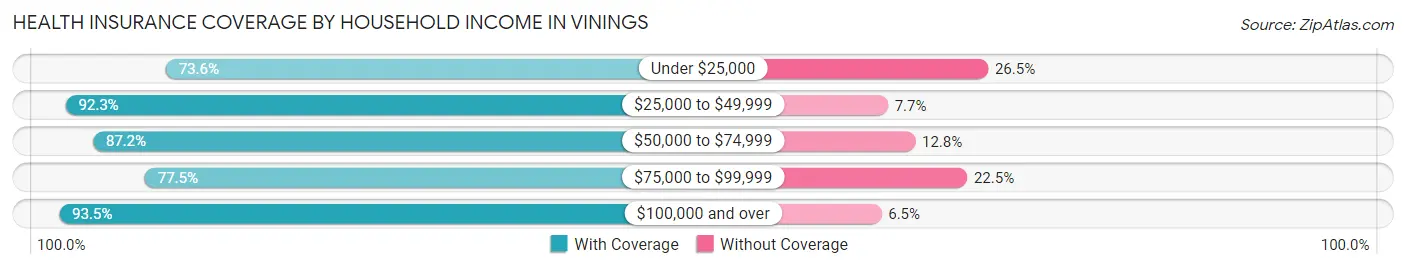
| Household Income | With Coverage | Without Coverage |
| Under $25,000 | 317 (73.6%) | 114 (26.5%) |
| $25,000 to $49,999 | 1,591 (92.3%) | 132 (7.7%) |
| $50,000 to $74,999 | 1,461 (87.2%) | 214 (12.8%) |
| $75,000 to $99,999 | 1,961 (77.5%) | 570 (22.5%) |
| $100,000 and over | 6,139 (93.5%) | 424 (6.5%) |
Public vs Private Health Insurance Coverage by Age in Vinings
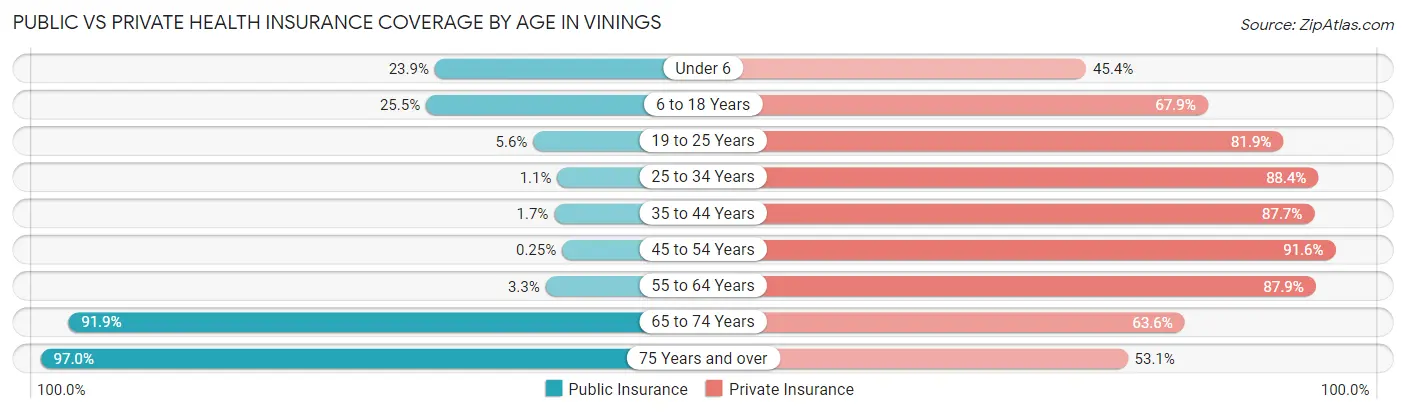
| Age Bracket | Public Insurance | Private Insurance |
| Under 6 | 200 (23.9%) | 380 (45.4%) |
| 6 to 18 Years | 243 (25.5%) | 647 (67.9%) |
| 19 to 25 Years | 88 (5.6%) | 1,287 (81.9%) |
| 25 to 34 Years | 41 (1.1%) | 3,222 (88.4%) |
| 35 to 44 Years | 23 (1.7%) | 1,186 (87.7%) |
| 45 to 54 Years | 4 (0.3%) | 1,451 (91.6%) |
| 55 to 64 Years | 43 (3.3%) | 1,145 (87.9%) |
| 65 to 74 Years | 894 (91.9%) | 619 (63.6%) |
| 75 Years and over | 684 (97.0%) | 374 (53.0%) |
| Total | 2,220 (17.2%) | 10,311 (79.8%) |
Disability Status by Sex by Age in Vinings
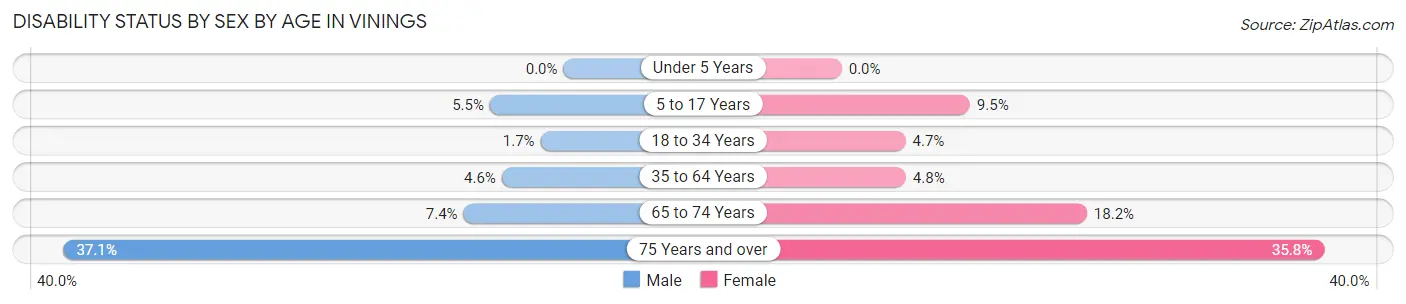
| Age Bracket | Male | Female |
| Under 5 Years | 0 (0.0%) | 0 (0.0%) |
| 5 to 17 Years | 33 (5.5%) | 49 (9.5%) |
| 18 to 34 Years | 45 (1.7%) | 123 (4.7%) |
| 35 to 64 Years | 97 (4.6%) | 101 (4.8%) |
| 65 to 74 Years | 31 (7.4%) | 101 (18.2%) |
| 75 Years and over | 131 (37.1%) | 126 (35.8%) |
Disability Class by Sex by Age in Vinings
Disability Class: Hearing Difficulty
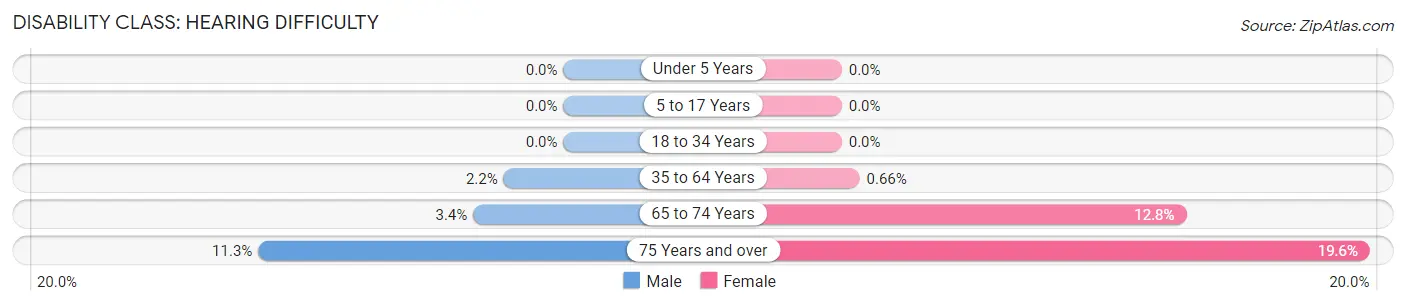
| Age Bracket | Male | Female |
| Under 5 Years | 0 (0.0%) | 0 (0.0%) |
| 5 to 17 Years | 0 (0.0%) | 0 (0.0%) |
| 18 to 34 Years | 0 (0.0%) | 0 (0.0%) |
| 35 to 64 Years | 47 (2.2%) | 14 (0.7%) |
| 65 to 74 Years | 14 (3.4%) | 71 (12.8%) |
| 75 Years and over | 40 (11.3%) | 69 (19.6%) |
Disability Class: Vision Difficulty
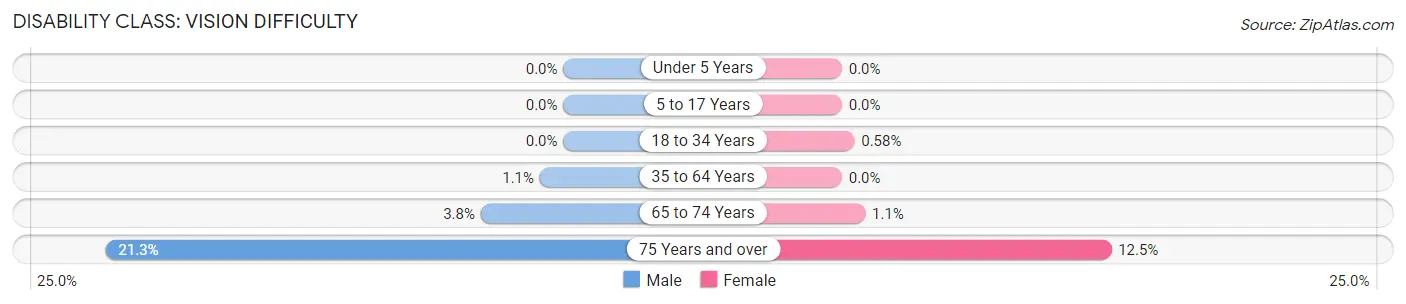
| Age Bracket | Male | Female |
| Under 5 Years | 0 (0.0%) | 0 (0.0%) |
| 5 to 17 Years | 0 (0.0%) | 0 (0.0%) |
| 18 to 34 Years | 0 (0.0%) | 15 (0.6%) |
| 35 to 64 Years | 23 (1.1%) | 0 (0.0%) |
| 65 to 74 Years | 16 (3.8%) | 6 (1.1%) |
| 75 Years and over | 75 (21.2%) | 44 (12.5%) |
Disability Class: Cognitive Difficulty
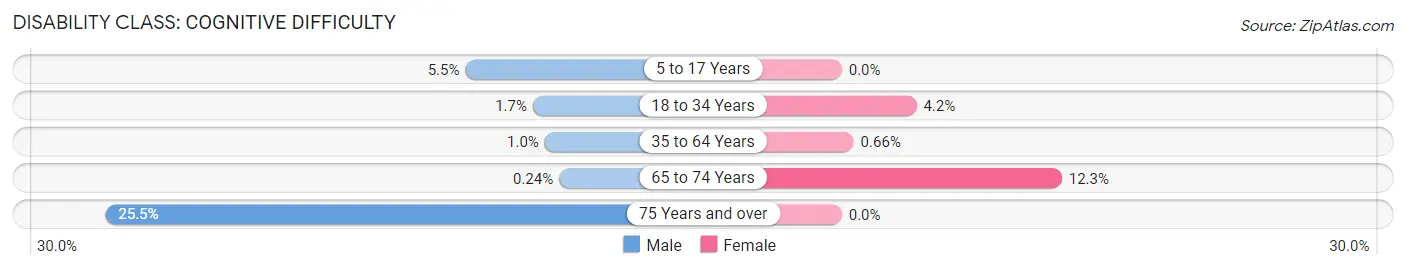
| Age Bracket | Male | Female |
| 5 to 17 Years | 33 (5.5%) | 0 (0.0%) |
| 18 to 34 Years | 45 (1.7%) | 108 (4.2%) |
| 35 to 64 Years | 22 (1.0%) | 14 (0.7%) |
| 65 to 74 Years | 1 (0.2%) | 68 (12.2%) |
| 75 Years and over | 90 (25.5%) | 0 (0.0%) |
Disability Class: Ambulatory Difficulty
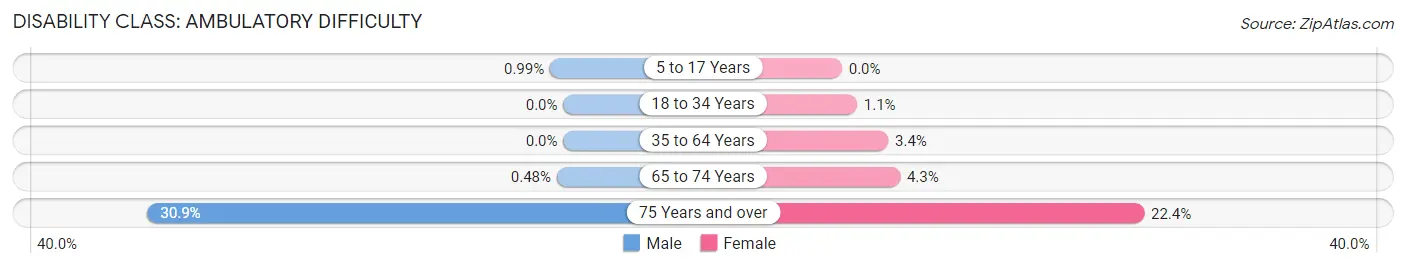
| Age Bracket | Male | Female |
| 5 to 17 Years | 6 (1.0%) | 0 (0.0%) |
| 18 to 34 Years | 0 (0.0%) | 29 (1.1%) |
| 35 to 64 Years | 0 (0.0%) | 73 (3.4%) |
| 65 to 74 Years | 2 (0.5%) | 24 (4.3%) |
| 75 Years and over | 109 (30.9%) | 79 (22.4%) |
Disability Class: Self-Care Difficulty
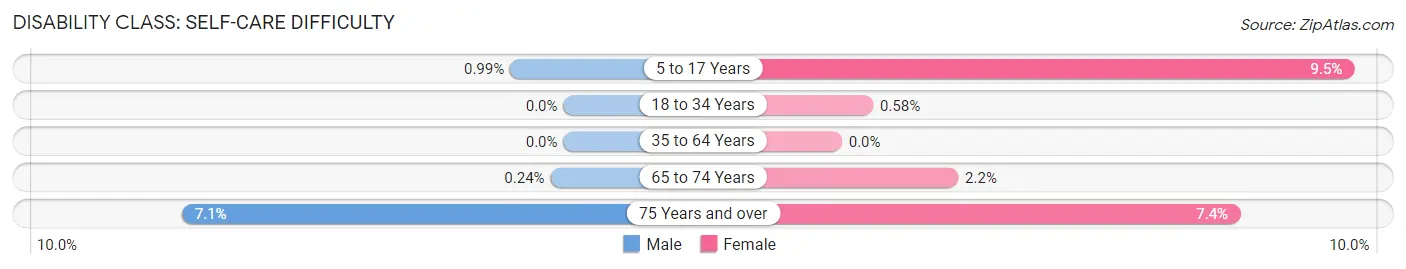
| Age Bracket | Male | Female |
| 5 to 17 Years | 6 (1.0%) | 49 (9.5%) |
| 18 to 34 Years | 0 (0.0%) | 15 (0.6%) |
| 35 to 64 Years | 0 (0.0%) | 0 (0.0%) |
| 65 to 74 Years | 1 (0.2%) | 12 (2.2%) |
| 75 Years and over | 25 (7.1%) | 26 (7.4%) |
Technology Access in Vinings
Computing Device Access in Vinings
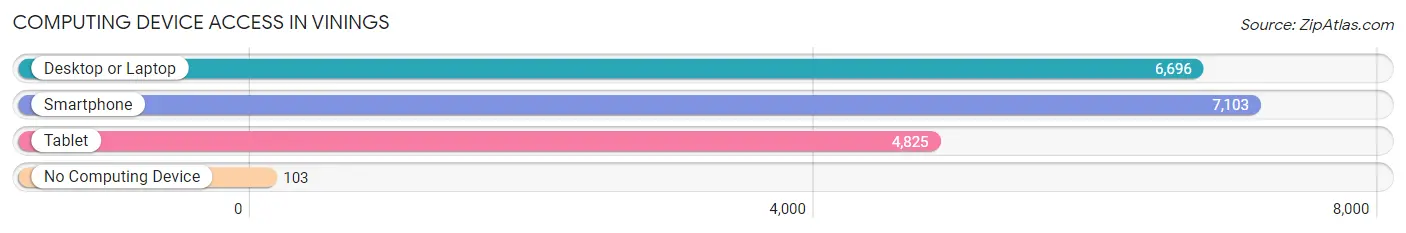
| Device Type | # Households | % Households |
| Desktop or Laptop | 6,696 | 92.5% |
| Smartphone | 7,103 | 98.1% |
| Tablet | 4,825 | 66.6% |
| No Computing Device | 103 | 1.4% |
| Total | 7,240 | 100.0% |
Internet Access in Vinings
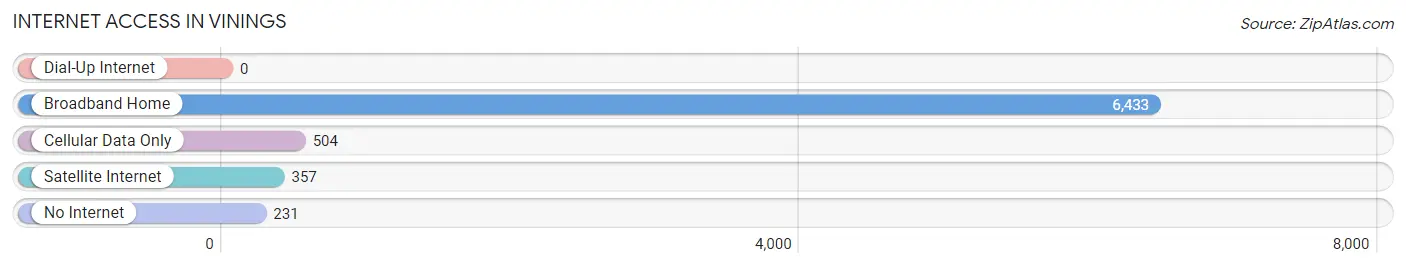
| Internet Type | # Households | % Households |
| Dial-Up Internet | 0 | 0.0% |
| Broadband Home | 6,433 | 88.8% |
| Cellular Data Only | 504 | 7.0% |
| Satellite Internet | 357 | 4.9% |
| No Internet | 231 | 3.2% |
| Total | 7,240 | 100.0% |
Vinings Summary
Vinings is a small unincorporated community located in Cobb County, Georgia, United States. It is situated just outside the city limits of Atlanta, and is part of the Atlanta metropolitan area. The population of Vinings was estimated to be 9,742 in 2019.
History
Vinings was founded in 1833 by Hardy Pace, a settler from North Carolina. He purchased land from the Creek Indians and built a trading post, which eventually became the town of Vinings. The town was named after William H. Vining, who was a prominent lawyer and politician in the area.
Vinings was a small rural community until the late 19th century, when the railroad was built through the area. This allowed for the development of the town, and it soon became a popular destination for wealthy Atlantans looking to escape the hustle and bustle of the city.
In the early 20th century, Vinings was a popular summer resort for wealthy Atlantans. The town was home to several large estates, and the area was known for its beautiful scenery and peaceful atmosphere.
Geography
Vinings is located in Cobb County, Georgia, just outside the city limits of Atlanta. It is situated in the foothills of the Appalachian Mountains, and is part of the Atlanta metropolitan area. The town is bordered by Smyrna to the north, Mableton to the east, and Powder Springs to the south.
The terrain of Vinings is mostly hilly, with some flat areas. The town is located in a humid subtropical climate zone, with hot, humid summers and mild winters.
Economy
Vinings is primarily a residential community, and the economy is largely based on the service industry. The town is home to several restaurants, retail stores, and other businesses.
The town is also home to several corporate headquarters, including the headquarters of the Home Depot, the Atlanta Braves, and the Atlanta Falcons.
Demographics
As of 2019, the population of Vinings was estimated to be 9,742. The racial makeup of the town was 79.3% White, 11.2% African American, 4.2% Asian, and 5.3% from other races.
The median household income in Vinings was $90,845 in 2019, and the median home value was $400,000. The town has a highly educated population, with over 50% of the population having a bachelor's degree or higher.
Conclusion
Vinings is a small unincorporated community located in Cobb County, Georgia, just outside the city limits of Atlanta. It was founded in 1833 by Hardy Pace, and has since become a popular destination for wealthy Atlantans looking to escape the hustle and bustle of the city. The economy of Vinings is largely based on the service industry, and the town is home to several corporate headquarters. The population of Vinings was estimated to be 9,742 in 2019, and the median household income was $90,845. Vinings is a peaceful and beautiful community, and is a great place to live for those looking for a quiet and relaxing atmosphere.
Common Questions
What is Per Capita Income in Vinings?
Per Capita income in Vinings is $80,167.
What is the Median Family Income in Vinings?
Median Family Income in Vinings is $144,469.
What is the Median Household income in Vinings?
Median Household Income in Vinings is $91,071.
What is Income or Wage Gap in Vinings?
Income or Wage Gap in Vinings is 21.2%.
Women in Vinings earn 78.8 cents for every dollar earned by a man.
What is Inequality or Gini Index in Vinings?
Inequality or Gini Index in Vinings is 0.48.
What is the Total Population of Vinings?
Total Population of Vinings is 12,947.
What is the Total Male Population of Vinings?
Total Male Population of Vinings is 6,375.
What is the Total Female Population of Vinings?
Total Female Population of Vinings is 6,572.
What is the Ratio of Males per 100 Females in Vinings?
There are 97.00 Males per 100 Females in Vinings.
What is the Ratio of Females per 100 Males in Vinings?
There are 103.09 Females per 100 Males in Vinings.
What is the Median Population Age in Vinings?
Median Population Age in Vinings is 33.3 Years.
What is the Average Family Size in Vinings
Average Family Size in Vinings is 2.7 People.
What is the Average Household Size in Vinings
Average Household Size in Vinings is 1.8 People.
How Large is the Labor Force in Vinings?
There are 9,104 People in the Labor Forcein in Vinings.
What is the Percentage of People in the Labor Force in Vinings?
80.9% of People are in the Labor Force in Vinings.
What is the Unemployment Rate in Vinings?
Unemployment Rate in Vinings is 2.1%.