Castine, ME Map & Demographics
Castine Map
Castine Overview
$27,076
PER CAPITA INCOME
$158,047
AVG FAMILY INCOME
$158,359
AVG HOUSEHOLD INCOME
40.9%
WAGE / INCOME GAP [ % ]
59.1¢/ $1
WAGE / INCOME GAP [ $ ]
0.36
INEQUALITY / GINI INDEX
923
TOTAL POPULATION
616
MALE POPULATION
307
FEMALE POPULATION
200.65
MALES / 100 FEMALES
49.84
FEMALES / 100 MALES
20.3
MEDIAN AGE
2.6
AVG FAMILY SIZE
2.3
AVG HOUSEHOLD SIZE
428
LABOR FORCE [ PEOPLE ]
48.8%
PERCENT IN LABOR FORCE
2.3%
UNEMPLOYMENT RATE
Castine Zip Codes
Castine Area Codes
Income in Castine
Income Overview in Castine
Per Capita Income in Castine is $27,076, while median incomes of families and households are $158,047 and $158,359 respectively.
| Characteristic | Number | Measure |
| Per Capita Income | 923 | $27,076 |
| Median Family Income | 121 | $158,047 |
| Mean Family Income | 121 | $132,401 |
| Median Household Income | 147 | $158,359 |
| Mean Household Income | 147 | $140,041 |
| Income Deficit | 121 | $0 |
| Wage / Income Gap (%) | 923 | 40.90% |
| Wage / Income Gap ($) | 923 | 59.10¢ per $1 |
| Gini / Inequality Index | 923 | 0.36 |
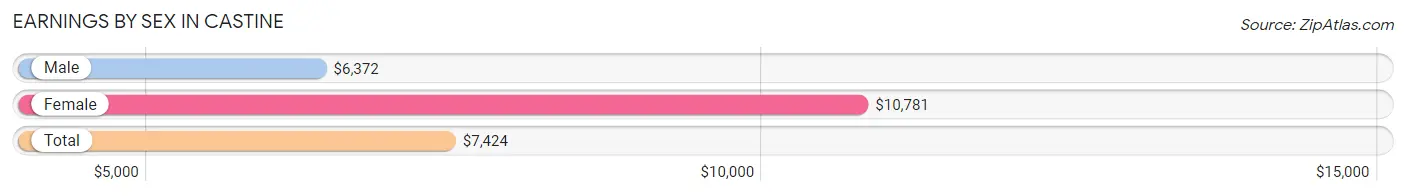
Earnings by Sex in Castine
Average Earnings in Castine are $7,424, $6,372 for men and $10,781 for women, a difference of 40.9%.
| Sex | Number | Average Earnings |
| Male | 455 (69.9%) | $6,372 |
| Female | 196 (30.1%) | $10,781 |
| Total | 651 (100.0%) | $7,424 |
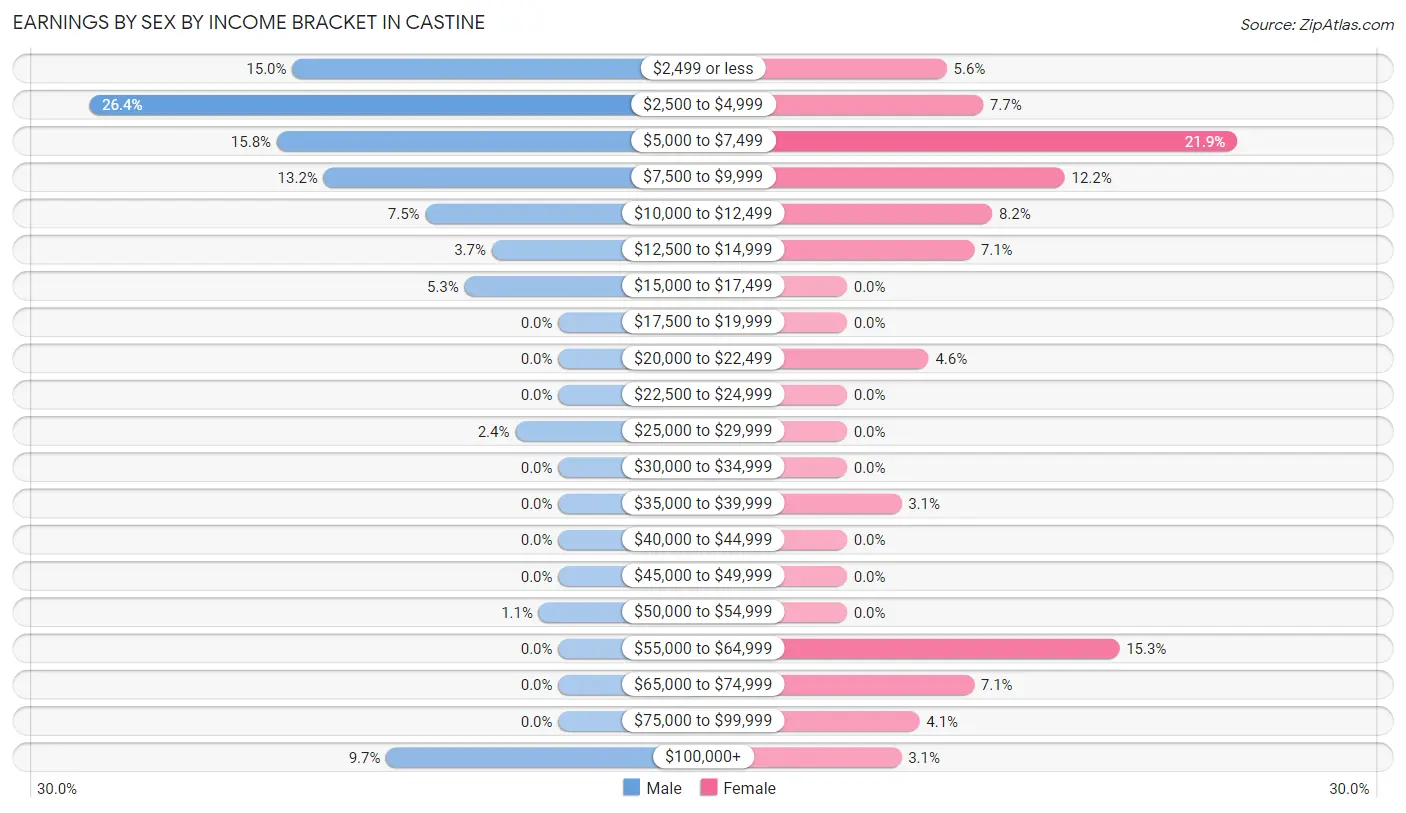
Earnings by Sex by Income Bracket in Castine
The most common earnings brackets in Castine are $2,500 to $4,999 for men (120 | 26.4%) and $5,000 to $7,499 for women (43 | 21.9%).
| Income | Male | Female |
| $2,499 or less | 68 (14.9%) | 11 (5.6%) |
| $2,500 to $4,999 | 120 (26.4%) | 15 (7.6%) |
| $5,000 to $7,499 | 72 (15.8%) | 43 (21.9%) |
| $7,500 to $9,999 | 60 (13.2%) | 24 (12.2%) |
| $10,000 to $12,499 | 34 (7.5%) | 16 (8.2%) |
| $12,500 to $14,999 | 17 (3.7%) | 14 (7.1%) |
| $15,000 to $17,499 | 24 (5.3%) | 0 (0.0%) |
| $17,500 to $19,999 | 0 (0.0%) | 0 (0.0%) |
| $20,000 to $22,499 | 0 (0.0%) | 9 (4.6%) |
| $22,500 to $24,999 | 0 (0.0%) | 0 (0.0%) |
| $25,000 to $29,999 | 11 (2.4%) | 0 (0.0%) |
| $30,000 to $34,999 | 0 (0.0%) | 0 (0.0%) |
| $35,000 to $39,999 | 0 (0.0%) | 6 (3.1%) |
| $40,000 to $44,999 | 0 (0.0%) | 0 (0.0%) |
| $45,000 to $49,999 | 0 (0.0%) | 0 (0.0%) |
| $50,000 to $54,999 | 5 (1.1%) | 0 (0.0%) |
| $55,000 to $64,999 | 0 (0.0%) | 30 (15.3%) |
| $65,000 to $74,999 | 0 (0.0%) | 14 (7.1%) |
| $75,000 to $99,999 | 0 (0.0%) | 8 (4.1%) |
| $100,000+ | 44 (9.7%) | 6 (3.1%) |
| Total | 455 (100.0%) | 196 (100.0%) |
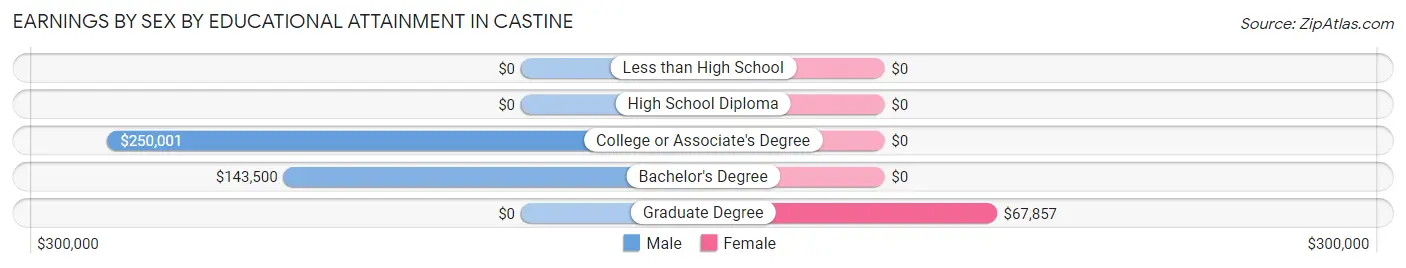
Earnings by Sex by Educational Attainment in Castine
Average earnings in Castine are $143,125 for men and $59,265 for women, a difference of 58.6%. Men with an educational attainment of college or associate's degree enjoy the highest average annual earnings of $250,001, while those with bachelor's degree education earn the least with $143,500. Women with an educational attainment of graduate degree earn the most with the average annual earnings of $67,857, while those with graduate degree education have the smallest earnings of $67,857.
| Educational Attainment | Male Income | Female Income |
| Less than High School | - | - |
| High School Diploma | - | - |
| College or Associate's Degree | $250,001 | $0 |
| Bachelor's Degree | $143,500 | $0 |
| Graduate Degree | - | - |
| Total | $143,125 | $59,265 |
Family Income in Castine
Family Income Brackets in Castine
According to the Castine family income data, there are 37 families falling into the $50,000 to $74,999 income range, which is the most common income bracket and makes up 30.6% of all families.
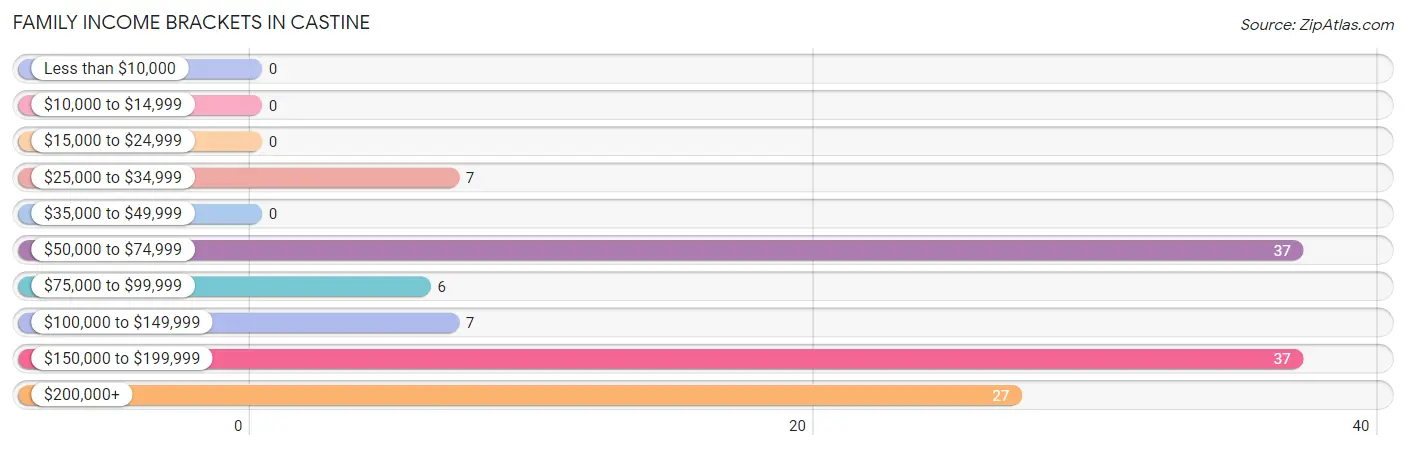
| Income Bracket | # Families | % Families |
| Less than $10,000 | 0 | 0.0% |
| $10,000 to $14,999 | 0 | 0.0% |
| $15,000 to $24,999 | 0 | 0.0% |
| $25,000 to $34,999 | 7 | 5.8% |
| $35,000 to $49,999 | 0 | 0.0% |
| $50,000 to $74,999 | 37 | 30.6% |
| $75,000 to $99,999 | 6 | 5.0% |
| $100,000 to $149,999 | 7 | 5.8% |
| $150,000 to $199,999 | 37 | 30.6% |
| $200,000+ | 27 | 22.3% |
Family Income by Famaliy Size in Castine
2-person families (86 | 71.1%) account for the highest median family income in Castine with $64,833 per family, while 2-person families (86 | 71.1%) have the highest median income of $32,416 per family member.
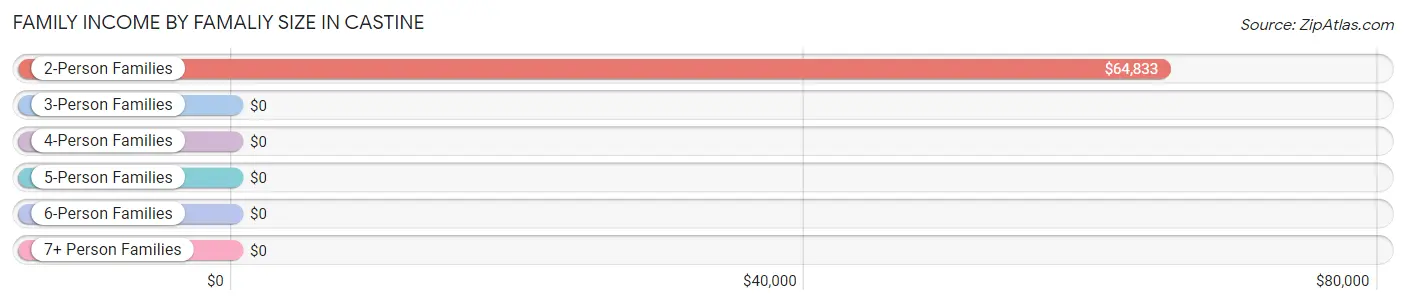
| Income Bracket | # Families | Median Income |
| 2-Person Families | 86 (71.1%) | $64,833 |
| 3-Person Families | 13 (10.7%) | $0 |
| 4-Person Families | 6 (5.0%) | $0 |
| 5-Person Families | 16 (13.2%) | $0 |
| 6-Person Families | 0 (0.0%) | $0 |
| 7+ Person Families | 0 (0.0%) | $0 |
| Total | 121 (100.0%) | $158,047 |
Family Income by Number of Earners in Castine
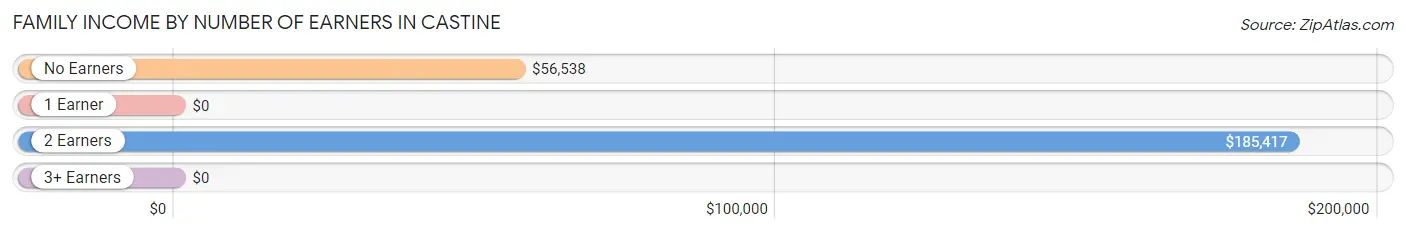
| Number of Earners | # Families | Median Income |
| No Earners | 48 (39.7%) | $56,538 |
| 1 Earner | 9 (7.4%) | $0 |
| 2 Earners | 44 (36.4%) | $185,417 |
| 3+ Earners | 20 (16.5%) | $0 |
| Total | 121 (100.0%) | $158,047 |
Household Income in Castine
Household Income Brackets in Castine
With 44 households falling in the category, the $150,000 to $199,999 income range is the most frequent in Castine, accounting for 29.9% of all households.
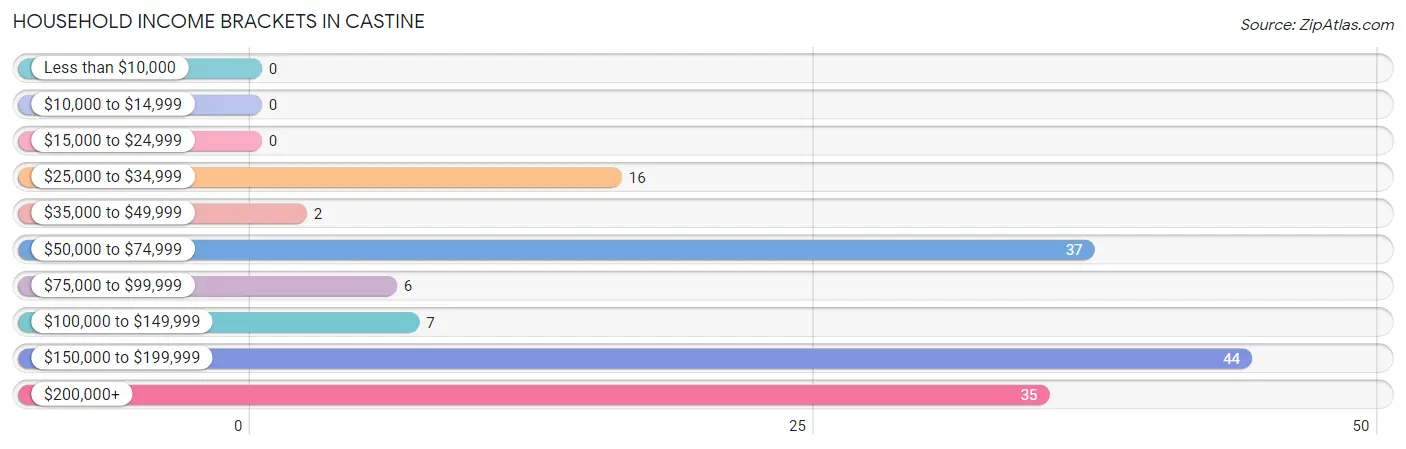
| Income Bracket | # Households | % Households |
| Less than $10,000 | 0 | 0.0% |
| $10,000 to $14,999 | 0 | 0.0% |
| $15,000 to $24,999 | 0 | 0.0% |
| $25,000 to $34,999 | 16 | 10.9% |
| $35,000 to $49,999 | 2 | 1.4% |
| $50,000 to $74,999 | 37 | 25.2% |
| $75,000 to $99,999 | 6 | 4.1% |
| $100,000 to $149,999 | 7 | 4.8% |
| $150,000 to $199,999 | 44 | 29.9% |
| $200,000+ | 35 | 23.8% |
Household Income by Householder Age in Castine
The median household income in Castine is $158,359, with the highest median household income of $182,500 found in the 45 to 64 years age bracket for the primary householder. A total of 44 households (29.9%) fall into this category.
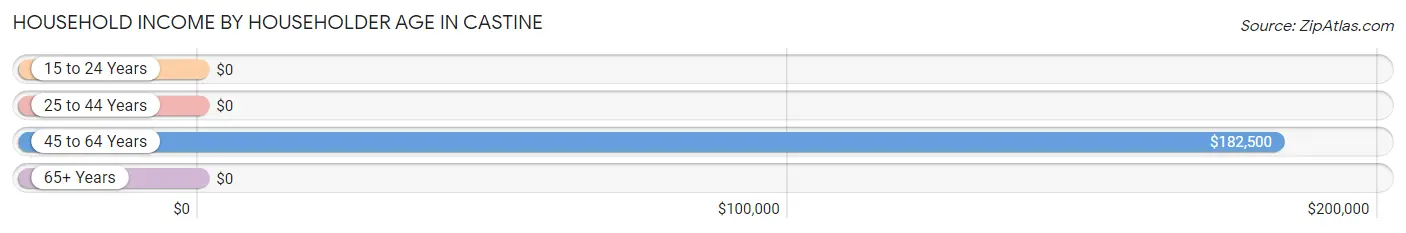
| Income Bracket | # Households | Median Income |
| 15 to 24 Years | 0 (0.0%) | $0 |
| 25 to 44 Years | 8 (5.4%) | $0 |
| 45 to 64 Years | 44 (29.9%) | $182,500 |
| 65+ Years | 95 (64.6%) | $0 |
| Total | 147 (100.0%) | $158,359 |
Poverty in Castine
Income Below Poverty by Sex and Age in Castine
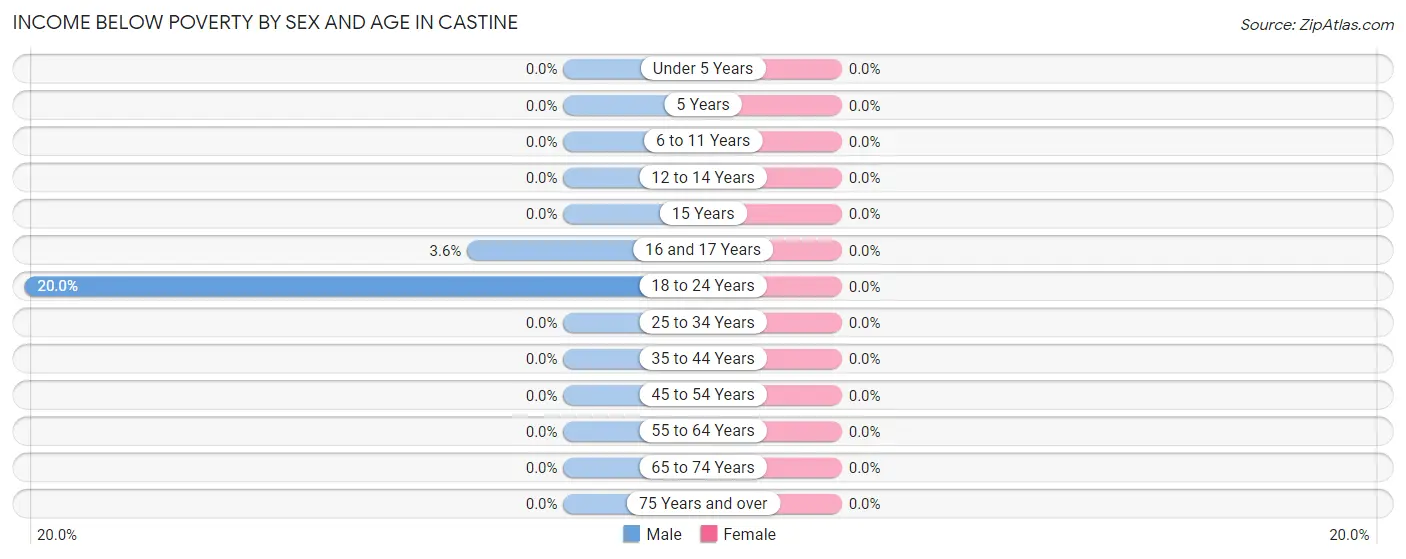
| Age Bracket | Male | Female |
| Under 5 Years | 0 (0.0%) | 0 (0.0%) |
| 5 Years | 0 (0.0%) | 0 (0.0%) |
| 6 to 11 Years | 0 (0.0%) | 0 (0.0%) |
| 12 to 14 Years | 0 (0.0%) | 0 (0.0%) |
| 15 Years | 0 (0.0%) | 0 (0.0%) |
| 16 and 17 Years | 1 (3.6%) | 0 (0.0%) |
| 18 to 24 Years | 1 (20.0%) | 0 (0.0%) |
| 25 to 34 Years | 0 (0.0%) | 0 (0.0%) |
| 35 to 44 Years | 0 (0.0%) | 0 (0.0%) |
| 45 to 54 Years | 0 (0.0%) | 0 (0.0%) |
| 55 to 64 Years | 0 (0.0%) | 0 (0.0%) |
| 65 to 74 Years | 0 (0.0%) | 0 (0.0%) |
| 75 Years and over | 0 (0.0%) | 0 (0.0%) |
| Total | 2 (1.2%) | 0 (0.0%) |
Income Above Poverty by Sex and Age in Castine
According to the poverty statistics in Castine, males aged 12 to 14 years and females aged 6 to 11 years are the age groups that are most secure financially, with 100.0% of males and 100.0% of females in these age groups living above the poverty line.
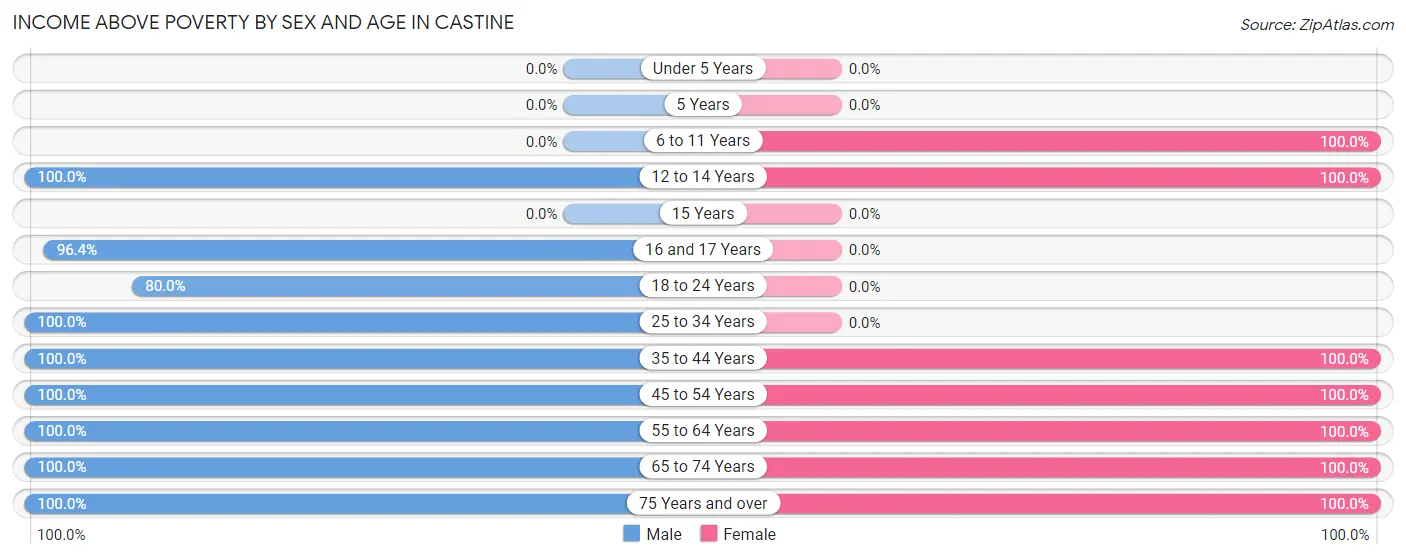
| Age Bracket | Male | Female |
| Under 5 Years | 0 (0.0%) | 0 (0.0%) |
| 5 Years | 0 (0.0%) | 0 (0.0%) |
| 6 to 11 Years | 0 (0.0%) | 17 (100.0%) |
| 12 to 14 Years | 24 (100.0%) | 5 (100.0%) |
| 15 Years | 0 (0.0%) | 0 (0.0%) |
| 16 and 17 Years | 27 (96.4%) | 0 (0.0%) |
| 18 to 24 Years | 4 (80.0%) | 0 (0.0%) |
| 25 to 34 Years | 1 (100.0%) | 0 (0.0%) |
| 35 to 44 Years | 10 (100.0%) | 8 (100.0%) |
| 45 to 54 Years | 19 (100.0%) | 29 (100.0%) |
| 55 to 64 Years | 8 (100.0%) | 44 (100.0%) |
| 65 to 74 Years | 36 (100.0%) | 40 (100.0%) |
| 75 Years and over | 36 (100.0%) | 38 (100.0%) |
| Total | 165 (98.8%) | 181 (100.0%) |
Income Below Poverty Among Married-Couple Families in Castine
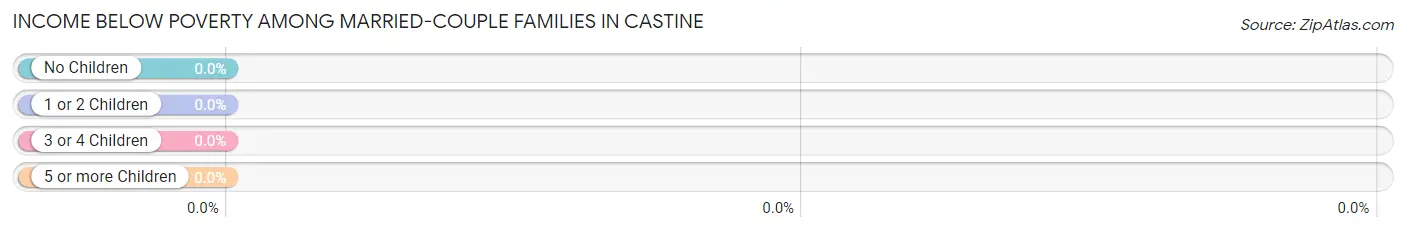
| Children | Above Poverty | Below Poverty |
| No Children | 74 (100.0%) | 0 (0.0%) |
| 1 or 2 Children | 15 (100.0%) | 0 (0.0%) |
| 3 or 4 Children | 16 (100.0%) | 0 (0.0%) |
| 5 or more Children | 0 (0.0%) | 0 (0.0%) |
| Total | 105 (100.0%) | 0 (0.0%) |
Income Below Poverty Among Single-Parent Households in Castine
| Children | Single Father | Single Mother |
| No Children | 0 (0.0%) | 0 (0.0%) |
| 1 or 2 Children | 0 (0.0%) | 0 (0.0%) |
| 3 or 4 Children | 0 (0.0%) | 0 (0.0%) |
| 5 or more Children | 0 (0.0%) | 0 (0.0%) |
| Total | 0 (0.0%) | 0 (0.0%) |
Income Below Poverty Among Married-Couple vs Single-Parent Households in Castine
| Children | Married-Couple Families | Single-Parent Households |
| No Children | 0 (0.0%) | 0 (0.0%) |
| 1 or 2 Children | 0 (0.0%) | 0 (0.0%) |
| 3 or 4 Children | 0 (0.0%) | 0 (0.0%) |
| 5 or more Children | 0 (0.0%) | 0 (0.0%) |
| Total | 0 (0.0%) | 0 (0.0%) |
Race in Castine
The most populous races in Castine are White / Caucasian (867 | 93.9%), Two or more Races (40 | 4.3%), and Black / African American (15 | 1.6%).
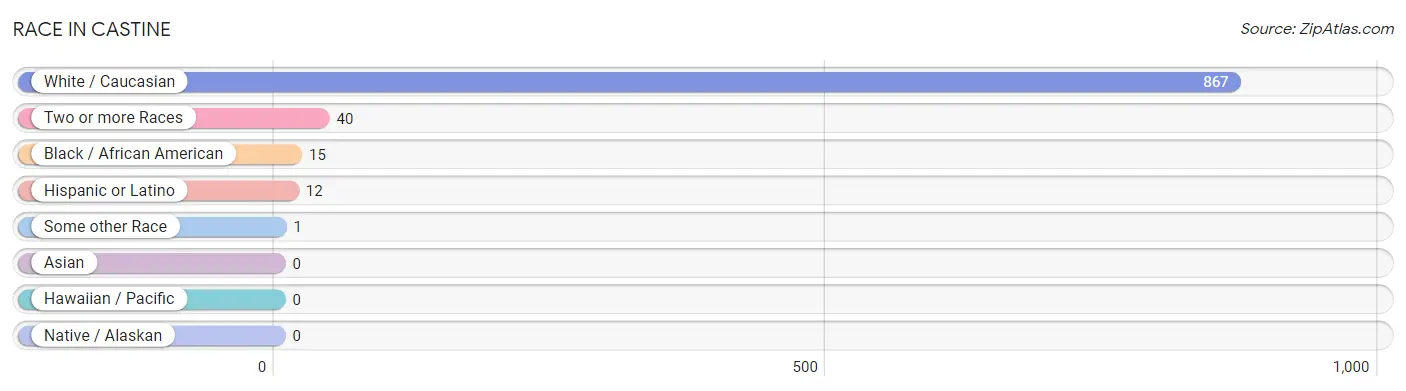
| Race | # Population | % Population |
| Asian | 0 | 0.0% |
| Black / African American | 15 | 1.6% |
| Hawaiian / Pacific | 0 | 0.0% |
| Hispanic or Latino | 12 | 1.3% |
| Native / Alaskan | 0 | 0.0% |
| White / Caucasian | 867 | 93.9% |
| Two or more Races | 40 | 4.3% |
| Some other Race | 1 | 0.1% |
| Total | 923 | 100.0% |
Ancestry in Castine
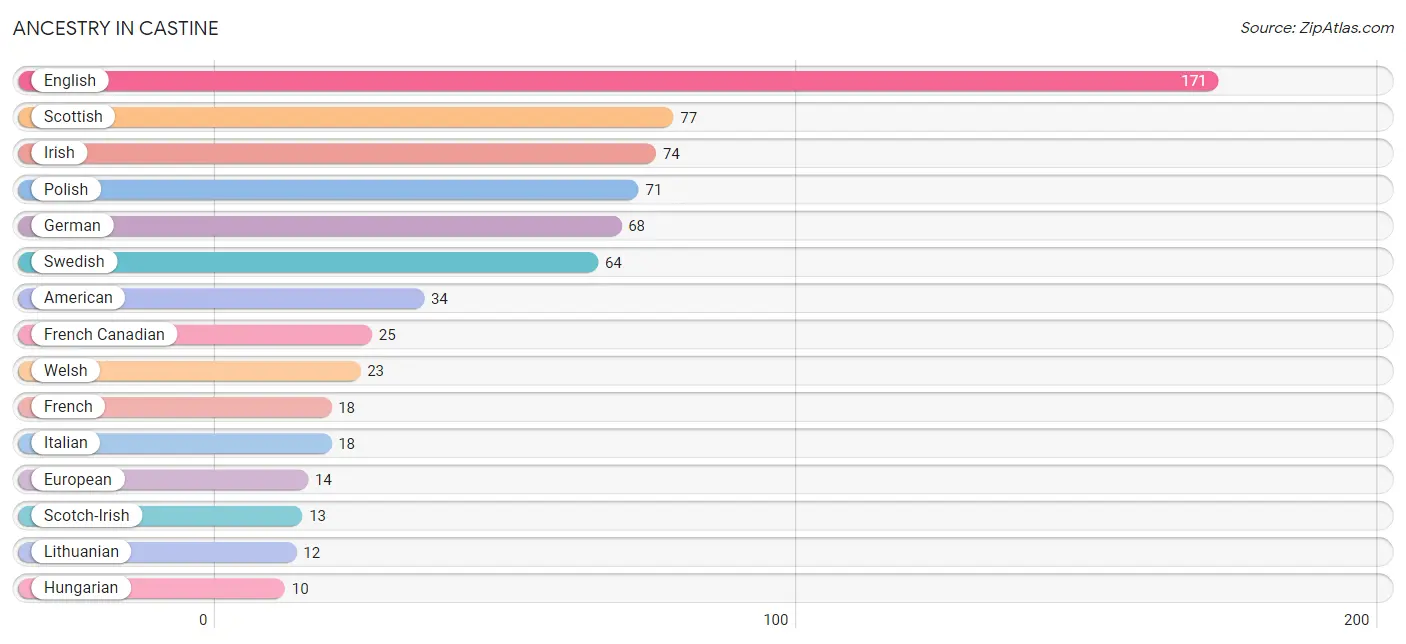
The most populous ancestries reported in Castine are English (171 | 18.5%), Scottish (77 | 8.3%), Irish (74 | 8.0%), Polish (71 | 7.7%), and German (68 | 7.4%), together accounting for 49.9% of all Castine residents.
| Ancestry | # Population | % Population |
| American | 34 | 3.7% |
| Armenian | 5 | 0.5% |
| British | 7 | 0.8% |
| Cajun | 5 | 0.5% |
| Canadian | 8 | 0.9% |
| Czechoslovakian | 7 | 0.8% |
| Danish | 7 | 0.8% |
| Dominican | 7 | 0.8% |
| Dutch | 3 | 0.3% |
| Eastern European | 8 | 0.9% |
| English | 171 | 18.5% |
| European | 14 | 1.5% |
| French | 18 | 1.9% |
| French Canadian | 25 | 2.7% |
| German | 68 | 7.4% |
| Hungarian | 10 | 1.1% |
| Irish | 74 | 8.0% |
| Israeli | 7 | 0.8% |
| Italian | 18 | 1.9% |
| Lithuanian | 12 | 1.3% |
| Norwegian | 9 | 1.0% |
| Polish | 71 | 7.7% |
| Scotch-Irish | 13 | 1.4% |
| Scottish | 77 | 8.3% |
| Spanish | 5 | 0.5% |
| Subsaharan African | 6 | 0.6% |
| Swedish | 64 | 6.9% |
| Swiss | 10 | 1.1% |
| Ugandan | 6 | 0.6% |
| Ukrainian | 8 | 0.9% |
| Welsh | 23 | 2.5% | View All 31 Rows |
Immigrants in Castine
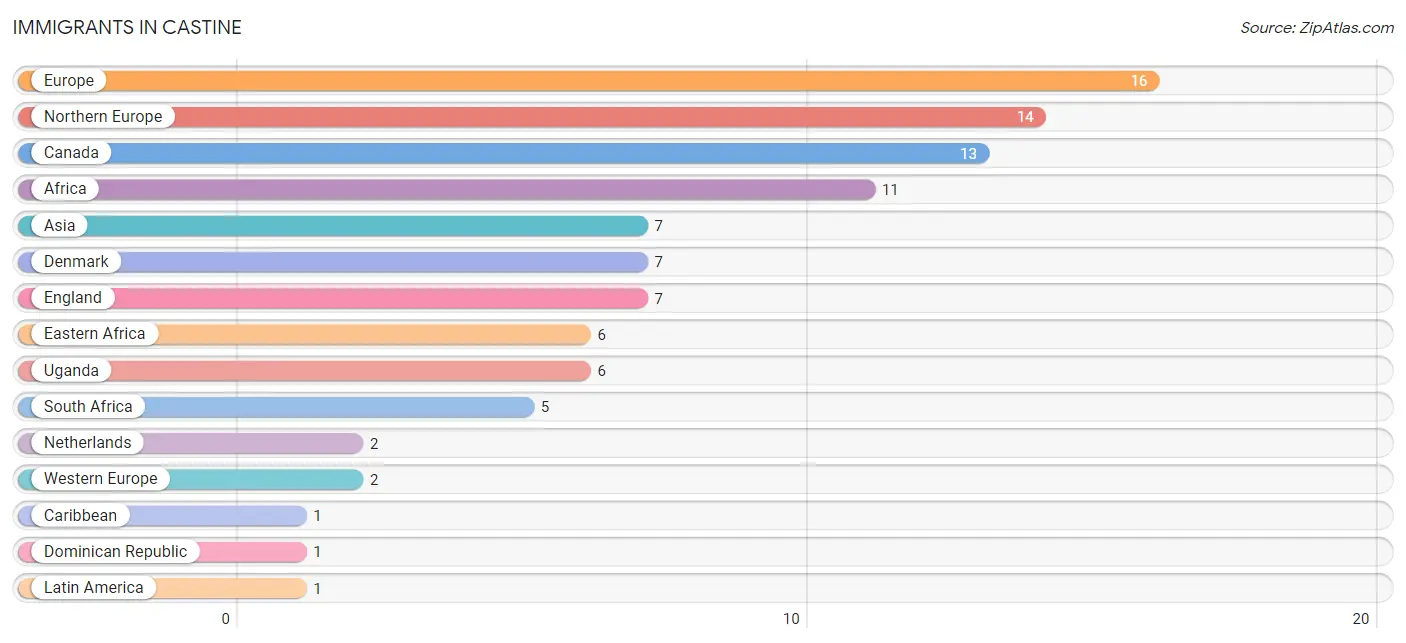
The most numerous immigrant groups reported in Castine came from Europe (16 | 1.7%), Northern Europe (14 | 1.5%), Canada (13 | 1.4%), Africa (11 | 1.2%), and Asia (7 | 0.8%), together accounting for 6.6% of all Castine residents.
| Immigration Origin | # Population | % Population |
| Africa | 11 | 1.2% |
| Asia | 7 | 0.8% |
| Canada | 13 | 1.4% |
| Caribbean | 1 | 0.1% |
| Denmark | 7 | 0.8% |
| Dominican Republic | 1 | 0.1% |
| Eastern Africa | 6 | 0.6% |
| England | 7 | 0.8% |
| Europe | 16 | 1.7% |
| Latin America | 1 | 0.1% |
| Netherlands | 2 | 0.2% |
| Northern Europe | 14 | 1.5% |
| South Africa | 5 | 0.5% |
| Uganda | 6 | 0.6% |
| Western Europe | 2 | 0.2% | View All 15 Rows |
Sex and Age in Castine
Sex and Age in Castine
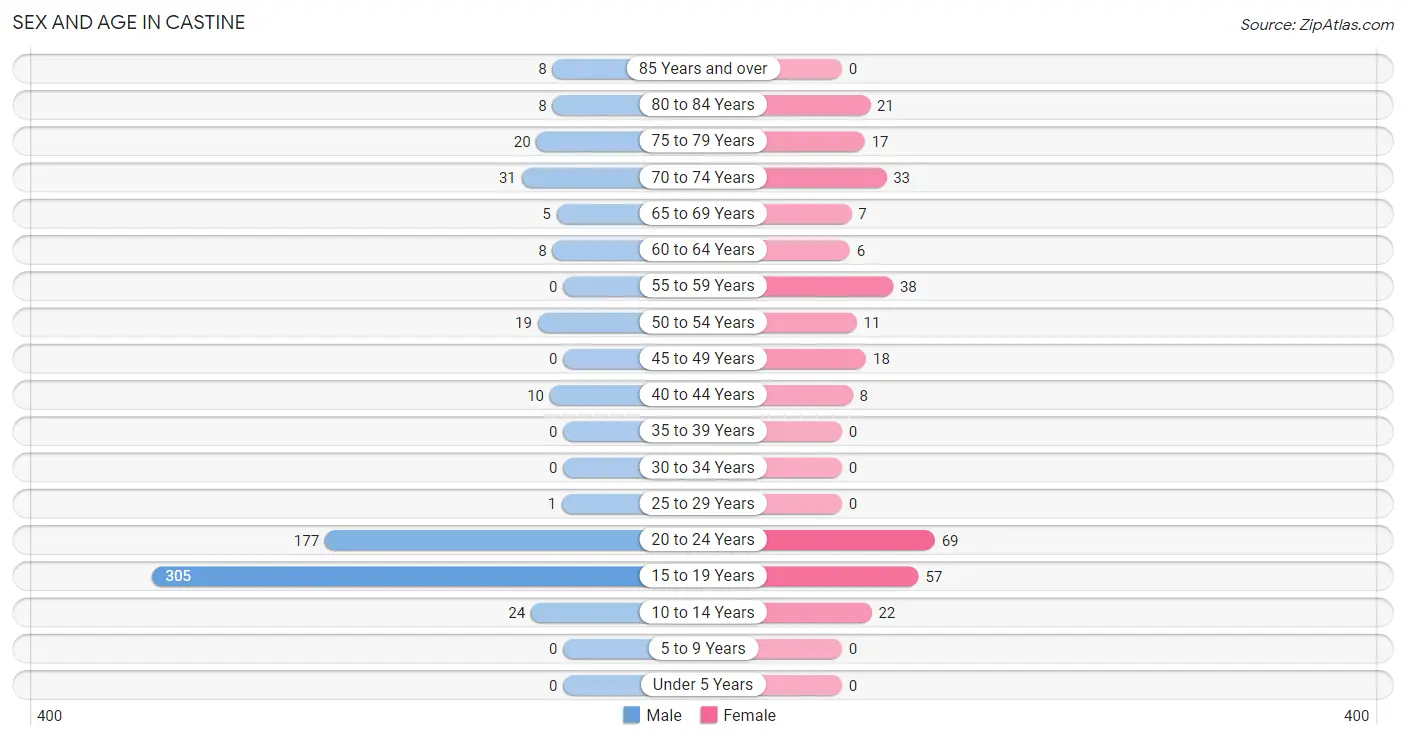
The most populous age groups in Castine are 15 to 19 Years (305 | 49.5%) for men and 20 to 24 Years (69 | 22.5%) for women.
| Age Bracket | Male | Female |
| Under 5 Years | 0 (0.0%) | 0 (0.0%) |
| 5 to 9 Years | 0 (0.0%) | 0 (0.0%) |
| 10 to 14 Years | 24 (3.9%) | 22 (7.2%) |
| 15 to 19 Years | 305 (49.5%) | 57 (18.6%) |
| 20 to 24 Years | 177 (28.7%) | 69 (22.5%) |
| 25 to 29 Years | 1 (0.2%) | 0 (0.0%) |
| 30 to 34 Years | 0 (0.0%) | 0 (0.0%) |
| 35 to 39 Years | 0 (0.0%) | 0 (0.0%) |
| 40 to 44 Years | 10 (1.6%) | 8 (2.6%) |
| 45 to 49 Years | 0 (0.0%) | 18 (5.9%) |
| 50 to 54 Years | 19 (3.1%) | 11 (3.6%) |
| 55 to 59 Years | 0 (0.0%) | 38 (12.4%) |
| 60 to 64 Years | 8 (1.3%) | 6 (1.9%) |
| 65 to 69 Years | 5 (0.8%) | 7 (2.3%) |
| 70 to 74 Years | 31 (5.0%) | 33 (10.7%) |
| 75 to 79 Years | 20 (3.3%) | 17 (5.5%) |
| 80 to 84 Years | 8 (1.3%) | 21 (6.8%) |
| 85 Years and over | 8 (1.3%) | 0 (0.0%) |
| Total | 616 (100.0%) | 307 (100.0%) |
Families and Households in Castine
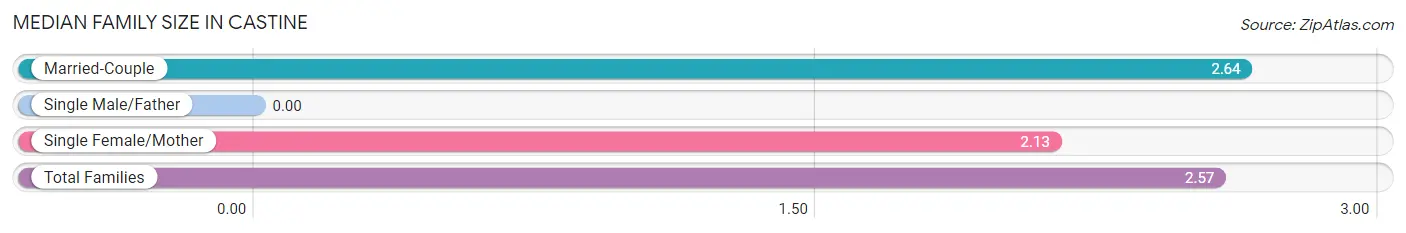
Median Family Size in Castine
| Family Type | # Families | Family Size |
| Married-Couple | 105 (86.8%) | 2.64 |
| Single Male/Father | 0 (0.0%) | - |
| Single Female/Mother | 16 (13.2%) | 2.13 |
| Total Families | 121 (100.0%) | 2.57 |
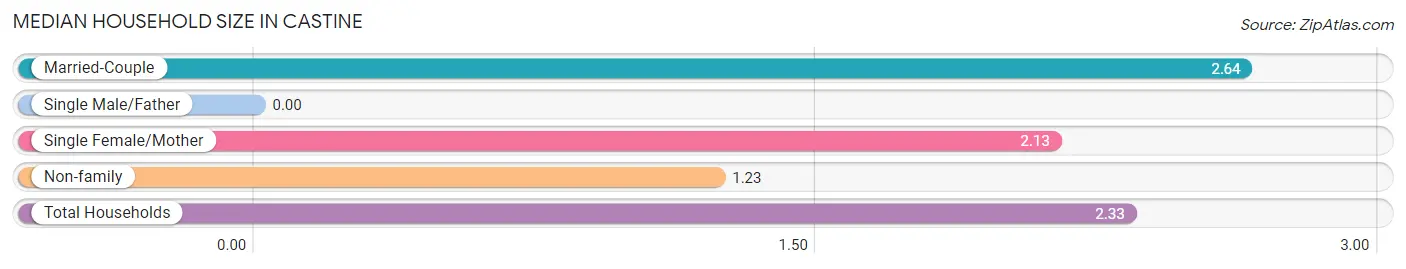
Median Household Size in Castine
| Household Type | # Households | Household Size |
| Married-Couple | 105 (71.4%) | 2.64 |
| Single Male/Father | 0 (0.0%) | - |
| Single Female/Mother | 16 (10.9%) | 2.13 |
| Non-family | 26 (17.7%) | 1.23 |
| Total Households | 147 (100.0%) | 2.33 |
Household Size by Marriage Status in Castine
Out of a total of 147 households in Castine, 121 (82.3%) are family households, while 26 (17.7%) are nonfamily households. The most numerous type of family households are 2-person households, comprising 86, and the most common type of nonfamily households are 1-person households, comprising 23.
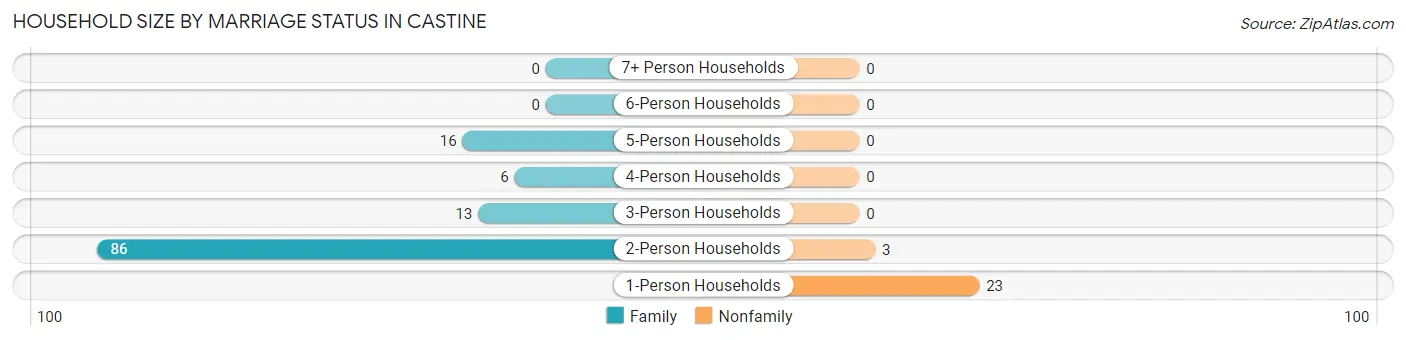
| Household Size | Family Households | Nonfamily Households |
| 1-Person Households | - | 23 (15.7%) |
| 2-Person Households | 86 (58.5%) | 3 (2.0%) |
| 3-Person Households | 13 (8.8%) | 0 (0.0%) |
| 4-Person Households | 6 (4.1%) | 0 (0.0%) |
| 5-Person Households | 16 (10.9%) | 0 (0.0%) |
| 6-Person Households | 0 (0.0%) | 0 (0.0%) |
| 7+ Person Households | 0 (0.0%) | 0 (0.0%) |
| Total | 121 (82.3%) | 26 (17.7%) |
Female Fertility in Castine
Fertility by Age in Castine
| Age Bracket | Women with Births | Births / 1,000 Women |
| 15 to 19 years | 0 (0.0%) | 0.0 |
| 20 to 34 years | 0 (0.0%) | 0.0 |
| 35 to 50 years | 0 (0.0%) | 0.0 |
| Total | 0 (0.0%) | 0.0 |
Fertility by Age by Marriage Status in Castine
| Age Bracket | Married | Unmarried |
| 15 to 19 years | 0 (0.0%) | 0 (0.0%) |
| 20 to 34 years | 0 (0.0%) | 0 (0.0%) |
| 35 to 50 years | 0 (0.0%) | 0 (0.0%) |
| Total | 0 (0.0%) | 0 (0.0%) |
Fertility by Education in Castine
| Educational Attainment | Women with Births | Births / 1,000 Women |
| Less than High School | 0 (0.0%) | 0.0 |
| High School Diploma | 0 (0.0%) | 0.0 |
| College or Associate's Degree | 0 (0.0%) | 0.0 |
| Bachelor's Degree | 0 (0.0%) | 0.0 |
| Graduate Degree | 0 (0.0%) | 0.0 |
| Total | 0 (0.0%) | 0.0 |
Fertility by Education by Marriage Status in Castine
| Educational Attainment | Married | Unmarried |
| Less than High School | 0 (0.0%) | 0 (0.0%) |
| High School Diploma | 0 (0.0%) | 0 (0.0%) |
| College or Associate's Degree | 0 (0.0%) | 0 (0.0%) |
| Bachelor's Degree | 0 (0.0%) | 0 (0.0%) |
| Graduate Degree | 0 (0.0%) | 0 (0.0%) |
| Total | 0 (0.0%) | 0 (0.0%) |
Employment Characteristics in Castine
Employment by Class of Employer in Castine
Among the 398 employed individuals in Castine, private company employees (225 | 56.5%), not-for-profit organizations (120 | 30.1%), and state government employees (49 | 12.3%) make up the most common classes of employment.
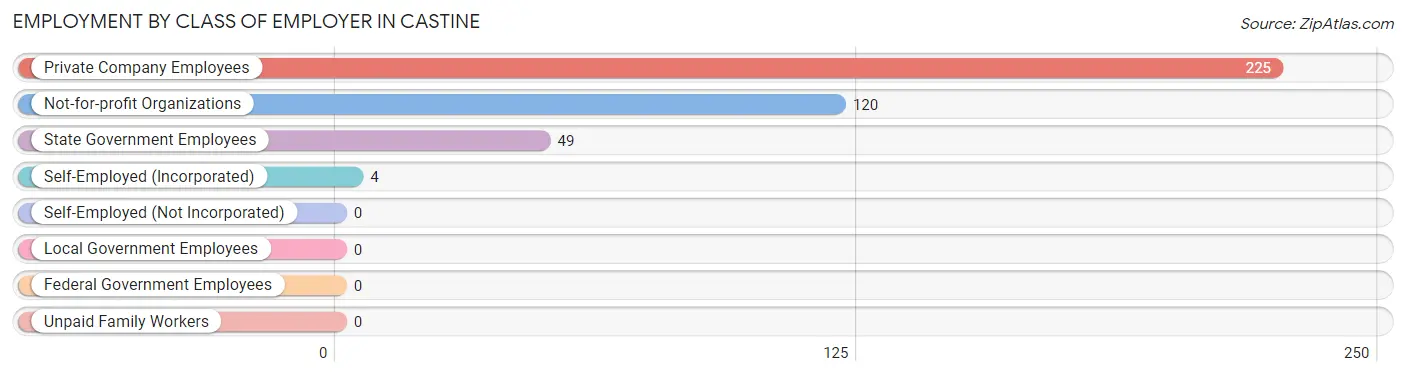
| Employer Class | # Employees | % Employees |
| Private Company Employees | 225 | 56.5% |
| Self-Employed (Incorporated) | 4 | 1.0% |
| Self-Employed (Not Incorporated) | 0 | 0.0% |
| Not-for-profit Organizations | 120 | 30.1% |
| Local Government Employees | 0 | 0.0% |
| State Government Employees | 49 | 12.3% |
| Federal Government Employees | 0 | 0.0% |
| Unpaid Family Workers | 0 | 0.0% |
| Total | 398 | 100.0% |
Employment Status by Age in Castine
According to the labor force statistics for Castine, out of the total population over 16 years of age (877), 48.8% or 428 individuals are in the labor force, with 2.3% or 10 of them unemployed. The age group with the highest labor force participation rate is 25 to 29 years, with 100.0% or 1 individuals in the labor force. Within the labor force, the 25 to 29 years age range has the highest percentage of unemployed individuals, with 100.0% or 1 of them being unemployed.
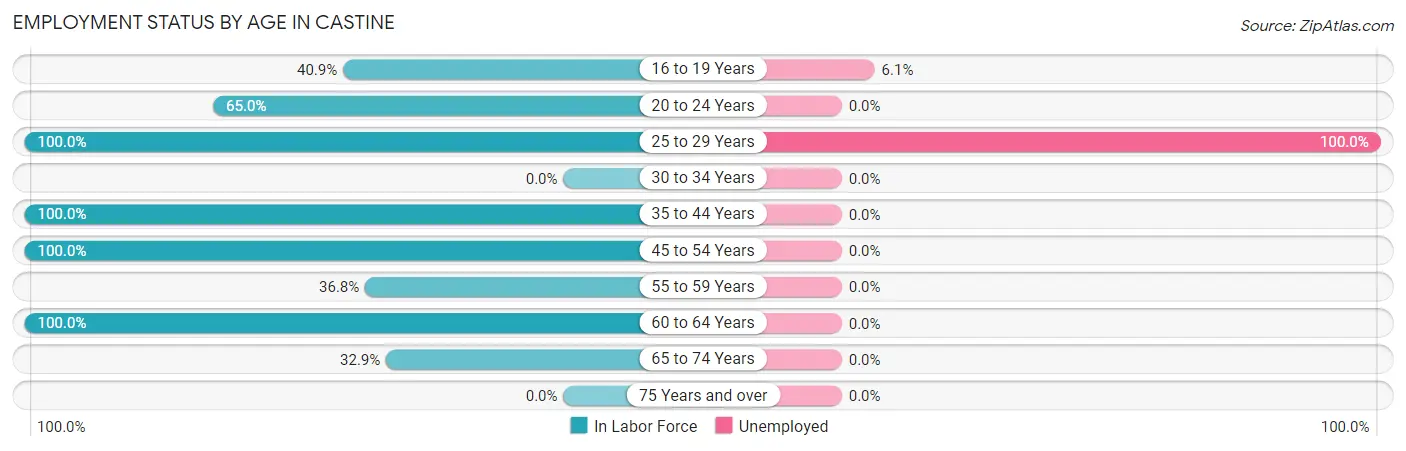
| Age Bracket | In Labor Force | Unemployed |
| 16 to 19 Years | 148 (40.9%) | 9 (6.1%) |
| 20 to 24 Years | 160 (65.0%) | 0 (0.0%) |
| 25 to 29 Years | 1 (100.0%) | 1 (100.0%) |
| 30 to 34 Years | 0 (0.0%) | 0 (0.0%) |
| 35 to 44 Years | 18 (100.0%) | 0 (0.0%) |
| 45 to 54 Years | 48 (100.0%) | 0 (0.0%) |
| 55 to 59 Years | 14 (36.8%) | 0 (0.0%) |
| 60 to 64 Years | 14 (100.0%) | 0 (0.0%) |
| 65 to 74 Years | 25 (32.9%) | 0 (0.0%) |
| 75 Years and over | 0 (0.0%) | 0 (0.0%) |
| Total | 428 (48.8%) | 10 (2.3%) |
Employment Status by Educational Attainment in Castine
According to labor force statistics for Castine, 79.8% of individuals (95) out of the total population between 25 and 64 years of age (119) are in the labor force, with 1.1% or 1 of them being unemployed. The group with the highest labor force participation rate are those with the educational attainment of high school diploma, with 100.0% or 6 individuals in the labor force. Within the labor force, individuals with college / associate degree education have the highest percentage of unemployment, with 5.9% or 1 of them being unemployed.
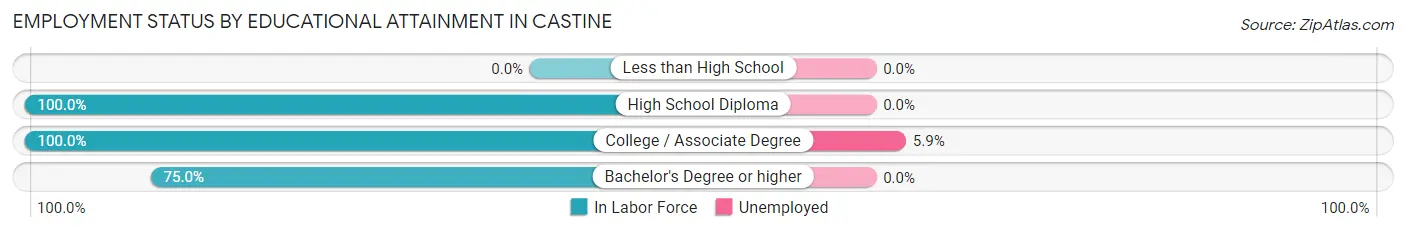
| Educational Attainment | In Labor Force | Unemployed |
| Less than High School | 0 (0.0%) | 0 (0.0%) |
| High School Diploma | 6 (100.0%) | 0 (0.0%) |
| College / Associate Degree | 17 (100.0%) | 1 (5.9%) |
| Bachelor's Degree or higher | 72 (75.0%) | 0 (0.0%) |
| Total | 95 (79.8%) | 1 (1.1%) |
Employment Occupations by Sex in Castine
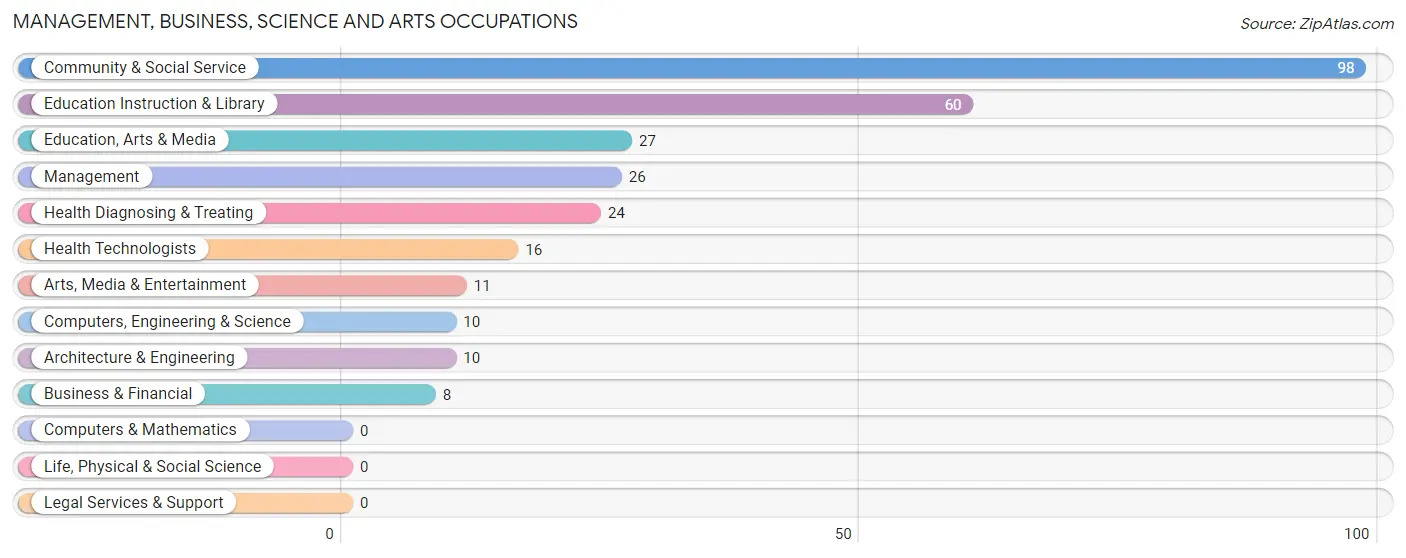
Management, Business, Science and Arts Occupations
The most common Management, Business, Science and Arts occupations in Castine are Community & Social Service (98 | 23.4%), Education Instruction & Library (60 | 14.3%), Education, Arts & Media (27 | 6.5%), Management (26 | 6.2%), and Health Diagnosing & Treating (24 | 5.7%).
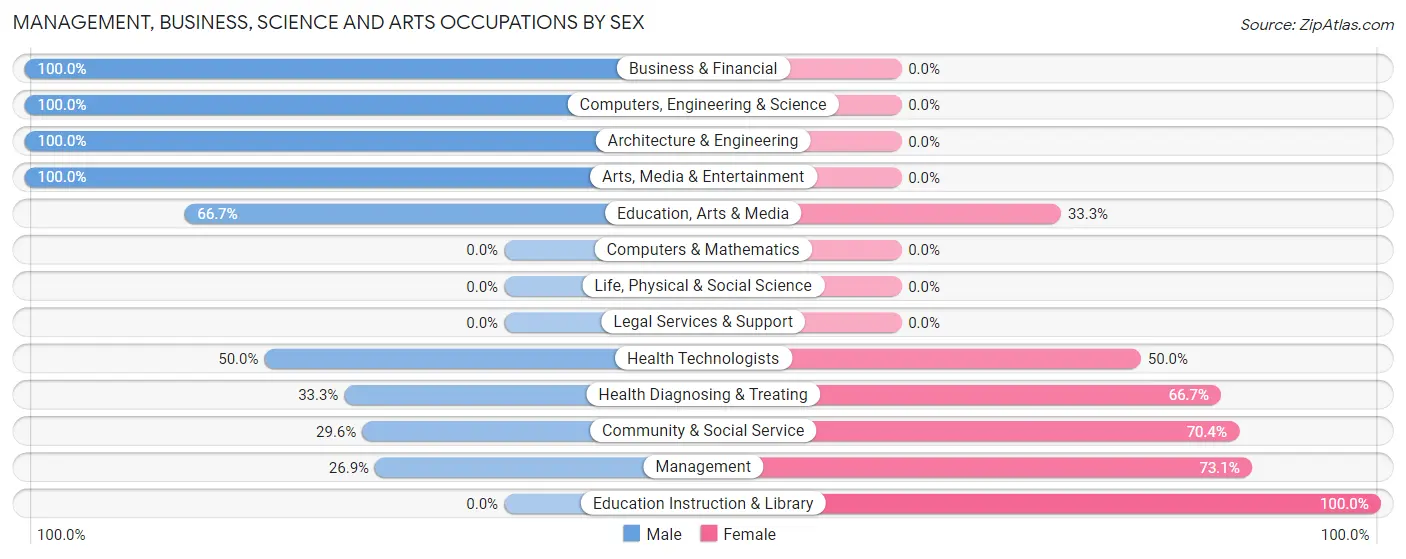
Management, Business, Science and Arts Occupations by Sex
Within the Management, Business, Science and Arts occupations in Castine, the most male-oriented occupations are Business & Financial (100.0%), Computers, Engineering & Science (100.0%), and Architecture & Engineering (100.0%), while the most female-oriented occupations are Education Instruction & Library (100.0%), Management (73.1%), and Community & Social Service (70.4%).
| Occupation | Male | Female |
| Management | 7 (26.9%) | 19 (73.1%) |
| Business & Financial | 8 (100.0%) | 0 (0.0%) |
| Computers, Engineering & Science | 10 (100.0%) | 0 (0.0%) |
| Computers & Mathematics | 0 (0.0%) | 0 (0.0%) |
| Architecture & Engineering | 10 (100.0%) | 0 (0.0%) |
| Life, Physical & Social Science | 0 (0.0%) | 0 (0.0%) |
| Community & Social Service | 29 (29.6%) | 69 (70.4%) |
| Education, Arts & Media | 18 (66.7%) | 9 (33.3%) |
| Legal Services & Support | 0 (0.0%) | 0 (0.0%) |
| Education Instruction & Library | 0 (0.0%) | 60 (100.0%) |
| Arts, Media & Entertainment | 11 (100.0%) | 0 (0.0%) |
| Health Diagnosing & Treating | 8 (33.3%) | 16 (66.7%) |
| Health Technologists | 8 (50.0%) | 8 (50.0%) |
| Total (Category) | 62 (37.3%) | 104 (62.6%) |
| Total (Overall) | 251 (60.1%) | 167 (40.0%) |
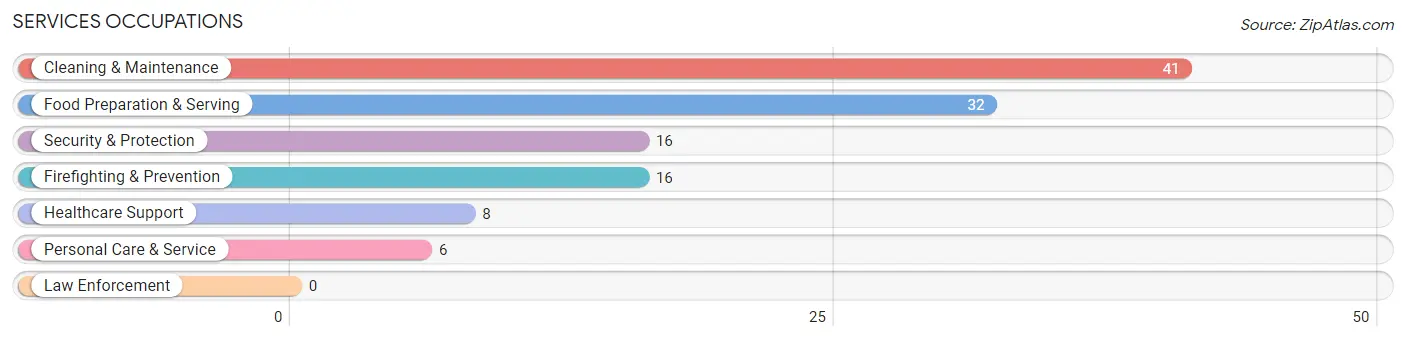
Services Occupations
The most common Services occupations in Castine are Cleaning & Maintenance (41 | 9.8%), Food Preparation & Serving (32 | 7.7%), Security & Protection (16 | 3.8%), Firefighting & Prevention (16 | 3.8%), and Healthcare Support (8 | 1.9%).
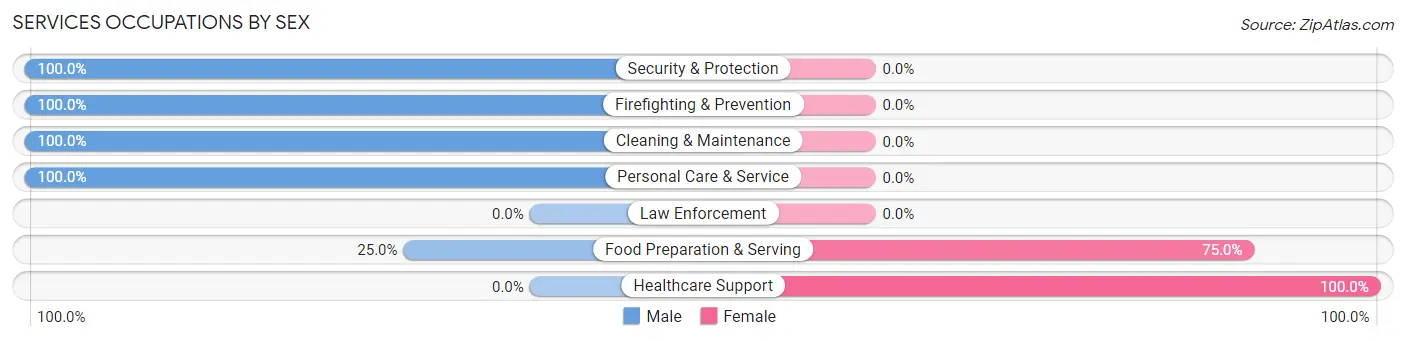
Services Occupations by Sex
Within the Services occupations in Castine, the most male-oriented occupations are Security & Protection (100.0%), Firefighting & Prevention (100.0%), and Cleaning & Maintenance (100.0%), while the most female-oriented occupations are Healthcare Support (100.0%), and Food Preparation & Serving (75.0%).
| Occupation | Male | Female |
| Healthcare Support | 0 (0.0%) | 8 (100.0%) |
| Security & Protection | 16 (100.0%) | 0 (0.0%) |
| Firefighting & Prevention | 16 (100.0%) | 0 (0.0%) |
| Law Enforcement | 0 (0.0%) | 0 (0.0%) |
| Food Preparation & Serving | 8 (25.0%) | 24 (75.0%) |
| Cleaning & Maintenance | 41 (100.0%) | 0 (0.0%) |
| Personal Care & Service | 6 (100.0%) | 0 (0.0%) |
| Total (Category) | 71 (68.9%) | 32 (31.1%) |
| Total (Overall) | 251 (60.1%) | 167 (40.0%) |
Sales and Office Occupations
The most common Sales and Office occupations in Castine are Office & Administration (51 | 12.2%), and Sales & Related (31 | 7.4%).
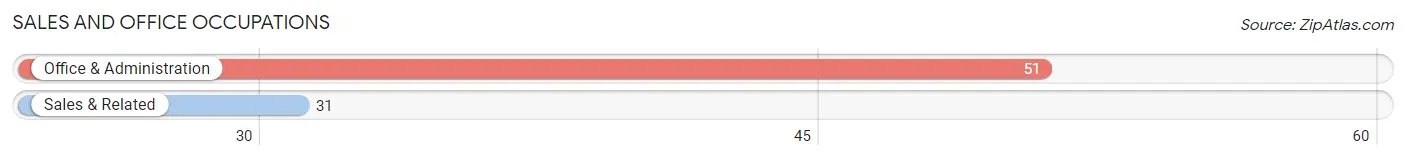
Sales and Office Occupations by Sex
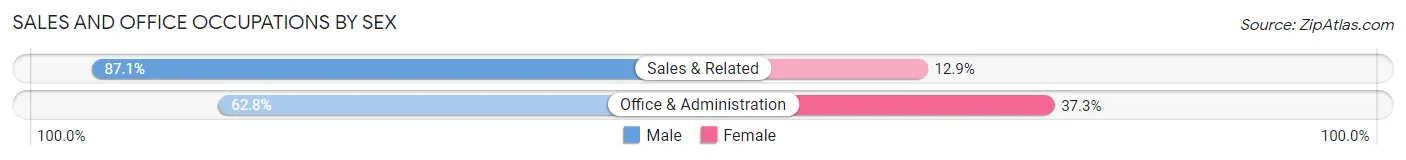
| Occupation | Male | Female |
| Sales & Related | 27 (87.1%) | 4 (12.9%) |
| Office & Administration | 32 (62.7%) | 19 (37.2%) |
| Total (Category) | 59 (72.0%) | 23 (28.1%) |
| Total (Overall) | 251 (60.1%) | 167 (40.0%) |
Natural Resources, Construction and Maintenance Occupations
The most common Natural Resources, Construction and Maintenance occupations in Castine are , and Construction & Extraction (19 | 4.5%).
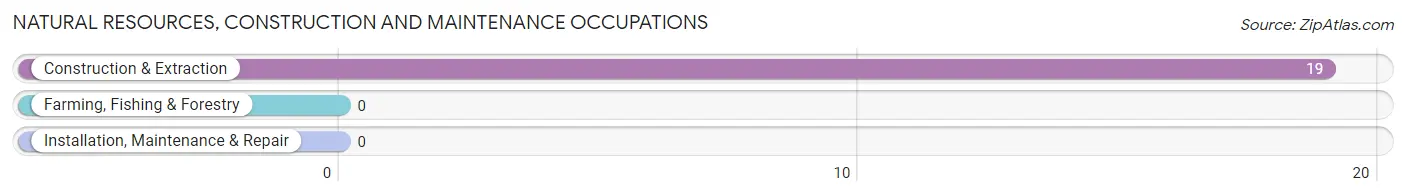
Natural Resources, Construction and Maintenance Occupations by Sex
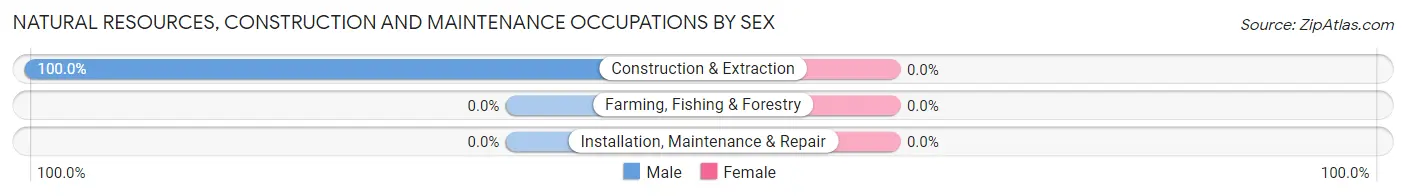
| Occupation | Male | Female |
| Farming, Fishing & Forestry | 0 (0.0%) | 0 (0.0%) |
| Construction & Extraction | 19 (100.0%) | 0 (0.0%) |
| Installation, Maintenance & Repair | 0 (0.0%) | 0 (0.0%) |
| Total (Category) | 19 (100.0%) | 0 (0.0%) |
| Total (Overall) | 251 (60.1%) | 167 (40.0%) |
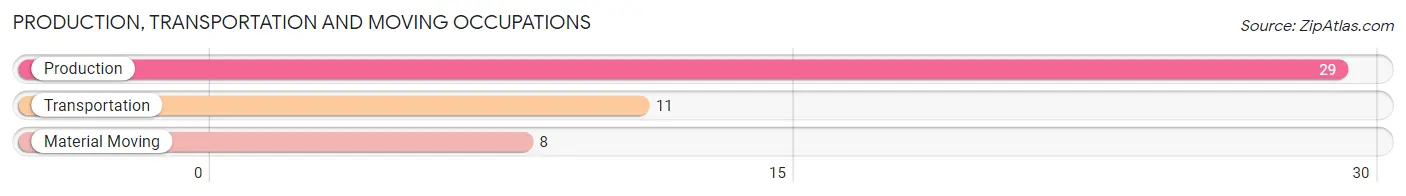
Production, Transportation and Moving Occupations
The most common Production, Transportation and Moving occupations in Castine are Production (29 | 6.9%), Transportation (11 | 2.6%), and Material Moving (8 | 1.9%).
Production, Transportation and Moving Occupations by Sex
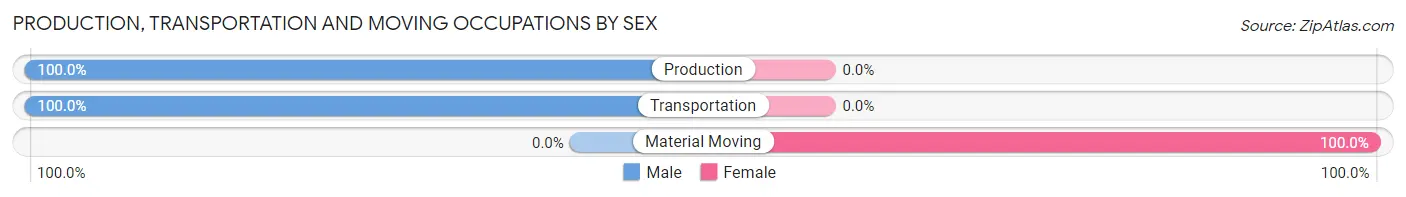
| Occupation | Male | Female |
| Production | 29 (100.0%) | 0 (0.0%) |
| Transportation | 11 (100.0%) | 0 (0.0%) |
| Material Moving | 0 (0.0%) | 8 (100.0%) |
| Total (Category) | 40 (83.3%) | 8 (16.7%) |
| Total (Overall) | 251 (60.1%) | 167 (40.0%) |
Employment Industries by Sex in Castine
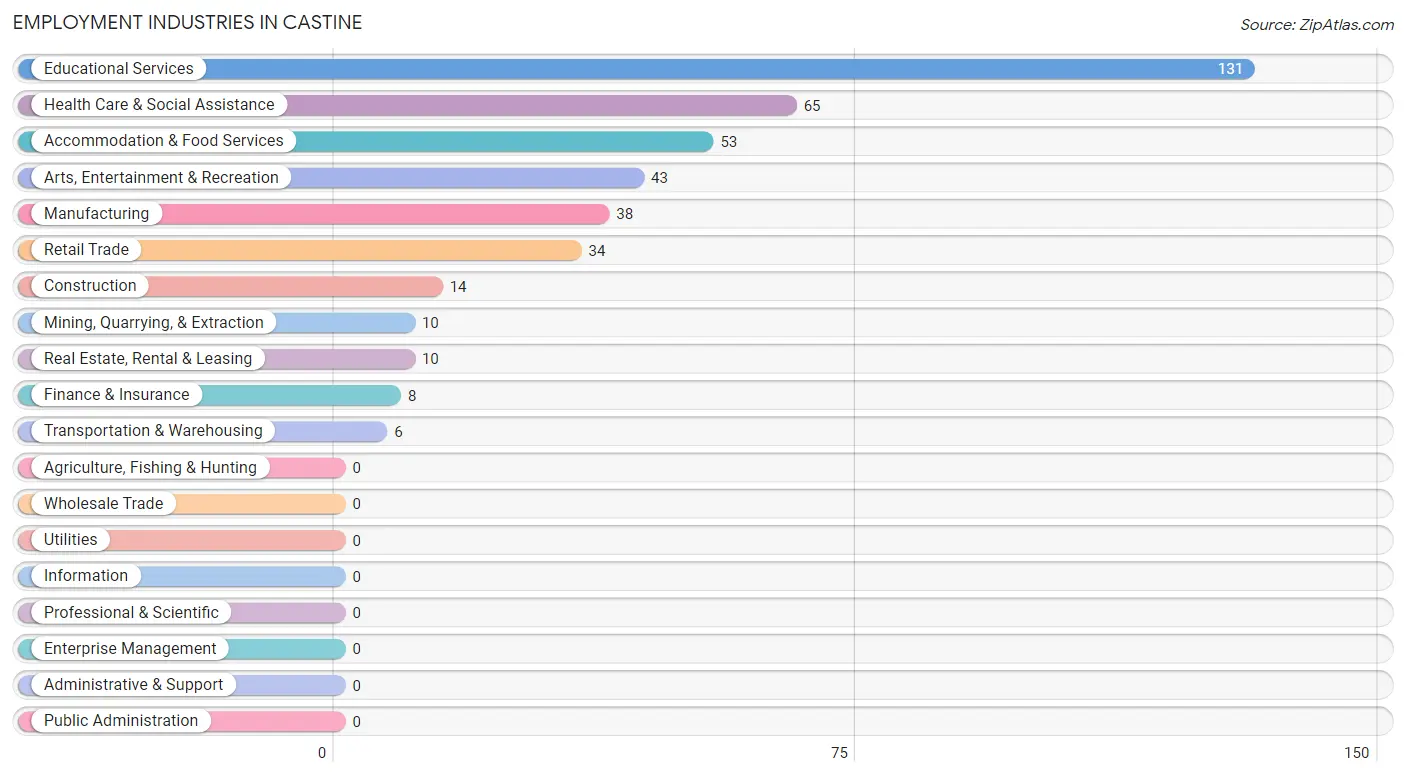
Employment Industries in Castine
The major employment industries in Castine include Educational Services (131 | 31.3%), Health Care & Social Assistance (65 | 15.5%), Accommodation & Food Services (53 | 12.7%), Arts, Entertainment & Recreation (43 | 10.3%), and Manufacturing (38 | 9.1%).
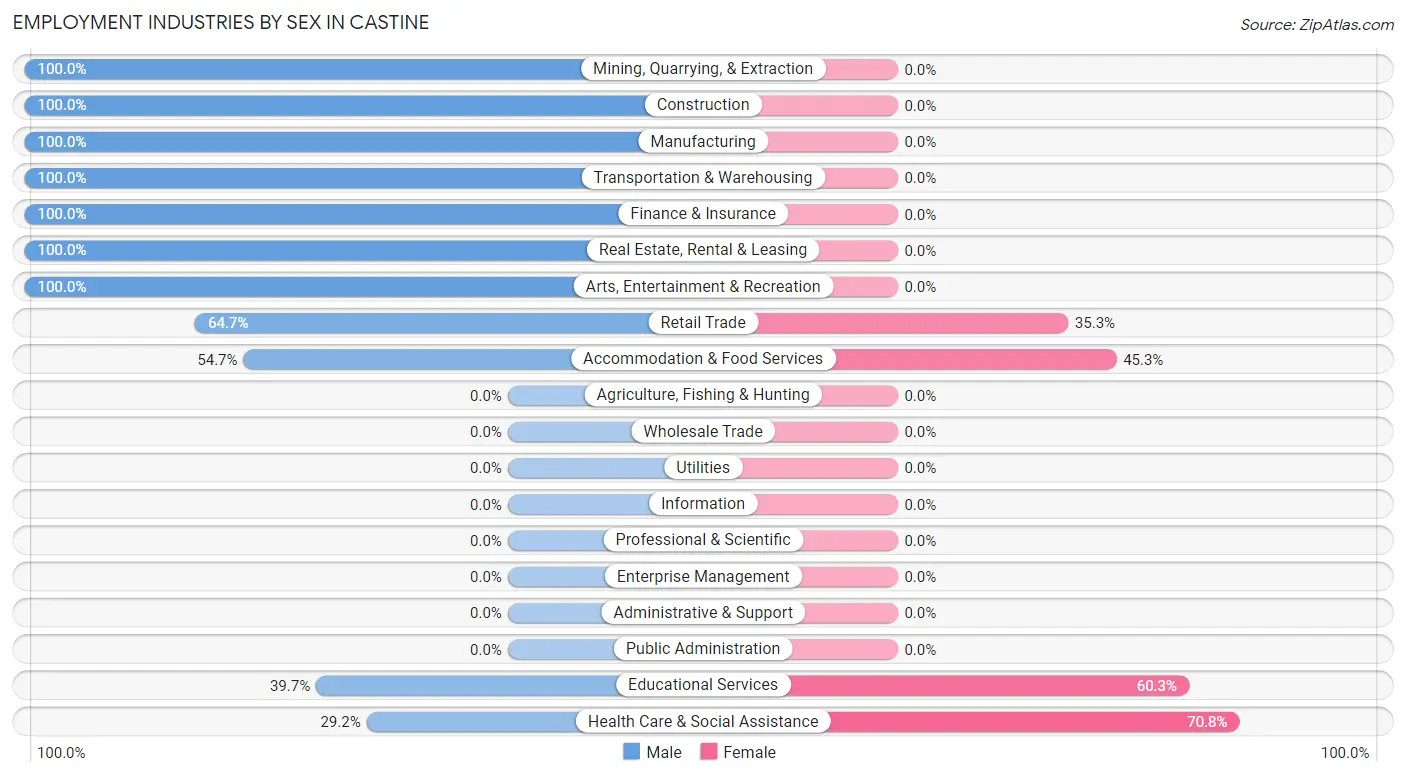
Employment Industries by Sex in Castine
The Castine industries that see more men than women are Mining, Quarrying, & Extraction (100.0%), Construction (100.0%), and Manufacturing (100.0%), whereas the industries that tend to have a higher number of women are Health Care & Social Assistance (70.8%), Educational Services (60.3%), and Accommodation & Food Services (45.3%).
| Industry | Male | Female |
| Agriculture, Fishing & Hunting | 0 (0.0%) | 0 (0.0%) |
| Mining, Quarrying, & Extraction | 10 (100.0%) | 0 (0.0%) |
| Construction | 14 (100.0%) | 0 (0.0%) |
| Manufacturing | 38 (100.0%) | 0 (0.0%) |
| Wholesale Trade | 0 (0.0%) | 0 (0.0%) |
| Retail Trade | 22 (64.7%) | 12 (35.3%) |
| Transportation & Warehousing | 6 (100.0%) | 0 (0.0%) |
| Utilities | 0 (0.0%) | 0 (0.0%) |
| Information | 0 (0.0%) | 0 (0.0%) |
| Finance & Insurance | 8 (100.0%) | 0 (0.0%) |
| Real Estate, Rental & Leasing | 10 (100.0%) | 0 (0.0%) |
| Professional & Scientific | 0 (0.0%) | 0 (0.0%) |
| Enterprise Management | 0 (0.0%) | 0 (0.0%) |
| Administrative & Support | 0 (0.0%) | 0 (0.0%) |
| Educational Services | 52 (39.7%) | 79 (60.3%) |
| Health Care & Social Assistance | 19 (29.2%) | 46 (70.8%) |
| Arts, Entertainment & Recreation | 43 (100.0%) | 0 (0.0%) |
| Accommodation & Food Services | 29 (54.7%) | 24 (45.3%) |
| Public Administration | 0 (0.0%) | 0 (0.0%) |
| Total | 251 (60.1%) | 167 (40.0%) |
Education in Castine
School Enrollment in Castine
The most common levels of schooling among the 652 students in Castine are college / undergraduate (575 | 88.2%), high school (40 | 6.1%), and middle school (37 | 5.7%).
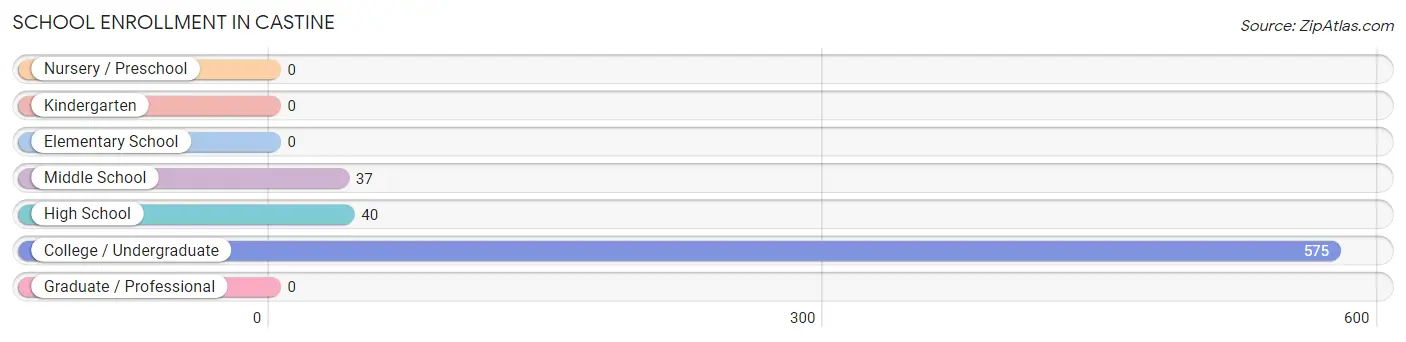
| School Level | # Students | % Students |
| Nursery / Preschool | 0 | 0.0% |
| Kindergarten | 0 | 0.0% |
| Elementary School | 0 | 0.0% |
| Middle School | 37 | 5.7% |
| High School | 40 | 6.1% |
| College / Undergraduate | 575 | 88.2% |
| Graduate / Professional | 0 | 0.0% |
| Total | 652 | 100.0% |
School Enrollment by Age by Funding Source in Castine
Out of a total of 652 students who are enrolled in schools in Castine, 61 (9.4%) attend a private institution, while the remaining 591 (90.6%) are enrolled in public schools. The age group of 10 to 14 year olds has the highest likelihood of being enrolled in private schools, with 5 (10.9% in the age bracket) enrolled. Conversely, the age group of 15 to 17 year olds has the lowest likelihood of being enrolled in a private school, with 27 (100.0% in the age bracket) attending a public institution.

| Age Bracket | Public School | Private School |
| 3 to 4 Year Olds | 0 (0.0%) | 0 (0.0%) |
| 5 to 9 Year Old | 0 (0.0%) | 0 (0.0%) |
| 10 to 14 Year Olds | 41 (89.1%) | 5 (10.9%) |
| 15 to 17 Year Olds | 27 (100.0%) | 0 (0.0%) |
| 18 to 19 Year Olds | 300 (89.8%) | 34 (10.2%) |
| 20 to 24 Year Olds | 223 (91.0%) | 22 (9.0%) |
| 25 to 34 Year Olds | 0 (0.0%) | 0 (0.0%) |
| 35 Years and over | 0 (0.0%) | 0 (0.0%) |
| Total | 591 (90.6%) | 61 (9.4%) |
Educational Attainment by Field of Study in Castine
Literature & languages (49 | 21.7%), social sciences (47 | 20.8%), visual & performing arts (25 | 11.1%), liberal arts & history (18 | 8.0%), and engineering (17 | 7.5%) are the most common fields of study among 226 individuals in Castine who have obtained a bachelor's degree or higher.
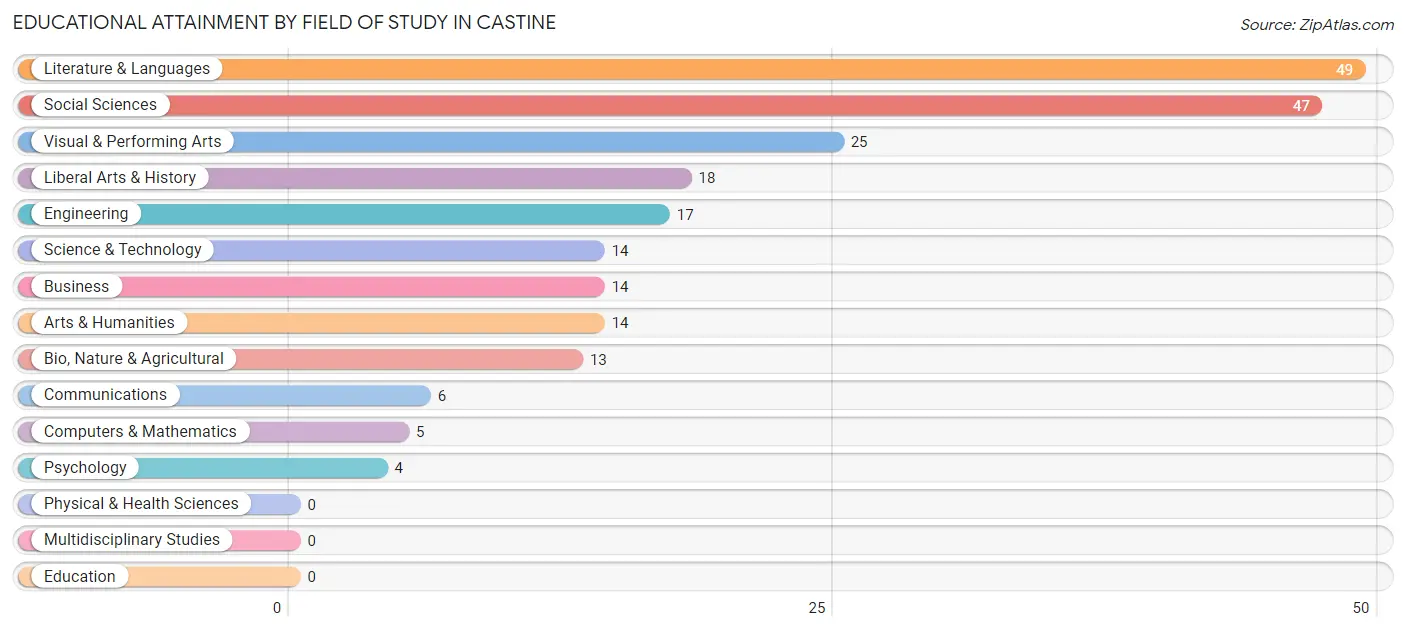
| Field of Study | # Graduates | % Graduates |
| Computers & Mathematics | 5 | 2.2% |
| Bio, Nature & Agricultural | 13 | 5.8% |
| Physical & Health Sciences | 0 | 0.0% |
| Psychology | 4 | 1.8% |
| Social Sciences | 47 | 20.8% |
| Engineering | 17 | 7.5% |
| Multidisciplinary Studies | 0 | 0.0% |
| Science & Technology | 14 | 6.2% |
| Business | 14 | 6.2% |
| Education | 0 | 0.0% |
| Literature & Languages | 49 | 21.7% |
| Liberal Arts & History | 18 | 8.0% |
| Visual & Performing Arts | 25 | 11.1% |
| Communications | 6 | 2.6% |
| Arts & Humanities | 14 | 6.2% |
| Total | 226 | 100.0% |
Transportation & Commute in Castine
Vehicle Availability by Sex in Castine
The most prevalent vehicle ownership categories in Castine are males with 2 vehicles (21, accounting for 42.9%) and females with 2 vehicles (29, making up 30.0%).
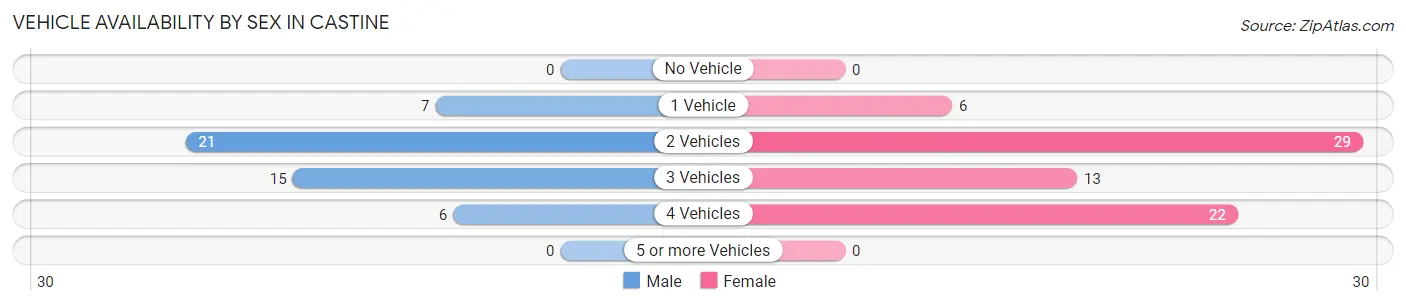
| Vehicles Available | Male | Female |
| No Vehicle | 0 (0.0%) | 0 (0.0%) |
| 1 Vehicle | 7 (14.3%) | 6 (8.6%) |
| 2 Vehicles | 21 (42.9%) | 29 (41.4%) |
| 3 Vehicles | 15 (30.6%) | 13 (18.6%) |
| 4 Vehicles | 6 (12.2%) | 22 (31.4%) |
| 5 or more Vehicles | 0 (0.0%) | 0 (0.0%) |
| Total | 49 (100.0%) | 70 (100.0%) |
Commute Time in Castine
The most frequently occuring commute durations in Castine are less than 5 minutes (102 commuters, 30.1%), 5 to 9 minutes (96 commuters, 28.3%), and 20 to 24 minutes (45 commuters, 13.3%).
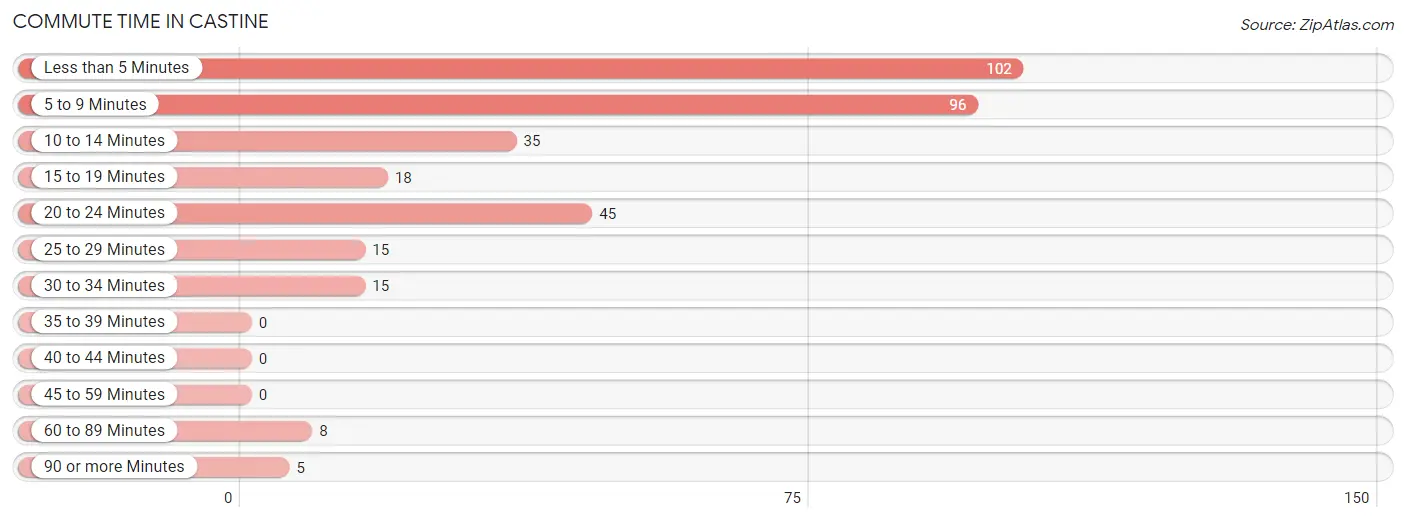
| Commute Time | # Commuters | % Commuters |
| Less than 5 Minutes | 102 | 30.1% |
| 5 to 9 Minutes | 96 | 28.3% |
| 10 to 14 Minutes | 35 | 10.3% |
| 15 to 19 Minutes | 18 | 5.3% |
| 20 to 24 Minutes | 45 | 13.3% |
| 25 to 29 Minutes | 15 | 4.4% |
| 30 to 34 Minutes | 15 | 4.4% |
| 35 to 39 Minutes | 0 | 0.0% |
| 40 to 44 Minutes | 0 | 0.0% |
| 45 to 59 Minutes | 0 | 0.0% |
| 60 to 89 Minutes | 8 | 2.4% |
| 90 or more Minutes | 5 | 1.5% |
Commute Time by Sex in Castine
The most common commute times in Castine are 5 to 9 minutes (58 commuters, 25.9%) for males and less than 5 minutes (48 commuters, 41.7%) for females.
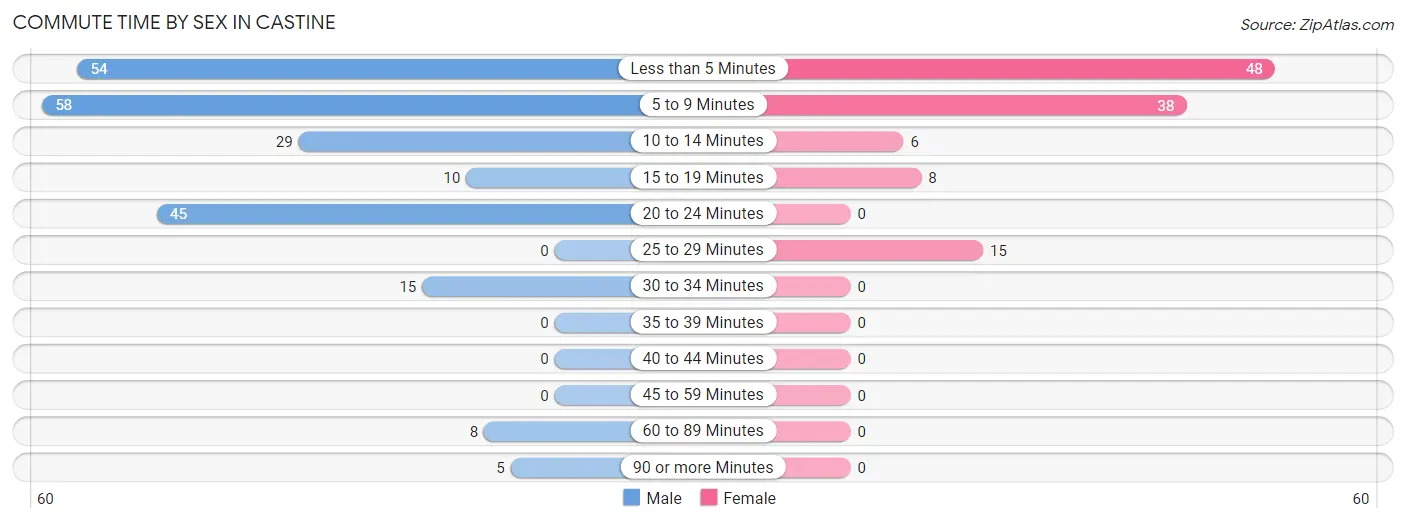
| Commute Time | Male | Female |
| Less than 5 Minutes | 54 (24.1%) | 48 (41.7%) |
| 5 to 9 Minutes | 58 (25.9%) | 38 (33.0%) |
| 10 to 14 Minutes | 29 (13.0%) | 6 (5.2%) |
| 15 to 19 Minutes | 10 (4.5%) | 8 (7.0%) |
| 20 to 24 Minutes | 45 (20.1%) | 0 (0.0%) |
| 25 to 29 Minutes | 0 (0.0%) | 15 (13.0%) |
| 30 to 34 Minutes | 15 (6.7%) | 0 (0.0%) |
| 35 to 39 Minutes | 0 (0.0%) | 0 (0.0%) |
| 40 to 44 Minutes | 0 (0.0%) | 0 (0.0%) |
| 45 to 59 Minutes | 0 (0.0%) | 0 (0.0%) |
| 60 to 89 Minutes | 8 (3.6%) | 0 (0.0%) |
| 90 or more Minutes | 5 (2.2%) | 0 (0.0%) |
Time of Departure to Work by Sex in Castine
The most frequent times of departure to work in Castine are 12:00 PM to 3:59 PM (65, 29.0%) for males and 12:00 PM to 3:59 PM (58, 50.4%) for females.
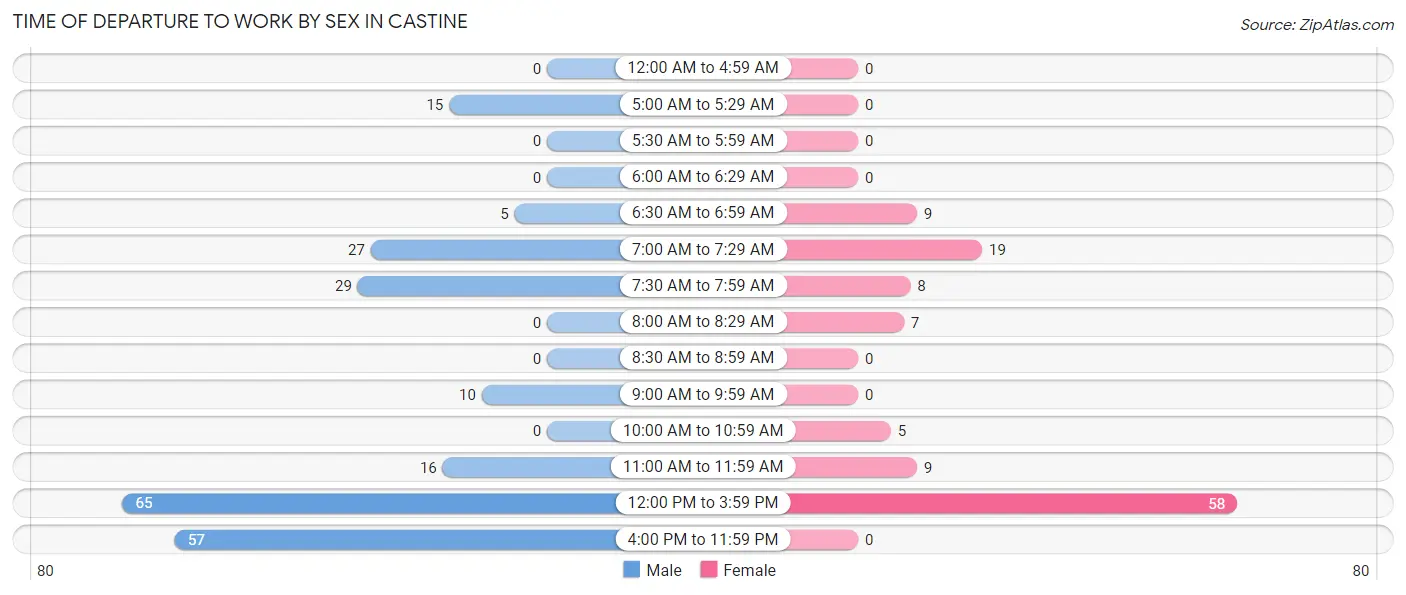
| Time of Departure | Male | Female |
| 12:00 AM to 4:59 AM | 0 (0.0%) | 0 (0.0%) |
| 5:00 AM to 5:29 AM | 15 (6.7%) | 0 (0.0%) |
| 5:30 AM to 5:59 AM | 0 (0.0%) | 0 (0.0%) |
| 6:00 AM to 6:29 AM | 0 (0.0%) | 0 (0.0%) |
| 6:30 AM to 6:59 AM | 5 (2.2%) | 9 (7.8%) |
| 7:00 AM to 7:29 AM | 27 (12.0%) | 19 (16.5%) |
| 7:30 AM to 7:59 AM | 29 (13.0%) | 8 (7.0%) |
| 8:00 AM to 8:29 AM | 0 (0.0%) | 7 (6.1%) |
| 8:30 AM to 8:59 AM | 0 (0.0%) | 0 (0.0%) |
| 9:00 AM to 9:59 AM | 10 (4.5%) | 0 (0.0%) |
| 10:00 AM to 10:59 AM | 0 (0.0%) | 5 (4.3%) |
| 11:00 AM to 11:59 AM | 16 (7.1%) | 9 (7.8%) |
| 12:00 PM to 3:59 PM | 65 (29.0%) | 58 (50.4%) |
| 4:00 PM to 11:59 PM | 57 (25.5%) | 0 (0.0%) |
| Total | 224 (100.0%) | 115 (100.0%) |
Housing Occupancy in Castine
Occupancy by Ownership in Castine
Of the total 147 dwellings in Castine, owner-occupied units account for 123 (83.7%), while renter-occupied units make up 24 (16.3%).
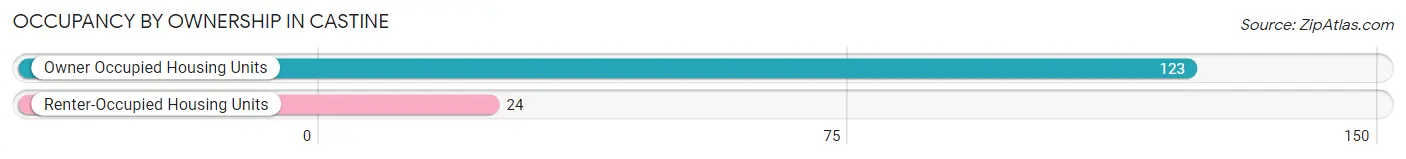
| Occupancy | # Housing Units | % Housing Units |
| Owner Occupied Housing Units | 123 | 83.7% |
| Renter-Occupied Housing Units | 24 | 16.3% |
| Total Occupied Housing Units | 147 | 100.0% |
Occupancy by Household Size in Castine
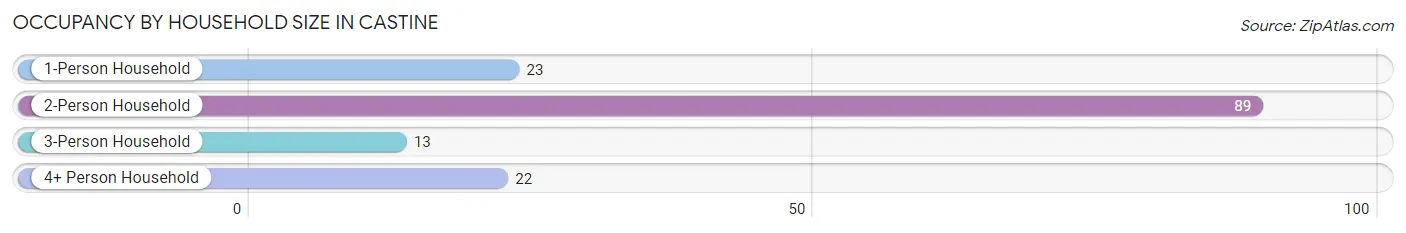
| Household Size | # Housing Units | % Housing Units |
| 1-Person Household | 23 | 15.7% |
| 2-Person Household | 89 | 60.5% |
| 3-Person Household | 13 | 8.8% |
| 4+ Person Household | 22 | 15.0% |
| Total Housing Units | 147 | 100.0% |
Occupancy by Ownership by Household Size in Castine
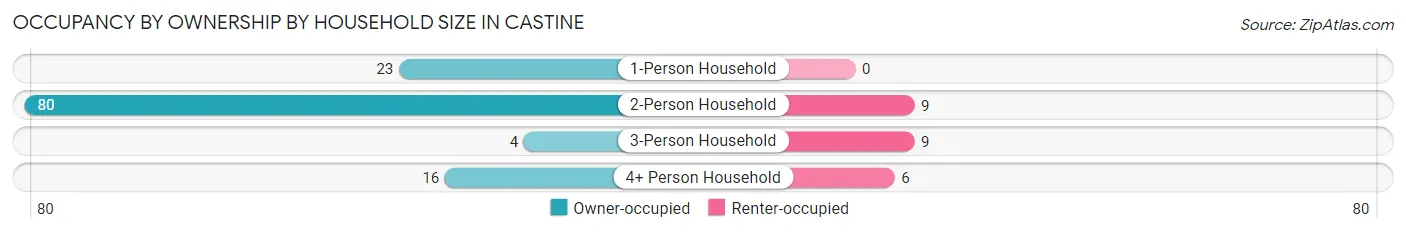
| Household Size | Owner-occupied | Renter-occupied |
| 1-Person Household | 23 (100.0%) | 0 (0.0%) |
| 2-Person Household | 80 (89.9%) | 9 (10.1%) |
| 3-Person Household | 4 (30.8%) | 9 (69.2%) |
| 4+ Person Household | 16 (72.7%) | 6 (27.3%) |
| Total Housing Units | 123 (83.7%) | 24 (16.3%) |
Occupancy by Educational Attainment in Castine
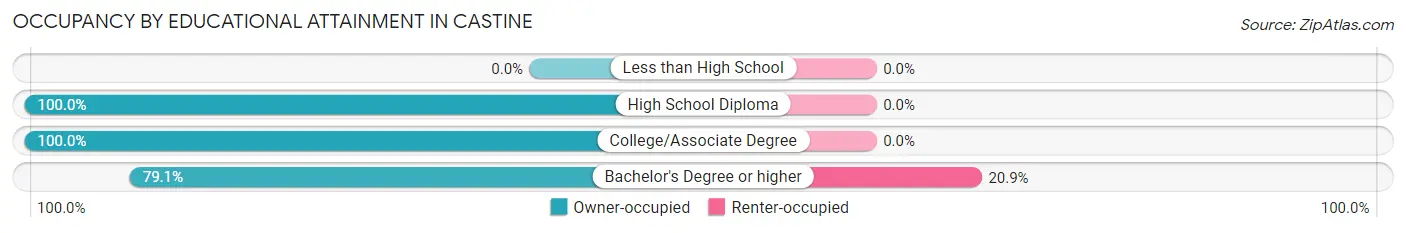
| Household Size | Owner-occupied | Renter-occupied |
| Less than High School | 0 (0.0%) | 0 (0.0%) |
| High School Diploma | 6 (100.0%) | 0 (0.0%) |
| College/Associate Degree | 26 (100.0%) | 0 (0.0%) |
| Bachelor's Degree or higher | 91 (79.1%) | 24 (20.9%) |
Occupancy by Age of Householder in Castine
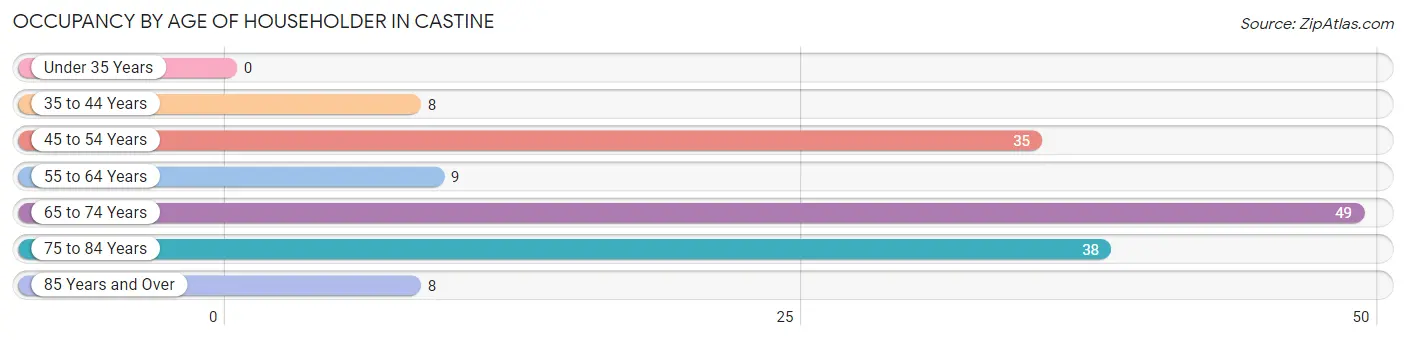
| Age Bracket | # Households | % Households |
| Under 35 Years | 0 | 0.0% |
| 35 to 44 Years | 8 | 5.4% |
| 45 to 54 Years | 35 | 23.8% |
| 55 to 64 Years | 9 | 6.1% |
| 65 to 74 Years | 49 | 33.3% |
| 75 to 84 Years | 38 | 25.9% |
| 85 Years and Over | 8 | 5.4% |
| Total | 147 | 100.0% |
Housing Finances in Castine
Median Income by Occupancy in Castine
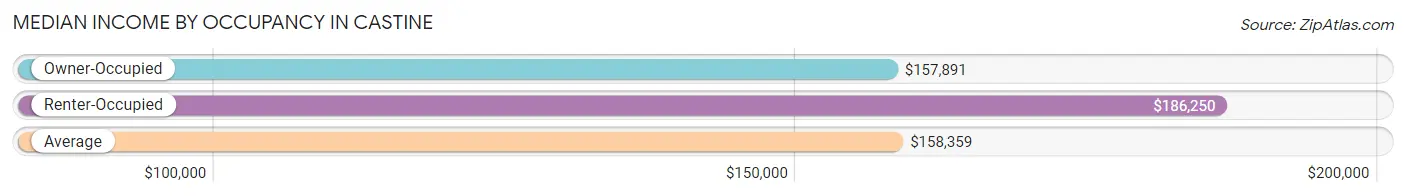
| Occupancy Type | # Households | Median Income |
| Owner-Occupied | 123 (83.7%) | $157,891 |
| Renter-Occupied | 24 (16.3%) | $186,250 |
| Average | 147 (100.0%) | $158,359 |
Occupancy by Householder Income Bracket in Castine
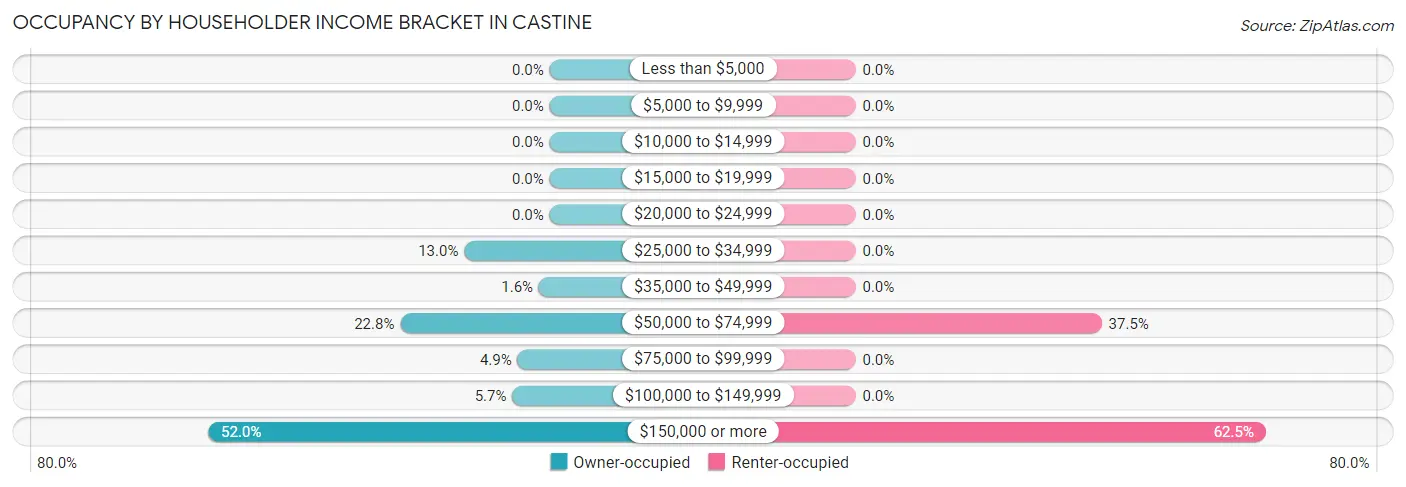
| Income Bracket | Owner-occupied | Renter-occupied |
| Less than $5,000 | 0 (0.0%) | 0 (0.0%) |
| $5,000 to $9,999 | 0 (0.0%) | 0 (0.0%) |
| $10,000 to $14,999 | 0 (0.0%) | 0 (0.0%) |
| $15,000 to $19,999 | 0 (0.0%) | 0 (0.0%) |
| $20,000 to $24,999 | 0 (0.0%) | 0 (0.0%) |
| $25,000 to $34,999 | 16 (13.0%) | 0 (0.0%) |
| $35,000 to $49,999 | 2 (1.6%) | 0 (0.0%) |
| $50,000 to $74,999 | 28 (22.8%) | 9 (37.5%) |
| $75,000 to $99,999 | 6 (4.9%) | 0 (0.0%) |
| $100,000 to $149,999 | 7 (5.7%) | 0 (0.0%) |
| $150,000 or more | 64 (52.0%) | 15 (62.5%) |
| Total | 123 (100.0%) | 24 (100.0%) |
Monthly Housing Cost Tiers in Castine
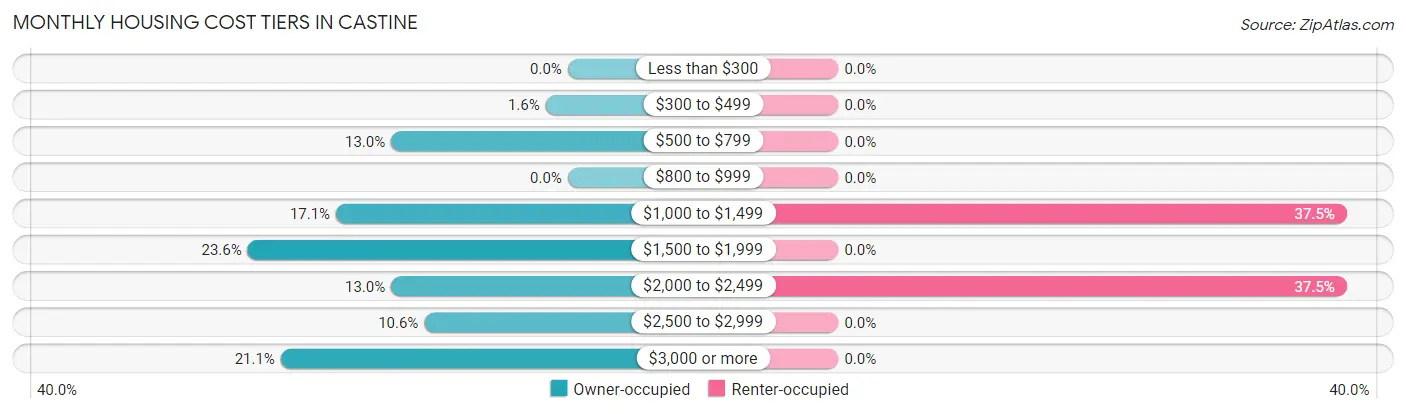
| Monthly Cost | Owner-occupied | Renter-occupied |
| Less than $300 | 0 (0.0%) | 0 (0.0%) |
| $300 to $499 | 2 (1.6%) | 0 (0.0%) |
| $500 to $799 | 16 (13.0%) | 0 (0.0%) |
| $800 to $999 | 0 (0.0%) | 0 (0.0%) |
| $1,000 to $1,499 | 21 (17.1%) | 9 (37.5%) |
| $1,500 to $1,999 | 29 (23.6%) | 0 (0.0%) |
| $2,000 to $2,499 | 16 (13.0%) | 9 (37.5%) |
| $2,500 to $2,999 | 13 (10.6%) | 0 (0.0%) |
| $3,000 or more | 26 (21.1%) | 0 (0.0%) |
| Total | 123 (100.0%) | 24 (100.0%) |
Physical Housing Characteristics in Castine
Housing Structures in Castine
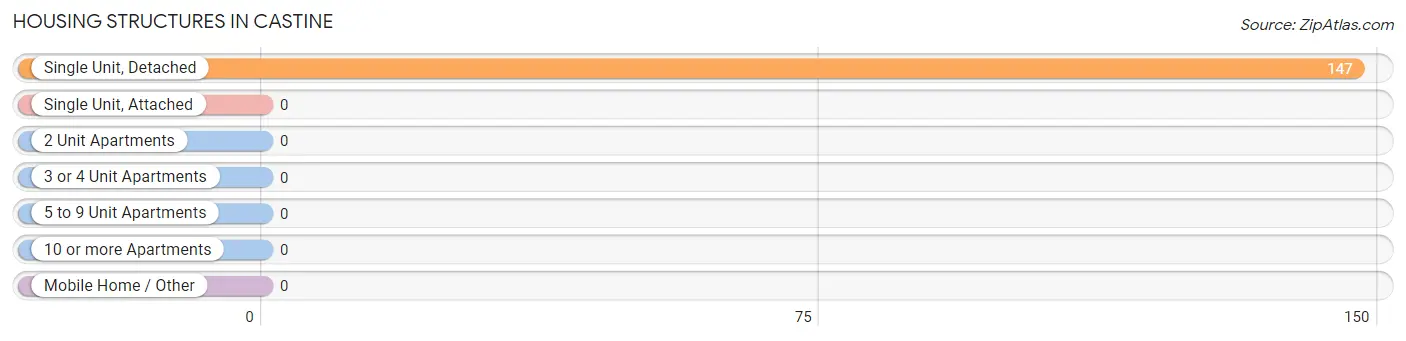
| Structure Type | # Housing Units | % Housing Units |
| Single Unit, Detached | 147 | 100.0% |
| Single Unit, Attached | 0 | 0.0% |
| 2 Unit Apartments | 0 | 0.0% |
| 3 or 4 Unit Apartments | 0 | 0.0% |
| 5 to 9 Unit Apartments | 0 | 0.0% |
| 10 or more Apartments | 0 | 0.0% |
| Mobile Home / Other | 0 | 0.0% |
| Total | 147 | 100.0% |
Housing Structures by Occupancy in Castine
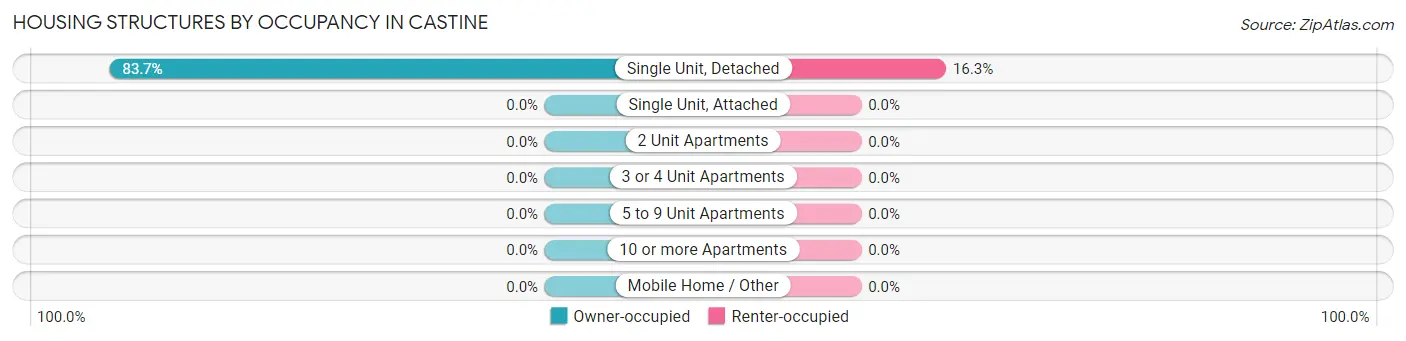
| Structure Type | Owner-occupied | Renter-occupied |
| Single Unit, Detached | 123 (83.7%) | 24 (16.3%) |
| Single Unit, Attached | 0 (0.0%) | 0 (0.0%) |
| 2 Unit Apartments | 0 (0.0%) | 0 (0.0%) |
| 3 or 4 Unit Apartments | 0 (0.0%) | 0 (0.0%) |
| 5 to 9 Unit Apartments | 0 (0.0%) | 0 (0.0%) |
| 10 or more Apartments | 0 (0.0%) | 0 (0.0%) |
| Mobile Home / Other | 0 (0.0%) | 0 (0.0%) |
| Total | 123 (83.7%) | 24 (16.3%) |
Housing Structures by Number of Rooms in Castine
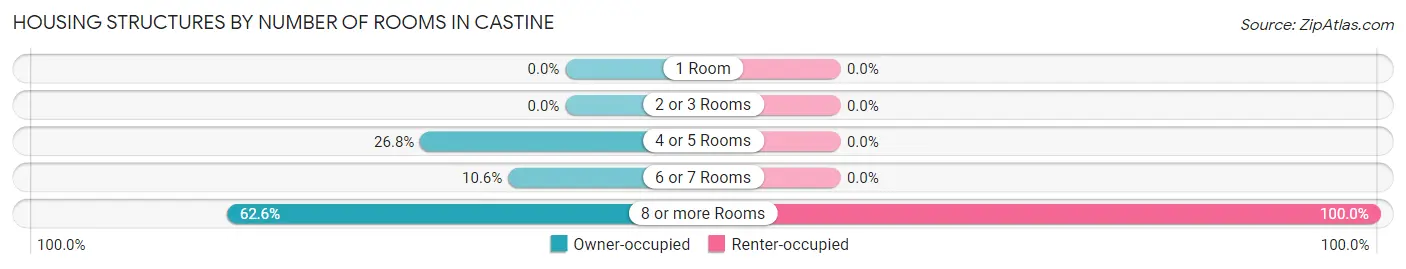
| Number of Rooms | Owner-occupied | Renter-occupied |
| 1 Room | 0 (0.0%) | 0 (0.0%) |
| 2 or 3 Rooms | 0 (0.0%) | 0 (0.0%) |
| 4 or 5 Rooms | 33 (26.8%) | 0 (0.0%) |
| 6 or 7 Rooms | 13 (10.6%) | 0 (0.0%) |
| 8 or more Rooms | 77 (62.6%) | 24 (100.0%) |
| Total | 123 (100.0%) | 24 (100.0%) |
Housing Structure by Heating Type in Castine
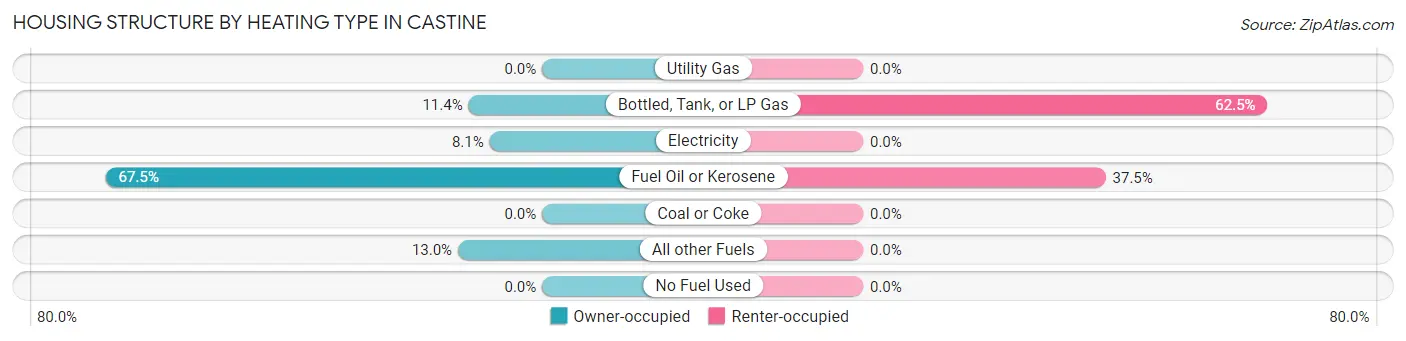
| Heating Type | Owner-occupied | Renter-occupied |
| Utility Gas | 0 (0.0%) | 0 (0.0%) |
| Bottled, Tank, or LP Gas | 14 (11.4%) | 15 (62.5%) |
| Electricity | 10 (8.1%) | 0 (0.0%) |
| Fuel Oil or Kerosene | 83 (67.5%) | 9 (37.5%) |
| Coal or Coke | 0 (0.0%) | 0 (0.0%) |
| All other Fuels | 16 (13.0%) | 0 (0.0%) |
| No Fuel Used | 0 (0.0%) | 0 (0.0%) |
| Total | 123 (100.0%) | 24 (100.0%) |
Household Vehicle Usage in Castine
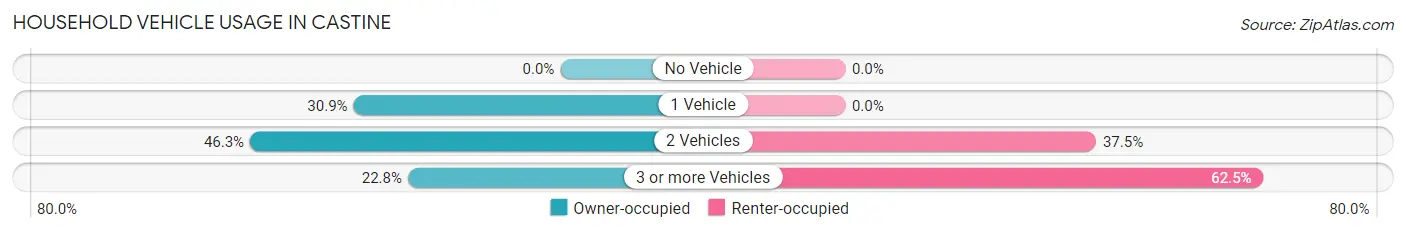
| Vehicles per Household | Owner-occupied | Renter-occupied |
| No Vehicle | 0 (0.0%) | 0 (0.0%) |
| 1 Vehicle | 38 (30.9%) | 0 (0.0%) |
| 2 Vehicles | 57 (46.3%) | 9 (37.5%) |
| 3 or more Vehicles | 28 (22.8%) | 15 (62.5%) |
| Total | 123 (100.0%) | 24 (100.0%) |
Real Estate & Mortgages in Castine
Real Estate and Mortgage Overview in Castine
| Characteristic | Without Mortgage | With Mortgage |
| Housing Units | 47 | 76 |
| Median Property Value | $724,000 | $550,000 |
| Median Household Income | $54,583 | $56 |
| Monthly Housing Costs | $1,079 | $26 |
| Real Estate Taxes | $5,917 | $0 |
Property Value by Mortgage Status in Castine
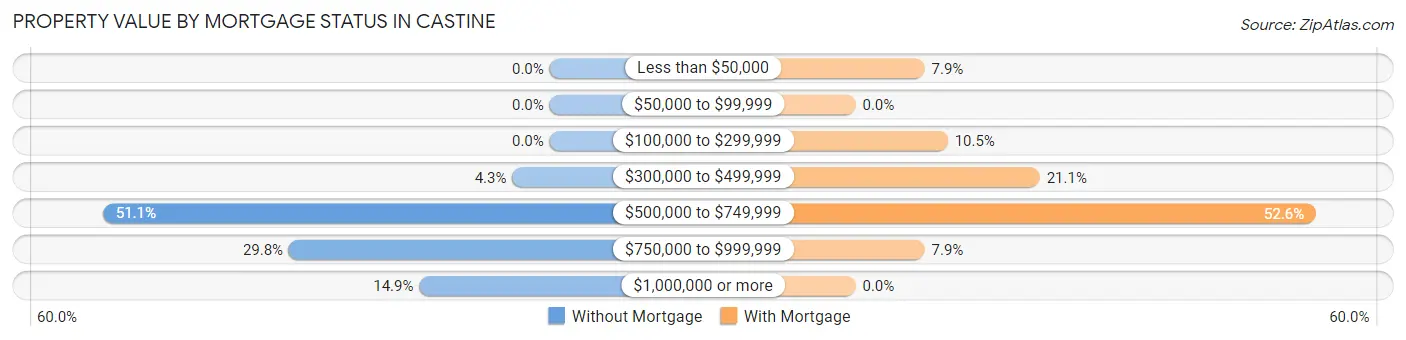
| Property Value | Without Mortgage | With Mortgage |
| Less than $50,000 | 0 (0.0%) | 6 (7.9%) |
| $50,000 to $99,999 | 0 (0.0%) | 0 (0.0%) |
| $100,000 to $299,999 | 0 (0.0%) | 8 (10.5%) |
| $300,000 to $499,999 | 2 (4.3%) | 16 (21.0%) |
| $500,000 to $749,999 | 24 (51.1%) | 40 (52.6%) |
| $750,000 to $999,999 | 14 (29.8%) | 6 (7.9%) |
| $1,000,000 or more | 7 (14.9%) | 0 (0.0%) |
| Total | 47 (100.0%) | 76 (100.0%) |
Household Income by Mortgage Status in Castine
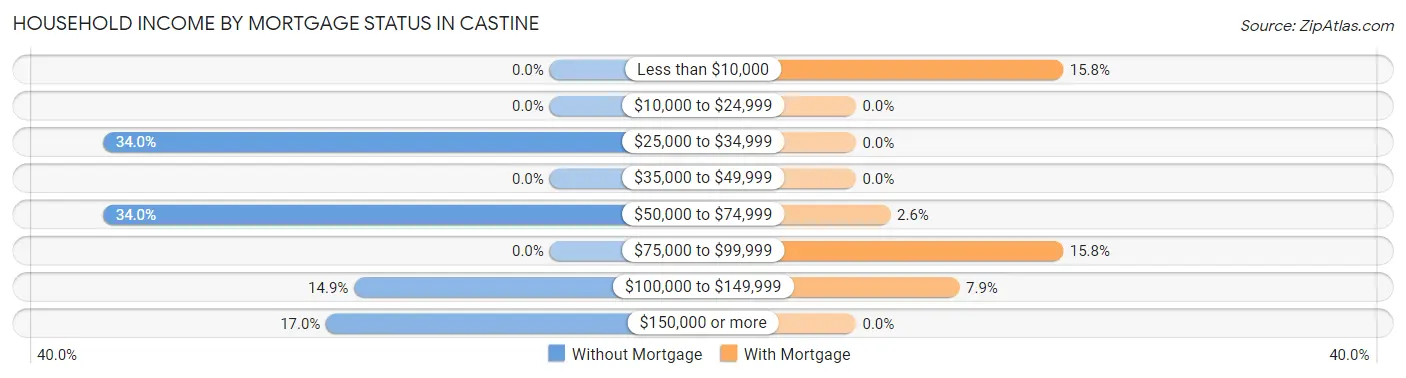
| Household Income | Without Mortgage | With Mortgage |
| Less than $10,000 | 0 (0.0%) | 12 (15.8%) |
| $10,000 to $24,999 | 0 (0.0%) | 0 (0.0%) |
| $25,000 to $34,999 | 16 (34.0%) | 0 (0.0%) |
| $35,000 to $49,999 | 0 (0.0%) | 0 (0.0%) |
| $50,000 to $74,999 | 16 (34.0%) | 2 (2.6%) |
| $75,000 to $99,999 | 0 (0.0%) | 12 (15.8%) |
| $100,000 to $149,999 | 7 (14.9%) | 6 (7.9%) |
| $150,000 or more | 8 (17.0%) | 0 (0.0%) |
| Total | 47 (100.0%) | 76 (100.0%) |
Property Value to Household Income Ratio in Castine
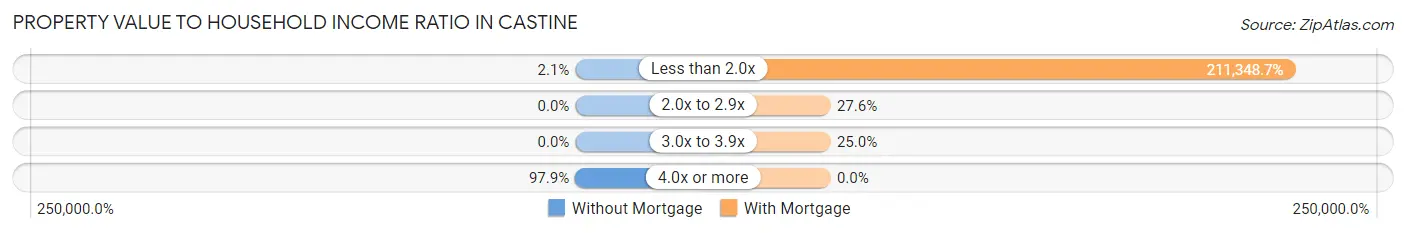
| Value-to-Income Ratio | Without Mortgage | With Mortgage |
| Less than 2.0x | 1 (2.1%) | 160,625 (211,348.7%) |
| 2.0x to 2.9x | 0 (0.0%) | 21 (27.6%) |
| 3.0x to 3.9x | 0 (0.0%) | 19 (25.0%) |
| 4.0x or more | 46 (97.9%) | 0 (0.0%) |
| Total | 47 (100.0%) | 76 (100.0%) |
Real Estate Taxes by Mortgage Status in Castine
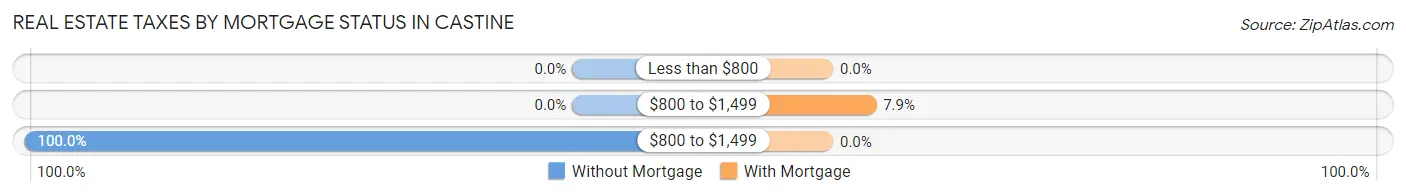
| Property Taxes | Without Mortgage | With Mortgage |
| Less than $800 | 0 (0.0%) | 0 (0.0%) |
| $800 to $1,499 | 0 (0.0%) | 6 (7.9%) |
| $800 to $1,499 | 47 (100.0%) | 0 (0.0%) |
| Total | 47 (100.0%) | 76 (100.0%) |
Health & Disability in Castine
Health Insurance Coverage by Age in Castine
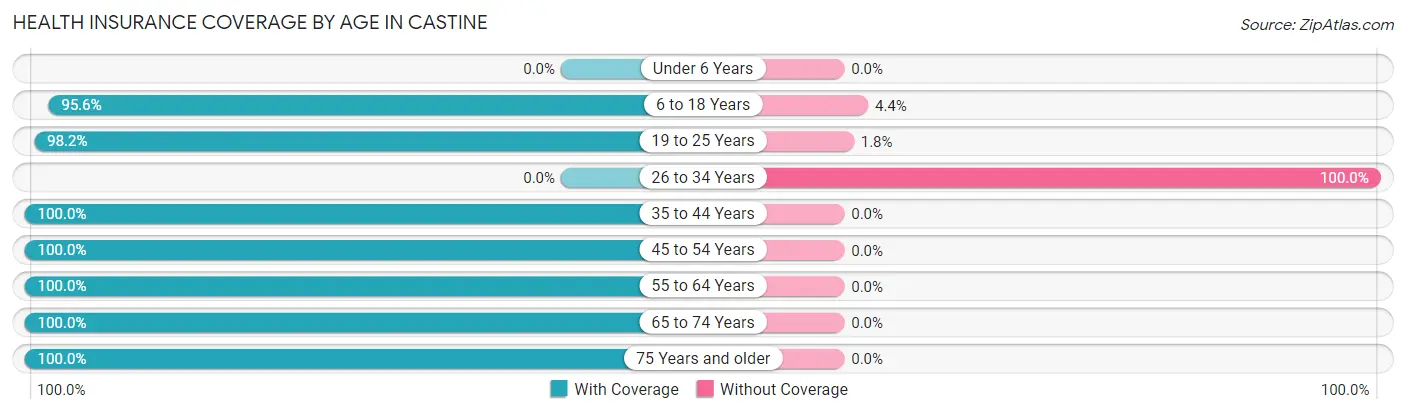
| Age Bracket | With Coverage | Without Coverage |
| Under 6 Years | 0 (0.0%) | 0 (0.0%) |
| 6 to 18 Years | 194 (95.6%) | 9 (4.4%) |
| 19 to 25 Years | 443 (98.2%) | 8 (1.8%) |
| 26 to 34 Years | 0 (0.0%) | 1 (100.0%) |
| 35 to 44 Years | 18 (100.0%) | 0 (0.0%) |
| 45 to 54 Years | 48 (100.0%) | 0 (0.0%) |
| 55 to 64 Years | 52 (100.0%) | 0 (0.0%) |
| 65 to 74 Years | 76 (100.0%) | 0 (0.0%) |
| 75 Years and older | 74 (100.0%) | 0 (0.0%) |
| Total | 905 (98.1%) | 18 (1.9%) |
Health Insurance Coverage by Citizenship Status in Castine
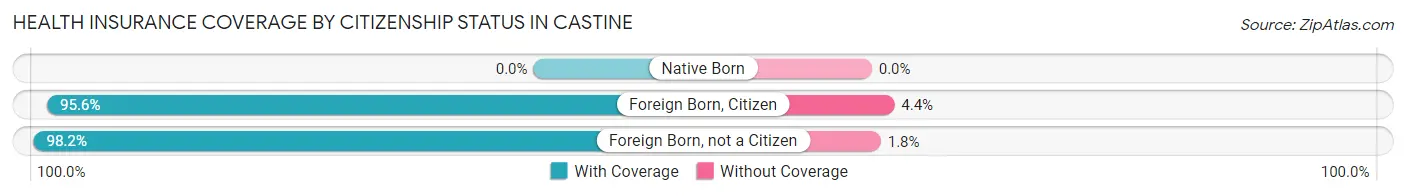
| Citizenship Status | With Coverage | Without Coverage |
| Native Born | 0 (0.0%) | 0 (0.0%) |
| Foreign Born, Citizen | 194 (95.6%) | 9 (4.4%) |
| Foreign Born, not a Citizen | 443 (98.2%) | 8 (1.8%) |
Health Insurance Coverage by Household Income in Castine
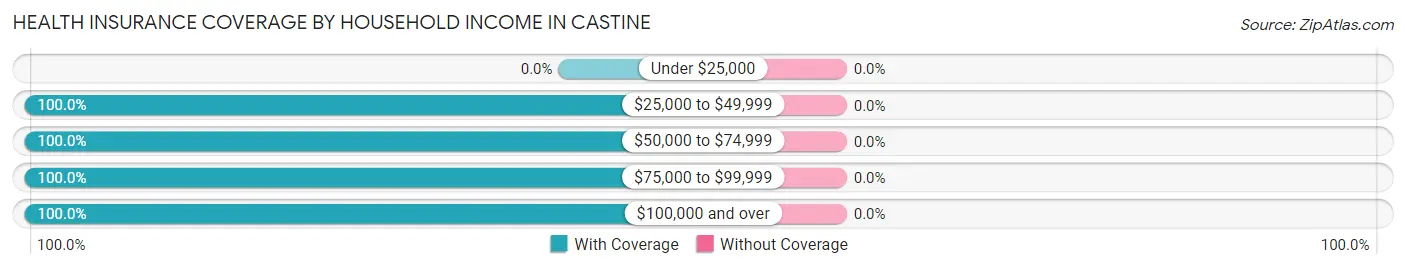
| Household Income | With Coverage | Without Coverage |
| Under $25,000 | 0 (0.0%) | 0 (0.0%) |
| $25,000 to $49,999 | 25 (100.0%) | 0 (0.0%) |
| $50,000 to $74,999 | 73 (100.0%) | 0 (0.0%) |
| $75,000 to $99,999 | 11 (100.0%) | 0 (0.0%) |
| $100,000 and over | 234 (100.0%) | 0 (0.0%) |
Public vs Private Health Insurance Coverage by Age in Castine
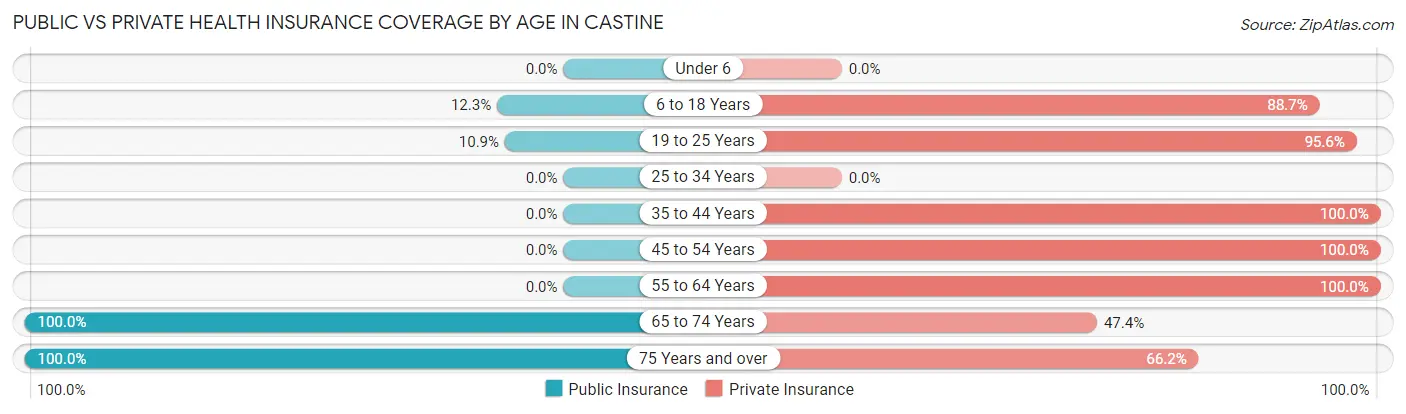
| Age Bracket | Public Insurance | Private Insurance |
| Under 6 | 0 (0.0%) | 0 (0.0%) |
| 6 to 18 Years | 25 (12.3%) | 180 (88.7%) |
| 19 to 25 Years | 49 (10.9%) | 431 (95.6%) |
| 25 to 34 Years | 0 (0.0%) | 0 (0.0%) |
| 35 to 44 Years | 0 (0.0%) | 18 (100.0%) |
| 45 to 54 Years | 0 (0.0%) | 48 (100.0%) |
| 55 to 64 Years | 0 (0.0%) | 52 (100.0%) |
| 65 to 74 Years | 76 (100.0%) | 36 (47.4%) |
| 75 Years and over | 74 (100.0%) | 49 (66.2%) |
| Total | 224 (24.3%) | 814 (88.2%) |
Disability Status by Sex by Age in Castine
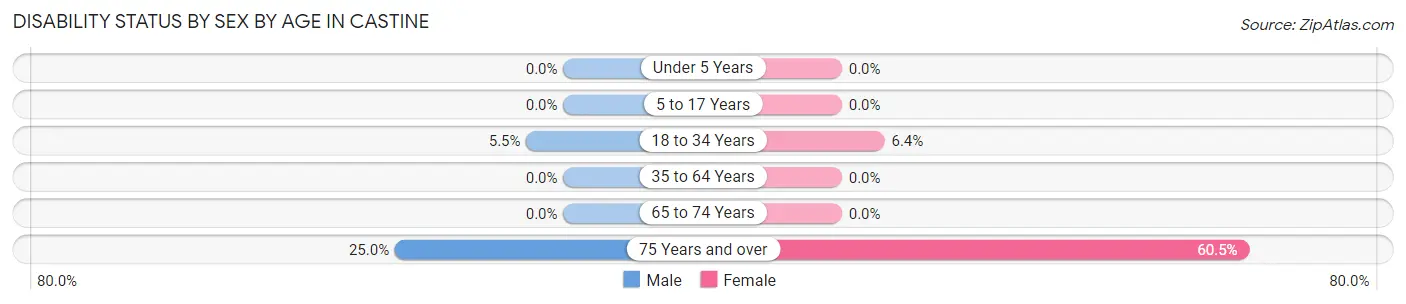
| Age Bracket | Male | Female |
| Under 5 Years | 0 (0.0%) | 0 (0.0%) |
| 5 to 17 Years | 0 (0.0%) | 0 (0.0%) |
| 18 to 34 Years | 25 (5.5%) | 8 (6.4%) |
| 35 to 64 Years | 0 (0.0%) | 0 (0.0%) |
| 65 to 74 Years | 0 (0.0%) | 0 (0.0%) |
| 75 Years and over | 9 (25.0%) | 23 (60.5%) |
Disability Class by Sex by Age in Castine
Disability Class: Hearing Difficulty
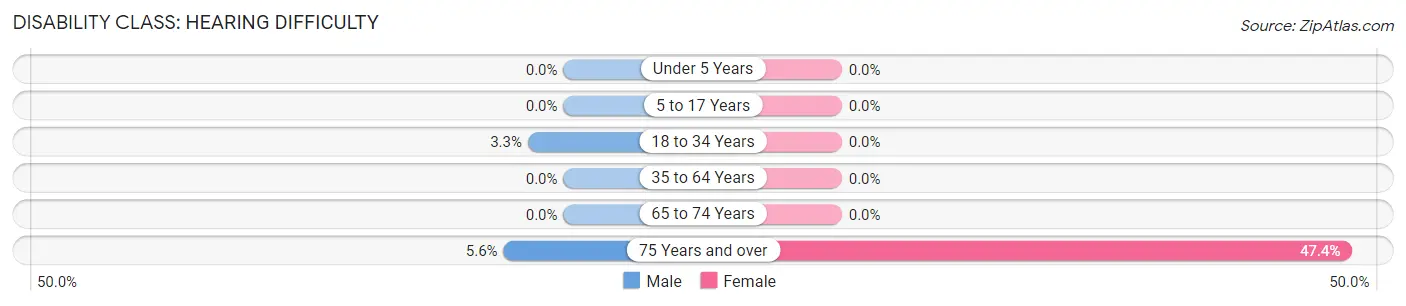
| Age Bracket | Male | Female |
| Under 5 Years | 0 (0.0%) | 0 (0.0%) |
| 5 to 17 Years | 0 (0.0%) | 0 (0.0%) |
| 18 to 34 Years | 15 (3.3%) | 0 (0.0%) |
| 35 to 64 Years | 0 (0.0%) | 0 (0.0%) |
| 65 to 74 Years | 0 (0.0%) | 0 (0.0%) |
| 75 Years and over | 2 (5.6%) | 18 (47.4%) |
Disability Class: Vision Difficulty
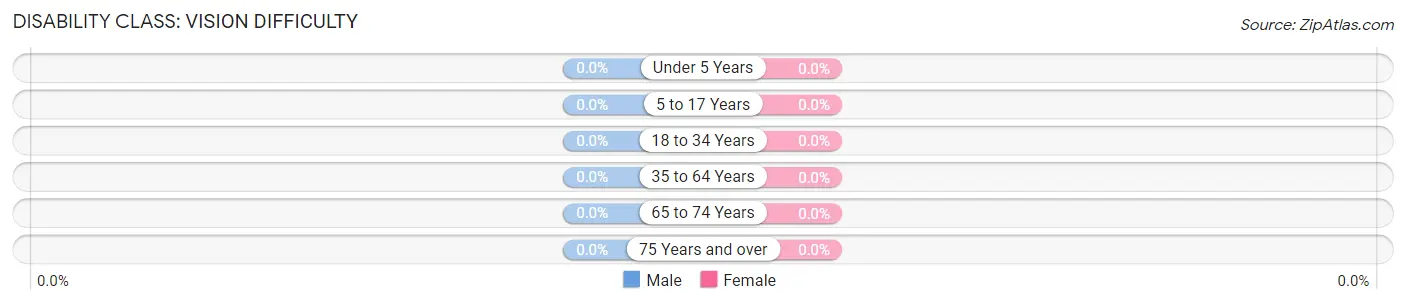
| Age Bracket | Male | Female |
| Under 5 Years | 0 (0.0%) | 0 (0.0%) |
| 5 to 17 Years | 0 (0.0%) | 0 (0.0%) |
| 18 to 34 Years | 0 (0.0%) | 0 (0.0%) |
| 35 to 64 Years | 0 (0.0%) | 0 (0.0%) |
| 65 to 74 Years | 0 (0.0%) | 0 (0.0%) |
| 75 Years and over | 0 (0.0%) | 0 (0.0%) |
Disability Class: Cognitive Difficulty
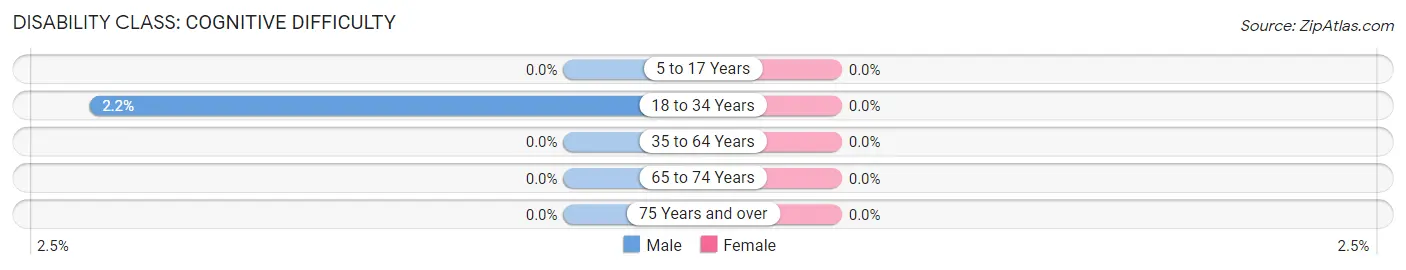
| Age Bracket | Male | Female |
| 5 to 17 Years | 0 (0.0%) | 0 (0.0%) |
| 18 to 34 Years | 10 (2.2%) | 0 (0.0%) |
| 35 to 64 Years | 0 (0.0%) | 0 (0.0%) |
| 65 to 74 Years | 0 (0.0%) | 0 (0.0%) |
| 75 Years and over | 0 (0.0%) | 0 (0.0%) |
Disability Class: Ambulatory Difficulty
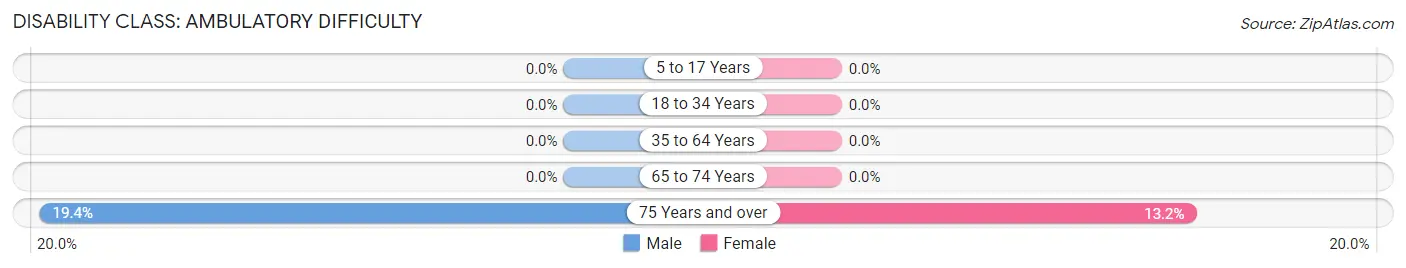
| Age Bracket | Male | Female |
| 5 to 17 Years | 0 (0.0%) | 0 (0.0%) |
| 18 to 34 Years | 0 (0.0%) | 0 (0.0%) |
| 35 to 64 Years | 0 (0.0%) | 0 (0.0%) |
| 65 to 74 Years | 0 (0.0%) | 0 (0.0%) |
| 75 Years and over | 7 (19.4%) | 5 (13.2%) |
Disability Class: Self-Care Difficulty
| Age Bracket | Male | Female |
| 5 to 17 Years | 0 (0.0%) | 0 (0.0%) |
| 18 to 34 Years | 0 (0.0%) | 0 (0.0%) |
| 35 to 64 Years | 0 (0.0%) | 0 (0.0%) |
| 65 to 74 Years | 0 (0.0%) | 0 (0.0%) |
| 75 Years and over | 0 (0.0%) | 0 (0.0%) |
Technology Access in Castine
Computing Device Access in Castine
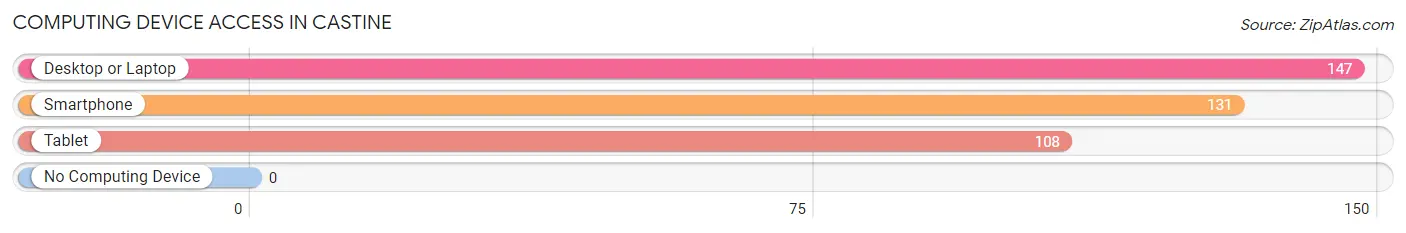
| Device Type | # Households | % Households |
| Desktop or Laptop | 147 | 100.0% |
| Smartphone | 131 | 89.1% |
| Tablet | 108 | 73.5% |
| No Computing Device | 0 | 0.0% |
| Total | 147 | 100.0% |
Internet Access in Castine
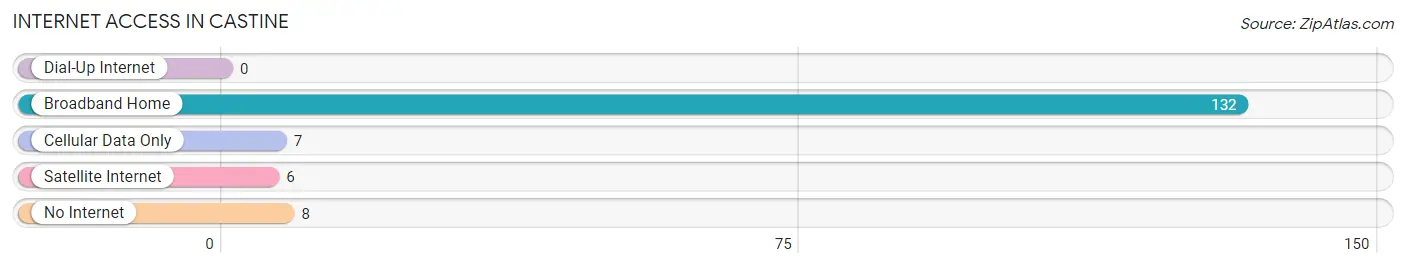
| Internet Type | # Households | % Households |
| Dial-Up Internet | 0 | 0.0% |
| Broadband Home | 132 | 89.8% |
| Cellular Data Only | 7 | 4.8% |
| Satellite Internet | 6 | 4.1% |
| No Internet | 8 | 5.4% |
| Total | 147 | 100.0% |
Castine Summary
Castine, Maine is a small town located on the eastern coast of the United States. It is situated on the Penobscot Bay, and is part of the town of Castine in Hancock County. The town has a population of 1,366 people, according to the 2010 census.
History
Castine was first settled in 1613 by French explorer Samuel de Champlain. He named the area Port Royal, and it was the first permanent French settlement in the New World. The settlement was abandoned in 1625, but was re-established in 1670 by the French. The town was captured by the British in 1676, and was renamed Fort Pentagoet. The British held the fort until 1779, when it was captured by the Americans during the Revolutionary War. The town was incorporated in 1796, and was named after the French fort.
Geography
Castine is located on the eastern coast of Maine, on the Penobscot Bay. The town is situated on a peninsula, and is bordered by the towns of Brooksville, Penobscot, and Sedgwick. The town is approximately 8 square miles in size, and is home to several small islands, including Eggemoggin Reach, Long Island, and Little Deer Isle. The town is located approximately 30 miles from Bangor, and is accessible by car or boat.
Economy
The economy of Castine is largely based on tourism and fishing. The town is home to several marinas, and is a popular destination for boaters and fishermen. The town also has several restaurants, shops, and galleries. The town is also home to the Maine Maritime Academy, which provides educational and training opportunities for students interested in maritime careers.
Demographics
According to the 2010 census, Castine has a population of 1,366 people. The median age of the population is 44.7 years, and the median household income is $50,000. The town is predominantly white, with 95.3% of the population identifying as such. The town also has a small African American population, at 1.2%, and a small Hispanic population, at 1.1%.
Conclusion
Castine, Maine is a small town located on the eastern coast of the United States. It has a rich history, dating back to the 1600s, and is home to a variety of businesses and attractions. The town has a population of 1,366 people, and is predominantly white. The economy of Castine is largely based on tourism and fishing, and the town is home to the Maine Maritime Academy.
Common Questions
What is Per Capita Income in Castine?
Per Capita income in Castine is $27,076.
What is the Median Family Income in Castine?
Median Family Income in Castine is $158,047.
What is the Median Household income in Castine?
Median Household Income in Castine is $158,359.
What is Income or Wage Gap in Castine?
Income or Wage Gap in Castine is 40.9%.
Women in Castine earn 59.1 cents for every dollar earned by a man.
What is Inequality or Gini Index in Castine?
Inequality or Gini Index in Castine is 0.36.
What is the Total Population of Castine?
Total Population of Castine is 923.
What is the Total Male Population of Castine?
Total Male Population of Castine is 616.
What is the Total Female Population of Castine?
Total Female Population of Castine is 307.
What is the Ratio of Males per 100 Females in Castine?
There are 200.65 Males per 100 Females in Castine.
What is the Ratio of Females per 100 Males in Castine?
There are 49.84 Females per 100 Males in Castine.
What is the Median Population Age in Castine?
Median Population Age in Castine is 20.3 Years.
What is the Average Family Size in Castine
Average Family Size in Castine is 2.6 People.
What is the Average Household Size in Castine
Average Household Size in Castine is 2.3 People.
How Large is the Labor Force in Castine?
There are 428 People in the Labor Forcein in Castine.
What is the Percentage of People in the Labor Force in Castine?
48.8% of People are in the Labor Force in Castine.
What is the Unemployment Rate in Castine?
Unemployment Rate in Castine is 2.3%.