North Star, DE Map & Demographics
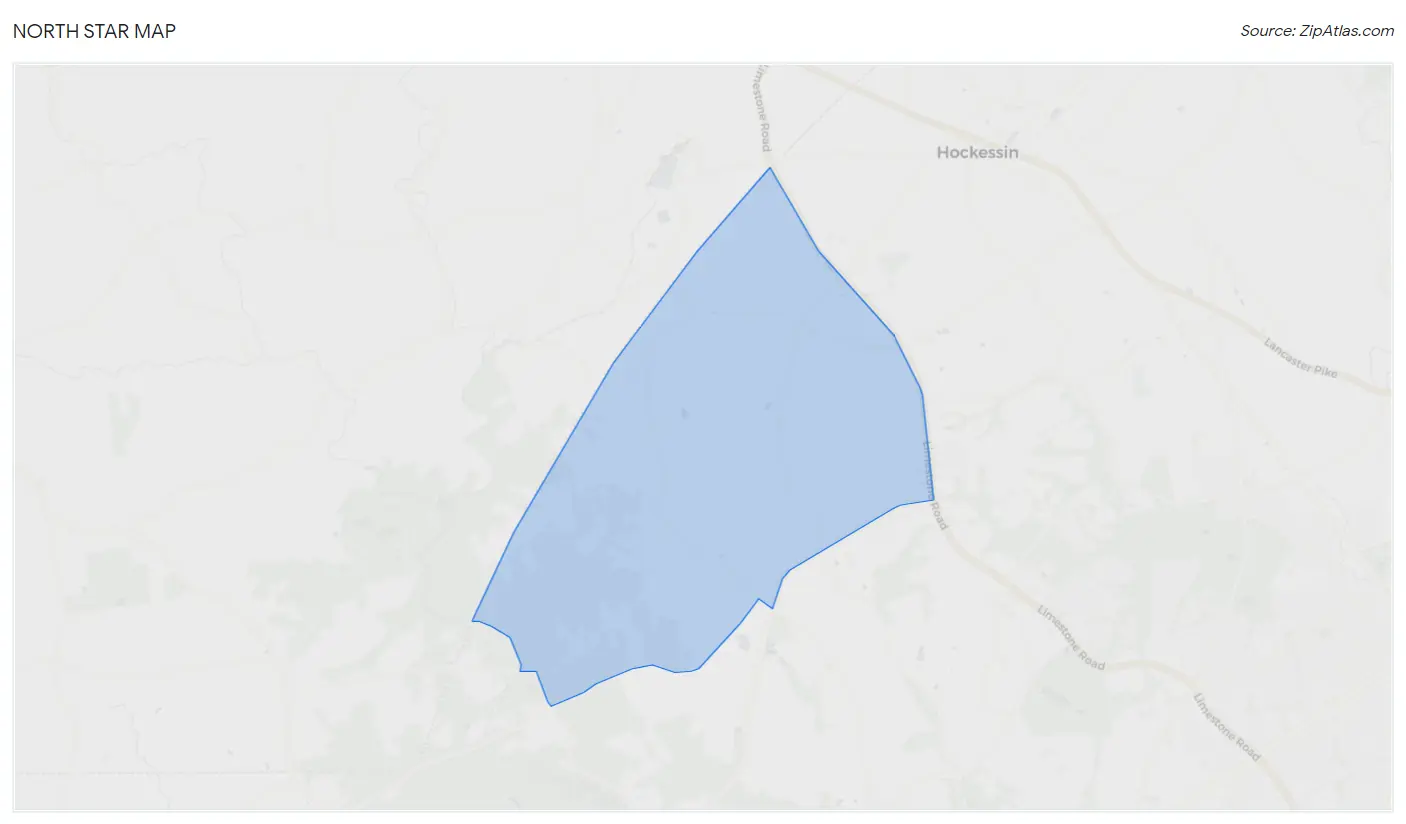
North Star Map
North Star Overview
$72,757
PER CAPITA INCOME
$176,061
AVG FAMILY INCOME
$165,179
AVG HOUSEHOLD INCOME
33.2%
WAGE / INCOME GAP [ % ]
66.8¢/ $1
WAGE / INCOME GAP [ $ ]
0.39
INEQUALITY / GINI INDEX
8,370
TOTAL POPULATION
4,130
MALE POPULATION
4,240
FEMALE POPULATION
97.41
MALES / 100 FEMALES
102.66
FEMALES / 100 MALES
49.3
MEDIAN AGE
2.9
AVG FAMILY SIZE
2.7
AVG HOUSEHOLD SIZE
4,423
LABOR FORCE [ PEOPLE ]
63.6%
PERCENT IN LABOR FORCE
3.7%
UNEMPLOYMENT RATE
Income in North Star
Income Overview in North Star
Per Capita Income in North Star is $72,757, while median incomes of families and households are $176,061 and $165,179 respectively.
| Characteristic | Number | Measure |
| Per Capita Income | 8,370 | $72,757 |
| Median Family Income | 2,636 | $176,061 |
| Mean Family Income | 2,636 | $213,928 |
| Median Household Income | 3,092 | $165,179 |
| Mean Household Income | 3,092 | $197,964 |
| Income Deficit | 2,636 | $0 |
| Wage / Income Gap (%) | 8,370 | 33.17% |
| Wage / Income Gap ($) | 8,370 | 66.83¢ per $1 |
| Gini / Inequality Index | 8,370 | 0.39 |
Earnings by Sex in North Star
Average Earnings in North Star are $66,250, $75,750 for men and $50,625 for women, a difference of 33.2%.
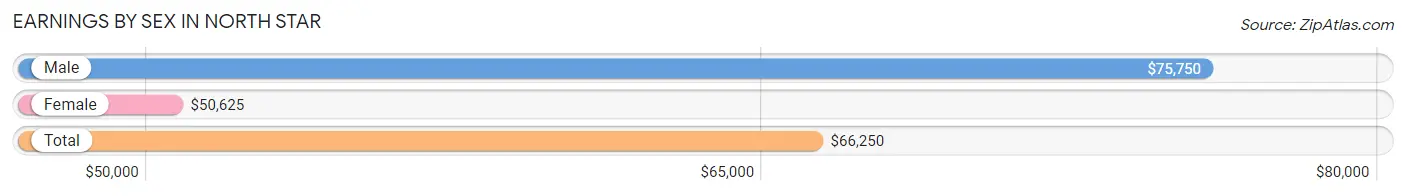
| Sex | Number | Average Earnings |
| Male | 2,600 (52.6%) | $75,750 |
| Female | 2,339 (47.4%) | $50,625 |
| Total | 4,939 (100.0%) | $66,250 |
Earnings by Sex by Income Bracket in North Star
The most common earnings brackets in North Star are $100,000+ for men (1,146 | 44.1%) and $100,000+ for women (538 | 23.0%).
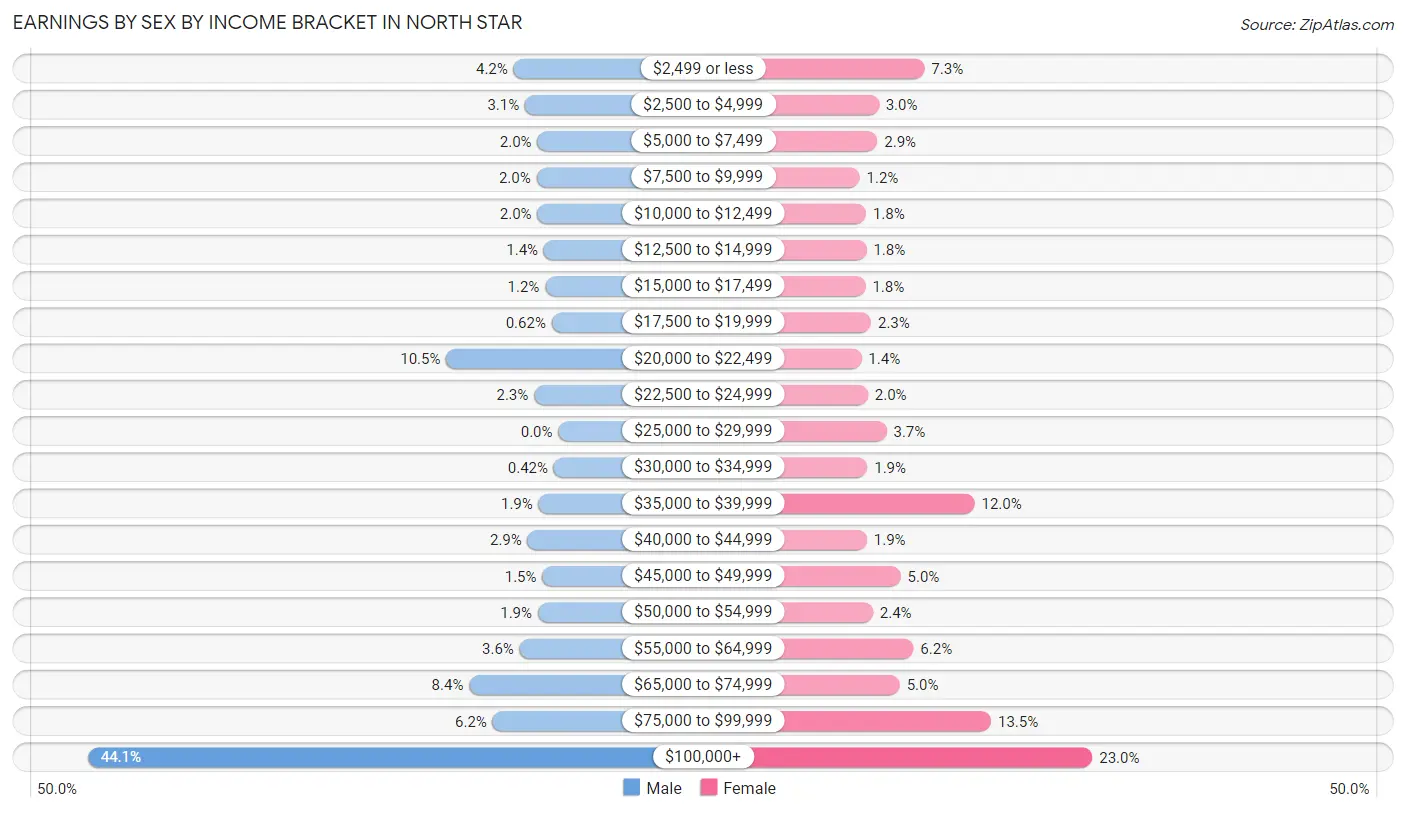
| Income | Male | Female |
| $2,499 or less | 109 (4.2%) | 170 (7.3%) |
| $2,500 to $4,999 | 81 (3.1%) | 70 (3.0%) |
| $5,000 to $7,499 | 51 (2.0%) | 67 (2.9%) |
| $7,500 to $9,999 | 53 (2.0%) | 28 (1.2%) |
| $10,000 to $12,499 | 51 (2.0%) | 42 (1.8%) |
| $12,500 to $14,999 | 35 (1.3%) | 43 (1.8%) |
| $15,000 to $17,499 | 32 (1.2%) | 41 (1.8%) |
| $17,500 to $19,999 | 16 (0.6%) | 53 (2.3%) |
| $20,000 to $22,499 | 273 (10.5%) | 32 (1.4%) |
| $22,500 to $24,999 | 59 (2.3%) | 46 (2.0%) |
| $25,000 to $29,999 | 0 (0.0%) | 87 (3.7%) |
| $30,000 to $34,999 | 11 (0.4%) | 45 (1.9%) |
| $35,000 to $39,999 | 48 (1.8%) | 280 (12.0%) |
| $40,000 to $44,999 | 75 (2.9%) | 44 (1.9%) |
| $45,000 to $49,999 | 39 (1.5%) | 118 (5.0%) |
| $50,000 to $54,999 | 50 (1.9%) | 57 (2.4%) |
| $55,000 to $64,999 | 94 (3.6%) | 146 (6.2%) |
| $65,000 to $74,999 | 217 (8.4%) | 116 (5.0%) |
| $75,000 to $99,999 | 160 (6.1%) | 316 (13.5%) |
| $100,000+ | 1,146 (44.1%) | 538 (23.0%) |
| Total | 2,600 (100.0%) | 2,339 (100.0%) |
Earnings by Sex by Educational Attainment in North Star
Average earnings in North Star are $106,932 for men and $57,991 for women, a difference of 45.8%. Men with an educational attainment of graduate degree enjoy the highest average annual earnings of $142,462, while those with high school diploma education earn the least with $47,440. Women with an educational attainment of graduate degree earn the most with the average annual earnings of $85,714, while those with bachelor's degree education have the smallest earnings of $55,278.
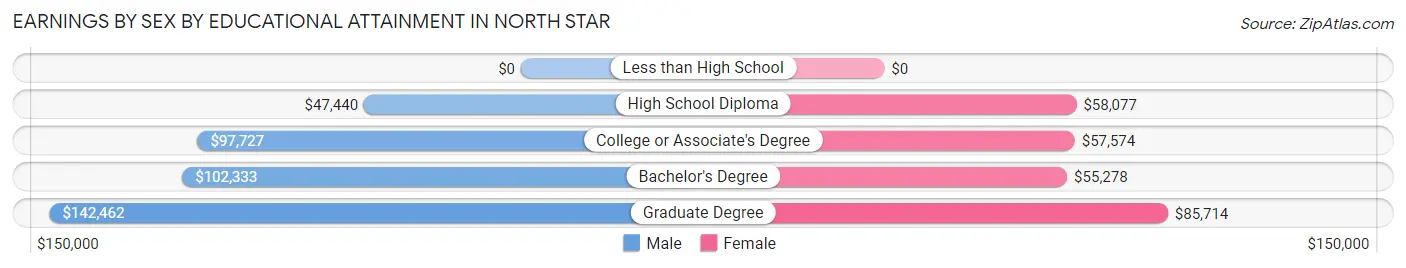
| Educational Attainment | Male Income | Female Income |
| Less than High School | - | - |
| High School Diploma | $47,440 | $58,077 |
| College or Associate's Degree | $97,727 | $57,574 |
| Bachelor's Degree | $102,333 | $55,278 |
| Graduate Degree | $142,462 | $85,714 |
| Total | $106,932 | $57,991 |
Family Income in North Star
Family Income Brackets in North Star
According to the North Star family income data, there are 1,110 families falling into the $200,000+ income range, which is the most common income bracket and makes up 42.1% of all families. Conversely, the $10,000 to $14,999 income bracket is the least frequent group with only 8 families (0.3%) belonging to this category.
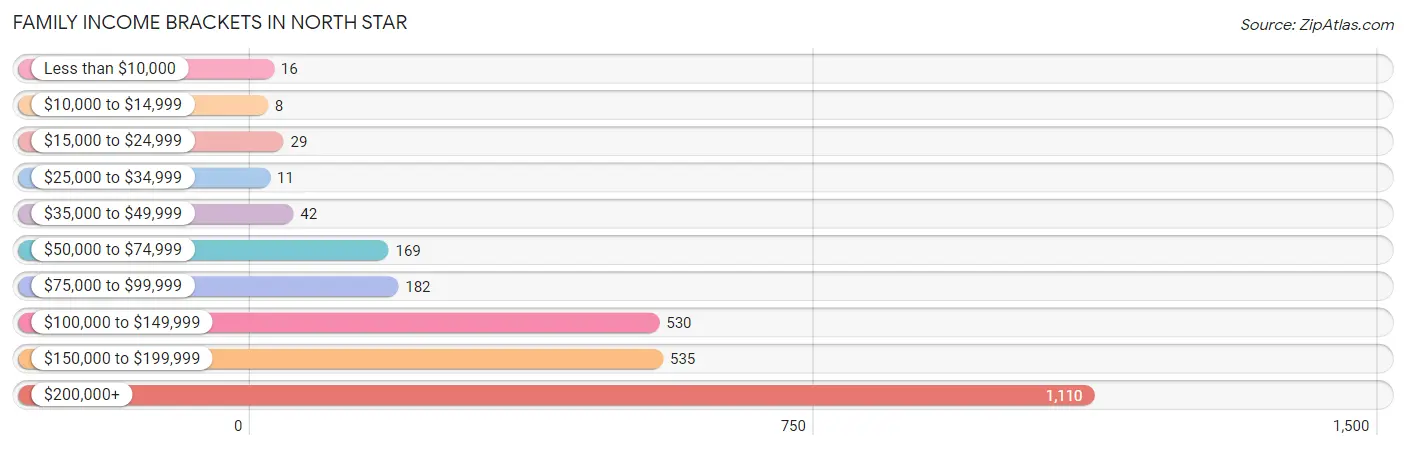
| Income Bracket | # Families | % Families |
| Less than $10,000 | 16 | 0.6% |
| $10,000 to $14,999 | 8 | 0.3% |
| $15,000 to $24,999 | 29 | 1.1% |
| $25,000 to $34,999 | 11 | 0.4% |
| $35,000 to $49,999 | 42 | 1.6% |
| $50,000 to $74,999 | 169 | 6.4% |
| $75,000 to $99,999 | 182 | 6.9% |
| $100,000 to $149,999 | 530 | 20.1% |
| $150,000 to $199,999 | 535 | 20.3% |
| $200,000+ | 1,110 | 42.1% |
Family Income by Famaliy Size in North Star
6-person families (21 | 0.8%) account for the highest median family income in North Star with $216,250 per family, while 2-person families (1,379 | 52.3%) have the highest median income of $83,906 per family member.
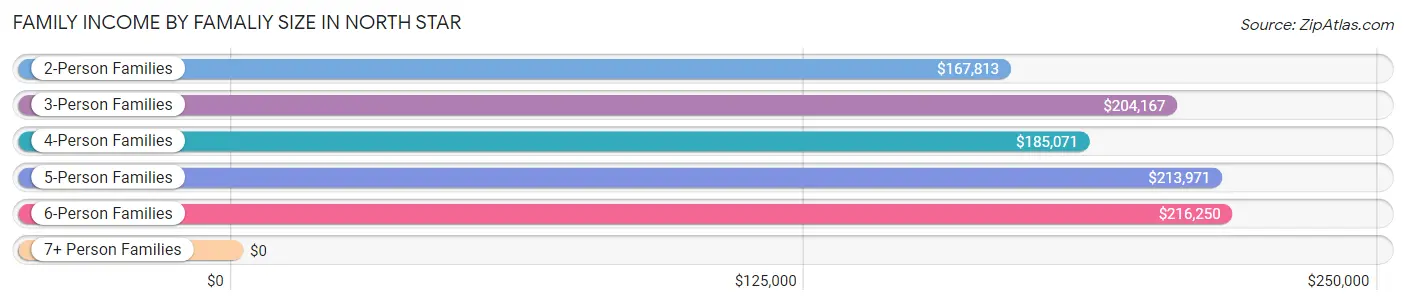
| Income Bracket | # Families | Median Income |
| 2-Person Families | 1,379 (52.3%) | $167,813 |
| 3-Person Families | 554 (21.0%) | $204,167 |
| 4-Person Families | 479 (18.2%) | $185,071 |
| 5-Person Families | 162 (6.1%) | $213,971 |
| 6-Person Families | 21 (0.8%) | $216,250 |
| 7+ Person Families | 41 (1.6%) | $0 |
| Total | 2,636 (100.0%) | $176,061 |
Family Income by Number of Earners in North Star
The median family income in North Star is $176,061, with families comprising 2 earners (1,393) having the highest median family income of $209,219, while families with no earners (314) have the lowest median family income of $94,318, accounting for 52.8% and 11.9% of families, respectively.
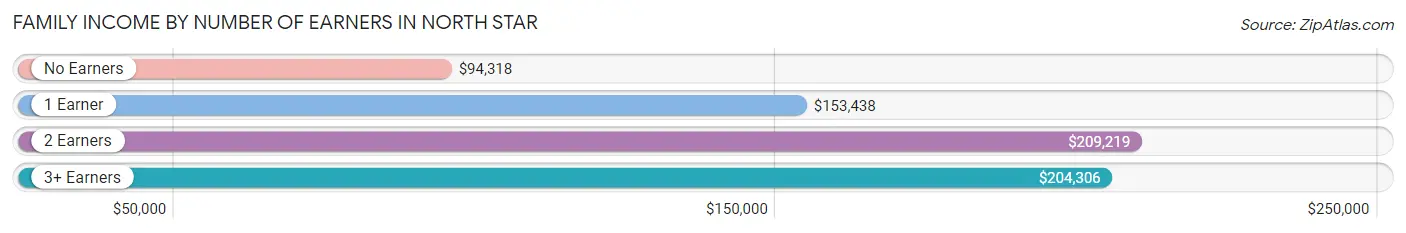
| Number of Earners | # Families | Median Income |
| No Earners | 314 (11.9%) | $94,318 |
| 1 Earner | 552 (20.9%) | $153,438 |
| 2 Earners | 1,393 (52.8%) | $209,219 |
| 3+ Earners | 377 (14.3%) | $204,306 |
| Total | 2,636 (100.0%) | $176,061 |
Household Income in North Star
Household Income Brackets in North Star
With 1,181 households falling in the category, the $200,000+ income range is the most frequent in North Star, accounting for 38.2% of all households. In contrast, only 15 households (0.5%) fall into the $10,000 to $14,999 income bracket, making it the least populous group.
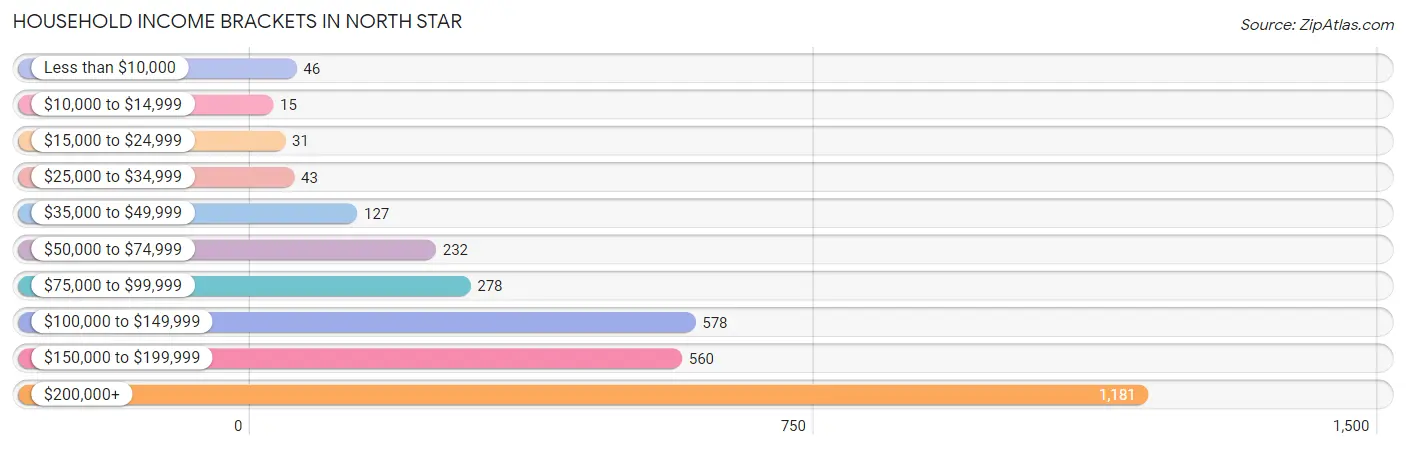
| Income Bracket | # Households | % Households |
| Less than $10,000 | 46 | 1.5% |
| $10,000 to $14,999 | 15 | 0.5% |
| $15,000 to $24,999 | 31 | 1.0% |
| $25,000 to $34,999 | 43 | 1.4% |
| $35,000 to $49,999 | 127 | 4.1% |
| $50,000 to $74,999 | 232 | 7.5% |
| $75,000 to $99,999 | 278 | 9.0% |
| $100,000 to $149,999 | 578 | 18.7% |
| $150,000 to $199,999 | 560 | 18.1% |
| $200,000+ | 1,181 | 38.2% |
Household Income by Householder Age in North Star
The median household income in North Star is $165,179, with the highest median household income of $222,000 found in the 25 to 44 years age bracket for the primary householder. A total of 634 households (20.5%) fall into this category.
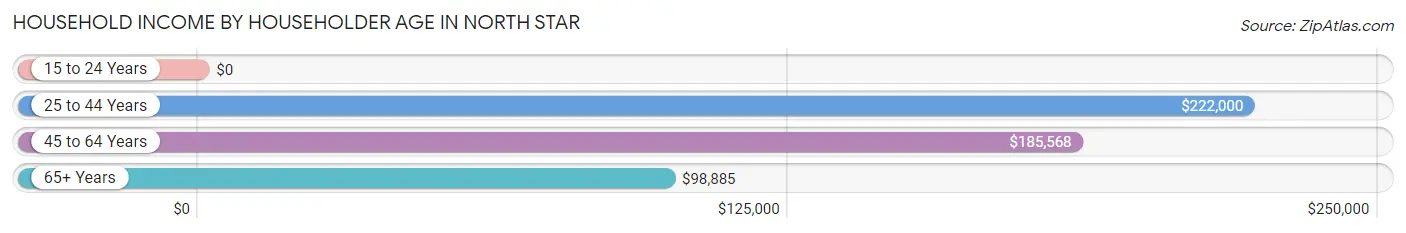
| Income Bracket | # Households | Median Income |
| 15 to 24 Years | 0 (0.0%) | $0 |
| 25 to 44 Years | 634 (20.5%) | $222,000 |
| 45 to 64 Years | 1,541 (49.8%) | $185,568 |
| 65+ Years | 917 (29.7%) | $98,885 |
| Total | 3,092 (100.0%) | $165,179 |
Poverty in North Star
Income Below Poverty by Sex and Age in North Star
With 1.3% poverty level for males and 4.5% for females among the residents of North Star, 12 to 14 year old males and 18 to 24 year old females are the most vulnerable to poverty, with 12 males (8.4%) and 55 females (19.1%) in their respective age groups living below the poverty level.
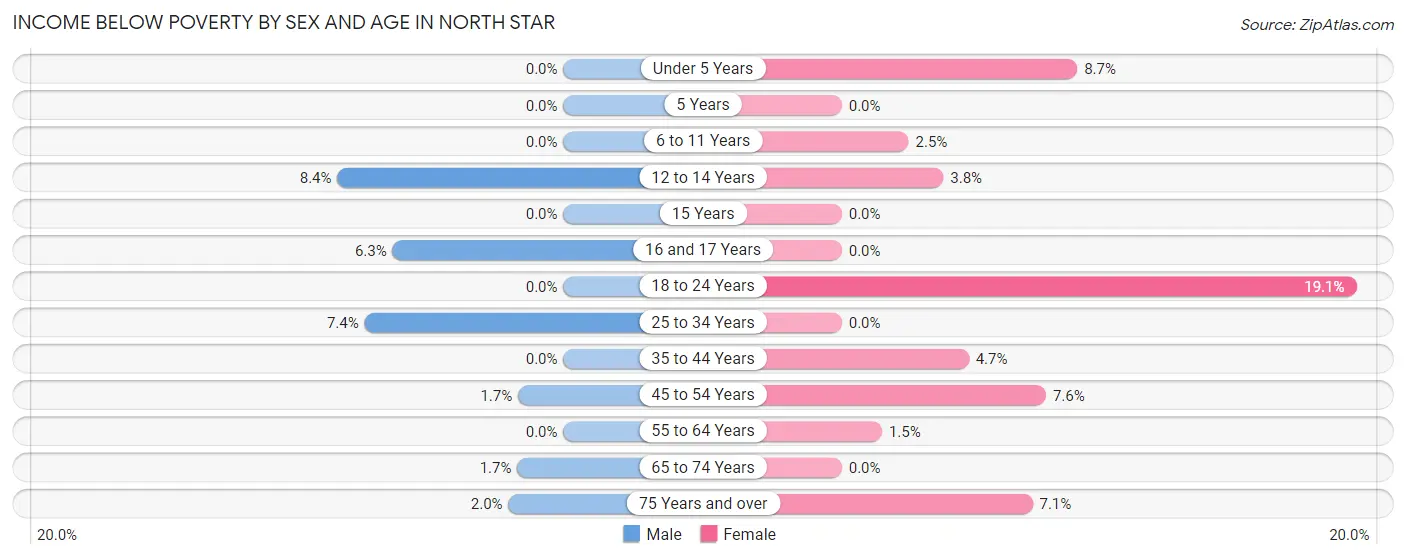
| Age Bracket | Male | Female |
| Under 5 Years | 0 (0.0%) | 9 (8.7%) |
| 5 Years | 0 (0.0%) | 0 (0.0%) |
| 6 to 11 Years | 0 (0.0%) | 8 (2.5%) |
| 12 to 14 Years | 12 (8.4%) | 8 (3.8%) |
| 15 Years | 0 (0.0%) | 0 (0.0%) |
| 16 and 17 Years | 9 (6.3%) | 0 (0.0%) |
| 18 to 24 Years | 0 (0.0%) | 55 (19.1%) |
| 25 to 34 Years | 9 (7.4%) | 0 (0.0%) |
| 35 to 44 Years | 0 (0.0%) | 28 (4.7%) |
| 45 to 54 Years | 10 (1.7%) | 43 (7.6%) |
| 55 to 64 Years | 0 (0.0%) | 15 (1.5%) |
| 65 to 74 Years | 8 (1.7%) | 0 (0.0%) |
| 75 Years and over | 6 (2.0%) | 26 (7.1%) |
| Total | 54 (1.3%) | 192 (4.5%) |
Income Above Poverty by Sex and Age in North Star
According to the poverty statistics in North Star, males aged under 5 years and females aged 5 years are the age groups that are most secure financially, with 100.0% of males and 100.0% of females in these age groups living above the poverty line.
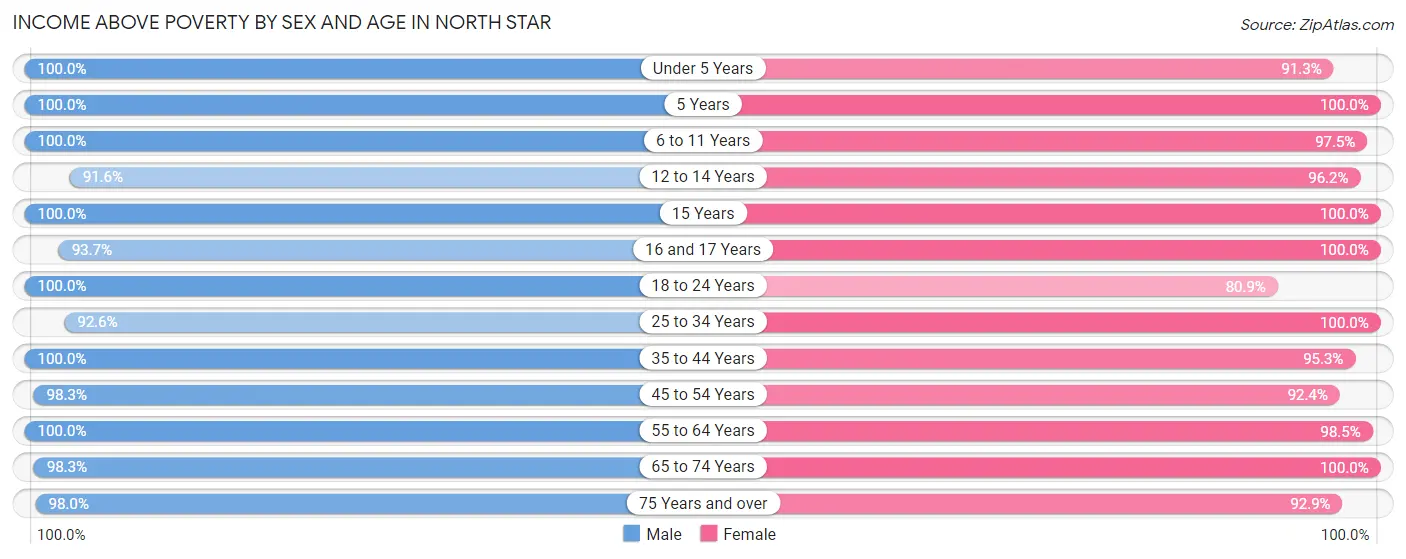
| Age Bracket | Male | Female |
| Under 5 Years | 195 (100.0%) | 94 (91.3%) |
| 5 Years | 36 (100.0%) | 36 (100.0%) |
| 6 to 11 Years | 266 (100.0%) | 315 (97.5%) |
| 12 to 14 Years | 131 (91.6%) | 204 (96.2%) |
| 15 Years | 47 (100.0%) | 54 (100.0%) |
| 16 and 17 Years | 133 (93.7%) | 71 (100.0%) |
| 18 to 24 Years | 563 (100.0%) | 233 (80.9%) |
| 25 to 34 Years | 113 (92.6%) | 162 (100.0%) |
| 35 to 44 Years | 428 (100.0%) | 566 (95.3%) |
| 45 to 54 Years | 585 (98.3%) | 524 (92.4%) |
| 55 to 64 Years | 830 (100.0%) | 995 (98.5%) |
| 65 to 74 Years | 461 (98.3%) | 453 (100.0%) |
| 75 Years and over | 288 (98.0%) | 341 (92.9%) |
| Total | 4,076 (98.7%) | 4,048 (95.5%) |
Income Below Poverty Among Married-Couple Families in North Star
The poverty statistics for married-couple families in North Star show that 1.3% or 29 of the total 2,240 families live below the poverty line. Families with 1 or 2 children have the highest poverty rate of 3.4%, comprising of 20 families. On the other hand, families with 3 or 4 children have the lowest poverty rate of 0.0%, which includes 0 families.
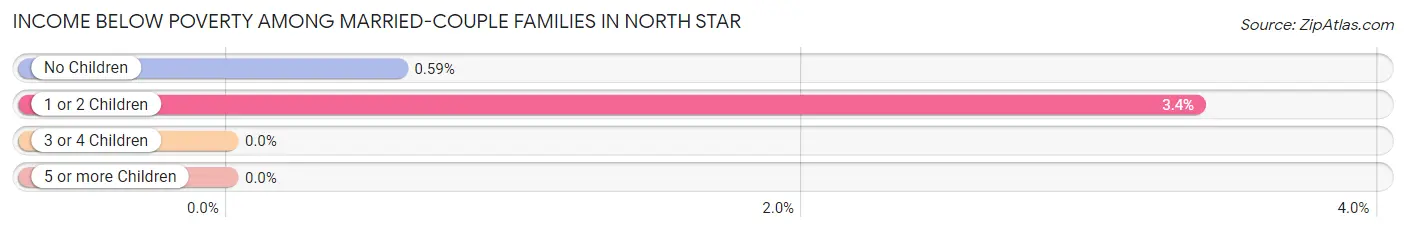
| Children | Above Poverty | Below Poverty |
| No Children | 1,512 (99.4%) | 9 (0.6%) |
| 1 or 2 Children | 573 (96.6%) | 20 (3.4%) |
| 3 or 4 Children | 94 (100.0%) | 0 (0.0%) |
| 5 or more Children | 32 (100.0%) | 0 (0.0%) |
| Total | 2,211 (98.7%) | 29 (1.3%) |
Income Below Poverty Among Single-Parent Households in North Star
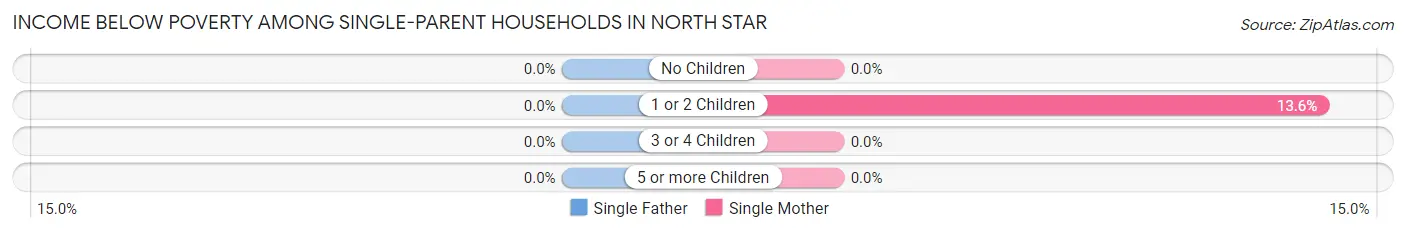
| Children | Single Father | Single Mother |
| No Children | 0 (0.0%) | 0 (0.0%) |
| 1 or 2 Children | 0 (0.0%) | 8 (13.6%) |
| 3 or 4 Children | 0 (0.0%) | 0 (0.0%) |
| 5 or more Children | 0 (0.0%) | 0 (0.0%) |
| Total | 0 (0.0%) | 8 (2.7%) |
Income Below Poverty Among Married-Couple vs Single-Parent Households in North Star
The poverty data for North Star shows that 29 of the married-couple family households (1.3%) and 8 of the single-parent households (2.0%) are living below the poverty level. Within the married-couple family households, those with 1 or 2 children have the highest poverty rate, with 20 households (3.4%) falling below the poverty line. Among the single-parent households, those with 1 or 2 children have the highest poverty rate, with 8 household (7.0%) living below poverty.
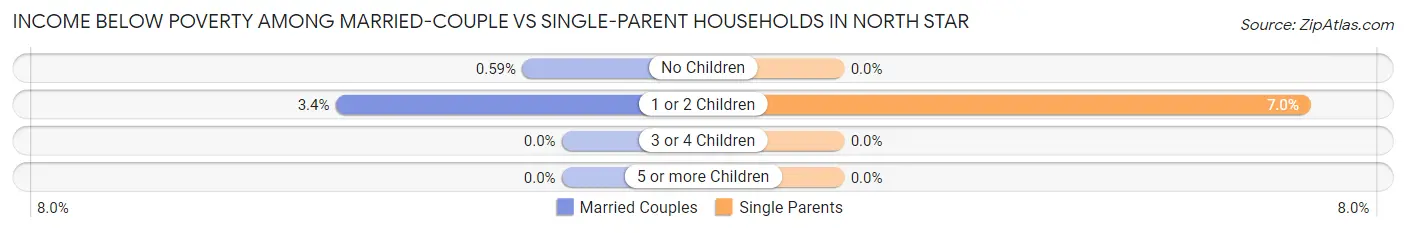
| Children | Married-Couple Families | Single-Parent Households |
| No Children | 9 (0.6%) | 0 (0.0%) |
| 1 or 2 Children | 20 (3.4%) | 8 (7.0%) |
| 3 or 4 Children | 0 (0.0%) | 0 (0.0%) |
| 5 or more Children | 0 (0.0%) | 0 (0.0%) |
| Total | 29 (1.3%) | 8 (2.0%) |
Race in North Star
The most populous races in North Star are White / Caucasian (6,733 | 80.4%), Asian (1,025 | 12.2%), and Two or more Races (385 | 4.6%).
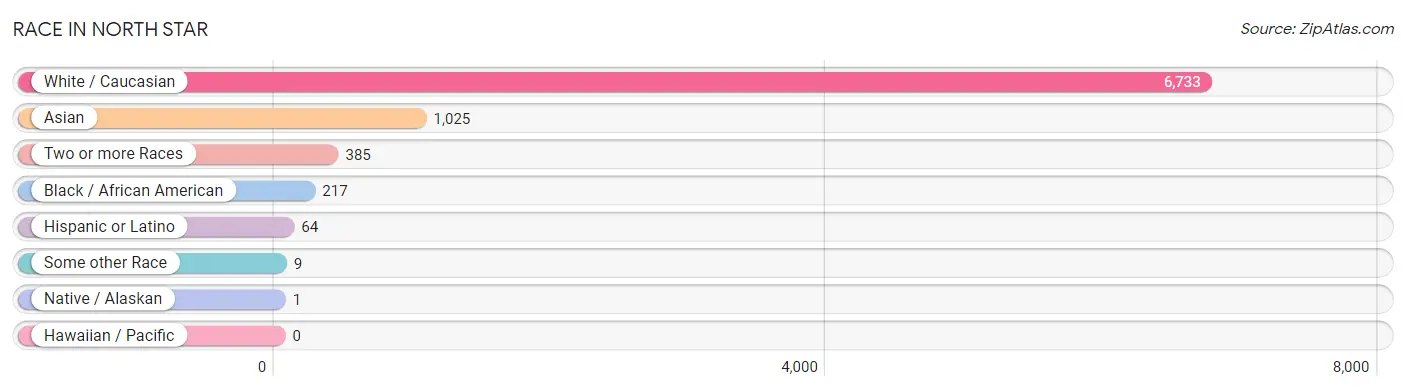
| Race | # Population | % Population |
| Asian | 1,025 | 12.2% |
| Black / African American | 217 | 2.6% |
| Hawaiian / Pacific | 0 | 0.0% |
| Hispanic or Latino | 64 | 0.8% |
| Native / Alaskan | 1 | 0.0% |
| White / Caucasian | 6,733 | 80.4% |
| Two or more Races | 385 | 4.6% |
| Some other Race | 9 | 0.1% |
| Total | 8,370 | 100.0% |
Ancestry in North Star
The most populous ancestries reported in North Star are Italian (1,752 | 20.9%), German (1,538 | 18.4%), Irish (1,354 | 16.2%), English (1,034 | 12.3%), and Thai (500 | 6.0%), together accounting for 73.8% of all North Star residents.
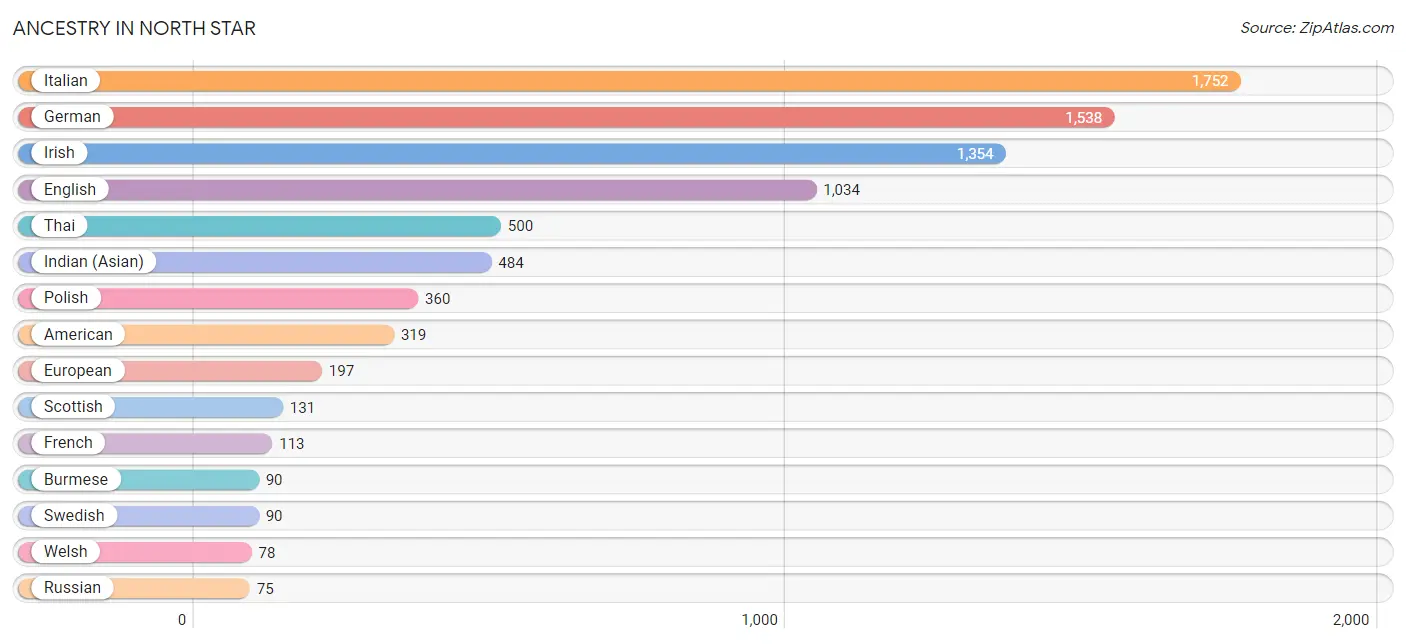
| Ancestry | # Population | % Population |
| American | 319 | 3.8% |
| Arab | 8 | 0.1% |
| Austrian | 7 | 0.1% |
| Bhutanese | 8 | 0.1% |
| British | 28 | 0.3% |
| Burmese | 90 | 1.1% |
| Central American | 30 | 0.4% |
| Cherokee | 23 | 0.3% |
| Colombian | 9 | 0.1% |
| Croatian | 11 | 0.1% |
| Cuban | 7 | 0.1% |
| Czech | 18 | 0.2% |
| Danish | 24 | 0.3% |
| Dutch | 65 | 0.8% |
| Eastern European | 40 | 0.5% |
| English | 1,034 | 12.3% |
| European | 197 | 2.4% |
| Filipino | 38 | 0.4% |
| Finnish | 14 | 0.2% |
| French | 113 | 1.3% |
| French Canadian | 4 | 0.1% |
| German | 1,538 | 18.4% |
| Greek | 59 | 0.7% |
| Hungarian | 34 | 0.4% |
| Indian (Asian) | 484 | 5.8% |
| Iranian | 24 | 0.3% |
| Irish | 1,354 | 16.2% |
| Italian | 1,752 | 20.9% |
| Lebanese | 7 | 0.1% |
| Liberian | 21 | 0.3% |
| Lithuanian | 47 | 0.6% |
| Malaysian | 9 | 0.1% |
| Maltese | 7 | 0.1% |
| Nigerian | 1 | 0.0% |
| Northern European | 6 | 0.1% |
| Polish | 360 | 4.3% |
| Portuguese | 20 | 0.2% |
| Romanian | 5 | 0.1% |
| Russian | 75 | 0.9% |
| Salvadoran | 30 | 0.4% |
| Scandinavian | 69 | 0.8% |
| Scotch-Irish | 31 | 0.4% |
| Scottish | 131 | 1.6% |
| Slovak | 39 | 0.5% |
| Slovene | 10 | 0.1% |
| South American | 9 | 0.1% |
| Spanish | 18 | 0.2% |
| Sri Lankan | 66 | 0.8% |
| Subsaharan African | 57 | 0.7% |
| Swedish | 90 | 1.1% |
| Swiss | 8 | 0.1% |
| Thai | 500 | 6.0% |
| Turkish | 8 | 0.1% |
| Ugandan | 35 | 0.4% |
| Ukrainian | 48 | 0.6% |
| Welsh | 78 | 0.9% | View All 56 Rows |
Immigrants in North Star
The most numerous immigrant groups reported in North Star came from Asia (726 | 8.7%), South Central Asia (366 | 4.4%), India (322 | 3.8%), Eastern Asia (286 | 3.4%), and China (259 | 3.1%), together accounting for 23.4% of all North Star residents.
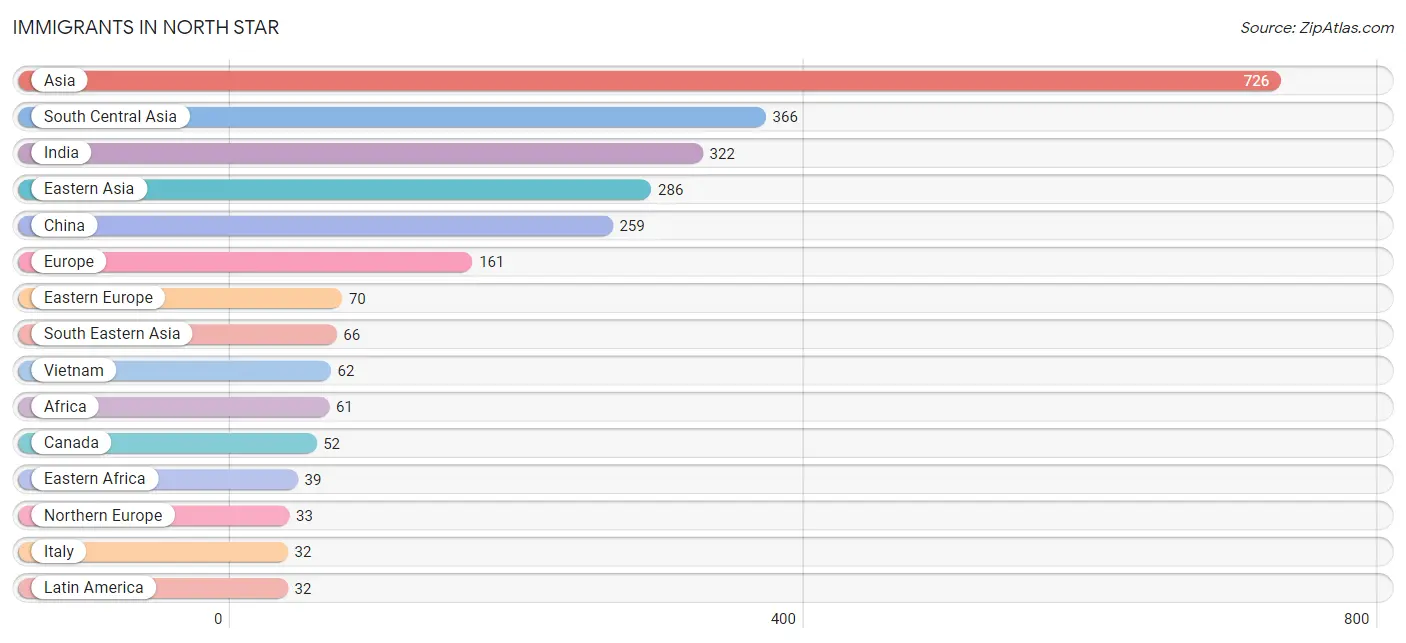
| Immigration Origin | # Population | % Population |
| Africa | 61 | 0.7% |
| Asia | 726 | 8.7% |
| Brazil | 16 | 0.2% |
| Canada | 52 | 0.6% |
| Caribbean | 7 | 0.1% |
| China | 259 | 3.1% |
| Colombia | 9 | 0.1% |
| Cuba | 7 | 0.1% |
| Eastern Africa | 39 | 0.5% |
| Eastern Asia | 286 | 3.4% |
| Eastern Europe | 70 | 0.8% |
| England | 19 | 0.2% |
| Europe | 161 | 1.9% |
| France | 1 | 0.0% |
| Germany | 25 | 0.3% |
| Hong Kong | 26 | 0.3% |
| India | 322 | 3.8% |
| Iran | 7 | 0.1% |
| Italy | 32 | 0.4% |
| Japan | 15 | 0.2% |
| Korea | 12 | 0.1% |
| Laos | 4 | 0.1% |
| Latin America | 32 | 0.4% |
| Latvia | 14 | 0.2% |
| Liberia | 21 | 0.3% |
| Nigeria | 1 | 0.0% |
| Northern Europe | 33 | 0.4% |
| Pakistan | 14 | 0.2% |
| Poland | 14 | 0.2% |
| Romania | 5 | 0.1% |
| Russia | 32 | 0.4% |
| South America | 25 | 0.3% |
| South Central Asia | 366 | 4.4% |
| South Eastern Asia | 66 | 0.8% |
| Southern Europe | 32 | 0.4% |
| Sri Lanka | 23 | 0.3% |
| Taiwan | 32 | 0.4% |
| Turkey | 8 | 0.1% |
| Uganda | 25 | 0.3% |
| Vietnam | 62 | 0.7% |
| Western Africa | 22 | 0.3% |
| Western Asia | 8 | 0.1% |
| Western Europe | 26 | 0.3% | View All 43 Rows |
Sex and Age in North Star
Sex and Age in North Star
The most populous age groups in North Star are 60 to 64 Years (540 | 13.1%) for men and 60 to 64 Years (730 | 17.2%) for women.
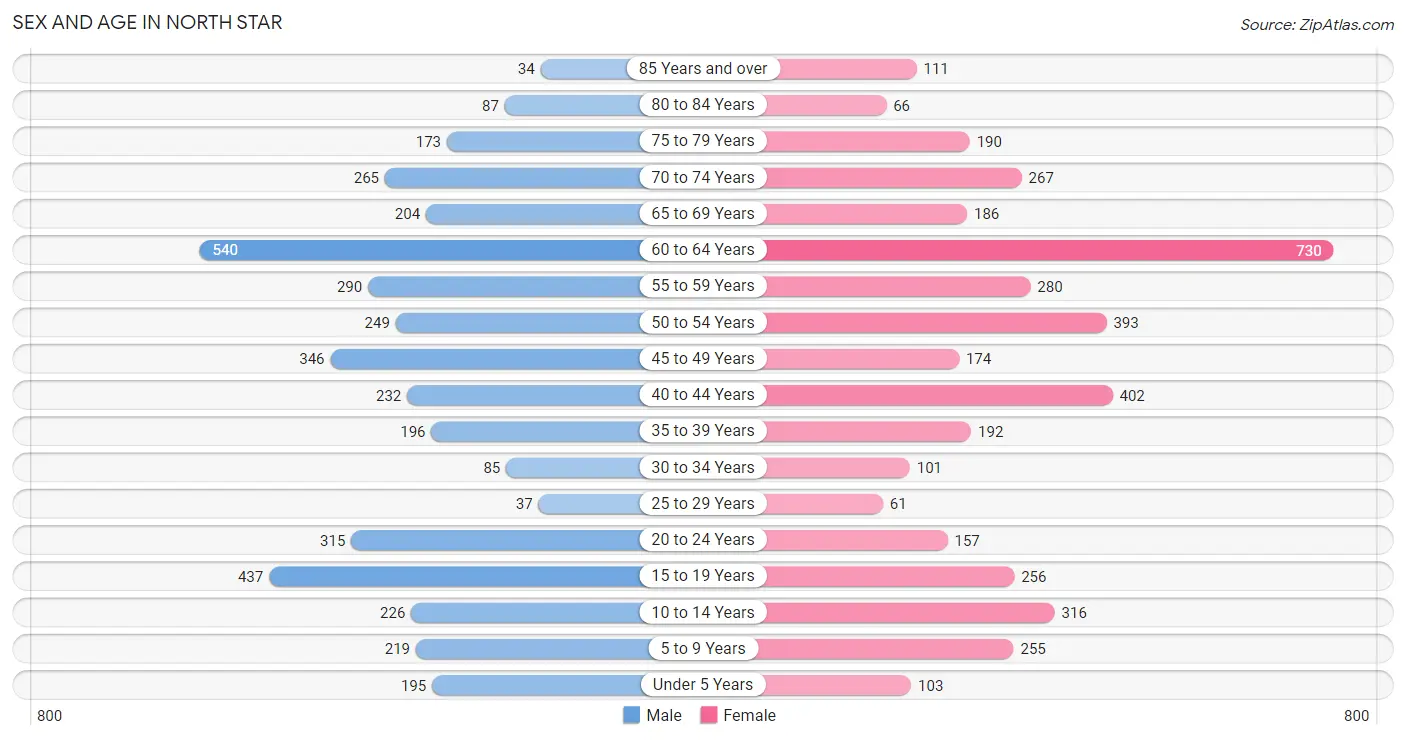
| Age Bracket | Male | Female |
| Under 5 Years | 195 (4.7%) | 103 (2.4%) |
| 5 to 9 Years | 219 (5.3%) | 255 (6.0%) |
| 10 to 14 Years | 226 (5.5%) | 316 (7.4%) |
| 15 to 19 Years | 437 (10.6%) | 256 (6.0%) |
| 20 to 24 Years | 315 (7.6%) | 157 (3.7%) |
| 25 to 29 Years | 37 (0.9%) | 61 (1.4%) |
| 30 to 34 Years | 85 (2.1%) | 101 (2.4%) |
| 35 to 39 Years | 196 (4.8%) | 192 (4.5%) |
| 40 to 44 Years | 232 (5.6%) | 402 (9.5%) |
| 45 to 49 Years | 346 (8.4%) | 174 (4.1%) |
| 50 to 54 Years | 249 (6.0%) | 393 (9.3%) |
| 55 to 59 Years | 290 (7.0%) | 280 (6.6%) |
| 60 to 64 Years | 540 (13.1%) | 730 (17.2%) |
| 65 to 69 Years | 204 (4.9%) | 186 (4.4%) |
| 70 to 74 Years | 265 (6.4%) | 267 (6.3%) |
| 75 to 79 Years | 173 (4.2%) | 190 (4.5%) |
| 80 to 84 Years | 87 (2.1%) | 66 (1.6%) |
| 85 Years and over | 34 (0.8%) | 111 (2.6%) |
| Total | 4,130 (100.0%) | 4,240 (100.0%) |
Families and Households in North Star
Median Family Size in North Star
The median family size in North Star is 2.93 persons per family, with married-couple families (2,240 | 85.0%) accounting for the largest median family size of 3.03 persons per family. On the other hand, single female/mother families (301 | 11.4%) represent the smallest median family size with 2.19 persons per family.
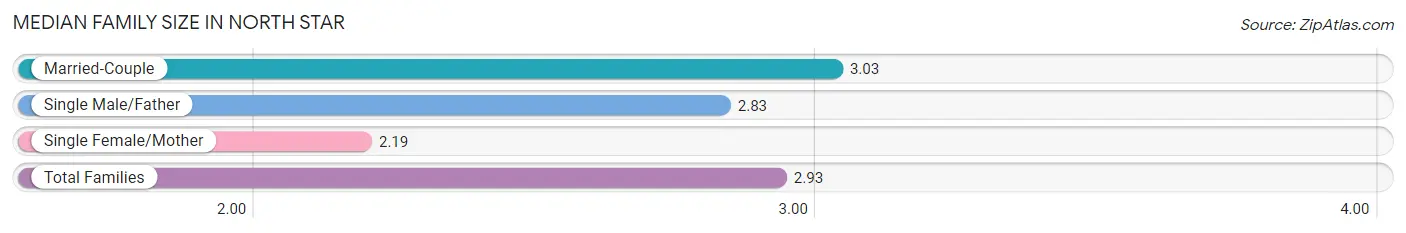
| Family Type | # Families | Family Size |
| Married-Couple | 2,240 (85.0%) | 3.03 |
| Single Male/Father | 95 (3.6%) | 2.83 |
| Single Female/Mother | 301 (11.4%) | 2.19 |
| Total Families | 2,636 (100.0%) | 2.93 |
Median Household Size in North Star
The median household size in North Star is 2.71 persons per household, with married-couple households (2,240 | 72.5%) accounting for the largest median household size of 3.08 persons per household. non-family households (456 | 14.7%) represent the smallest median household size with 1.15 persons per household.
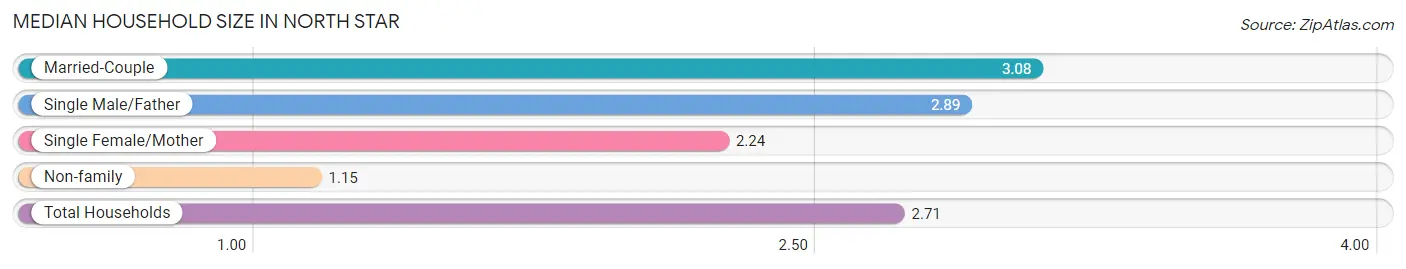
| Household Type | # Households | Household Size |
| Married-Couple | 2,240 (72.5%) | 3.08 |
| Single Male/Father | 95 (3.1%) | 2.89 |
| Single Female/Mother | 301 (9.7%) | 2.24 |
| Non-family | 456 (14.7%) | 1.15 |
| Total Households | 3,092 (100.0%) | 2.71 |
Household Size by Marriage Status in North Star
Out of a total of 3,092 households in North Star, 2,636 (85.3%) are family households, while 456 (14.7%) are nonfamily households. The most numerous type of family households are 2-person households, comprising 1,357, and the most common type of nonfamily households are 1-person households, comprising 386.
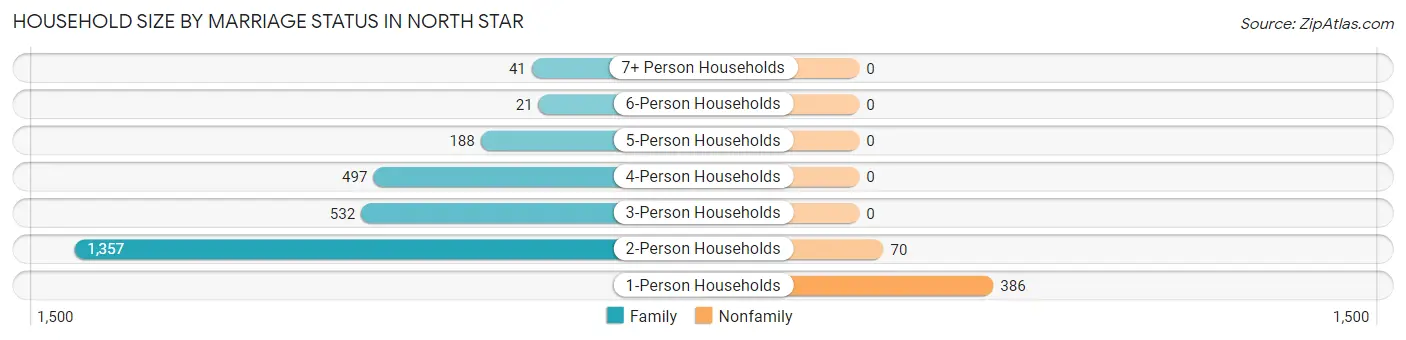
| Household Size | Family Households | Nonfamily Households |
| 1-Person Households | - | 386 (12.5%) |
| 2-Person Households | 1,357 (43.9%) | 70 (2.3%) |
| 3-Person Households | 532 (17.2%) | 0 (0.0%) |
| 4-Person Households | 497 (16.1%) | 0 (0.0%) |
| 5-Person Households | 188 (6.1%) | 0 (0.0%) |
| 6-Person Households | 21 (0.7%) | 0 (0.0%) |
| 7+ Person Households | 41 (1.3%) | 0 (0.0%) |
| Total | 2,636 (85.3%) | 456 (14.7%) |
Female Fertility in North Star
Fertility by Age in North Star
Average fertility rate in North Star is 13.0 births per 1,000 women. Women in the age bracket of 20 to 34 years have the highest fertility rate with 38.0 births per 1,000 women. Women in the age bracket of 20 to 34 years acount for 63.2% of all women with births.
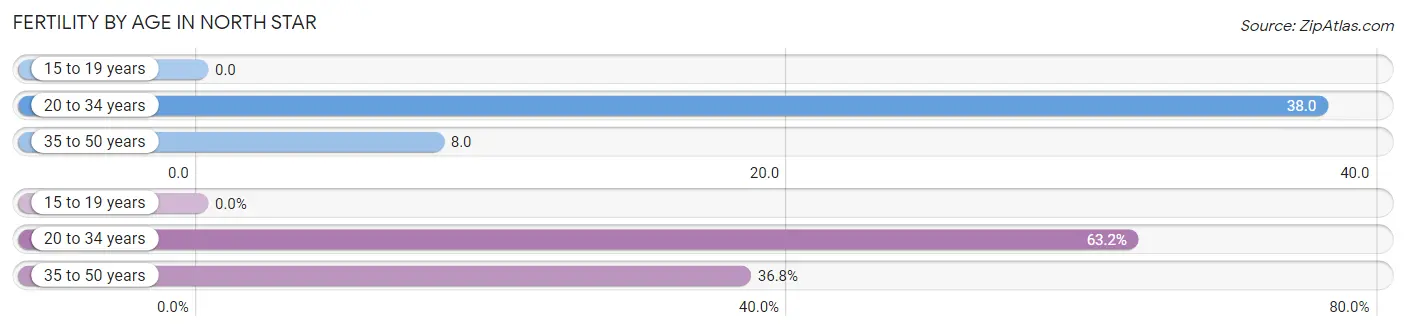
| Age Bracket | Women with Births | Births / 1,000 Women |
| 15 to 19 years | 0 (0.0%) | 0.0 |
| 20 to 34 years | 12 (63.2%) | 38.0 |
| 35 to 50 years | 7 (36.8%) | 8.0 |
| Total | 19 (100.0%) | 13.0 |
Fertility by Age by Marriage Status in North Star
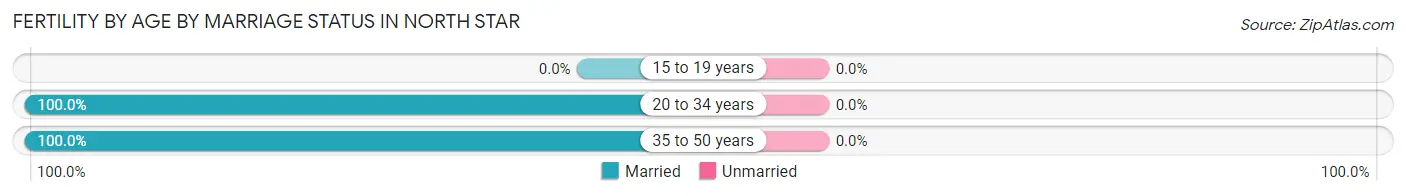
| Age Bracket | Married | Unmarried |
| 15 to 19 years | 0 (0.0%) | 0 (0.0%) |
| 20 to 34 years | 12 (100.0%) | 0 (0.0%) |
| 35 to 50 years | 7 (100.0%) | 0 (0.0%) |
| Total | 19 (100.0%) | 0 (0.0%) |
Fertility by Education in North Star
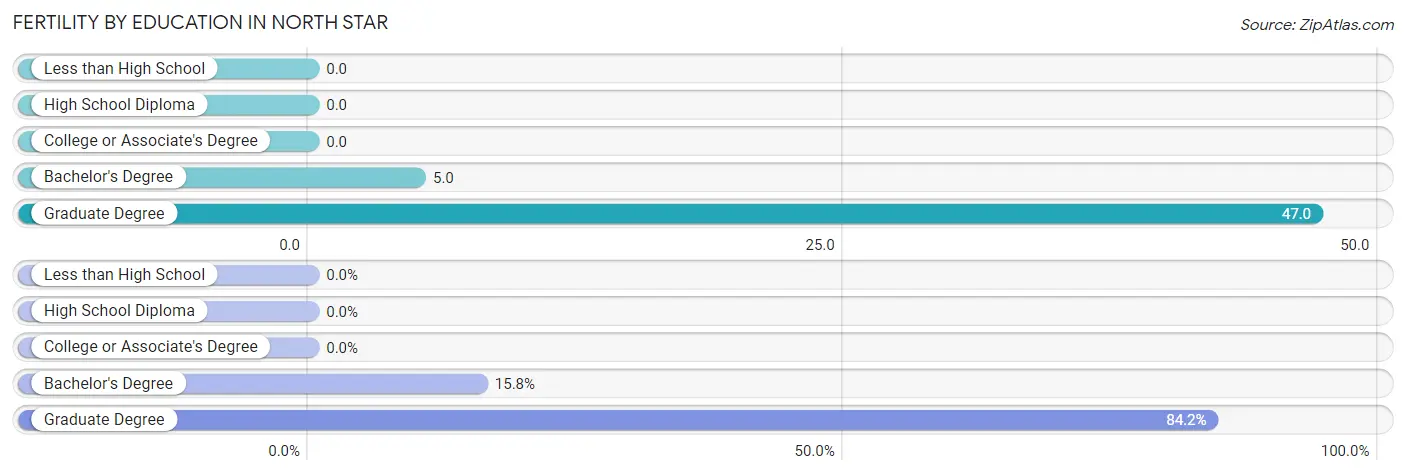
| Educational Attainment | Women with Births | Births / 1,000 Women |
| Less than High School | 0 (0.0%) | 0.0 |
| High School Diploma | 0 (0.0%) | 0.0 |
| College or Associate's Degree | 0 (0.0%) | 0.0 |
| Bachelor's Degree | 3 (15.8%) | 5.0 |
| Graduate Degree | 16 (84.2%) | 47.0 |
| Total | 19 (100.0%) | 13.0 |
Fertility by Education by Marriage Status in North Star
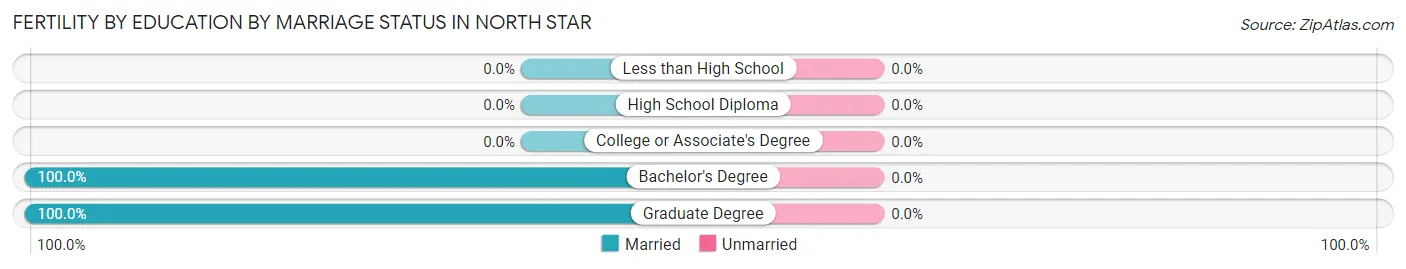
| Educational Attainment | Married | Unmarried |
| Less than High School | 0 (0.0%) | 0 (0.0%) |
| High School Diploma | 0 (0.0%) | 0 (0.0%) |
| College or Associate's Degree | 0 (0.0%) | 0 (0.0%) |
| Bachelor's Degree | 3 (100.0%) | 0 (0.0%) |
| Graduate Degree | 16 (100.0%) | 0 (0.0%) |
| Total | 19 (100.0%) | 0 (0.0%) |
Employment Characteristics in North Star
Employment by Class of Employer in North Star
Among the 4,038 employed individuals in North Star, private company employees (2,819 | 69.8%), not-for-profit organizations (297 | 7.4%), and self-employed (incorporated) (292 | 7.2%) make up the most common classes of employment.
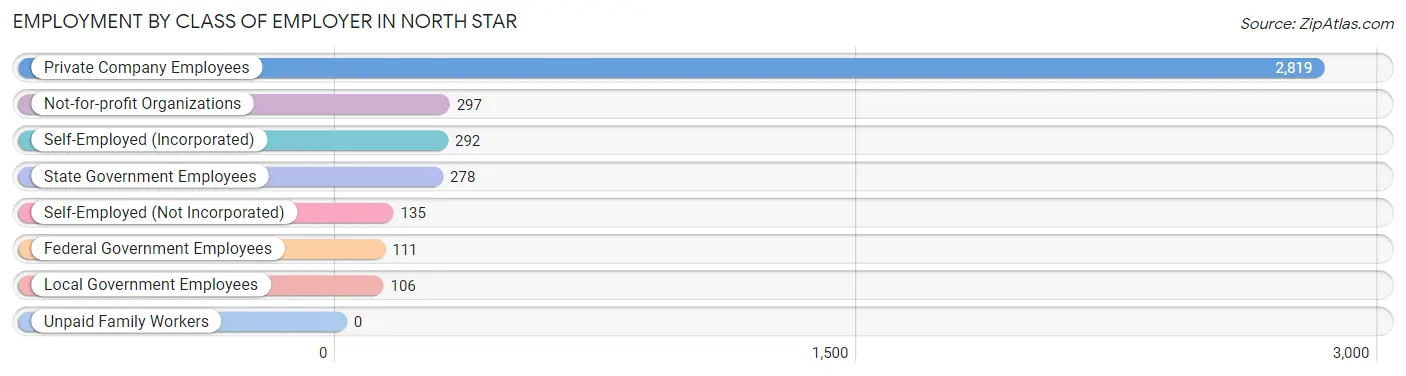
| Employer Class | # Employees | % Employees |
| Private Company Employees | 2,819 | 69.8% |
| Self-Employed (Incorporated) | 292 | 7.2% |
| Self-Employed (Not Incorporated) | 135 | 3.3% |
| Not-for-profit Organizations | 297 | 7.4% |
| Local Government Employees | 106 | 2.6% |
| State Government Employees | 278 | 6.9% |
| Federal Government Employees | 111 | 2.8% |
| Unpaid Family Workers | 0 | 0.0% |
| Total | 4,038 | 100.0% |
Employment Status by Age in North Star
According to the labor force statistics for North Star, out of the total population over 16 years of age (6,955), 63.6% or 4,423 individuals are in the labor force, with 3.7% or 164 of them unemployed. The age group with the highest labor force participation rate is 25 to 29 years, with 96.9% or 95 individuals in the labor force. Within the labor force, the 25 to 29 years age range has the highest percentage of unemployed individuals, with 26.3% or 25 of them being unemployed.
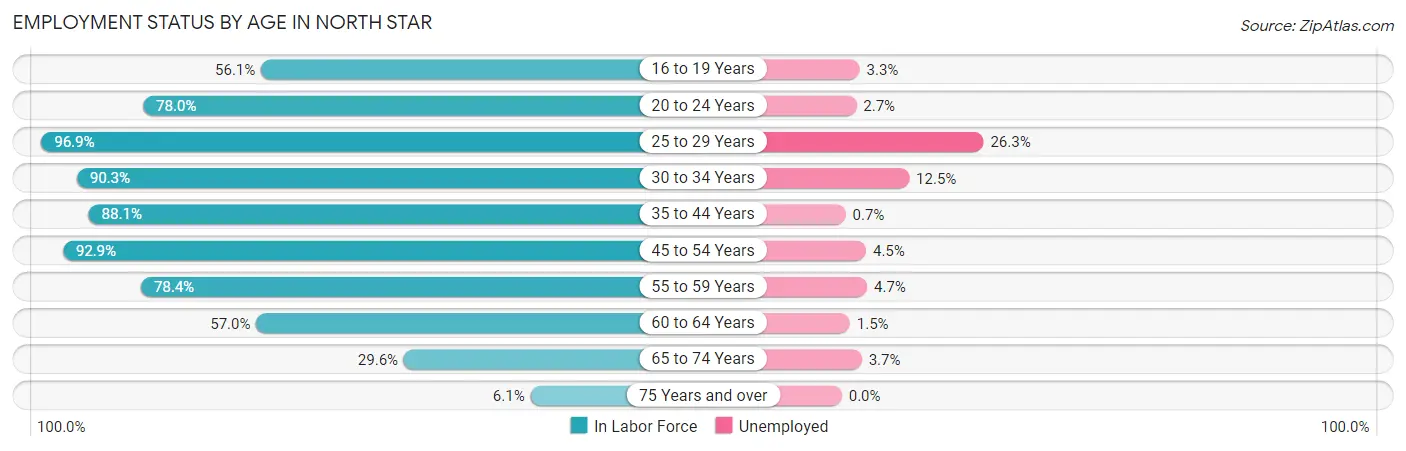
| Age Bracket | In Labor Force | Unemployed |
| 16 to 19 Years | 332 (56.1%) | 11 (3.3%) |
| 20 to 24 Years | 368 (78.0%) | 10 (2.7%) |
| 25 to 29 Years | 95 (96.9%) | 25 (26.3%) |
| 30 to 34 Years | 168 (90.3%) | 21 (12.5%) |
| 35 to 44 Years | 900 (88.1%) | 6 (0.7%) |
| 45 to 54 Years | 1,079 (92.9%) | 49 (4.5%) |
| 55 to 59 Years | 447 (78.4%) | 21 (4.7%) |
| 60 to 64 Years | 724 (57.0%) | 11 (1.5%) |
| 65 to 74 Years | 273 (29.6%) | 10 (3.7%) |
| 75 Years and over | 40 (6.1%) | 0 (0.0%) |
| Total | 4,423 (63.6%) | 164 (3.7%) |
Employment Status by Educational Attainment in North Star
According to labor force statistics for North Star, 79.2% of individuals (3,412) out of the total population between 25 and 64 years of age (4,308) are in the labor force, with 3.9% or 133 of them being unemployed. The group with the highest labor force participation rate are those with the educational attainment of high school diploma, with 82.4% or 365 individuals in the labor force. Within the labor force, individuals with high school diploma education have the highest percentage of unemployment, with 15.6% or 57 of them being unemployed.
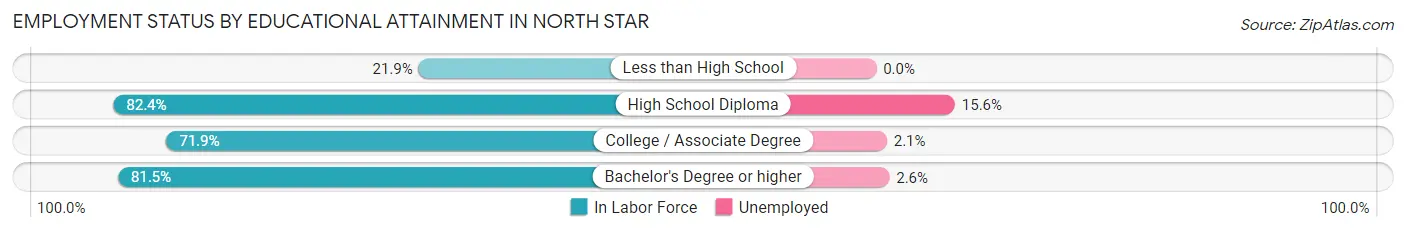
| Educational Attainment | In Labor Force | Unemployed |
| Less than High School | 14 (21.9%) | 0 (0.0%) |
| High School Diploma | 365 (82.4%) | 69 (15.6%) |
| College / Associate Degree | 468 (71.9%) | 14 (2.1%) |
| Bachelor's Degree or higher | 2,567 (81.5%) | 82 (2.6%) |
| Total | 3,412 (79.2%) | 168 (3.9%) |
Employment Occupations by Sex in North Star
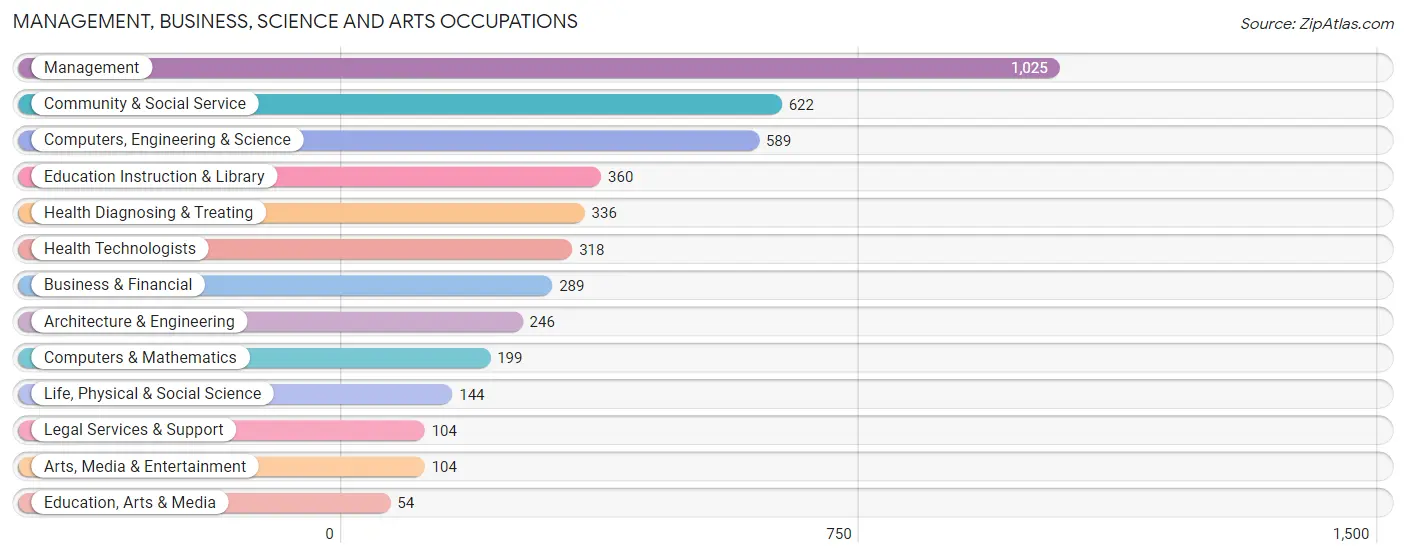
Management, Business, Science and Arts Occupations
The most common Management, Business, Science and Arts occupations in North Star are Management (1,025 | 24.0%), Community & Social Service (622 | 14.6%), Computers, Engineering & Science (589 | 13.8%), Education Instruction & Library (360 | 8.5%), and Health Diagnosing & Treating (336 | 7.9%).
Management, Business, Science and Arts Occupations by Sex
Within the Management, Business, Science and Arts occupations in North Star, the most male-oriented occupations are Architecture & Engineering (100.0%), Computers, Engineering & Science (80.6%), and Computers & Mathematics (78.4%), while the most female-oriented occupations are Education Instruction & Library (79.2%), Health Diagnosing & Treating (78.0%), and Health Technologists (76.7%).
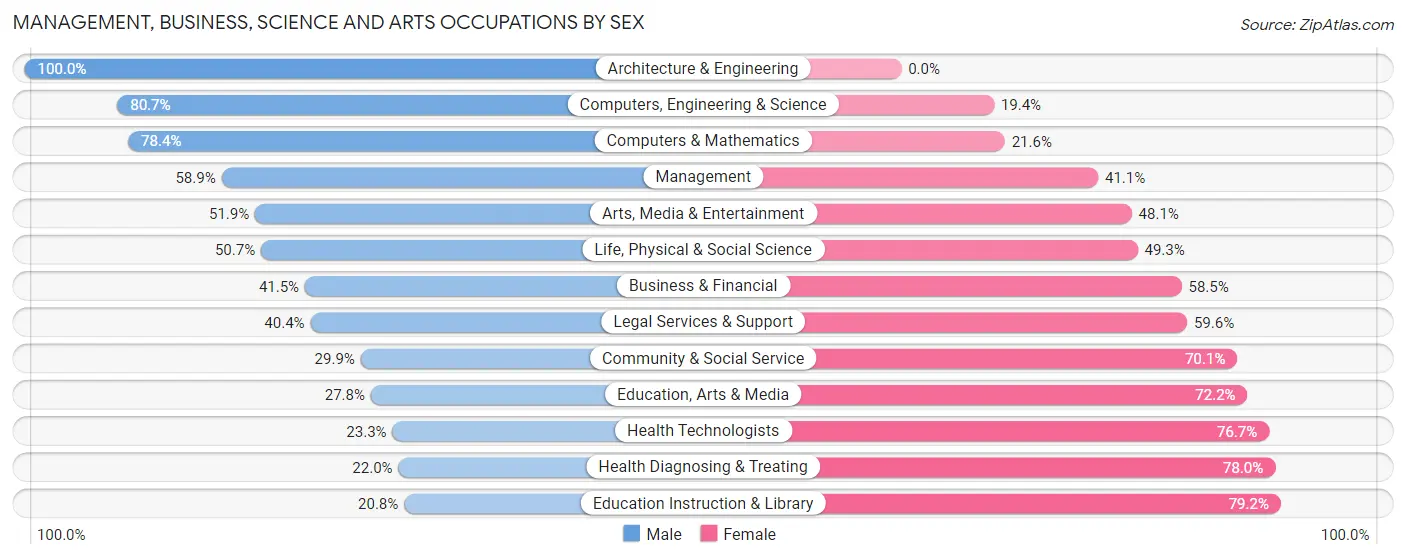
| Occupation | Male | Female |
| Management | 604 (58.9%) | 421 (41.1%) |
| Business & Financial | 120 (41.5%) | 169 (58.5%) |
| Computers, Engineering & Science | 475 (80.6%) | 114 (19.4%) |
| Computers & Mathematics | 156 (78.4%) | 43 (21.6%) |
| Architecture & Engineering | 246 (100.0%) | 0 (0.0%) |
| Life, Physical & Social Science | 73 (50.7%) | 71 (49.3%) |
| Community & Social Service | 186 (29.9%) | 436 (70.1%) |
| Education, Arts & Media | 15 (27.8%) | 39 (72.2%) |
| Legal Services & Support | 42 (40.4%) | 62 (59.6%) |
| Education Instruction & Library | 75 (20.8%) | 285 (79.2%) |
| Arts, Media & Entertainment | 54 (51.9%) | 50 (48.1%) |
| Health Diagnosing & Treating | 74 (22.0%) | 262 (78.0%) |
| Health Technologists | 74 (23.3%) | 244 (76.7%) |
| Total (Category) | 1,459 (51.0%) | 1,402 (49.0%) |
| Total (Overall) | 2,414 (56.6%) | 1,848 (43.4%) |
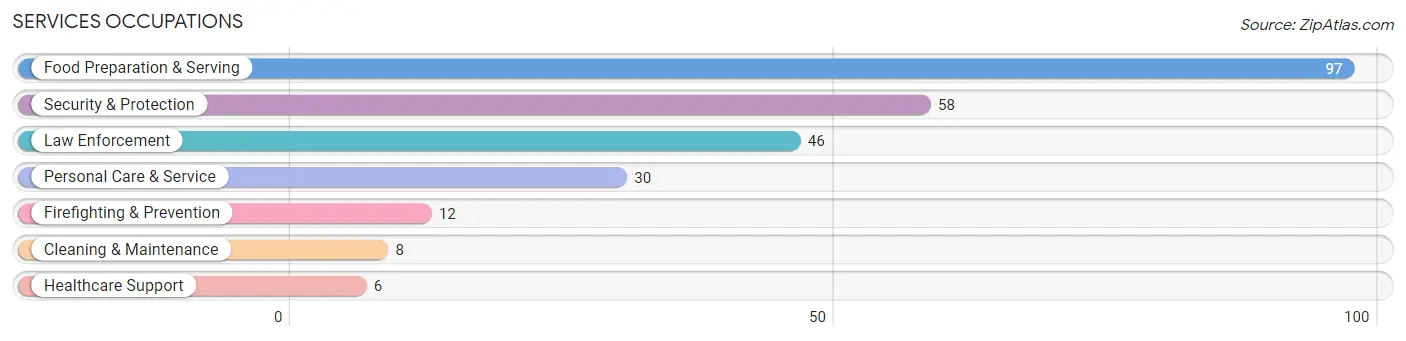
Services Occupations
The most common Services occupations in North Star are Food Preparation & Serving (97 | 2.3%), Security & Protection (58 | 1.4%), Law Enforcement (46 | 1.1%), Personal Care & Service (30 | 0.7%), and Firefighting & Prevention (12 | 0.3%).
Services Occupations by Sex
Within the Services occupations in North Star, the most male-oriented occupations are Security & Protection (100.0%), Firefighting & Prevention (100.0%), and Law Enforcement (100.0%), while the most female-oriented occupations are Healthcare Support (100.0%), Food Preparation & Serving (63.9%), and Personal Care & Service (53.3%).
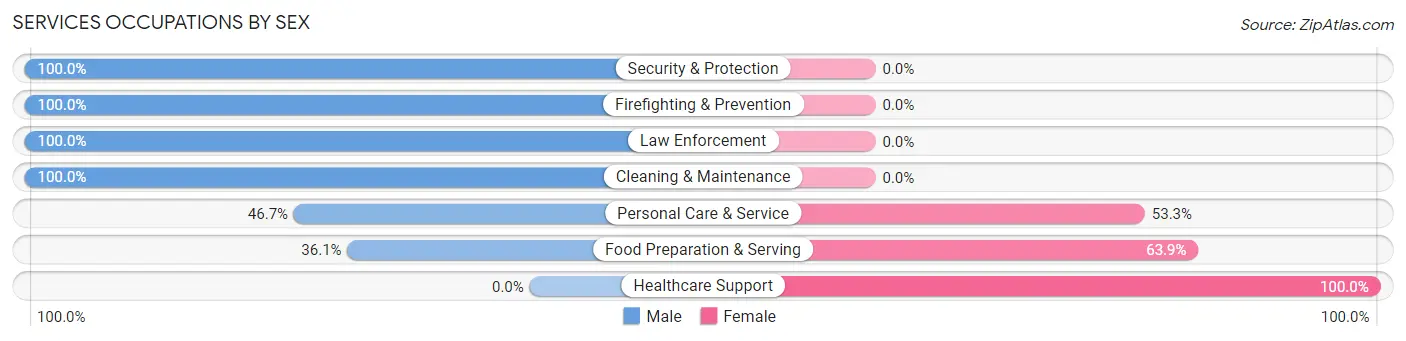
| Occupation | Male | Female |
| Healthcare Support | 0 (0.0%) | 6 (100.0%) |
| Security & Protection | 58 (100.0%) | 0 (0.0%) |
| Firefighting & Prevention | 12 (100.0%) | 0 (0.0%) |
| Law Enforcement | 46 (100.0%) | 0 (0.0%) |
| Food Preparation & Serving | 35 (36.1%) | 62 (63.9%) |
| Cleaning & Maintenance | 8 (100.0%) | 0 (0.0%) |
| Personal Care & Service | 14 (46.7%) | 16 (53.3%) |
| Total (Category) | 115 (57.8%) | 84 (42.2%) |
| Total (Overall) | 2,414 (56.6%) | 1,848 (43.4%) |
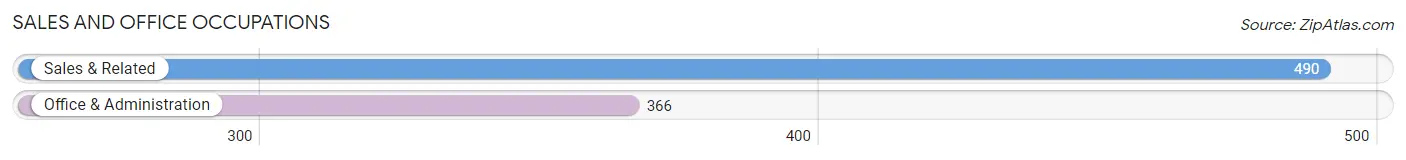
Sales and Office Occupations
The most common Sales and Office occupations in North Star are Sales & Related (490 | 11.5%), and Office & Administration (366 | 8.6%).
Sales and Office Occupations by Sex
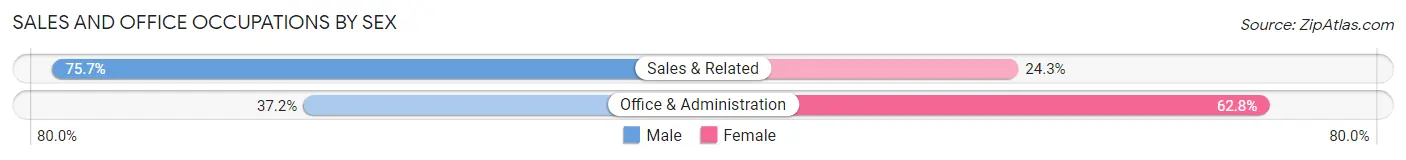
| Occupation | Male | Female |
| Sales & Related | 371 (75.7%) | 119 (24.3%) |
| Office & Administration | 136 (37.2%) | 230 (62.8%) |
| Total (Category) | 507 (59.2%) | 349 (40.8%) |
| Total (Overall) | 2,414 (56.6%) | 1,848 (43.4%) |
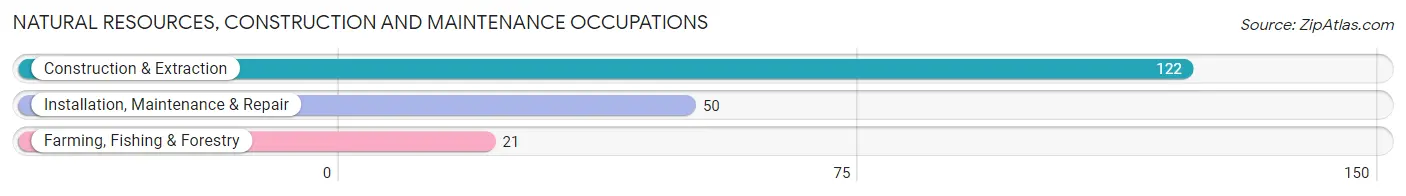
Natural Resources, Construction and Maintenance Occupations
The most common Natural Resources, Construction and Maintenance occupations in North Star are Construction & Extraction (122 | 2.9%), Installation, Maintenance & Repair (50 | 1.2%), and Farming, Fishing & Forestry (21 | 0.5%).
Natural Resources, Construction and Maintenance Occupations by Sex
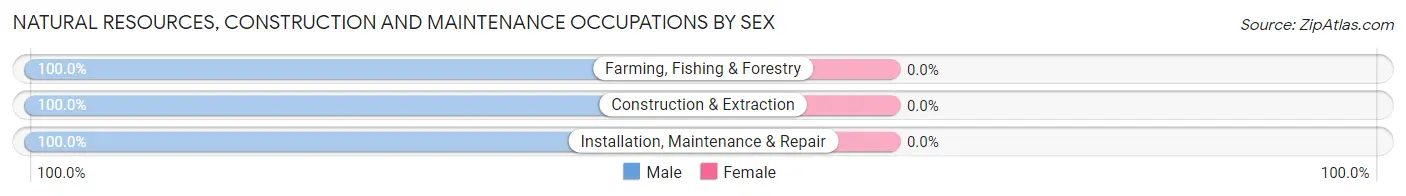
| Occupation | Male | Female |
| Farming, Fishing & Forestry | 21 (100.0%) | 0 (0.0%) |
| Construction & Extraction | 122 (100.0%) | 0 (0.0%) |
| Installation, Maintenance & Repair | 50 (100.0%) | 0 (0.0%) |
| Total (Category) | 193 (100.0%) | 0 (0.0%) |
| Total (Overall) | 2,414 (56.6%) | 1,848 (43.4%) |
Production, Transportation and Moving Occupations
The most common Production, Transportation and Moving occupations in North Star are Material Moving (66 | 1.5%), Production (61 | 1.4%), and Transportation (26 | 0.6%).
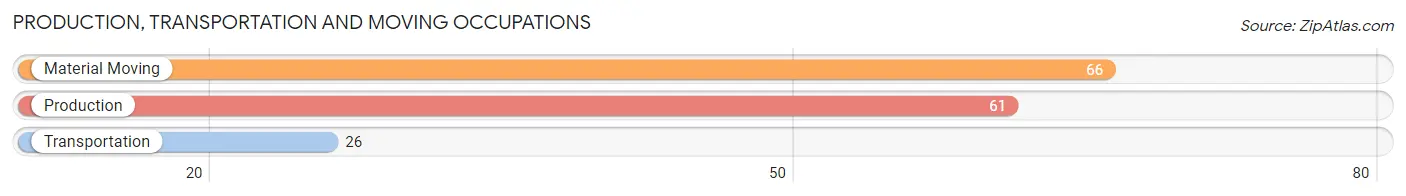
Production, Transportation and Moving Occupations by Sex
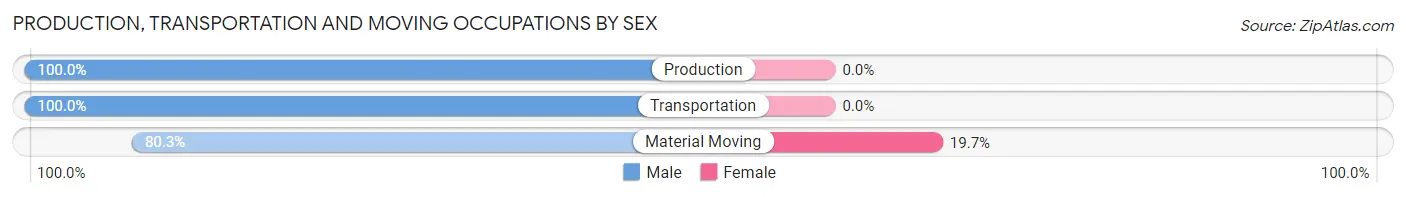
| Occupation | Male | Female |
| Production | 61 (100.0%) | 0 (0.0%) |
| Transportation | 26 (100.0%) | 0 (0.0%) |
| Material Moving | 53 (80.3%) | 13 (19.7%) |
| Total (Category) | 140 (91.5%) | 13 (8.5%) |
| Total (Overall) | 2,414 (56.6%) | 1,848 (43.4%) |
Employment Industries by Sex in North Star
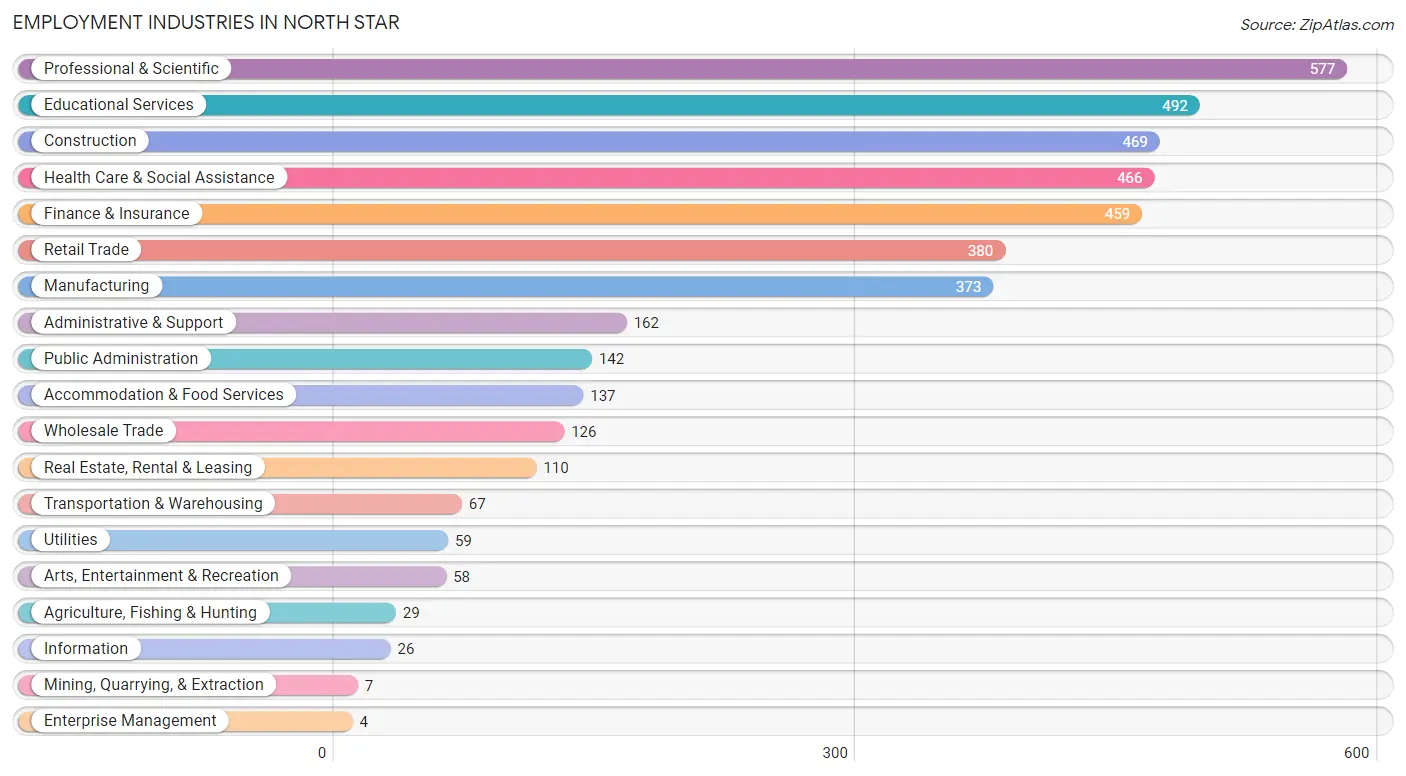
Employment Industries in North Star
The major employment industries in North Star include Professional & Scientific (577 | 13.5%), Educational Services (492 | 11.5%), Construction (469 | 11.0%), Health Care & Social Assistance (466 | 10.9%), and Finance & Insurance (459 | 10.8%).
Employment Industries by Sex in North Star
The North Star industries that see more men than women are Enterprise Management (100.0%), Utilities (88.1%), and Transportation & Warehousing (88.1%), whereas the industries that tend to have a higher number of women are Mining, Quarrying, & Extraction (100.0%), Health Care & Social Assistance (76.2%), and Educational Services (74.4%).
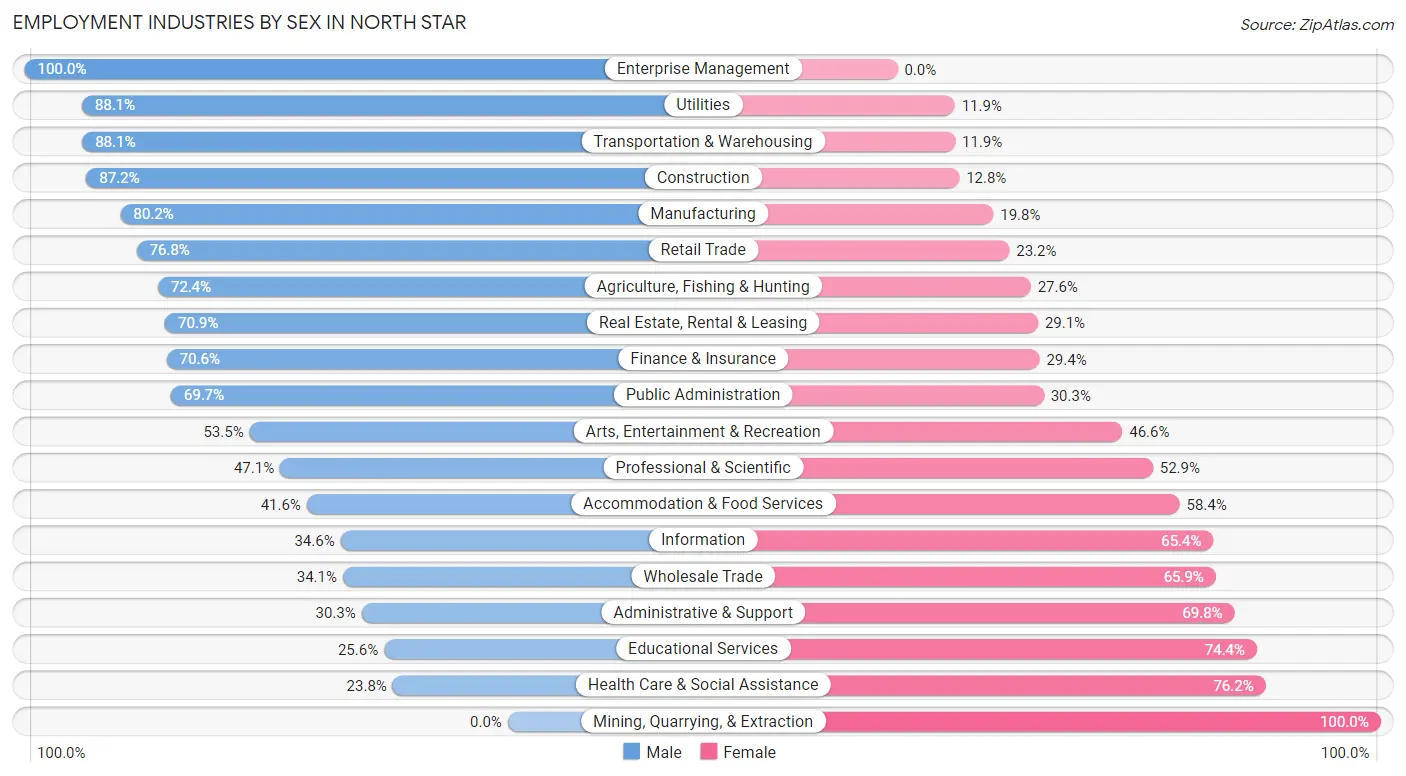
| Industry | Male | Female |
| Agriculture, Fishing & Hunting | 21 (72.4%) | 8 (27.6%) |
| Mining, Quarrying, & Extraction | 0 (0.0%) | 7 (100.0%) |
| Construction | 409 (87.2%) | 60 (12.8%) |
| Manufacturing | 299 (80.2%) | 74 (19.8%) |
| Wholesale Trade | 43 (34.1%) | 83 (65.9%) |
| Retail Trade | 292 (76.8%) | 88 (23.2%) |
| Transportation & Warehousing | 59 (88.1%) | 8 (11.9%) |
| Utilities | 52 (88.1%) | 7 (11.9%) |
| Information | 9 (34.6%) | 17 (65.4%) |
| Finance & Insurance | 324 (70.6%) | 135 (29.4%) |
| Real Estate, Rental & Leasing | 78 (70.9%) | 32 (29.1%) |
| Professional & Scientific | 272 (47.1%) | 305 (52.9%) |
| Enterprise Management | 4 (100.0%) | 0 (0.0%) |
| Administrative & Support | 49 (30.2%) | 113 (69.8%) |
| Educational Services | 126 (25.6%) | 366 (74.4%) |
| Health Care & Social Assistance | 111 (23.8%) | 355 (76.2%) |
| Arts, Entertainment & Recreation | 31 (53.4%) | 27 (46.6%) |
| Accommodation & Food Services | 57 (41.6%) | 80 (58.4%) |
| Public Administration | 99 (69.7%) | 43 (30.3%) |
| Total | 2,414 (56.6%) | 1,848 (43.4%) |
Education in North Star
School Enrollment in North Star
The most common levels of schooling among the 1,962 students in North Star are elementary school (428 | 21.8%), college / undergraduate (427 | 21.8%), and middle school (414 | 21.1%).
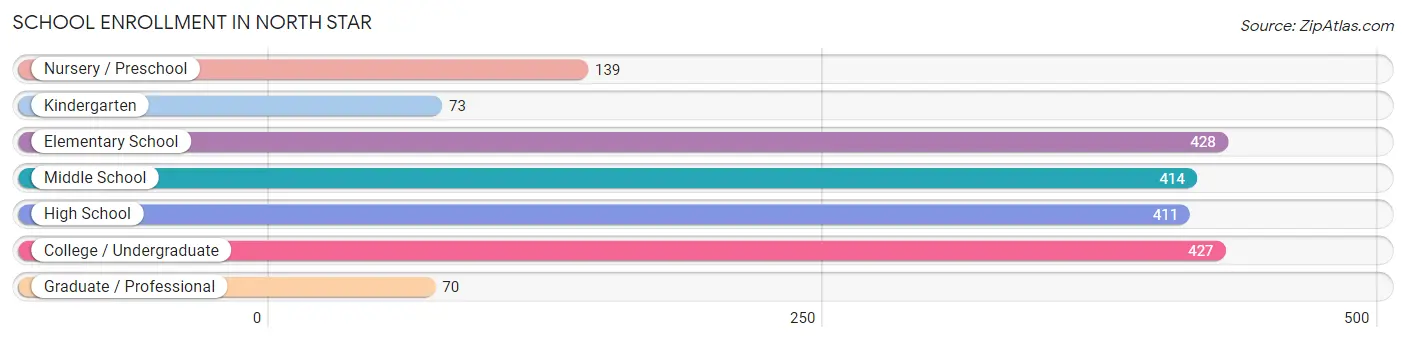
| School Level | # Students | % Students |
| Nursery / Preschool | 139 | 7.1% |
| Kindergarten | 73 | 3.7% |
| Elementary School | 428 | 21.8% |
| Middle School | 414 | 21.1% |
| High School | 411 | 20.9% |
| College / Undergraduate | 427 | 21.8% |
| Graduate / Professional | 70 | 3.6% |
| Total | 1,962 | 100.0% |
School Enrollment by Age by Funding Source in North Star
Out of a total of 1,962 students who are enrolled in schools in North Star, 644 (32.8%) attend a private institution, while the remaining 1,318 (67.2%) are enrolled in public schools. The age group of 3 to 4 year olds has the highest likelihood of being enrolled in private schools, with 95 (79.8% in the age bracket) enrolled. Conversely, the age group of 18 to 19 year olds has the lowest likelihood of being enrolled in a private school, with 162 (88.5% in the age bracket) attending a public institution.
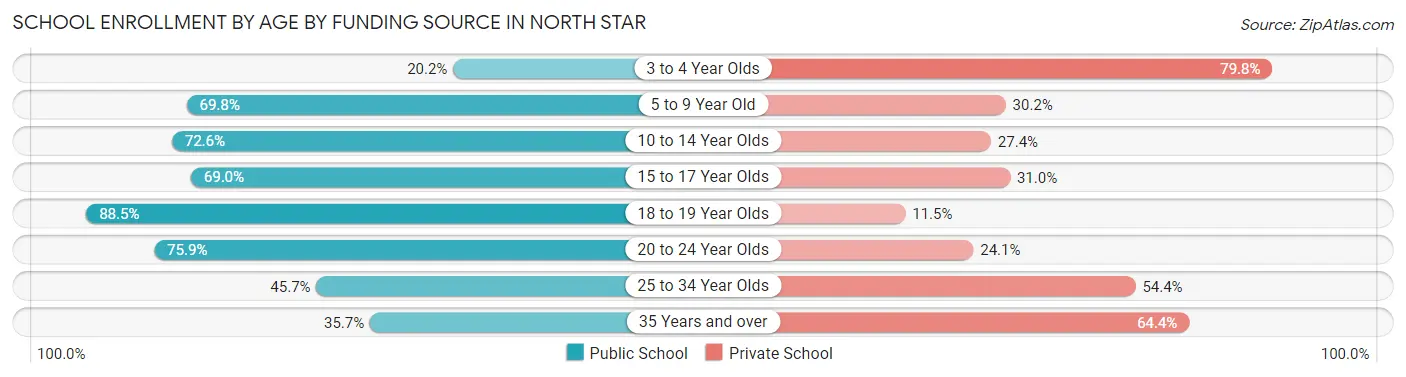
| Age Bracket | Public School | Private School |
| 3 to 4 Year Olds | 24 (20.2%) | 95 (79.8%) |
| 5 to 9 Year Old | 331 (69.8%) | 143 (30.2%) |
| 10 to 14 Year Olds | 381 (72.6%) | 144 (27.4%) |
| 15 to 17 Year Olds | 205 (69.0%) | 92 (31.0%) |
| 18 to 19 Year Olds | 162 (88.5%) | 21 (11.5%) |
| 20 to 24 Year Olds | 154 (75.9%) | 49 (24.1%) |
| 25 to 34 Year Olds | 21 (45.7%) | 25 (54.3%) |
| 35 Years and over | 41 (35.6%) | 74 (64.3%) |
| Total | 1,318 (67.2%) | 644 (32.8%) |
Educational Attainment by Field of Study in North Star
Business (878 | 20.4%), bio, nature & agricultural (652 | 15.2%), engineering (476 | 11.1%), science & technology (457 | 10.6%), and education (290 | 6.7%) are the most common fields of study among 4,300 individuals in North Star who have obtained a bachelor's degree or higher.
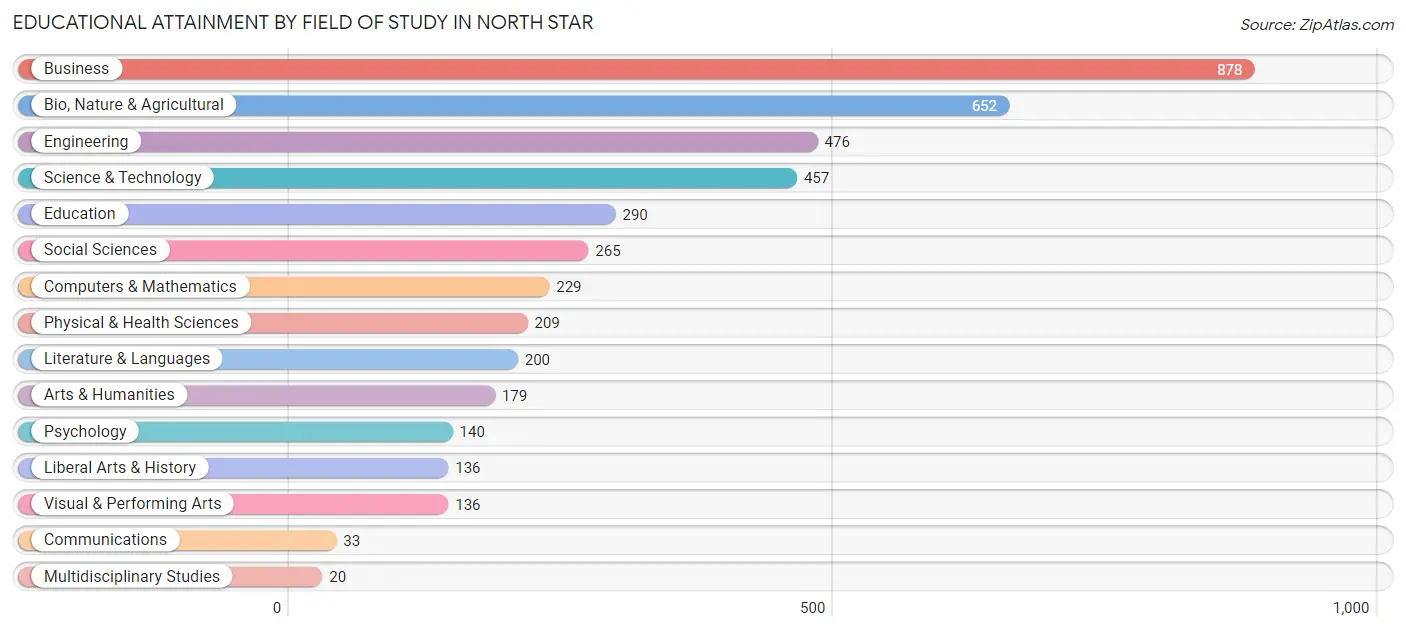
| Field of Study | # Graduates | % Graduates |
| Computers & Mathematics | 229 | 5.3% |
| Bio, Nature & Agricultural | 652 | 15.2% |
| Physical & Health Sciences | 209 | 4.9% |
| Psychology | 140 | 3.3% |
| Social Sciences | 265 | 6.2% |
| Engineering | 476 | 11.1% |
| Multidisciplinary Studies | 20 | 0.5% |
| Science & Technology | 457 | 10.6% |
| Business | 878 | 20.4% |
| Education | 290 | 6.7% |
| Literature & Languages | 200 | 4.6% |
| Liberal Arts & History | 136 | 3.2% |
| Visual & Performing Arts | 136 | 3.2% |
| Communications | 33 | 0.8% |
| Arts & Humanities | 179 | 4.2% |
| Total | 4,300 | 100.0% |
Transportation & Commute in North Star
Vehicle Availability by Sex in North Star
The most prevalent vehicle ownership categories in North Star are males with 2 vehicles (874, accounting for 39.8%) and females with 2 vehicles (908, making up 47.4%).
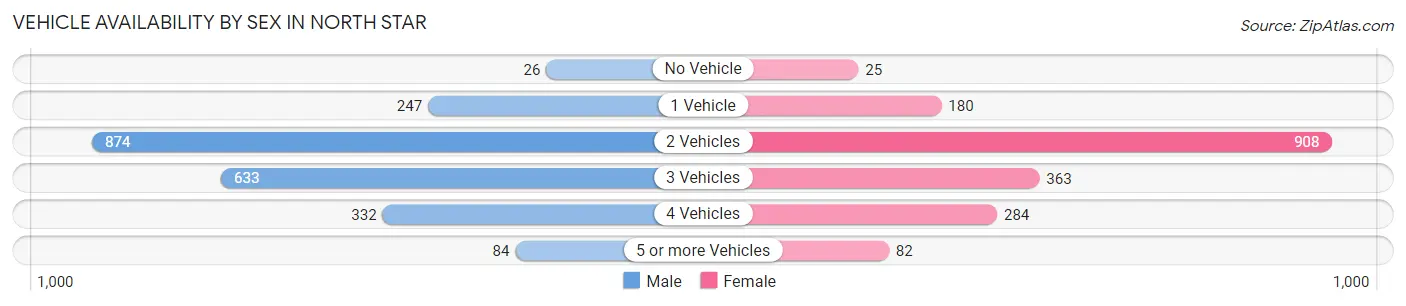
| Vehicles Available | Male | Female |
| No Vehicle | 26 (1.2%) | 25 (1.4%) |
| 1 Vehicle | 247 (11.3%) | 180 (9.8%) |
| 2 Vehicles | 874 (39.8%) | 908 (49.3%) |
| 3 Vehicles | 633 (28.8%) | 363 (19.7%) |
| 4 Vehicles | 332 (15.1%) | 284 (15.4%) |
| 5 or more Vehicles | 84 (3.8%) | 82 (4.4%) |
| Total | 2,196 (100.0%) | 1,842 (100.0%) |
Commute Time in North Star
The most frequently occuring commute durations in North Star are 25 to 29 minutes (695 commuters, 20.3%), 15 to 19 minutes (651 commuters, 19.0%), and 20 to 24 minutes (588 commuters, 17.2%).
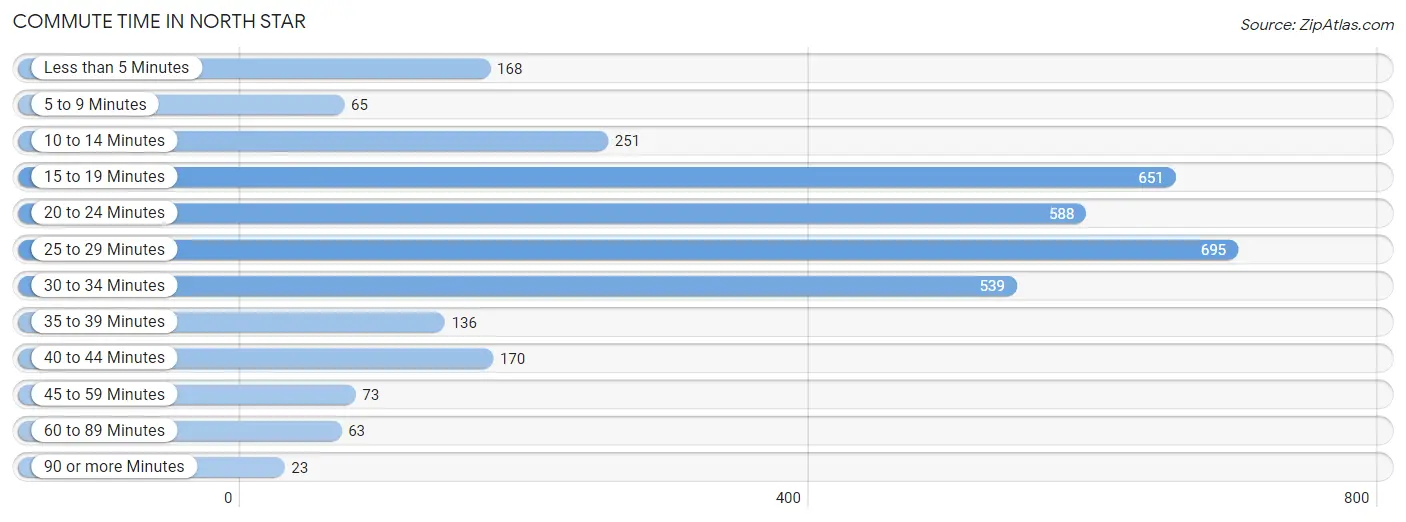
| Commute Time | # Commuters | % Commuters |
| Less than 5 Minutes | 168 | 4.9% |
| 5 to 9 Minutes | 65 | 1.9% |
| 10 to 14 Minutes | 251 | 7.3% |
| 15 to 19 Minutes | 651 | 19.0% |
| 20 to 24 Minutes | 588 | 17.2% |
| 25 to 29 Minutes | 695 | 20.3% |
| 30 to 34 Minutes | 539 | 15.8% |
| 35 to 39 Minutes | 136 | 4.0% |
| 40 to 44 Minutes | 170 | 5.0% |
| 45 to 59 Minutes | 73 | 2.1% |
| 60 to 89 Minutes | 63 | 1.8% |
| 90 or more Minutes | 23 | 0.7% |
Commute Time by Sex in North Star
The most common commute times in North Star are 15 to 19 minutes (357 commuters, 19.1%) for males and 25 to 29 minutes (386 commuters, 24.8%) for females.
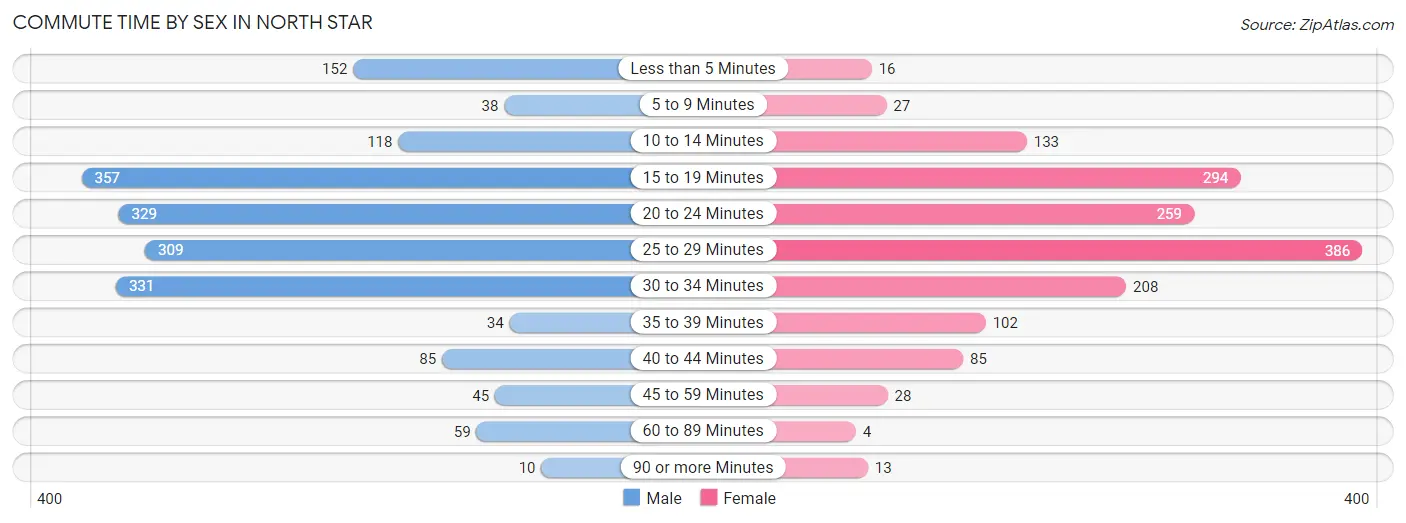
| Commute Time | Male | Female |
| Less than 5 Minutes | 152 (8.1%) | 16 (1.0%) |
| 5 to 9 Minutes | 38 (2.0%) | 27 (1.7%) |
| 10 to 14 Minutes | 118 (6.3%) | 133 (8.6%) |
| 15 to 19 Minutes | 357 (19.1%) | 294 (18.9%) |
| 20 to 24 Minutes | 329 (17.6%) | 259 (16.7%) |
| 25 to 29 Minutes | 309 (16.6%) | 386 (24.8%) |
| 30 to 34 Minutes | 331 (17.7%) | 208 (13.4%) |
| 35 to 39 Minutes | 34 (1.8%) | 102 (6.6%) |
| 40 to 44 Minutes | 85 (4.5%) | 85 (5.5%) |
| 45 to 59 Minutes | 45 (2.4%) | 28 (1.8%) |
| 60 to 89 Minutes | 59 (3.2%) | 4 (0.3%) |
| 90 or more Minutes | 10 (0.5%) | 13 (0.8%) |
Time of Departure to Work by Sex in North Star
The most frequent times of departure to work in North Star are 7:30 AM to 7:59 AM (442, 23.7%) for males and 8:00 AM to 8:29 AM (431, 27.7%) for females.
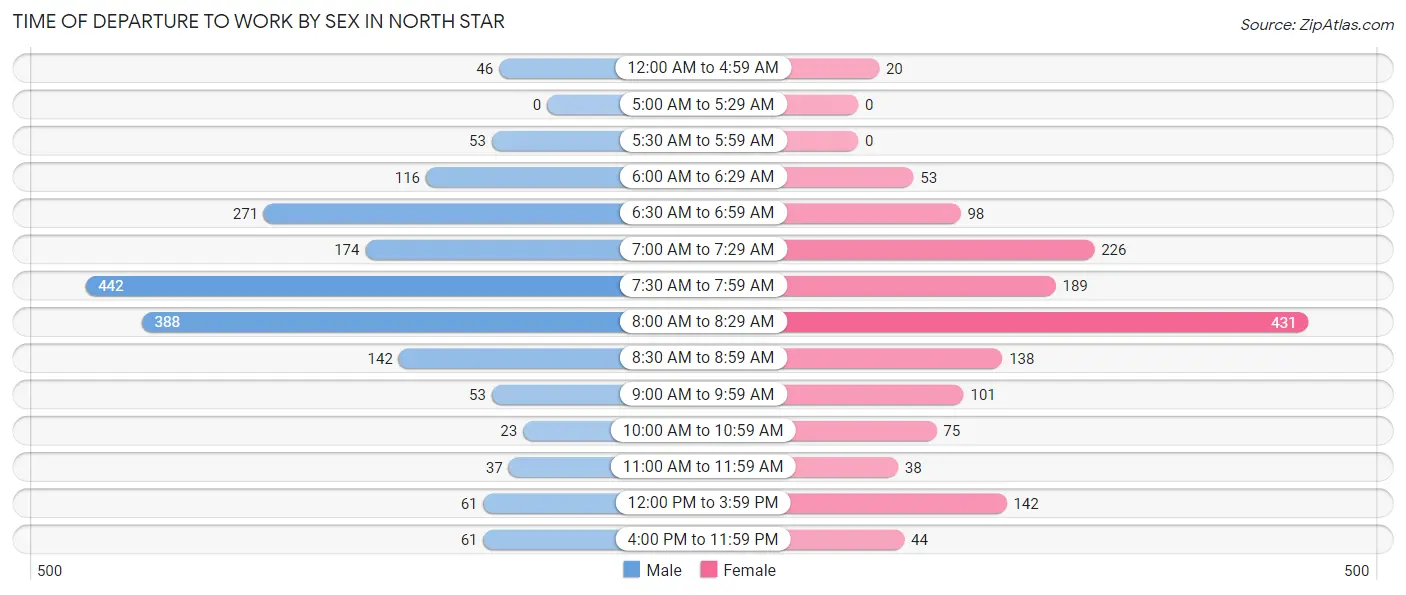
| Time of Departure | Male | Female |
| 12:00 AM to 4:59 AM | 46 (2.5%) | 20 (1.3%) |
| 5:00 AM to 5:29 AM | 0 (0.0%) | 0 (0.0%) |
| 5:30 AM to 5:59 AM | 53 (2.8%) | 0 (0.0%) |
| 6:00 AM to 6:29 AM | 116 (6.2%) | 53 (3.4%) |
| 6:30 AM to 6:59 AM | 271 (14.5%) | 98 (6.3%) |
| 7:00 AM to 7:29 AM | 174 (9.3%) | 226 (14.5%) |
| 7:30 AM to 7:59 AM | 442 (23.7%) | 189 (12.1%) |
| 8:00 AM to 8:29 AM | 388 (20.8%) | 431 (27.7%) |
| 8:30 AM to 8:59 AM | 142 (7.6%) | 138 (8.9%) |
| 9:00 AM to 9:59 AM | 53 (2.8%) | 101 (6.5%) |
| 10:00 AM to 10:59 AM | 23 (1.2%) | 75 (4.8%) |
| 11:00 AM to 11:59 AM | 37 (2.0%) | 38 (2.4%) |
| 12:00 PM to 3:59 PM | 61 (3.3%) | 142 (9.1%) |
| 4:00 PM to 11:59 PM | 61 (3.3%) | 44 (2.8%) |
| Total | 1,867 (100.0%) | 1,555 (100.0%) |
Housing Occupancy in North Star
Occupancy by Ownership in North Star
Of the total 3,092 dwellings in North Star, owner-occupied units account for 2,687 (86.9%), while renter-occupied units make up 405 (13.1%).
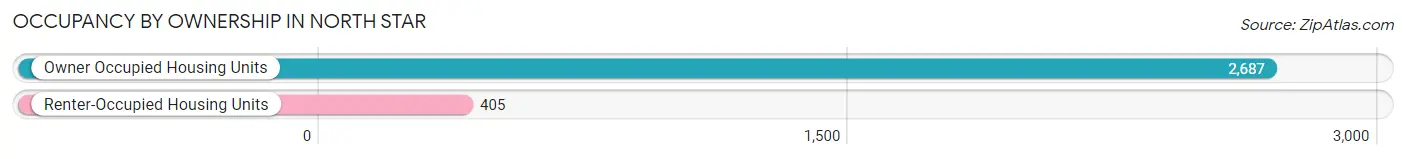
| Occupancy | # Housing Units | % Housing Units |
| Owner Occupied Housing Units | 2,687 | 86.9% |
| Renter-Occupied Housing Units | 405 | 13.1% |
| Total Occupied Housing Units | 3,092 | 100.0% |
Occupancy by Household Size in North Star
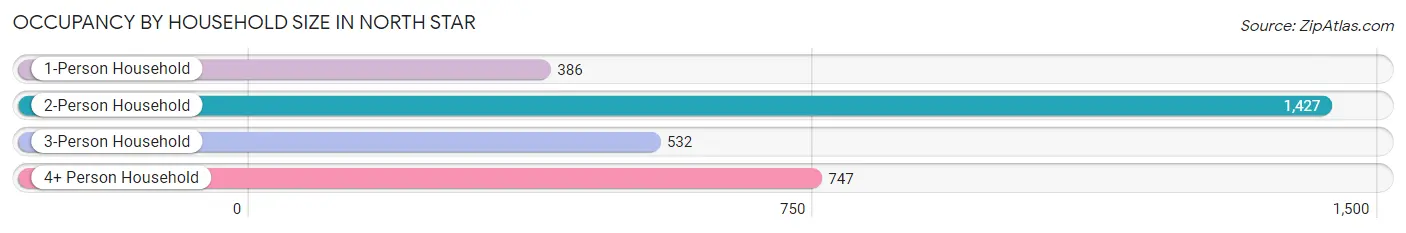
| Household Size | # Housing Units | % Housing Units |
| 1-Person Household | 386 | 12.5% |
| 2-Person Household | 1,427 | 46.2% |
| 3-Person Household | 532 | 17.2% |
| 4+ Person Household | 747 | 24.2% |
| Total Housing Units | 3,092 | 100.0% |
Occupancy by Ownership by Household Size in North Star
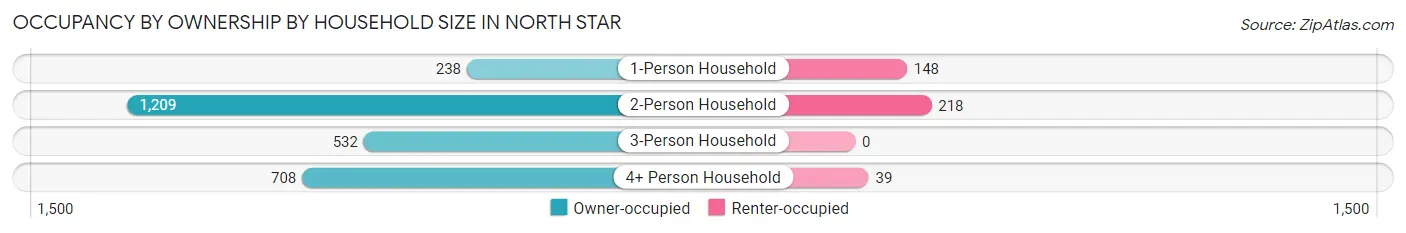
| Household Size | Owner-occupied | Renter-occupied |
| 1-Person Household | 238 (61.7%) | 148 (38.3%) |
| 2-Person Household | 1,209 (84.7%) | 218 (15.3%) |
| 3-Person Household | 532 (100.0%) | 0 (0.0%) |
| 4+ Person Household | 708 (94.8%) | 39 (5.2%) |
| Total Housing Units | 2,687 (86.9%) | 405 (13.1%) |
Occupancy by Educational Attainment in North Star
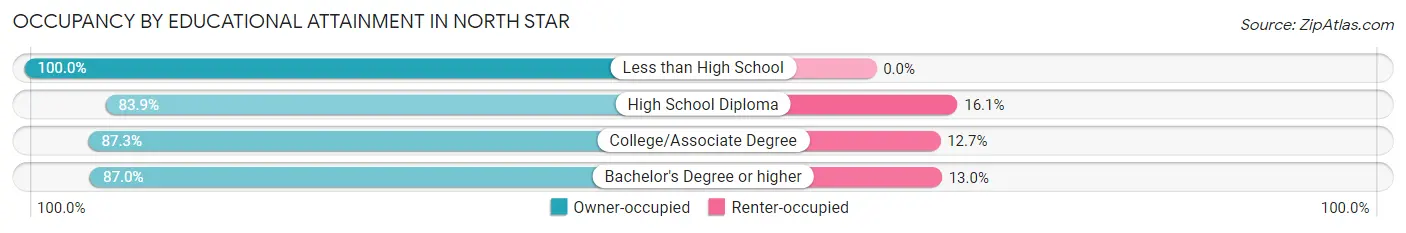
| Household Size | Owner-occupied | Renter-occupied |
| Less than High School | 23 (100.0%) | 0 (0.0%) |
| High School Diploma | 214 (83.9%) | 41 (16.1%) |
| College/Associate Degree | 502 (87.3%) | 73 (12.7%) |
| Bachelor's Degree or higher | 1,948 (87.0%) | 291 (13.0%) |
Occupancy by Age of Householder in North Star
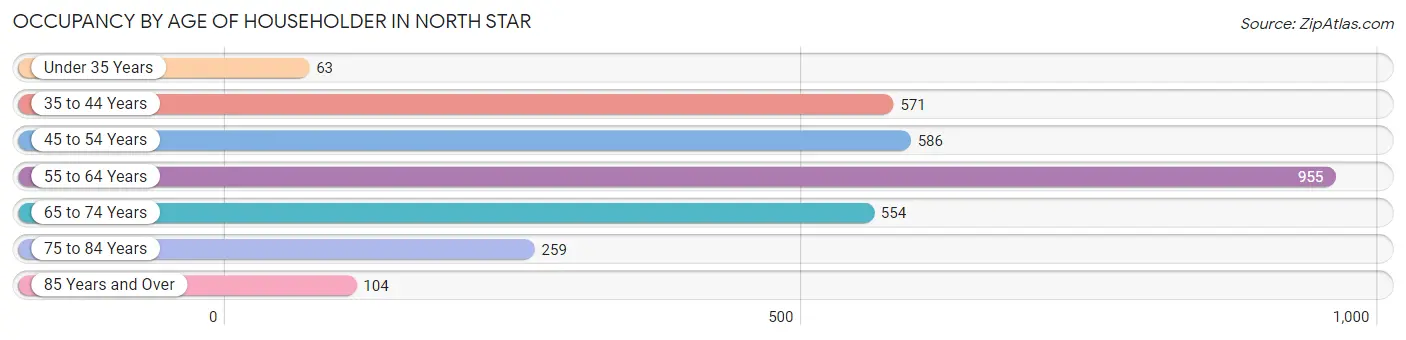
| Age Bracket | # Households | % Households |
| Under 35 Years | 63 | 2.0% |
| 35 to 44 Years | 571 | 18.5% |
| 45 to 54 Years | 586 | 19.0% |
| 55 to 64 Years | 955 | 30.9% |
| 65 to 74 Years | 554 | 17.9% |
| 75 to 84 Years | 259 | 8.4% |
| 85 Years and Over | 104 | 3.4% |
| Total | 3,092 | 100.0% |
Housing Finances in North Star
Median Income by Occupancy in North Star
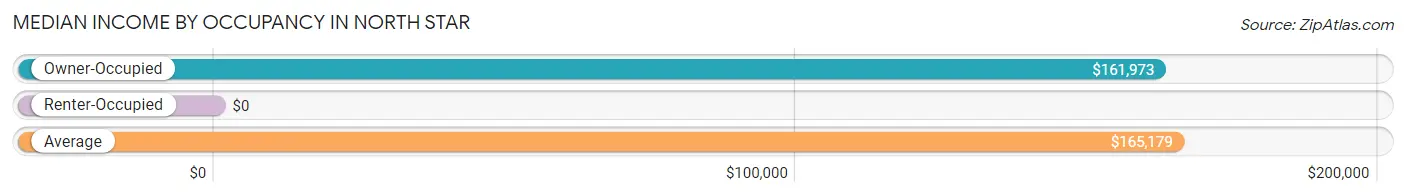
| Occupancy Type | # Households | Median Income |
| Owner-Occupied | 2,687 (86.9%) | $161,973 |
| Renter-Occupied | 405 (13.1%) | $0 |
| Average | 3,092 (100.0%) | $165,179 |
Occupancy by Householder Income Bracket in North Star
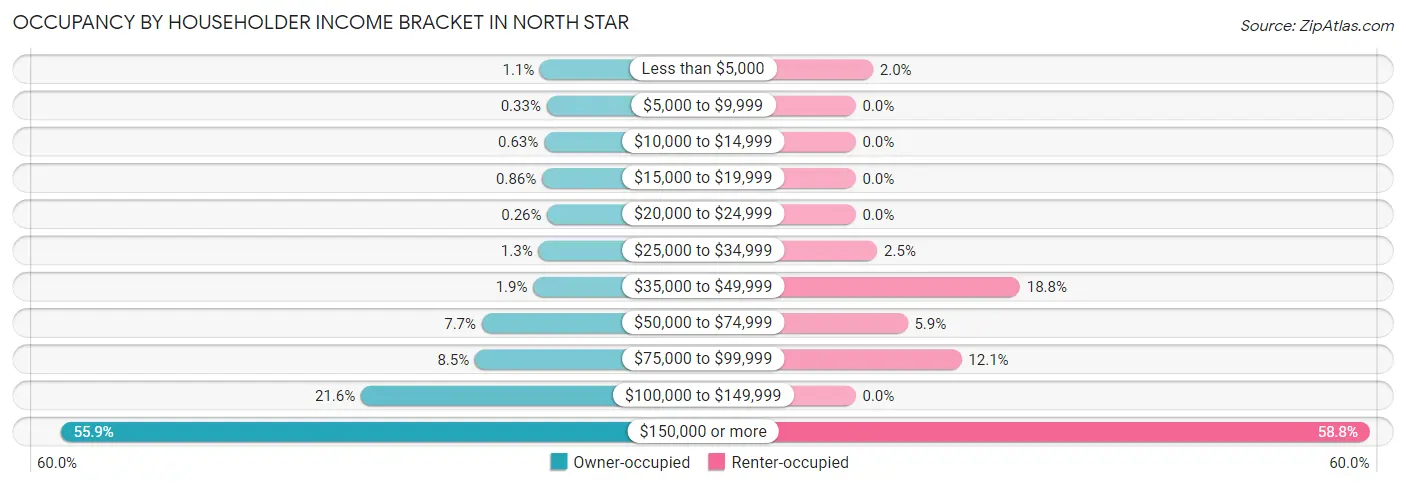
| Income Bracket | Owner-occupied | Renter-occupied |
| Less than $5,000 | 29 (1.1%) | 8 (2.0%) |
| $5,000 to $9,999 | 9 (0.3%) | 0 (0.0%) |
| $10,000 to $14,999 | 17 (0.6%) | 0 (0.0%) |
| $15,000 to $19,999 | 23 (0.9%) | 0 (0.0%) |
| $20,000 to $24,999 | 7 (0.3%) | 0 (0.0%) |
| $25,000 to $34,999 | 34 (1.3%) | 10 (2.5%) |
| $35,000 to $49,999 | 50 (1.9%) | 76 (18.8%) |
| $50,000 to $74,999 | 208 (7.7%) | 24 (5.9%) |
| $75,000 to $99,999 | 229 (8.5%) | 49 (12.1%) |
| $100,000 to $149,999 | 579 (21.5%) | 0 (0.0%) |
| $150,000 or more | 1,502 (55.9%) | 238 (58.8%) |
| Total | 2,687 (100.0%) | 405 (100.0%) |
Monthly Housing Cost Tiers in North Star
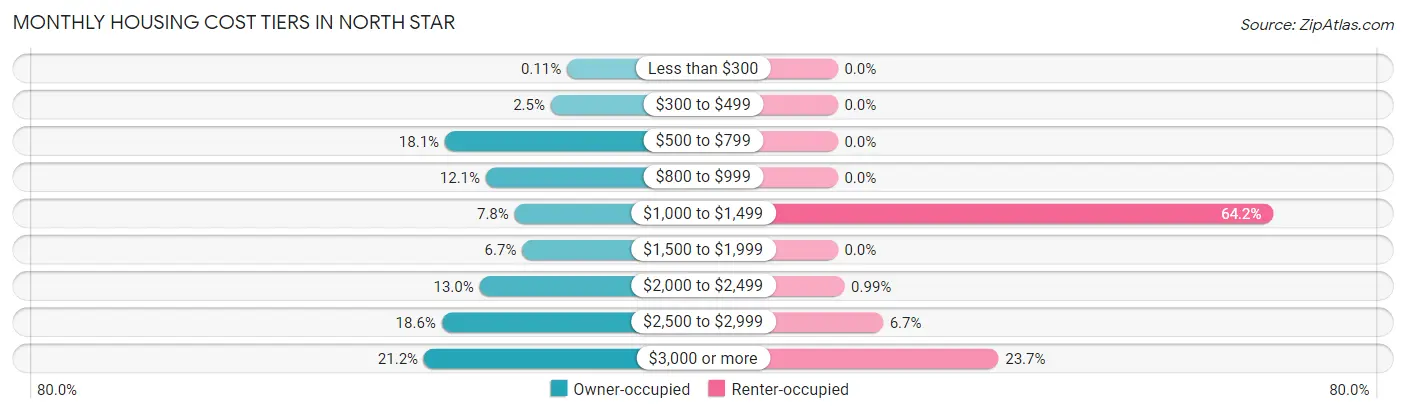
| Monthly Cost | Owner-occupied | Renter-occupied |
| Less than $300 | 3 (0.1%) | 0 (0.0%) |
| $300 to $499 | 67 (2.5%) | 0 (0.0%) |
| $500 to $799 | 486 (18.1%) | 0 (0.0%) |
| $800 to $999 | 324 (12.1%) | 0 (0.0%) |
| $1,000 to $1,499 | 210 (7.8%) | 260 (64.2%) |
| $1,500 to $1,999 | 180 (6.7%) | 0 (0.0%) |
| $2,000 to $2,499 | 349 (13.0%) | 4 (1.0%) |
| $2,500 to $2,999 | 499 (18.6%) | 27 (6.7%) |
| $3,000 or more | 569 (21.2%) | 96 (23.7%) |
| Total | 2,687 (100.0%) | 405 (100.0%) |
Physical Housing Characteristics in North Star
Housing Structures in North Star
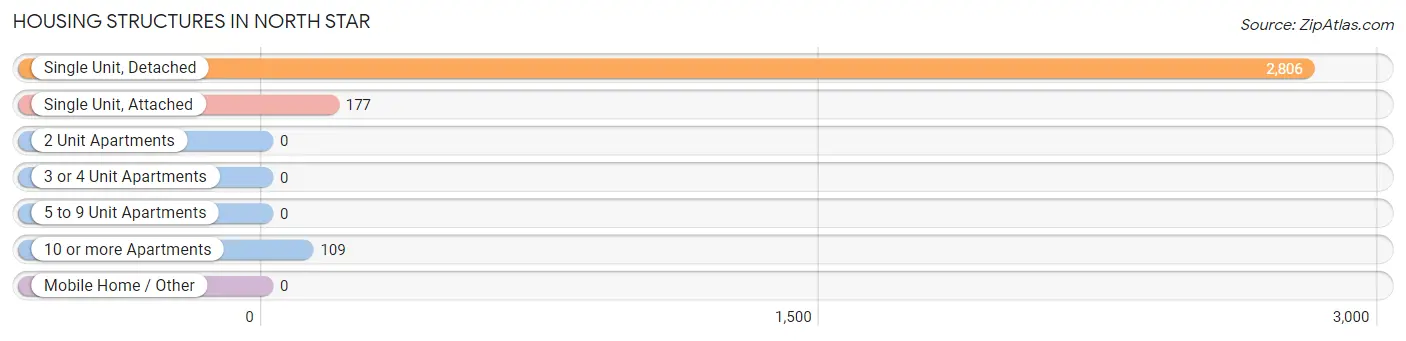
| Structure Type | # Housing Units | % Housing Units |
| Single Unit, Detached | 2,806 | 90.7% |
| Single Unit, Attached | 177 | 5.7% |
| 2 Unit Apartments | 0 | 0.0% |
| 3 or 4 Unit Apartments | 0 | 0.0% |
| 5 to 9 Unit Apartments | 0 | 0.0% |
| 10 or more Apartments | 109 | 3.5% |
| Mobile Home / Other | 0 | 0.0% |
| Total | 3,092 | 100.0% |
Housing Structures by Occupancy in North Star
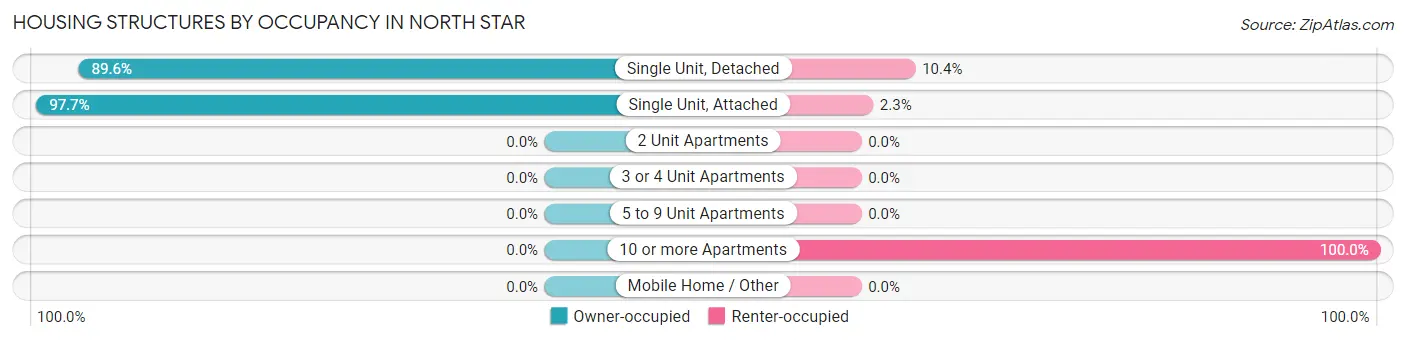
| Structure Type | Owner-occupied | Renter-occupied |
| Single Unit, Detached | 2,514 (89.6%) | 292 (10.4%) |
| Single Unit, Attached | 173 (97.7%) | 4 (2.3%) |
| 2 Unit Apartments | 0 (0.0%) | 0 (0.0%) |
| 3 or 4 Unit Apartments | 0 (0.0%) | 0 (0.0%) |
| 5 to 9 Unit Apartments | 0 (0.0%) | 0 (0.0%) |
| 10 or more Apartments | 0 (0.0%) | 109 (100.0%) |
| Mobile Home / Other | 0 (0.0%) | 0 (0.0%) |
| Total | 2,687 (86.9%) | 405 (13.1%) |
Housing Structures by Number of Rooms in North Star
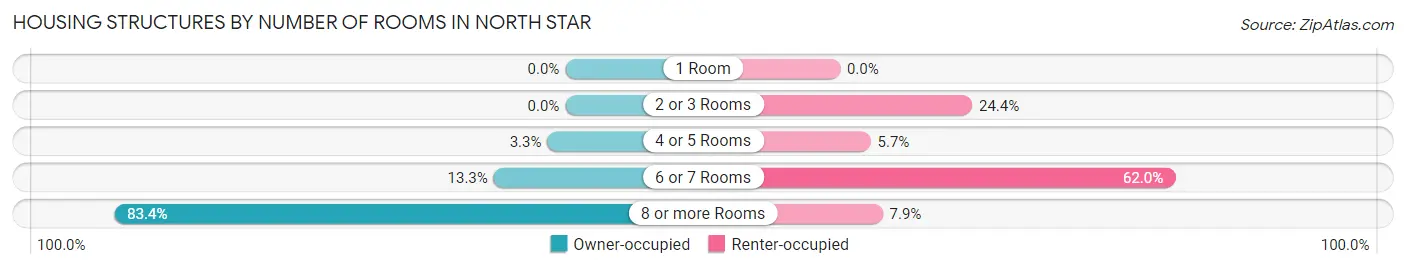
| Number of Rooms | Owner-occupied | Renter-occupied |
| 1 Room | 0 (0.0%) | 0 (0.0%) |
| 2 or 3 Rooms | 0 (0.0%) | 99 (24.4%) |
| 4 or 5 Rooms | 89 (3.3%) | 23 (5.7%) |
| 6 or 7 Rooms | 356 (13.3%) | 251 (62.0%) |
| 8 or more Rooms | 2,242 (83.4%) | 32 (7.9%) |
| Total | 2,687 (100.0%) | 405 (100.0%) |
Housing Structure by Heating Type in North Star
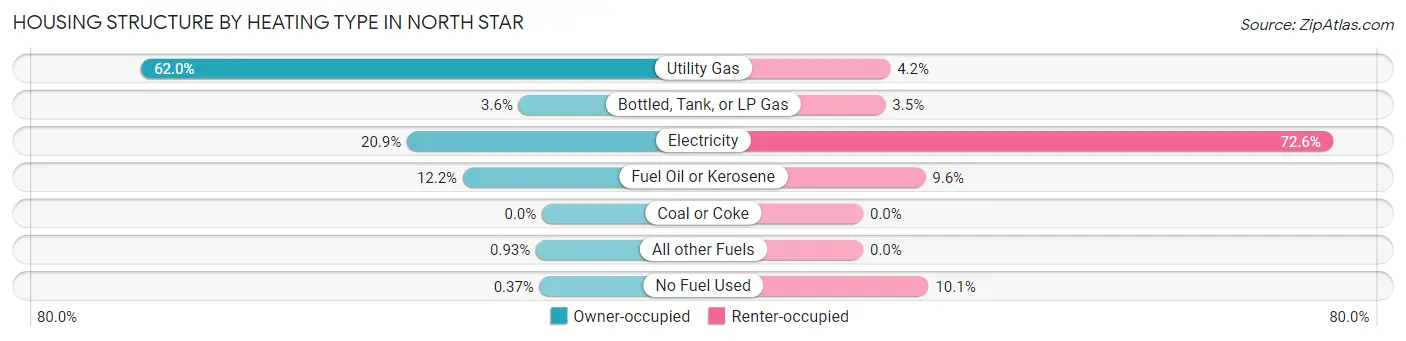
| Heating Type | Owner-occupied | Renter-occupied |
| Utility Gas | 1,665 (62.0%) | 17 (4.2%) |
| Bottled, Tank, or LP Gas | 97 (3.6%) | 14 (3.5%) |
| Electricity | 561 (20.9%) | 294 (72.6%) |
| Fuel Oil or Kerosene | 329 (12.2%) | 39 (9.6%) |
| Coal or Coke | 0 (0.0%) | 0 (0.0%) |
| All other Fuels | 25 (0.9%) | 0 (0.0%) |
| No Fuel Used | 10 (0.4%) | 41 (10.1%) |
| Total | 2,687 (100.0%) | 405 (100.0%) |
Household Vehicle Usage in North Star
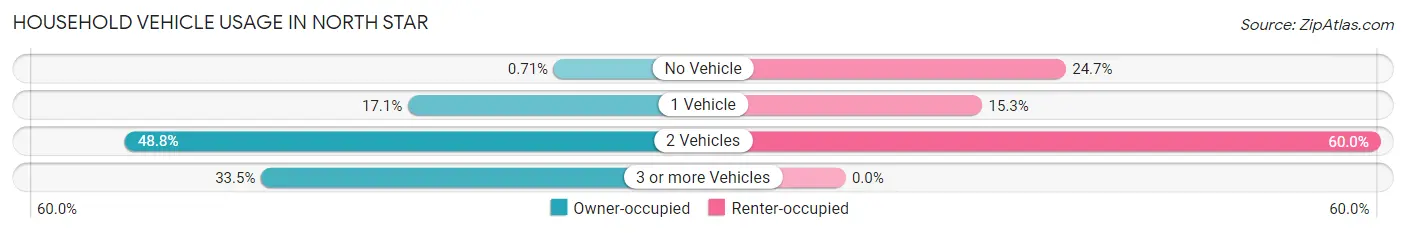
| Vehicles per Household | Owner-occupied | Renter-occupied |
| No Vehicle | 19 (0.7%) | 100 (24.7%) |
| 1 Vehicle | 458 (17.1%) | 62 (15.3%) |
| 2 Vehicles | 1,310 (48.7%) | 243 (60.0%) |
| 3 or more Vehicles | 900 (33.5%) | 0 (0.0%) |
| Total | 2,687 (100.0%) | 405 (100.0%) |
Real Estate & Mortgages in North Star
Real Estate and Mortgage Overview in North Star
| Characteristic | Without Mortgage | With Mortgage |
| Housing Units | 1,002 | 1,685 |
| Median Property Value | $475,700 | $537,100 |
| Median Household Income | $118,625 | $1,100 |
| Monthly Housing Costs | $757 | $569 |
| Real Estate Taxes | $4,504 | $8 |
Property Value by Mortgage Status in North Star
| Property Value | Without Mortgage | With Mortgage |
| Less than $50,000 | 0 (0.0%) | 0 (0.0%) |
| $50,000 to $99,999 | 0 (0.0%) | 26 (1.5%) |
| $100,000 to $299,999 | 29 (2.9%) | 57 (3.4%) |
| $300,000 to $499,999 | 562 (56.1%) | 630 (37.4%) |
| $500,000 to $749,999 | 349 (34.8%) | 872 (51.7%) |
| $750,000 to $999,999 | 14 (1.4%) | 82 (4.9%) |
| $1,000,000 or more | 48 (4.8%) | 18 (1.1%) |
| Total | 1,002 (100.0%) | 1,685 (100.0%) |
Household Income by Mortgage Status in North Star
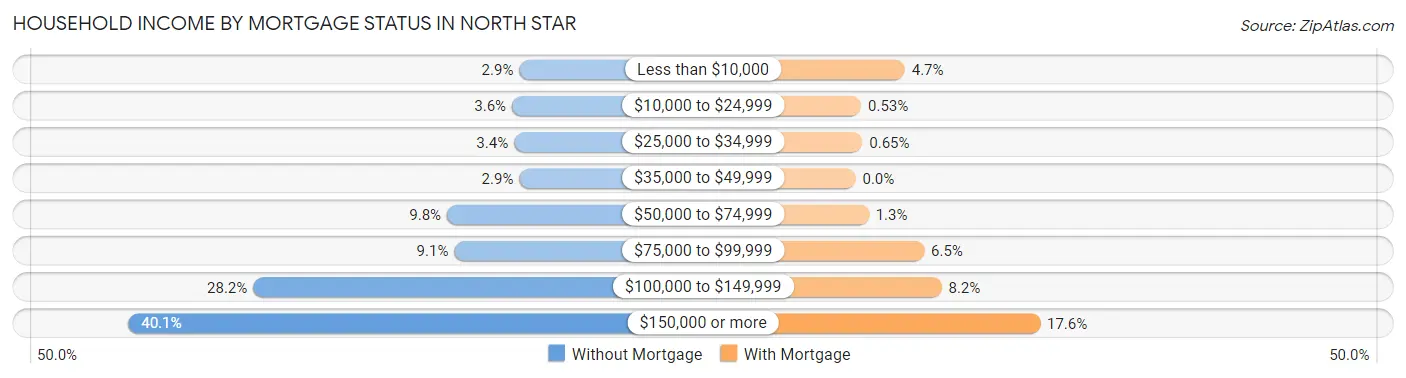
| Household Income | Without Mortgage | With Mortgage |
| Less than $10,000 | 29 (2.9%) | 79 (4.7%) |
| $10,000 to $24,999 | 36 (3.6%) | 9 (0.5%) |
| $25,000 to $34,999 | 34 (3.4%) | 11 (0.6%) |
| $35,000 to $49,999 | 29 (2.9%) | 0 (0.0%) |
| $50,000 to $74,999 | 98 (9.8%) | 21 (1.3%) |
| $75,000 to $99,999 | 91 (9.1%) | 110 (6.5%) |
| $100,000 to $149,999 | 283 (28.2%) | 138 (8.2%) |
| $150,000 or more | 402 (40.1%) | 296 (17.6%) |
| Total | 1,002 (100.0%) | 1,685 (100.0%) |
Property Value to Household Income Ratio in North Star
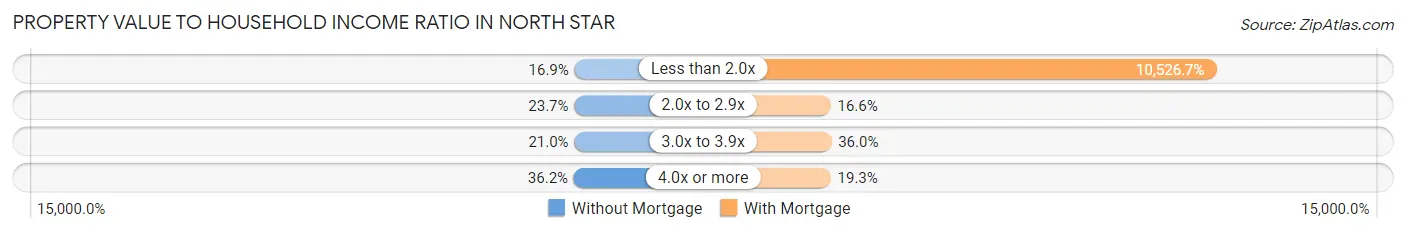
| Value-to-Income Ratio | Without Mortgage | With Mortgage |
| Less than 2.0x | 169 (16.9%) | 177,375 (10,526.7%) |
| 2.0x to 2.9x | 237 (23.6%) | 280 (16.6%) |
| 3.0x to 3.9x | 210 (21.0%) | 607 (36.0%) |
| 4.0x or more | 363 (36.2%) | 325 (19.3%) |
| Total | 1,002 (100.0%) | 1,685 (100.0%) |
Real Estate Taxes by Mortgage Status in North Star
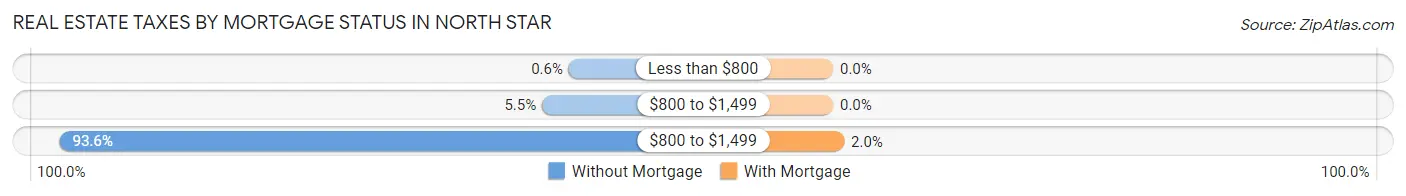
| Property Taxes | Without Mortgage | With Mortgage |
| Less than $800 | 6 (0.6%) | 0 (0.0%) |
| $800 to $1,499 | 55 (5.5%) | 0 (0.0%) |
| $800 to $1,499 | 938 (93.6%) | 34 (2.0%) |
| Total | 1,002 (100.0%) | 1,685 (100.0%) |
Health & Disability in North Star
Health Insurance Coverage by Age in North Star
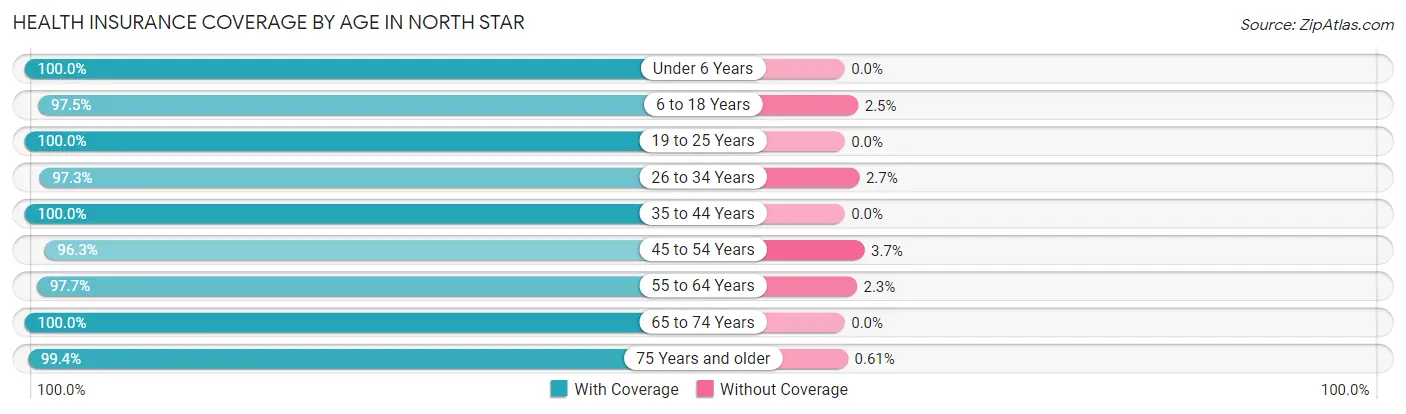
| Age Bracket | With Coverage | Without Coverage |
| Under 6 Years | 370 (100.0%) | 0 (0.0%) |
| 6 to 18 Years | 1,509 (97.5%) | 39 (2.5%) |
| 19 to 25 Years | 589 (100.0%) | 0 (0.0%) |
| 26 to 34 Years | 249 (97.3%) | 7 (2.7%) |
| 35 to 44 Years | 1,022 (100.0%) | 0 (0.0%) |
| 45 to 54 Years | 1,119 (96.3%) | 43 (3.7%) |
| 55 to 64 Years | 1,798 (97.7%) | 42 (2.3%) |
| 65 to 74 Years | 922 (100.0%) | 0 (0.0%) |
| 75 Years and older | 657 (99.4%) | 4 (0.6%) |
| Total | 8,235 (98.4%) | 135 (1.6%) |
Health Insurance Coverage by Citizenship Status in North Star
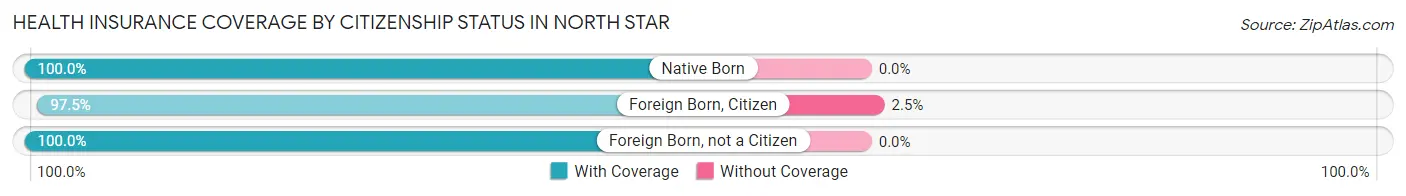
| Citizenship Status | With Coverage | Without Coverage |
| Native Born | 370 (100.0%) | 0 (0.0%) |
| Foreign Born, Citizen | 1,509 (97.5%) | 39 (2.5%) |
| Foreign Born, not a Citizen | 589 (100.0%) | 0 (0.0%) |
Health Insurance Coverage by Household Income in North Star
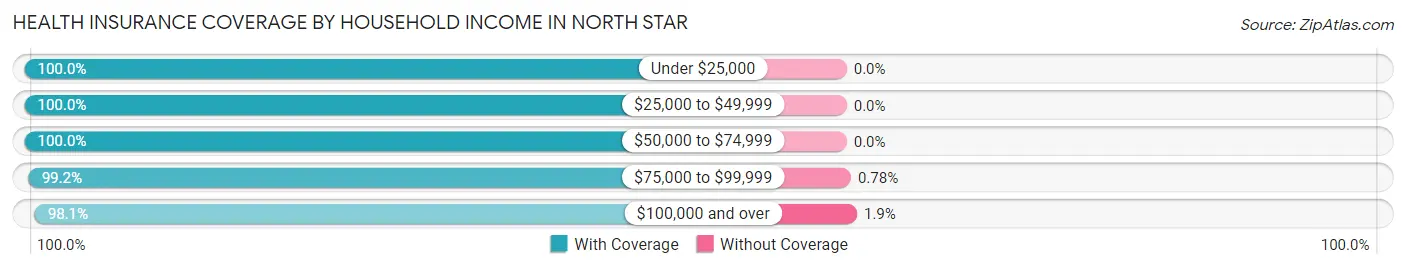
| Household Income | With Coverage | Without Coverage |
| Under $25,000 | 203 (100.0%) | 0 (0.0%) |
| $25,000 to $49,999 | 298 (100.0%) | 0 (0.0%) |
| $50,000 to $74,999 | 524 (100.0%) | 0 (0.0%) |
| $75,000 to $99,999 | 510 (99.2%) | 4 (0.8%) |
| $100,000 and over | 6,700 (98.1%) | 131 (1.9%) |
Public vs Private Health Insurance Coverage by Age in North Star
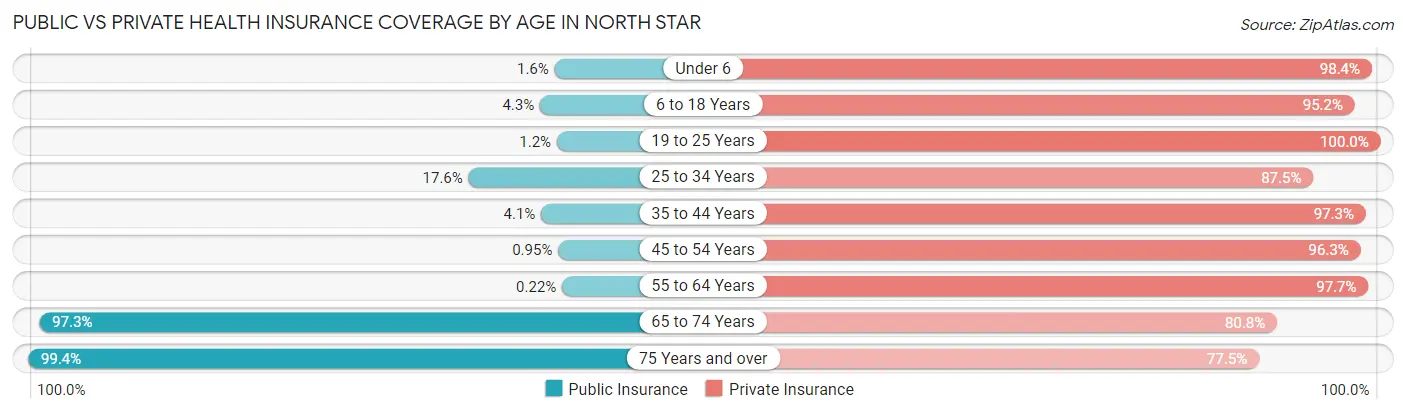
| Age Bracket | Public Insurance | Private Insurance |
| Under 6 | 6 (1.6%) | 364 (98.4%) |
| 6 to 18 Years | 67 (4.3%) | 1,474 (95.2%) |
| 19 to 25 Years | 7 (1.2%) | 589 (100.0%) |
| 25 to 34 Years | 45 (17.6%) | 224 (87.5%) |
| 35 to 44 Years | 42 (4.1%) | 994 (97.3%) |
| 45 to 54 Years | 11 (0.9%) | 1,119 (96.3%) |
| 55 to 64 Years | 4 (0.2%) | 1,798 (97.7%) |
| 65 to 74 Years | 897 (97.3%) | 745 (80.8%) |
| 75 Years and over | 657 (99.4%) | 512 (77.5%) |
| Total | 1,736 (20.7%) | 7,819 (93.4%) |
Disability Status by Sex by Age in North Star
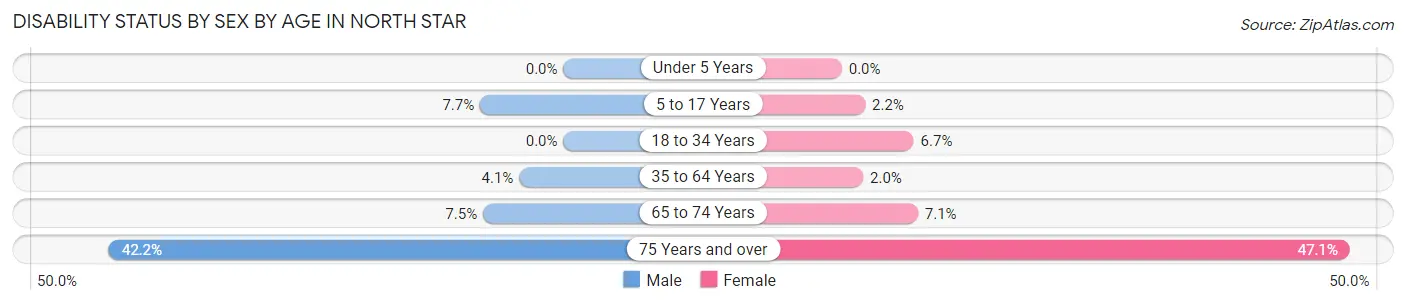
| Age Bracket | Male | Female |
| Under 5 Years | 0 (0.0%) | 0 (0.0%) |
| 5 to 17 Years | 49 (7.7%) | 15 (2.2%) |
| 18 to 34 Years | 0 (0.0%) | 30 (6.7%) |
| 35 to 64 Years | 76 (4.1%) | 43 (2.0%) |
| 65 to 74 Years | 35 (7.5%) | 32 (7.1%) |
| 75 Years and over | 124 (42.2%) | 173 (47.1%) |
Disability Class by Sex by Age in North Star
Disability Class: Hearing Difficulty
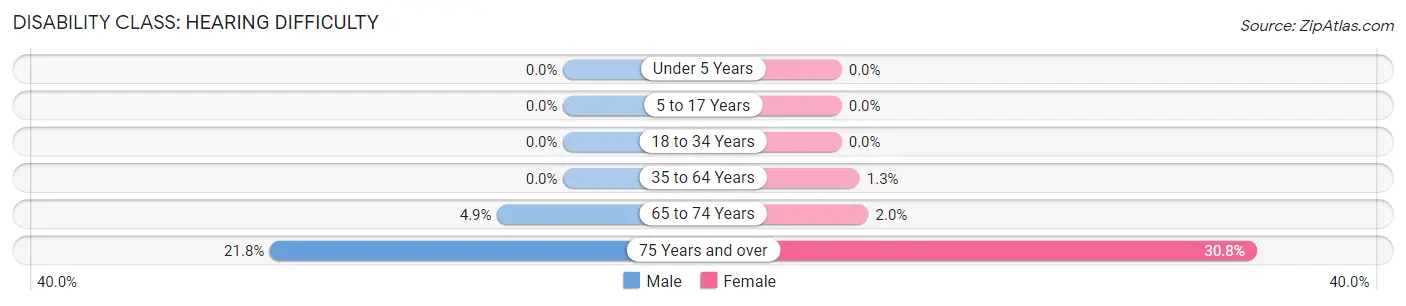
| Age Bracket | Male | Female |
| Under 5 Years | 0 (0.0%) | 0 (0.0%) |
| 5 to 17 Years | 0 (0.0%) | 0 (0.0%) |
| 18 to 34 Years | 0 (0.0%) | 0 (0.0%) |
| 35 to 64 Years | 0 (0.0%) | 29 (1.3%) |
| 65 to 74 Years | 23 (4.9%) | 9 (2.0%) |
| 75 Years and over | 64 (21.8%) | 113 (30.8%) |
Disability Class: Vision Difficulty
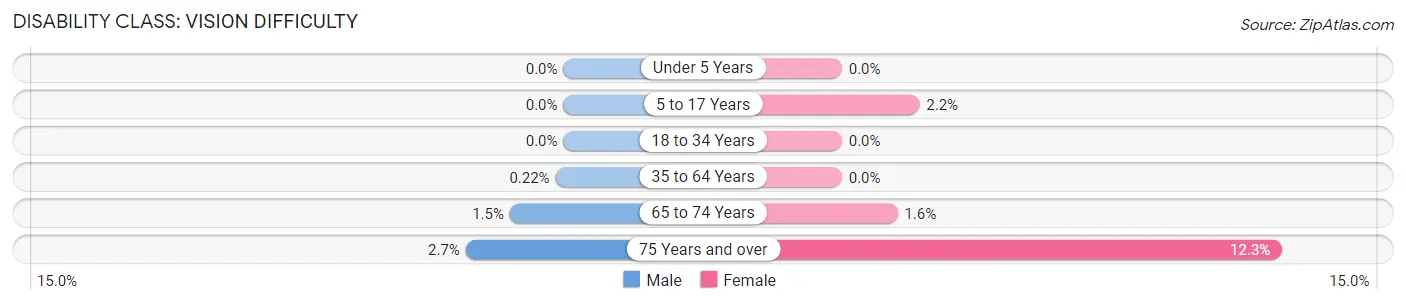
| Age Bracket | Male | Female |
| Under 5 Years | 0 (0.0%) | 0 (0.0%) |
| 5 to 17 Years | 0 (0.0%) | 15 (2.2%) |
| 18 to 34 Years | 0 (0.0%) | 0 (0.0%) |
| 35 to 64 Years | 4 (0.2%) | 0 (0.0%) |
| 65 to 74 Years | 7 (1.5%) | 7 (1.5%) |
| 75 Years and over | 8 (2.7%) | 45 (12.3%) |
Disability Class: Cognitive Difficulty
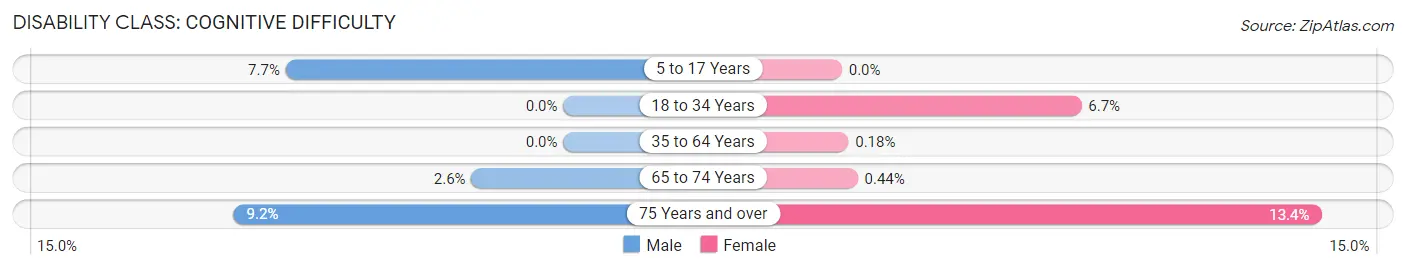
| Age Bracket | Male | Female |
| 5 to 17 Years | 49 (7.7%) | 0 (0.0%) |
| 18 to 34 Years | 0 (0.0%) | 30 (6.7%) |
| 35 to 64 Years | 0 (0.0%) | 4 (0.2%) |
| 65 to 74 Years | 12 (2.6%) | 2 (0.4%) |
| 75 Years and over | 27 (9.2%) | 49 (13.4%) |
Disability Class: Ambulatory Difficulty
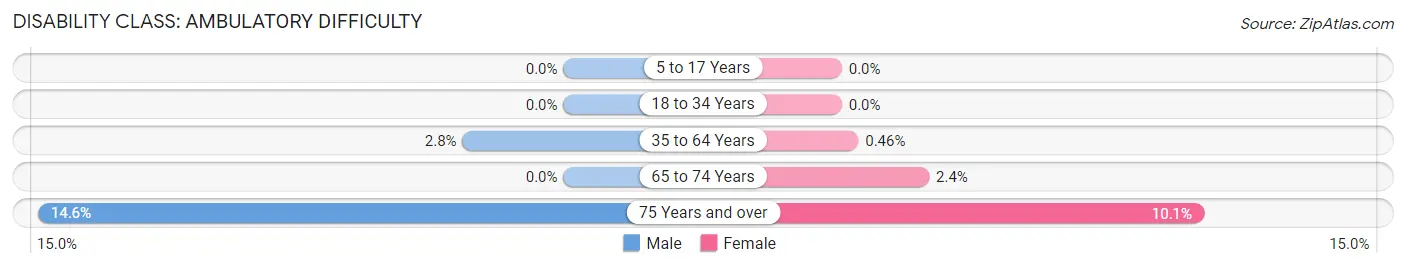
| Age Bracket | Male | Female |
| 5 to 17 Years | 0 (0.0%) | 0 (0.0%) |
| 18 to 34 Years | 0 (0.0%) | 0 (0.0%) |
| 35 to 64 Years | 52 (2.8%) | 10 (0.5%) |
| 65 to 74 Years | 0 (0.0%) | 11 (2.4%) |
| 75 Years and over | 43 (14.6%) | 37 (10.1%) |
Disability Class: Self-Care Difficulty
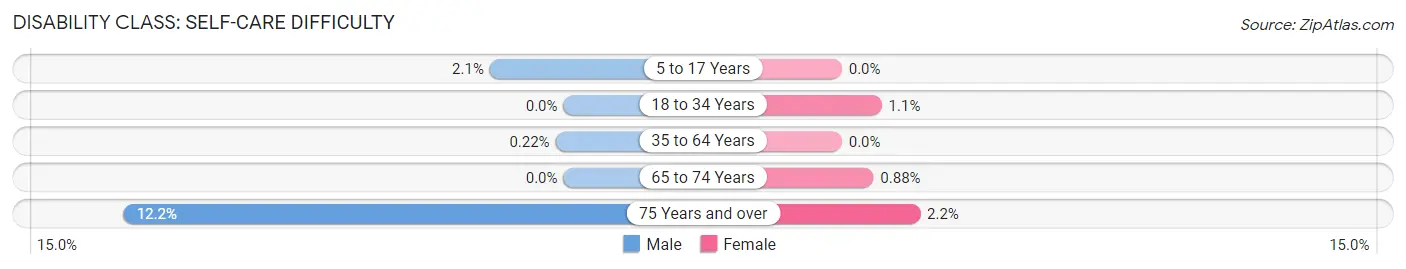
| Age Bracket | Male | Female |
| 5 to 17 Years | 13 (2.1%) | 0 (0.0%) |
| 18 to 34 Years | 0 (0.0%) | 5 (1.1%) |
| 35 to 64 Years | 4 (0.2%) | 0 (0.0%) |
| 65 to 74 Years | 0 (0.0%) | 4 (0.9%) |
| 75 Years and over | 36 (12.2%) | 8 (2.2%) |
Technology Access in North Star
Computing Device Access in North Star
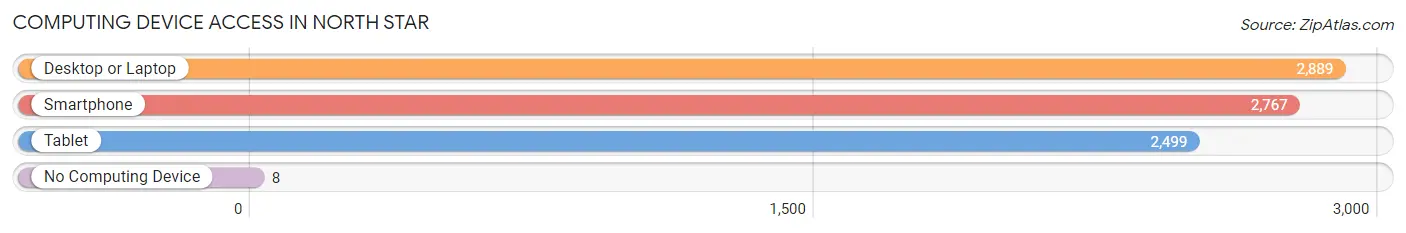
| Device Type | # Households | % Households |
| Desktop or Laptop | 2,889 | 93.4% |
| Smartphone | 2,767 | 89.5% |
| Tablet | 2,499 | 80.8% |
| No Computing Device | 8 | 0.3% |
| Total | 3,092 | 100.0% |
Internet Access in North Star
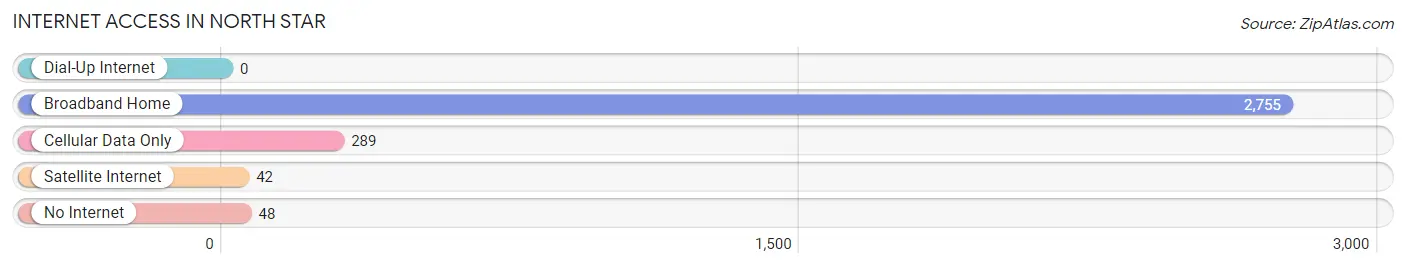
| Internet Type | # Households | % Households |
| Dial-Up Internet | 0 | 0.0% |
| Broadband Home | 2,755 | 89.1% |
| Cellular Data Only | 289 | 9.3% |
| Satellite Internet | 42 | 1.4% |
| No Internet | 48 | 1.5% |
| Total | 3,092 | 100.0% |
North Star Summary
North Star is a small unincorporated community located in Kent County, Delaware. It is situated in the northern part of the state, near the Maryland border. The community is located on the banks of the Chesapeake and Delaware Canal, and is home to a population of approximately 1,000 people.
History
North Star was first settled in the late 1700s by a group of Quakers from Pennsylvania. The community was originally known as “North Star Meeting House”, and was named after the nearby North Star Creek. The creek was named after the North Star, which was used by the Quakers to guide their travels.
The community grew slowly over the years, and by the mid-1800s, it had become a thriving agricultural community. The area was known for its production of wheat, corn, and other grains. In addition, the community was home to several small businesses, including a general store, a blacksmith, and a post office.
In the late 1800s, the Chesapeake and Delaware Canal was constructed, connecting the Delaware River to the Chesapeake Bay. This allowed for increased trade and commerce in the area, and the community of North Star began to grow. By the early 1900s, the population had grown to over 1,000 people.
Geography
North Star is located in northern Kent County, Delaware, near the Maryland border. The community is situated on the banks of the Chesapeake and Delaware Canal, and is surrounded by farmland and woodlands. The area is mostly flat, with some rolling hills in the surrounding area.
The climate in North Star is typical of the mid-Atlantic region, with hot, humid summers and cold, wet winters. The average annual temperature is around 55 degrees Fahrenheit, and the average annual precipitation is around 40 inches.
Economy
The economy of North Star is largely based on agriculture and tourism. The area is home to several farms, which produce a variety of crops, including wheat, corn, and soybeans. In addition, the community is home to several small businesses, including a general store, a blacksmith, and a post office.
The area is also a popular tourist destination, due to its proximity to the Chesapeake and Delaware Canal. The canal is a popular spot for fishing, boating, and other recreational activities. In addition, the area is home to several historic sites, including the North Star Meeting House and the North Star Cemetery.
Demographics
As of the 2010 census, the population of North Star was 1,000 people. The racial makeup of the community was 97.2% White, 0.7% African American, 0.3% Native American, 0.3% Asian, and 1.5% from other races. The median household income was $45,000, and the median home value was $150,000.
The majority of the population (90%) is affiliated with a Christian denomination. The largest denominations are Methodist (30%), Baptist (20%), and Presbyterian (20%). The remaining 10% of the population is unaffiliated with any religion.
Conclusion
North Star is a small unincorporated community located in Kent County, Delaware. It is situated on the banks of the Chesapeake and Delaware Canal, and is home to a population of approximately 1,000 people. The economy of North Star is largely based on agriculture and tourism, and the area is a popular tourist destination due to its proximity to the canal. The majority of the population is affiliated with a Christian denomination, and the median household income is $45,000.
Common Questions
What is Per Capita Income in North Star?
Per Capita income in North Star is $72,757.
What is the Median Family Income in North Star?
Median Family Income in North Star is $176,061.
What is the Median Household income in North Star?
Median Household Income in North Star is $165,179.
What is Income or Wage Gap in North Star?
Income or Wage Gap in North Star is 33.2%.
Women in North Star earn 66.8 cents for every dollar earned by a man.
What is Inequality or Gini Index in North Star?
Inequality or Gini Index in North Star is 0.39.
What is the Total Population of North Star?
Total Population of North Star is 8,370.
What is the Total Male Population of North Star?
Total Male Population of North Star is 4,130.
What is the Total Female Population of North Star?
Total Female Population of North Star is 4,240.
What is the Ratio of Males per 100 Females in North Star?
There are 97.41 Males per 100 Females in North Star.
What is the Ratio of Females per 100 Males in North Star?
There are 102.66 Females per 100 Males in North Star.
What is the Median Population Age in North Star?
Median Population Age in North Star is 49.3 Years.
What is the Average Family Size in North Star
Average Family Size in North Star is 2.9 People.
What is the Average Household Size in North Star
Average Household Size in North Star is 2.7 People.
How Large is the Labor Force in North Star?
There are 4,423 People in the Labor Forcein in North Star.
What is the Percentage of People in the Labor Force in North Star?
63.6% of People are in the Labor Force in North Star.
What is the Unemployment Rate in North Star?
Unemployment Rate in North Star is 3.7%.