Maysville, KY Map & Demographics
Maysville Map
Maysville Overview
$31,089
PER CAPITA INCOME
$60,000
AVG FAMILY INCOME
$41,171
AVG HOUSEHOLD INCOME
28.0%
WAGE / INCOME GAP [ % ]
72.0¢/ $1
WAGE / INCOME GAP [ $ ]
0.54
INEQUALITY / GINI INDEX
8,831
TOTAL POPULATION
4,240
MALE POPULATION
4,591
FEMALE POPULATION
92.35
MALES / 100 FEMALES
108.28
FEMALES / 100 MALES
41.5
MEDIAN AGE
3.0
AVG FAMILY SIZE
2.3
AVG HOUSEHOLD SIZE
4,022
LABOR FORCE [ PEOPLE ]
56.4%
PERCENT IN LABOR FORCE
4.8%
UNEMPLOYMENT RATE
Maysville Zip Codes
Maysville Area Codes
Income in Maysville
Income Overview in Maysville
Per Capita Income in Maysville is $31,089, while median incomes of families and households are $60,000 and $41,171 respectively.
| Characteristic | Number | Measure |
| Per Capita Income | 8,831 | $31,089 |
| Median Family Income | 2,220 | $60,000 |
| Mean Family Income | 2,220 | $83,243 |
| Median Household Income | 3,703 | $41,171 |
| Mean Household Income | 3,703 | $69,423 |
| Income Deficit | 2,220 | $0 |
| Wage / Income Gap (%) | 8,831 | 28.03% |
| Wage / Income Gap ($) | 8,831 | 71.97¢ per $1 |
| Gini / Inequality Index | 8,831 | 0.54 |
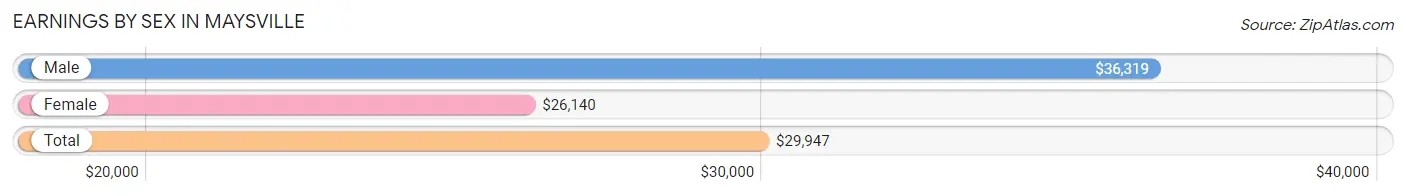
Earnings by Sex in Maysville
Average Earnings in Maysville are $29,947, $36,319 for men and $26,140 for women, a difference of 28.0%.
| Sex | Number | Average Earnings |
| Male | 2,149 (50.8%) | $36,319 |
| Female | 2,080 (49.2%) | $26,140 |
| Total | 4,229 (100.0%) | $29,947 |
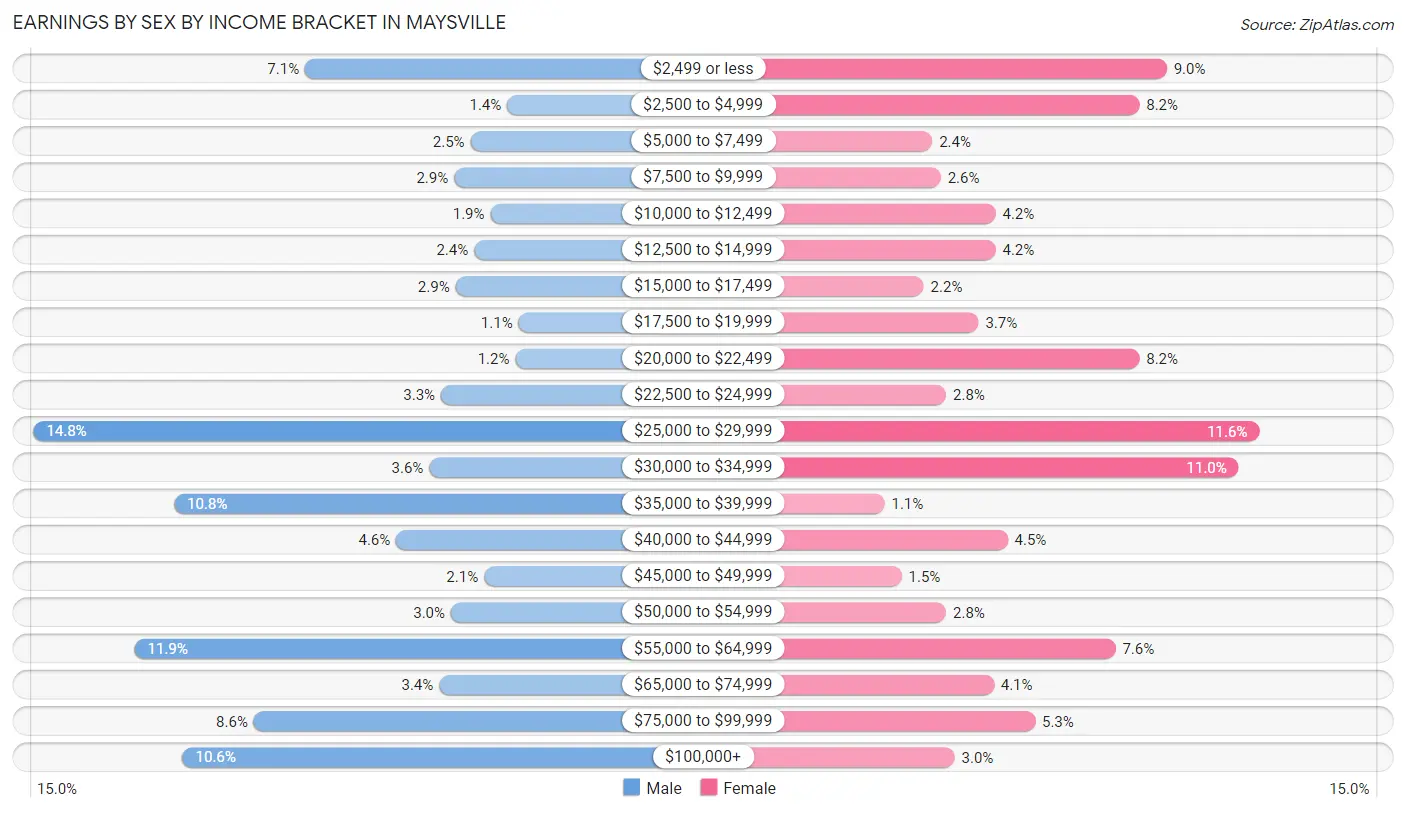
Earnings by Sex by Income Bracket in Maysville
The most common earnings brackets in Maysville are $25,000 to $29,999 for men (317 | 14.7%) and $25,000 to $29,999 for women (241 | 11.6%).
| Income | Male | Female |
| $2,499 or less | 153 (7.1%) | 187 (9.0%) |
| $2,500 to $4,999 | 31 (1.4%) | 171 (8.2%) |
| $5,000 to $7,499 | 53 (2.5%) | 50 (2.4%) |
| $7,500 to $9,999 | 63 (2.9%) | 55 (2.6%) |
| $10,000 to $12,499 | 41 (1.9%) | 87 (4.2%) |
| $12,500 to $14,999 | 51 (2.4%) | 87 (4.2%) |
| $15,000 to $17,499 | 62 (2.9%) | 45 (2.2%) |
| $17,500 to $19,999 | 24 (1.1%) | 77 (3.7%) |
| $20,000 to $22,499 | 26 (1.2%) | 171 (8.2%) |
| $22,500 to $24,999 | 71 (3.3%) | 58 (2.8%) |
| $25,000 to $29,999 | 317 (14.7%) | 241 (11.6%) |
| $30,000 to $34,999 | 78 (3.6%) | 229 (11.0%) |
| $35,000 to $39,999 | 232 (10.8%) | 22 (1.1%) |
| $40,000 to $44,999 | 98 (4.6%) | 94 (4.5%) |
| $45,000 to $49,999 | 45 (2.1%) | 32 (1.5%) |
| $50,000 to $54,999 | 65 (3.0%) | 58 (2.8%) |
| $55,000 to $64,999 | 256 (11.9%) | 157 (7.5%) |
| $65,000 to $74,999 | 72 (3.4%) | 86 (4.1%) |
| $75,000 to $99,999 | 184 (8.6%) | 110 (5.3%) |
| $100,000+ | 227 (10.6%) | 63 (3.0%) |
| Total | 2,149 (100.0%) | 2,080 (100.0%) |
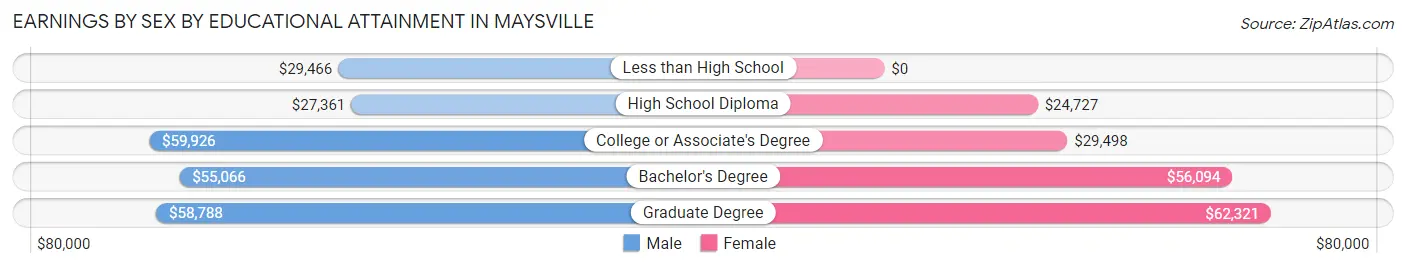
Earnings by Sex by Educational Attainment in Maysville
Average earnings in Maysville are $41,003 for men and $28,770 for women, a difference of 29.8%. Men with an educational attainment of college or associate's degree enjoy the highest average annual earnings of $59,926, while those with high school diploma education earn the least with $27,361. Women with an educational attainment of graduate degree earn the most with the average annual earnings of $62,321, while those with high school diploma education have the smallest earnings of $24,727.
| Educational Attainment | Male Income | Female Income |
| Less than High School | $29,466 | $0 |
| High School Diploma | $27,361 | $24,727 |
| College or Associate's Degree | $59,926 | $29,498 |
| Bachelor's Degree | $55,066 | $56,094 |
| Graduate Degree | $58,788 | $62,321 |
| Total | $41,003 | $28,770 |
Family Income in Maysville
Family Income Brackets in Maysville
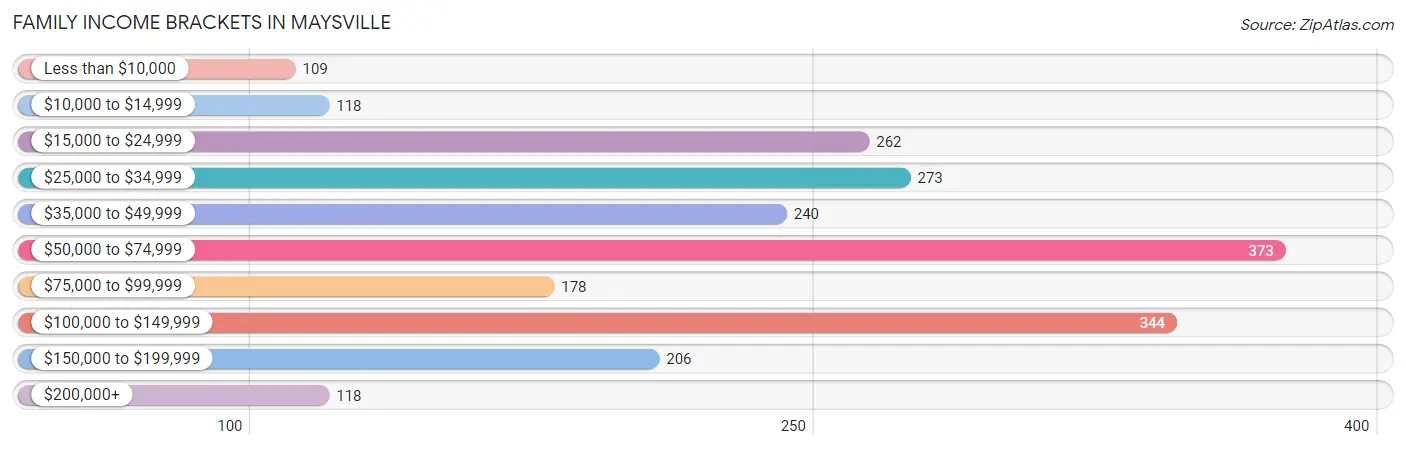
According to the Maysville family income data, there are 373 families falling into the $50,000 to $74,999 income range, which is the most common income bracket and makes up 16.8% of all families. Conversely, the less than $10,000 income bracket is the least frequent group with only 109 families (4.9%) belonging to this category.
| Income Bracket | # Families | % Families |
| Less than $10,000 | 109 | 4.9% |
| $10,000 to $14,999 | 118 | 5.3% |
| $15,000 to $24,999 | 262 | 11.8% |
| $25,000 to $34,999 | 273 | 12.3% |
| $35,000 to $49,999 | 240 | 10.8% |
| $50,000 to $74,999 | 373 | 16.8% |
| $75,000 to $99,999 | 178 | 8.0% |
| $100,000 to $149,999 | 344 | 15.5% |
| $150,000 to $199,999 | 206 | 9.3% |
| $200,000+ | 118 | 5.3% |
Family Income by Famaliy Size in Maysville
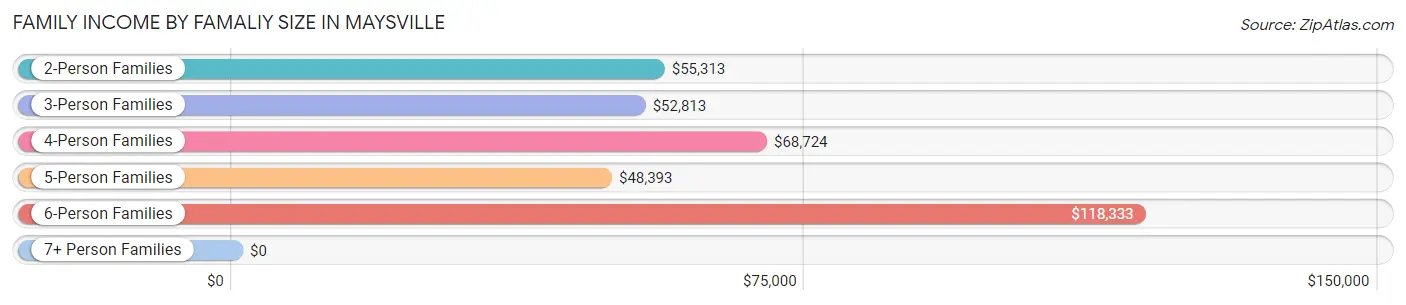
6-person families (24 | 1.1%) account for the highest median family income in Maysville with $118,333 per family, while 2-person families (1,328 | 59.8%) have the highest median income of $27,656 per family member.
| Income Bracket | # Families | Median Income |
| 2-Person Families | 1,328 (59.8%) | $55,313 |
| 3-Person Families | 350 (15.8%) | $52,813 |
| 4-Person Families | 361 (16.3%) | $68,724 |
| 5-Person Families | 92 (4.1%) | $48,393 |
| 6-Person Families | 24 (1.1%) | $118,333 |
| 7+ Person Families | 65 (2.9%) | $0 |
| Total | 2,220 (100.0%) | $60,000 |
Family Income by Number of Earners in Maysville
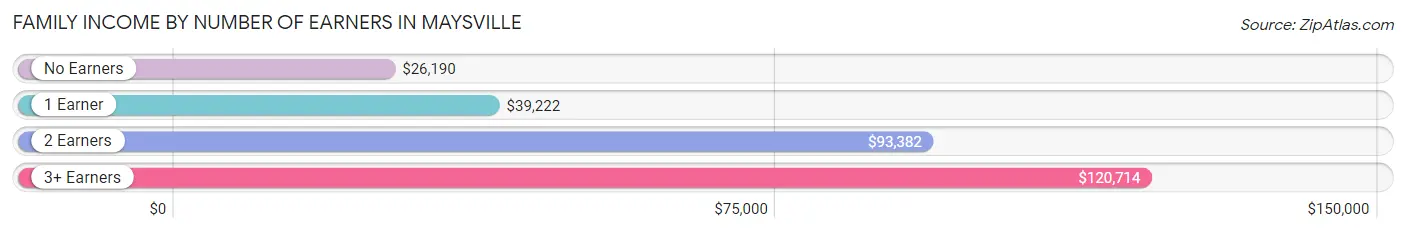
The median family income in Maysville is $60,000, with families comprising 3+ earners (232) having the highest median family income of $120,714, while families with no earners (470) have the lowest median family income of $26,190, accounting for 10.4% and 21.2% of families, respectively.
| Number of Earners | # Families | Median Income |
| No Earners | 470 (21.2%) | $26,190 |
| 1 Earner | 912 (41.1%) | $39,222 |
| 2 Earners | 606 (27.3%) | $93,382 |
| 3+ Earners | 232 (10.4%) | $120,714 |
| Total | 2,220 (100.0%) | $60,000 |
Household Income in Maysville
Household Income Brackets in Maysville
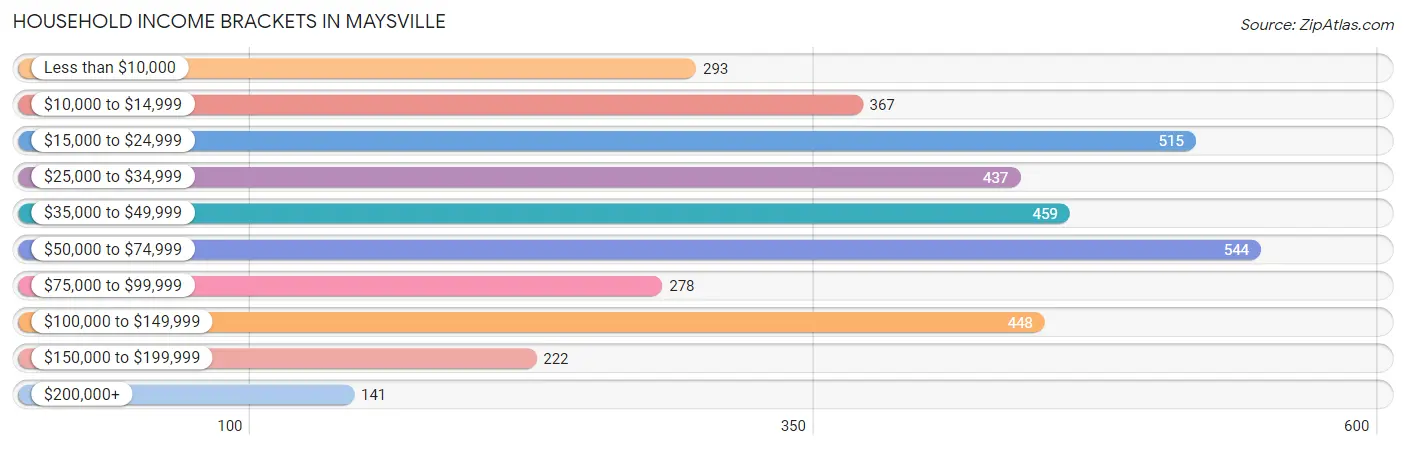
With 544 households falling in the category, the $50,000 to $74,999 income range is the most frequent in Maysville, accounting for 14.7% of all households. In contrast, only 141 households (3.8%) fall into the $200,000+ income bracket, making it the least populous group.
| Income Bracket | # Households | % Households |
| Less than $10,000 | 293 | 7.9% |
| $10,000 to $14,999 | 367 | 9.9% |
| $15,000 to $24,999 | 515 | 13.9% |
| $25,000 to $34,999 | 437 | 11.8% |
| $35,000 to $49,999 | 459 | 12.4% |
| $50,000 to $74,999 | 544 | 14.7% |
| $75,000 to $99,999 | 278 | 7.5% |
| $100,000 to $149,999 | 448 | 12.1% |
| $150,000 to $199,999 | 222 | 6.0% |
| $200,000+ | 141 | 3.8% |
Household Income by Householder Age in Maysville
The median household income in Maysville is $41,171, with the highest median household income of $60,692 found in the 45 to 64 years age bracket for the primary householder. A total of 1,308 households (35.3%) fall into this category. Meanwhile, the 15 to 24 years age bracket for the primary householder has the lowest median household income of $20,270, with 154 households (4.2%) in this group.
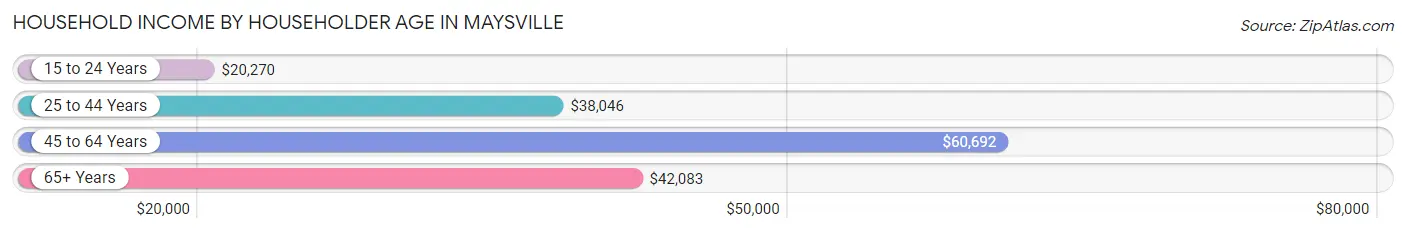
| Income Bracket | # Households | Median Income |
| 15 to 24 Years | 154 (4.2%) | $20,270 |
| 25 to 44 Years | 1,127 (30.4%) | $38,046 |
| 45 to 64 Years | 1,308 (35.3%) | $60,692 |
| 65+ Years | 1,114 (30.1%) | $42,083 |
| Total | 3,703 (100.0%) | $41,171 |
Poverty in Maysville
Income Below Poverty by Sex and Age in Maysville
With 18.9% poverty level for males and 28.0% for females among the residents of Maysville, 6 to 11 year old males and under 5 year old females are the most vulnerable to poverty, with 210 males (50.0%) and 215 females (56.9%) in their respective age groups living below the poverty level.
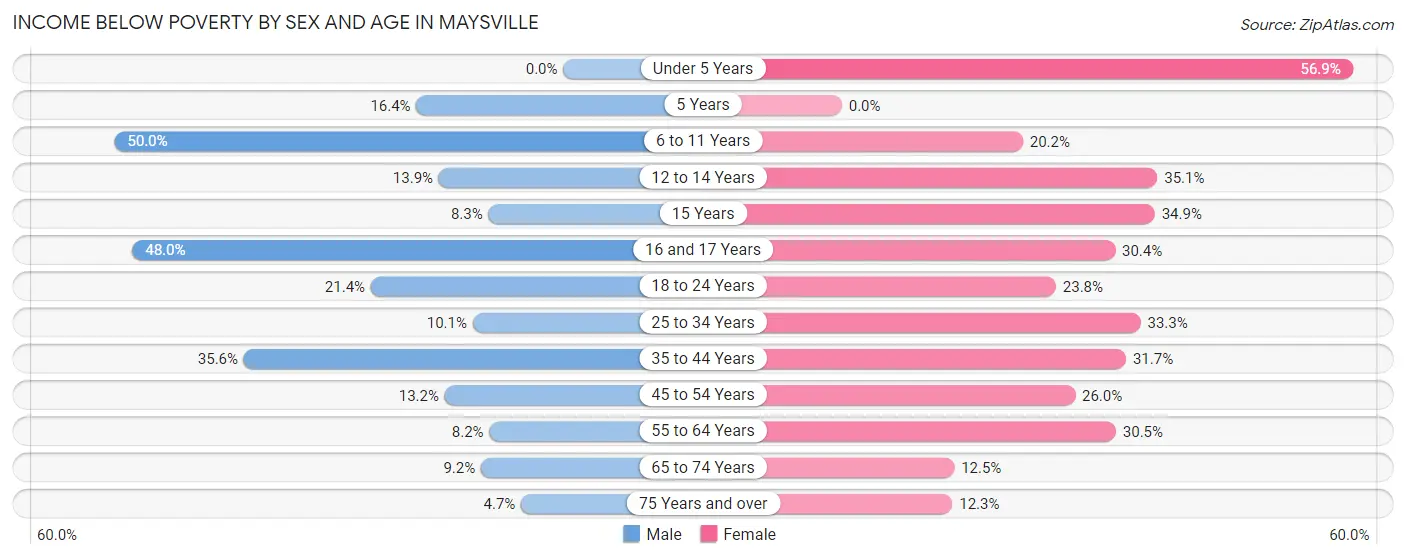
| Age Bracket | Male | Female |
| Under 5 Years | 0 (0.0%) | 215 (56.9%) |
| 5 Years | 9 (16.4%) | 0 (0.0%) |
| 6 to 11 Years | 210 (50.0%) | 50 (20.2%) |
| 12 to 14 Years | 14 (13.9%) | 52 (35.1%) |
| 15 Years | 10 (8.3%) | 23 (34.8%) |
| 16 and 17 Years | 24 (48.0%) | 35 (30.4%) |
| 18 to 24 Years | 75 (21.4%) | 82 (23.8%) |
| 25 to 34 Years | 39 (10.1%) | 180 (33.3%) |
| 35 to 44 Years | 211 (35.6%) | 163 (31.7%) |
| 45 to 54 Years | 71 (13.2%) | 152 (26.0%) |
| 55 to 64 Years | 41 (8.2%) | 188 (30.5%) |
| 65 to 74 Years | 55 (9.2%) | 64 (12.5%) |
| 75 Years and over | 11 (4.7%) | 48 (12.3%) |
| Total | 770 (18.9%) | 1,252 (28.0%) |
Income Above Poverty by Sex and Age in Maysville
According to the poverty statistics in Maysville, males aged under 5 years and females aged 5 years are the age groups that are most secure financially, with 100.0% of males and 100.0% of females in these age groups living above the poverty line.
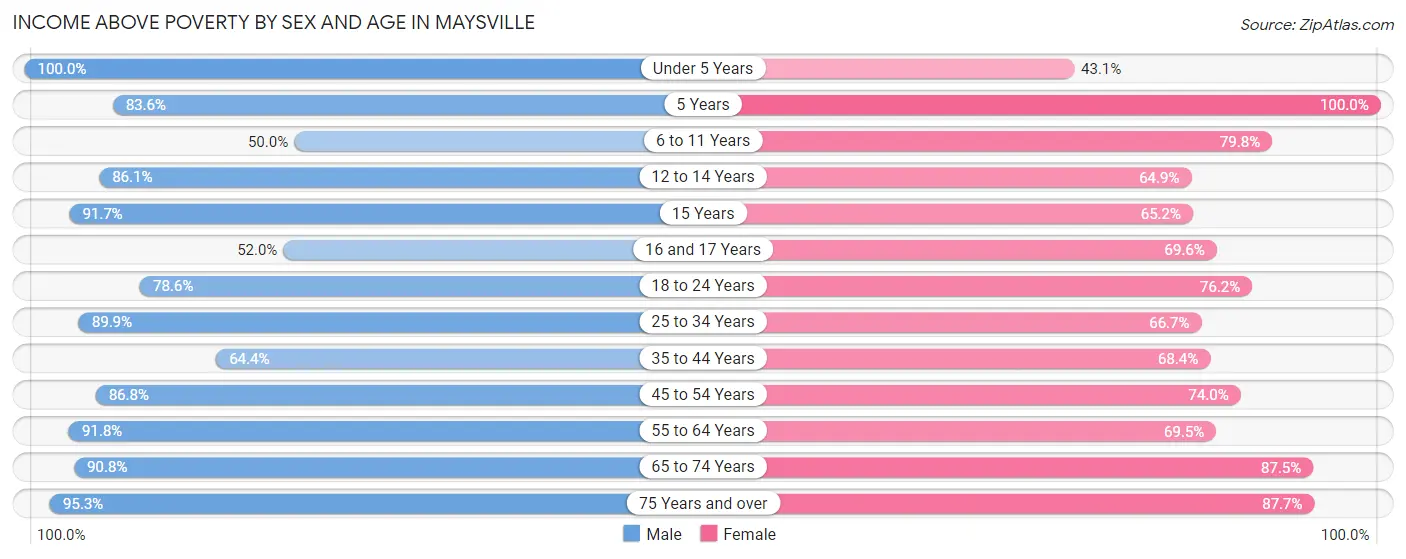
| Age Bracket | Male | Female |
| Under 5 Years | 131 (100.0%) | 163 (43.1%) |
| 5 Years | 46 (83.6%) | 17 (100.0%) |
| 6 to 11 Years | 210 (50.0%) | 198 (79.8%) |
| 12 to 14 Years | 87 (86.1%) | 96 (64.9%) |
| 15 Years | 110 (91.7%) | 43 (65.1%) |
| 16 and 17 Years | 26 (52.0%) | 80 (69.6%) |
| 18 to 24 Years | 275 (78.6%) | 262 (76.2%) |
| 25 to 34 Years | 348 (89.9%) | 361 (66.7%) |
| 35 to 44 Years | 382 (64.4%) | 352 (68.3%) |
| 45 to 54 Years | 467 (86.8%) | 433 (74.0%) |
| 55 to 64 Years | 457 (91.8%) | 428 (69.5%) |
| 65 to 74 Years | 545 (90.8%) | 447 (87.5%) |
| 75 Years and over | 223 (95.3%) | 342 (87.7%) |
| Total | 3,307 (81.1%) | 3,222 (72.0%) |
Income Below Poverty Among Married-Couple Families in Maysville
The poverty statistics for married-couple families in Maysville show that 11.8% or 161 of the total 1,368 families live below the poverty line. Families with 3 or 4 children have the highest poverty rate of 43.3%, comprising of 52 families. On the other hand, families with no children have the lowest poverty rate of 8.1%, which includes 75 families.
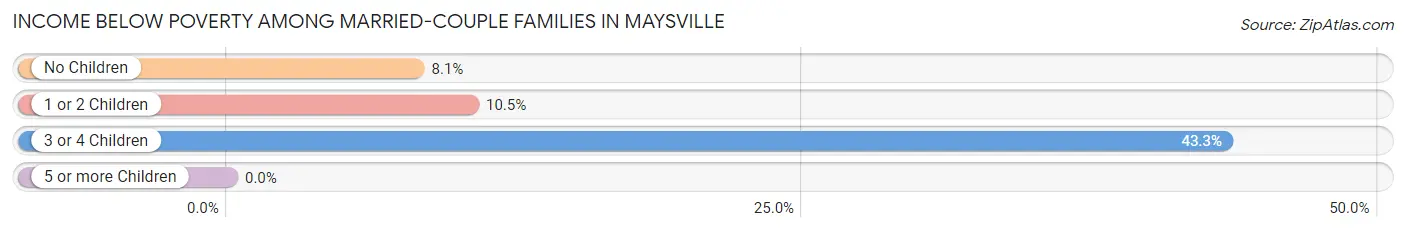
| Children | Above Poverty | Below Poverty |
| No Children | 849 (91.9%) | 75 (8.1%) |
| 1 or 2 Children | 290 (89.5%) | 34 (10.5%) |
| 3 or 4 Children | 68 (56.7%) | 52 (43.3%) |
| 5 or more Children | 0 (0.0%) | 0 (0.0%) |
| Total | 1,207 (88.2%) | 161 (11.8%) |
Income Below Poverty Among Single-Parent Households in Maysville
According to the poverty data in Maysville, 15.7% or 18 single-father households and 35.3% or 260 single-mother households are living below the poverty line. Among single-father households, those with 1 or 2 children have the highest poverty rate, with 18 households (32.1%) experiencing poverty. Likewise, among single-mother households, those with 5 or more children have the highest poverty rate, with 23 households (100.0%) falling below the poverty line.
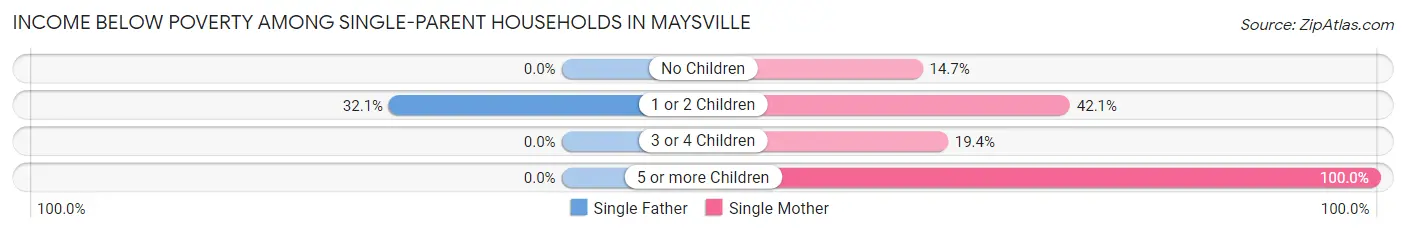
| Children | Single Father | Single Mother |
| No Children | 0 (0.0%) | 26 (14.7%) |
| 1 or 2 Children | 18 (32.1%) | 198 (42.1%) |
| 3 or 4 Children | 0 (0.0%) | 13 (19.4%) |
| 5 or more Children | 0 (0.0%) | 23 (100.0%) |
| Total | 18 (15.7%) | 260 (35.3%) |
Income Below Poverty Among Married-Couple vs Single-Parent Households in Maysville
The poverty data for Maysville shows that 161 of the married-couple family households (11.8%) and 278 of the single-parent households (32.6%) are living below the poverty level. Within the married-couple family households, those with 3 or 4 children have the highest poverty rate, with 52 households (43.3%) falling below the poverty line. Among the single-parent households, those with 5 or more children have the highest poverty rate, with 23 household (100.0%) living below poverty.
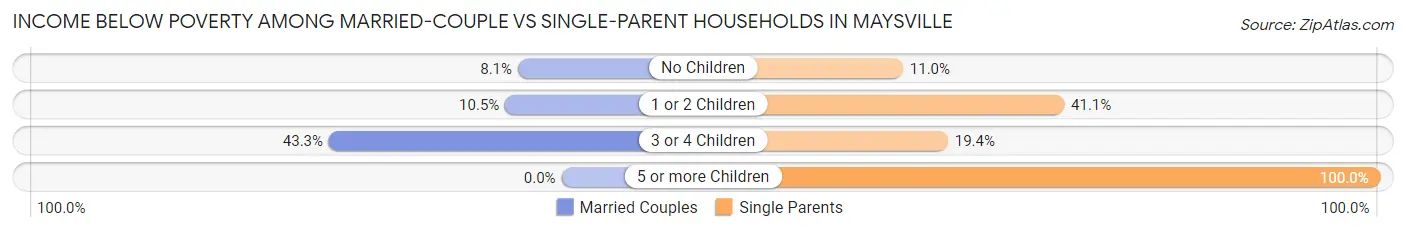
| Children | Married-Couple Families | Single-Parent Households |
| No Children | 75 (8.1%) | 26 (11.0%) |
| 1 or 2 Children | 34 (10.5%) | 216 (41.1%) |
| 3 or 4 Children | 52 (43.3%) | 13 (19.4%) |
| 5 or more Children | 0 (0.0%) | 23 (100.0%) |
| Total | 161 (11.8%) | 278 (32.6%) |
Race in Maysville
The most populous races in Maysville are White / Caucasian (7,651 | 86.6%), Black / African American (607 | 6.9%), and Two or more Races (391 | 4.4%).
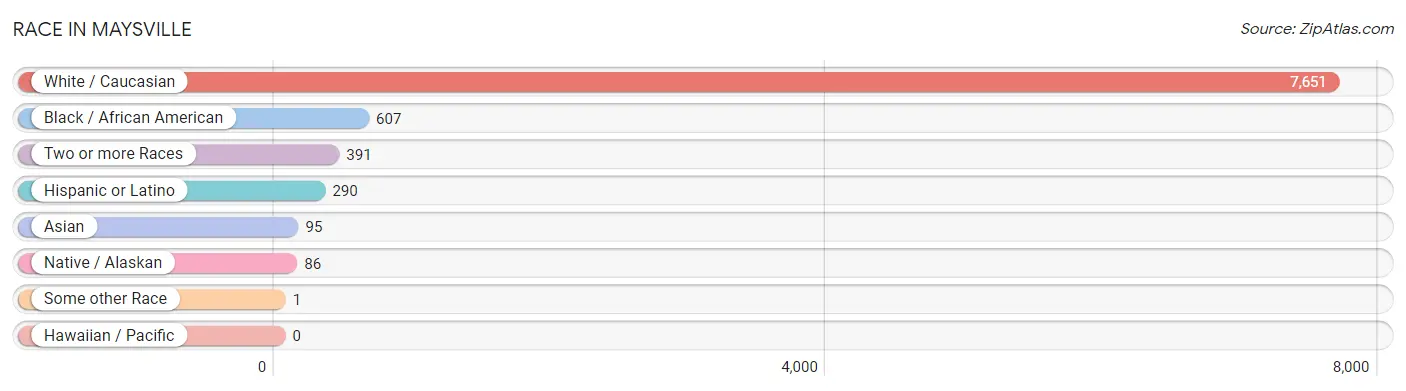
| Race | # Population | % Population |
| Asian | 95 | 1.1% |
| Black / African American | 607 | 6.9% |
| Hawaiian / Pacific | 0 | 0.0% |
| Hispanic or Latino | 290 | 3.3% |
| Native / Alaskan | 86 | 1.0% |
| White / Caucasian | 7,651 | 86.6% |
| Two or more Races | 391 | 4.4% |
| Some other Race | 1 | 0.0% |
| Total | 8,831 | 100.0% |
Ancestry in Maysville
The most populous ancestries reported in Maysville are American (2,256 | 25.6%), Irish (1,350 | 15.3%), English (1,348 | 15.3%), German (1,100 | 12.5%), and Scottish (253 | 2.9%), together accounting for 71.4% of all Maysville residents.
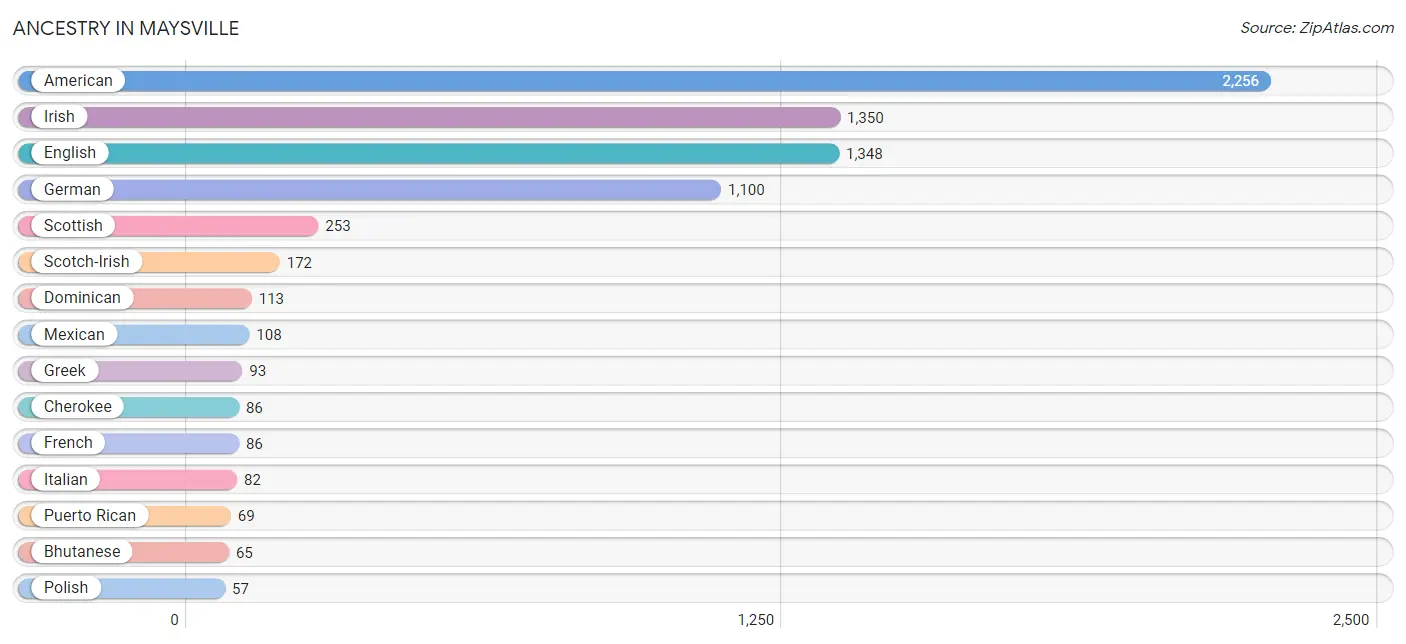
| Ancestry | # Population | % Population |
| American | 2,256 | 25.6% |
| Bhutanese | 65 | 0.7% |
| British | 22 | 0.3% |
| Burmese | 5 | 0.1% |
| Canadian | 11 | 0.1% |
| Cherokee | 86 | 1.0% |
| Dominican | 113 | 1.3% |
| Dutch | 17 | 0.2% |
| Eastern European | 5 | 0.1% |
| English | 1,348 | 15.3% |
| European | 19 | 0.2% |
| French | 86 | 1.0% |
| French Canadian | 38 | 0.4% |
| German | 1,100 | 12.5% |
| Greek | 93 | 1.1% |
| Indian (Asian) | 16 | 0.2% |
| Irish | 1,350 | 15.3% |
| Italian | 82 | 0.9% |
| Korean | 25 | 0.3% |
| Mexican | 108 | 1.2% |
| Norwegian | 23 | 0.3% |
| Pennsylvania German | 23 | 0.3% |
| Polish | 57 | 0.6% |
| Portuguese | 44 | 0.5% |
| Puerto Rican | 69 | 0.8% |
| Scandinavian | 46 | 0.5% |
| Scotch-Irish | 172 | 1.9% |
| Scottish | 253 | 2.9% |
| Subsaharan African | 27 | 0.3% |
| Ugandan | 27 | 0.3% |
| Welsh | 33 | 0.4% | View All 31 Rows |
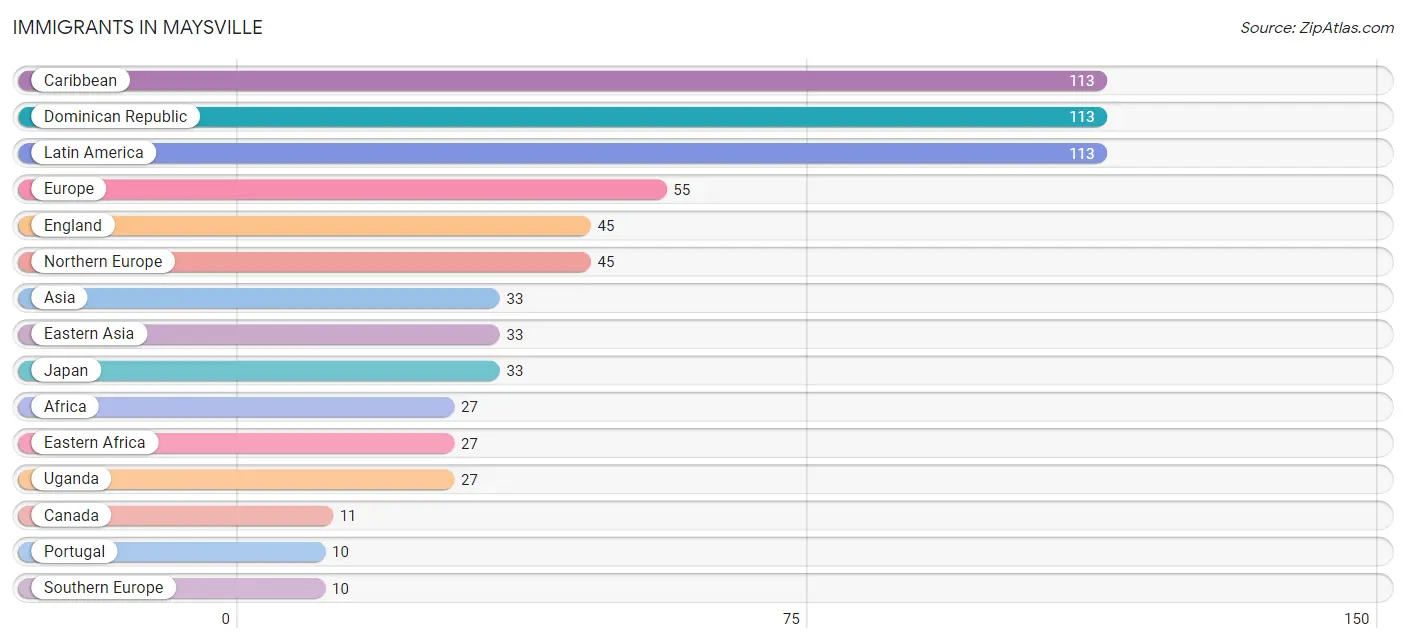
Immigrants in Maysville
The most numerous immigrant groups reported in Maysville came from Caribbean (113 | 1.3%), Dominican Republic (113 | 1.3%), Latin America (113 | 1.3%), Europe (55 | 0.6%), and England (45 | 0.5%), together accounting for 5.0% of all Maysville residents.
| Immigration Origin | # Population | % Population |
| Africa | 27 | 0.3% |
| Asia | 33 | 0.4% |
| Canada | 11 | 0.1% |
| Caribbean | 113 | 1.3% |
| Dominican Republic | 113 | 1.3% |
| Eastern Africa | 27 | 0.3% |
| Eastern Asia | 33 | 0.4% |
| England | 45 | 0.5% |
| Europe | 55 | 0.6% |
| Japan | 33 | 0.4% |
| Latin America | 113 | 1.3% |
| Northern Europe | 45 | 0.5% |
| Portugal | 10 | 0.1% |
| Southern Europe | 10 | 0.1% |
| Uganda | 27 | 0.3% | View All 15 Rows |
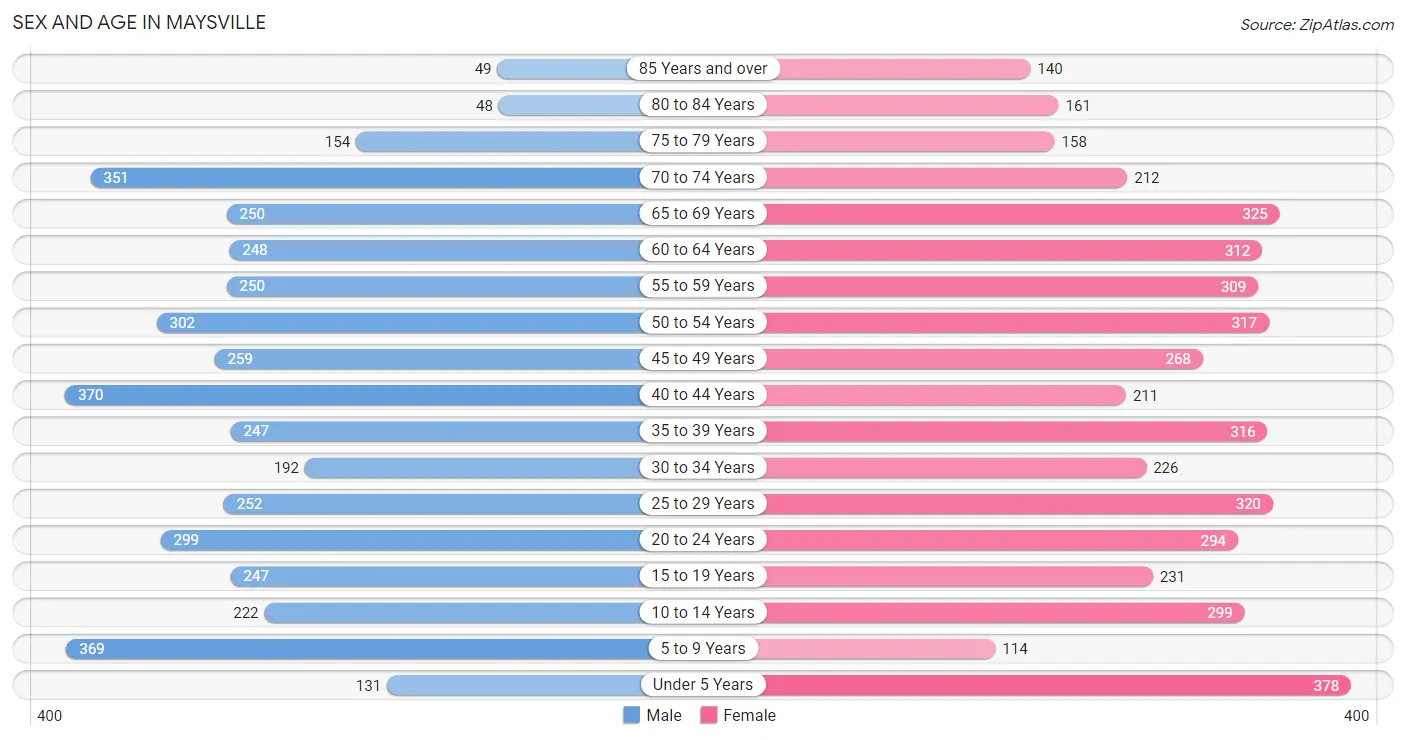
Sex and Age in Maysville
Sex and Age in Maysville
The most populous age groups in Maysville are 40 to 44 Years (370 | 8.7%) for men and Under 5 Years (378 | 8.2%) for women.
| Age Bracket | Male | Female |
| Under 5 Years | 131 (3.1%) | 378 (8.2%) |
| 5 to 9 Years | 369 (8.7%) | 114 (2.5%) |
| 10 to 14 Years | 222 (5.2%) | 299 (6.5%) |
| 15 to 19 Years | 247 (5.8%) | 231 (5.0%) |
| 20 to 24 Years | 299 (7.0%) | 294 (6.4%) |
| 25 to 29 Years | 252 (5.9%) | 320 (7.0%) |
| 30 to 34 Years | 192 (4.5%) | 226 (4.9%) |
| 35 to 39 Years | 247 (5.8%) | 316 (6.9%) |
| 40 to 44 Years | 370 (8.7%) | 211 (4.6%) |
| 45 to 49 Years | 259 (6.1%) | 268 (5.8%) |
| 50 to 54 Years | 302 (7.1%) | 317 (6.9%) |
| 55 to 59 Years | 250 (5.9%) | 309 (6.7%) |
| 60 to 64 Years | 248 (5.9%) | 312 (6.8%) |
| 65 to 69 Years | 250 (5.9%) | 325 (7.1%) |
| 70 to 74 Years | 351 (8.3%) | 212 (4.6%) |
| 75 to 79 Years | 154 (3.6%) | 158 (3.4%) |
| 80 to 84 Years | 48 (1.1%) | 161 (3.5%) |
| 85 Years and over | 49 (1.2%) | 140 (3.0%) |
| Total | 4,240 (100.0%) | 4,591 (100.0%) |
Families and Households in Maysville
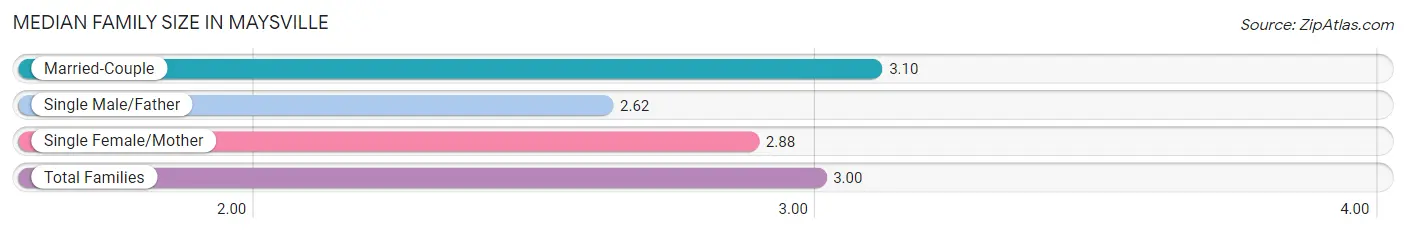
Median Family Size in Maysville
The median family size in Maysville is 3.00 persons per family, with married-couple families (1,368 | 61.6%) accounting for the largest median family size of 3.1 persons per family. On the other hand, single male/father families (115 | 5.2%) represent the smallest median family size with 2.62 persons per family.
| Family Type | # Families | Family Size |
| Married-Couple | 1,368 (61.6%) | 3.10 |
| Single Male/Father | 115 (5.2%) | 2.62 |
| Single Female/Mother | 737 (33.2%) | 2.88 |
| Total Families | 2,220 (100.0%) | 3.00 |
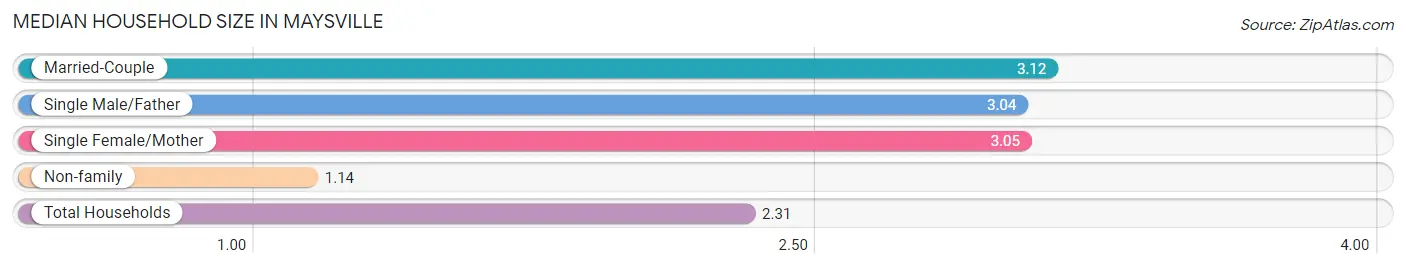
Median Household Size in Maysville
The median household size in Maysville is 2.31 persons per household, with married-couple households (1,368 | 36.9%) accounting for the largest median household size of 3.12 persons per household. non-family households (1,483 | 40.1%) represent the smallest median household size with 1.14 persons per household.
| Household Type | # Households | Household Size |
| Married-Couple | 1,368 (36.9%) | 3.12 |
| Single Male/Father | 115 (3.1%) | 3.04 |
| Single Female/Mother | 737 (19.9%) | 3.05 |
| Non-family | 1,483 (40.1%) | 1.14 |
| Total Households | 3,703 (100.0%) | 2.31 |
Household Size by Marriage Status in Maysville
Out of a total of 3,703 households in Maysville, 2,220 (60.0%) are family households, while 1,483 (40.1%) are nonfamily households. The most numerous type of family households are 2-person households, comprising 1,272, and the most common type of nonfamily households are 1-person households, comprising 1,299.
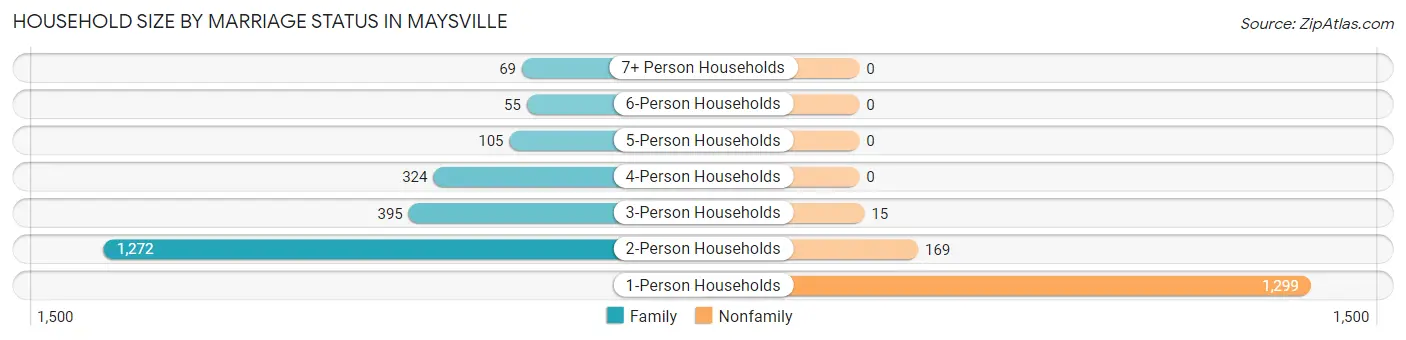
| Household Size | Family Households | Nonfamily Households |
| 1-Person Households | - | 1,299 (35.1%) |
| 2-Person Households | 1,272 (34.4%) | 169 (4.6%) |
| 3-Person Households | 395 (10.7%) | 15 (0.4%) |
| 4-Person Households | 324 (8.7%) | 0 (0.0%) |
| 5-Person Households | 105 (2.8%) | 0 (0.0%) |
| 6-Person Households | 55 (1.5%) | 0 (0.0%) |
| 7+ Person Households | 69 (1.9%) | 0 (0.0%) |
| Total | 2,220 (60.0%) | 1,483 (40.1%) |
Female Fertility in Maysville
Fertility by Age in Maysville
Average fertility rate in Maysville is 82.0 births per 1,000 women. Women in the age bracket of 20 to 34 years have the highest fertility rate with 164.0 births per 1,000 women. Women in the age bracket of 20 to 34 years acount for 85.7% of all women with births.
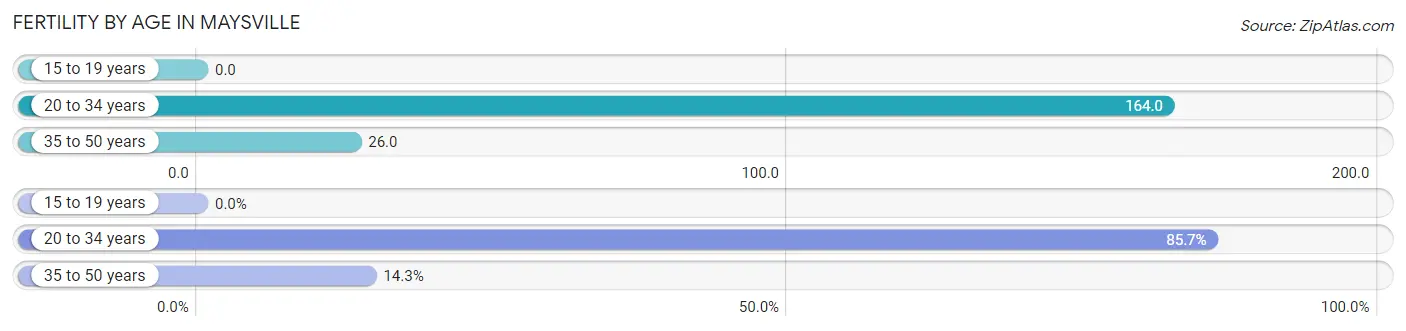
| Age Bracket | Women with Births | Births / 1,000 Women |
| 15 to 19 years | 0 (0.0%) | 0.0 |
| 20 to 34 years | 138 (85.7%) | 164.0 |
| 35 to 50 years | 23 (14.3%) | 26.0 |
| Total | 161 (100.0%) | 82.0 |
Fertility by Age by Marriage Status in Maysville
26.7% of women with births (161) in Maysville are married. The highest percentage of unmarried women with births falls into 20 to 34 years age bracket with 74.6% of them unmarried at the time of birth, while the lowest percentage of unmarried women with births belong to 35 to 50 years age bracket with 65.2% of them unmarried.
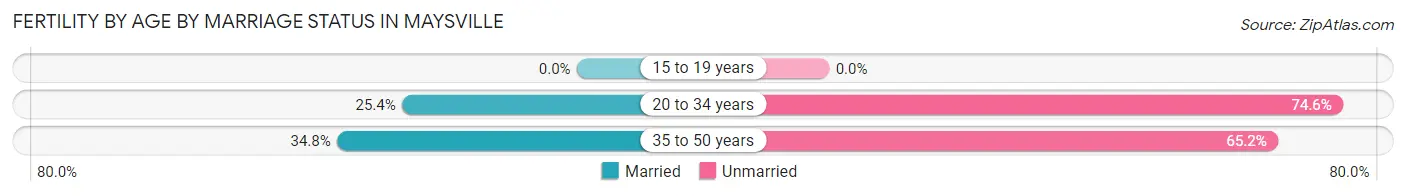
| Age Bracket | Married | Unmarried |
| 15 to 19 years | 0 (0.0%) | 0 (0.0%) |
| 20 to 34 years | 35 (25.4%) | 103 (74.6%) |
| 35 to 50 years | 8 (34.8%) | 15 (65.2%) |
| Total | 43 (26.7%) | 118 (73.3%) |
Fertility by Education in Maysville
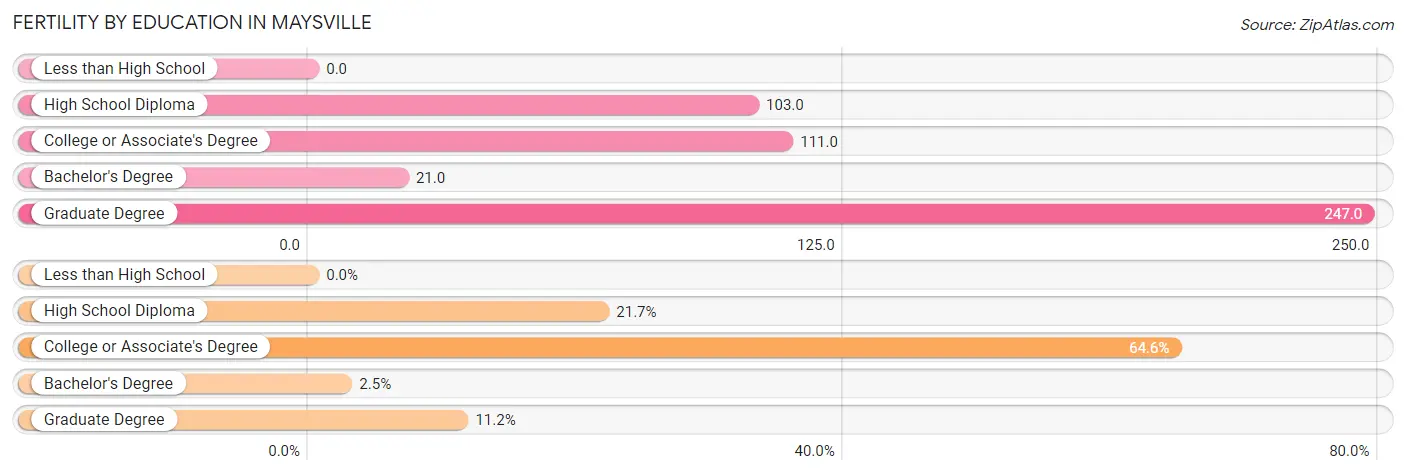
| Educational Attainment | Women with Births | Births / 1,000 Women |
| Less than High School | 0 (0.0%) | 0.0 |
| High School Diploma | 35 (21.7%) | 103.0 |
| College or Associate's Degree | 104 (64.6%) | 111.0 |
| Bachelor's Degree | 4 (2.5%) | 21.0 |
| Graduate Degree | 18 (11.2%) | 247.0 |
| Total | 161 (100.0%) | 82.0 |
Fertility by Education by Marriage Status in Maysville
73.3% of women with births in Maysville are unmarried. Women with the educational attainment of graduate degree are most likely to be married with 100.0% of them married at childbirth, while women with the educational attainment of college or associate's degree are least likely to be married with 100.0% of them unmarried at childbirth.
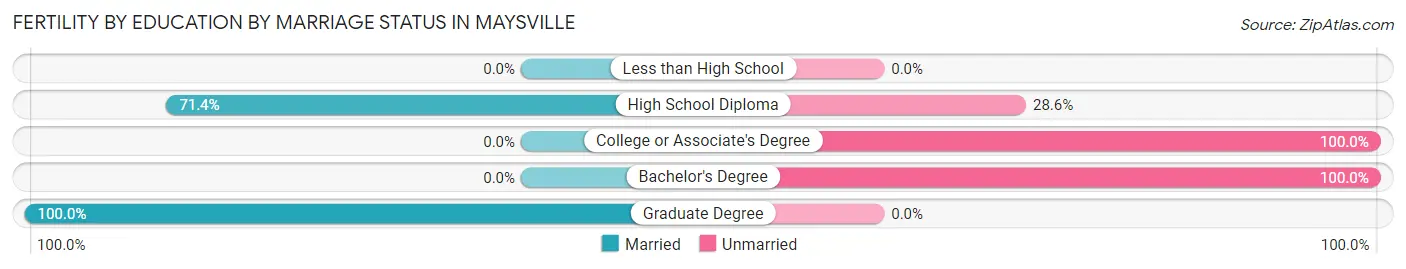
| Educational Attainment | Married | Unmarried |
| Less than High School | 0 (0.0%) | 0 (0.0%) |
| High School Diploma | 25 (71.4%) | 10 (28.6%) |
| College or Associate's Degree | 0 (0.0%) | 104 (100.0%) |
| Bachelor's Degree | 0 (0.0%) | 4 (100.0%) |
| Graduate Degree | 18 (100.0%) | 0 (0.0%) |
| Total | 43 (26.7%) | 118 (73.3%) |
Employment Characteristics in Maysville
Employment by Class of Employer in Maysville
Among the 3,793 employed individuals in Maysville, private company employees (2,623 | 69.2%), not-for-profit organizations (227 | 6.0%), and self-employed (not incorporated) (224 | 5.9%) make up the most common classes of employment.
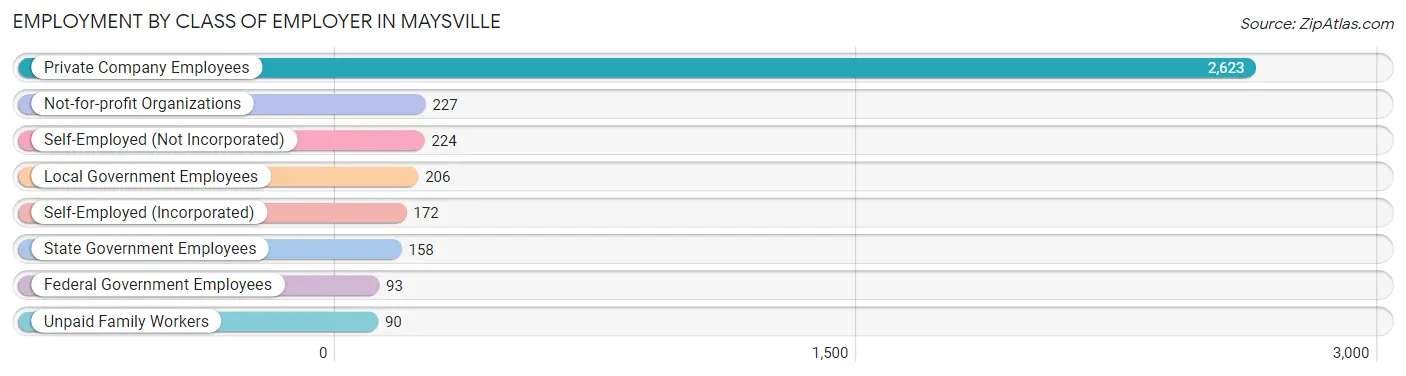
| Employer Class | # Employees | % Employees |
| Private Company Employees | 2,623 | 69.2% |
| Self-Employed (Incorporated) | 172 | 4.5% |
| Self-Employed (Not Incorporated) | 224 | 5.9% |
| Not-for-profit Organizations | 227 | 6.0% |
| Local Government Employees | 206 | 5.4% |
| State Government Employees | 158 | 4.2% |
| Federal Government Employees | 93 | 2.5% |
| Unpaid Family Workers | 90 | 2.4% |
| Total | 3,793 | 100.0% |
Employment Status by Age in Maysville
According to the labor force statistics for Maysville, out of the total population over 16 years of age (7,132), 56.4% or 4,022 individuals are in the labor force, with 4.8% or 193 of them unemployed. The age group with the highest labor force participation rate is 25 to 29 years, with 85.7% or 490 individuals in the labor force. Within the labor force, the 35 to 44 years age range has the highest percentage of unemployed individuals, with 6.4% or 50 of them being unemployed.
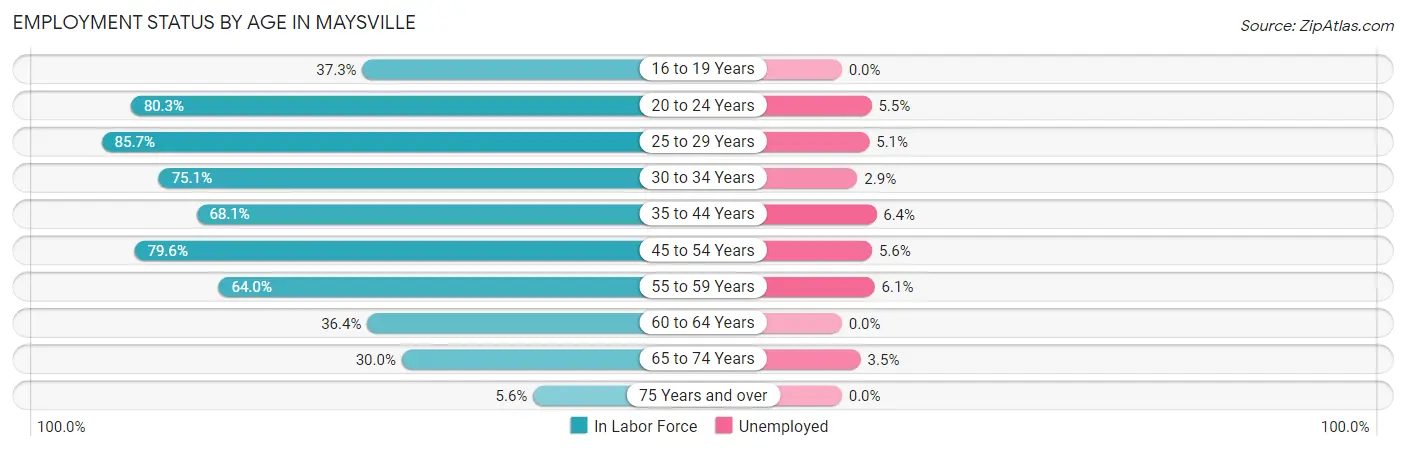
| Age Bracket | In Labor Force | Unemployed |
| 16 to 19 Years | 109 (37.3%) | 0 (0.0%) |
| 20 to 24 Years | 476 (80.3%) | 26 (5.5%) |
| 25 to 29 Years | 490 (85.7%) | 25 (5.1%) |
| 30 to 34 Years | 314 (75.1%) | 9 (2.9%) |
| 35 to 44 Years | 779 (68.1%) | 50 (6.4%) |
| 45 to 54 Years | 912 (79.6%) | 51 (5.6%) |
| 55 to 59 Years | 358 (64.0%) | 22 (6.1%) |
| 60 to 64 Years | 204 (36.4%) | 0 (0.0%) |
| 65 to 74 Years | 341 (30.0%) | 12 (3.5%) |
| 75 Years and over | 40 (5.6%) | 0 (0.0%) |
| Total | 4,022 (56.4%) | 193 (4.8%) |
Employment Status by Educational Attainment in Maysville
According to labor force statistics for Maysville, 69.5% of individuals (3,057) out of the total population between 25 and 64 years of age (4,399) are in the labor force, with 5.1% or 156 of them being unemployed. The group with the highest labor force participation rate are those with the educational attainment of bachelor's degree or higher, with 80.6% or 693 individuals in the labor force. Within the labor force, individuals with high school diploma education have the highest percentage of unemployment, with 11.5% or 85 of them being unemployed.
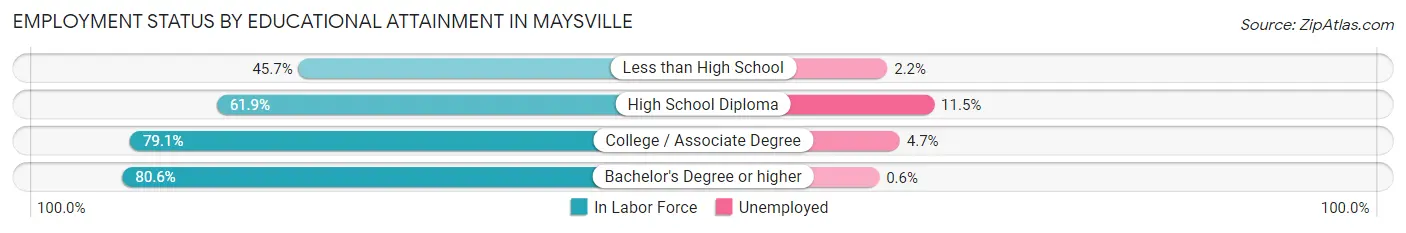
| Educational Attainment | In Labor Force | Unemployed |
| Less than High School | 315 (45.7%) | 15 (2.2%) |
| High School Diploma | 742 (61.9%) | 138 (11.5%) |
| College / Associate Degree | 1,307 (79.1%) | 78 (4.7%) |
| Bachelor's Degree or higher | 693 (80.6%) | 5 (0.6%) |
| Total | 3,057 (69.5%) | 224 (5.1%) |
Employment Occupations by Sex in Maysville
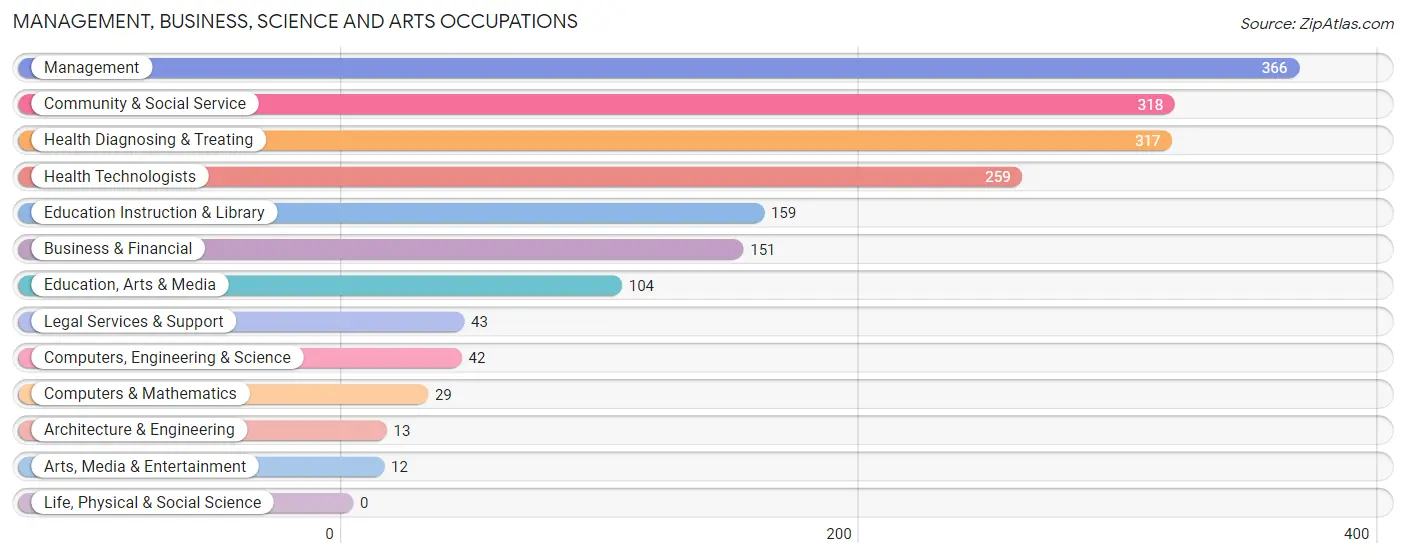
Management, Business, Science and Arts Occupations
The most common Management, Business, Science and Arts occupations in Maysville are Management (366 | 9.6%), Community & Social Service (318 | 8.3%), Health Diagnosing & Treating (317 | 8.3%), Health Technologists (259 | 6.8%), and Education Instruction & Library (159 | 4.2%).
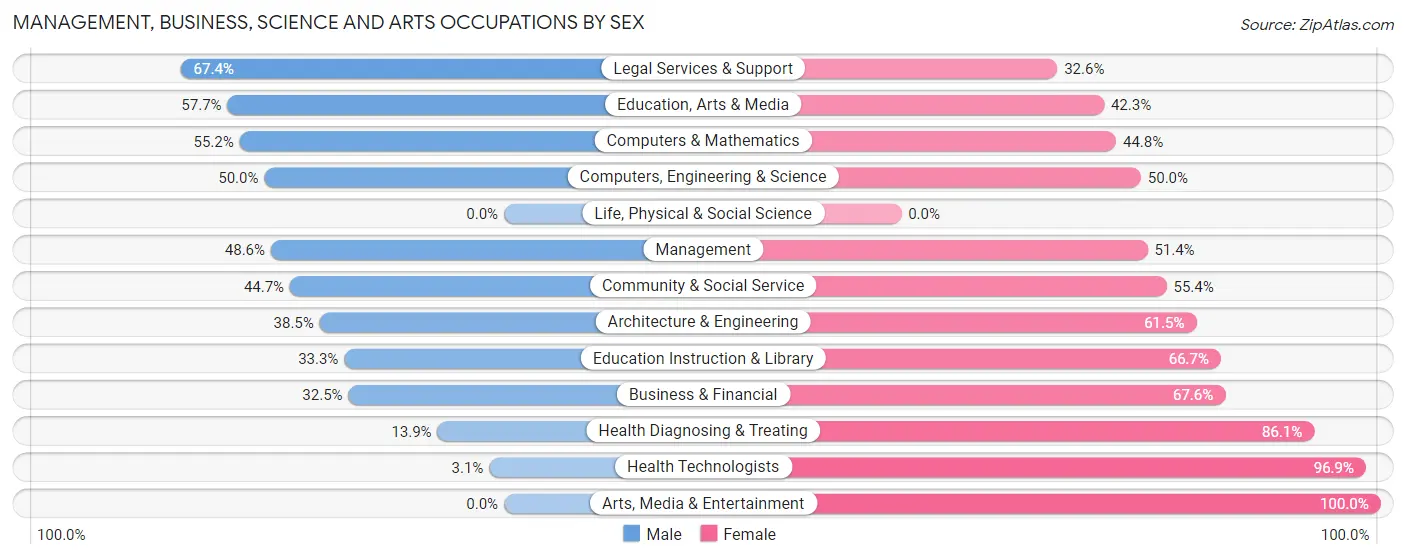
Management, Business, Science and Arts Occupations by Sex
Within the Management, Business, Science and Arts occupations in Maysville, the most male-oriented occupations are Legal Services & Support (67.4%), Education, Arts & Media (57.7%), and Computers & Mathematics (55.2%), while the most female-oriented occupations are Arts, Media & Entertainment (100.0%), Health Technologists (96.9%), and Health Diagnosing & Treating (86.1%).
| Occupation | Male | Female |
| Management | 178 (48.6%) | 188 (51.4%) |
| Business & Financial | 49 (32.5%) | 102 (67.5%) |
| Computers, Engineering & Science | 21 (50.0%) | 21 (50.0%) |
| Computers & Mathematics | 16 (55.2%) | 13 (44.8%) |
| Architecture & Engineering | 5 (38.5%) | 8 (61.5%) |
| Life, Physical & Social Science | 0 (0.0%) | 0 (0.0%) |
| Community & Social Service | 142 (44.7%) | 176 (55.3%) |
| Education, Arts & Media | 60 (57.7%) | 44 (42.3%) |
| Legal Services & Support | 29 (67.4%) | 14 (32.6%) |
| Education Instruction & Library | 53 (33.3%) | 106 (66.7%) |
| Arts, Media & Entertainment | 0 (0.0%) | 12 (100.0%) |
| Health Diagnosing & Treating | 44 (13.9%) | 273 (86.1%) |
| Health Technologists | 8 (3.1%) | 251 (96.9%) |
| Total (Category) | 434 (36.3%) | 760 (63.6%) |
| Total (Overall) | 1,915 (50.0%) | 1,913 (50.0%) |
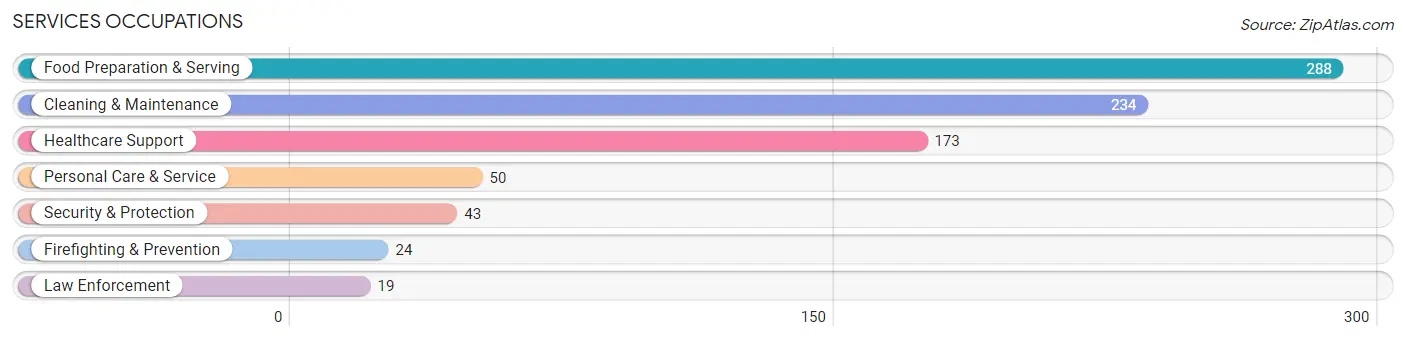
Services Occupations
The most common Services occupations in Maysville are Food Preparation & Serving (288 | 7.5%), Cleaning & Maintenance (234 | 6.1%), Healthcare Support (173 | 4.5%), Personal Care & Service (50 | 1.3%), and Security & Protection (43 | 1.1%).
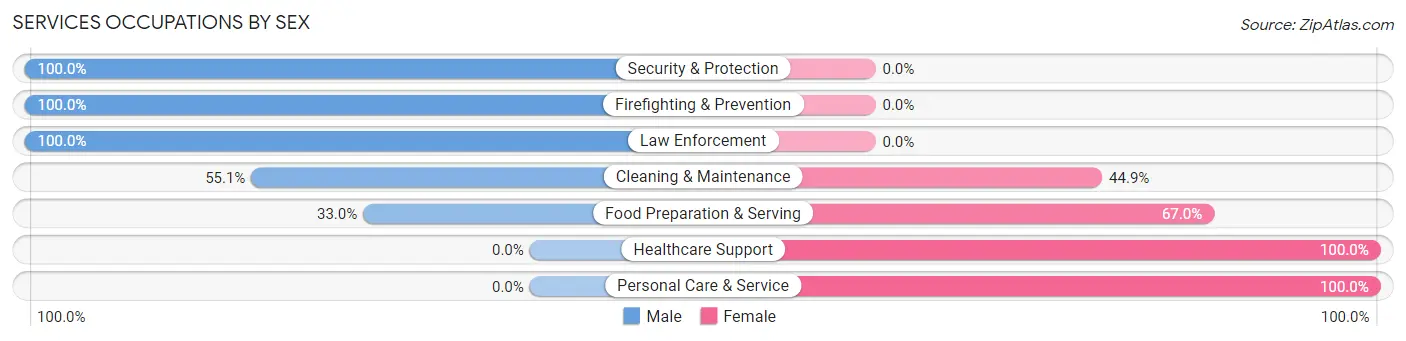
Services Occupations by Sex
Within the Services occupations in Maysville, the most male-oriented occupations are Security & Protection (100.0%), Firefighting & Prevention (100.0%), and Law Enforcement (100.0%), while the most female-oriented occupations are Healthcare Support (100.0%), Personal Care & Service (100.0%), and Food Preparation & Serving (67.0%).
| Occupation | Male | Female |
| Healthcare Support | 0 (0.0%) | 173 (100.0%) |
| Security & Protection | 43 (100.0%) | 0 (0.0%) |
| Firefighting & Prevention | 24 (100.0%) | 0 (0.0%) |
| Law Enforcement | 19 (100.0%) | 0 (0.0%) |
| Food Preparation & Serving | 95 (33.0%) | 193 (67.0%) |
| Cleaning & Maintenance | 129 (55.1%) | 105 (44.9%) |
| Personal Care & Service | 0 (0.0%) | 50 (100.0%) |
| Total (Category) | 267 (33.9%) | 521 (66.1%) |
| Total (Overall) | 1,915 (50.0%) | 1,913 (50.0%) |
Sales and Office Occupations
The most common Sales and Office occupations in Maysville are Sales & Related (438 | 11.4%), and Office & Administration (327 | 8.5%).

Sales and Office Occupations by Sex

| Occupation | Male | Female |
| Sales & Related | 172 (39.3%) | 266 (60.7%) |
| Office & Administration | 48 (14.7%) | 279 (85.3%) |
| Total (Category) | 220 (28.8%) | 545 (71.2%) |
| Total (Overall) | 1,915 (50.0%) | 1,913 (50.0%) |
Natural Resources, Construction and Maintenance Occupations
The most common Natural Resources, Construction and Maintenance occupations in Maysville are Construction & Extraction (178 | 4.6%), Installation, Maintenance & Repair (142 | 3.7%), and Farming, Fishing & Forestry (64 | 1.7%).
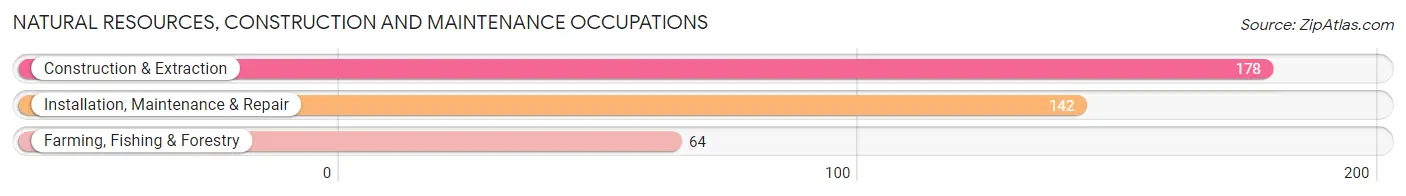
Natural Resources, Construction and Maintenance Occupations by Sex
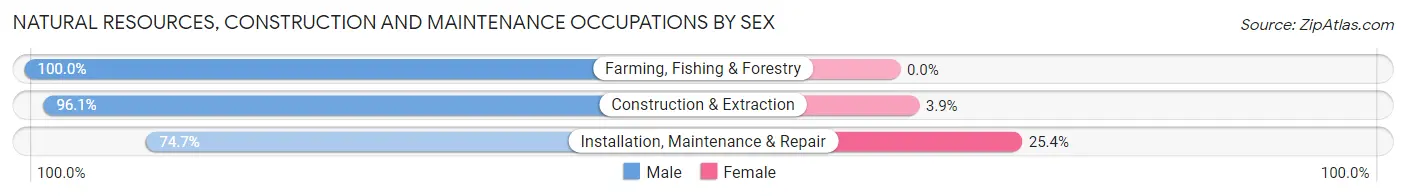
| Occupation | Male | Female |
| Farming, Fishing & Forestry | 64 (100.0%) | 0 (0.0%) |
| Construction & Extraction | 171 (96.1%) | 7 (3.9%) |
| Installation, Maintenance & Repair | 106 (74.7%) | 36 (25.4%) |
| Total (Category) | 341 (88.8%) | 43 (11.2%) |
| Total (Overall) | 1,915 (50.0%) | 1,913 (50.0%) |
Production, Transportation and Moving Occupations
The most common Production, Transportation and Moving occupations in Maysville are Production (356 | 9.3%), Transportation (201 | 5.2%), and Material Moving (140 | 3.7%).
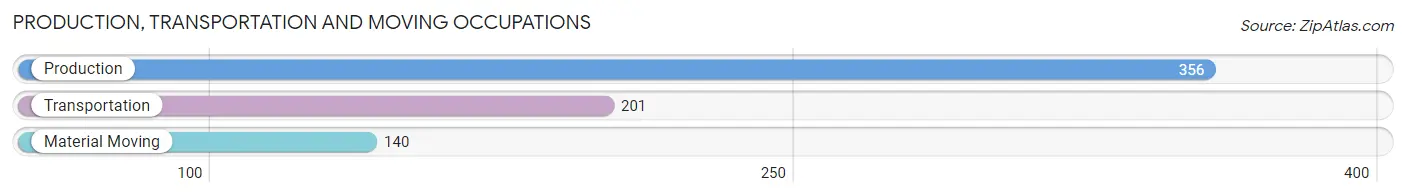
Production, Transportation and Moving Occupations by Sex
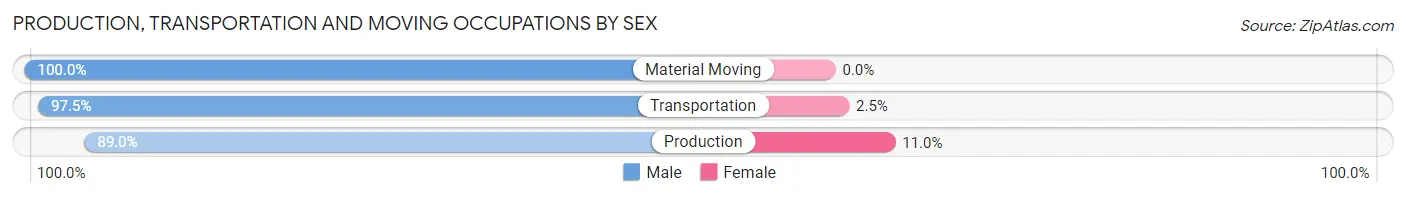
| Occupation | Male | Female |
| Production | 317 (89.0%) | 39 (11.0%) |
| Transportation | 196 (97.5%) | 5 (2.5%) |
| Material Moving | 140 (100.0%) | 0 (0.0%) |
| Total (Category) | 653 (93.7%) | 44 (6.3%) |
| Total (Overall) | 1,915 (50.0%) | 1,913 (50.0%) |
Employment Industries by Sex in Maysville
Employment Industries in Maysville
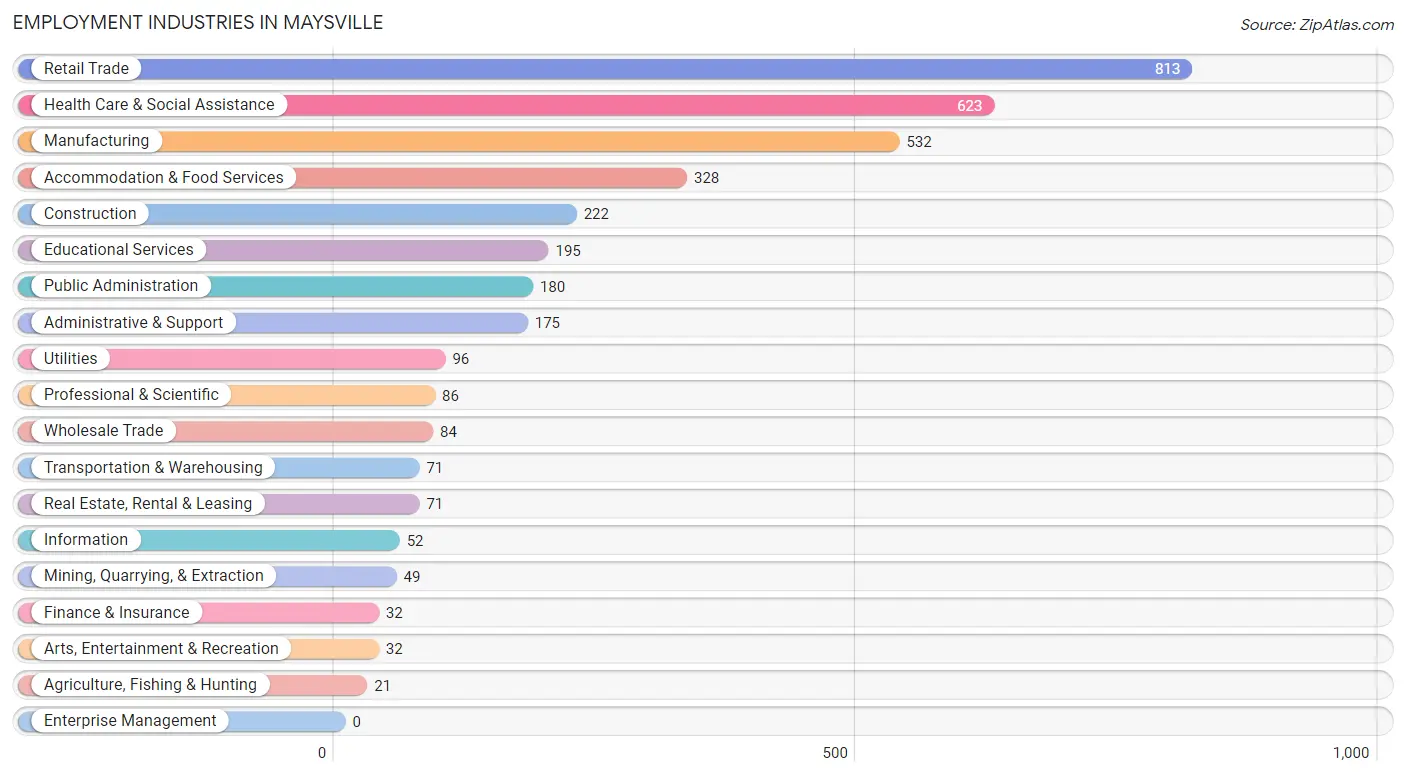
The major employment industries in Maysville include Retail Trade (813 | 21.2%), Health Care & Social Assistance (623 | 16.3%), Manufacturing (532 | 13.9%), Accommodation & Food Services (328 | 8.6%), and Construction (222 | 5.8%).
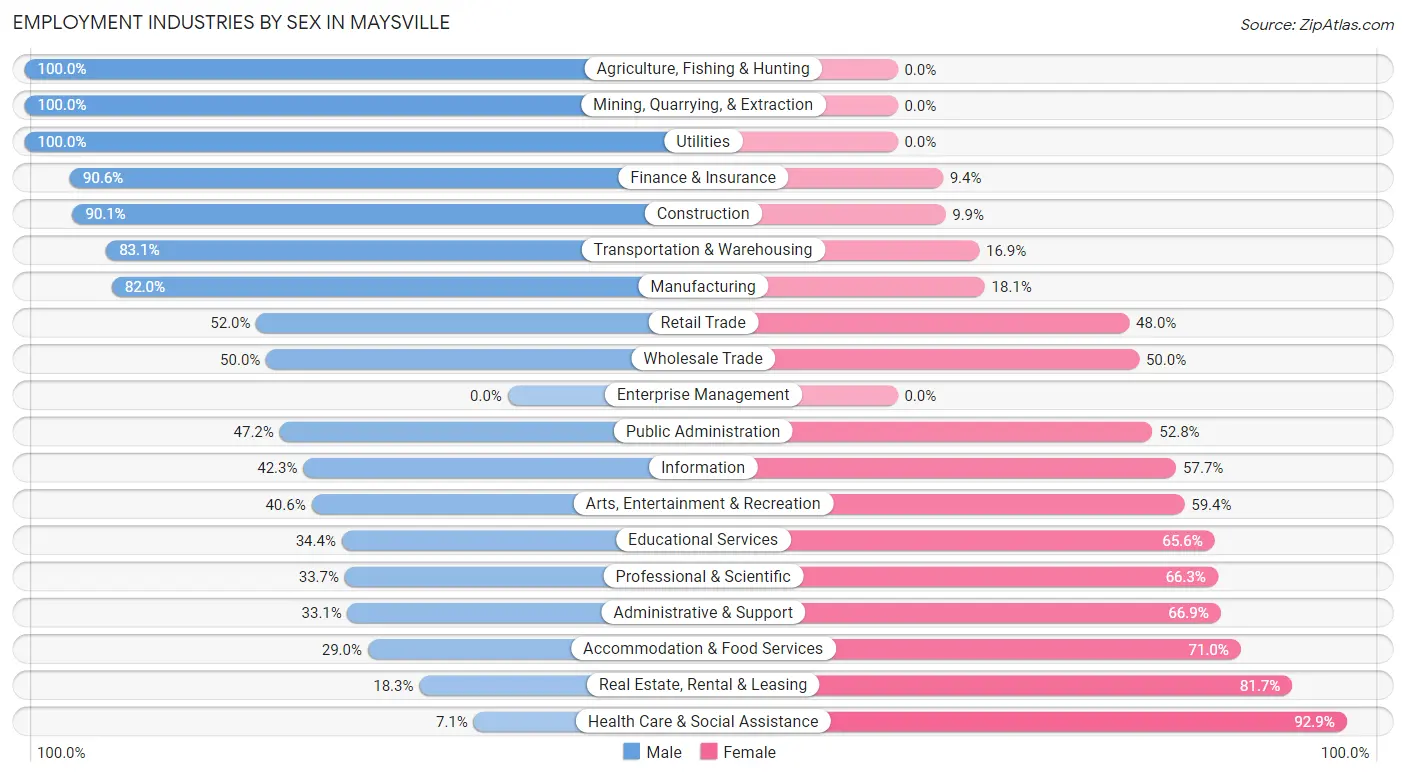
Employment Industries by Sex in Maysville
The Maysville industries that see more men than women are Agriculture, Fishing & Hunting (100.0%), Mining, Quarrying, & Extraction (100.0%), and Utilities (100.0%), whereas the industries that tend to have a higher number of women are Health Care & Social Assistance (92.9%), Real Estate, Rental & Leasing (81.7%), and Accommodation & Food Services (71.0%).
| Industry | Male | Female |
| Agriculture, Fishing & Hunting | 21 (100.0%) | 0 (0.0%) |
| Mining, Quarrying, & Extraction | 49 (100.0%) | 0 (0.0%) |
| Construction | 200 (90.1%) | 22 (9.9%) |
| Manufacturing | 436 (82.0%) | 96 (18.0%) |
| Wholesale Trade | 42 (50.0%) | 42 (50.0%) |
| Retail Trade | 423 (52.0%) | 390 (48.0%) |
| Transportation & Warehousing | 59 (83.1%) | 12 (16.9%) |
| Utilities | 96 (100.0%) | 0 (0.0%) |
| Information | 22 (42.3%) | 30 (57.7%) |
| Finance & Insurance | 29 (90.6%) | 3 (9.4%) |
| Real Estate, Rental & Leasing | 13 (18.3%) | 58 (81.7%) |
| Professional & Scientific | 29 (33.7%) | 57 (66.3%) |
| Enterprise Management | 0 (0.0%) | 0 (0.0%) |
| Administrative & Support | 58 (33.1%) | 117 (66.9%) |
| Educational Services | 67 (34.4%) | 128 (65.6%) |
| Health Care & Social Assistance | 44 (7.1%) | 579 (92.9%) |
| Arts, Entertainment & Recreation | 13 (40.6%) | 19 (59.4%) |
| Accommodation & Food Services | 95 (29.0%) | 233 (71.0%) |
| Public Administration | 85 (47.2%) | 95 (52.8%) |
| Total | 1,915 (50.0%) | 1,913 (50.0%) |
Education in Maysville
School Enrollment in Maysville
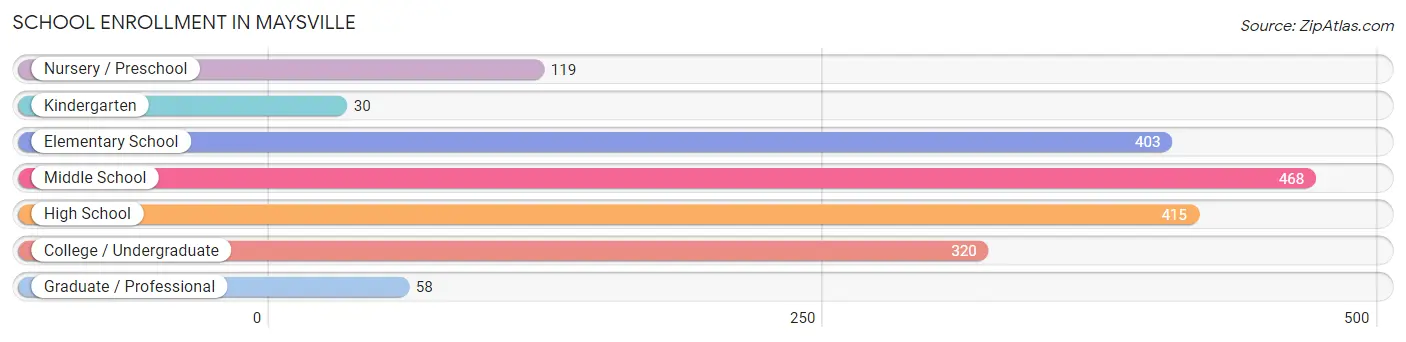
The most common levels of schooling among the 1,813 students in Maysville are middle school (468 | 25.8%), high school (415 | 22.9%), and elementary school (403 | 22.2%).
| School Level | # Students | % Students |
| Nursery / Preschool | 119 | 6.6% |
| Kindergarten | 30 | 1.7% |
| Elementary School | 403 | 22.2% |
| Middle School | 468 | 25.8% |
| High School | 415 | 22.9% |
| College / Undergraduate | 320 | 17.6% |
| Graduate / Professional | 58 | 3.2% |
| Total | 1,813 | 100.0% |
School Enrollment by Age by Funding Source in Maysville
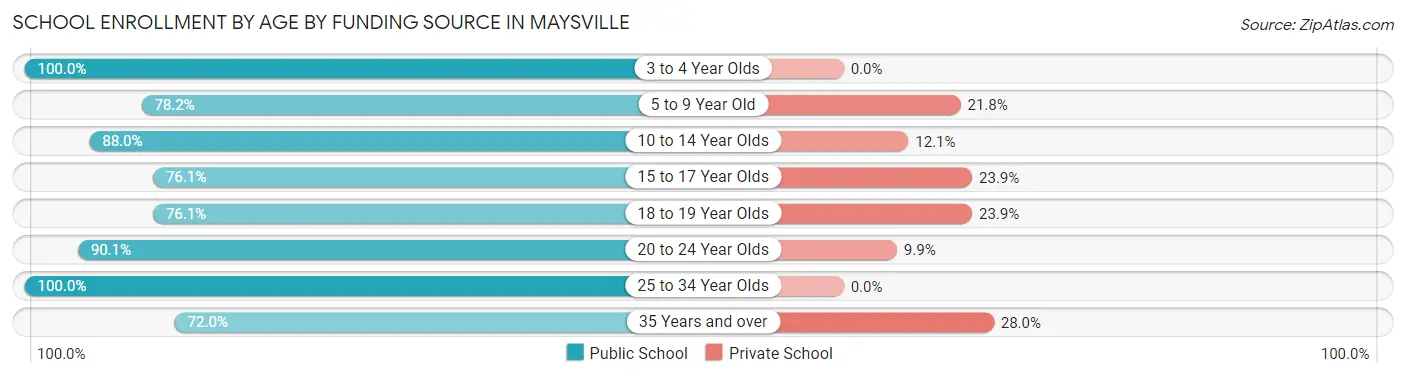
Out of a total of 1,813 students who are enrolled in schools in Maysville, 305 (16.8%) attend a private institution, while the remaining 1,508 (83.2%) are enrolled in public schools. The age group of 35 years and over has the highest likelihood of being enrolled in private schools, with 26 (28.0% in the age bracket) enrolled. Conversely, the age group of 3 to 4 year olds has the lowest likelihood of being enrolled in a private school, with 66 (100.0% in the age bracket) attending a public institution.
| Age Bracket | Public School | Private School |
| 3 to 4 Year Olds | 66 (100.0%) | 0 (0.0%) |
| 5 to 9 Year Old | 363 (78.2%) | 101 (21.8%) |
| 10 to 14 Year Olds | 438 (87.9%) | 60 (12.0%) |
| 15 to 17 Year Olds | 264 (76.1%) | 83 (23.9%) |
| 18 to 19 Year Olds | 70 (76.1%) | 22 (23.9%) |
| 20 to 24 Year Olds | 118 (90.1%) | 13 (9.9%) |
| 25 to 34 Year Olds | 122 (100.0%) | 0 (0.0%) |
| 35 Years and over | 67 (72.0%) | 26 (28.0%) |
| Total | 1,508 (83.2%) | 305 (16.8%) |
Educational Attainment by Field of Study in Maysville
Business (268 | 17.2%), education (196 | 12.6%), liberal arts & history (185 | 11.8%), bio, nature & agricultural (180 | 11.5%), and science & technology (162 | 10.4%) are the most common fields of study among 1,561 individuals in Maysville who have obtained a bachelor's degree or higher.
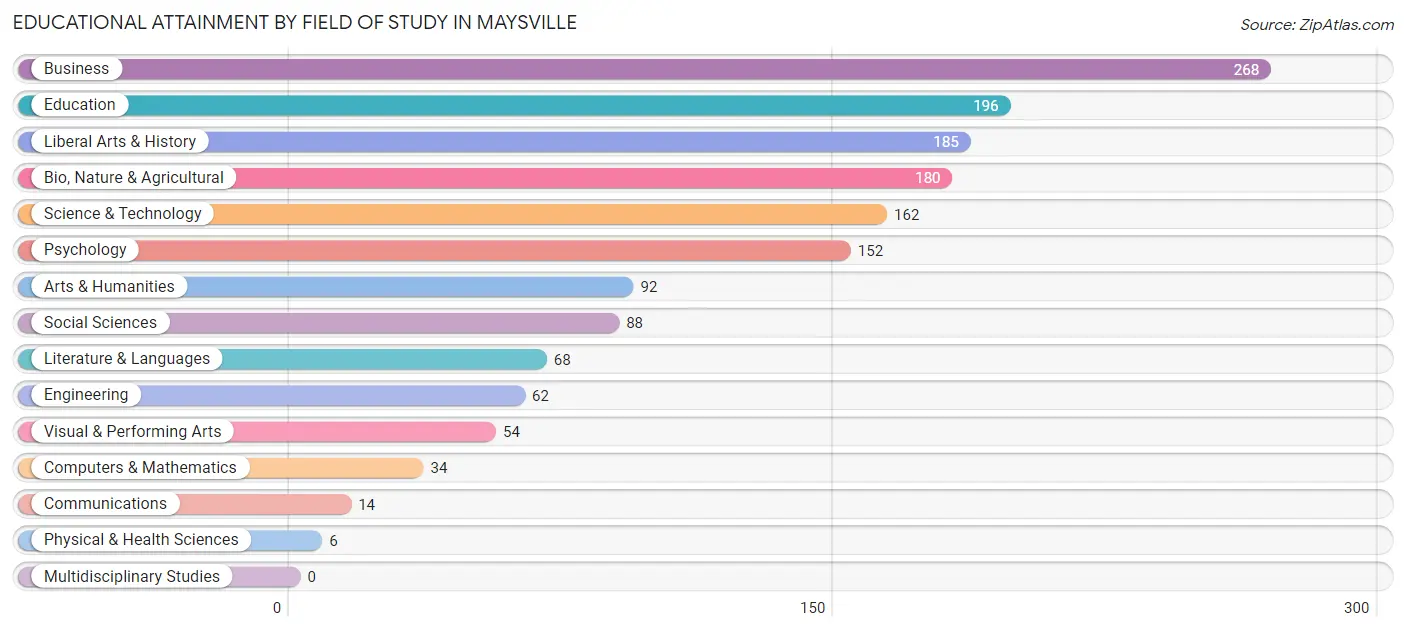
| Field of Study | # Graduates | % Graduates |
| Computers & Mathematics | 34 | 2.2% |
| Bio, Nature & Agricultural | 180 | 11.5% |
| Physical & Health Sciences | 6 | 0.4% |
| Psychology | 152 | 9.7% |
| Social Sciences | 88 | 5.6% |
| Engineering | 62 | 4.0% |
| Multidisciplinary Studies | 0 | 0.0% |
| Science & Technology | 162 | 10.4% |
| Business | 268 | 17.2% |
| Education | 196 | 12.6% |
| Literature & Languages | 68 | 4.4% |
| Liberal Arts & History | 185 | 11.8% |
| Visual & Performing Arts | 54 | 3.5% |
| Communications | 14 | 0.9% |
| Arts & Humanities | 92 | 5.9% |
| Total | 1,561 | 100.0% |
Transportation & Commute in Maysville
Vehicle Availability by Sex in Maysville
The most prevalent vehicle ownership categories in Maysville are males with 2 vehicles (546, accounting for 28.9%) and females with 2 vehicles (397, making up 28.7%).
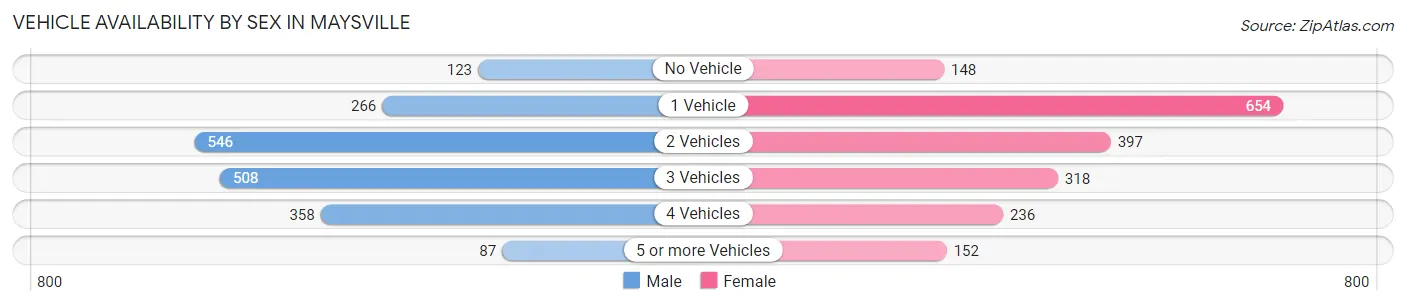
| Vehicles Available | Male | Female |
| No Vehicle | 123 (6.5%) | 148 (7.8%) |
| 1 Vehicle | 266 (14.1%) | 654 (34.3%) |
| 2 Vehicles | 546 (28.9%) | 397 (20.8%) |
| 3 Vehicles | 508 (26.9%) | 318 (16.7%) |
| 4 Vehicles | 358 (19.0%) | 236 (12.4%) |
| 5 or more Vehicles | 87 (4.6%) | 152 (8.0%) |
| Total | 1,888 (100.0%) | 1,905 (100.0%) |
Commute Time in Maysville
The most frequently occuring commute durations in Maysville are 15 to 19 minutes (730 commuters, 20.7%), 5 to 9 minutes (708 commuters, 20.1%), and 10 to 14 minutes (516 commuters, 14.6%).
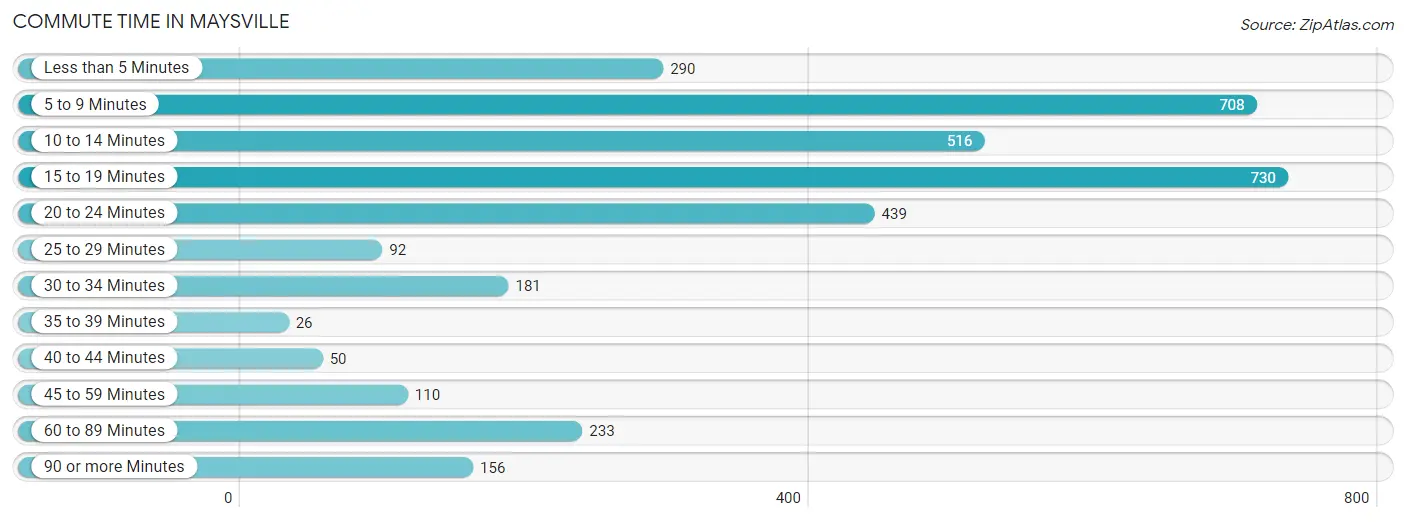
| Commute Time | # Commuters | % Commuters |
| Less than 5 Minutes | 290 | 8.2% |
| 5 to 9 Minutes | 708 | 20.1% |
| 10 to 14 Minutes | 516 | 14.6% |
| 15 to 19 Minutes | 730 | 20.7% |
| 20 to 24 Minutes | 439 | 12.4% |
| 25 to 29 Minutes | 92 | 2.6% |
| 30 to 34 Minutes | 181 | 5.1% |
| 35 to 39 Minutes | 26 | 0.7% |
| 40 to 44 Minutes | 50 | 1.4% |
| 45 to 59 Minutes | 110 | 3.1% |
| 60 to 89 Minutes | 233 | 6.6% |
| 90 or more Minutes | 156 | 4.4% |
Commute Time by Sex in Maysville
The most common commute times in Maysville are 5 to 9 minutes (435 commuters, 24.1%) for males and 15 to 19 minutes (428 commuters, 24.8%) for females.
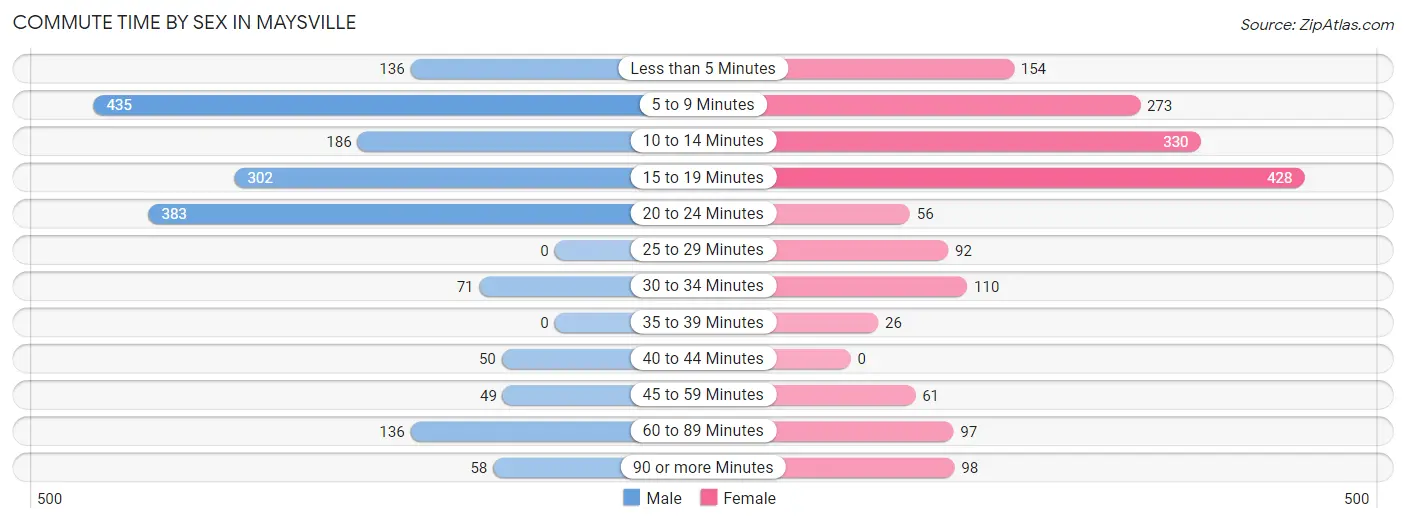
| Commute Time | Male | Female |
| Less than 5 Minutes | 136 (7.5%) | 154 (8.9%) |
| 5 to 9 Minutes | 435 (24.1%) | 273 (15.8%) |
| 10 to 14 Minutes | 186 (10.3%) | 330 (19.1%) |
| 15 to 19 Minutes | 302 (16.7%) | 428 (24.8%) |
| 20 to 24 Minutes | 383 (21.2%) | 56 (3.3%) |
| 25 to 29 Minutes | 0 (0.0%) | 92 (5.3%) |
| 30 to 34 Minutes | 71 (3.9%) | 110 (6.4%) |
| 35 to 39 Minutes | 0 (0.0%) | 26 (1.5%) |
| 40 to 44 Minutes | 50 (2.8%) | 0 (0.0%) |
| 45 to 59 Minutes | 49 (2.7%) | 61 (3.5%) |
| 60 to 89 Minutes | 136 (7.5%) | 97 (5.6%) |
| 90 or more Minutes | 58 (3.2%) | 98 (5.7%) |
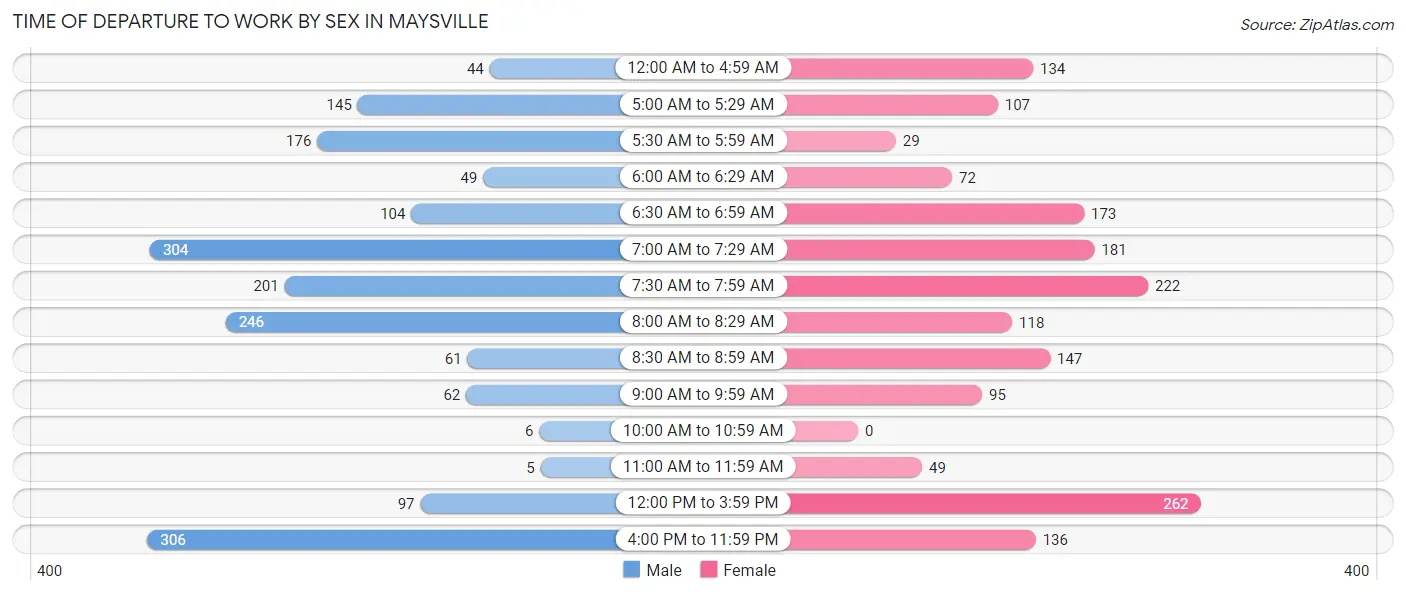
Time of Departure to Work by Sex in Maysville
The most frequent times of departure to work in Maysville are 4:00 PM to 11:59 PM (306, 16.9%) for males and 12:00 PM to 3:59 PM (262, 15.2%) for females.
| Time of Departure | Male | Female |
| 12:00 AM to 4:59 AM | 44 (2.4%) | 134 (7.8%) |
| 5:00 AM to 5:29 AM | 145 (8.0%) | 107 (6.2%) |
| 5:30 AM to 5:59 AM | 176 (9.8%) | 29 (1.7%) |
| 6:00 AM to 6:29 AM | 49 (2.7%) | 72 (4.2%) |
| 6:30 AM to 6:59 AM | 104 (5.8%) | 173 (10.0%) |
| 7:00 AM to 7:29 AM | 304 (16.8%) | 181 (10.5%) |
| 7:30 AM to 7:59 AM | 201 (11.1%) | 222 (12.9%) |
| 8:00 AM to 8:29 AM | 246 (13.6%) | 118 (6.8%) |
| 8:30 AM to 8:59 AM | 61 (3.4%) | 147 (8.5%) |
| 9:00 AM to 9:59 AM | 62 (3.4%) | 95 (5.5%) |
| 10:00 AM to 10:59 AM | 6 (0.3%) | 0 (0.0%) |
| 11:00 AM to 11:59 AM | 5 (0.3%) | 49 (2.8%) |
| 12:00 PM to 3:59 PM | 97 (5.4%) | 262 (15.2%) |
| 4:00 PM to 11:59 PM | 306 (16.9%) | 136 (7.9%) |
| Total | 1,806 (100.0%) | 1,725 (100.0%) |
Housing Occupancy in Maysville
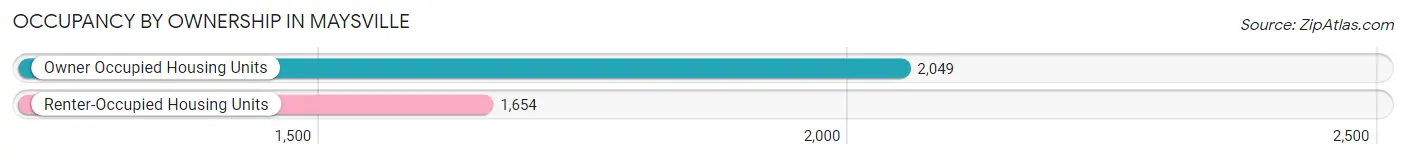
Occupancy by Ownership in Maysville
Of the total 3,703 dwellings in Maysville, owner-occupied units account for 2,049 (55.3%), while renter-occupied units make up 1,654 (44.7%).
| Occupancy | # Housing Units | % Housing Units |
| Owner Occupied Housing Units | 2,049 | 55.3% |
| Renter-Occupied Housing Units | 1,654 | 44.7% |
| Total Occupied Housing Units | 3,703 | 100.0% |
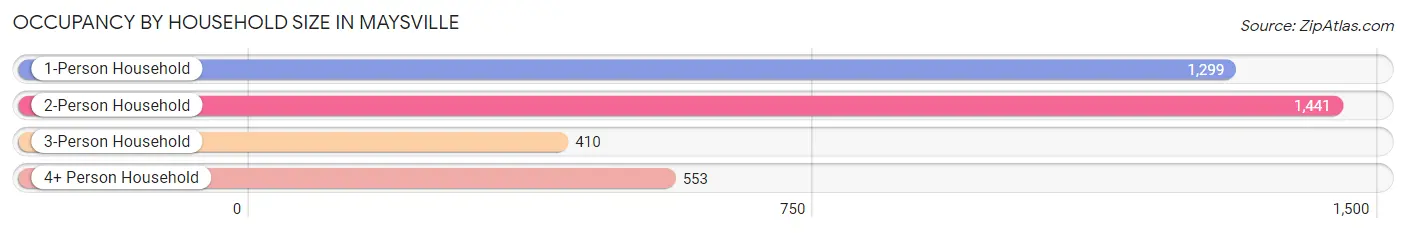
Occupancy by Household Size in Maysville
| Household Size | # Housing Units | % Housing Units |
| 1-Person Household | 1,299 | 35.1% |
| 2-Person Household | 1,441 | 38.9% |
| 3-Person Household | 410 | 11.1% |
| 4+ Person Household | 553 | 14.9% |
| Total Housing Units | 3,703 | 100.0% |
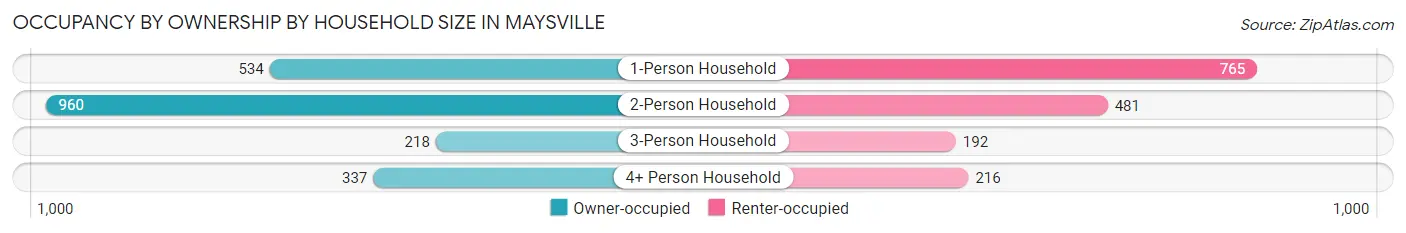
Occupancy by Ownership by Household Size in Maysville
| Household Size | Owner-occupied | Renter-occupied |
| 1-Person Household | 534 (41.1%) | 765 (58.9%) |
| 2-Person Household | 960 (66.6%) | 481 (33.4%) |
| 3-Person Household | 218 (53.2%) | 192 (46.8%) |
| 4+ Person Household | 337 (60.9%) | 216 (39.1%) |
| Total Housing Units | 2,049 (55.3%) | 1,654 (44.7%) |
Occupancy by Educational Attainment in Maysville
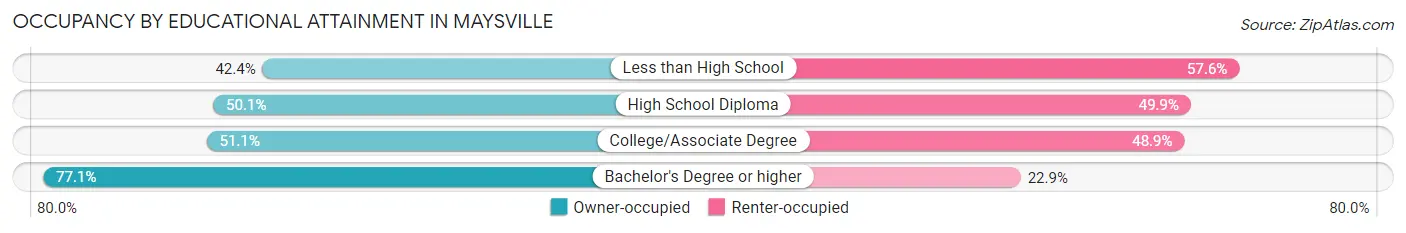
| Household Size | Owner-occupied | Renter-occupied |
| Less than High School | 199 (42.4%) | 270 (57.6%) |
| High School Diploma | 517 (50.1%) | 515 (49.9%) |
| College/Associate Degree | 718 (51.1%) | 686 (48.9%) |
| Bachelor's Degree or higher | 615 (77.1%) | 183 (22.9%) |
Occupancy by Age of Householder in Maysville
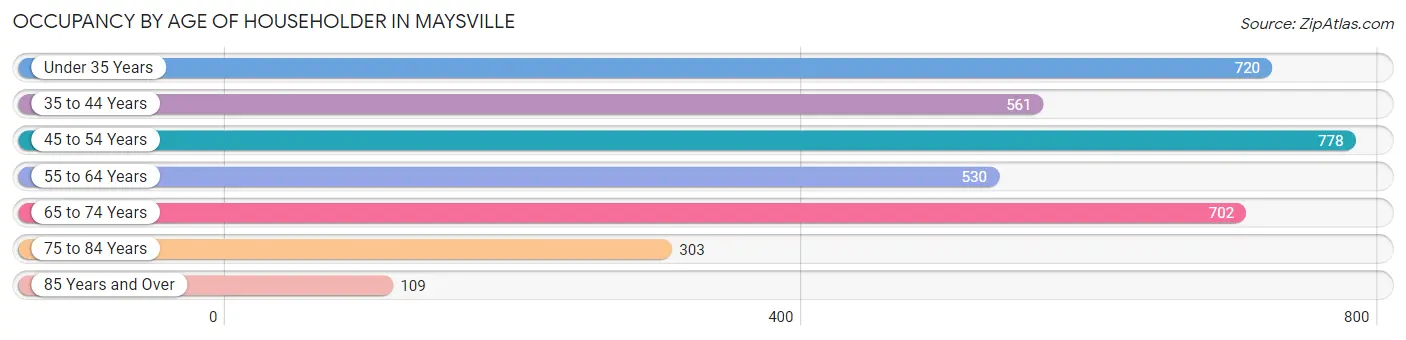
| Age Bracket | # Households | % Households |
| Under 35 Years | 720 | 19.4% |
| 35 to 44 Years | 561 | 15.1% |
| 45 to 54 Years | 778 | 21.0% |
| 55 to 64 Years | 530 | 14.3% |
| 65 to 74 Years | 702 | 19.0% |
| 75 to 84 Years | 303 | 8.2% |
| 85 Years and Over | 109 | 2.9% |
| Total | 3,703 | 100.0% |
Housing Finances in Maysville
Median Income by Occupancy in Maysville
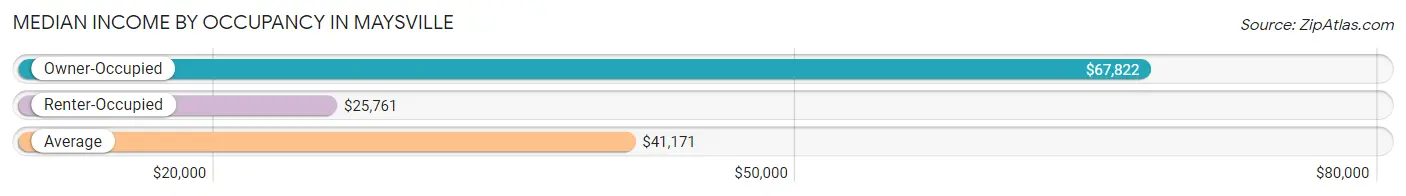
| Occupancy Type | # Households | Median Income |
| Owner-Occupied | 2,049 (55.3%) | $67,822 |
| Renter-Occupied | 1,654 (44.7%) | $25,761 |
| Average | 3,703 (100.0%) | $41,171 |
Occupancy by Householder Income Bracket in Maysville
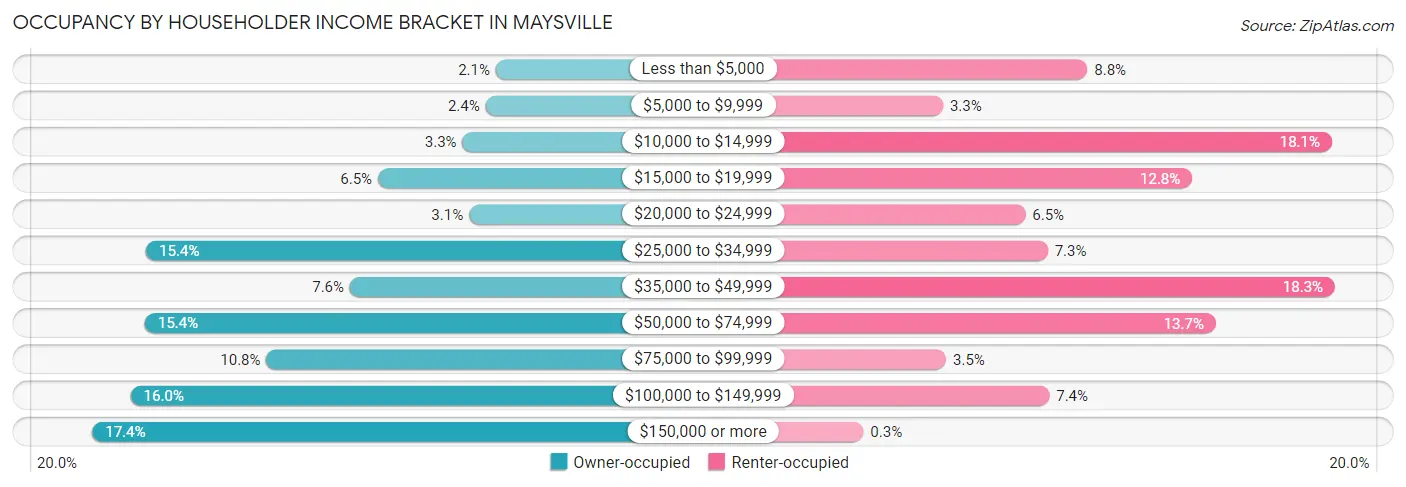
| Income Bracket | Owner-occupied | Renter-occupied |
| Less than $5,000 | 42 (2.1%) | 146 (8.8%) |
| $5,000 to $9,999 | 50 (2.4%) | 55 (3.3%) |
| $10,000 to $14,999 | 68 (3.3%) | 300 (18.1%) |
| $15,000 to $19,999 | 134 (6.5%) | 212 (12.8%) |
| $20,000 to $24,999 | 63 (3.1%) | 107 (6.5%) |
| $25,000 to $34,999 | 315 (15.4%) | 121 (7.3%) |
| $35,000 to $49,999 | 156 (7.6%) | 302 (18.3%) |
| $50,000 to $74,999 | 316 (15.4%) | 227 (13.7%) |
| $75,000 to $99,999 | 221 (10.8%) | 57 (3.5%) |
| $100,000 to $149,999 | 327 (16.0%) | 122 (7.4%) |
| $150,000 or more | 357 (17.4%) | 5 (0.3%) |
| Total | 2,049 (100.0%) | 1,654 (100.0%) |
Monthly Housing Cost Tiers in Maysville
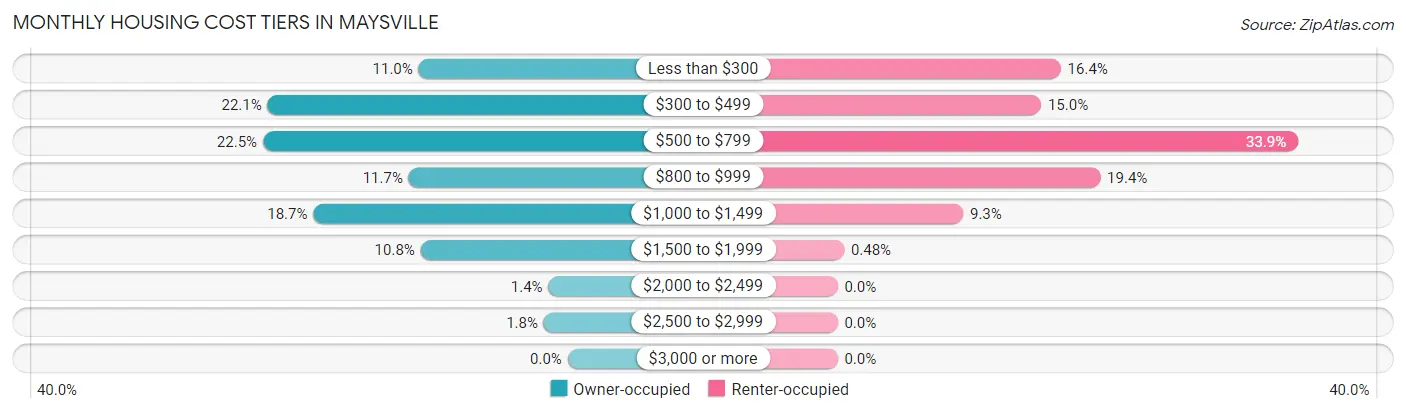
| Monthly Cost | Owner-occupied | Renter-occupied |
| Less than $300 | 225 (11.0%) | 272 (16.4%) |
| $300 to $499 | 453 (22.1%) | 248 (15.0%) |
| $500 to $799 | 460 (22.5%) | 561 (33.9%) |
| $800 to $999 | 240 (11.7%) | 320 (19.4%) |
| $1,000 to $1,499 | 384 (18.7%) | 153 (9.2%) |
| $1,500 to $1,999 | 222 (10.8%) | 8 (0.5%) |
| $2,000 to $2,499 | 29 (1.4%) | 0 (0.0%) |
| $2,500 to $2,999 | 36 (1.8%) | 0 (0.0%) |
| $3,000 or more | 0 (0.0%) | 0 (0.0%) |
| Total | 2,049 (100.0%) | 1,654 (100.0%) |
Physical Housing Characteristics in Maysville
Housing Structures in Maysville
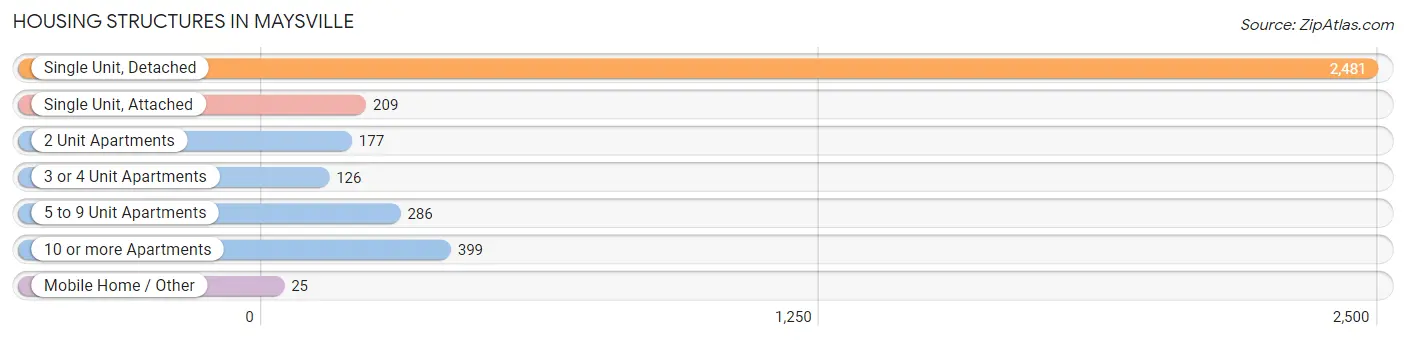
| Structure Type | # Housing Units | % Housing Units |
| Single Unit, Detached | 2,481 | 67.0% |
| Single Unit, Attached | 209 | 5.6% |
| 2 Unit Apartments | 177 | 4.8% |
| 3 or 4 Unit Apartments | 126 | 3.4% |
| 5 to 9 Unit Apartments | 286 | 7.7% |
| 10 or more Apartments | 399 | 10.8% |
| Mobile Home / Other | 25 | 0.7% |
| Total | 3,703 | 100.0% |
Housing Structures by Occupancy in Maysville
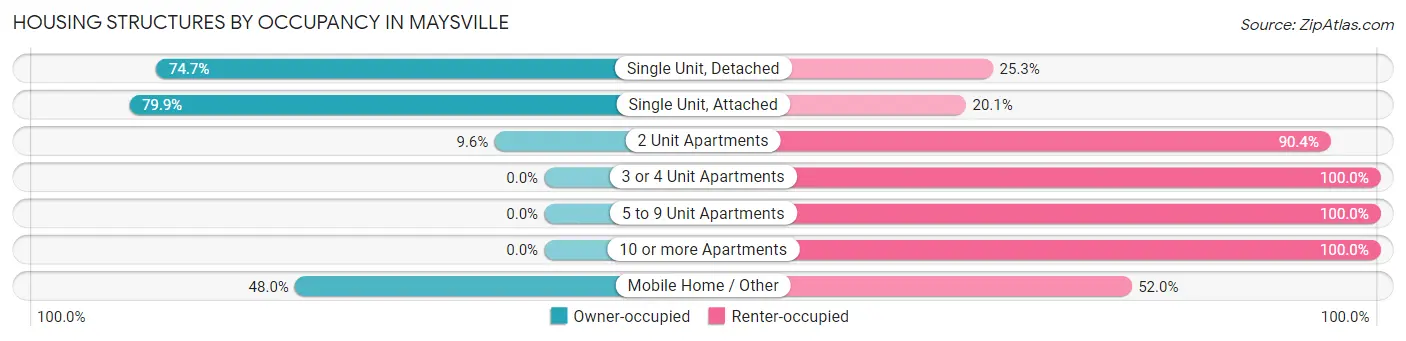
| Structure Type | Owner-occupied | Renter-occupied |
| Single Unit, Detached | 1,853 (74.7%) | 628 (25.3%) |
| Single Unit, Attached | 167 (79.9%) | 42 (20.1%) |
| 2 Unit Apartments | 17 (9.6%) | 160 (90.4%) |
| 3 or 4 Unit Apartments | 0 (0.0%) | 126 (100.0%) |
| 5 to 9 Unit Apartments | 0 (0.0%) | 286 (100.0%) |
| 10 or more Apartments | 0 (0.0%) | 399 (100.0%) |
| Mobile Home / Other | 12 (48.0%) | 13 (52.0%) |
| Total | 2,049 (55.3%) | 1,654 (44.7%) |
Housing Structures by Number of Rooms in Maysville
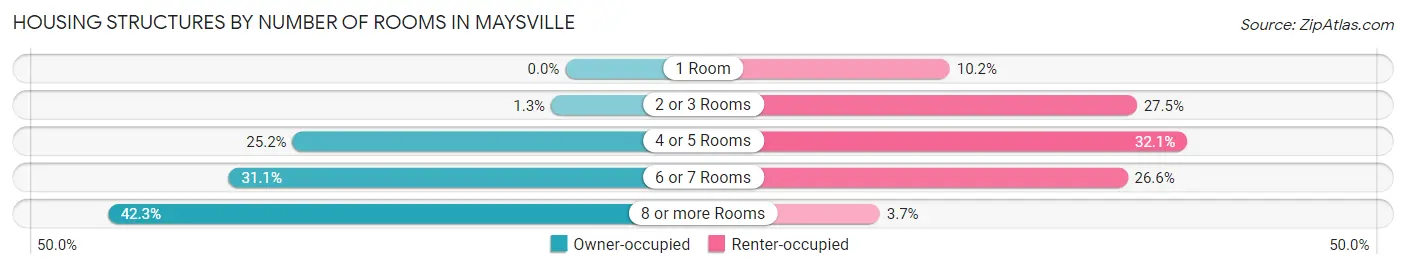
| Number of Rooms | Owner-occupied | Renter-occupied |
| 1 Room | 0 (0.0%) | 168 (10.2%) |
| 2 or 3 Rooms | 27 (1.3%) | 454 (27.5%) |
| 4 or 5 Rooms | 517 (25.2%) | 531 (32.1%) |
| 6 or 7 Rooms | 638 (31.1%) | 440 (26.6%) |
| 8 or more Rooms | 867 (42.3%) | 61 (3.7%) |
| Total | 2,049 (100.0%) | 1,654 (100.0%) |
Housing Structure by Heating Type in Maysville
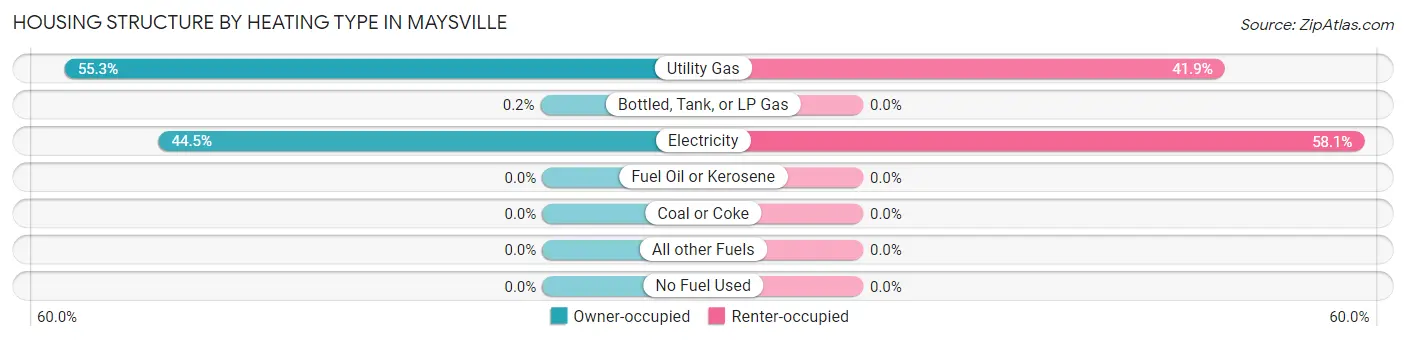
| Heating Type | Owner-occupied | Renter-occupied |
| Utility Gas | 1,134 (55.3%) | 693 (41.9%) |
| Bottled, Tank, or LP Gas | 4 (0.2%) | 0 (0.0%) |
| Electricity | 911 (44.5%) | 961 (58.1%) |
| Fuel Oil or Kerosene | 0 (0.0%) | 0 (0.0%) |
| Coal or Coke | 0 (0.0%) | 0 (0.0%) |
| All other Fuels | 0 (0.0%) | 0 (0.0%) |
| No Fuel Used | 0 (0.0%) | 0 (0.0%) |
| Total | 2,049 (100.0%) | 1,654 (100.0%) |
Household Vehicle Usage in Maysville
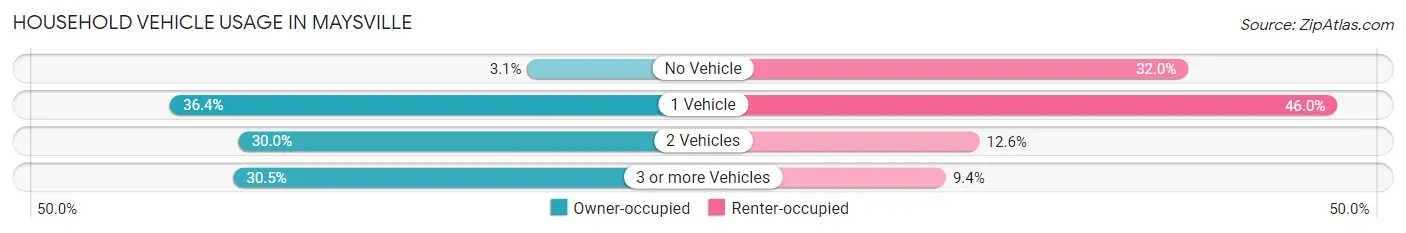
| Vehicles per Household | Owner-occupied | Renter-occupied |
| No Vehicle | 63 (3.1%) | 530 (32.0%) |
| 1 Vehicle | 746 (36.4%) | 760 (46.0%) |
| 2 Vehicles | 615 (30.0%) | 208 (12.6%) |
| 3 or more Vehicles | 625 (30.5%) | 156 (9.4%) |
| Total | 2,049 (100.0%) | 1,654 (100.0%) |
Real Estate & Mortgages in Maysville
Real Estate and Mortgage Overview in Maysville
| Characteristic | Without Mortgage | With Mortgage |
| Housing Units | 1,125 | 924 |
| Median Property Value | $137,400 | $155,200 |
| Median Household Income | $48,835 | $214 |
| Monthly Housing Costs | $458 | $0 |
| Real Estate Taxes | $1,126 | $39 |
Property Value by Mortgage Status in Maysville
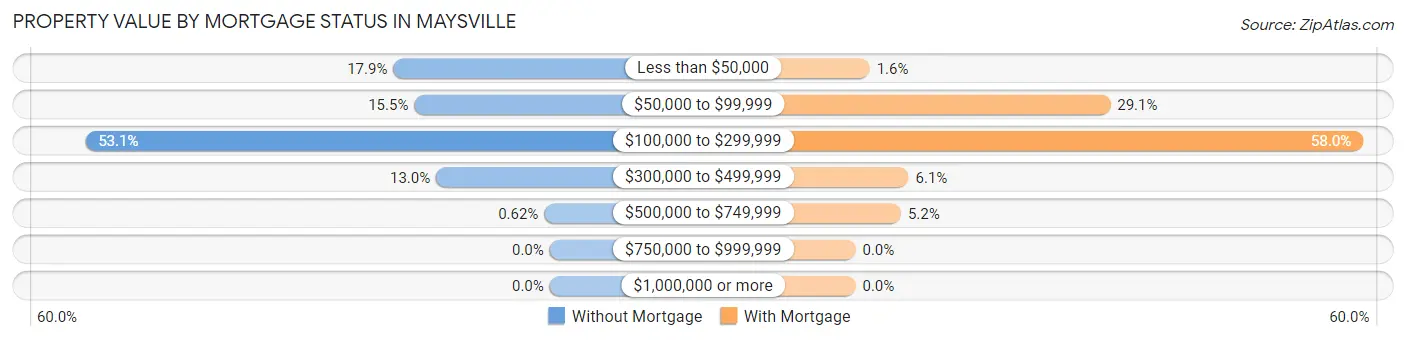
| Property Value | Without Mortgage | With Mortgage |
| Less than $50,000 | 201 (17.9%) | 15 (1.6%) |
| $50,000 to $99,999 | 174 (15.5%) | 269 (29.1%) |
| $100,000 to $299,999 | 597 (53.1%) | 536 (58.0%) |
| $300,000 to $499,999 | 146 (13.0%) | 56 (6.1%) |
| $500,000 to $749,999 | 7 (0.6%) | 48 (5.2%) |
| $750,000 to $999,999 | 0 (0.0%) | 0 (0.0%) |
| $1,000,000 or more | 0 (0.0%) | 0 (0.0%) |
| Total | 1,125 (100.0%) | 924 (100.0%) |
Household Income by Mortgage Status in Maysville
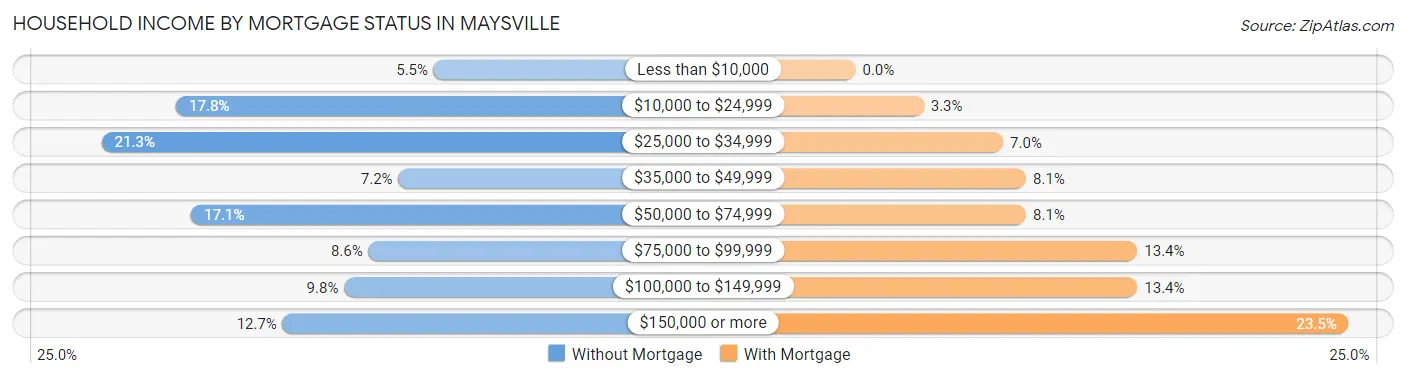
| Household Income | Without Mortgage | With Mortgage |
| Less than $10,000 | 62 (5.5%) | 0 (0.0%) |
| $10,000 to $24,999 | 200 (17.8%) | 30 (3.3%) |
| $25,000 to $34,999 | 240 (21.3%) | 65 (7.0%) |
| $35,000 to $49,999 | 81 (7.2%) | 75 (8.1%) |
| $50,000 to $74,999 | 192 (17.1%) | 75 (8.1%) |
| $75,000 to $99,999 | 97 (8.6%) | 124 (13.4%) |
| $100,000 to $149,999 | 110 (9.8%) | 124 (13.4%) |
| $150,000 or more | 143 (12.7%) | 217 (23.5%) |
| Total | 1,125 (100.0%) | 924 (100.0%) |
Property Value to Household Income Ratio in Maysville
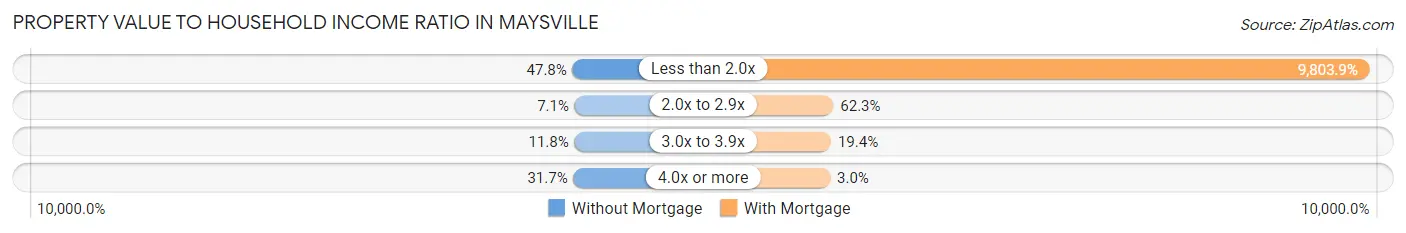
| Value-to-Income Ratio | Without Mortgage | With Mortgage |
| Less than 2.0x | 538 (47.8%) | 90,588 (9,803.9%) |
| 2.0x to 2.9x | 80 (7.1%) | 576 (62.3%) |
| 3.0x to 3.9x | 133 (11.8%) | 179 (19.4%) |
| 4.0x or more | 357 (31.7%) | 28 (3.0%) |
| Total | 1,125 (100.0%) | 924 (100.0%) |
Real Estate Taxes by Mortgage Status in Maysville
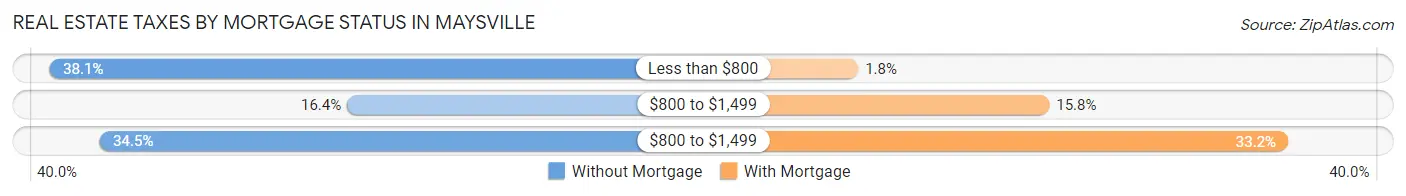
| Property Taxes | Without Mortgage | With Mortgage |
| Less than $800 | 429 (38.1%) | 17 (1.8%) |
| $800 to $1,499 | 185 (16.4%) | 146 (15.8%) |
| $800 to $1,499 | 388 (34.5%) | 307 (33.2%) |
| Total | 1,125 (100.0%) | 924 (100.0%) |
Health & Disability in Maysville
Health Insurance Coverage by Age in Maysville
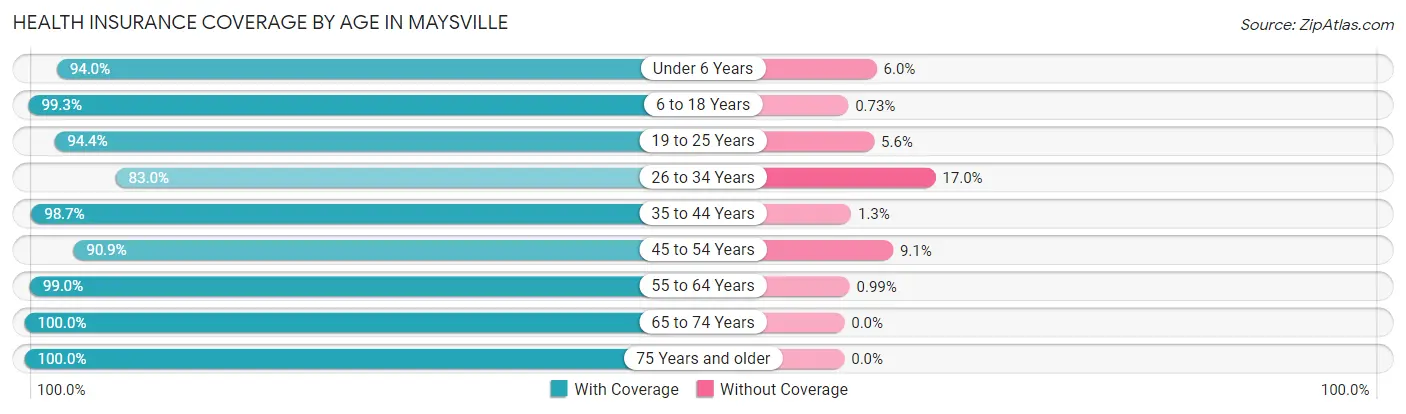
| Age Bracket | With Coverage | Without Coverage |
| Under 6 Years | 546 (94.0%) | 35 (6.0%) |
| 6 to 18 Years | 1,353 (99.3%) | 10 (0.7%) |
| 19 to 25 Years | 628 (94.4%) | 37 (5.6%) |
| 26 to 34 Years | 728 (83.0%) | 149 (17.0%) |
| 35 to 44 Years | 1,094 (98.7%) | 14 (1.3%) |
| 45 to 54 Years | 1,021 (90.9%) | 102 (9.1%) |
| 55 to 64 Years | 1,103 (99.0%) | 11 (1.0%) |
| 65 to 74 Years | 1,111 (100.0%) | 0 (0.0%) |
| 75 Years and older | 624 (100.0%) | 0 (0.0%) |
| Total | 8,208 (95.8%) | 358 (4.2%) |
Health Insurance Coverage by Citizenship Status in Maysville
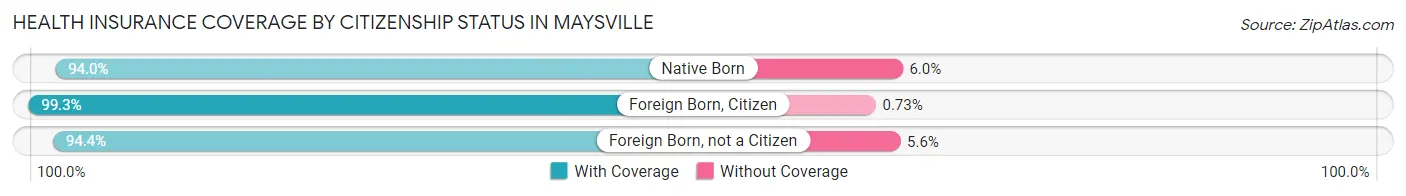
| Citizenship Status | With Coverage | Without Coverage |
| Native Born | 546 (94.0%) | 35 (6.0%) |
| Foreign Born, Citizen | 1,353 (99.3%) | 10 (0.7%) |
| Foreign Born, not a Citizen | 628 (94.4%) | 37 (5.6%) |
Health Insurance Coverage by Household Income in Maysville
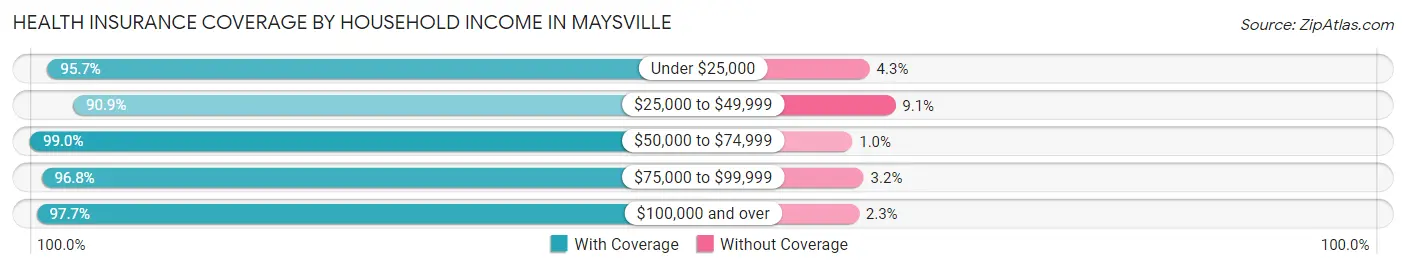
| Household Income | With Coverage | Without Coverage |
| Under $25,000 | 2,012 (95.7%) | 90 (4.3%) |
| $25,000 to $49,999 | 1,749 (90.9%) | 175 (9.1%) |
| $50,000 to $74,999 | 1,253 (99.0%) | 13 (1.0%) |
| $75,000 to $99,999 | 644 (96.8%) | 21 (3.2%) |
| $100,000 and over | 2,550 (97.7%) | 59 (2.3%) |
Public vs Private Health Insurance Coverage by Age in Maysville
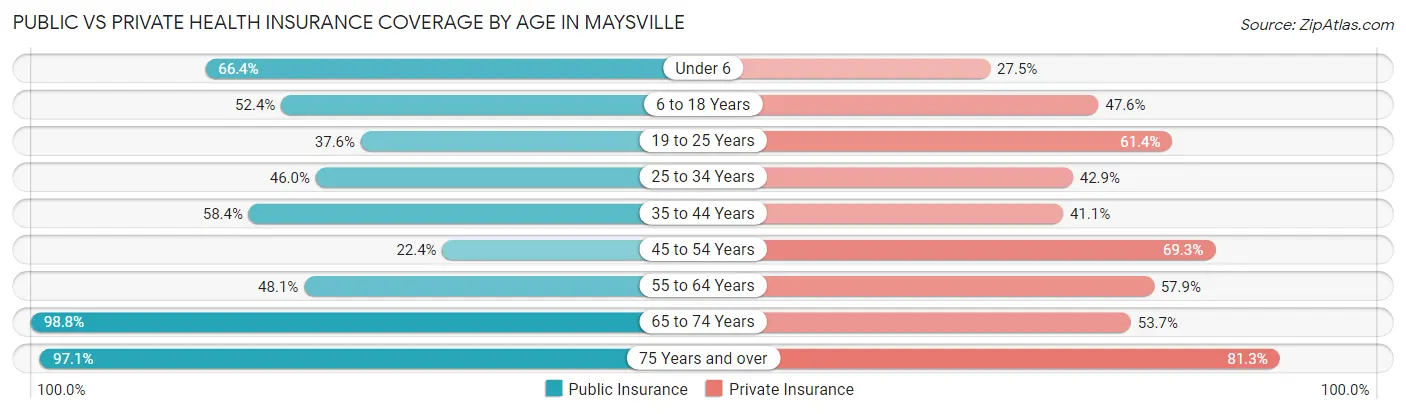
| Age Bracket | Public Insurance | Private Insurance |
| Under 6 | 386 (66.4%) | 160 (27.5%) |
| 6 to 18 Years | 714 (52.4%) | 649 (47.6%) |
| 19 to 25 Years | 250 (37.6%) | 408 (61.4%) |
| 25 to 34 Years | 403 (46.0%) | 376 (42.9%) |
| 35 to 44 Years | 647 (58.4%) | 455 (41.1%) |
| 45 to 54 Years | 252 (22.4%) | 778 (69.3%) |
| 55 to 64 Years | 536 (48.1%) | 645 (57.9%) |
| 65 to 74 Years | 1,098 (98.8%) | 596 (53.6%) |
| 75 Years and over | 606 (97.1%) | 507 (81.2%) |
| Total | 4,892 (57.1%) | 4,574 (53.4%) |
Disability Status by Sex by Age in Maysville
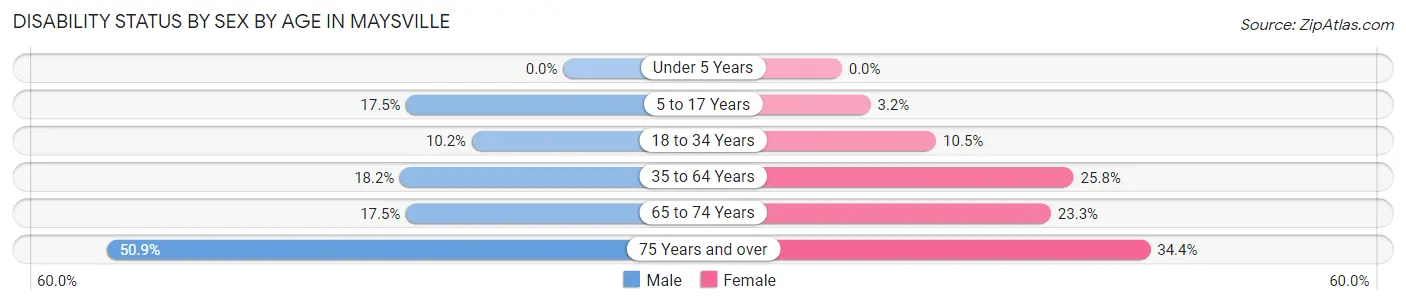
| Age Bracket | Male | Female |
| Under 5 Years | 0 (0.0%) | 0 (0.0%) |
| 5 to 17 Years | 133 (17.5%) | 19 (3.2%) |
| 18 to 34 Years | 75 (10.2%) | 93 (10.5%) |
| 35 to 64 Years | 296 (18.2%) | 443 (25.8%) |
| 65 to 74 Years | 105 (17.5%) | 119 (23.3%) |
| 75 Years and over | 119 (50.8%) | 134 (34.4%) |
Disability Class by Sex by Age in Maysville
Disability Class: Hearing Difficulty
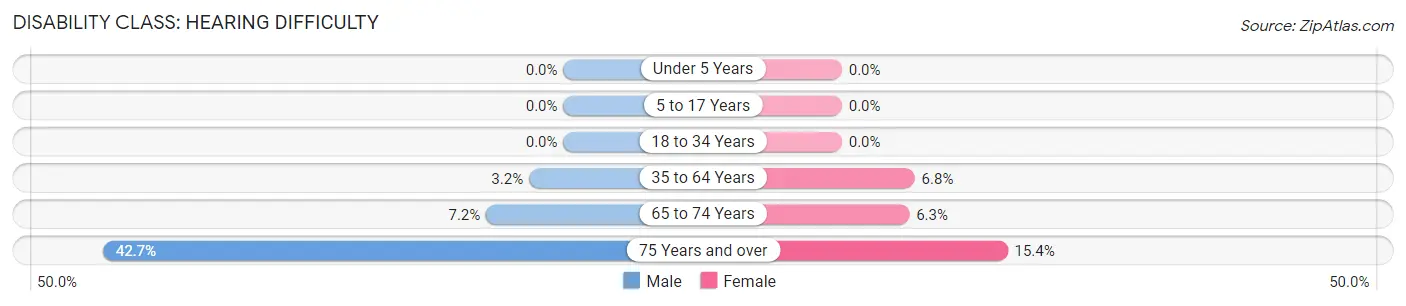
| Age Bracket | Male | Female |
| Under 5 Years | 0 (0.0%) | 0 (0.0%) |
| 5 to 17 Years | 0 (0.0%) | 0 (0.0%) |
| 18 to 34 Years | 0 (0.0%) | 0 (0.0%) |
| 35 to 64 Years | 52 (3.2%) | 116 (6.8%) |
| 65 to 74 Years | 43 (7.2%) | 32 (6.3%) |
| 75 Years and over | 100 (42.7%) | 60 (15.4%) |
Disability Class: Vision Difficulty
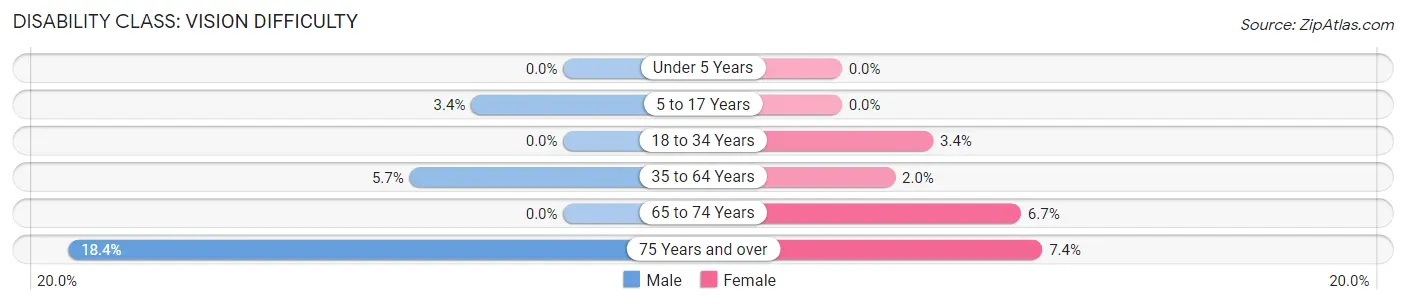
| Age Bracket | Male | Female |
| Under 5 Years | 0 (0.0%) | 0 (0.0%) |
| 5 to 17 Years | 26 (3.4%) | 0 (0.0%) |
| 18 to 34 Years | 0 (0.0%) | 30 (3.4%) |
| 35 to 64 Years | 93 (5.7%) | 34 (2.0%) |
| 65 to 74 Years | 0 (0.0%) | 34 (6.7%) |
| 75 Years and over | 43 (18.4%) | 29 (7.4%) |
Disability Class: Cognitive Difficulty
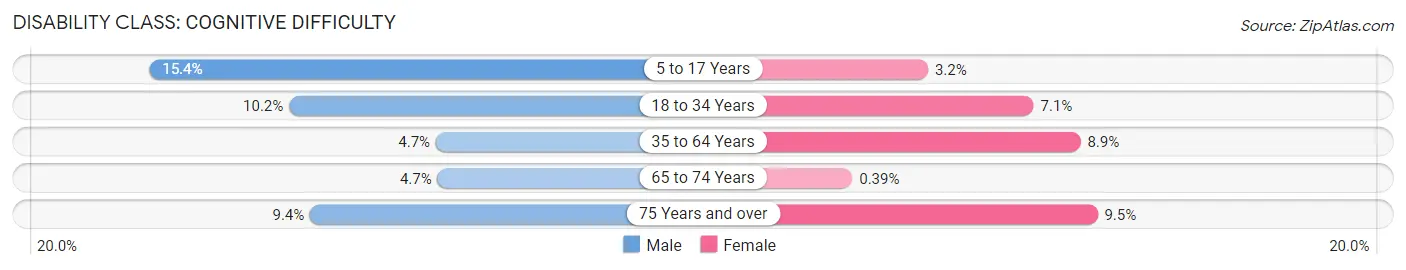
| Age Bracket | Male | Female |
| 5 to 17 Years | 117 (15.4%) | 19 (3.2%) |
| 18 to 34 Years | 75 (10.2%) | 63 (7.1%) |
| 35 to 64 Years | 77 (4.7%) | 152 (8.9%) |
| 65 to 74 Years | 28 (4.7%) | 2 (0.4%) |
| 75 Years and over | 22 (9.4%) | 37 (9.5%) |
Disability Class: Ambulatory Difficulty
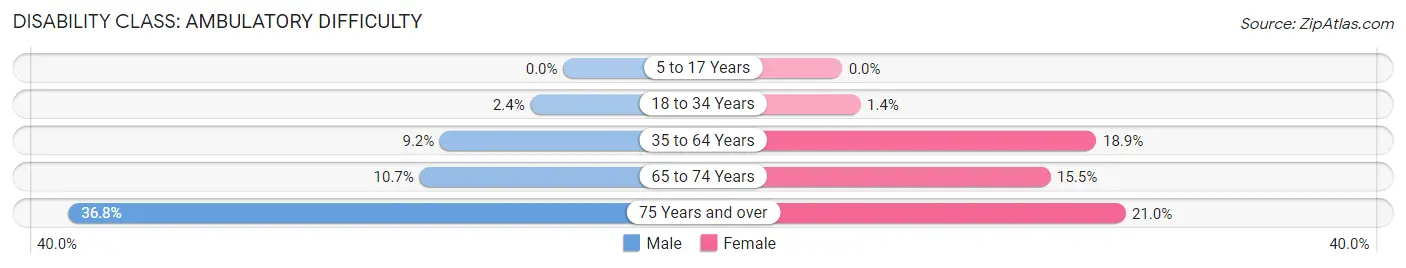
| Age Bracket | Male | Female |
| 5 to 17 Years | 0 (0.0%) | 0 (0.0%) |
| 18 to 34 Years | 18 (2.4%) | 12 (1.4%) |
| 35 to 64 Years | 149 (9.1%) | 324 (18.9%) |
| 65 to 74 Years | 64 (10.7%) | 79 (15.5%) |
| 75 Years and over | 86 (36.7%) | 82 (21.0%) |
Disability Class: Self-Care Difficulty
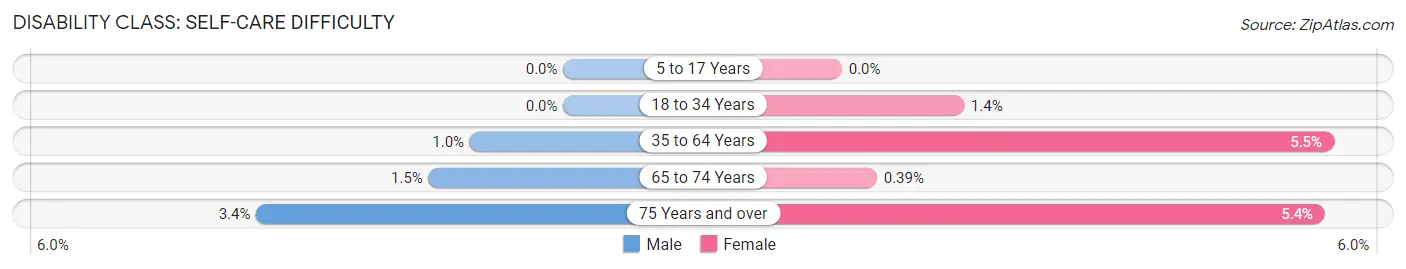
| Age Bracket | Male | Female |
| 5 to 17 Years | 0 (0.0%) | 0 (0.0%) |
| 18 to 34 Years | 0 (0.0%) | 12 (1.4%) |
| 35 to 64 Years | 17 (1.0%) | 94 (5.5%) |
| 65 to 74 Years | 9 (1.5%) | 2 (0.4%) |
| 75 Years and over | 8 (3.4%) | 21 (5.4%) |
Technology Access in Maysville
Computing Device Access in Maysville
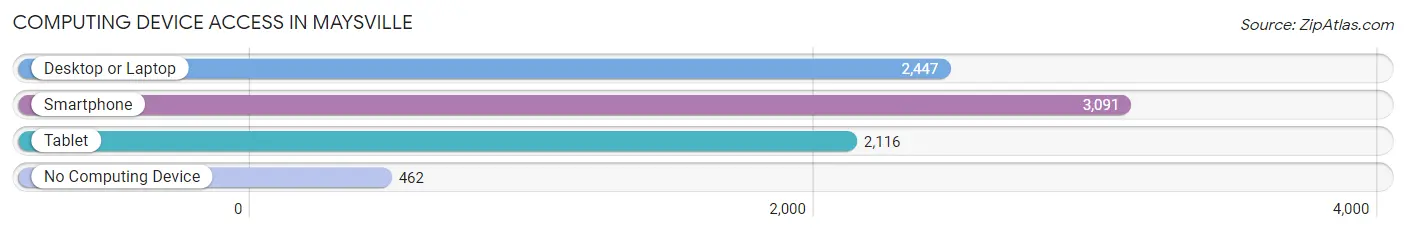
| Device Type | # Households | % Households |
| Desktop or Laptop | 2,447 | 66.1% |
| Smartphone | 3,091 | 83.5% |
| Tablet | 2,116 | 57.1% |
| No Computing Device | 462 | 12.5% |
| Total | 3,703 | 100.0% |
Internet Access in Maysville
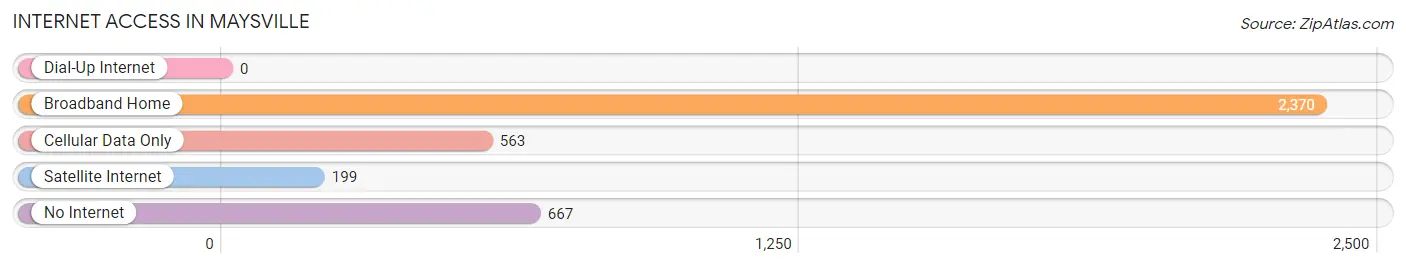
| Internet Type | # Households | % Households |
| Dial-Up Internet | 0 | 0.0% |
| Broadband Home | 2,370 | 64.0% |
| Cellular Data Only | 563 | 15.2% |
| Satellite Internet | 199 | 5.4% |
| No Internet | 667 | 18.0% |
| Total | 3,703 | 100.0% |
Maysville Summary
Maysville is a city located in Mason County, Kentucky, United States. It is the county seat of Mason County and the principal city of the Maysville Micropolitan Statistical Area, which includes Mason and Lewis counties. As of the 2010 census, the city had a population of 9,011.
History
Maysville was founded in 1784 by John May, a Revolutionary War veteran, and was originally known as Limestone. The town was renamed in honor of May in 1787. It was incorporated as a city in 1834.
Maysville was an important gateway city for much of the 19th century, as it was located at the northern terminus of the Kentucky and Ohio River Railroad. This allowed goods produced in the interior of Kentucky to be shipped to the Ohio River for transport to markets in the east. It was the site of the first bridge built across the Ohio River, connecting the city to Aberdeen, Ohio. The bridge was completed in 1856 and still stands today.
Geography
Maysville is located in northeastern Kentucky at the confluence of the Ohio and Licking Rivers. It is situated at the northern terminus of the Kentucky and Ohio River Railroad, which connects the city to Cincinnati, Ohio. The city has a total area of 5.3 square miles, of which 5.2 square miles is land and 0.1 square miles is water.
Climate
Maysville has a humid subtropical climate, with hot, humid summers and cold, wet winters. The average annual temperature is 57°F, with an average high of 73°F in July and an average low of 41°F in January. The average annual precipitation is 45 inches.
Demographics
As of the 2010 census, there were 9,011 people, 3,845 households, and 2,323 families residing in the city. The population density was 1,717.3 people per square mile. The racial makeup of the city was 92.2% White, 5.2% African American, 0.3% Native American, 0.5% Asian, 0.1% Pacific Islander, 0.5% from other races, and 1.2% from two or more races. Hispanic or Latino of any race were 1.3% of the population.
Economy
Maysville's economy is largely based on manufacturing and tourism. The city is home to several manufacturing companies, including a large paper mill and a furniture factory. The city is also a popular tourist destination, with several historic sites, museums, and other attractions. The city is also home to a large number of antique shops and art galleries.
Maysville is also home to a number of educational institutions, including Maysville Community and Technical College, which offers a variety of degree and certificate programs. The city is also home to a number of healthcare facilities, including a hospital and several clinics.
Conclusion
Maysville is a city located in Mason County, Kentucky, United States. It is the county seat of Mason County and the principal city of the Maysville Micropolitan Statistical Area, which includes Mason and Lewis counties. As of the 2010 census, the city had a population of 9,011. Maysville was founded in 1784 by John May and was originally known as Limestone. The town was renamed in honor of May in 1787 and was incorporated as a city in 1834. Maysville is located at the northern terminus of the Kentucky and Ohio River Railroad, which connects the city to Cincinnati, Ohio. The city has a humid subtropical climate, with hot, humid summers and cold, wet winters. The economy of Maysville is largely based on manufacturing and tourism. The city is home to several manufacturing companies, as well as a number of educational institutions, healthcare facilities, and tourist attractions.
Common Questions
What is Per Capita Income in Maysville?
Per Capita income in Maysville is $31,089.
What is the Median Family Income in Maysville?
Median Family Income in Maysville is $60,000.
What is the Median Household income in Maysville?
Median Household Income in Maysville is $41,171.
What is Income or Wage Gap in Maysville?
Income or Wage Gap in Maysville is 28.0%.
Women in Maysville earn 72.0 cents for every dollar earned by a man.
What is Inequality or Gini Index in Maysville?
Inequality or Gini Index in Maysville is 0.54.
What is the Total Population of Maysville?
Total Population of Maysville is 8,831.
What is the Total Male Population of Maysville?
Total Male Population of Maysville is 4,240.
What is the Total Female Population of Maysville?
Total Female Population of Maysville is 4,591.
What is the Ratio of Males per 100 Females in Maysville?
There are 92.35 Males per 100 Females in Maysville.
What is the Ratio of Females per 100 Males in Maysville?
There are 108.28 Females per 100 Males in Maysville.
What is the Median Population Age in Maysville?
Median Population Age in Maysville is 41.5 Years.
What is the Average Family Size in Maysville
Average Family Size in Maysville is 3.0 People.
What is the Average Household Size in Maysville
Average Household Size in Maysville is 2.3 People.
How Large is the Labor Force in Maysville?
There are 4,022 People in the Labor Forcein in Maysville.
What is the Percentage of People in the Labor Force in Maysville?
56.4% of People are in the Labor Force in Maysville.
What is the Unemployment Rate in Maysville?
Unemployment Rate in Maysville is 4.8%.