St Paul, AK Map & Demographics
St Paul Map
St Paul Overview
$31,903
PER CAPITA INCOME
$83,250
AVG FAMILY INCOME
$83,214
AVG HOUSEHOLD INCOME
0.38
INEQUALITY / GINI INDEX
349
TOTAL POPULATION
257
MALE POPULATION
92
FEMALE POPULATION
279.35
MALES / 100 FEMALES
35.80
FEMALES / 100 MALES
44.0
MEDIAN AGE
4.4
AVG FAMILY SIZE
3.5
AVG HOUSEHOLD SIZE
137
LABOR FORCE [ PEOPLE ]
50.9%
PERCENT IN LABOR FORCE
2.9%
UNEMPLOYMENT RATE
St Paul Area Codes
Income in St Paul
Income Overview in St Paul
Per Capita Income in St Paul is $31,903, while median incomes of families and households are $83,250 and $83,214 respectively.
| Characteristic | Number | Measure |
| Per Capita Income | 349 | $31,903 |
| Median Family Income | 49 | $83,250 |
| Mean Family Income | 49 | $86,512 |
| Median Household Income | 78 | $83,214 |
| Mean Household Income | 78 | $89,199 |
| Income Deficit | 49 | $0 |
| Wage / Income Gap (%) | 349 | 0.00% |
| Wage / Income Gap ($) | 349 | 100.00¢ per $1 |
| Gini / Inequality Index | 349 | 0.38 |
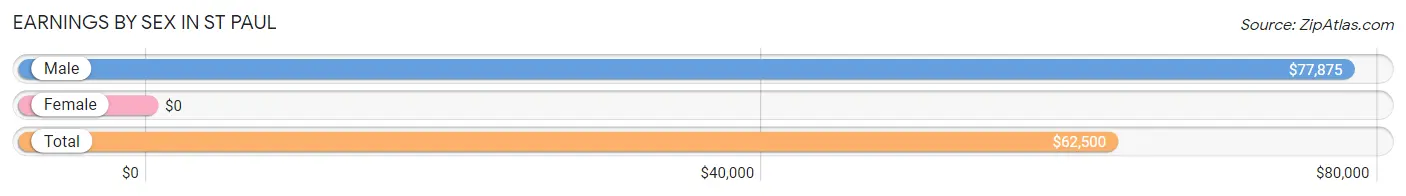
Earnings by Sex in St Paul
| Sex | Number | Average Earnings |
| Male | 109 (77.9%) | $77,875 |
| Female | 31 (22.1%) | $0 |
| Total | 140 (100.0%) | $62,500 |
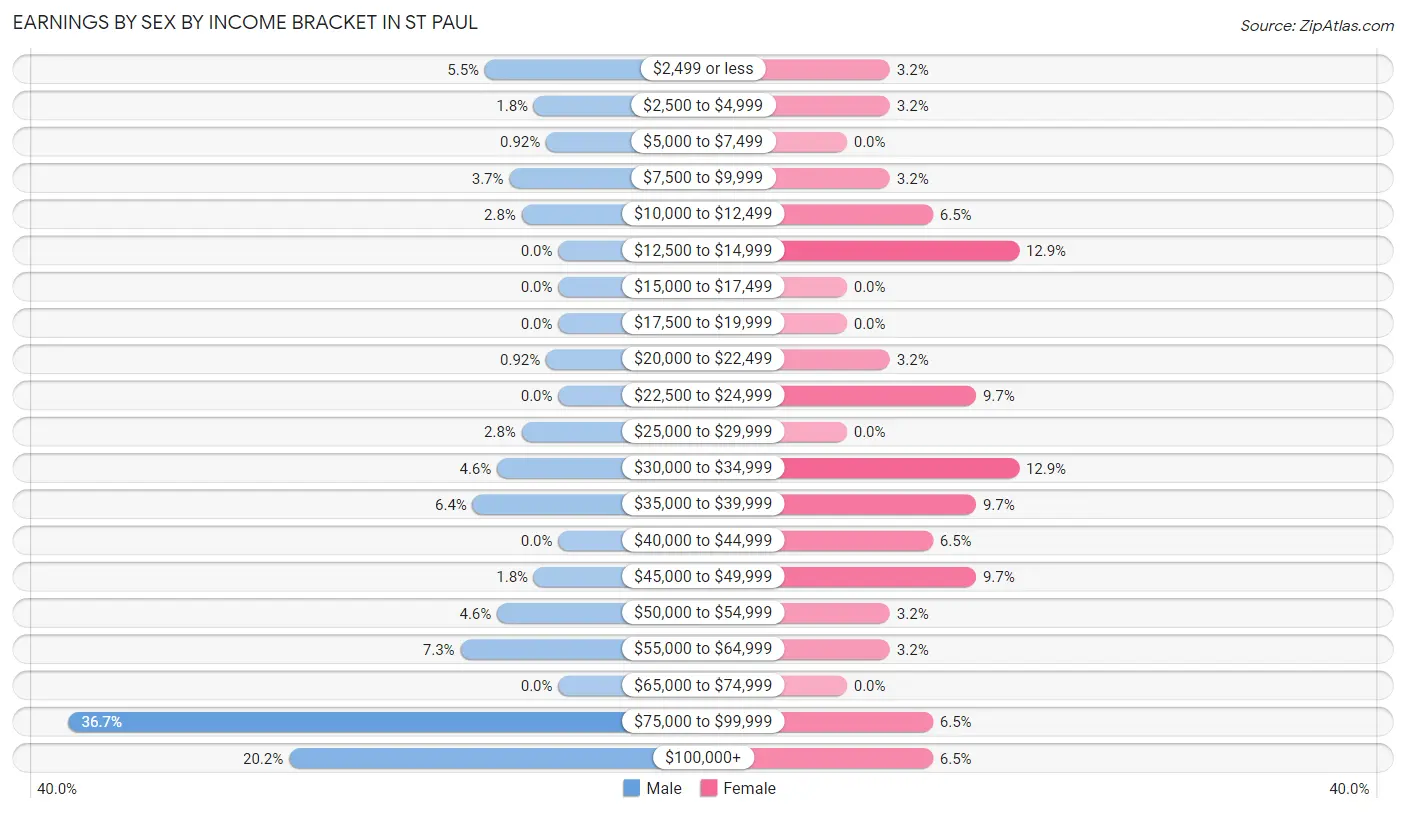
Earnings by Sex by Income Bracket in St Paul
The most common earnings brackets in St Paul are $75,000 to $99,999 for men (40 | 36.7%) and $12,500 to $14,999 for women (4 | 12.9%).
| Income | Male | Female |
| $2,499 or less | 6 (5.5%) | 1 (3.2%) |
| $2,500 to $4,999 | 2 (1.8%) | 1 (3.2%) |
| $5,000 to $7,499 | 1 (0.9%) | 0 (0.0%) |
| $7,500 to $9,999 | 4 (3.7%) | 1 (3.2%) |
| $10,000 to $12,499 | 3 (2.8%) | 2 (6.5%) |
| $12,500 to $14,999 | 0 (0.0%) | 4 (12.9%) |
| $15,000 to $17,499 | 0 (0.0%) | 0 (0.0%) |
| $17,500 to $19,999 | 0 (0.0%) | 0 (0.0%) |
| $20,000 to $22,499 | 1 (0.9%) | 1 (3.2%) |
| $22,500 to $24,999 | 0 (0.0%) | 3 (9.7%) |
| $25,000 to $29,999 | 3 (2.8%) | 0 (0.0%) |
| $30,000 to $34,999 | 5 (4.6%) | 4 (12.9%) |
| $35,000 to $39,999 | 7 (6.4%) | 3 (9.7%) |
| $40,000 to $44,999 | 0 (0.0%) | 2 (6.5%) |
| $45,000 to $49,999 | 2 (1.8%) | 3 (9.7%) |
| $50,000 to $54,999 | 5 (4.6%) | 1 (3.2%) |
| $55,000 to $64,999 | 8 (7.3%) | 1 (3.2%) |
| $65,000 to $74,999 | 0 (0.0%) | 0 (0.0%) |
| $75,000 to $99,999 | 40 (36.7%) | 2 (6.5%) |
| $100,000+ | 22 (20.2%) | 2 (6.5%) |
| Total | 109 (100.0%) | 31 (100.0%) |
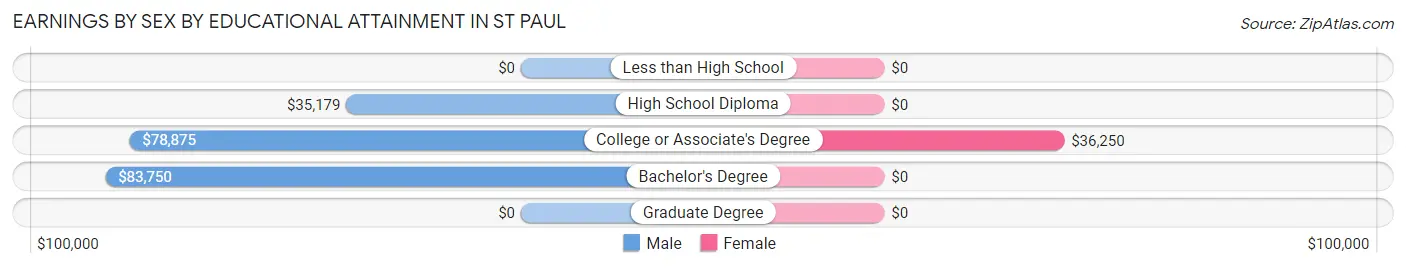
Earnings by Sex by Educational Attainment in St Paul
| Educational Attainment | Male Income | Female Income |
| Less than High School | - | - |
| High School Diploma | $35,179 | $0 |
| College or Associate's Degree | $78,875 | $36,250 |
| Bachelor's Degree | $83,750 | $0 |
| Graduate Degree | - | - |
| Total | $78,375 | $0 |
Family Income in St Paul
Family Income Brackets in St Paul
According to the St Paul family income data, there are 14 families falling into the $100,000 to $149,999 income range, which is the most common income bracket and makes up 28.6% of all families. Conversely, the $10,000 to $14,999 income bracket is the least frequent group with only 2 families (4.1%) belonging to this category.
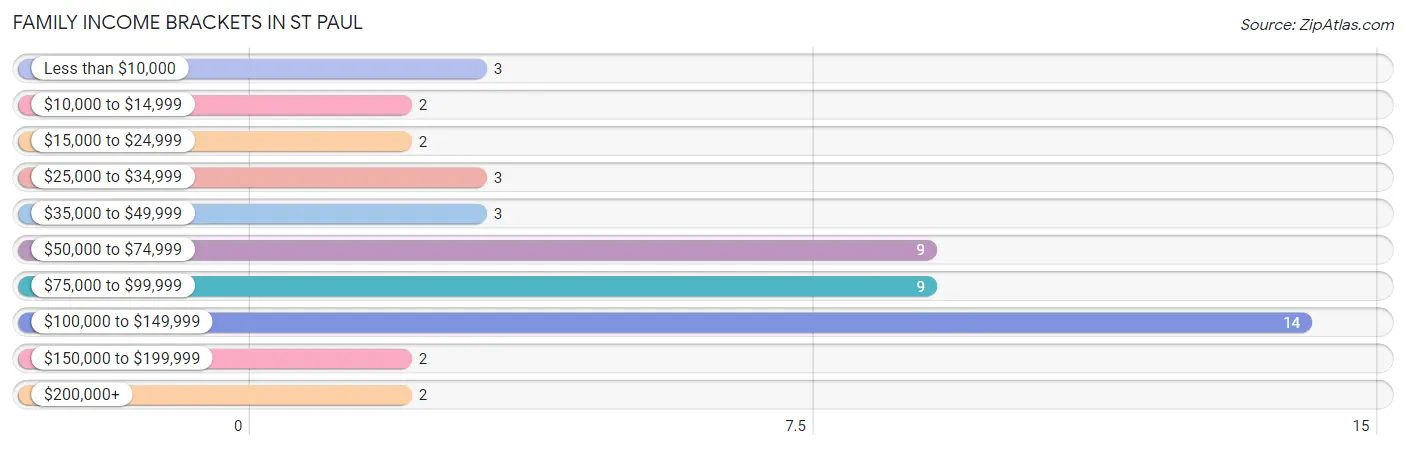
| Income Bracket | # Families | % Families |
| Less than $10,000 | 3 | 6.1% |
| $10,000 to $14,999 | 2 | 4.1% |
| $15,000 to $24,999 | 2 | 4.1% |
| $25,000 to $34,999 | 3 | 6.1% |
| $35,000 to $49,999 | 3 | 6.1% |
| $50,000 to $74,999 | 9 | 18.4% |
| $75,000 to $99,999 | 9 | 18.4% |
| $100,000 to $149,999 | 14 | 28.6% |
| $150,000 to $199,999 | 2 | 4.1% |
| $200,000+ | 2 | 4.1% |
Family Income by Famaliy Size in St Paul
3-person families (26 | 53.1%) account for the highest median family income in St Paul with $84,000 per family, while 3-person families (26 | 53.1%) have the highest median income of $28,000 per family member.
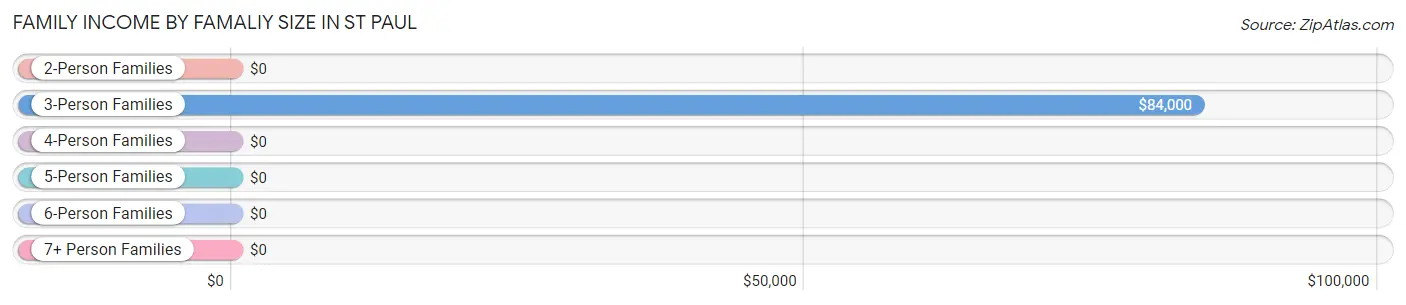
| Income Bracket | # Families | Median Income |
| 2-Person Families | 13 (26.5%) | $0 |
| 3-Person Families | 26 (53.1%) | $84,000 |
| 4-Person Families | 7 (14.3%) | $0 |
| 5-Person Families | 2 (4.1%) | $0 |
| 6-Person Families | 0 (0.0%) | $0 |
| 7+ Person Families | 1 (2.0%) | $0 |
| Total | 49 (100.0%) | $83,250 |
Family Income by Number of Earners in St Paul
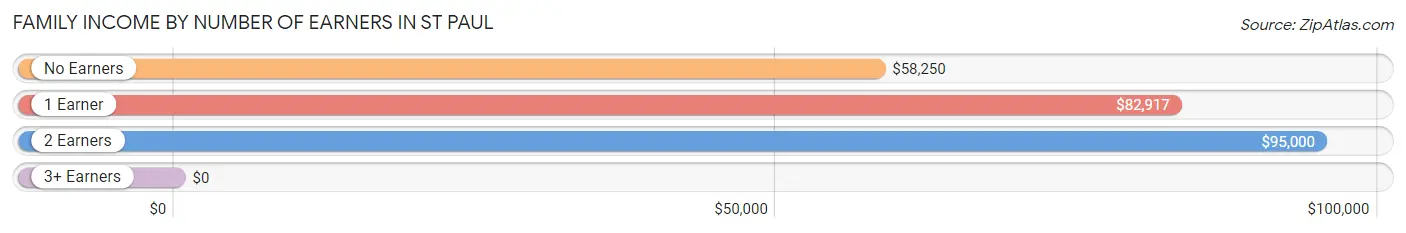
| Number of Earners | # Families | Median Income |
| No Earners | 7 (14.3%) | $58,250 |
| 1 Earner | 27 (55.1%) | $82,917 |
| 2 Earners | 12 (24.5%) | $95,000 |
| 3+ Earners | 3 (6.1%) | $0 |
| Total | 49 (100.0%) | $83,250 |
Household Income in St Paul
Household Income Brackets in St Paul
With 16 households falling in the category, the $100,000 to $149,999 income range is the most frequent in St Paul, accounting for 20.5% of all households. In contrast, only 2 households (2.6%) fall into the $10,000 to $14,999 income bracket, making it the least populous group.
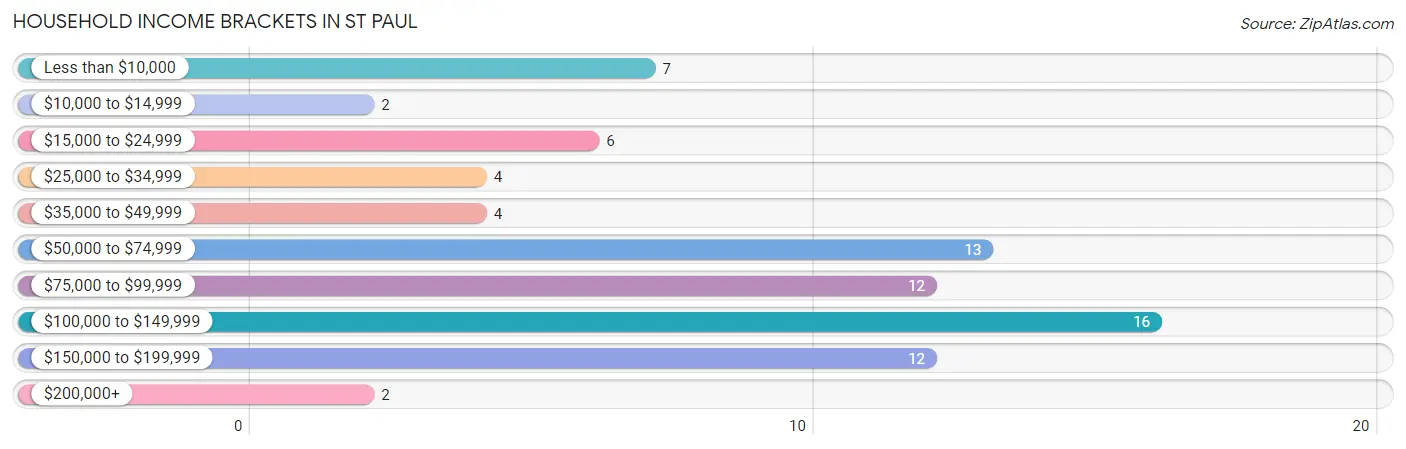
| Income Bracket | # Households | % Households |
| Less than $10,000 | 7 | 9.0% |
| $10,000 to $14,999 | 2 | 2.6% |
| $15,000 to $24,999 | 6 | 7.7% |
| $25,000 to $34,999 | 4 | 5.1% |
| $35,000 to $49,999 | 4 | 5.1% |
| $50,000 to $74,999 | 13 | 16.7% |
| $75,000 to $99,999 | 12 | 15.4% |
| $100,000 to $149,999 | 16 | 20.5% |
| $150,000 to $199,999 | 12 | 15.4% |
| $200,000+ | 2 | 2.6% |
Household Income by Householder Age in St Paul
The median household income in St Paul is $83,214, with the highest median household income of $81,250 found in the 45 to 64 years age bracket for the primary householder. A total of 26 households (33.3%) fall into this category. Meanwhile, the 15 to 24 years age bracket for the primary householder has the lowest median household income of $0, with 2 households (2.6%) in this group.
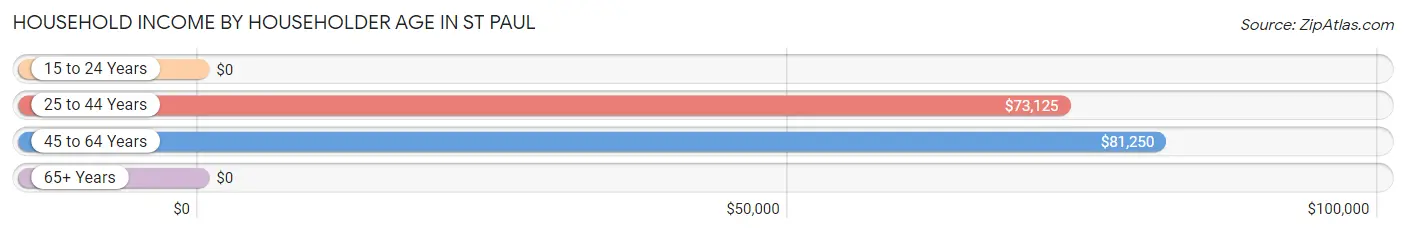
| Income Bracket | # Households | Median Income |
| 15 to 24 Years | 2 (2.6%) | $0 |
| 25 to 44 Years | 21 (26.9%) | $73,125 |
| 45 to 64 Years | 26 (33.3%) | $81,250 |
| 65+ Years | 29 (37.2%) | $0 |
| Total | 78 (100.0%) | $83,214 |
Poverty in St Paul
Income Below Poverty by Sex and Age in St Paul
With 32.8% poverty level for males and 15.2% for females among the residents of St Paul, 18 to 24 year old males and 18 to 24 year old females are the most vulnerable to poverty, with 3 males (100.0%) and 5 females (35.7%) in their respective age groups living below the poverty level.
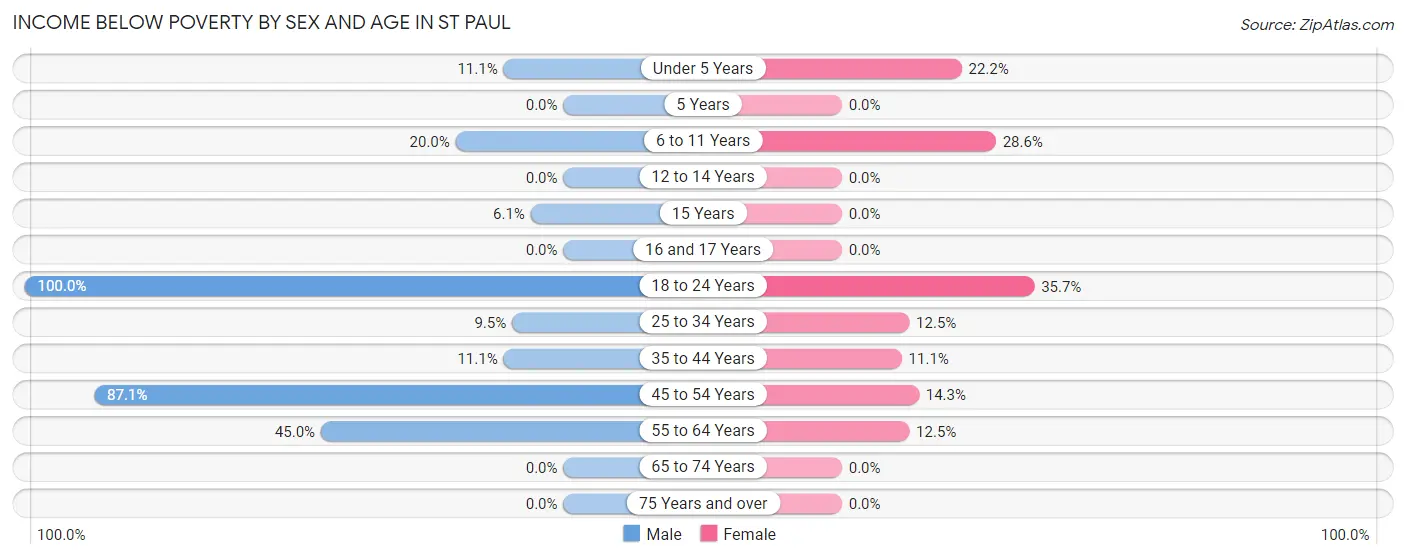
| Age Bracket | Male | Female |
| Under 5 Years | 1 (11.1%) | 2 (22.2%) |
| 5 Years | 0 (0.0%) | 0 (0.0%) |
| 6 to 11 Years | 2 (20.0%) | 2 (28.6%) |
| 12 to 14 Years | 0 (0.0%) | 0 (0.0%) |
| 15 Years | 2 (6.1%) | 0 (0.0%) |
| 16 and 17 Years | 0 (0.0%) | 0 (0.0%) |
| 18 to 24 Years | 3 (100.0%) | 5 (35.7%) |
| 25 to 34 Years | 4 (9.5%) | 1 (12.5%) |
| 35 to 44 Years | 1 (11.1%) | 1 (11.1%) |
| 45 to 54 Years | 54 (87.1%) | 1 (14.3%) |
| 55 to 64 Years | 9 (45.0%) | 2 (12.5%) |
| 65 to 74 Years | 0 (0.0%) | 0 (0.0%) |
| 75 Years and over | 0 (0.0%) | 0 (0.0%) |
| Total | 76 (32.8%) | 14 (15.2%) |
Income Above Poverty by Sex and Age in St Paul
According to the poverty statistics in St Paul, males aged 5 years and females aged 5 years are the age groups that are most secure financially, with 100.0% of males and 100.0% of females in these age groups living above the poverty line.
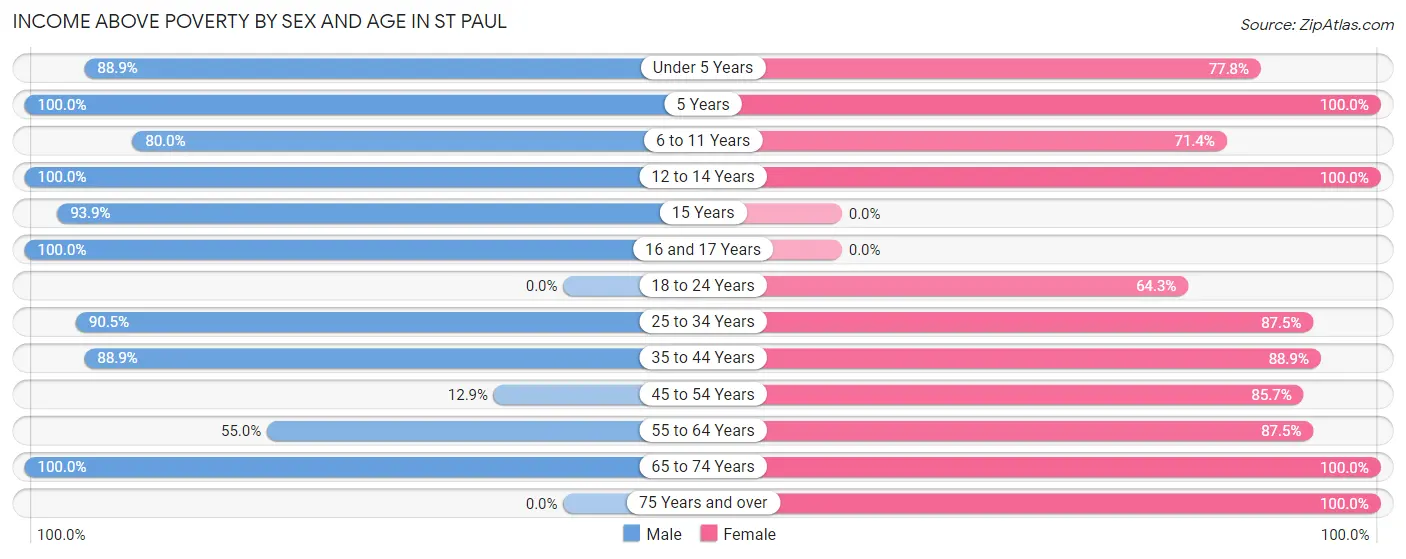
| Age Bracket | Male | Female |
| Under 5 Years | 8 (88.9%) | 7 (77.8%) |
| 5 Years | 2 (100.0%) | 2 (100.0%) |
| 6 to 11 Years | 8 (80.0%) | 5 (71.4%) |
| 12 to 14 Years | 3 (100.0%) | 5 (100.0%) |
| 15 Years | 31 (93.9%) | 0 (0.0%) |
| 16 and 17 Years | 1 (100.0%) | 0 (0.0%) |
| 18 to 24 Years | 0 (0.0%) | 9 (64.3%) |
| 25 to 34 Years | 38 (90.5%) | 7 (87.5%) |
| 35 to 44 Years | 8 (88.9%) | 8 (88.9%) |
| 45 to 54 Years | 8 (12.9%) | 6 (85.7%) |
| 55 to 64 Years | 11 (55.0%) | 14 (87.5%) |
| 65 to 74 Years | 38 (100.0%) | 7 (100.0%) |
| 75 Years and over | 0 (0.0%) | 8 (100.0%) |
| Total | 156 (67.2%) | 78 (84.8%) |
Income Below Poverty Among Married-Couple Families in St Paul
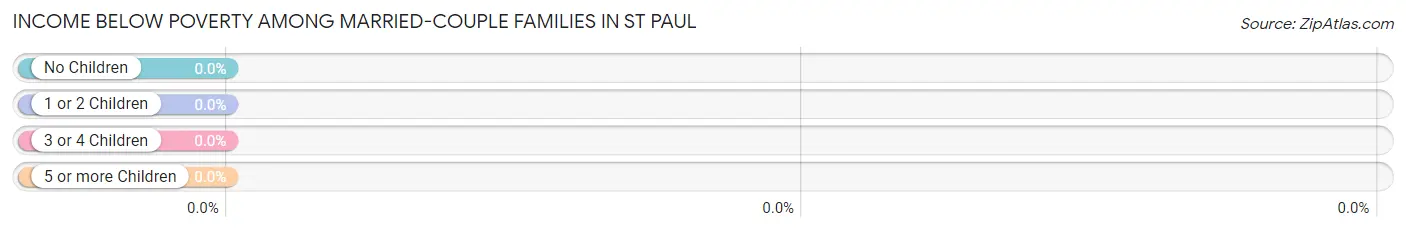
| Children | Above Poverty | Below Poverty |
| No Children | 14 (100.0%) | 0 (0.0%) |
| 1 or 2 Children | 7 (100.0%) | 0 (0.0%) |
| 3 or 4 Children | 2 (100.0%) | 0 (0.0%) |
| 5 or more Children | 0 (0.0%) | 0 (0.0%) |
| Total | 23 (100.0%) | 0 (0.0%) |
Income Below Poverty Among Single-Parent Households in St Paul
According to the poverty data in St Paul, 33.3% or 2 single-father households and 20.0% or 4 single-mother households are living below the poverty line. Among single-father households, those with no children have the highest poverty rate, with 1 households (50.0%) experiencing poverty. Likewise, among single-mother households, those with 3 or 4 children have the highest poverty rate, with 1 households (50.0%) falling below the poverty line.
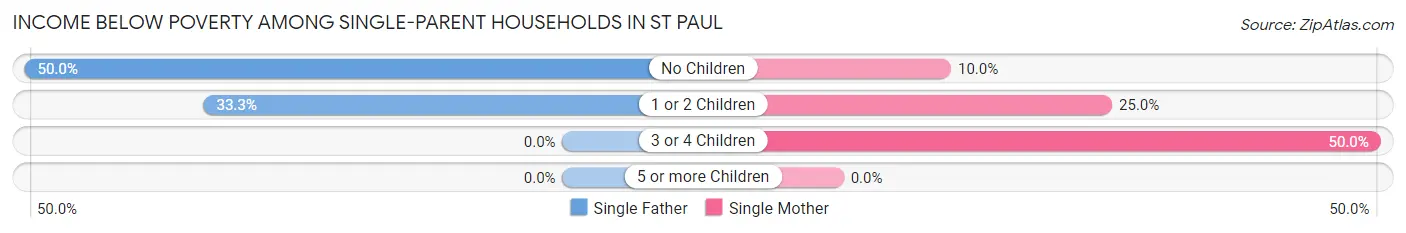
| Children | Single Father | Single Mother |
| No Children | 1 (50.0%) | 1 (10.0%) |
| 1 or 2 Children | 1 (33.3%) | 2 (25.0%) |
| 3 or 4 Children | 0 (0.0%) | 1 (50.0%) |
| 5 or more Children | 0 (0.0%) | 0 (0.0%) |
| Total | 2 (33.3%) | 4 (20.0%) |
Income Below Poverty Among Married-Couple vs Single-Parent Households in St Paul
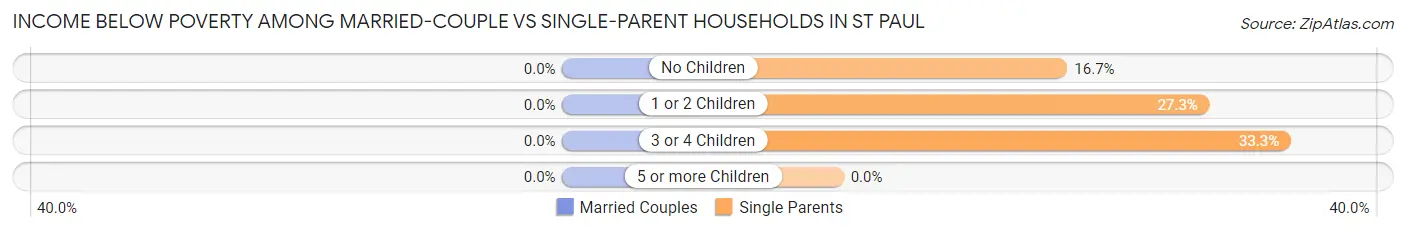
| Children | Married-Couple Families | Single-Parent Households |
| No Children | 0 (0.0%) | 2 (16.7%) |
| 1 or 2 Children | 0 (0.0%) | 3 (27.3%) |
| 3 or 4 Children | 0 (0.0%) | 1 (33.3%) |
| 5 or more Children | 0 (0.0%) | 0 (0.0%) |
| Total | 0 (0.0%) | 6 (23.1%) |
Race in St Paul
The most populous races in St Paul are Native / Alaskan (274 | 78.5%), White / Caucasian (38 | 10.9%), and Hispanic or Latino (29 | 8.3%).
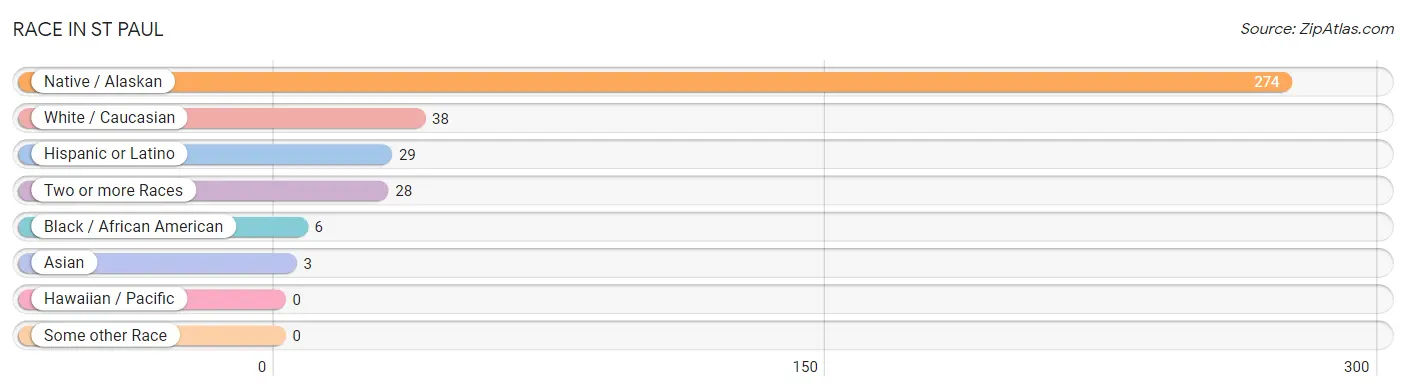
| Race | # Population | % Population |
| Asian | 3 | 0.9% |
| Black / African American | 6 | 1.7% |
| Hawaiian / Pacific | 0 | 0.0% |
| Hispanic or Latino | 29 | 8.3% |
| Native / Alaskan | 274 | 78.5% |
| White / Caucasian | 38 | 10.9% |
| Two or more Races | 28 | 8.0% |
| Some other Race | 0 | 0.0% |
| Total | 349 | 100.0% |
Ancestry in St Paul
The most populous ancestries reported in St Paul are Aleut (276 | 79.1%), Mexican (29 | 8.3%), Russian (23 | 6.6%), German (11 | 3.2%), and Yup'ik (11 | 3.2%), together accounting for 100.3% of all St Paul residents.
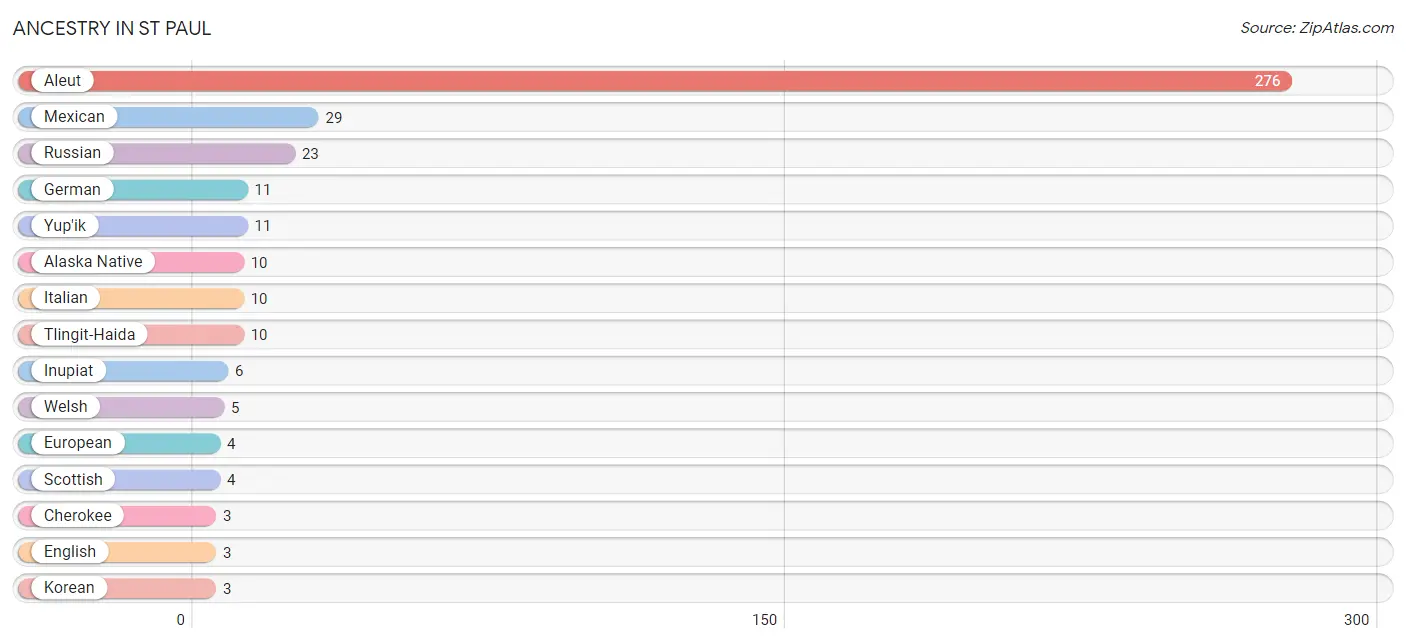
| Ancestry | # Population | % Population |
| Alaska Native | 10 | 2.9% |
| Alaskan Athabascan | 1 | 0.3% |
| Aleut | 276 | 79.1% |
| Cherokee | 3 | 0.9% |
| English | 3 | 0.9% |
| European | 4 | 1.1% |
| German | 11 | 3.2% |
| Inupiat | 6 | 1.7% |
| Irish | 2 | 0.6% |
| Italian | 10 | 2.9% |
| Korean | 3 | 0.9% |
| Mexican | 29 | 8.3% |
| Russian | 23 | 6.6% |
| Scottish | 4 | 1.1% |
| Subsaharan African | 3 | 0.9% |
| Tlingit-Haida | 10 | 2.9% |
| Ugandan | 3 | 0.9% |
| Welsh | 5 | 1.4% |
| Yup'ik | 11 | 3.2% | View All 19 Rows |
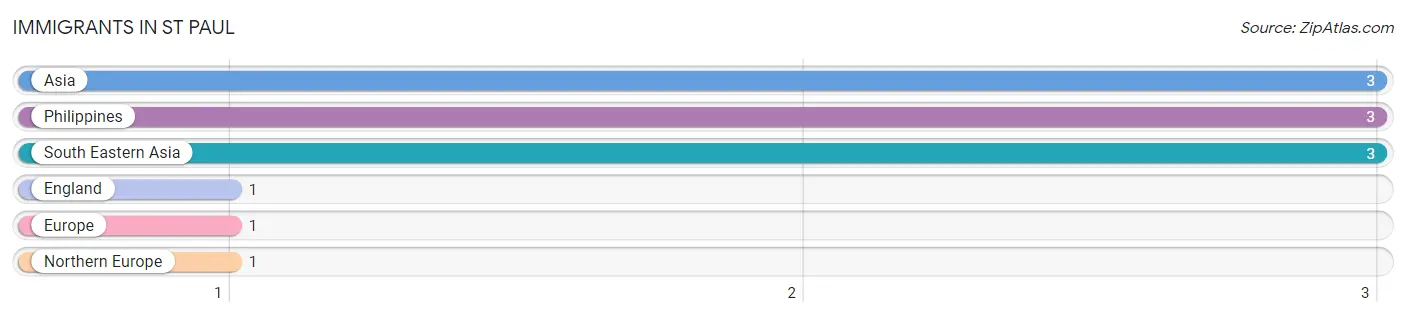
Immigrants in St Paul
The most numerous immigrant groups reported in St Paul came from Asia (3 | 0.9%), Philippines (3 | 0.9%), South Eastern Asia (3 | 0.9%), England (1 | 0.3%), and Europe (1 | 0.3%), together accounting for 3.2% of all St Paul residents.
| Immigration Origin | # Population | % Population |
| Asia | 3 | 0.9% |
| England | 1 | 0.3% |
| Europe | 1 | 0.3% |
| Northern Europe | 1 | 0.3% |
| Philippines | 3 | 0.9% |
| South Eastern Asia | 3 | 0.9% | View All 6 Rows |
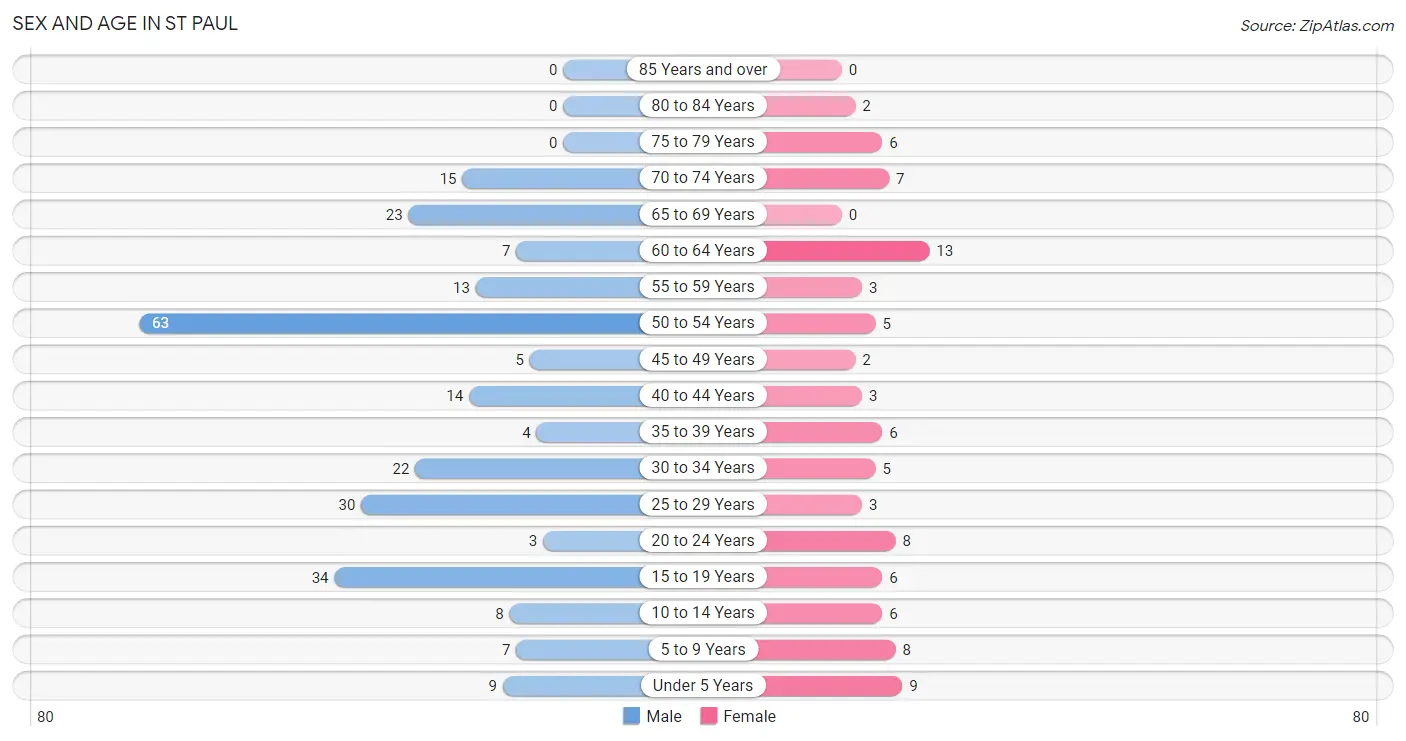
Sex and Age in St Paul
Sex and Age in St Paul
The most populous age groups in St Paul are 50 to 54 Years (63 | 24.5%) for men and 60 to 64 Years (13 | 14.1%) for women.
| Age Bracket | Male | Female |
| Under 5 Years | 9 (3.5%) | 9 (9.8%) |
| 5 to 9 Years | 7 (2.7%) | 8 (8.7%) |
| 10 to 14 Years | 8 (3.1%) | 6 (6.5%) |
| 15 to 19 Years | 34 (13.2%) | 6 (6.5%) |
| 20 to 24 Years | 3 (1.2%) | 8 (8.7%) |
| 25 to 29 Years | 30 (11.7%) | 3 (3.3%) |
| 30 to 34 Years | 22 (8.6%) | 5 (5.4%) |
| 35 to 39 Years | 4 (1.6%) | 6 (6.5%) |
| 40 to 44 Years | 14 (5.4%) | 3 (3.3%) |
| 45 to 49 Years | 5 (1.9%) | 2 (2.2%) |
| 50 to 54 Years | 63 (24.5%) | 5 (5.4%) |
| 55 to 59 Years | 13 (5.1%) | 3 (3.3%) |
| 60 to 64 Years | 7 (2.7%) | 13 (14.1%) |
| 65 to 69 Years | 23 (8.9%) | 0 (0.0%) |
| 70 to 74 Years | 15 (5.8%) | 7 (7.6%) |
| 75 to 79 Years | 0 (0.0%) | 6 (6.5%) |
| 80 to 84 Years | 0 (0.0%) | 2 (2.2%) |
| 85 Years and over | 0 (0.0%) | 0 (0.0%) |
| Total | 257 (100.0%) | 92 (100.0%) |
Families and Households in St Paul
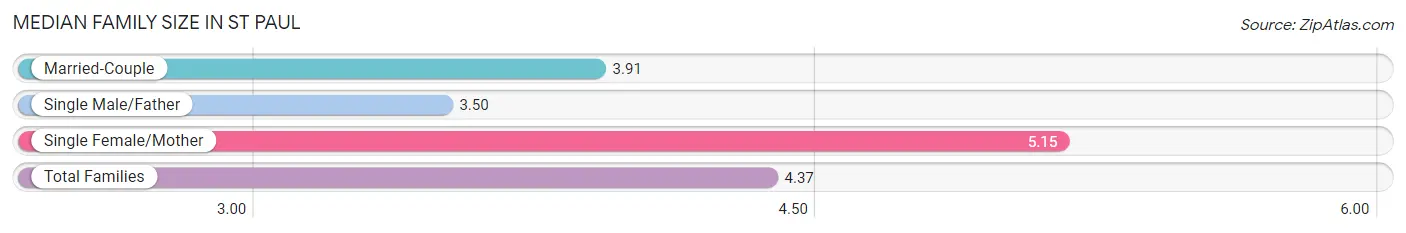
Median Family Size in St Paul
The median family size in St Paul is 4.37 persons per family, with single female/mother families (20 | 40.8%) accounting for the largest median family size of 5.15 persons per family. On the other hand, single male/father families (6 | 12.2%) represent the smallest median family size with 3.50 persons per family.
| Family Type | # Families | Family Size |
| Married-Couple | 23 (46.9%) | 3.91 |
| Single Male/Father | 6 (12.2%) | 3.50 |
| Single Female/Mother | 20 (40.8%) | 5.15 |
| Total Families | 49 (100.0%) | 4.37 |
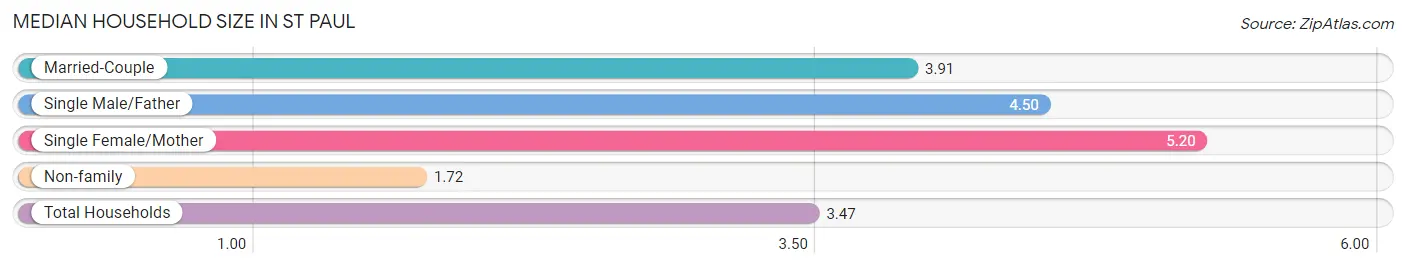
Median Household Size in St Paul
The median household size in St Paul is 3.47 persons per household, with single female/mother households (20 | 25.6%) accounting for the largest median household size of 5.2 persons per household. non-family households (29 | 37.2%) represent the smallest median household size with 1.72 persons per household.
| Household Type | # Households | Household Size |
| Married-Couple | 23 (29.5%) | 3.91 |
| Single Male/Father | 6 (7.7%) | 4.50 |
| Single Female/Mother | 20 (25.6%) | 5.20 |
| Non-family | 29 (37.2%) | 1.72 |
| Total Households | 78 (100.0%) | 3.47 |
Household Size by Marriage Status in St Paul
Out of a total of 78 households in St Paul, 49 (62.8%) are family households, while 29 (37.2%) are nonfamily households. The most numerous type of family households are 3-person households, comprising 23, and the most common type of nonfamily households are 1-person households, comprising 25.
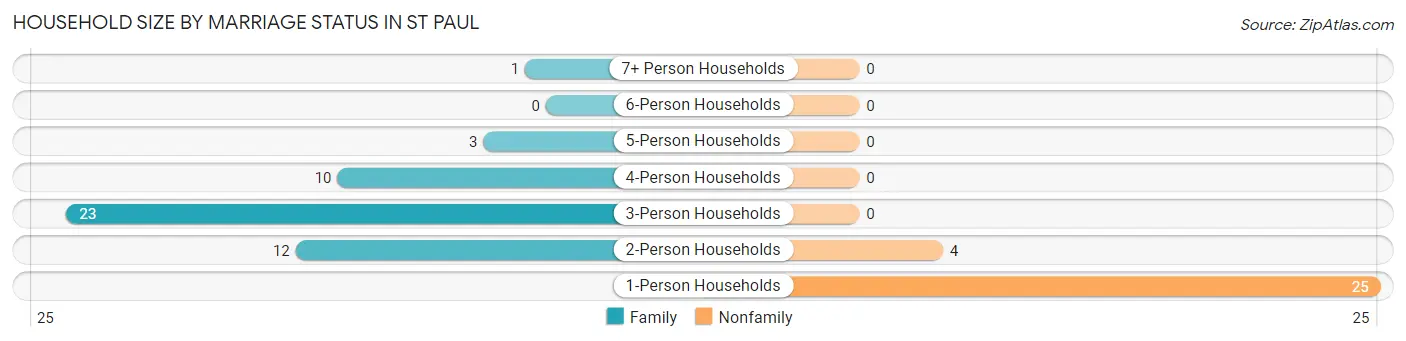
| Household Size | Family Households | Nonfamily Households |
| 1-Person Households | - | 25 (32.1%) |
| 2-Person Households | 12 (15.4%) | 4 (5.1%) |
| 3-Person Households | 23 (29.5%) | 0 (0.0%) |
| 4-Person Households | 10 (12.8%) | 0 (0.0%) |
| 5-Person Households | 3 (3.8%) | 0 (0.0%) |
| 6-Person Households | 0 (0.0%) | 0 (0.0%) |
| 7+ Person Households | 1 (1.3%) | 0 (0.0%) |
| Total | 49 (62.8%) | 29 (37.2%) |
Female Fertility in St Paul
Fertility by Age in St Paul
Average fertility rate in St Paul is 152.0 births per 1,000 women. Women in the age bracket of 20 to 34 years have the highest fertility rate with 250.0 births per 1,000 women. Women in the age bracket of 20 to 34 years acount for 80.0% of all women with births.
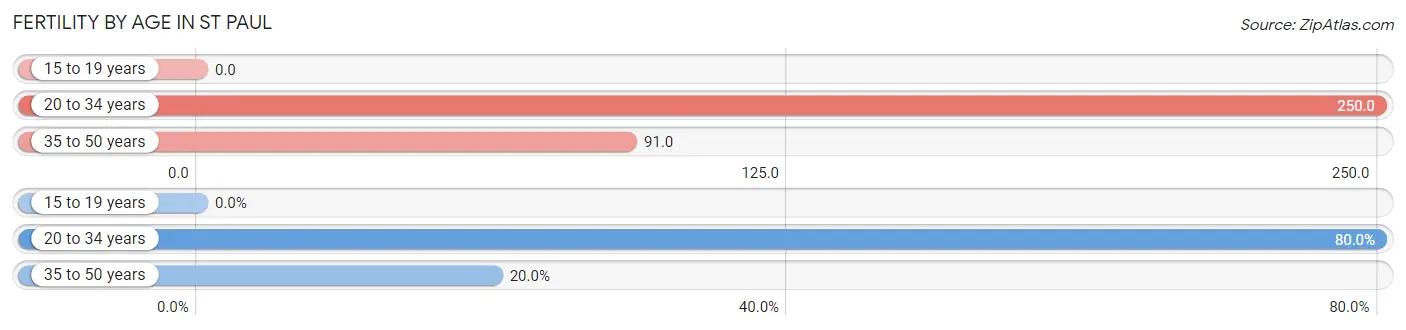
| Age Bracket | Women with Births | Births / 1,000 Women |
| 15 to 19 years | 0 (0.0%) | 0.0 |
| 20 to 34 years | 4 (80.0%) | 250.0 |
| 35 to 50 years | 1 (20.0%) | 91.0 |
| Total | 5 (100.0%) | 152.0 |
Fertility by Age by Marriage Status in St Paul
20.0% of women with births (5) in St Paul are married. The highest percentage of unmarried women with births falls into 20 to 34 years age bracket with 100.0% of them unmarried at the time of birth, while the lowest percentage of unmarried women with births belong to 35 to 50 years age bracket with 0.0% of them unmarried.
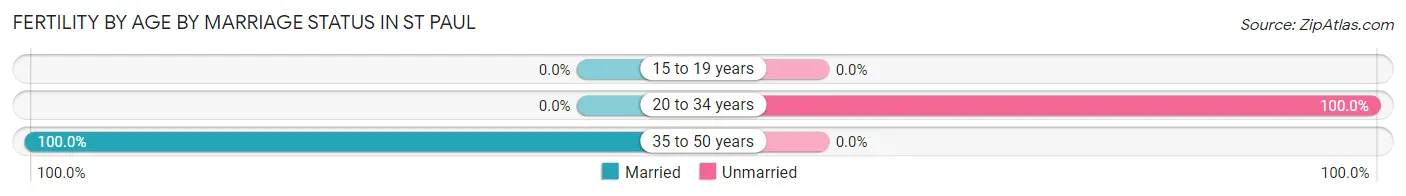
| Age Bracket | Married | Unmarried |
| 15 to 19 years | 0 (0.0%) | 0 (0.0%) |
| 20 to 34 years | 0 (0.0%) | 4 (100.0%) |
| 35 to 50 years | 1 (100.0%) | 0 (0.0%) |
| Total | 1 (20.0%) | 4 (80.0%) |
Fertility by Education in St Paul
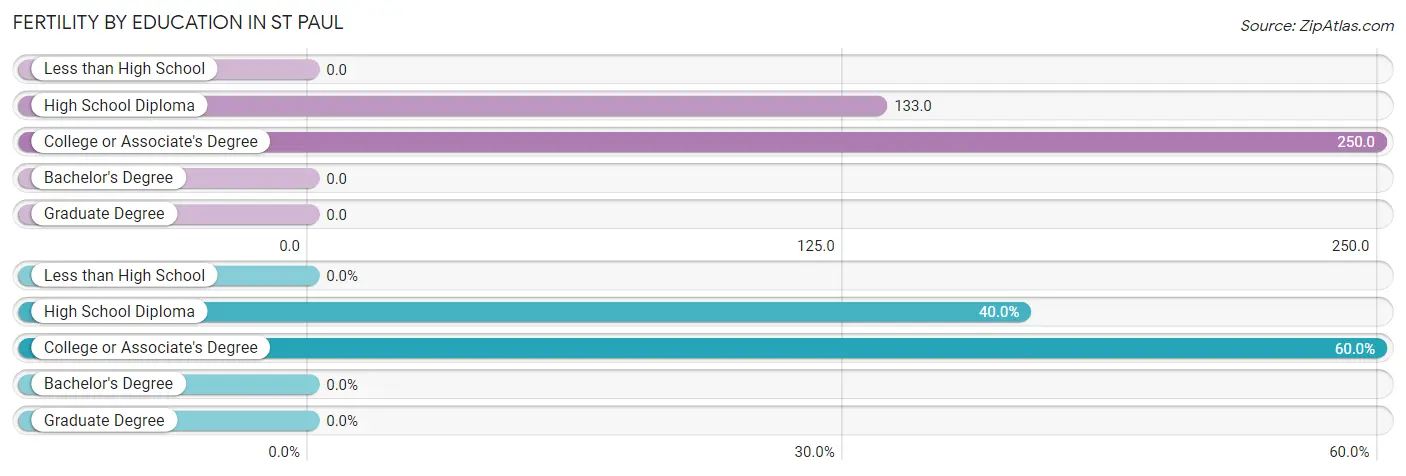
| Educational Attainment | Women with Births | Births / 1,000 Women |
| Less than High School | 0 (0.0%) | 0.0 |
| High School Diploma | 2 (40.0%) | 133.0 |
| College or Associate's Degree | 3 (60.0%) | 250.0 |
| Bachelor's Degree | 0 (0.0%) | 0.0 |
| Graduate Degree | 0 (0.0%) | 0.0 |
| Total | 5 (100.0%) | 152.0 |
Fertility by Education by Marriage Status in St Paul
80.0% of women with births in St Paul are unmarried. Women with the educational attainment of high school diploma are most likely to be married with 50.0% of them married at childbirth, while women with the educational attainment of college or associate's degree are least likely to be married with 100.0% of them unmarried at childbirth.
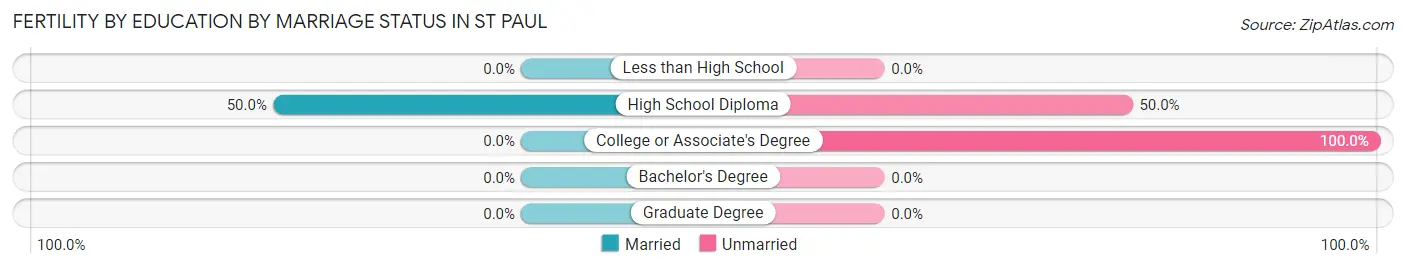
| Educational Attainment | Married | Unmarried |
| Less than High School | 0 (0.0%) | 0 (0.0%) |
| High School Diploma | 1 (50.0%) | 1 (50.0%) |
| College or Associate's Degree | 0 (0.0%) | 3 (100.0%) |
| Bachelor's Degree | 0 (0.0%) | 0 (0.0%) |
| Graduate Degree | 0 (0.0%) | 0 (0.0%) |
| Total | 1 (20.0%) | 4 (80.0%) |
Employment Characteristics in St Paul
Employment by Class of Employer in St Paul
Among the 111 employed individuals in St Paul, local government employees (41 | 36.9%), federal government employees (33 | 29.7%), and private company employees (18 | 16.2%) make up the most common classes of employment.
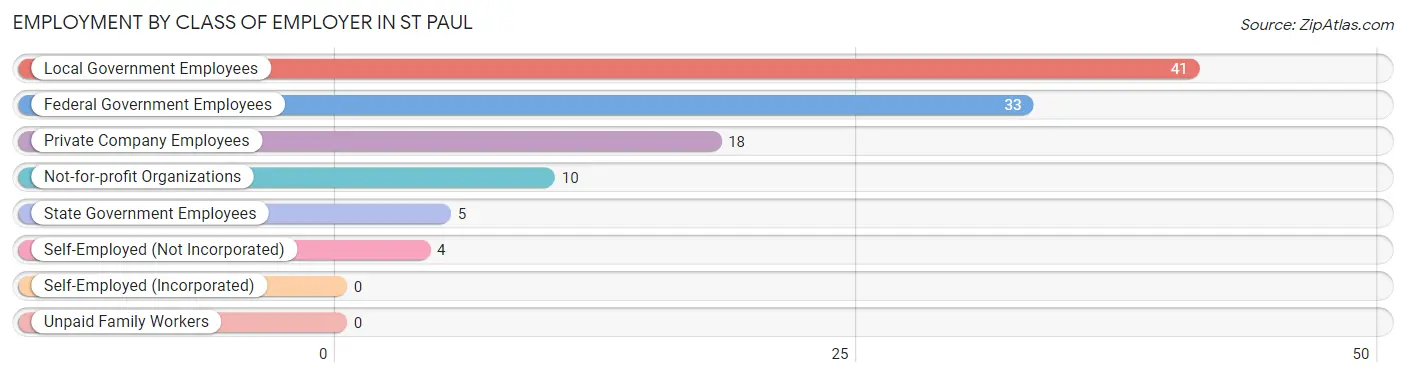
| Employer Class | # Employees | % Employees |
| Private Company Employees | 18 | 16.2% |
| Self-Employed (Incorporated) | 0 | 0.0% |
| Self-Employed (Not Incorporated) | 4 | 3.6% |
| Not-for-profit Organizations | 10 | 9.0% |
| Local Government Employees | 41 | 36.9% |
| State Government Employees | 5 | 4.5% |
| Federal Government Employees | 33 | 29.7% |
| Unpaid Family Workers | 0 | 0.0% |
| Total | 111 | 100.0% |
Employment Status by Age in St Paul
According to the labor force statistics for St Paul, out of the total population over 16 years of age (269), 50.9% or 137 individuals are in the labor force, with 2.9% or 4 of them unemployed. The age group with the highest labor force participation rate is 25 to 29 years, with 97.0% or 32 individuals in the labor force. Within the labor force, the 55 to 59 years age range has the highest percentage of unemployed individuals, with 25.0% or 2 of them being unemployed.
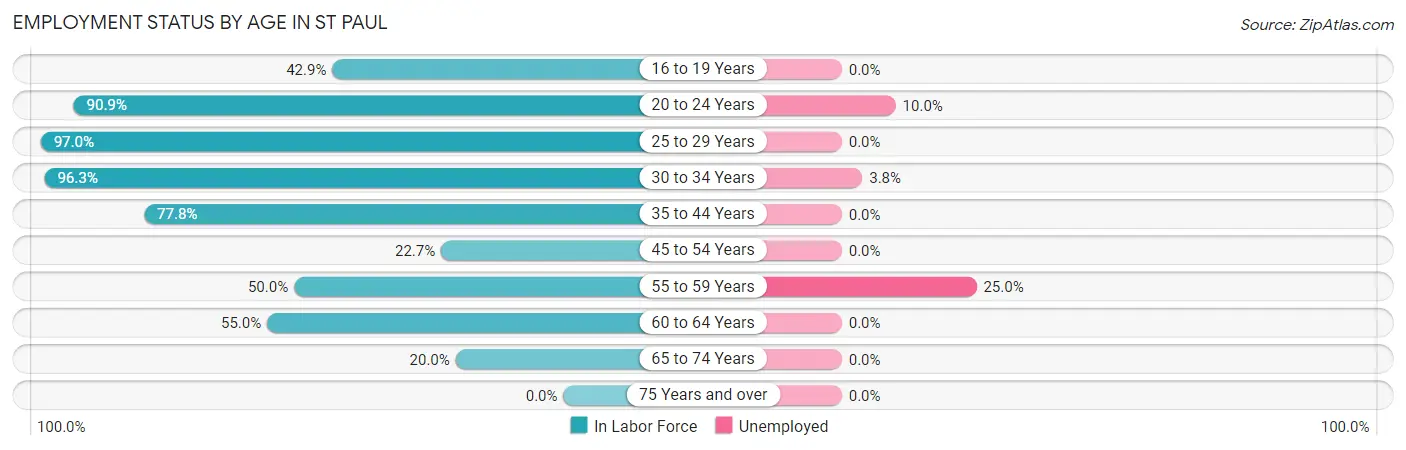
| Age Bracket | In Labor Force | Unemployed |
| 16 to 19 Years | 3 (42.9%) | 0 (0.0%) |
| 20 to 24 Years | 10 (90.9%) | 1 (10.0%) |
| 25 to 29 Years | 32 (97.0%) | 0 (0.0%) |
| 30 to 34 Years | 26 (96.3%) | 1 (3.8%) |
| 35 to 44 Years | 21 (77.8%) | 0 (0.0%) |
| 45 to 54 Years | 17 (22.7%) | 0 (0.0%) |
| 55 to 59 Years | 8 (50.0%) | 2 (25.0%) |
| 60 to 64 Years | 11 (55.0%) | 0 (0.0%) |
| 65 to 74 Years | 9 (20.0%) | 0 (0.0%) |
| 75 Years and over | 0 (0.0%) | 0 (0.0%) |
| Total | 137 (50.9%) | 4 (2.9%) |
Employment Status by Educational Attainment in St Paul
According to labor force statistics for St Paul, 58.1% of individuals (115) out of the total population between 25 and 64 years of age (198) are in the labor force, with 2.6% or 3 of them being unemployed. The group with the highest labor force participation rate are those with the educational attainment of bachelor's degree or higher, with 100.0% or 24 individuals in the labor force. Within the labor force, individuals with less than high school education have the highest percentage of unemployment, with 25.0% or 1 of them being unemployed.
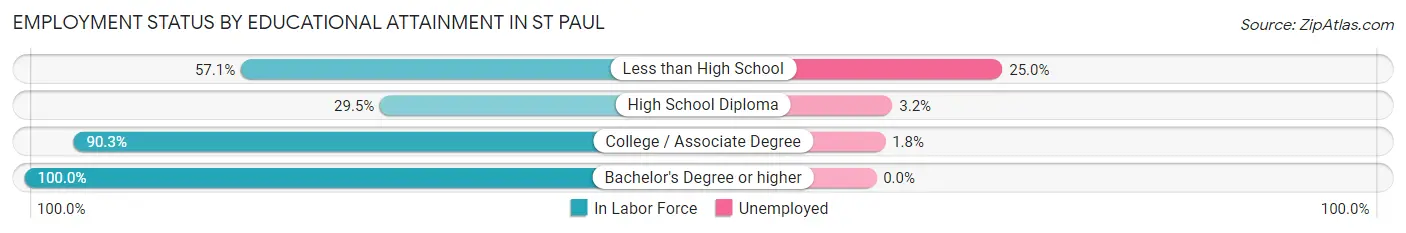
| Educational Attainment | In Labor Force | Unemployed |
| Less than High School | 4 (57.1%) | 2 (25.0%) |
| High School Diploma | 31 (29.5%) | 3 (3.2%) |
| College / Associate Degree | 56 (90.3%) | 1 (1.8%) |
| Bachelor's Degree or higher | 24 (100.0%) | 0 (0.0%) |
| Total | 115 (58.1%) | 5 (2.6%) |
Employment Occupations by Sex in St Paul
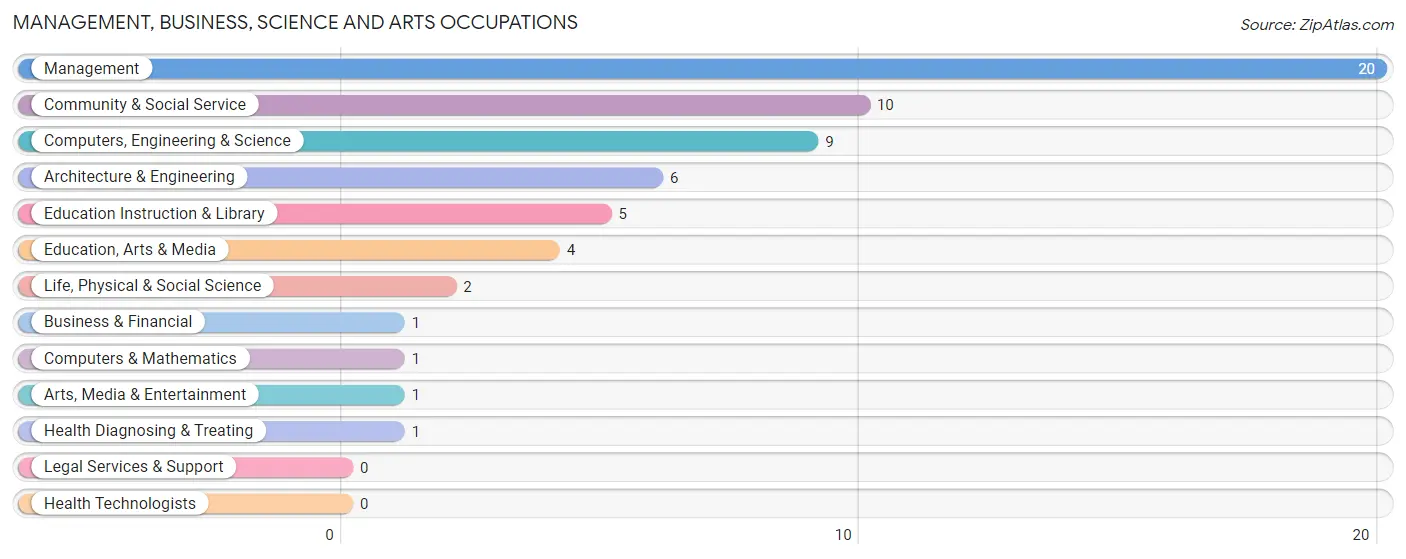
Management, Business, Science and Arts Occupations
The most common Management, Business, Science and Arts occupations in St Paul are Management (20 | 15.0%), Community & Social Service (10 | 7.5%), Computers, Engineering & Science (9 | 6.8%), Architecture & Engineering (6 | 4.5%), and Education Instruction & Library (5 | 3.8%).
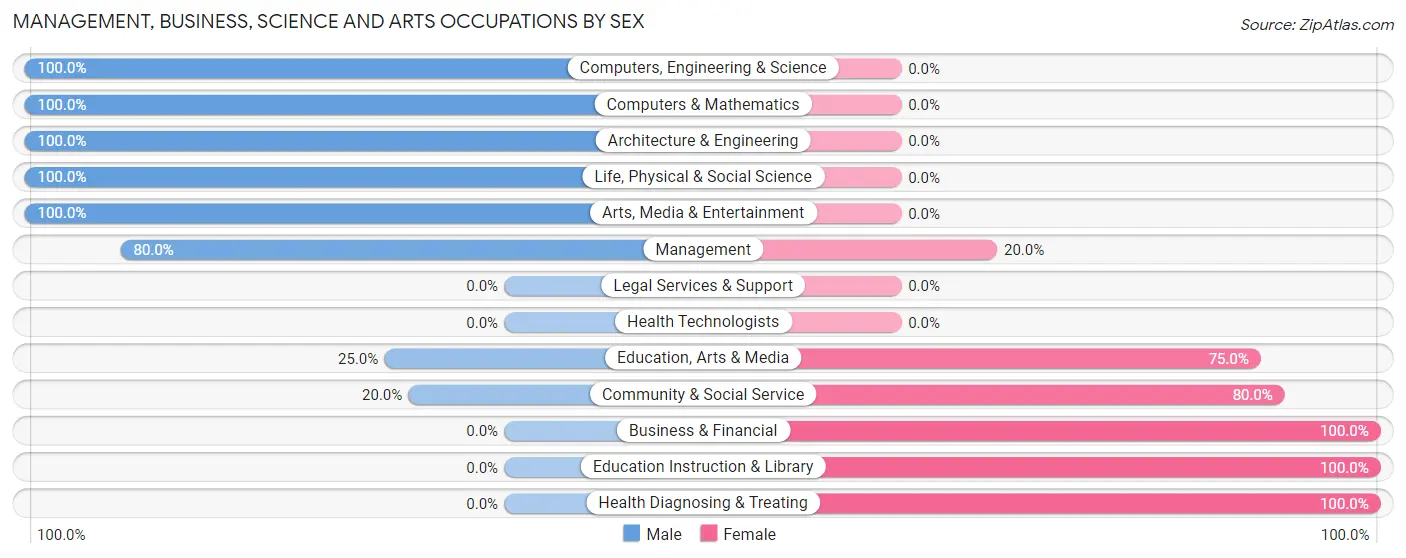
Management, Business, Science and Arts Occupations by Sex
Within the Management, Business, Science and Arts occupations in St Paul, the most male-oriented occupations are Computers, Engineering & Science (100.0%), Computers & Mathematics (100.0%), and Architecture & Engineering (100.0%), while the most female-oriented occupations are Business & Financial (100.0%), Education Instruction & Library (100.0%), and Health Diagnosing & Treating (100.0%).
| Occupation | Male | Female |
| Management | 16 (80.0%) | 4 (20.0%) |
| Business & Financial | 0 (0.0%) | 1 (100.0%) |
| Computers, Engineering & Science | 9 (100.0%) | 0 (0.0%) |
| Computers & Mathematics | 1 (100.0%) | 0 (0.0%) |
| Architecture & Engineering | 6 (100.0%) | 0 (0.0%) |
| Life, Physical & Social Science | 2 (100.0%) | 0 (0.0%) |
| Community & Social Service | 2 (20.0%) | 8 (80.0%) |
| Education, Arts & Media | 1 (25.0%) | 3 (75.0%) |
| Legal Services & Support | 0 (0.0%) | 0 (0.0%) |
| Education Instruction & Library | 0 (0.0%) | 5 (100.0%) |
| Arts, Media & Entertainment | 1 (100.0%) | 0 (0.0%) |
| Health Diagnosing & Treating | 0 (0.0%) | 1 (100.0%) |
| Health Technologists | 0 (0.0%) | 0 (0.0%) |
| Total (Category) | 27 (65.8%) | 14 (34.2%) |
| Total (Overall) | 104 (78.2%) | 29 (21.8%) |
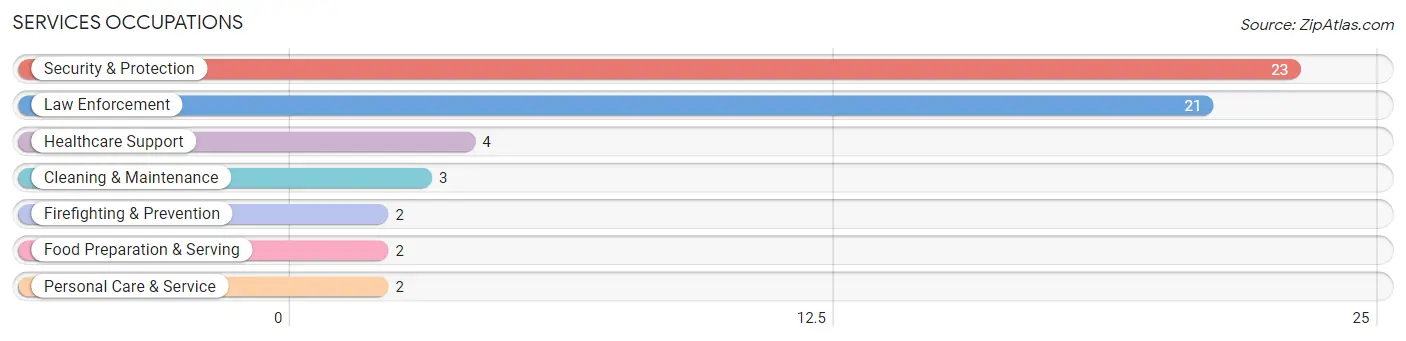
Services Occupations
The most common Services occupations in St Paul are Security & Protection (23 | 17.3%), Law Enforcement (21 | 15.8%), Healthcare Support (4 | 3.0%), Cleaning & Maintenance (3 | 2.3%), and Firefighting & Prevention (2 | 1.5%).
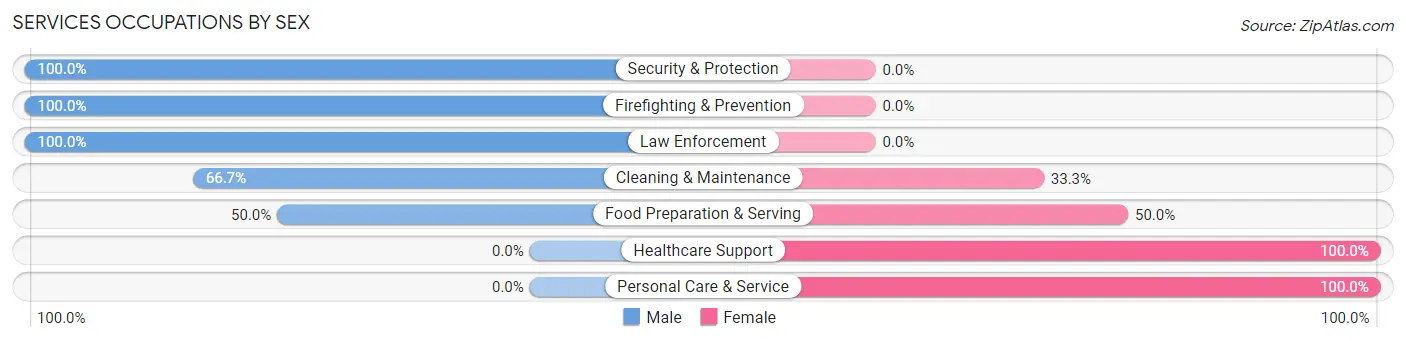
Services Occupations by Sex
Within the Services occupations in St Paul, the most male-oriented occupations are Security & Protection (100.0%), Firefighting & Prevention (100.0%), and Law Enforcement (100.0%), while the most female-oriented occupations are Healthcare Support (100.0%), Personal Care & Service (100.0%), and Food Preparation & Serving (50.0%).
| Occupation | Male | Female |
| Healthcare Support | 0 (0.0%) | 4 (100.0%) |
| Security & Protection | 23 (100.0%) | 0 (0.0%) |
| Firefighting & Prevention | 2 (100.0%) | 0 (0.0%) |
| Law Enforcement | 21 (100.0%) | 0 (0.0%) |
| Food Preparation & Serving | 1 (50.0%) | 1 (50.0%) |
| Cleaning & Maintenance | 2 (66.7%) | 1 (33.3%) |
| Personal Care & Service | 0 (0.0%) | 2 (100.0%) |
| Total (Category) | 26 (76.5%) | 8 (23.5%) |
| Total (Overall) | 104 (78.2%) | 29 (21.8%) |
Sales and Office Occupations
The most common Sales and Office occupations in St Paul are Office & Administration (6 | 4.5%), and Sales & Related (2 | 1.5%).
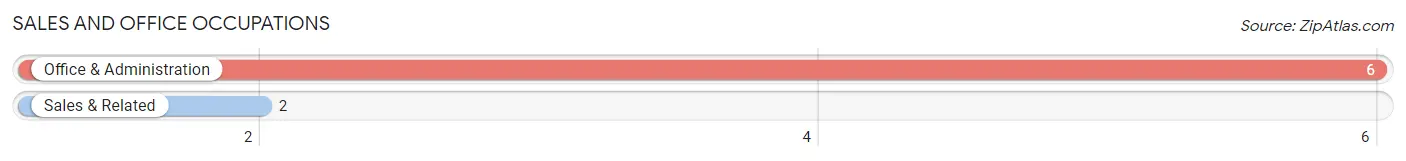
Sales and Office Occupations by Sex
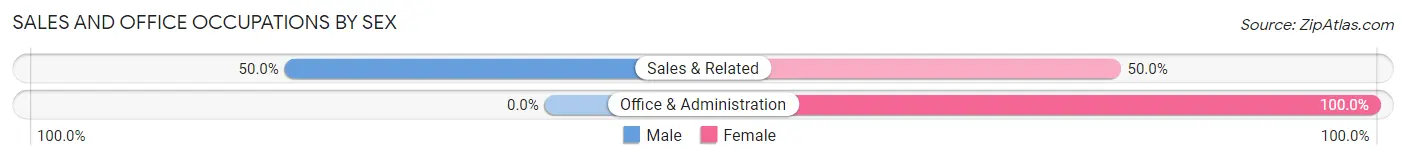
| Occupation | Male | Female |
| Sales & Related | 1 (50.0%) | 1 (50.0%) |
| Office & Administration | 0 (0.0%) | 6 (100.0%) |
| Total (Category) | 1 (12.5%) | 7 (87.5%) |
| Total (Overall) | 104 (78.2%) | 29 (21.8%) |
Natural Resources, Construction and Maintenance Occupations
The most common Natural Resources, Construction and Maintenance occupations in St Paul are Construction & Extraction (13 | 9.8%), Installation, Maintenance & Repair (6 | 4.5%), and Farming, Fishing & Forestry (1 | 0.7%).
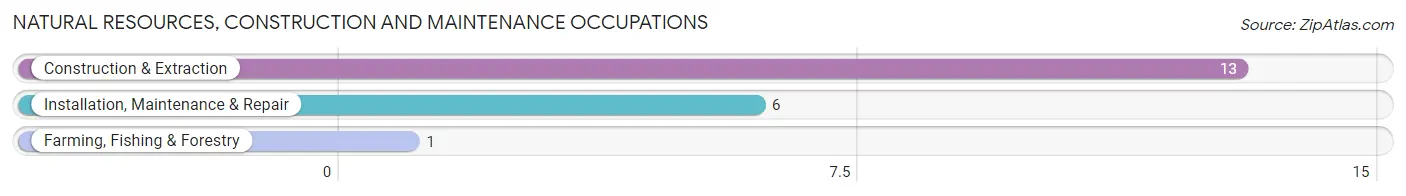
Natural Resources, Construction and Maintenance Occupations by Sex
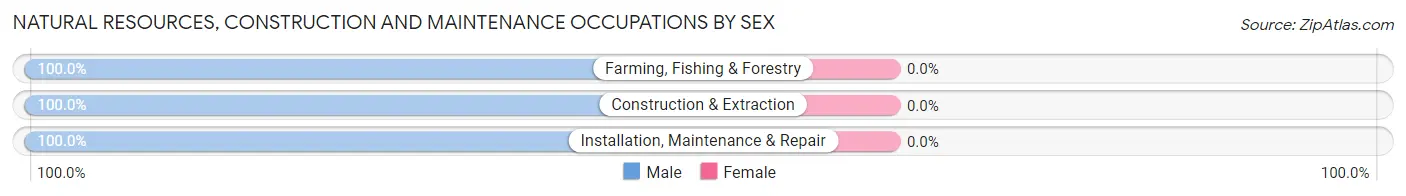
| Occupation | Male | Female |
| Farming, Fishing & Forestry | 1 (100.0%) | 0 (0.0%) |
| Construction & Extraction | 13 (100.0%) | 0 (0.0%) |
| Installation, Maintenance & Repair | 6 (100.0%) | 0 (0.0%) |
| Total (Category) | 20 (100.0%) | 0 (0.0%) |
| Total (Overall) | 104 (78.2%) | 29 (21.8%) |
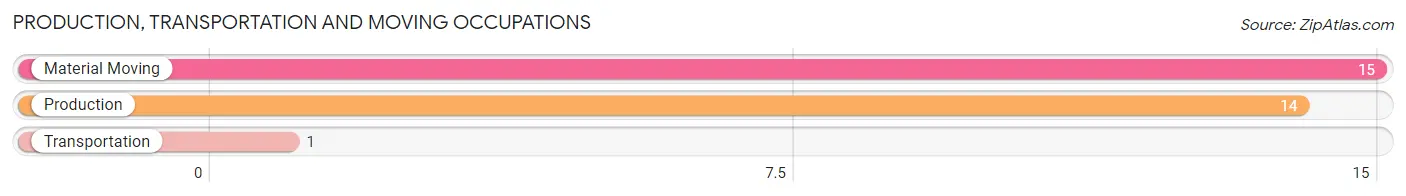
Production, Transportation and Moving Occupations
The most common Production, Transportation and Moving occupations in St Paul are Material Moving (15 | 11.3%), Production (14 | 10.5%), and Transportation (1 | 0.7%).
Production, Transportation and Moving Occupations by Sex
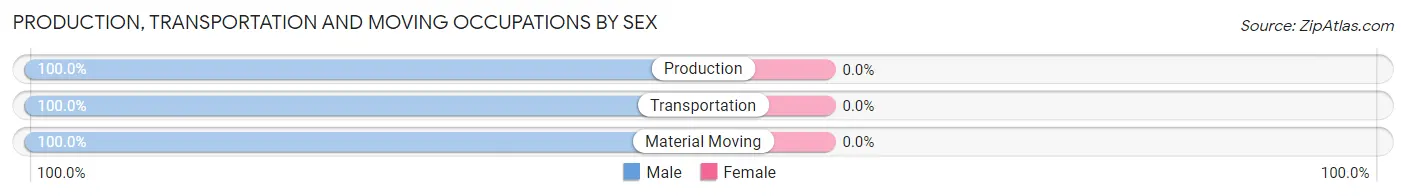
| Occupation | Male | Female |
| Production | 14 (100.0%) | 0 (0.0%) |
| Transportation | 1 (100.0%) | 0 (0.0%) |
| Material Moving | 15 (100.0%) | 0 (0.0%) |
| Total (Category) | 30 (100.0%) | 0 (0.0%) |
| Total (Overall) | 104 (78.2%) | 29 (21.8%) |
Employment Industries by Sex in St Paul
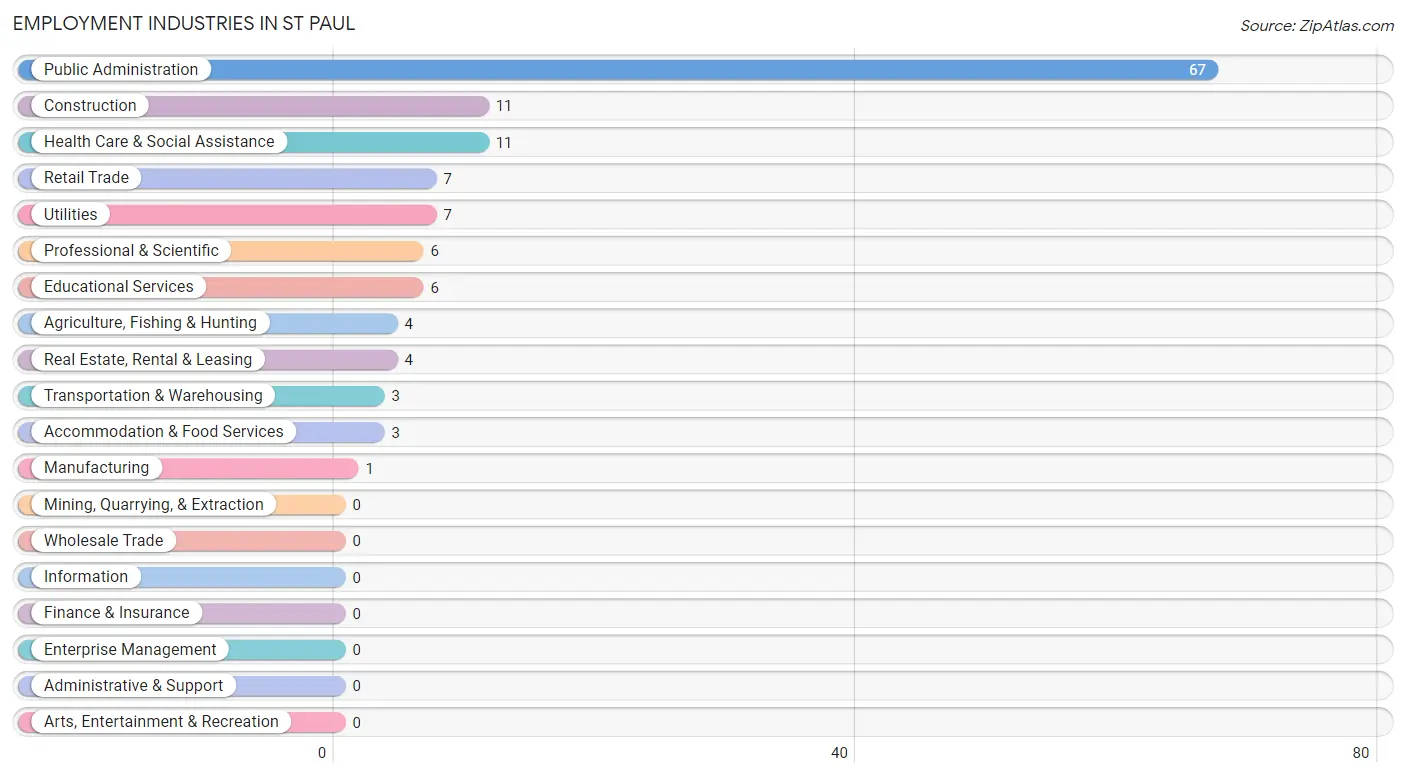
Employment Industries in St Paul
The major employment industries in St Paul include Public Administration (67 | 50.4%), Construction (11 | 8.3%), Health Care & Social Assistance (11 | 8.3%), Retail Trade (7 | 5.3%), and Utilities (7 | 5.3%).
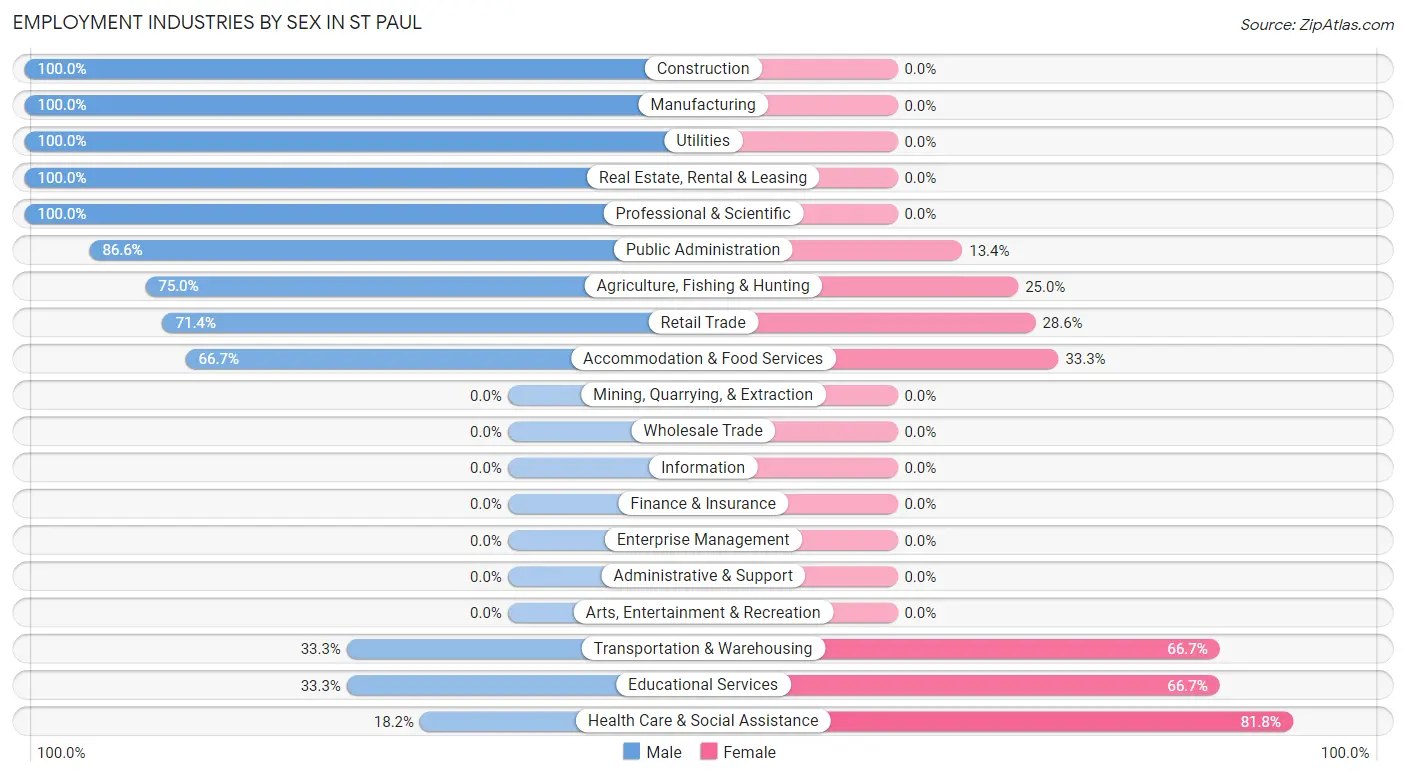
Employment Industries by Sex in St Paul
The St Paul industries that see more men than women are Construction (100.0%), Manufacturing (100.0%), and Utilities (100.0%), whereas the industries that tend to have a higher number of women are Health Care & Social Assistance (81.8%), Transportation & Warehousing (66.7%), and Educational Services (66.7%).
| Industry | Male | Female |
| Agriculture, Fishing & Hunting | 3 (75.0%) | 1 (25.0%) |
| Mining, Quarrying, & Extraction | 0 (0.0%) | 0 (0.0%) |
| Construction | 11 (100.0%) | 0 (0.0%) |
| Manufacturing | 1 (100.0%) | 0 (0.0%) |
| Wholesale Trade | 0 (0.0%) | 0 (0.0%) |
| Retail Trade | 5 (71.4%) | 2 (28.6%) |
| Transportation & Warehousing | 1 (33.3%) | 2 (66.7%) |
| Utilities | 7 (100.0%) | 0 (0.0%) |
| Information | 0 (0.0%) | 0 (0.0%) |
| Finance & Insurance | 0 (0.0%) | 0 (0.0%) |
| Real Estate, Rental & Leasing | 4 (100.0%) | 0 (0.0%) |
| Professional & Scientific | 6 (100.0%) | 0 (0.0%) |
| Enterprise Management | 0 (0.0%) | 0 (0.0%) |
| Administrative & Support | 0 (0.0%) | 0 (0.0%) |
| Educational Services | 2 (33.3%) | 4 (66.7%) |
| Health Care & Social Assistance | 2 (18.2%) | 9 (81.8%) |
| Arts, Entertainment & Recreation | 0 (0.0%) | 0 (0.0%) |
| Accommodation & Food Services | 2 (66.7%) | 1 (33.3%) |
| Public Administration | 58 (86.6%) | 9 (13.4%) |
| Total | 104 (78.2%) | 29 (21.8%) |
Education in St Paul
School Enrollment in St Paul
The most common levels of schooling among the 76 students in St Paul are high school (39 | 51.3%), middle school (14 | 18.4%), and elementary school (9 | 11.8%).
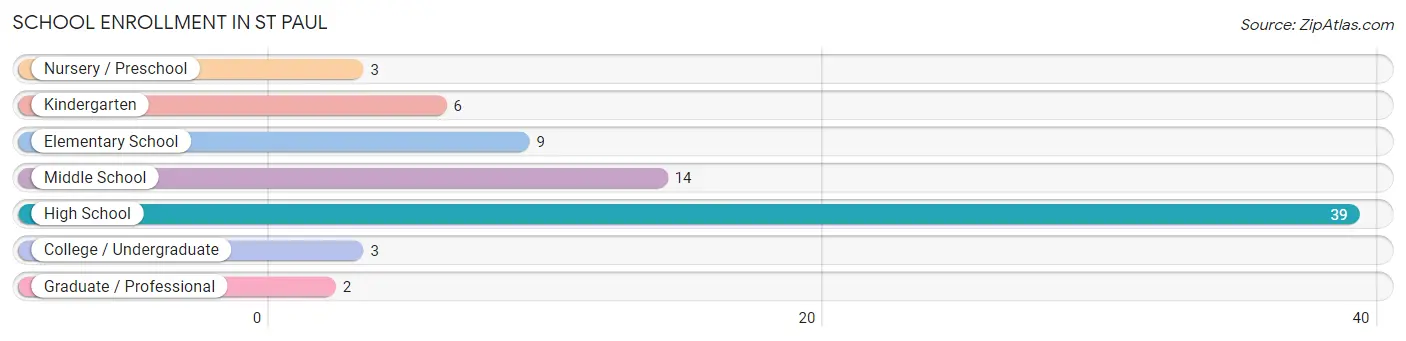
| School Level | # Students | % Students |
| Nursery / Preschool | 3 | 4.0% |
| Kindergarten | 6 | 7.9% |
| Elementary School | 9 | 11.8% |
| Middle School | 14 | 18.4% |
| High School | 39 | 51.3% |
| College / Undergraduate | 3 | 4.0% |
| Graduate / Professional | 2 | 2.6% |
| Total | 76 | 100.0% |
School Enrollment by Age by Funding Source in St Paul
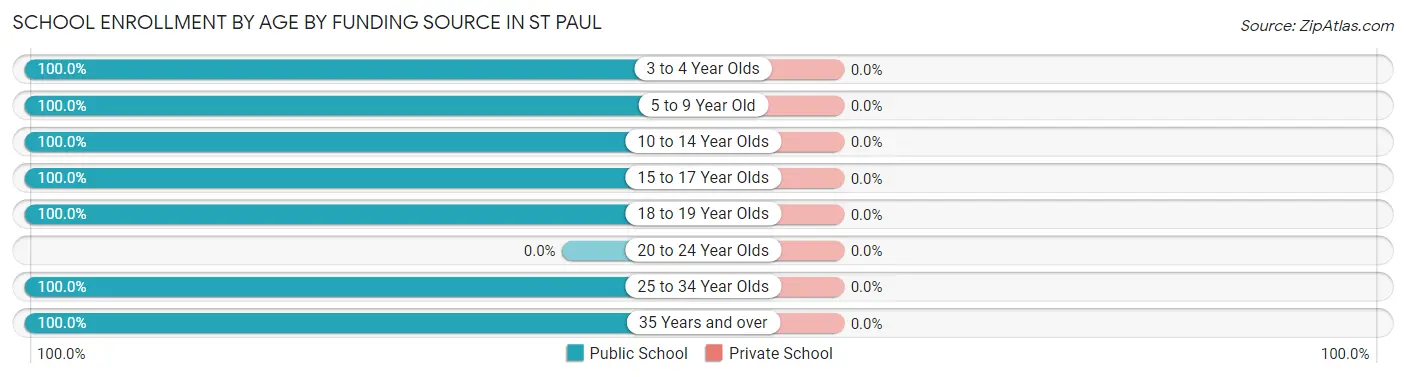
| Age Bracket | Public School | Private School |
| 3 to 4 Year Olds | 5 (100.0%) | 0 (0.0%) |
| 5 to 9 Year Old | 15 (100.0%) | 0 (0.0%) |
| 10 to 14 Year Olds | 14 (100.0%) | 0 (0.0%) |
| 15 to 17 Year Olds | 34 (100.0%) | 0 (0.0%) |
| 18 to 19 Year Olds | 3 (100.0%) | 0 (0.0%) |
| 20 to 24 Year Olds | 0 (0.0%) | 0 (0.0%) |
| 25 to 34 Year Olds | 2 (100.0%) | 0 (0.0%) |
| 35 Years and over | 3 (100.0%) | 0 (0.0%) |
| Total | 76 (100.0%) | 0 (0.0%) |
Educational Attainment by Field of Study in St Paul
Liberal arts & history (19 | 79.2%), physical & health sciences (2 | 8.3%), business (2 | 8.3%), and psychology (1 | 4.2%) are the most common fields of study among 24 individuals in St Paul who have obtained a bachelor's degree or higher.
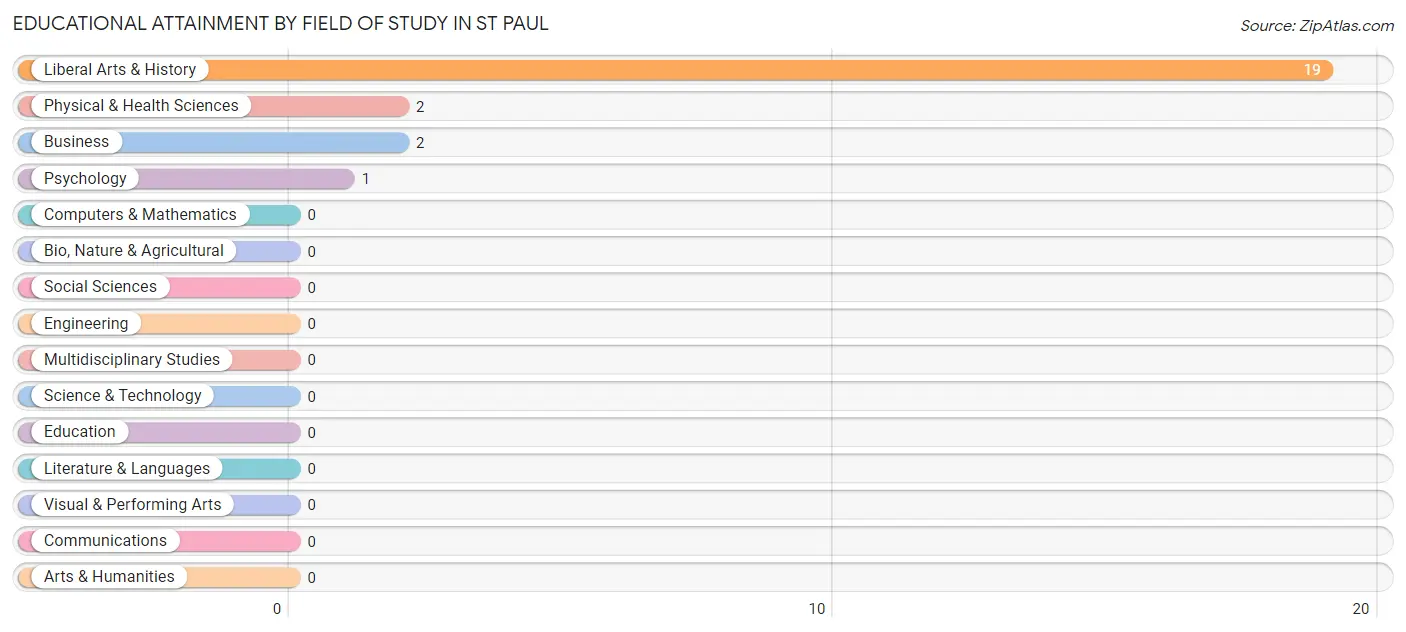
| Field of Study | # Graduates | % Graduates |
| Computers & Mathematics | 0 | 0.0% |
| Bio, Nature & Agricultural | 0 | 0.0% |
| Physical & Health Sciences | 2 | 8.3% |
| Psychology | 1 | 4.2% |
| Social Sciences | 0 | 0.0% |
| Engineering | 0 | 0.0% |
| Multidisciplinary Studies | 0 | 0.0% |
| Science & Technology | 0 | 0.0% |
| Business | 2 | 8.3% |
| Education | 0 | 0.0% |
| Literature & Languages | 0 | 0.0% |
| Liberal Arts & History | 19 | 79.2% |
| Visual & Performing Arts | 0 | 0.0% |
| Communications | 0 | 0.0% |
| Arts & Humanities | 0 | 0.0% |
| Total | 24 | 100.0% |
Transportation & Commute in St Paul
Vehicle Availability by Sex in St Paul
The most prevalent vehicle ownership categories in St Paul are males with 1 vehicle (33, accounting for 56.9%) and females with 1 vehicle (17, making up 117.9%).
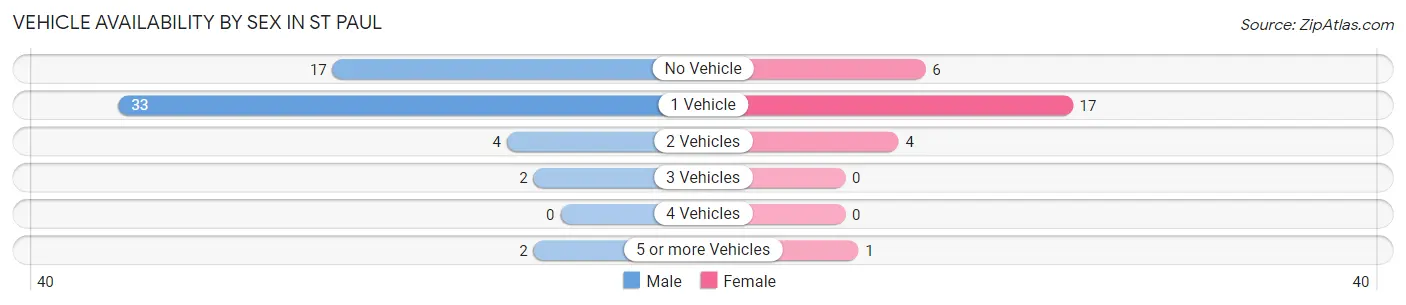
| Vehicles Available | Male | Female |
| No Vehicle | 17 (29.3%) | 6 (21.4%) |
| 1 Vehicle | 33 (56.9%) | 17 (60.7%) |
| 2 Vehicles | 4 (6.9%) | 4 (14.3%) |
| 3 Vehicles | 2 (3.5%) | 0 (0.0%) |
| 4 Vehicles | 0 (0.0%) | 0 (0.0%) |
| 5 or more Vehicles | 2 (3.5%) | 1 (3.6%) |
| Total | 58 (100.0%) | 28 (100.0%) |
Commute Time in St Paul
The most frequently occuring commute durations in St Paul are 5 to 9 minutes (60 commuters, 56.1%), less than 5 minutes (35 commuters, 32.7%), and 10 to 14 minutes (10 commuters, 9.3%).
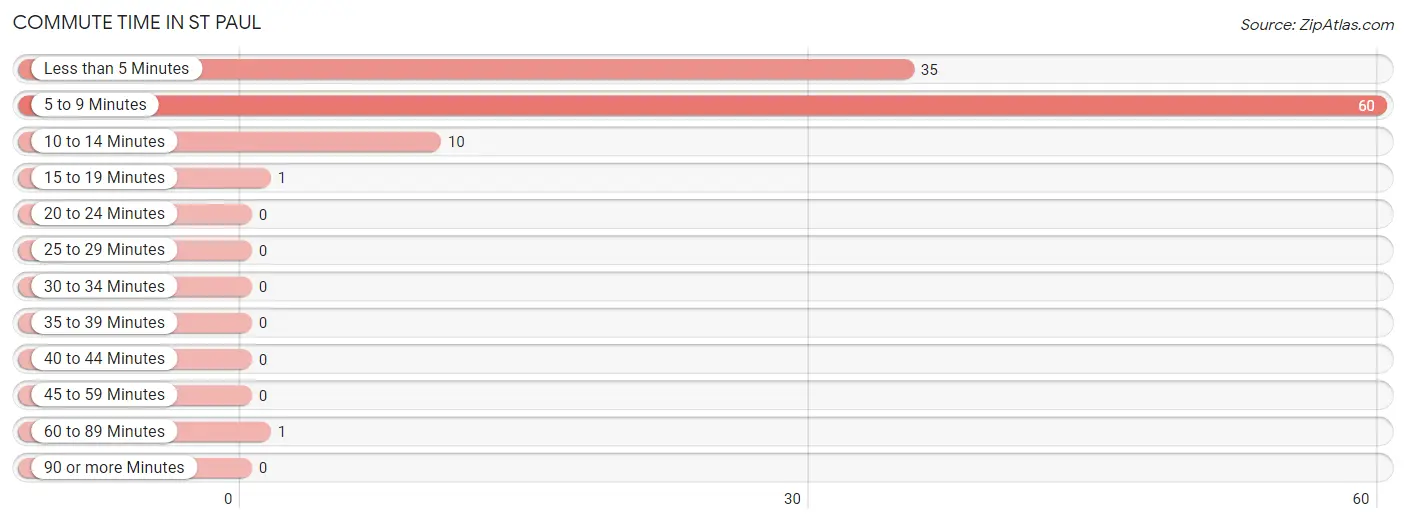
| Commute Time | # Commuters | % Commuters |
| Less than 5 Minutes | 35 | 32.7% |
| 5 to 9 Minutes | 60 | 56.1% |
| 10 to 14 Minutes | 10 | 9.3% |
| 15 to 19 Minutes | 1 | 0.9% |
| 20 to 24 Minutes | 0 | 0.0% |
| 25 to 29 Minutes | 0 | 0.0% |
| 30 to 34 Minutes | 0 | 0.0% |
| 35 to 39 Minutes | 0 | 0.0% |
| 40 to 44 Minutes | 0 | 0.0% |
| 45 to 59 Minutes | 0 | 0.0% |
| 60 to 89 Minutes | 1 | 0.9% |
| 90 or more Minutes | 0 | 0.0% |
Commute Time by Sex in St Paul
The most common commute times in St Paul are 5 to 9 minutes (51 commuters, 62.2%) for males and less than 5 minutes (16 commuters, 64.0%) for females.
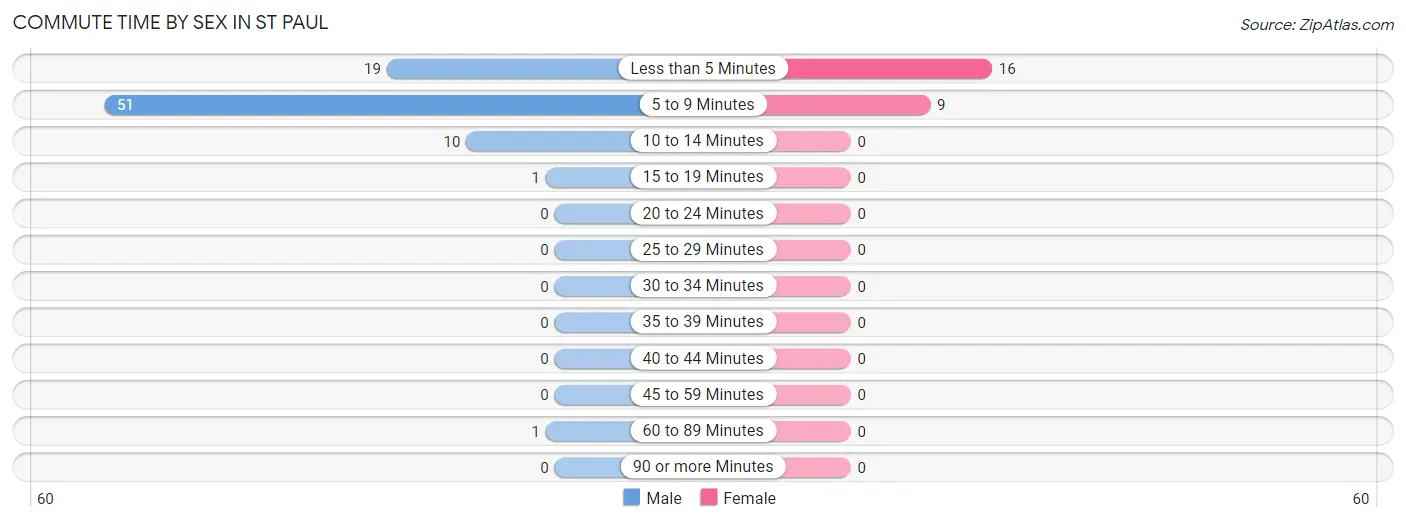
| Commute Time | Male | Female |
| Less than 5 Minutes | 19 (23.2%) | 16 (64.0%) |
| 5 to 9 Minutes | 51 (62.2%) | 9 (36.0%) |
| 10 to 14 Minutes | 10 (12.2%) | 0 (0.0%) |
| 15 to 19 Minutes | 1 (1.2%) | 0 (0.0%) |
| 20 to 24 Minutes | 0 (0.0%) | 0 (0.0%) |
| 25 to 29 Minutes | 0 (0.0%) | 0 (0.0%) |
| 30 to 34 Minutes | 0 (0.0%) | 0 (0.0%) |
| 35 to 39 Minutes | 0 (0.0%) | 0 (0.0%) |
| 40 to 44 Minutes | 0 (0.0%) | 0 (0.0%) |
| 45 to 59 Minutes | 0 (0.0%) | 0 (0.0%) |
| 60 to 89 Minutes | 1 (1.2%) | 0 (0.0%) |
| 90 or more Minutes | 0 (0.0%) | 0 (0.0%) |
Time of Departure to Work by Sex in St Paul
The most frequent times of departure to work in St Paul are 8:00 AM to 8:29 AM (30, 36.6%) for males and 7:30 AM to 7:59 AM (9, 36.0%) for females.
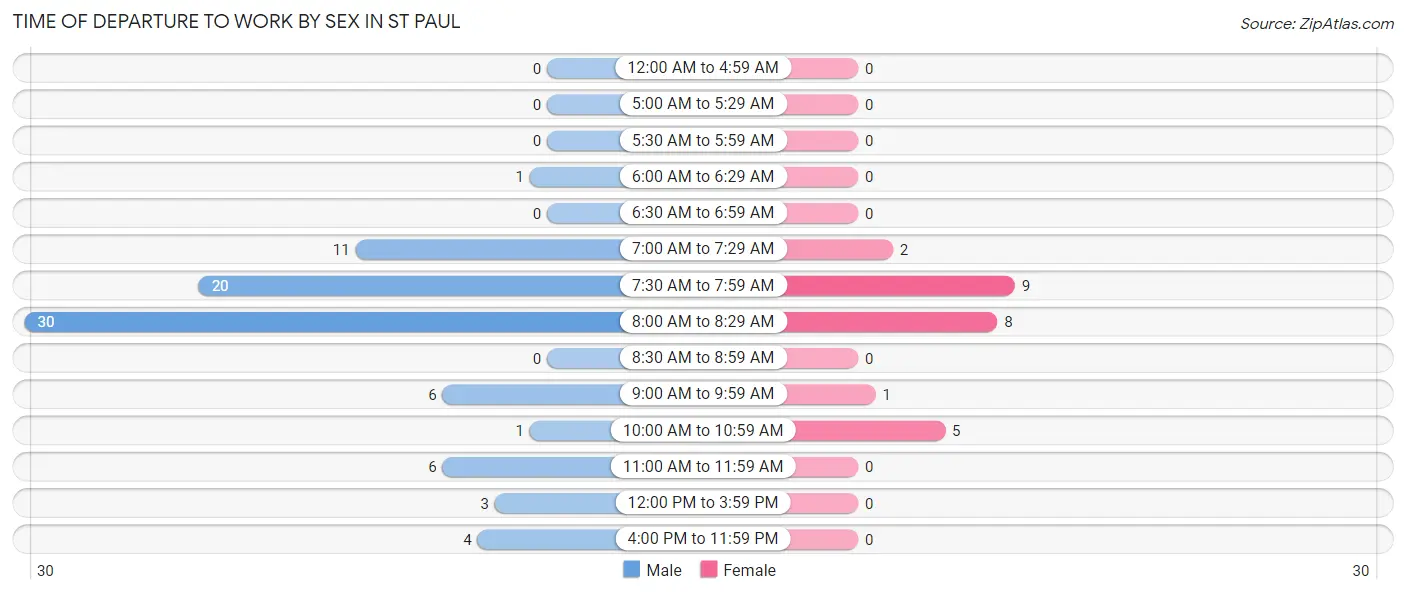
| Time of Departure | Male | Female |
| 12:00 AM to 4:59 AM | 0 (0.0%) | 0 (0.0%) |
| 5:00 AM to 5:29 AM | 0 (0.0%) | 0 (0.0%) |
| 5:30 AM to 5:59 AM | 0 (0.0%) | 0 (0.0%) |
| 6:00 AM to 6:29 AM | 1 (1.2%) | 0 (0.0%) |
| 6:30 AM to 6:59 AM | 0 (0.0%) | 0 (0.0%) |
| 7:00 AM to 7:29 AM | 11 (13.4%) | 2 (8.0%) |
| 7:30 AM to 7:59 AM | 20 (24.4%) | 9 (36.0%) |
| 8:00 AM to 8:29 AM | 30 (36.6%) | 8 (32.0%) |
| 8:30 AM to 8:59 AM | 0 (0.0%) | 0 (0.0%) |
| 9:00 AM to 9:59 AM | 6 (7.3%) | 1 (4.0%) |
| 10:00 AM to 10:59 AM | 1 (1.2%) | 5 (20.0%) |
| 11:00 AM to 11:59 AM | 6 (7.3%) | 0 (0.0%) |
| 12:00 PM to 3:59 PM | 3 (3.7%) | 0 (0.0%) |
| 4:00 PM to 11:59 PM | 4 (4.9%) | 0 (0.0%) |
| Total | 82 (100.0%) | 25 (100.0%) |
Housing Occupancy in St Paul
Occupancy by Ownership in St Paul
Of the total 78 dwellings in St Paul, owner-occupied units account for 50 (64.1%), while renter-occupied units make up 28 (35.9%).
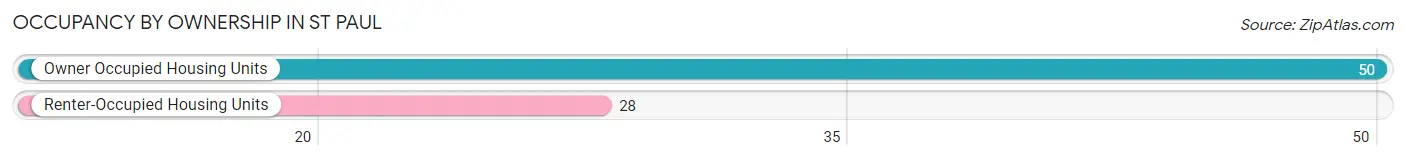
| Occupancy | # Housing Units | % Housing Units |
| Owner Occupied Housing Units | 50 | 64.1% |
| Renter-Occupied Housing Units | 28 | 35.9% |
| Total Occupied Housing Units | 78 | 100.0% |
Occupancy by Household Size in St Paul
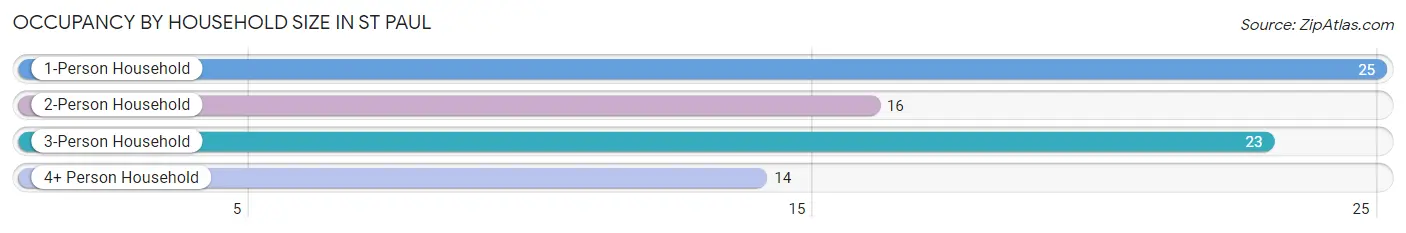
| Household Size | # Housing Units | % Housing Units |
| 1-Person Household | 25 | 32.1% |
| 2-Person Household | 16 | 20.5% |
| 3-Person Household | 23 | 29.5% |
| 4+ Person Household | 14 | 17.9% |
| Total Housing Units | 78 | 100.0% |
Occupancy by Ownership by Household Size in St Paul
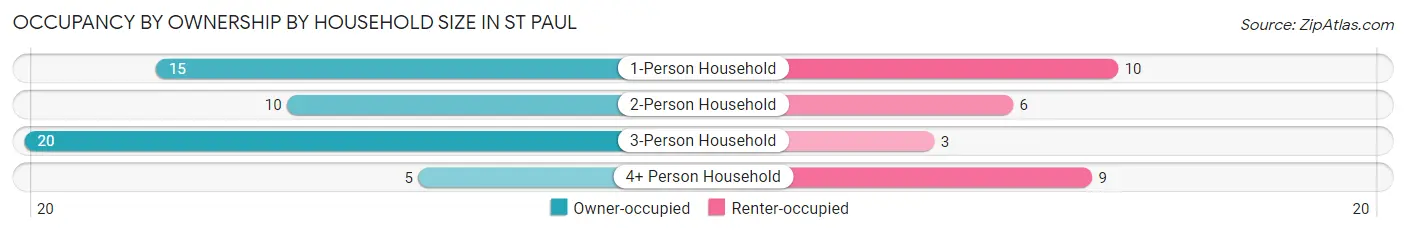
| Household Size | Owner-occupied | Renter-occupied |
| 1-Person Household | 15 (60.0%) | 10 (40.0%) |
| 2-Person Household | 10 (62.5%) | 6 (37.5%) |
| 3-Person Household | 20 (87.0%) | 3 (13.0%) |
| 4+ Person Household | 5 (35.7%) | 9 (64.3%) |
| Total Housing Units | 50 (64.1%) | 28 (35.9%) |
Occupancy by Educational Attainment in St Paul
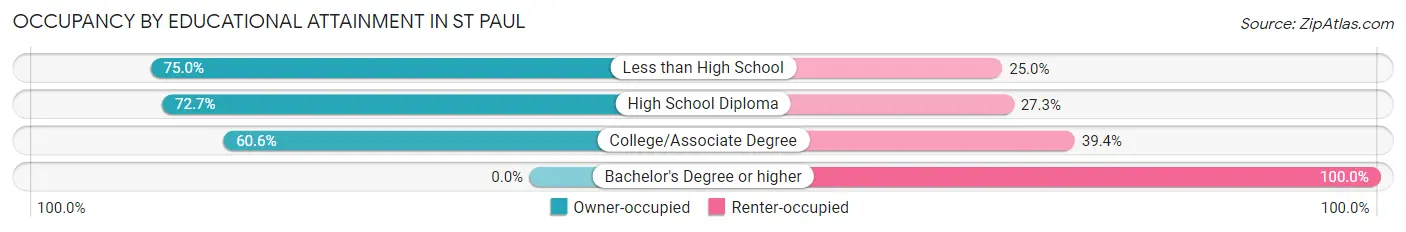
| Household Size | Owner-occupied | Renter-occupied |
| Less than High School | 6 (75.0%) | 2 (25.0%) |
| High School Diploma | 24 (72.7%) | 9 (27.3%) |
| College/Associate Degree | 20 (60.6%) | 13 (39.4%) |
| Bachelor's Degree or higher | 0 (0.0%) | 4 (100.0%) |
Occupancy by Age of Householder in St Paul
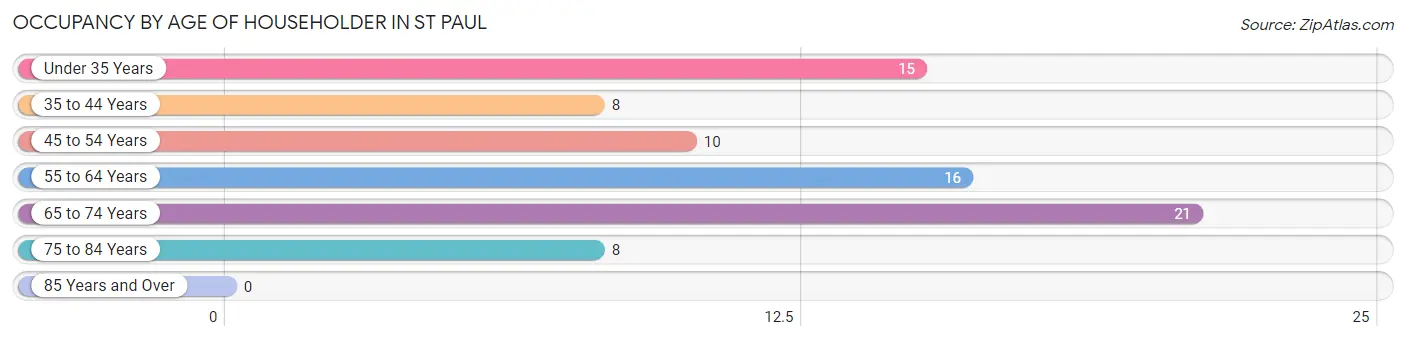
| Age Bracket | # Households | % Households |
| Under 35 Years | 15 | 19.2% |
| 35 to 44 Years | 8 | 10.3% |
| 45 to 54 Years | 10 | 12.8% |
| 55 to 64 Years | 16 | 20.5% |
| 65 to 74 Years | 21 | 26.9% |
| 75 to 84 Years | 8 | 10.3% |
| 85 Years and Over | 0 | 0.0% |
| Total | 78 | 100.0% |
Housing Finances in St Paul
Median Income by Occupancy in St Paul
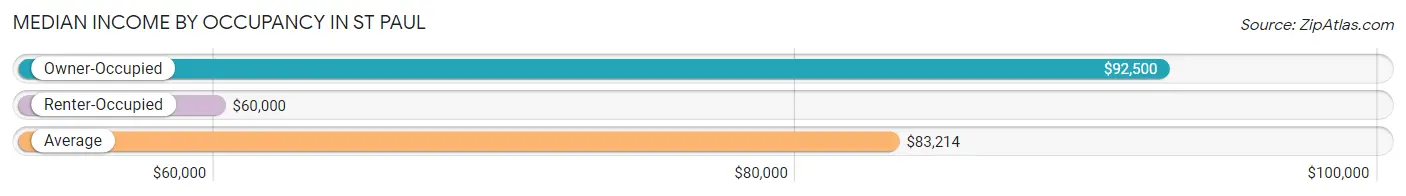
| Occupancy Type | # Households | Median Income |
| Owner-Occupied | 50 (64.1%) | $92,500 |
| Renter-Occupied | 28 (35.9%) | $60,000 |
| Average | 78 (100.0%) | $83,214 |
Occupancy by Householder Income Bracket in St Paul
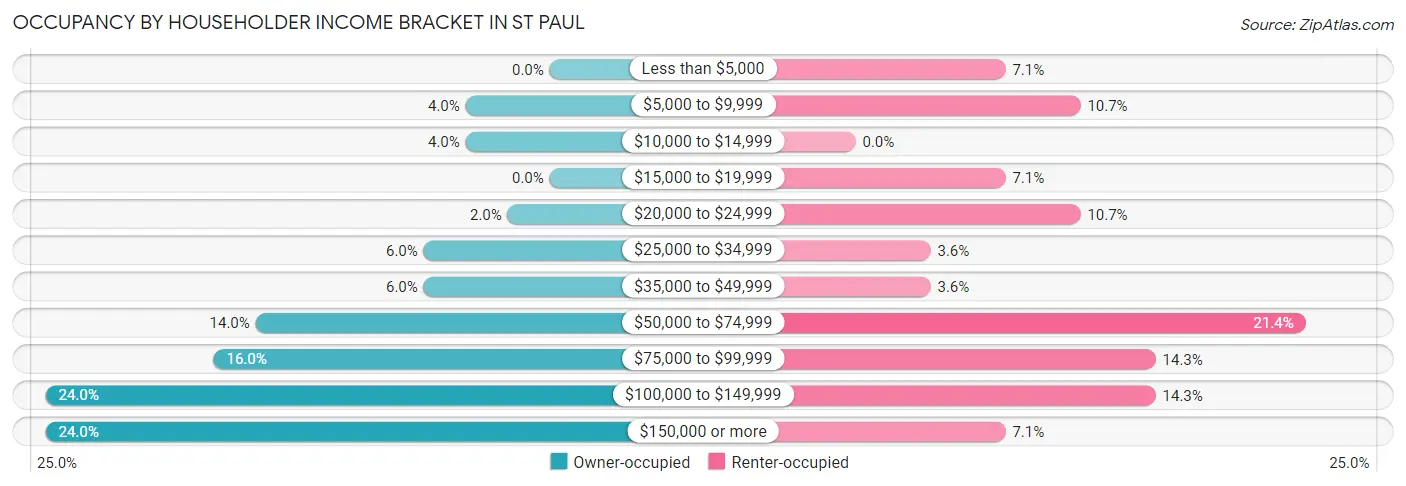
| Income Bracket | Owner-occupied | Renter-occupied |
| Less than $5,000 | 0 (0.0%) | 2 (7.1%) |
| $5,000 to $9,999 | 2 (4.0%) | 3 (10.7%) |
| $10,000 to $14,999 | 2 (4.0%) | 0 (0.0%) |
| $15,000 to $19,999 | 0 (0.0%) | 2 (7.1%) |
| $20,000 to $24,999 | 1 (2.0%) | 3 (10.7%) |
| $25,000 to $34,999 | 3 (6.0%) | 1 (3.6%) |
| $35,000 to $49,999 | 3 (6.0%) | 1 (3.6%) |
| $50,000 to $74,999 | 7 (14.0%) | 6 (21.4%) |
| $75,000 to $99,999 | 8 (16.0%) | 4 (14.3%) |
| $100,000 to $149,999 | 12 (24.0%) | 4 (14.3%) |
| $150,000 or more | 12 (24.0%) | 2 (7.1%) |
| Total | 50 (100.0%) | 28 (100.0%) |
Monthly Housing Cost Tiers in St Paul
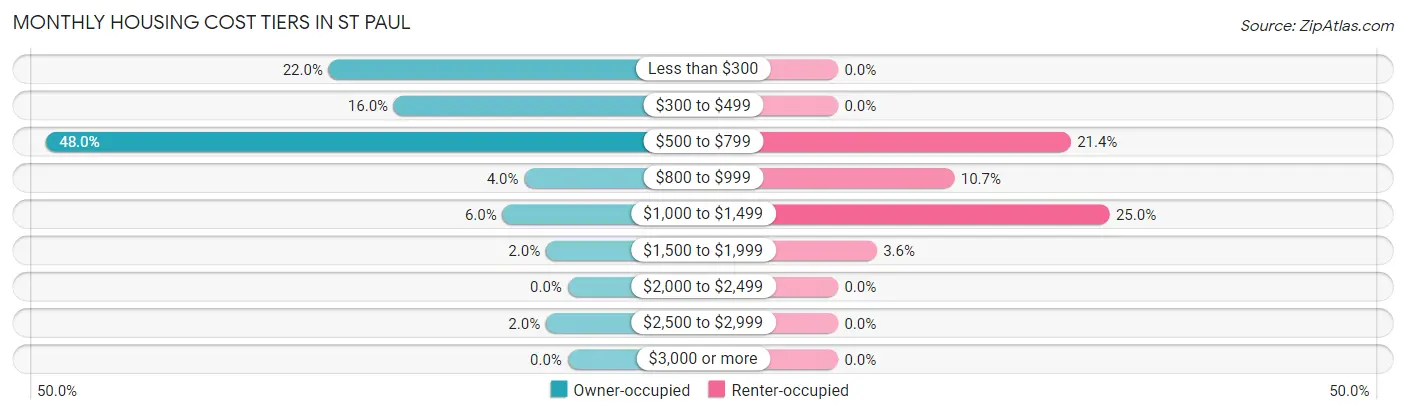
| Monthly Cost | Owner-occupied | Renter-occupied |
| Less than $300 | 11 (22.0%) | 0 (0.0%) |
| $300 to $499 | 8 (16.0%) | 0 (0.0%) |
| $500 to $799 | 24 (48.0%) | 6 (21.4%) |
| $800 to $999 | 2 (4.0%) | 3 (10.7%) |
| $1,000 to $1,499 | 3 (6.0%) | 7 (25.0%) |
| $1,500 to $1,999 | 1 (2.0%) | 1 (3.6%) |
| $2,000 to $2,499 | 0 (0.0%) | 0 (0.0%) |
| $2,500 to $2,999 | 1 (2.0%) | 0 (0.0%) |
| $3,000 or more | 0 (0.0%) | 0 (0.0%) |
| Total | 50 (100.0%) | 28 (100.0%) |
Physical Housing Characteristics in St Paul
Housing Structures in St Paul
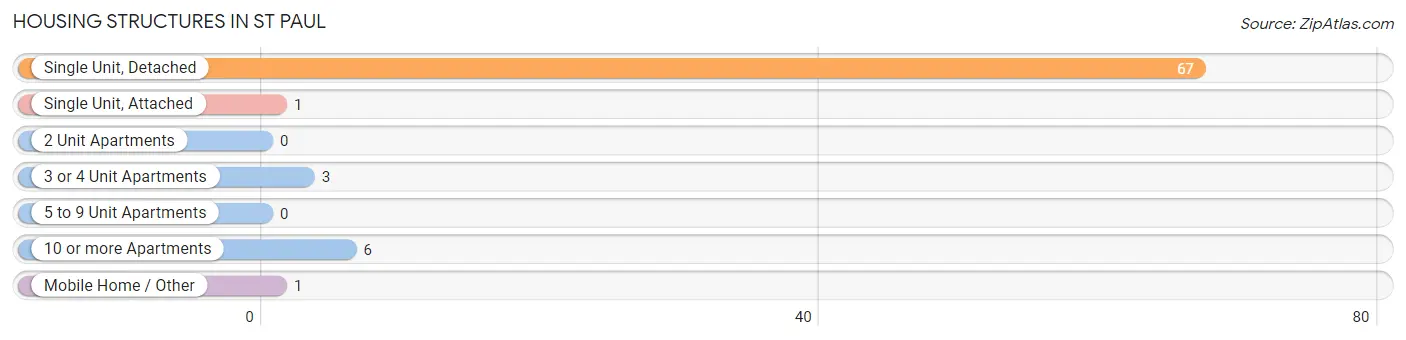
| Structure Type | # Housing Units | % Housing Units |
| Single Unit, Detached | 67 | 85.9% |
| Single Unit, Attached | 1 | 1.3% |
| 2 Unit Apartments | 0 | 0.0% |
| 3 or 4 Unit Apartments | 3 | 3.8% |
| 5 to 9 Unit Apartments | 0 | 0.0% |
| 10 or more Apartments | 6 | 7.7% |
| Mobile Home / Other | 1 | 1.3% |
| Total | 78 | 100.0% |
Housing Structures by Occupancy in St Paul
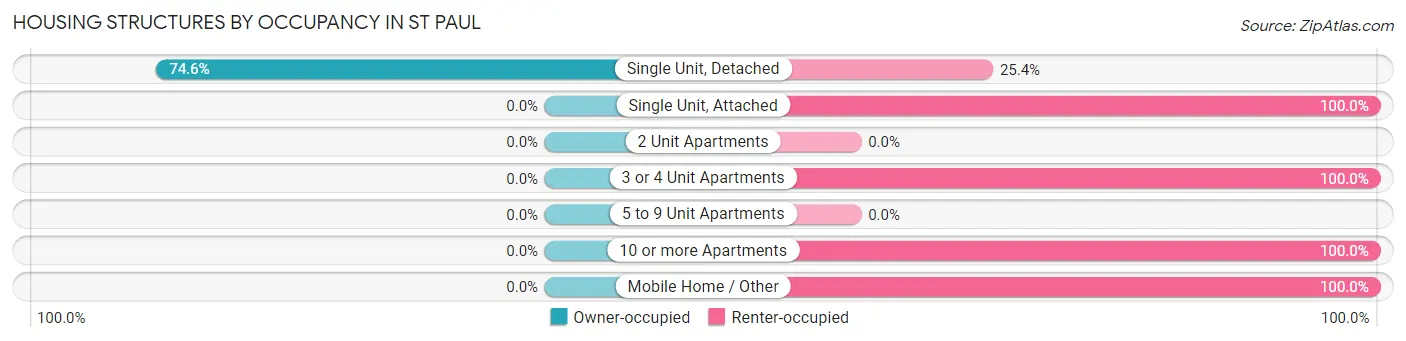
| Structure Type | Owner-occupied | Renter-occupied |
| Single Unit, Detached | 50 (74.6%) | 17 (25.4%) |
| Single Unit, Attached | 0 (0.0%) | 1 (100.0%) |
| 2 Unit Apartments | 0 (0.0%) | 0 (0.0%) |
| 3 or 4 Unit Apartments | 0 (0.0%) | 3 (100.0%) |
| 5 to 9 Unit Apartments | 0 (0.0%) | 0 (0.0%) |
| 10 or more Apartments | 0 (0.0%) | 6 (100.0%) |
| Mobile Home / Other | 0 (0.0%) | 1 (100.0%) |
| Total | 50 (64.1%) | 28 (35.9%) |
Housing Structures by Number of Rooms in St Paul
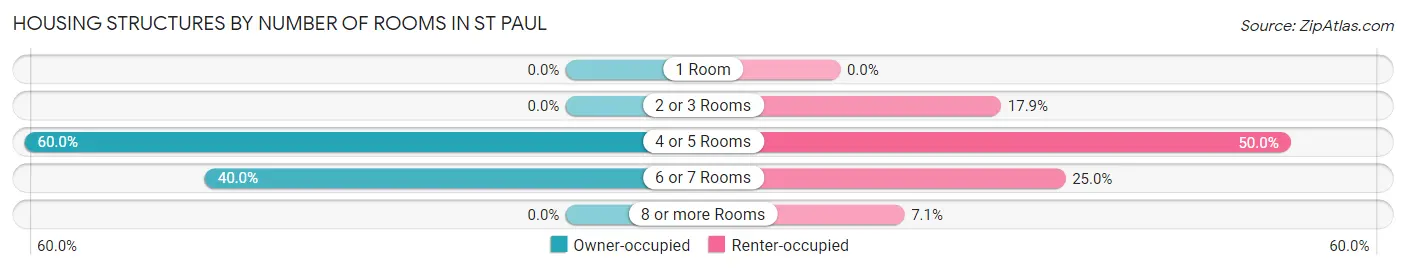
| Number of Rooms | Owner-occupied | Renter-occupied |
| 1 Room | 0 (0.0%) | 0 (0.0%) |
| 2 or 3 Rooms | 0 (0.0%) | 5 (17.9%) |
| 4 or 5 Rooms | 30 (60.0%) | 14 (50.0%) |
| 6 or 7 Rooms | 20 (40.0%) | 7 (25.0%) |
| 8 or more Rooms | 0 (0.0%) | 2 (7.1%) |
| Total | 50 (100.0%) | 28 (100.0%) |
Housing Structure by Heating Type in St Paul
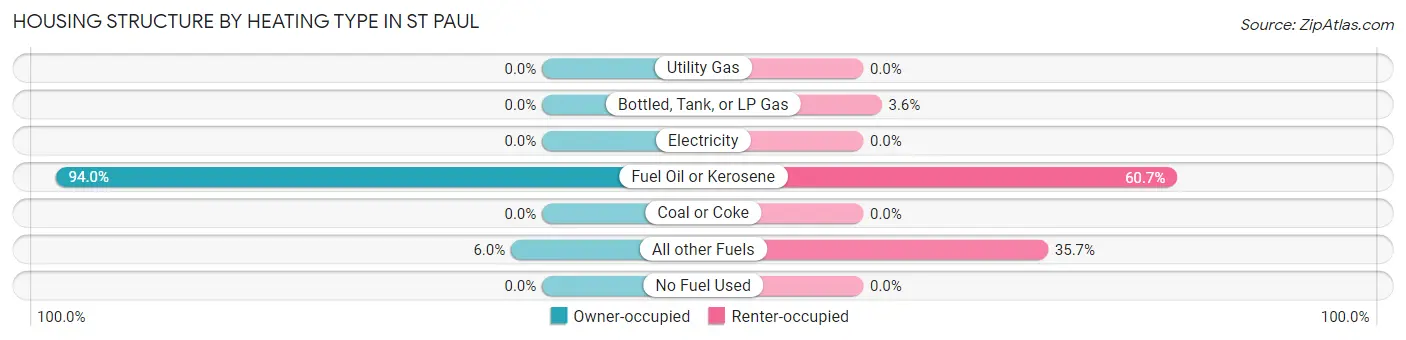
| Heating Type | Owner-occupied | Renter-occupied |
| Utility Gas | 0 (0.0%) | 0 (0.0%) |
| Bottled, Tank, or LP Gas | 0 (0.0%) | 1 (3.6%) |
| Electricity | 0 (0.0%) | 0 (0.0%) |
| Fuel Oil or Kerosene | 47 (94.0%) | 17 (60.7%) |
| Coal or Coke | 0 (0.0%) | 0 (0.0%) |
| All other Fuels | 3 (6.0%) | 10 (35.7%) |
| No Fuel Used | 0 (0.0%) | 0 (0.0%) |
| Total | 50 (100.0%) | 28 (100.0%) |
Household Vehicle Usage in St Paul
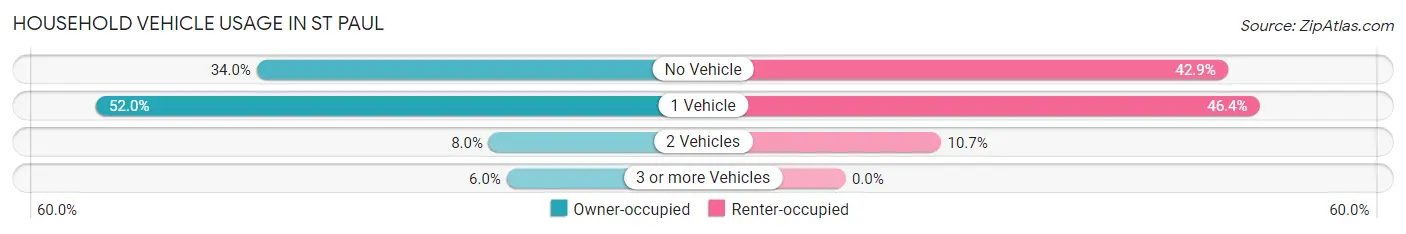
| Vehicles per Household | Owner-occupied | Renter-occupied |
| No Vehicle | 17 (34.0%) | 12 (42.9%) |
| 1 Vehicle | 26 (52.0%) | 13 (46.4%) |
| 2 Vehicles | 4 (8.0%) | 3 (10.7%) |
| 3 or more Vehicles | 3 (6.0%) | 0 (0.0%) |
| Total | 50 (100.0%) | 28 (100.0%) |
Real Estate & Mortgages in St Paul
Real Estate and Mortgage Overview in St Paul
| Characteristic | Without Mortgage | With Mortgage |
| Housing Units | 43 | 7 |
| Median Property Value | $99,200 | $0 |
| Median Household Income | $100,625 | $1 |
| Monthly Housing Costs | $610 | $0 |
| Real Estate Taxes | - | - |
Property Value by Mortgage Status in St Paul
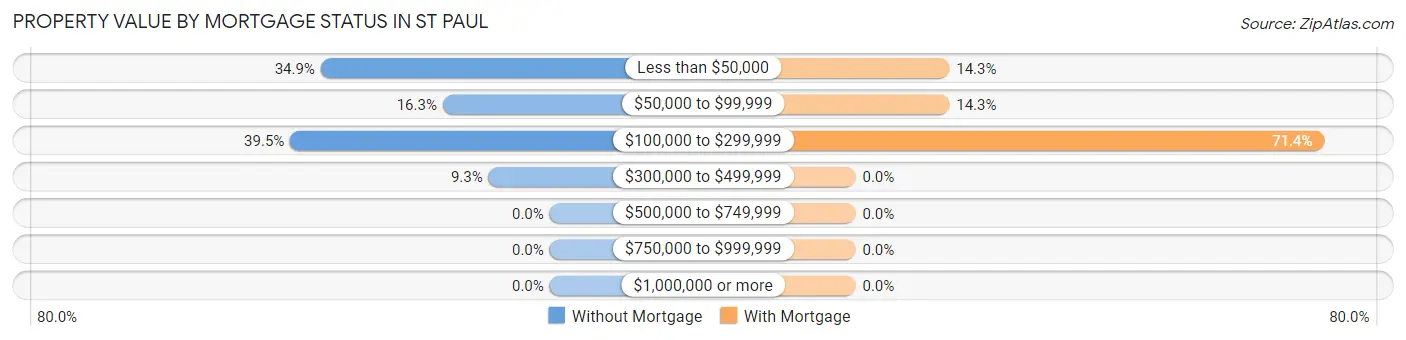
| Property Value | Without Mortgage | With Mortgage |
| Less than $50,000 | 15 (34.9%) | 1 (14.3%) |
| $50,000 to $99,999 | 7 (16.3%) | 1 (14.3%) |
| $100,000 to $299,999 | 17 (39.5%) | 5 (71.4%) |
| $300,000 to $499,999 | 4 (9.3%) | 0 (0.0%) |
| $500,000 to $749,999 | 0 (0.0%) | 0 (0.0%) |
| $750,000 to $999,999 | 0 (0.0%) | 0 (0.0%) |
| $1,000,000 or more | 0 (0.0%) | 0 (0.0%) |
| Total | 43 (100.0%) | 7 (100.0%) |
Household Income by Mortgage Status in St Paul
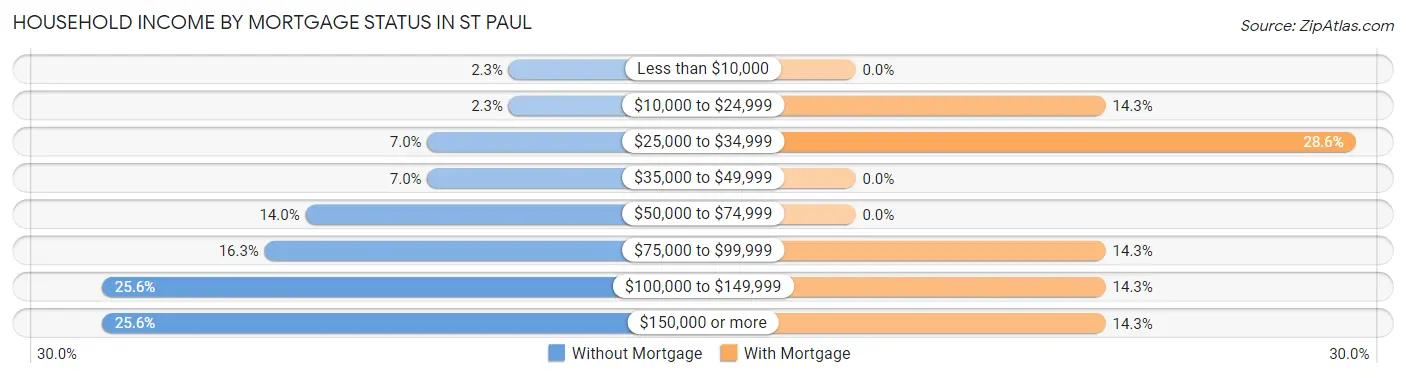
| Household Income | Without Mortgage | With Mortgage |
| Less than $10,000 | 1 (2.3%) | 0 (0.0%) |
| $10,000 to $24,999 | 1 (2.3%) | 1 (14.3%) |
| $25,000 to $34,999 | 3 (7.0%) | 2 (28.6%) |
| $35,000 to $49,999 | 3 (7.0%) | 0 (0.0%) |
| $50,000 to $74,999 | 6 (14.0%) | 0 (0.0%) |
| $75,000 to $99,999 | 7 (16.3%) | 1 (14.3%) |
| $100,000 to $149,999 | 11 (25.6%) | 1 (14.3%) |
| $150,000 or more | 11 (25.6%) | 1 (14.3%) |
| Total | 43 (100.0%) | 7 (100.0%) |
Property Value to Household Income Ratio in St Paul
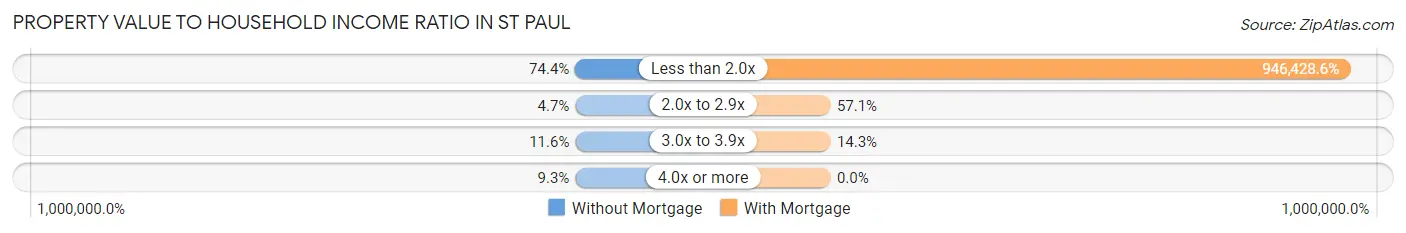
| Value-to-Income Ratio | Without Mortgage | With Mortgage |
| Less than 2.0x | 32 (74.4%) | 66,250 (946,428.6%) |
| 2.0x to 2.9x | 2 (4.6%) | 4 (57.1%) |
| 3.0x to 3.9x | 5 (11.6%) | 1 (14.3%) |
| 4.0x or more | 4 (9.3%) | 0 (0.0%) |
| Total | 43 (100.0%) | 7 (100.0%) |
Real Estate Taxes by Mortgage Status in St Paul
| Property Taxes | Without Mortgage | With Mortgage |
| Less than $800 | 0 (0.0%) | 0 (0.0%) |
| $800 to $1,499 | 0 (0.0%) | 0 (0.0%) |
| $800 to $1,499 | 0 (0.0%) | 0 (0.0%) |
| Total | 43 (100.0%) | 7 (100.0%) |
Health & Disability in St Paul
Health Insurance Coverage by Age in St Paul
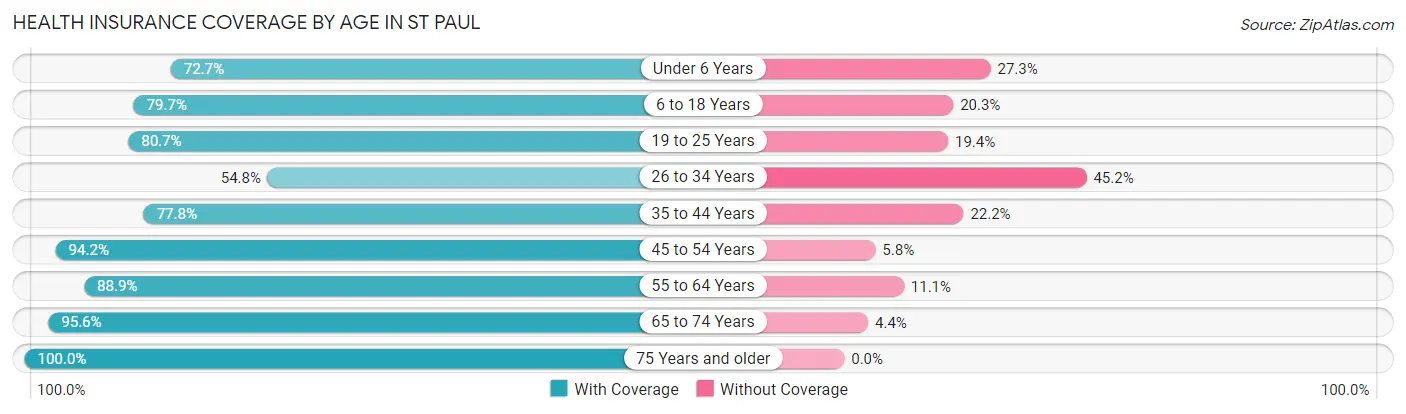
| Age Bracket | With Coverage | Without Coverage |
| Under 6 Years | 16 (72.7%) | 6 (27.3%) |
| 6 to 18 Years | 51 (79.7%) | 13 (20.3%) |
| 19 to 25 Years | 25 (80.6%) | 6 (19.4%) |
| 26 to 34 Years | 17 (54.8%) | 14 (45.2%) |
| 35 to 44 Years | 14 (77.8%) | 4 (22.2%) |
| 45 to 54 Years | 65 (94.2%) | 4 (5.8%) |
| 55 to 64 Years | 32 (88.9%) | 4 (11.1%) |
| 65 to 74 Years | 43 (95.6%) | 2 (4.4%) |
| 75 Years and older | 8 (100.0%) | 0 (0.0%) |
| Total | 271 (83.6%) | 53 (16.4%) |
Health Insurance Coverage by Citizenship Status in St Paul
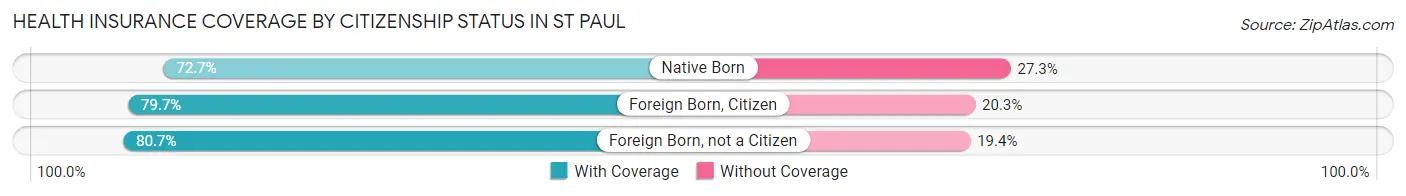
| Citizenship Status | With Coverage | Without Coverage |
| Native Born | 16 (72.7%) | 6 (27.3%) |
| Foreign Born, Citizen | 51 (79.7%) | 13 (20.3%) |
| Foreign Born, not a Citizen | 25 (80.6%) | 6 (19.4%) |
Health Insurance Coverage by Household Income in St Paul
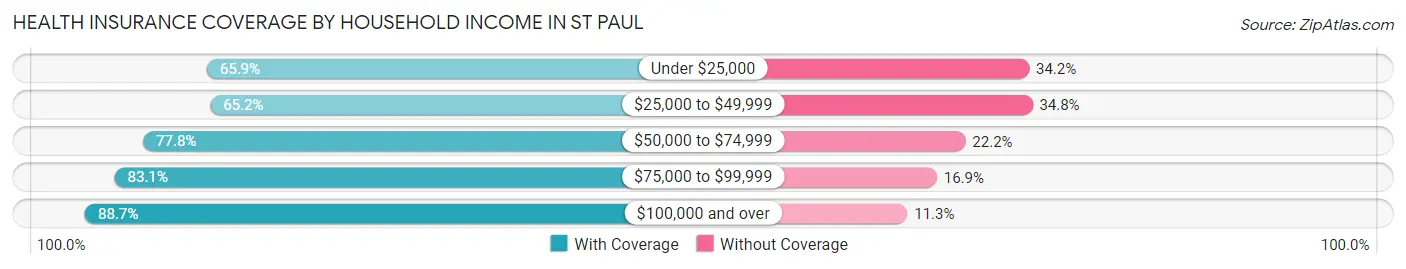
| Household Income | With Coverage | Without Coverage |
| Under $25,000 | 27 (65.8%) | 14 (34.2%) |
| $25,000 to $49,999 | 15 (65.2%) | 8 (34.8%) |
| $50,000 to $74,999 | 21 (77.8%) | 6 (22.2%) |
| $75,000 to $99,999 | 69 (83.1%) | 14 (16.9%) |
| $100,000 and over | 86 (88.7%) | 11 (11.3%) |
Public vs Private Health Insurance Coverage by Age in St Paul
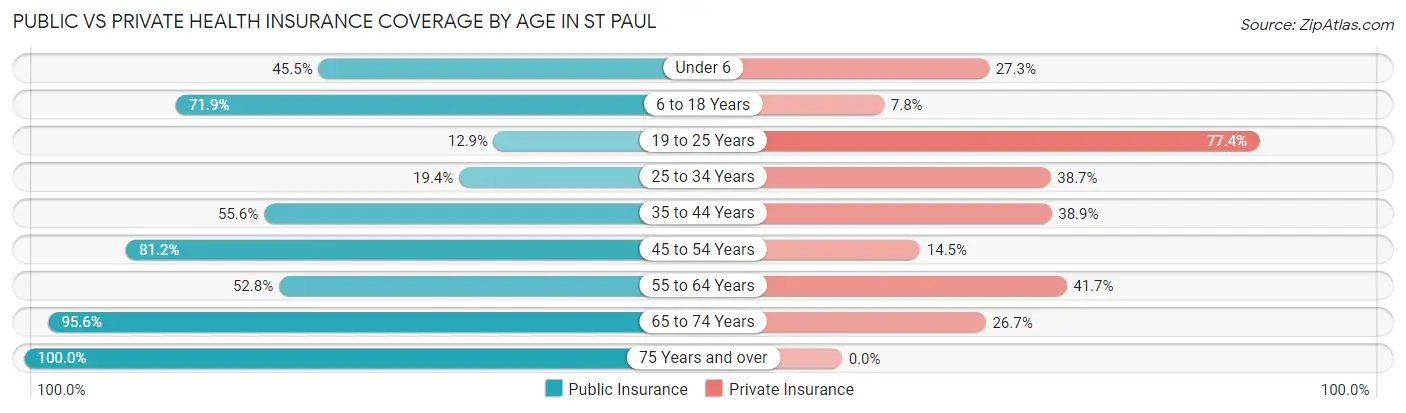
| Age Bracket | Public Insurance | Private Insurance |
| Under 6 | 10 (45.5%) | 6 (27.3%) |
| 6 to 18 Years | 46 (71.9%) | 5 (7.8%) |
| 19 to 25 Years | 4 (12.9%) | 24 (77.4%) |
| 25 to 34 Years | 6 (19.4%) | 12 (38.7%) |
| 35 to 44 Years | 10 (55.6%) | 7 (38.9%) |
| 45 to 54 Years | 56 (81.2%) | 10 (14.5%) |
| 55 to 64 Years | 19 (52.8%) | 15 (41.7%) |
| 65 to 74 Years | 43 (95.6%) | 12 (26.7%) |
| 75 Years and over | 8 (100.0%) | 0 (0.0%) |
| Total | 202 (62.4%) | 91 (28.1%) |
Disability Status by Sex by Age in St Paul
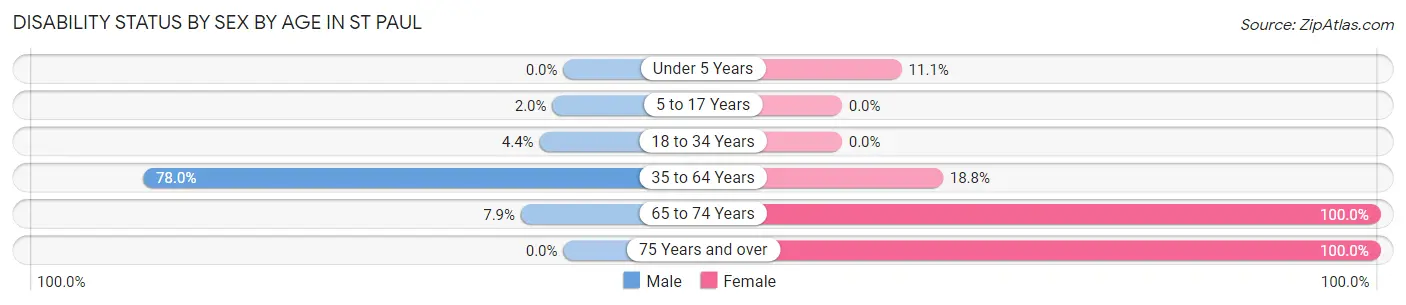
| Age Bracket | Male | Female |
| Under 5 Years | 0 (0.0%) | 1 (11.1%) |
| 5 to 17 Years | 1 (2.0%) | 0 (0.0%) |
| 18 to 34 Years | 2 (4.4%) | 0 (0.0%) |
| 35 to 64 Years | 71 (78.0%) | 6 (18.8%) |
| 65 to 74 Years | 3 (7.9%) | 7 (100.0%) |
| 75 Years and over | 0 (0.0%) | 8 (100.0%) |
Disability Class by Sex by Age in St Paul
Disability Class: Hearing Difficulty
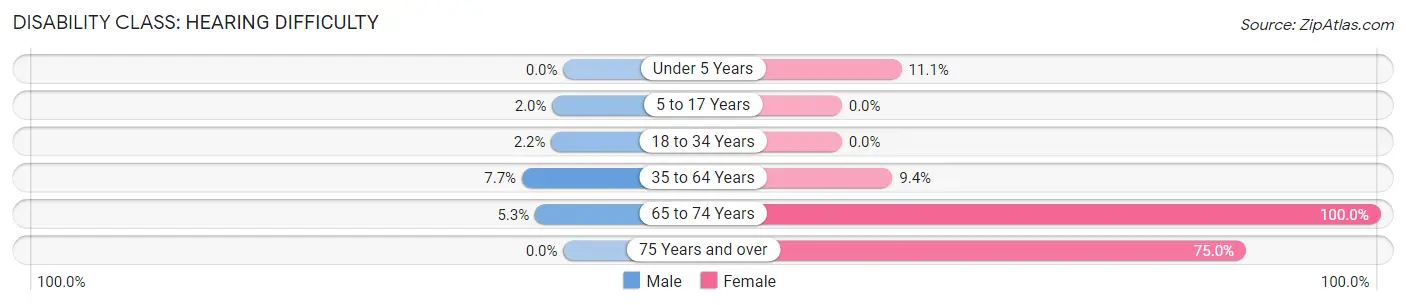
| Age Bracket | Male | Female |
| Under 5 Years | 0 (0.0%) | 1 (11.1%) |
| 5 to 17 Years | 1 (2.0%) | 0 (0.0%) |
| 18 to 34 Years | 1 (2.2%) | 0 (0.0%) |
| 35 to 64 Years | 7 (7.7%) | 3 (9.4%) |
| 65 to 74 Years | 2 (5.3%) | 7 (100.0%) |
| 75 Years and over | 0 (0.0%) | 6 (75.0%) |
Disability Class: Vision Difficulty
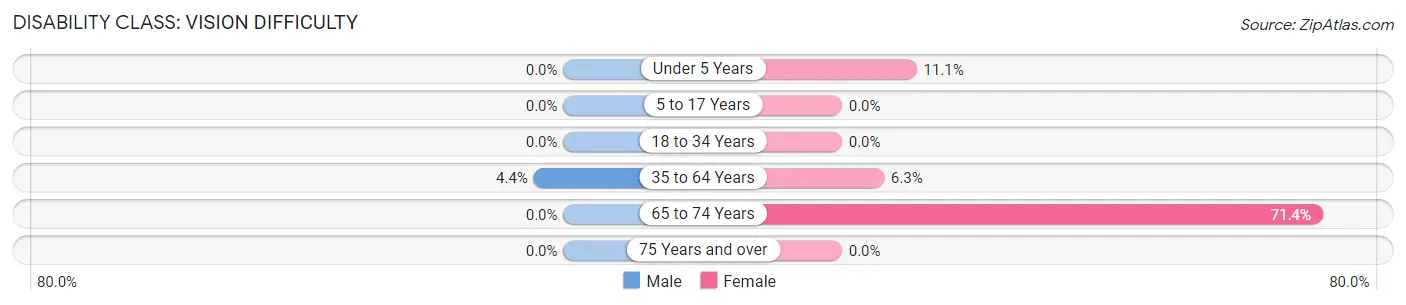
| Age Bracket | Male | Female |
| Under 5 Years | 0 (0.0%) | 1 (11.1%) |
| 5 to 17 Years | 0 (0.0%) | 0 (0.0%) |
| 18 to 34 Years | 0 (0.0%) | 0 (0.0%) |
| 35 to 64 Years | 4 (4.4%) | 2 (6.2%) |
| 65 to 74 Years | 0 (0.0%) | 5 (71.4%) |
| 75 Years and over | 0 (0.0%) | 0 (0.0%) |
Disability Class: Cognitive Difficulty
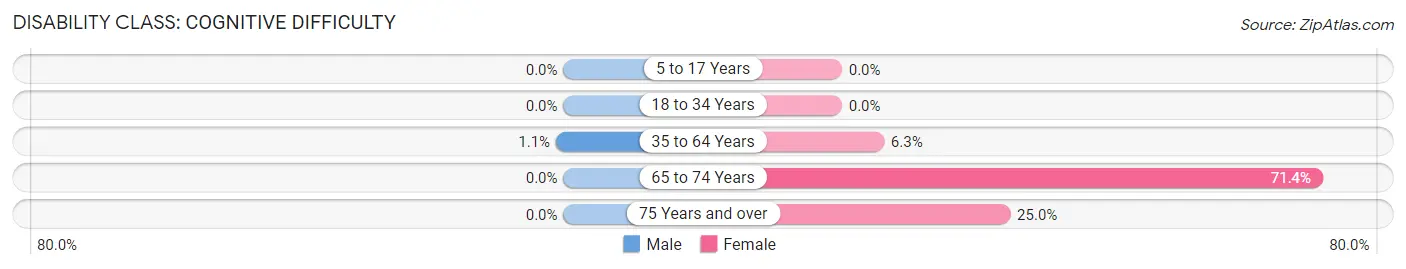
| Age Bracket | Male | Female |
| 5 to 17 Years | 0 (0.0%) | 0 (0.0%) |
| 18 to 34 Years | 0 (0.0%) | 0 (0.0%) |
| 35 to 64 Years | 1 (1.1%) | 2 (6.2%) |
| 65 to 74 Years | 0 (0.0%) | 5 (71.4%) |
| 75 Years and over | 0 (0.0%) | 2 (25.0%) |
Disability Class: Ambulatory Difficulty
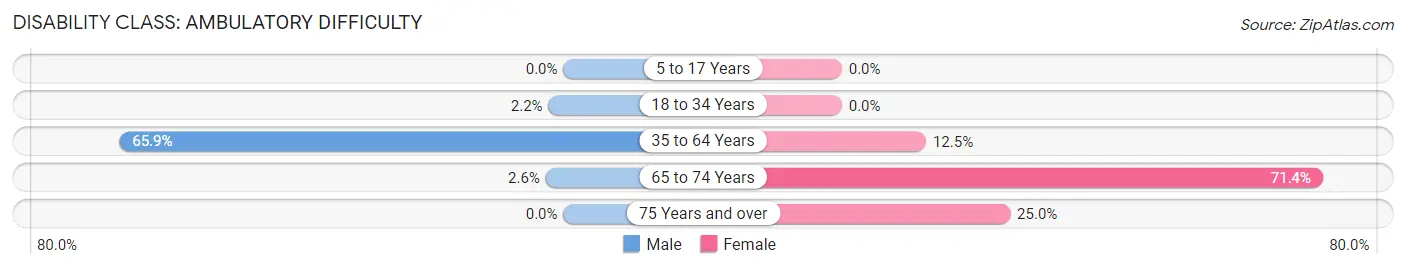
| Age Bracket | Male | Female |
| 5 to 17 Years | 0 (0.0%) | 0 (0.0%) |
| 18 to 34 Years | 1 (2.2%) | 0 (0.0%) |
| 35 to 64 Years | 60 (65.9%) | 4 (12.5%) |
| 65 to 74 Years | 1 (2.6%) | 5 (71.4%) |
| 75 Years and over | 0 (0.0%) | 2 (25.0%) |
Disability Class: Self-Care Difficulty
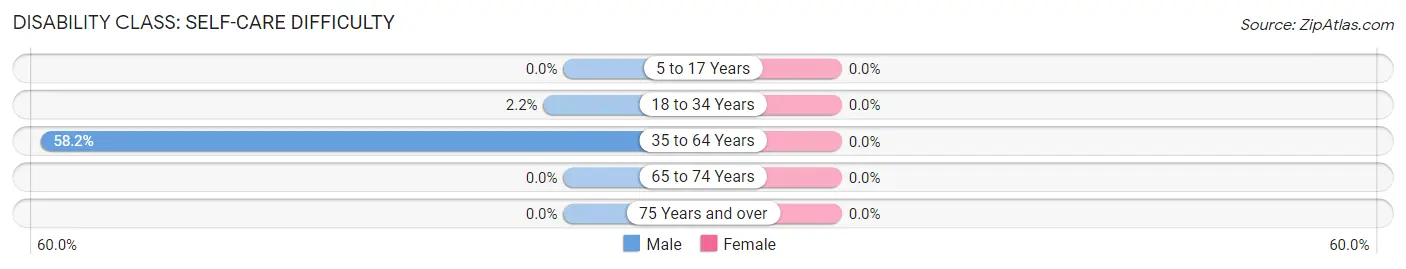
| Age Bracket | Male | Female |
| 5 to 17 Years | 0 (0.0%) | 0 (0.0%) |
| 18 to 34 Years | 1 (2.2%) | 0 (0.0%) |
| 35 to 64 Years | 53 (58.2%) | 0 (0.0%) |
| 65 to 74 Years | 0 (0.0%) | 0 (0.0%) |
| 75 Years and over | 0 (0.0%) | 0 (0.0%) |
Technology Access in St Paul
Computing Device Access in St Paul
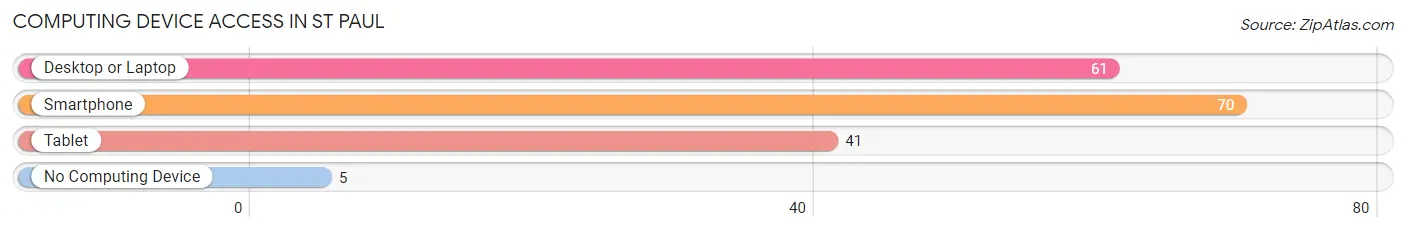
| Device Type | # Households | % Households |
| Desktop or Laptop | 61 | 78.2% |
| Smartphone | 70 | 89.7% |
| Tablet | 41 | 52.6% |
| No Computing Device | 5 | 6.4% |
| Total | 78 | 100.0% |
Internet Access in St Paul
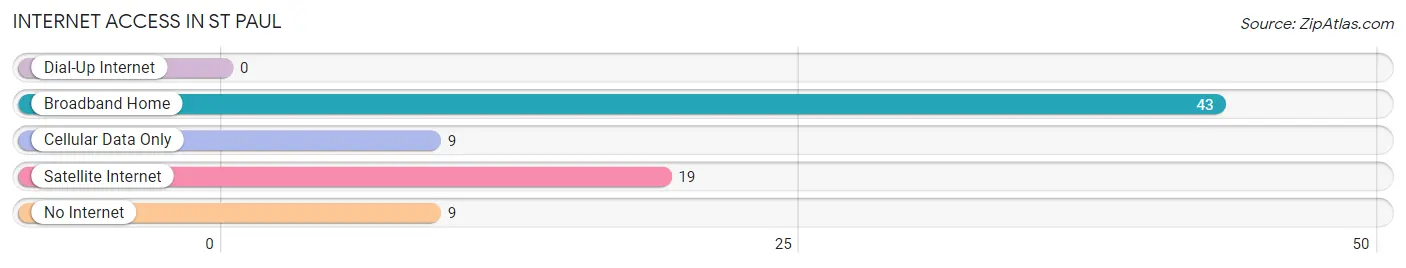
| Internet Type | # Households | % Households |
| Dial-Up Internet | 0 | 0.0% |
| Broadband Home | 43 | 55.1% |
| Cellular Data Only | 9 | 11.5% |
| Satellite Internet | 19 | 24.4% |
| No Internet | 9 | 11.5% |
| Total | 78 | 100.0% |
St Paul Summary
St Paul, Alaska is a small city located on the western side of the Alaska Peninsula, in the Aleutian Islands. It is the only city in the Aleutian Islands and the only incorporated city in the Aleutian East Borough. The city is located on the island of St. Paul, which is the largest of the Pribilof Islands. The city has a population of about 500 people, and is the only city in the Aleutian East Borough.
Geography
St Paul is located on the western side of the Alaska Peninsula, in the Aleutian Islands. It is the only city in the Aleutian Islands and the only incorporated city in the Aleutian East Borough. The city is located on the island of St. Paul, which is the largest of the Pribilof Islands. The island is about 8 miles long and 4 miles wide, and is located about 600 miles southwest of Anchorage. The island is surrounded by the Bering Sea to the north, the Pacific Ocean to the south, and the Aleutian Islands to the east. The island is mostly flat, with some hills and mountains in the center. The highest point on the island is Mount St. Paul, which is about 1,500 feet above sea level.
The climate in St Paul is generally mild, with temperatures ranging from the mid-30s in the winter to the mid-50s in the summer. The city receives an average of about 20 inches of precipitation per year, with most of it falling in the winter months.
Economy
The economy of St Paul is largely based on fishing and tourism. The city is home to a large fishing fleet, which harvests a variety of fish, including salmon, cod, halibut, and crab. The city also has a large tourism industry, with many visitors coming to the island to experience the unique wildlife and scenery.
The city also has a small manufacturing sector, with a few small businesses producing items such as clothing, furniture, and jewelry.
Demographics
As of the 2010 census, the population of St Paul was 476 people. The population is mostly Aleut, with a small number of other ethnicities, including Russian, Filipino, and Hispanic. The median age of the population is 37.5 years, and the median household income is $45,000.
The city is served by the Aleutian East Borough School District, which operates two schools in the city. The schools are St. Paul Elementary School and St. Paul High School.
Conclusion
St Paul, Alaska is a small city located on the western side of the Alaska Peninsula, in the Aleutian Islands. It is the only city in the Aleutian Islands and the only incorporated city in the Aleutian East Borough. The city has a population of about 500 people, and is the only city in the Aleutian East Borough. The economy of St Paul is largely based on fishing and tourism, and the city is home to a large fishing fleet and a large tourism industry. The population is mostly Aleut, with a small number of other ethnicities, and the median age of the population is 37.5 years. The city is served by the Aleutian East Borough School District, which operates two schools in the city.
Common Questions
What is Per Capita Income in St Paul?
Per Capita income in St Paul is $31,903.
What is the Median Family Income in St Paul?
Median Family Income in St Paul is $83,250.
What is the Median Household income in St Paul?
Median Household Income in St Paul is $83,214.
What is Inequality or Gini Index in St Paul?
Inequality or Gini Index in St Paul is 0.38.
What is the Total Population of St Paul?
Total Population of St Paul is 349.
What is the Total Male Population of St Paul?
Total Male Population of St Paul is 257.
What is the Total Female Population of St Paul?
Total Female Population of St Paul is 92.
What is the Ratio of Males per 100 Females in St Paul?
There are 279.35 Males per 100 Females in St Paul.
What is the Ratio of Females per 100 Males in St Paul?
There are 35.80 Females per 100 Males in St Paul.
What is the Median Population Age in St Paul?
Median Population Age in St Paul is 44.0 Years.
What is the Average Family Size in St Paul
Average Family Size in St Paul is 4.4 People.
What is the Average Household Size in St Paul
Average Household Size in St Paul is 3.5 People.
How Large is the Labor Force in St Paul?
There are 137 People in the Labor Forcein in St Paul.
What is the Percentage of People in the Labor Force in St Paul?
50.9% of People are in the Labor Force in St Paul.
What is the Unemployment Rate in St Paul?
Unemployment Rate in St Paul is 2.9%.