Nelson, GA Map & Demographics
Nelson Map
Nelson Overview
$36,291
PER CAPITA INCOME
$89,333
AVG FAMILY INCOME
$66,719
AVG HOUSEHOLD INCOME
50.4%
WAGE / INCOME GAP [ % ]
49.6¢/ $1
WAGE / INCOME GAP [ $ ]
0.41
INEQUALITY / GINI INDEX
946
TOTAL POPULATION
538
MALE POPULATION
408
FEMALE POPULATION
131.86
MALES / 100 FEMALES
75.84
FEMALES / 100 MALES
40.5
MEDIAN AGE
3.3
AVG FAMILY SIZE
2.4
AVG HOUSEHOLD SIZE
498
LABOR FORCE [ PEOPLE ]
66.9%
PERCENT IN LABOR FORCE
2.6%
UNEMPLOYMENT RATE
Income in Nelson
Income Overview in Nelson
Per Capita Income in Nelson is $36,291, while median incomes of families and households are $89,333 and $66,719 respectively.
| Characteristic | Number | Measure |
| Per Capita Income | 946 | $36,291 |
| Median Family Income | 210 | $89,333 |
| Mean Family Income | 210 | $112,441 |
| Median Household Income | 402 | $66,719 |
| Mean Household Income | 402 | $83,143 |
| Income Deficit | 210 | $0 |
| Wage / Income Gap (%) | 946 | 50.40% |
| Wage / Income Gap ($) | 946 | 49.60¢ per $1 |
| Gini / Inequality Index | 946 | 0.41 |
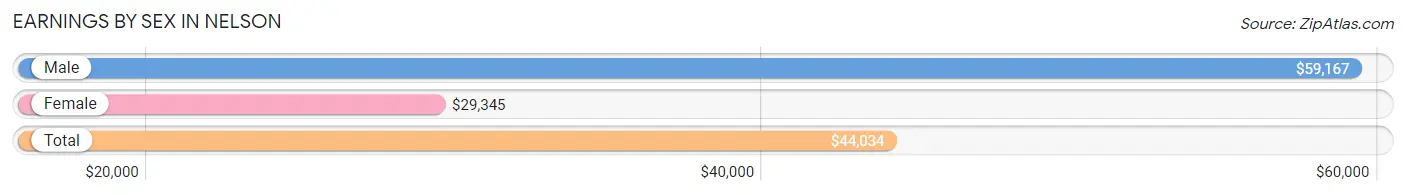
Earnings by Sex in Nelson
Average Earnings in Nelson are $44,034, $59,167 for men and $29,345 for women, a difference of 50.4%.
| Sex | Number | Average Earnings |
| Male | 284 (57.4%) | $59,167 |
| Female | 211 (42.6%) | $29,345 |
| Total | 495 (100.0%) | $44,034 |
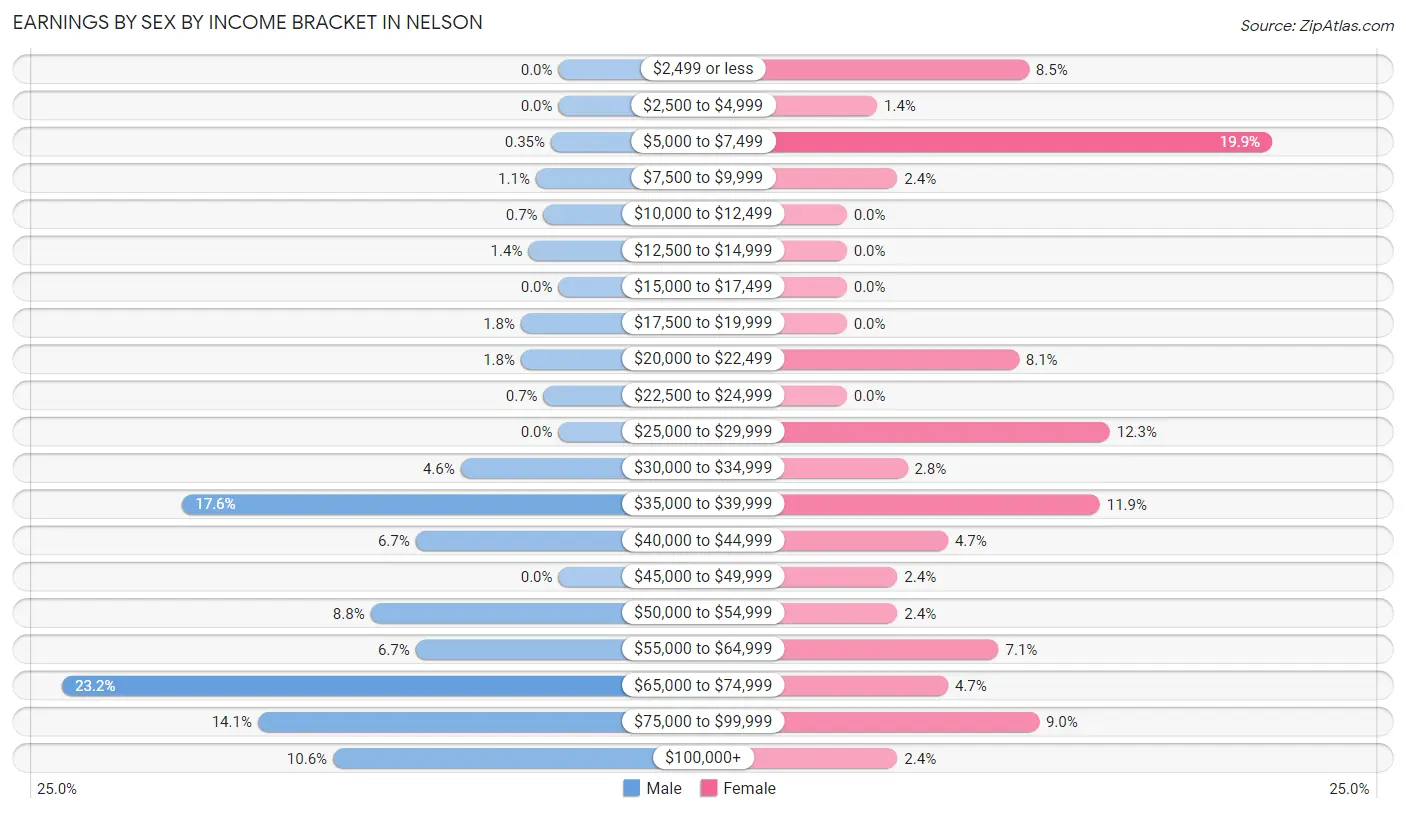
Earnings by Sex by Income Bracket in Nelson
The most common earnings brackets in Nelson are $65,000 to $74,999 for men (66 | 23.2%) and $5,000 to $7,499 for women (42 | 19.9%).
| Income | Male | Female |
| $2,499 or less | 0 (0.0%) | 18 (8.5%) |
| $2,500 to $4,999 | 0 (0.0%) | 3 (1.4%) |
| $5,000 to $7,499 | 1 (0.4%) | 42 (19.9%) |
| $7,500 to $9,999 | 3 (1.1%) | 5 (2.4%) |
| $10,000 to $12,499 | 2 (0.7%) | 0 (0.0%) |
| $12,500 to $14,999 | 4 (1.4%) | 0 (0.0%) |
| $15,000 to $17,499 | 0 (0.0%) | 0 (0.0%) |
| $17,500 to $19,999 | 5 (1.8%) | 0 (0.0%) |
| $20,000 to $22,499 | 5 (1.8%) | 17 (8.1%) |
| $22,500 to $24,999 | 2 (0.7%) | 0 (0.0%) |
| $25,000 to $29,999 | 0 (0.0%) | 26 (12.3%) |
| $30,000 to $34,999 | 13 (4.6%) | 6 (2.8%) |
| $35,000 to $39,999 | 50 (17.6%) | 25 (11.8%) |
| $40,000 to $44,999 | 19 (6.7%) | 10 (4.7%) |
| $45,000 to $49,999 | 0 (0.0%) | 5 (2.4%) |
| $50,000 to $54,999 | 25 (8.8%) | 5 (2.4%) |
| $55,000 to $64,999 | 19 (6.7%) | 15 (7.1%) |
| $65,000 to $74,999 | 66 (23.2%) | 10 (4.7%) |
| $75,000 to $99,999 | 40 (14.1%) | 19 (9.0%) |
| $100,000+ | 30 (10.6%) | 5 (2.4%) |
| Total | 284 (100.0%) | 211 (100.0%) |
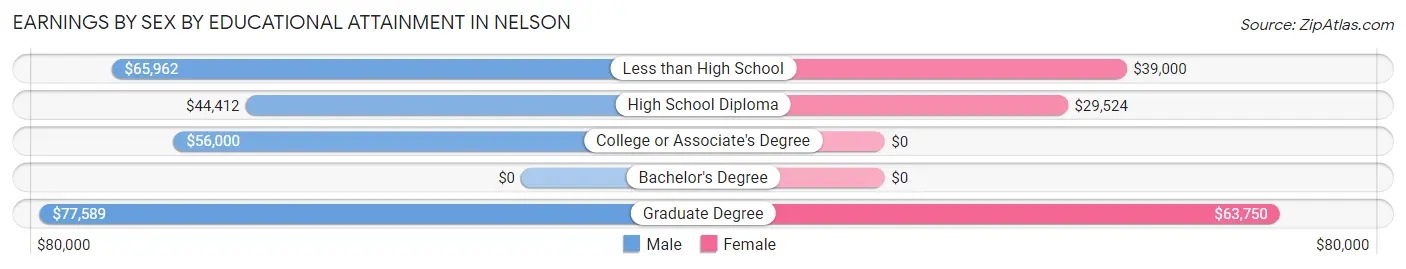
Earnings by Sex by Educational Attainment in Nelson
Average earnings in Nelson are $59,167 for men and $36,250 for women, a difference of 38.7%. Men with an educational attainment of graduate degree enjoy the highest average annual earnings of $77,589, while those with high school diploma education earn the least with $44,412. Women with an educational attainment of graduate degree earn the most with the average annual earnings of $63,750, while those with high school diploma education have the smallest earnings of $29,524.
| Educational Attainment | Male Income | Female Income |
| Less than High School | $65,962 | $39,000 |
| High School Diploma | $44,412 | $29,524 |
| College or Associate's Degree | $56,000 | $0 |
| Bachelor's Degree | - | - |
| Graduate Degree | $77,589 | $63,750 |
| Total | $59,167 | $36,250 |
Family Income in Nelson
Family Income Brackets in Nelson
According to the Nelson family income data, there are 60 families falling into the $100,000 to $149,999 income range, which is the most common income bracket and makes up 28.6% of all families.
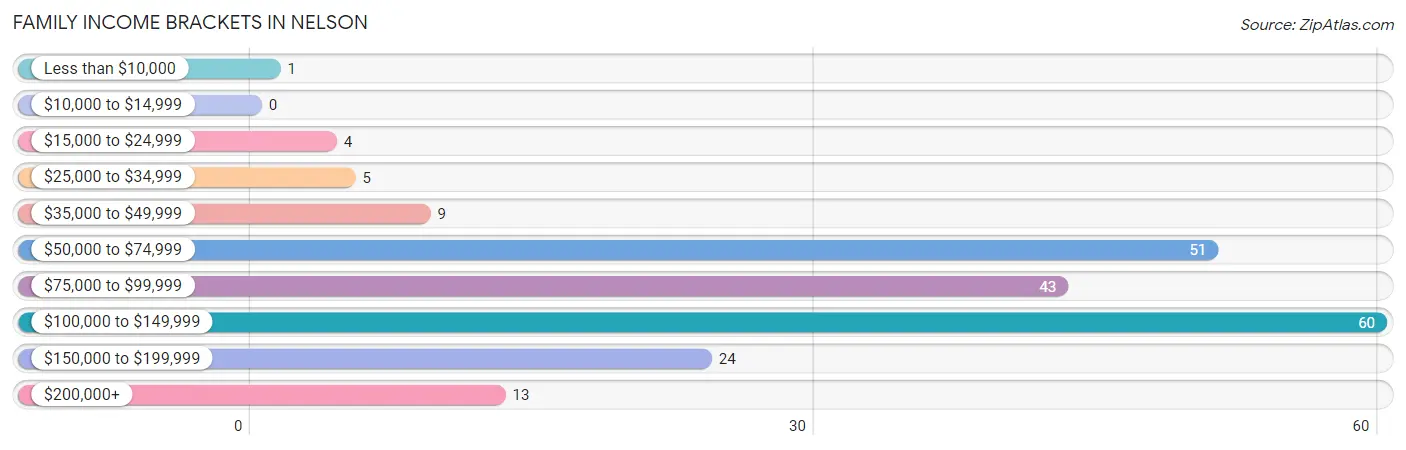
| Income Bracket | # Families | % Families |
| Less than $10,000 | 1 | 0.5% |
| $10,000 to $14,999 | 0 | 0.0% |
| $15,000 to $24,999 | 4 | 1.9% |
| $25,000 to $34,999 | 5 | 2.4% |
| $35,000 to $49,999 | 9 | 4.3% |
| $50,000 to $74,999 | 51 | 24.3% |
| $75,000 to $99,999 | 43 | 20.5% |
| $100,000 to $149,999 | 60 | 28.6% |
| $150,000 to $199,999 | 24 | 11.4% |
| $200,000+ | 13 | 6.2% |
Family Income by Famaliy Size in Nelson
2-person families (93 | 44.3%) account for the highest median family income in Nelson with $104,250 per family, while 2-person families (93 | 44.3%) have the highest median income of $52,125 per family member.
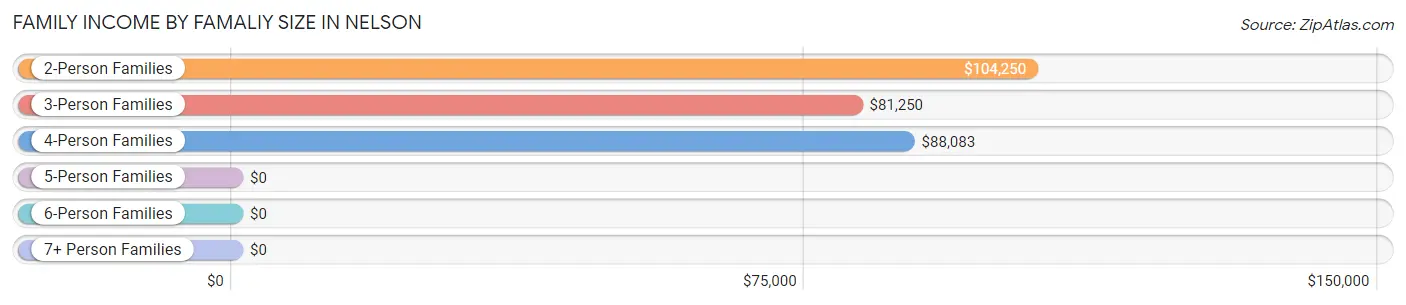
| Income Bracket | # Families | Median Income |
| 2-Person Families | 93 (44.3%) | $104,250 |
| 3-Person Families | 20 (9.5%) | $81,250 |
| 4-Person Families | 71 (33.8%) | $88,083 |
| 5-Person Families | 17 (8.1%) | $0 |
| 6-Person Families | 7 (3.3%) | $0 |
| 7+ Person Families | 2 (0.9%) | $0 |
| Total | 210 (100.0%) | $89,333 |
Family Income by Number of Earners in Nelson
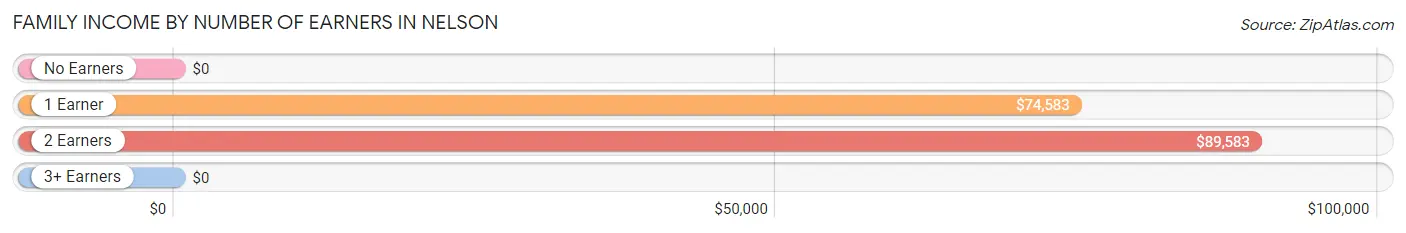
| Number of Earners | # Families | Median Income |
| No Earners | 20 (9.5%) | $0 |
| 1 Earner | 29 (13.8%) | $74,583 |
| 2 Earners | 159 (75.7%) | $89,583 |
| 3+ Earners | 2 (0.9%) | $0 |
| Total | 210 (100.0%) | $89,333 |
Household Income in Nelson
Household Income Brackets in Nelson
With 88 households falling in the category, the $50,000 to $74,999 income range is the most frequent in Nelson, accounting for 21.9% of all households. In contrast, only 5 households (1.2%) fall into the less than $10,000 income bracket, making it the least populous group.
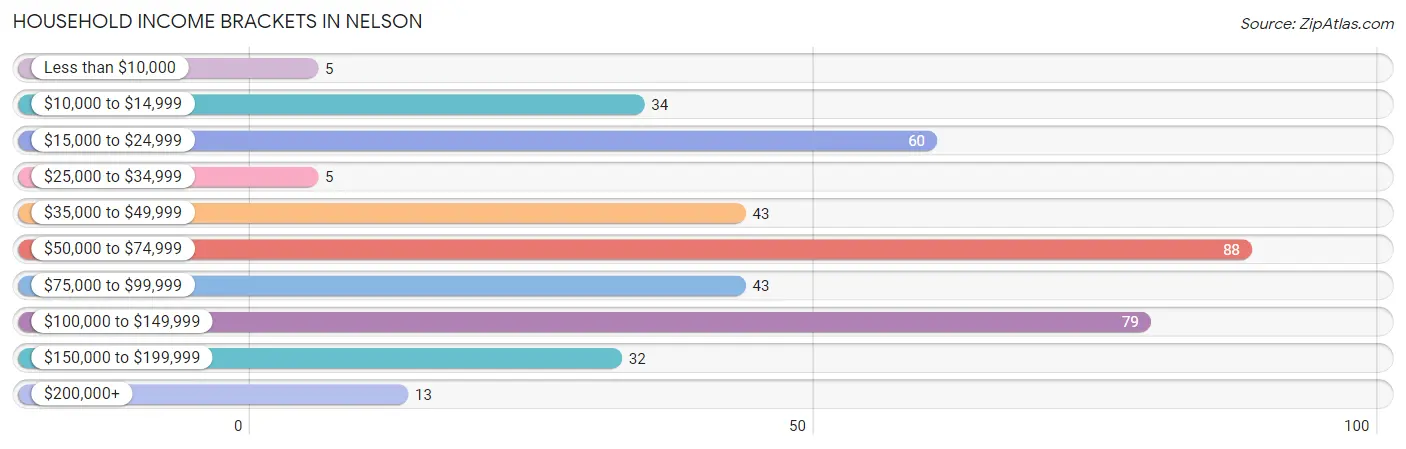
| Income Bracket | # Households | % Households |
| Less than $10,000 | 5 | 1.2% |
| $10,000 to $14,999 | 34 | 8.5% |
| $15,000 to $24,999 | 60 | 14.9% |
| $25,000 to $34,999 | 5 | 1.2% |
| $35,000 to $49,999 | 43 | 10.7% |
| $50,000 to $74,999 | 88 | 21.9% |
| $75,000 to $99,999 | 43 | 10.7% |
| $100,000 to $149,999 | 79 | 19.7% |
| $150,000 to $199,999 | 32 | 8.0% |
| $200,000+ | 13 | 3.2% |
Household Income by Householder Age in Nelson
The median household income in Nelson is $66,719, with the highest median household income of $84,688 found in the 45 to 64 years age bracket for the primary householder. A total of 125 households (31.1%) fall into this category. Meanwhile, the 15 to 24 years age bracket for the primary householder has the lowest median household income of $0, with 7 households (1.7%) in this group.
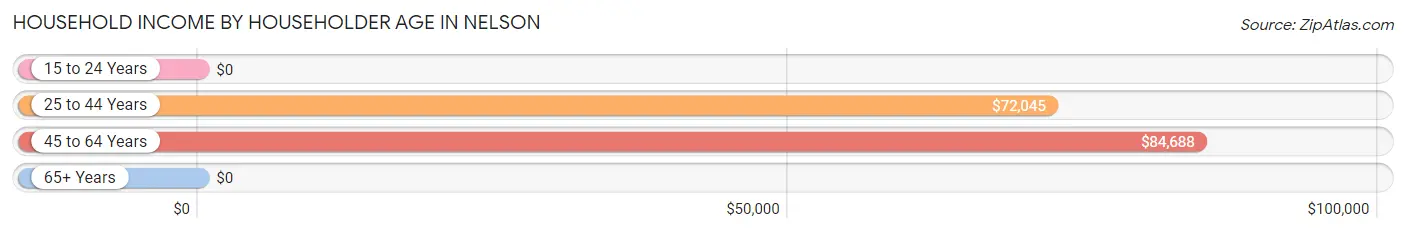
| Income Bracket | # Households | Median Income |
| 15 to 24 Years | 7 (1.7%) | $0 |
| 25 to 44 Years | 126 (31.3%) | $72,045 |
| 45 to 64 Years | 125 (31.1%) | $84,688 |
| 65+ Years | 144 (35.8%) | $0 |
| Total | 402 (100.0%) | $66,719 |
Poverty in Nelson
Income Below Poverty by Sex and Age in Nelson
With 3.0% poverty level for males and 11.0% for females among the residents of Nelson, 55 to 64 year old males and 65 to 74 year old females are the most vulnerable to poverty, with 11 males (14.1%) and 23 females (43.4%) in their respective age groups living below the poverty level.
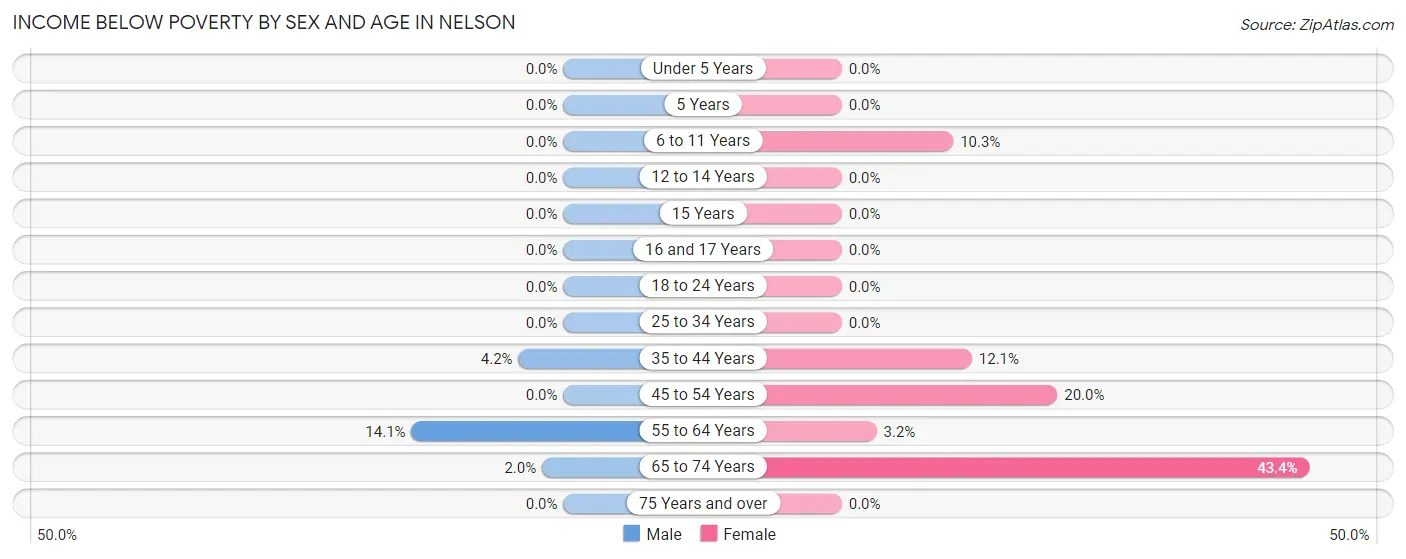
| Age Bracket | Male | Female |
| Under 5 Years | 0 (0.0%) | 0 (0.0%) |
| 5 Years | 0 (0.0%) | 0 (0.0%) |
| 6 to 11 Years | 0 (0.0%) | 3 (10.3%) |
| 12 to 14 Years | 0 (0.0%) | 0 (0.0%) |
| 15 Years | 0 (0.0%) | 0 (0.0%) |
| 16 and 17 Years | 0 (0.0%) | 0 (0.0%) |
| 18 to 24 Years | 0 (0.0%) | 0 (0.0%) |
| 25 to 34 Years | 0 (0.0%) | 0 (0.0%) |
| 35 to 44 Years | 3 (4.2%) | 7 (12.1%) |
| 45 to 54 Years | 0 (0.0%) | 11 (20.0%) |
| 55 to 64 Years | 11 (14.1%) | 1 (3.2%) |
| 65 to 74 Years | 2 (2.0%) | 23 (43.4%) |
| 75 Years and over | 0 (0.0%) | 0 (0.0%) |
| Total | 16 (3.0%) | 45 (11.0%) |
Income Above Poverty by Sex and Age in Nelson
According to the poverty statistics in Nelson, males aged 5 years and females aged under 5 years are the age groups that are most secure financially, with 100.0% of males and 100.0% of females in these age groups living above the poverty line.
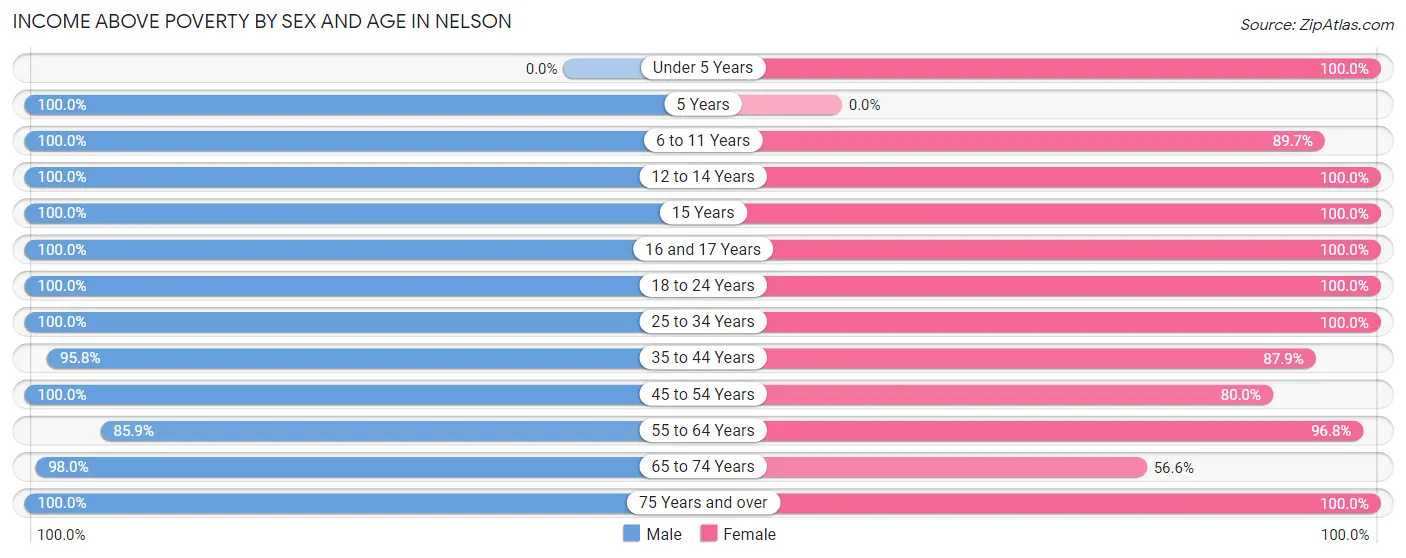
| Age Bracket | Male | Female |
| Under 5 Years | 0 (0.0%) | 41 (100.0%) |
| 5 Years | 26 (100.0%) | 0 (0.0%) |
| 6 to 11 Years | 52 (100.0%) | 26 (89.7%) |
| 12 to 14 Years | 28 (100.0%) | 11 (100.0%) |
| 15 Years | 7 (100.0%) | 8 (100.0%) |
| 16 and 17 Years | 4 (100.0%) | 18 (100.0%) |
| 18 to 24 Years | 2 (100.0%) | 44 (100.0%) |
| 25 to 34 Years | 79 (100.0%) | 41 (100.0%) |
| 35 to 44 Years | 69 (95.8%) | 51 (87.9%) |
| 45 to 54 Years | 56 (100.0%) | 44 (80.0%) |
| 55 to 64 Years | 67 (85.9%) | 30 (96.8%) |
| 65 to 74 Years | 99 (98.0%) | 30 (56.6%) |
| 75 Years and over | 33 (100.0%) | 19 (100.0%) |
| Total | 522 (97.0%) | 363 (89.0%) |
Income Below Poverty Among Married-Couple Families in Nelson
The poverty statistics for married-couple families in Nelson show that 2.1% or 4 of the total 186 families live below the poverty line. Families with 1 or 2 children have the highest poverty rate of 3.7%, comprising of 3 families. On the other hand, families with 3 or 4 children have the lowest poverty rate of 0.0%, which includes 0 families.
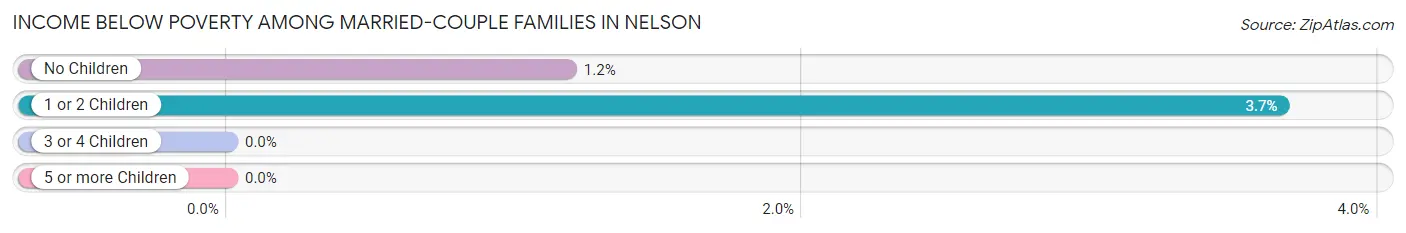
| Children | Above Poverty | Below Poverty |
| No Children | 84 (98.8%) | 1 (1.2%) |
| 1 or 2 Children | 79 (96.3%) | 3 (3.7%) |
| 3 or 4 Children | 17 (100.0%) | 0 (0.0%) |
| 5 or more Children | 2 (100.0%) | 0 (0.0%) |
| Total | 182 (97.9%) | 4 (2.1%) |
Income Below Poverty Among Single-Parent Households in Nelson
| Children | Single Father | Single Mother |
| No Children | 0 (0.0%) | 0 (0.0%) |
| 1 or 2 Children | 0 (0.0%) | 0 (0.0%) |
| 3 or 4 Children | 0 (0.0%) | 0 (0.0%) |
| 5 or more Children | 0 (0.0%) | 0 (0.0%) |
| Total | 0 (0.0%) | 0 (0.0%) |
Income Below Poverty Among Married-Couple vs Single-Parent Households in Nelson
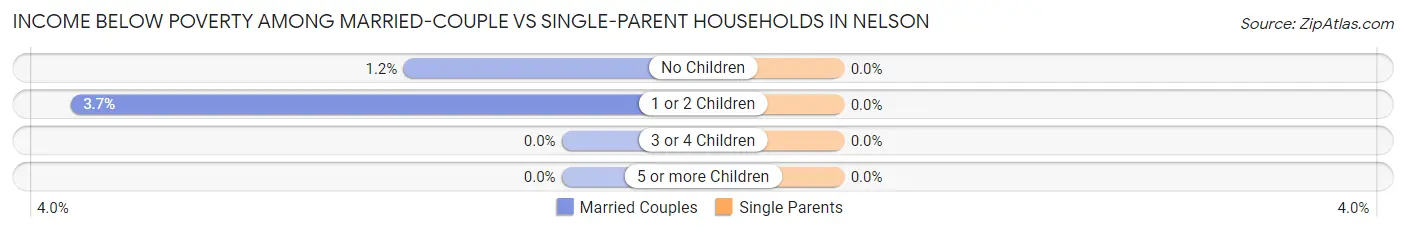
| Children | Married-Couple Families | Single-Parent Households |
| No Children | 1 (1.2%) | 0 (0.0%) |
| 1 or 2 Children | 3 (3.7%) | 0 (0.0%) |
| 3 or 4 Children | 0 (0.0%) | 0 (0.0%) |
| 5 or more Children | 0 (0.0%) | 0 (0.0%) |
| Total | 4 (2.1%) | 0 (0.0%) |
Race in Nelson
The most populous races in Nelson are White / Caucasian (864 | 91.3%), Two or more Races (31 | 3.3%), and Hispanic or Latino (27 | 2.9%).
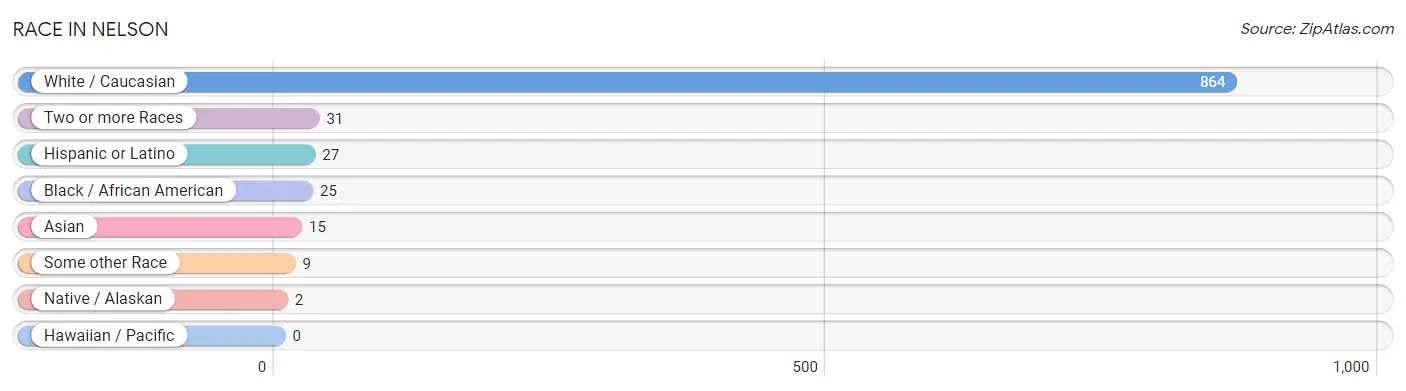
| Race | # Population | % Population |
| Asian | 15 | 1.6% |
| Black / African American | 25 | 2.6% |
| Hawaiian / Pacific | 0 | 0.0% |
| Hispanic or Latino | 27 | 2.9% |
| Native / Alaskan | 2 | 0.2% |
| White / Caucasian | 864 | 91.3% |
| Two or more Races | 31 | 3.3% |
| Some other Race | 9 | 0.9% |
| Total | 946 | 100.0% |
Ancestry in Nelson
The most populous ancestries reported in Nelson are Irish (187 | 19.8%), English (152 | 16.1%), German (133 | 14.1%), American (79 | 8.4%), and Scottish (41 | 4.3%), together accounting for 62.6% of all Nelson residents.
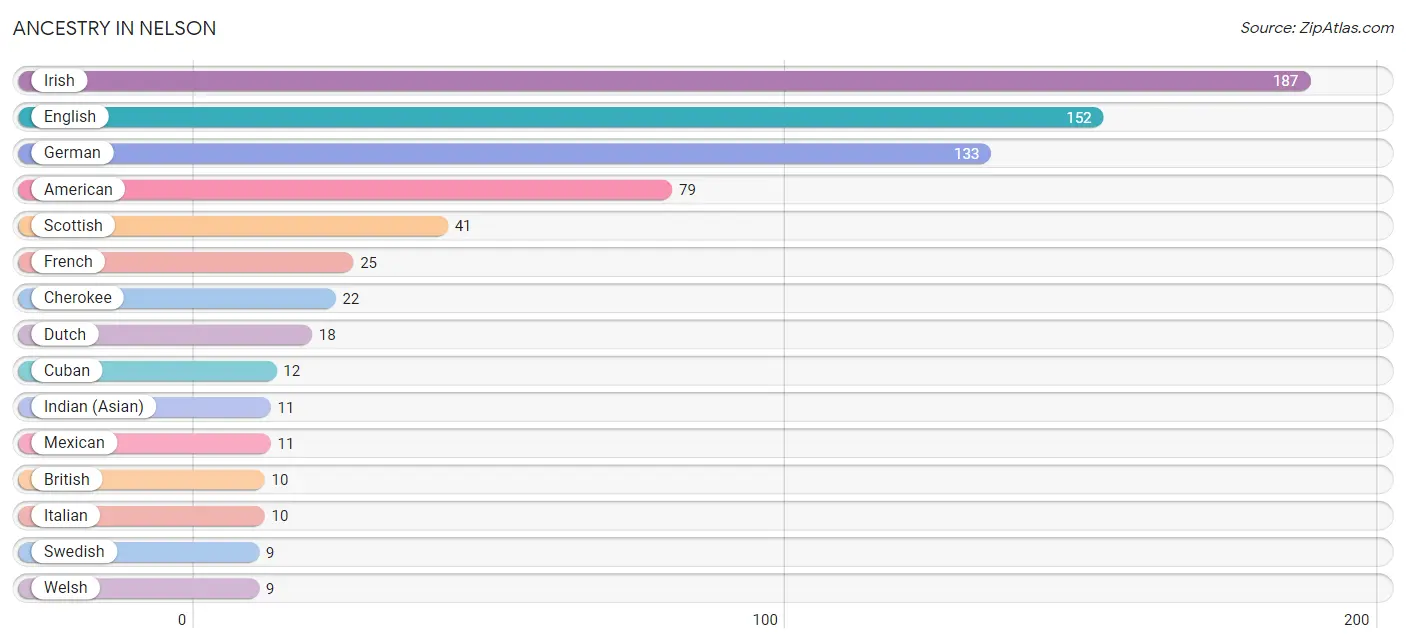
| Ancestry | # Population | % Population |
| American | 79 | 8.4% |
| British | 10 | 1.1% |
| Cherokee | 22 | 2.3% |
| Colombian | 2 | 0.2% |
| Creek | 1 | 0.1% |
| Cuban | 12 | 1.3% |
| Danish | 2 | 0.2% |
| Dutch | 18 | 1.9% |
| English | 152 | 16.1% |
| European | 4 | 0.4% |
| Finnish | 6 | 0.6% |
| French | 25 | 2.6% |
| German | 133 | 14.1% |
| Hungarian | 2 | 0.2% |
| Indian (Asian) | 11 | 1.2% |
| Irish | 187 | 19.8% |
| Italian | 10 | 1.1% |
| Korean | 4 | 0.4% |
| Mexican | 11 | 1.2% |
| Northern European | 4 | 0.4% |
| Peruvian | 2 | 0.2% |
| Polish | 1 | 0.1% |
| Scotch-Irish | 2 | 0.2% |
| Scottish | 41 | 4.3% |
| South American | 4 | 0.4% |
| South American Indian | 2 | 0.2% |
| Subsaharan African | 2 | 0.2% |
| Swedish | 9 | 0.9% |
| Swiss | 2 | 0.2% |
| Ugandan | 2 | 0.2% |
| Welsh | 9 | 0.9% | View All 31 Rows |
Immigrants in Nelson
The most numerous immigrant groups reported in Nelson came from Asia (11 | 1.2%), China (11 | 1.2%), Eastern Asia (11 | 1.2%), Latin America (4 | 0.4%), and South America (4 | 0.4%), together accounting for 4.3% of all Nelson residents.
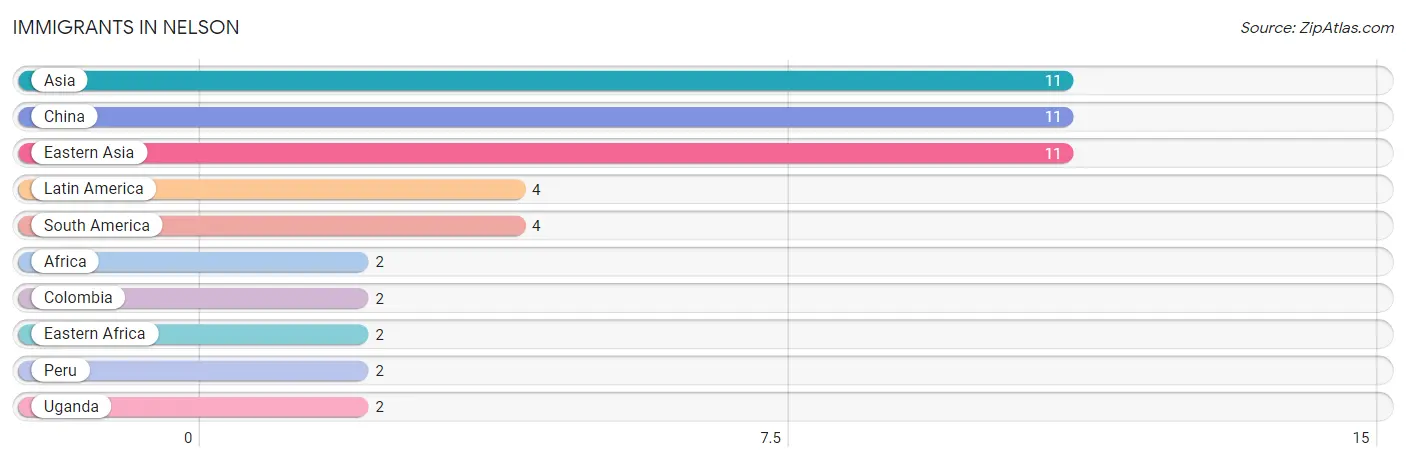
| Immigration Origin | # Population | % Population |
| Africa | 2 | 0.2% |
| Asia | 11 | 1.2% |
| China | 11 | 1.2% |
| Colombia | 2 | 0.2% |
| Eastern Africa | 2 | 0.2% |
| Eastern Asia | 11 | 1.2% |
| Latin America | 4 | 0.4% |
| Peru | 2 | 0.2% |
| South America | 4 | 0.4% |
| Uganda | 2 | 0.2% | View All 10 Rows |
Sex and Age in Nelson
Sex and Age in Nelson
The most populous age groups in Nelson are 65 to 69 Years (73 | 13.6%) for men and 15 to 19 Years (42 | 10.3%) for women.
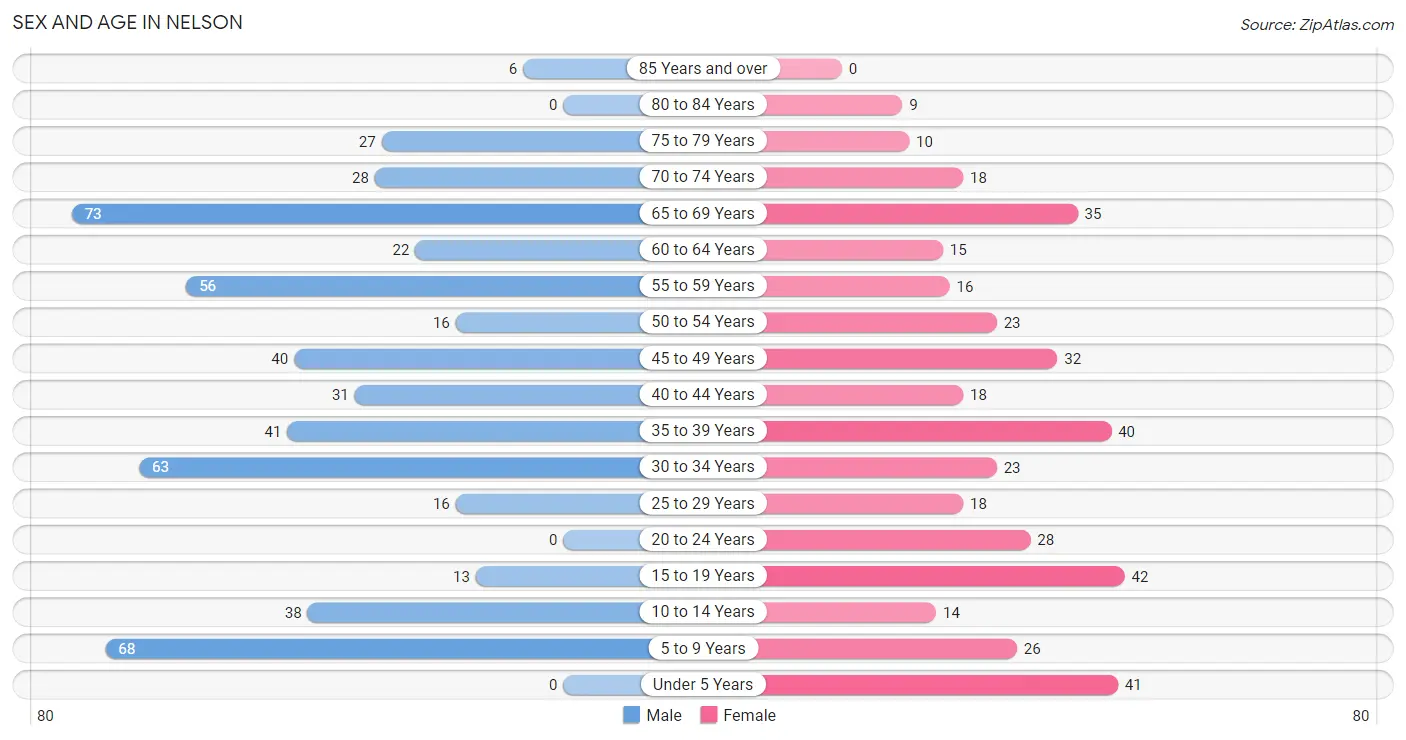
| Age Bracket | Male | Female |
| Under 5 Years | 0 (0.0%) | 41 (10.1%) |
| 5 to 9 Years | 68 (12.6%) | 26 (6.4%) |
| 10 to 14 Years | 38 (7.1%) | 14 (3.4%) |
| 15 to 19 Years | 13 (2.4%) | 42 (10.3%) |
| 20 to 24 Years | 0 (0.0%) | 28 (6.9%) |
| 25 to 29 Years | 16 (3.0%) | 18 (4.4%) |
| 30 to 34 Years | 63 (11.7%) | 23 (5.6%) |
| 35 to 39 Years | 41 (7.6%) | 40 (9.8%) |
| 40 to 44 Years | 31 (5.8%) | 18 (4.4%) |
| 45 to 49 Years | 40 (7.4%) | 32 (7.8%) |
| 50 to 54 Years | 16 (3.0%) | 23 (5.6%) |
| 55 to 59 Years | 56 (10.4%) | 16 (3.9%) |
| 60 to 64 Years | 22 (4.1%) | 15 (3.7%) |
| 65 to 69 Years | 73 (13.6%) | 35 (8.6%) |
| 70 to 74 Years | 28 (5.2%) | 18 (4.4%) |
| 75 to 79 Years | 27 (5.0%) | 10 (2.5%) |
| 80 to 84 Years | 0 (0.0%) | 9 (2.2%) |
| 85 Years and over | 6 (1.1%) | 0 (0.0%) |
| Total | 538 (100.0%) | 408 (100.0%) |
Families and Households in Nelson
Median Family Size in Nelson
The median family size in Nelson is 3.34 persons per family, with married-couple families (186 | 88.6%) accounting for the largest median family size of 3.45 persons per family. On the other hand, single male/father families (4 | 1.9%) represent the smallest median family size with 2.00 persons per family.
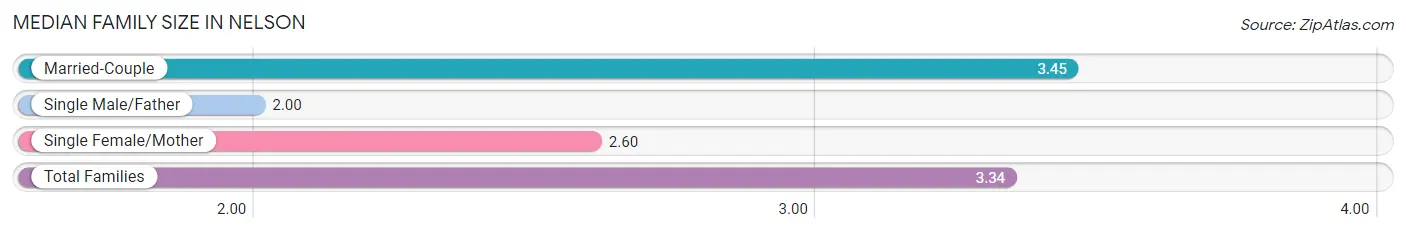
| Family Type | # Families | Family Size |
| Married-Couple | 186 (88.6%) | 3.45 |
| Single Male/Father | 4 (1.9%) | 2.00 |
| Single Female/Mother | 20 (9.5%) | 2.60 |
| Total Families | 210 (100.0%) | 3.34 |
Median Household Size in Nelson
The median household size in Nelson is 2.35 persons per household, with married-couple households (186 | 46.3%) accounting for the largest median household size of 3.5 persons per household. non-family households (192 | 47.8%) represent the smallest median household size with 1.20 persons per household.
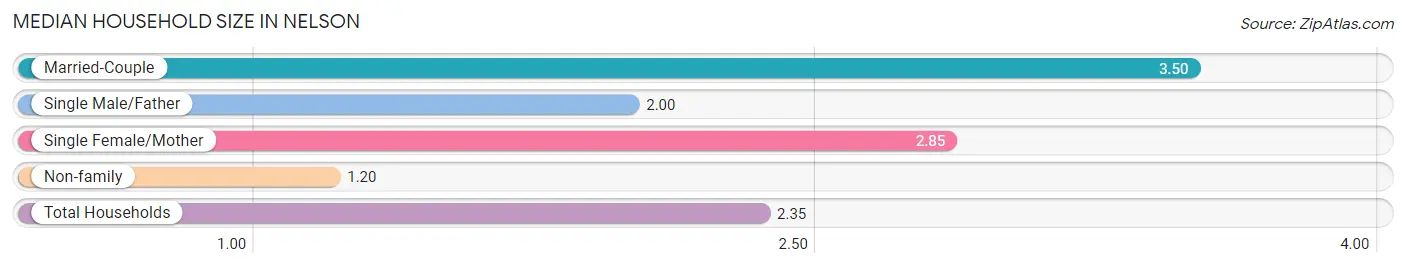
| Household Type | # Households | Household Size |
| Married-Couple | 186 (46.3%) | 3.50 |
| Single Male/Father | 4 (1.0%) | 2.00 |
| Single Female/Mother | 20 (5.0%) | 2.85 |
| Non-family | 192 (47.8%) | 1.20 |
| Total Households | 402 (100.0%) | 2.35 |
Household Size by Marriage Status in Nelson
Out of a total of 402 households in Nelson, 210 (52.2%) are family households, while 192 (47.8%) are nonfamily households. The most numerous type of family households are 2-person households, comprising 93, and the most common type of nonfamily households are 1-person households, comprising 160.
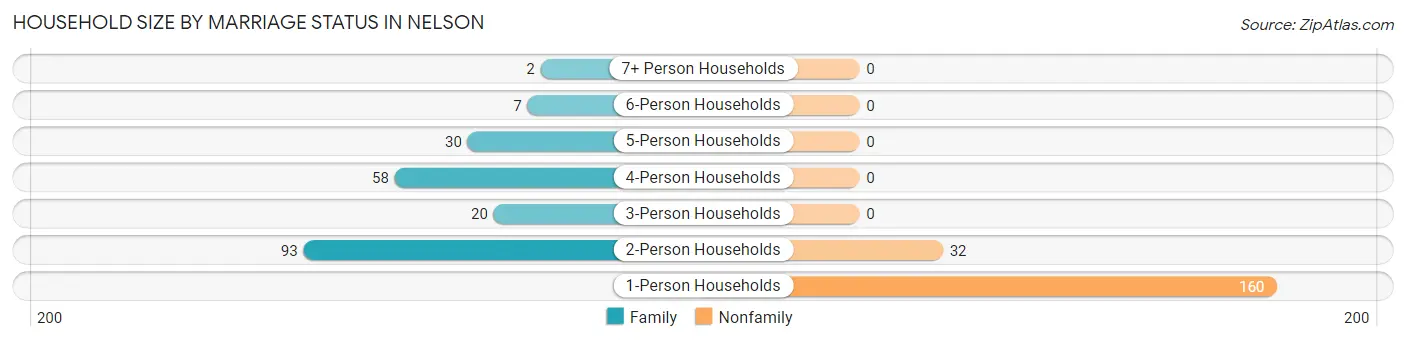
| Household Size | Family Households | Nonfamily Households |
| 1-Person Households | - | 160 (39.8%) |
| 2-Person Households | 93 (23.1%) | 32 (8.0%) |
| 3-Person Households | 20 (5.0%) | 0 (0.0%) |
| 4-Person Households | 58 (14.4%) | 0 (0.0%) |
| 5-Person Households | 30 (7.5%) | 0 (0.0%) |
| 6-Person Households | 7 (1.7%) | 0 (0.0%) |
| 7+ Person Households | 2 (0.5%) | 0 (0.0%) |
| Total | 210 (52.2%) | 192 (47.8%) |
Female Fertility in Nelson
Fertility by Age in Nelson
Average fertility rate in Nelson is 15.0 births per 1,000 women. Women in the age bracket of 20 to 34 years have the highest fertility rate with 43.0 births per 1,000 women. Women in the age bracket of 20 to 34 years acount for 100.0% of all women with births.
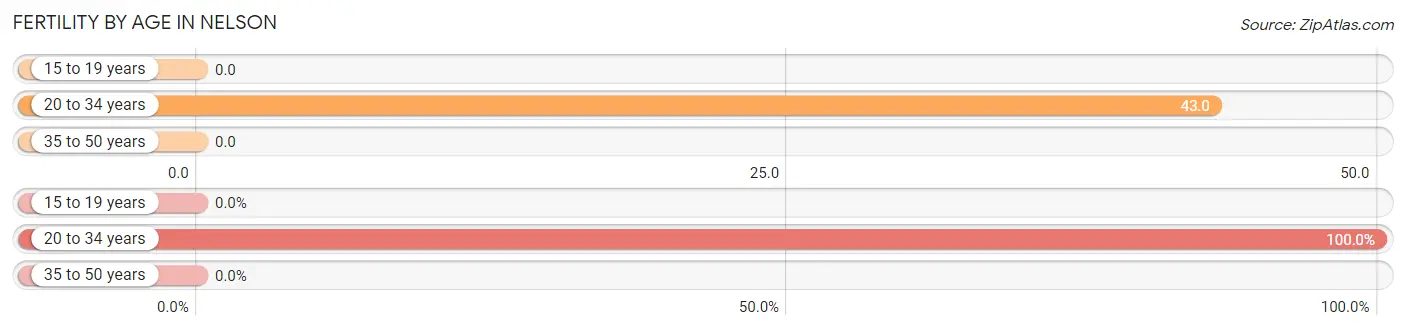
| Age Bracket | Women with Births | Births / 1,000 Women |
| 15 to 19 years | 0 (0.0%) | 0.0 |
| 20 to 34 years | 3 (100.0%) | 43.0 |
| 35 to 50 years | 0 (0.0%) | 0.0 |
| Total | 3 (100.0%) | 15.0 |
Fertility by Age by Marriage Status in Nelson
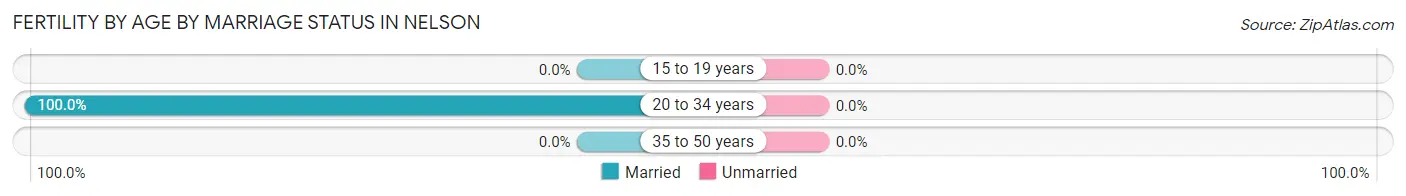
| Age Bracket | Married | Unmarried |
| 15 to 19 years | 0 (0.0%) | 0 (0.0%) |
| 20 to 34 years | 3 (100.0%) | 0 (0.0%) |
| 35 to 50 years | 0 (0.0%) | 0 (0.0%) |
| Total | 3 (100.0%) | 0 (0.0%) |
Fertility by Education in Nelson
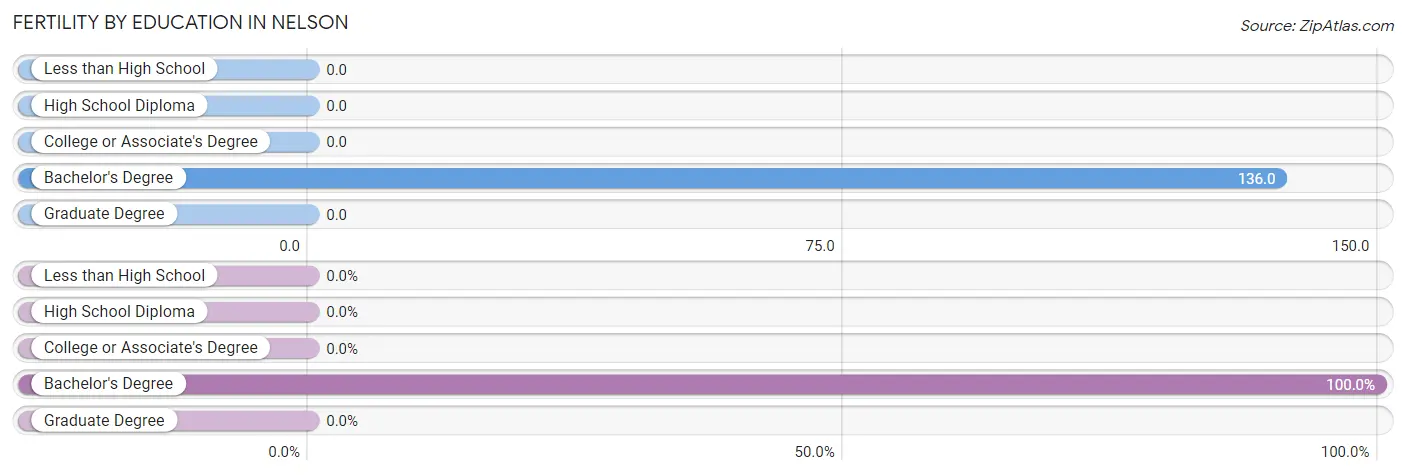
| Educational Attainment | Women with Births | Births / 1,000 Women |
| Less than High School | 0 (0.0%) | 0.0 |
| High School Diploma | 0 (0.0%) | 0.0 |
| College or Associate's Degree | 0 (0.0%) | 0.0 |
| Bachelor's Degree | 3 (100.0%) | 136.0 |
| Graduate Degree | 0 (0.0%) | 0.0 |
| Total | 3 (100.0%) | 15.0 |
Fertility by Education by Marriage Status in Nelson
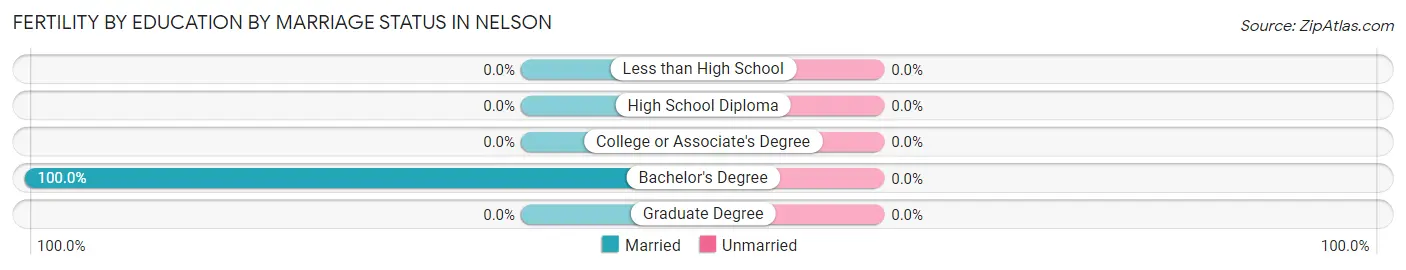
| Educational Attainment | Married | Unmarried |
| Less than High School | 0 (0.0%) | 0 (0.0%) |
| High School Diploma | 0 (0.0%) | 0 (0.0%) |
| College or Associate's Degree | 0 (0.0%) | 0 (0.0%) |
| Bachelor's Degree | 3 (100.0%) | 0 (0.0%) |
| Graduate Degree | 0 (0.0%) | 0 (0.0%) |
| Total | 3 (100.0%) | 0 (0.0%) |
Employment Characteristics in Nelson
Employment by Class of Employer in Nelson
Among the 481 employed individuals in Nelson, private company employees (338 | 70.3%), local government employees (73 | 15.2%), and self-employed (not incorporated) (30 | 6.2%) make up the most common classes of employment.
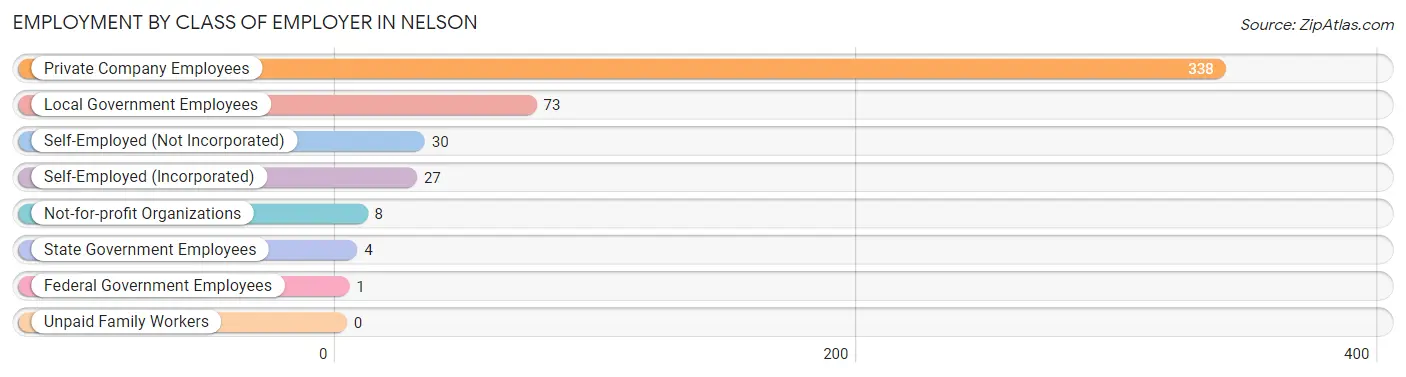
| Employer Class | # Employees | % Employees |
| Private Company Employees | 338 | 70.3% |
| Self-Employed (Incorporated) | 27 | 5.6% |
| Self-Employed (Not Incorporated) | 30 | 6.2% |
| Not-for-profit Organizations | 8 | 1.7% |
| Local Government Employees | 73 | 15.2% |
| State Government Employees | 4 | 0.8% |
| Federal Government Employees | 1 | 0.2% |
| Unpaid Family Workers | 0 | 0.0% |
| Total | 481 | 100.0% |
Employment Status by Age in Nelson
According to the labor force statistics for Nelson, out of the total population over 16 years of age (744), 66.9% or 498 individuals are in the labor force, with 2.6% or 13 of them unemployed. The age group with the highest labor force participation rate is 20 to 24 years, with 100.0% or 28 individuals in the labor force. Within the labor force, the 16 to 19 years age range has the highest percentage of unemployed individuals, with 41.7% or 10 of them being unemployed.
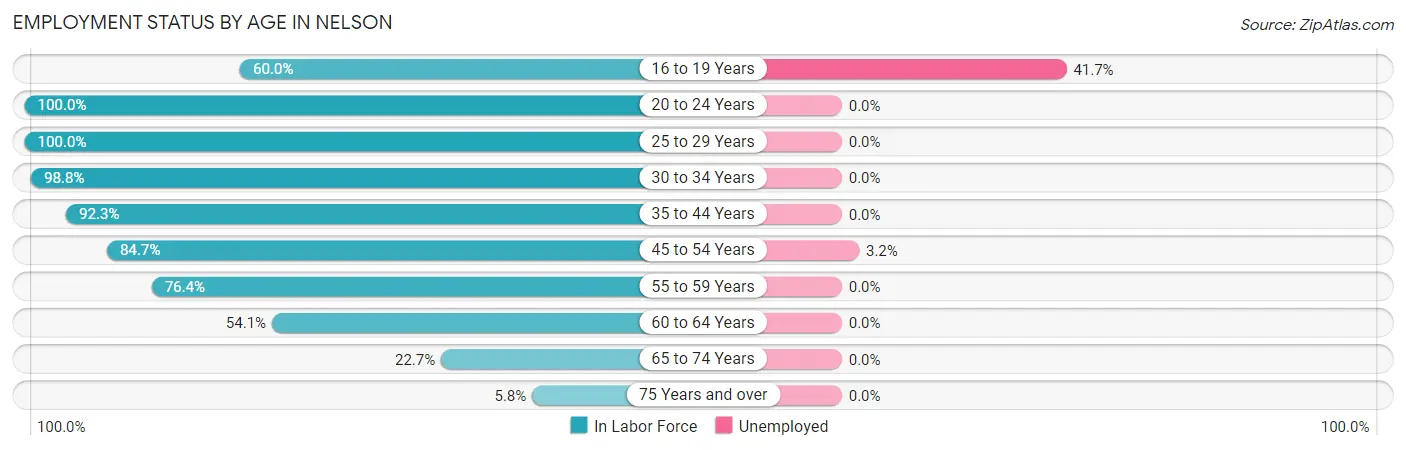
| Age Bracket | In Labor Force | Unemployed |
| 16 to 19 Years | 24 (60.0%) | 10 (41.7%) |
| 20 to 24 Years | 28 (100.0%) | 0 (0.0%) |
| 25 to 29 Years | 34 (100.0%) | 0 (0.0%) |
| 30 to 34 Years | 85 (98.8%) | 0 (0.0%) |
| 35 to 44 Years | 120 (92.3%) | 0 (0.0%) |
| 45 to 54 Years | 94 (84.7%) | 3 (3.2%) |
| 55 to 59 Years | 55 (76.4%) | 0 (0.0%) |
| 60 to 64 Years | 20 (54.1%) | 0 (0.0%) |
| 65 to 74 Years | 35 (22.7%) | 0 (0.0%) |
| 75 Years and over | 3 (5.8%) | 0 (0.0%) |
| Total | 498 (66.9%) | 13 (2.6%) |
Employment Status by Educational Attainment in Nelson
According to labor force statistics for Nelson, 86.8% of individuals (408) out of the total population between 25 and 64 years of age (470) are in the labor force, with 0.7% or 3 of them being unemployed. The group with the highest labor force participation rate are those with the educational attainment of high school diploma, with 92.9% or 196 individuals in the labor force. Within the labor force, individuals with high school diploma education have the highest percentage of unemployment, with 1.5% or 3 of them being unemployed.
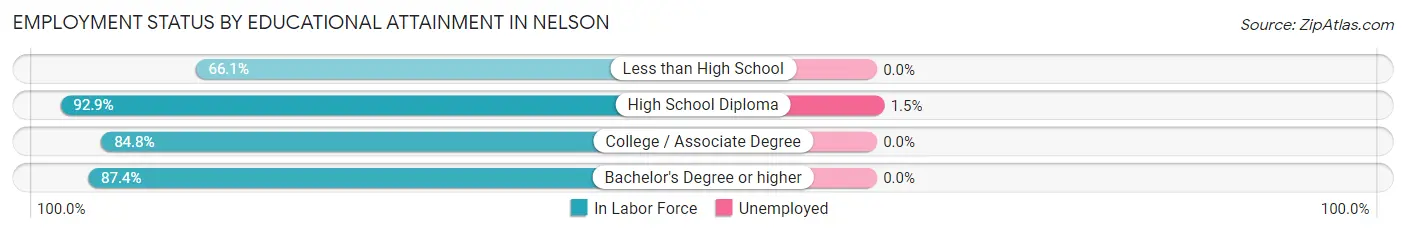
| Educational Attainment | In Labor Force | Unemployed |
| Less than High School | 37 (66.1%) | 0 (0.0%) |
| High School Diploma | 196 (92.9%) | 3 (1.5%) |
| College / Associate Degree | 78 (84.8%) | 0 (0.0%) |
| Bachelor's Degree or higher | 97 (87.4%) | 0 (0.0%) |
| Total | 408 (86.8%) | 3 (0.7%) |
Employment Occupations by Sex in Nelson
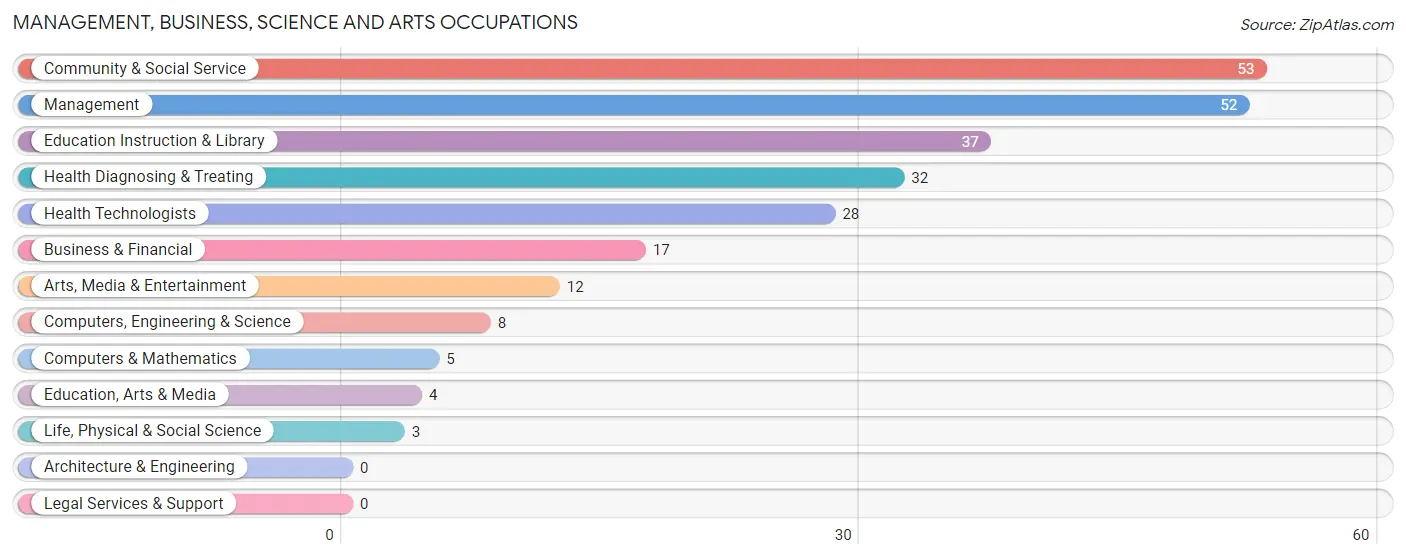
Management, Business, Science and Arts Occupations
The most common Management, Business, Science and Arts occupations in Nelson are Community & Social Service (53 | 10.9%), Management (52 | 10.7%), Education Instruction & Library (37 | 7.6%), Health Diagnosing & Treating (32 | 6.6%), and Health Technologists (28 | 5.8%).
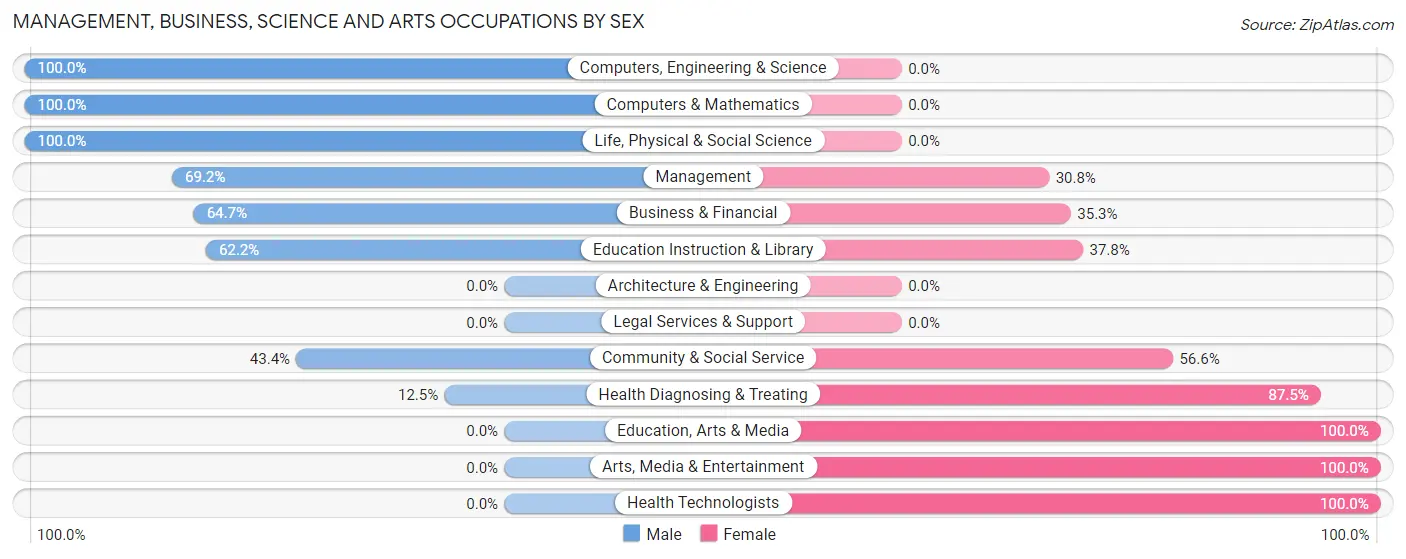
Management, Business, Science and Arts Occupations by Sex
Within the Management, Business, Science and Arts occupations in Nelson, the most male-oriented occupations are Computers, Engineering & Science (100.0%), Computers & Mathematics (100.0%), and Life, Physical & Social Science (100.0%), while the most female-oriented occupations are Education, Arts & Media (100.0%), Arts, Media & Entertainment (100.0%), and Health Technologists (100.0%).
| Occupation | Male | Female |
| Management | 36 (69.2%) | 16 (30.8%) |
| Business & Financial | 11 (64.7%) | 6 (35.3%) |
| Computers, Engineering & Science | 8 (100.0%) | 0 (0.0%) |
| Computers & Mathematics | 5 (100.0%) | 0 (0.0%) |
| Architecture & Engineering | 0 (0.0%) | 0 (0.0%) |
| Life, Physical & Social Science | 3 (100.0%) | 0 (0.0%) |
| Community & Social Service | 23 (43.4%) | 30 (56.6%) |
| Education, Arts & Media | 0 (0.0%) | 4 (100.0%) |
| Legal Services & Support | 0 (0.0%) | 0 (0.0%) |
| Education Instruction & Library | 23 (62.2%) | 14 (37.8%) |
| Arts, Media & Entertainment | 0 (0.0%) | 12 (100.0%) |
| Health Diagnosing & Treating | 4 (12.5%) | 28 (87.5%) |
| Health Technologists | 0 (0.0%) | 28 (100.0%) |
| Total (Category) | 82 (50.6%) | 80 (49.4%) |
| Total (Overall) | 281 (57.9%) | 204 (42.1%) |
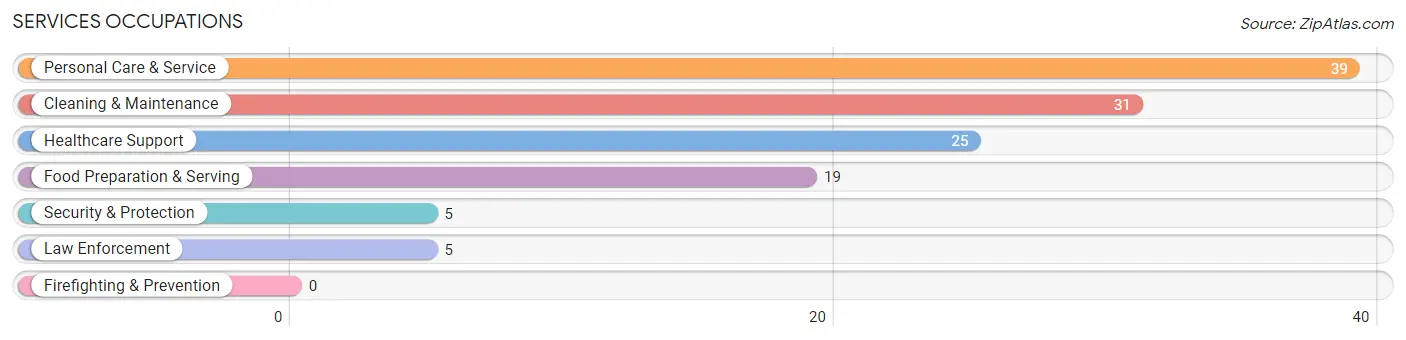
Services Occupations
The most common Services occupations in Nelson are Personal Care & Service (39 | 8.0%), Cleaning & Maintenance (31 | 6.4%), Healthcare Support (25 | 5.1%), Food Preparation & Serving (19 | 3.9%), and Security & Protection (5 | 1.0%).
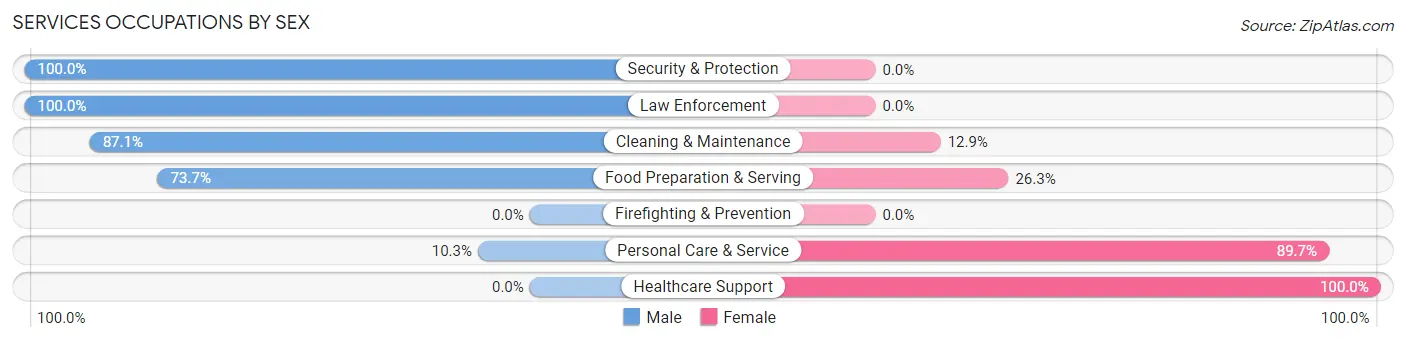
Services Occupations by Sex
Within the Services occupations in Nelson, the most male-oriented occupations are Security & Protection (100.0%), Law Enforcement (100.0%), and Cleaning & Maintenance (87.1%), while the most female-oriented occupations are Healthcare Support (100.0%), Personal Care & Service (89.7%), and Food Preparation & Serving (26.3%).
| Occupation | Male | Female |
| Healthcare Support | 0 (0.0%) | 25 (100.0%) |
| Security & Protection | 5 (100.0%) | 0 (0.0%) |
| Firefighting & Prevention | 0 (0.0%) | 0 (0.0%) |
| Law Enforcement | 5 (100.0%) | 0 (0.0%) |
| Food Preparation & Serving | 14 (73.7%) | 5 (26.3%) |
| Cleaning & Maintenance | 27 (87.1%) | 4 (12.9%) |
| Personal Care & Service | 4 (10.3%) | 35 (89.7%) |
| Total (Category) | 50 (42.0%) | 69 (58.0%) |
| Total (Overall) | 281 (57.9%) | 204 (42.1%) |
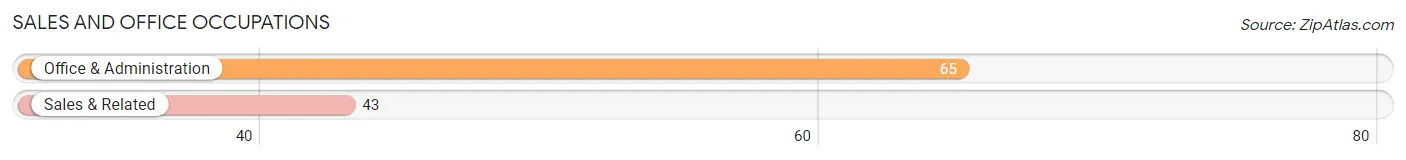
Sales and Office Occupations
The most common Sales and Office occupations in Nelson are Office & Administration (65 | 13.4%), and Sales & Related (43 | 8.9%).
Sales and Office Occupations by Sex
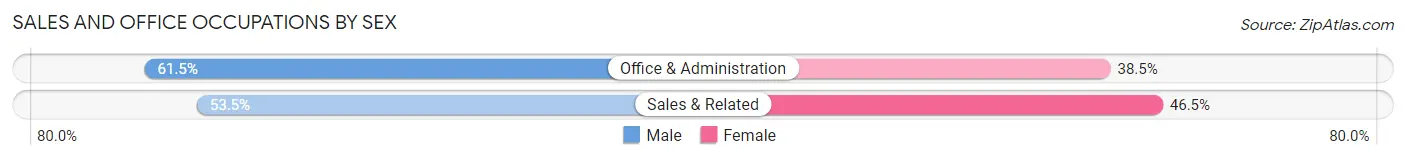
| Occupation | Male | Female |
| Sales & Related | 23 (53.5%) | 20 (46.5%) |
| Office & Administration | 40 (61.5%) | 25 (38.5%) |
| Total (Category) | 63 (58.3%) | 45 (41.7%) |
| Total (Overall) | 281 (57.9%) | 204 (42.1%) |
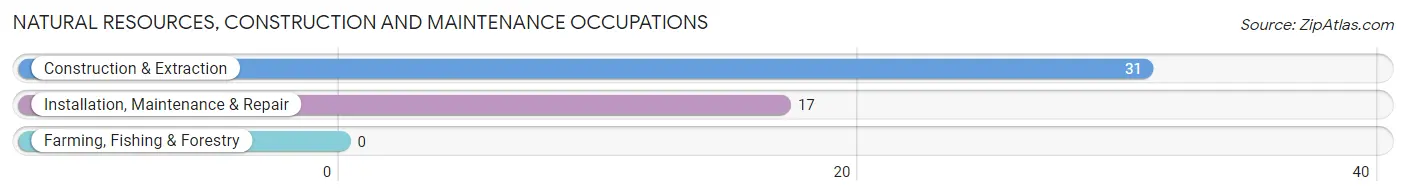
Natural Resources, Construction and Maintenance Occupations
The most common Natural Resources, Construction and Maintenance occupations in Nelson are Construction & Extraction (31 | 6.4%), and Installation, Maintenance & Repair (17 | 3.5%).
Natural Resources, Construction and Maintenance Occupations by Sex
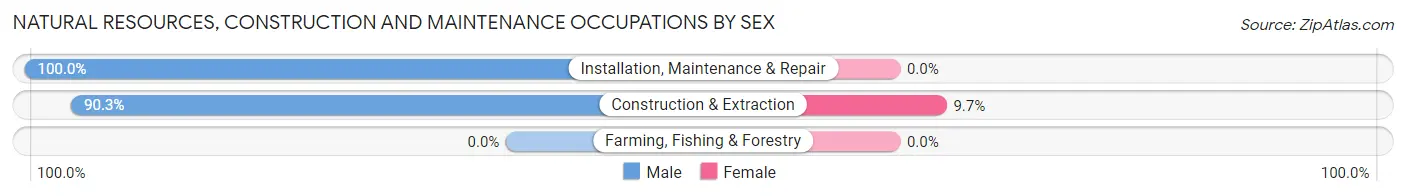
| Occupation | Male | Female |
| Farming, Fishing & Forestry | 0 (0.0%) | 0 (0.0%) |
| Construction & Extraction | 28 (90.3%) | 3 (9.7%) |
| Installation, Maintenance & Repair | 17 (100.0%) | 0 (0.0%) |
| Total (Category) | 45 (93.8%) | 3 (6.2%) |
| Total (Overall) | 281 (57.9%) | 204 (42.1%) |
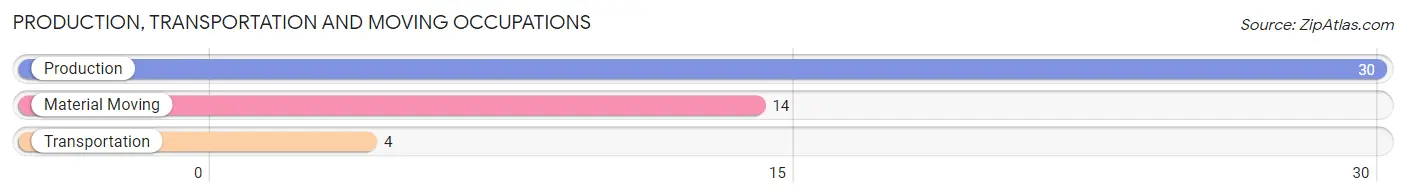
Production, Transportation and Moving Occupations
The most common Production, Transportation and Moving occupations in Nelson are Production (30 | 6.2%), Material Moving (14 | 2.9%), and Transportation (4 | 0.8%).
Production, Transportation and Moving Occupations by Sex
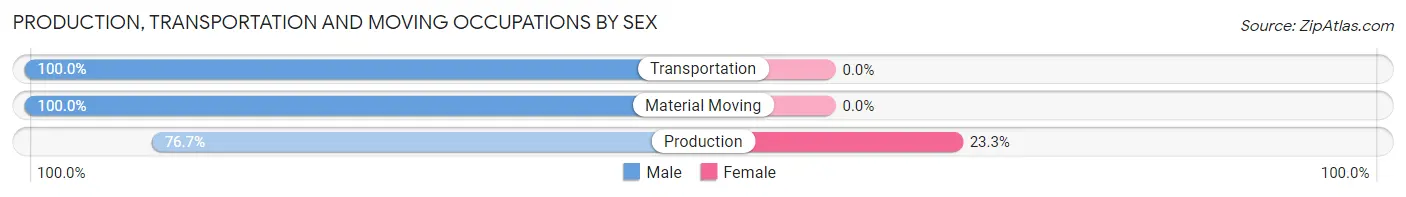
| Occupation | Male | Female |
| Production | 23 (76.7%) | 7 (23.3%) |
| Transportation | 4 (100.0%) | 0 (0.0%) |
| Material Moving | 14 (100.0%) | 0 (0.0%) |
| Total (Category) | 41 (85.4%) | 7 (14.6%) |
| Total (Overall) | 281 (57.9%) | 204 (42.1%) |
Employment Industries by Sex in Nelson
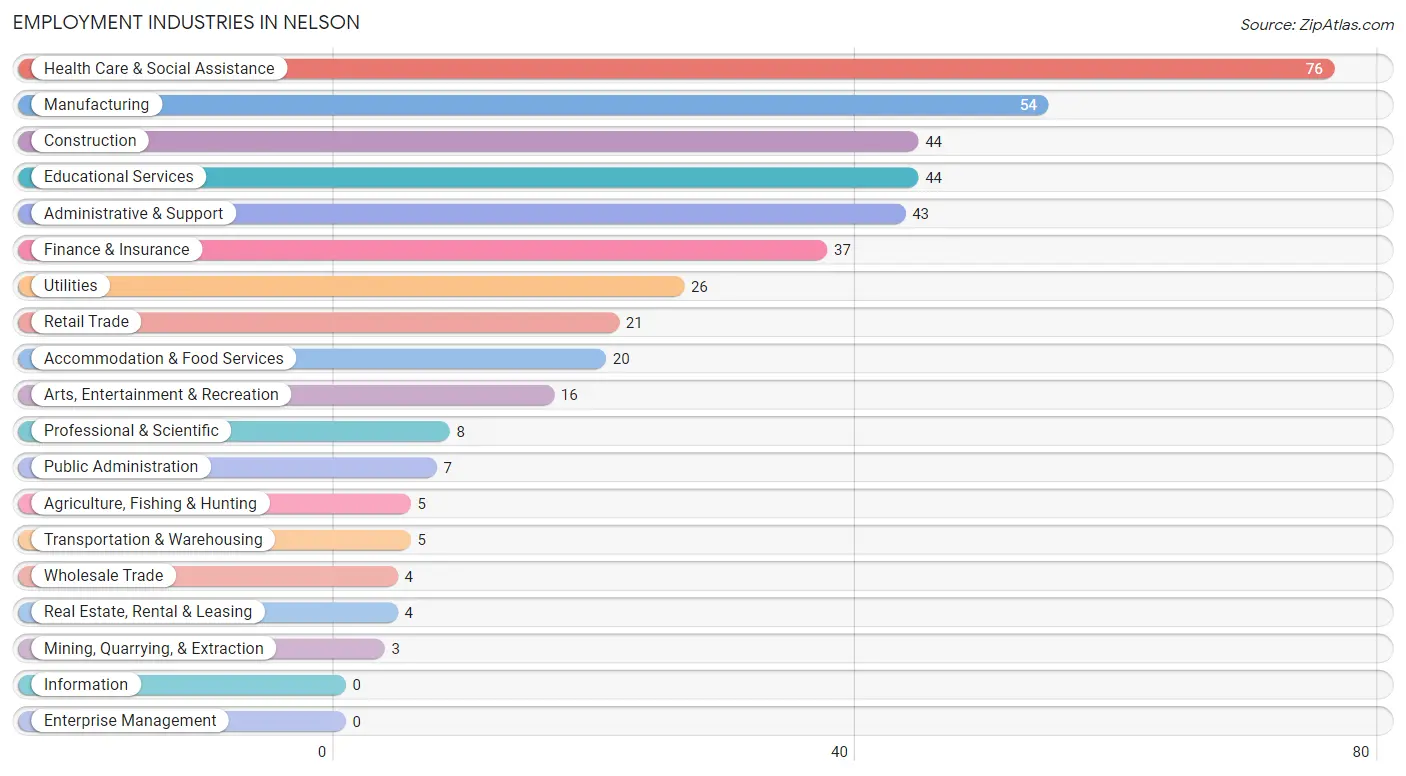
Employment Industries in Nelson
The major employment industries in Nelson include Health Care & Social Assistance (76 | 15.7%), Manufacturing (54 | 11.1%), Construction (44 | 9.1%), Educational Services (44 | 9.1%), and Administrative & Support (43 | 8.9%).
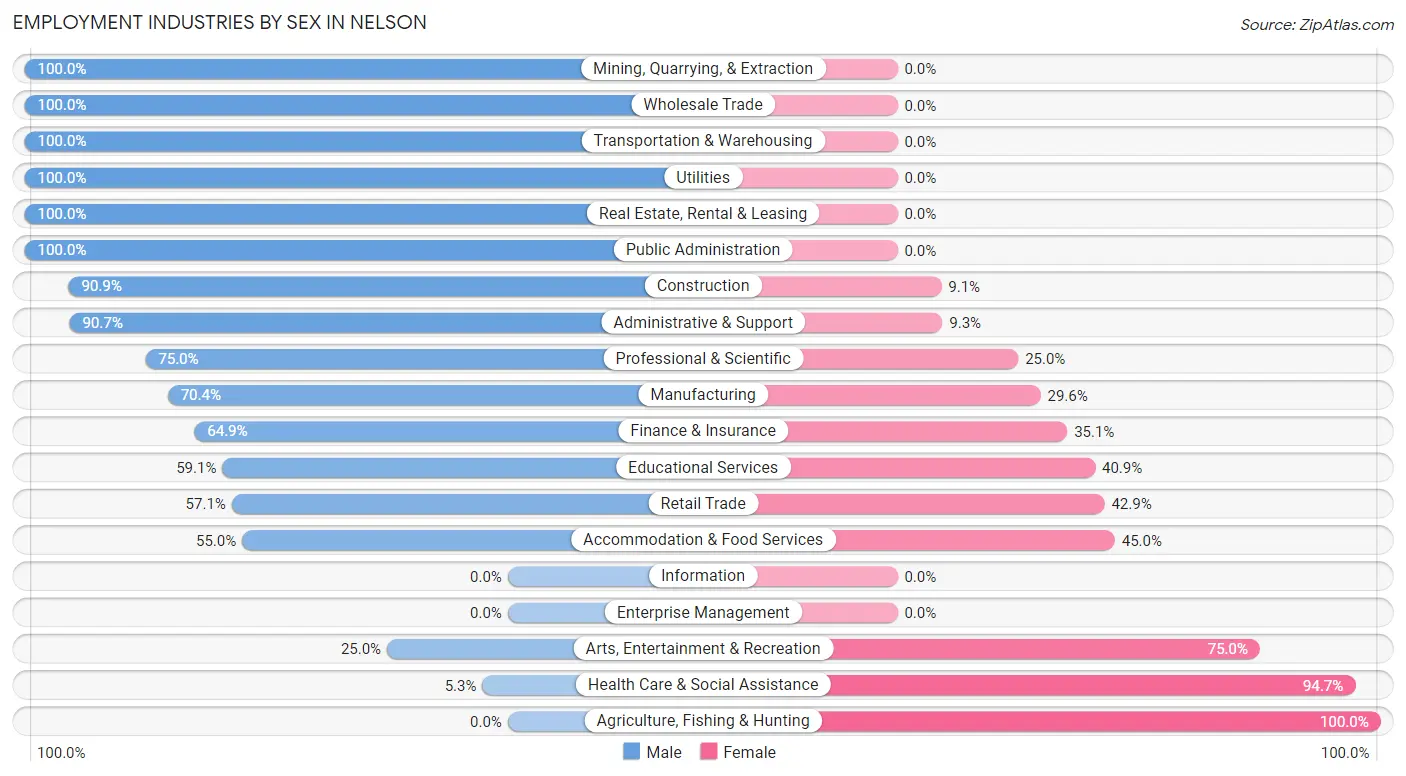
Employment Industries by Sex in Nelson
The Nelson industries that see more men than women are Mining, Quarrying, & Extraction (100.0%), Wholesale Trade (100.0%), and Transportation & Warehousing (100.0%), whereas the industries that tend to have a higher number of women are Agriculture, Fishing & Hunting (100.0%), Health Care & Social Assistance (94.7%), and Arts, Entertainment & Recreation (75.0%).
| Industry | Male | Female |
| Agriculture, Fishing & Hunting | 0 (0.0%) | 5 (100.0%) |
| Mining, Quarrying, & Extraction | 3 (100.0%) | 0 (0.0%) |
| Construction | 40 (90.9%) | 4 (9.1%) |
| Manufacturing | 38 (70.4%) | 16 (29.6%) |
| Wholesale Trade | 4 (100.0%) | 0 (0.0%) |
| Retail Trade | 12 (57.1%) | 9 (42.9%) |
| Transportation & Warehousing | 5 (100.0%) | 0 (0.0%) |
| Utilities | 26 (100.0%) | 0 (0.0%) |
| Information | 0 (0.0%) | 0 (0.0%) |
| Finance & Insurance | 24 (64.9%) | 13 (35.1%) |
| Real Estate, Rental & Leasing | 4 (100.0%) | 0 (0.0%) |
| Professional & Scientific | 6 (75.0%) | 2 (25.0%) |
| Enterprise Management | 0 (0.0%) | 0 (0.0%) |
| Administrative & Support | 39 (90.7%) | 4 (9.3%) |
| Educational Services | 26 (59.1%) | 18 (40.9%) |
| Health Care & Social Assistance | 4 (5.3%) | 72 (94.7%) |
| Arts, Entertainment & Recreation | 4 (25.0%) | 12 (75.0%) |
| Accommodation & Food Services | 11 (55.0%) | 9 (45.0%) |
| Public Administration | 7 (100.0%) | 0 (0.0%) |
| Total | 281 (57.9%) | 204 (42.1%) |
Education in Nelson
School Enrollment in Nelson
The most common levels of schooling among the 230 students in Nelson are elementary school (77 | 33.5%), high school (49 | 21.3%), and middle school (38 | 16.5%).
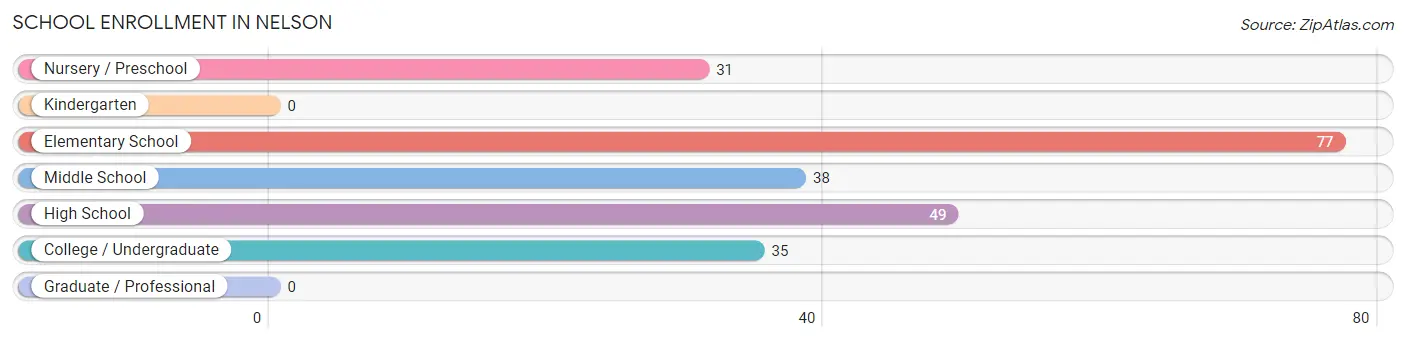
| School Level | # Students | % Students |
| Nursery / Preschool | 31 | 13.5% |
| Kindergarten | 0 | 0.0% |
| Elementary School | 77 | 33.5% |
| Middle School | 38 | 16.5% |
| High School | 49 | 21.3% |
| College / Undergraduate | 35 | 15.2% |
| Graduate / Professional | 0 | 0.0% |
| Total | 230 | 100.0% |
School Enrollment by Age by Funding Source in Nelson
Out of a total of 230 students who are enrolled in schools in Nelson, 68 (29.6%) attend a private institution, while the remaining 162 (70.4%) are enrolled in public schools. The age group of 5 to 9 year old has the highest likelihood of being enrolled in private schools, with 38 (40.4% in the age bracket) enrolled. Conversely, the age group of 3 to 4 year olds has the lowest likelihood of being enrolled in a private school, with 5 (100.0% in the age bracket) attending a public institution.
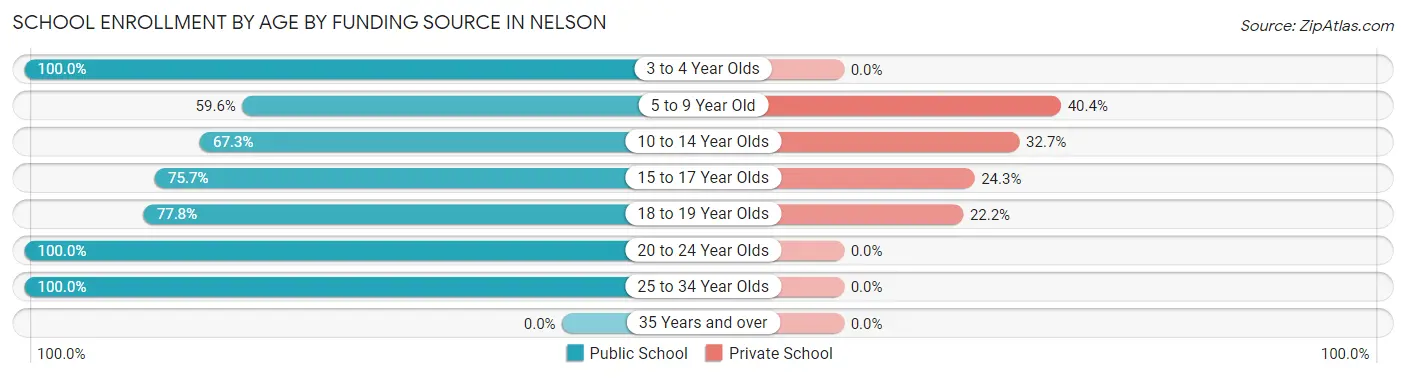
| Age Bracket | Public School | Private School |
| 3 to 4 Year Olds | 5 (100.0%) | 0 (0.0%) |
| 5 to 9 Year Old | 56 (59.6%) | 38 (40.4%) |
| 10 to 14 Year Olds | 35 (67.3%) | 17 (32.7%) |
| 15 to 17 Year Olds | 28 (75.7%) | 9 (24.3%) |
| 18 to 19 Year Olds | 14 (77.8%) | 4 (22.2%) |
| 20 to 24 Year Olds | 21 (100.0%) | 0 (0.0%) |
| 25 to 34 Year Olds | 3 (100.0%) | 0 (0.0%) |
| 35 Years and over | 0 (0.0%) | 0 (0.0%) |
| Total | 162 (70.4%) | 68 (29.6%) |
Educational Attainment by Field of Study in Nelson
Education (37 | 24.0%), business (31 | 20.1%), science & technology (25 | 16.2%), liberal arts & history (24 | 15.6%), and communications (10 | 6.5%) are the most common fields of study among 154 individuals in Nelson who have obtained a bachelor's degree or higher.
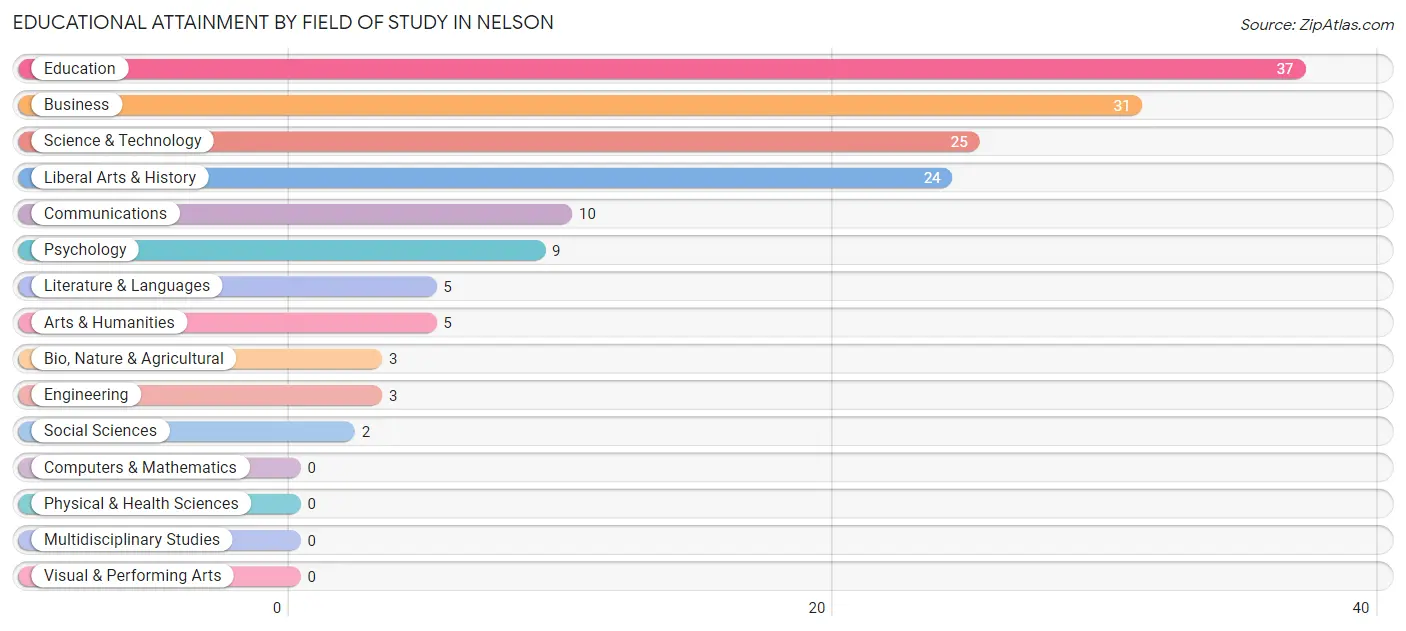
| Field of Study | # Graduates | % Graduates |
| Computers & Mathematics | 0 | 0.0% |
| Bio, Nature & Agricultural | 3 | 1.9% |
| Physical & Health Sciences | 0 | 0.0% |
| Psychology | 9 | 5.8% |
| Social Sciences | 2 | 1.3% |
| Engineering | 3 | 1.9% |
| Multidisciplinary Studies | 0 | 0.0% |
| Science & Technology | 25 | 16.2% |
| Business | 31 | 20.1% |
| Education | 37 | 24.0% |
| Literature & Languages | 5 | 3.3% |
| Liberal Arts & History | 24 | 15.6% |
| Visual & Performing Arts | 0 | 0.0% |
| Communications | 10 | 6.5% |
| Arts & Humanities | 5 | 3.3% |
| Total | 154 | 100.0% |
Transportation & Commute in Nelson
Vehicle Availability by Sex in Nelson
The most prevalent vehicle ownership categories in Nelson are males with 2 vehicles (132, accounting for 47.0%) and females with 2 vehicles (117, making up 66.0%).
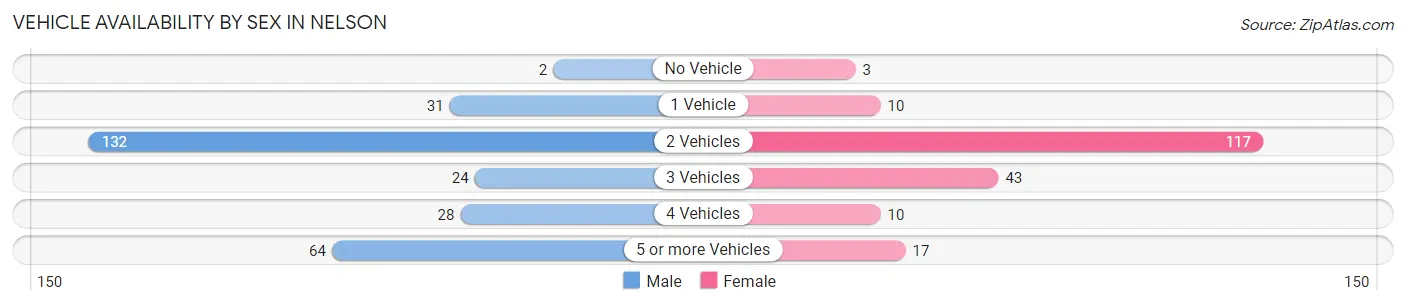
| Vehicles Available | Male | Female |
| No Vehicle | 2 (0.7%) | 3 (1.5%) |
| 1 Vehicle | 31 (11.0%) | 10 (5.0%) |
| 2 Vehicles | 132 (47.0%) | 117 (58.5%) |
| 3 Vehicles | 24 (8.5%) | 43 (21.5%) |
| 4 Vehicles | 28 (10.0%) | 10 (5.0%) |
| 5 or more Vehicles | 64 (22.8%) | 17 (8.5%) |
| Total | 281 (100.0%) | 200 (100.0%) |
Commute Time in Nelson
The most frequently occuring commute durations in Nelson are 15 to 19 minutes (86 commuters, 19.3%), 45 to 59 minutes (84 commuters, 18.9%), and 30 to 34 minutes (73 commuters, 16.4%).
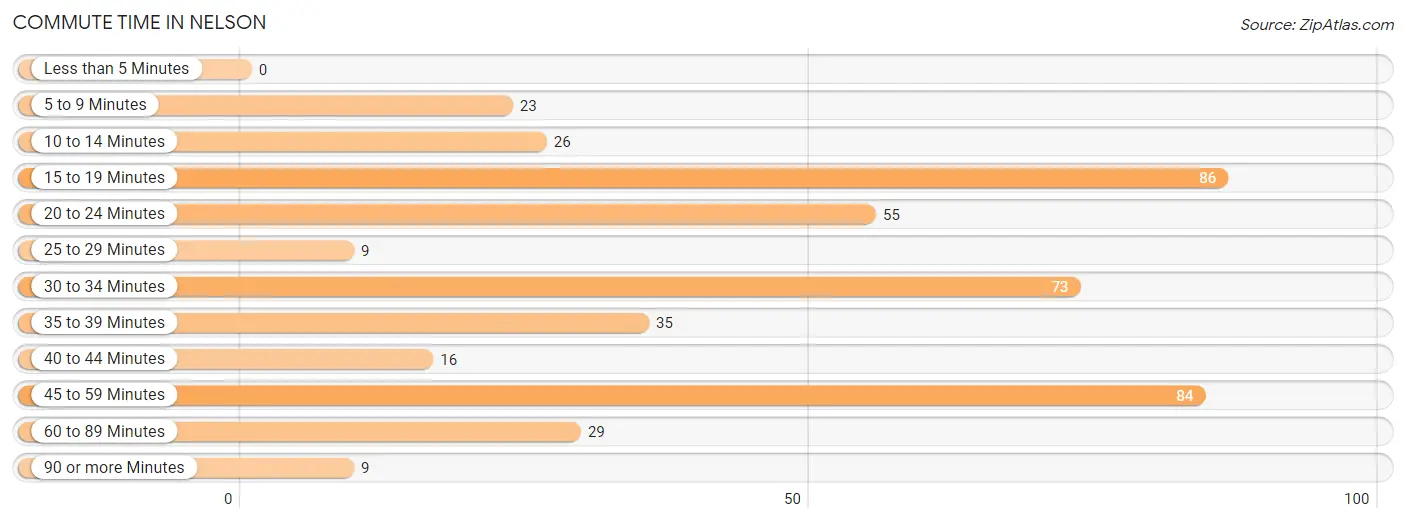
| Commute Time | # Commuters | % Commuters |
| Less than 5 Minutes | 0 | 0.0% |
| 5 to 9 Minutes | 23 | 5.2% |
| 10 to 14 Minutes | 26 | 5.8% |
| 15 to 19 Minutes | 86 | 19.3% |
| 20 to 24 Minutes | 55 | 12.4% |
| 25 to 29 Minutes | 9 | 2.0% |
| 30 to 34 Minutes | 73 | 16.4% |
| 35 to 39 Minutes | 35 | 7.9% |
| 40 to 44 Minutes | 16 | 3.6% |
| 45 to 59 Minutes | 84 | 18.9% |
| 60 to 89 Minutes | 29 | 6.5% |
| 90 or more Minutes | 9 | 2.0% |
Commute Time by Sex in Nelson
The most common commute times in Nelson are 15 to 19 minutes (66 commuters, 25.9%) for males and 30 to 34 minutes (66 commuters, 34.7%) for females.
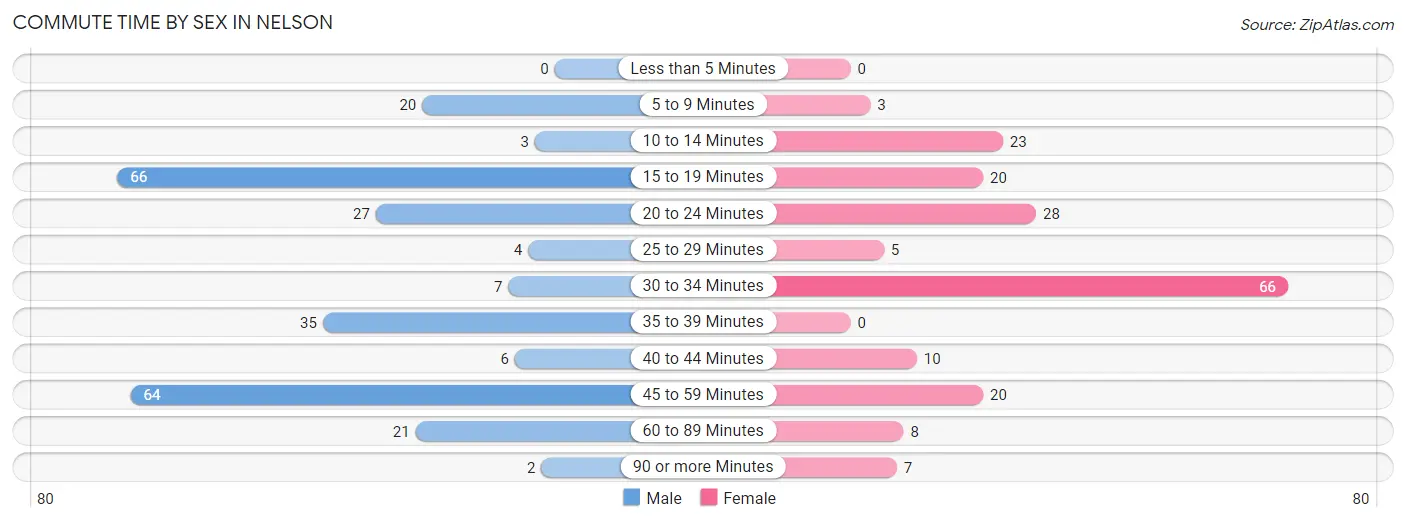
| Commute Time | Male | Female |
| Less than 5 Minutes | 0 (0.0%) | 0 (0.0%) |
| 5 to 9 Minutes | 20 (7.8%) | 3 (1.6%) |
| 10 to 14 Minutes | 3 (1.2%) | 23 (12.1%) |
| 15 to 19 Minutes | 66 (25.9%) | 20 (10.5%) |
| 20 to 24 Minutes | 27 (10.6%) | 28 (14.7%) |
| 25 to 29 Minutes | 4 (1.6%) | 5 (2.6%) |
| 30 to 34 Minutes | 7 (2.8%) | 66 (34.7%) |
| 35 to 39 Minutes | 35 (13.7%) | 0 (0.0%) |
| 40 to 44 Minutes | 6 (2.4%) | 10 (5.3%) |
| 45 to 59 Minutes | 64 (25.1%) | 20 (10.5%) |
| 60 to 89 Minutes | 21 (8.2%) | 8 (4.2%) |
| 90 or more Minutes | 2 (0.8%) | 7 (3.7%) |
Time of Departure to Work by Sex in Nelson
The most frequent times of departure to work in Nelson are 7:00 AM to 7:29 AM (63, 24.7%) for males and 7:00 AM to 7:29 AM (50, 26.3%) for females.
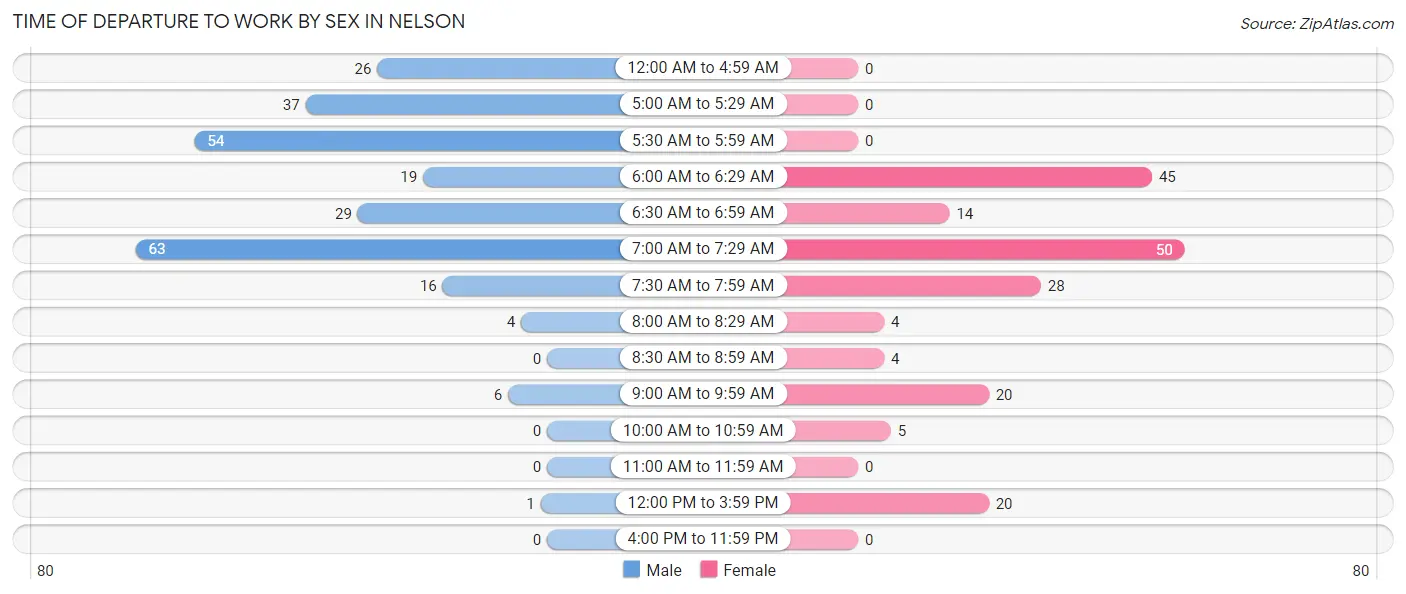
| Time of Departure | Male | Female |
| 12:00 AM to 4:59 AM | 26 (10.2%) | 0 (0.0%) |
| 5:00 AM to 5:29 AM | 37 (14.5%) | 0 (0.0%) |
| 5:30 AM to 5:59 AM | 54 (21.2%) | 0 (0.0%) |
| 6:00 AM to 6:29 AM | 19 (7.4%) | 45 (23.7%) |
| 6:30 AM to 6:59 AM | 29 (11.4%) | 14 (7.4%) |
| 7:00 AM to 7:29 AM | 63 (24.7%) | 50 (26.3%) |
| 7:30 AM to 7:59 AM | 16 (6.3%) | 28 (14.7%) |
| 8:00 AM to 8:29 AM | 4 (1.6%) | 4 (2.1%) |
| 8:30 AM to 8:59 AM | 0 (0.0%) | 4 (2.1%) |
| 9:00 AM to 9:59 AM | 6 (2.4%) | 20 (10.5%) |
| 10:00 AM to 10:59 AM | 0 (0.0%) | 5 (2.6%) |
| 11:00 AM to 11:59 AM | 0 (0.0%) | 0 (0.0%) |
| 12:00 PM to 3:59 PM | 1 (0.4%) | 20 (10.5%) |
| 4:00 PM to 11:59 PM | 0 (0.0%) | 0 (0.0%) |
| Total | 255 (100.0%) | 190 (100.0%) |
Housing Occupancy in Nelson
Occupancy by Ownership in Nelson
Of the total 402 dwellings in Nelson, owner-occupied units account for 304 (75.6%), while renter-occupied units make up 98 (24.4%).
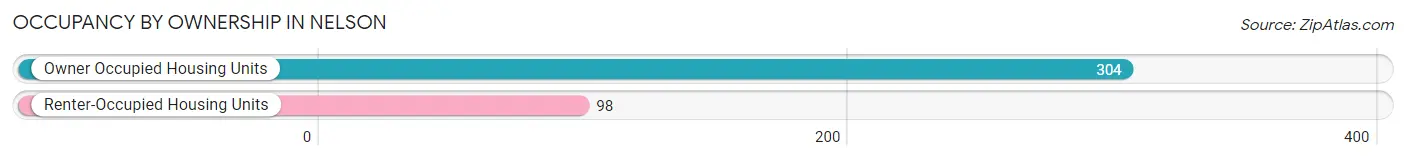
| Occupancy | # Housing Units | % Housing Units |
| Owner Occupied Housing Units | 304 | 75.6% |
| Renter-Occupied Housing Units | 98 | 24.4% |
| Total Occupied Housing Units | 402 | 100.0% |
Occupancy by Household Size in Nelson
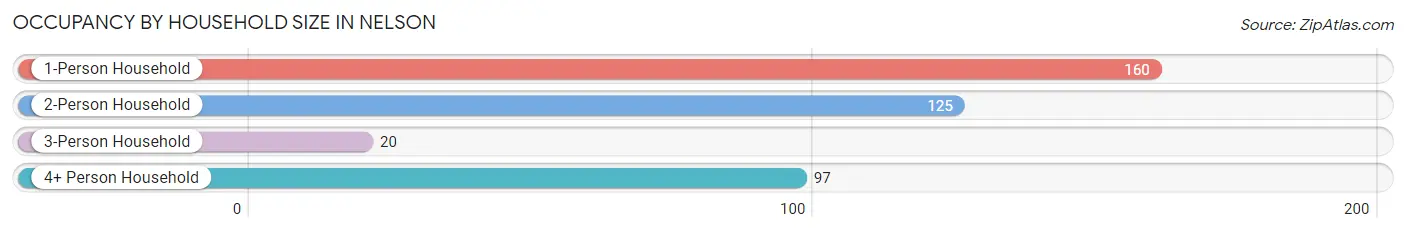
| Household Size | # Housing Units | % Housing Units |
| 1-Person Household | 160 | 39.8% |
| 2-Person Household | 125 | 31.1% |
| 3-Person Household | 20 | 5.0% |
| 4+ Person Household | 97 | 24.1% |
| Total Housing Units | 402 | 100.0% |
Occupancy by Ownership by Household Size in Nelson
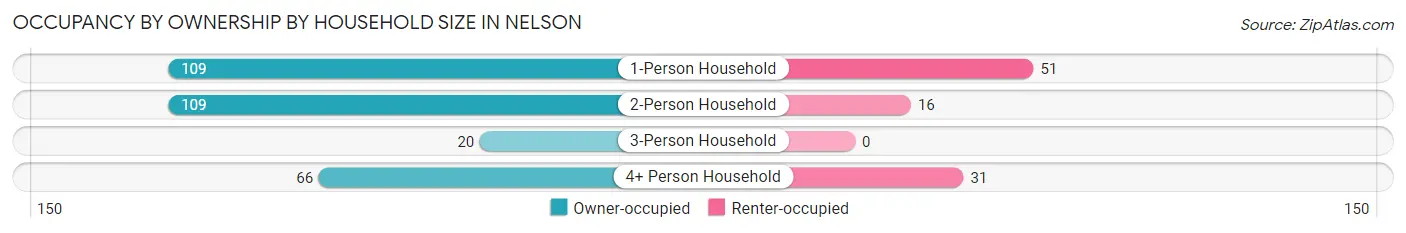
| Household Size | Owner-occupied | Renter-occupied |
| 1-Person Household | 109 (68.1%) | 51 (31.9%) |
| 2-Person Household | 109 (87.2%) | 16 (12.8%) |
| 3-Person Household | 20 (100.0%) | 0 (0.0%) |
| 4+ Person Household | 66 (68.0%) | 31 (32.0%) |
| Total Housing Units | 304 (75.6%) | 98 (24.4%) |
Occupancy by Educational Attainment in Nelson
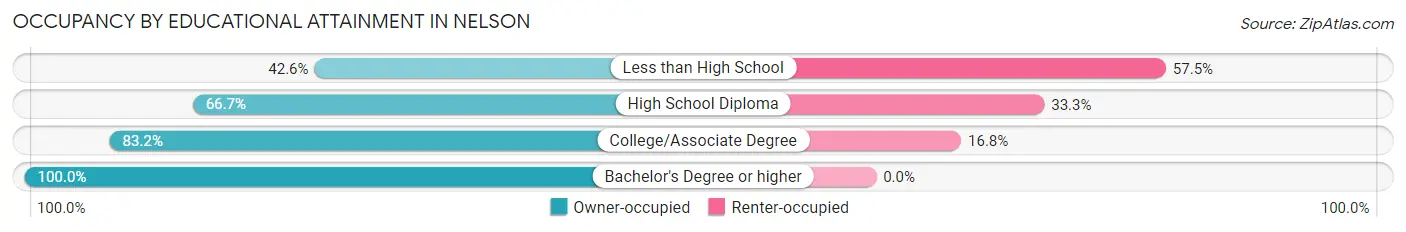
| Household Size | Owner-occupied | Renter-occupied |
| Less than High School | 20 (42.5%) | 27 (57.5%) |
| High School Diploma | 110 (66.7%) | 55 (33.3%) |
| College/Associate Degree | 79 (83.2%) | 16 (16.8%) |
| Bachelor's Degree or higher | 95 (100.0%) | 0 (0.0%) |
Occupancy by Age of Householder in Nelson
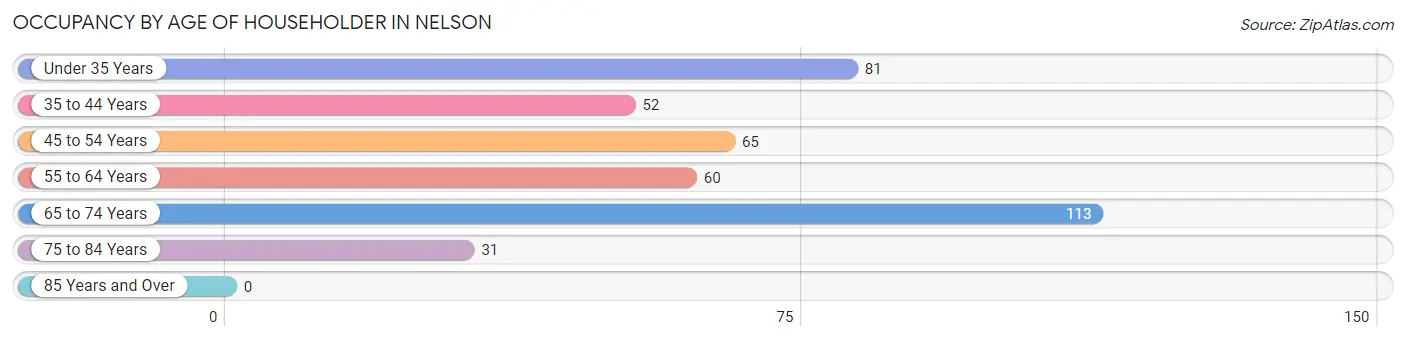
| Age Bracket | # Households | % Households |
| Under 35 Years | 81 | 20.2% |
| 35 to 44 Years | 52 | 12.9% |
| 45 to 54 Years | 65 | 16.2% |
| 55 to 64 Years | 60 | 14.9% |
| 65 to 74 Years | 113 | 28.1% |
| 75 to 84 Years | 31 | 7.7% |
| 85 Years and Over | 0 | 0.0% |
| Total | 402 | 100.0% |
Housing Finances in Nelson
Median Income by Occupancy in Nelson
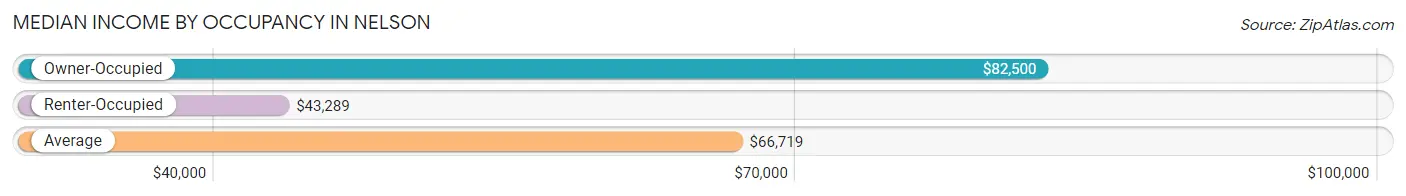
| Occupancy Type | # Households | Median Income |
| Owner-Occupied | 304 (75.6%) | $82,500 |
| Renter-Occupied | 98 (24.4%) | $43,289 |
| Average | 402 (100.0%) | $66,719 |
Occupancy by Householder Income Bracket in Nelson
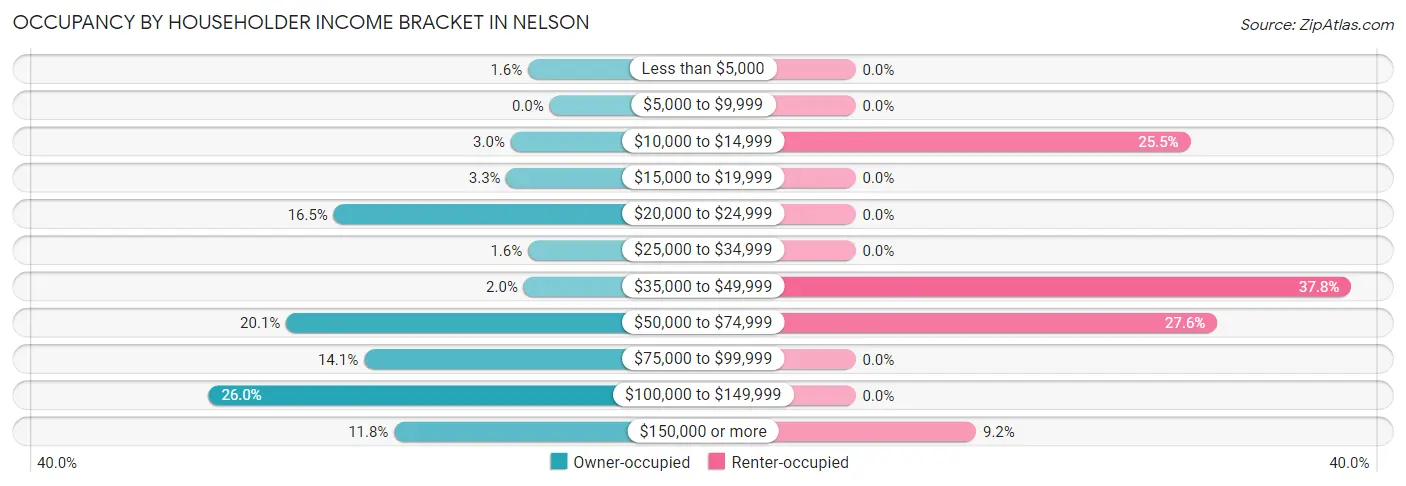
| Income Bracket | Owner-occupied | Renter-occupied |
| Less than $5,000 | 5 (1.6%) | 0 (0.0%) |
| $5,000 to $9,999 | 0 (0.0%) | 0 (0.0%) |
| $10,000 to $14,999 | 9 (3.0%) | 25 (25.5%) |
| $15,000 to $19,999 | 10 (3.3%) | 0 (0.0%) |
| $20,000 to $24,999 | 50 (16.5%) | 0 (0.0%) |
| $25,000 to $34,999 | 5 (1.6%) | 0 (0.0%) |
| $35,000 to $49,999 | 6 (2.0%) | 37 (37.8%) |
| $50,000 to $74,999 | 61 (20.1%) | 27 (27.6%) |
| $75,000 to $99,999 | 43 (14.1%) | 0 (0.0%) |
| $100,000 to $149,999 | 79 (26.0%) | 0 (0.0%) |
| $150,000 or more | 36 (11.8%) | 9 (9.2%) |
| Total | 304 (100.0%) | 98 (100.0%) |
Monthly Housing Cost Tiers in Nelson
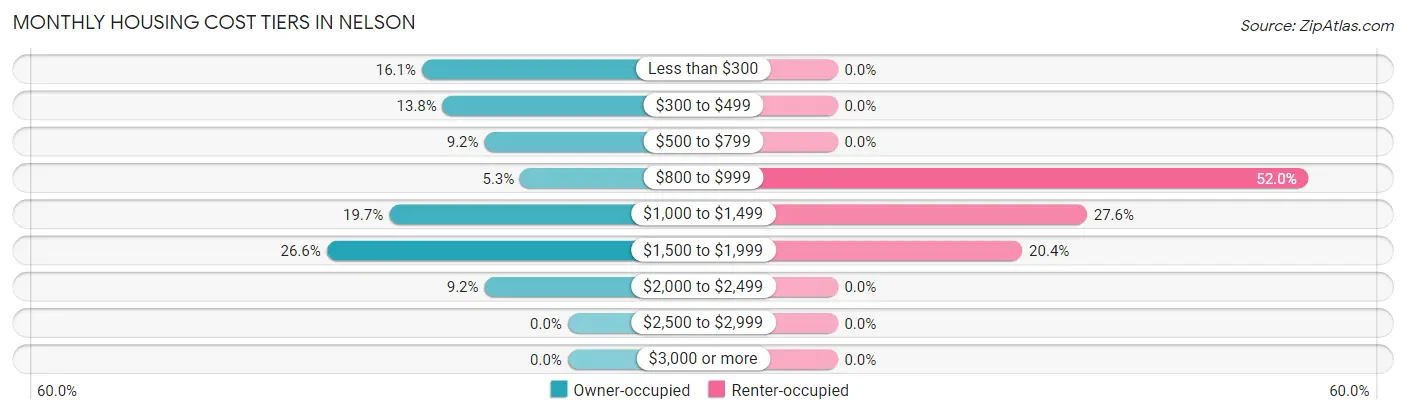
| Monthly Cost | Owner-occupied | Renter-occupied |
| Less than $300 | 49 (16.1%) | 0 (0.0%) |
| $300 to $499 | 42 (13.8%) | 0 (0.0%) |
| $500 to $799 | 28 (9.2%) | 0 (0.0%) |
| $800 to $999 | 16 (5.3%) | 51 (52.0%) |
| $1,000 to $1,499 | 60 (19.7%) | 27 (27.6%) |
| $1,500 to $1,999 | 81 (26.6%) | 20 (20.4%) |
| $2,000 to $2,499 | 28 (9.2%) | 0 (0.0%) |
| $2,500 to $2,999 | 0 (0.0%) | 0 (0.0%) |
| $3,000 or more | 0 (0.0%) | 0 (0.0%) |
| Total | 304 (100.0%) | 98 (100.0%) |
Physical Housing Characteristics in Nelson
Housing Structures in Nelson
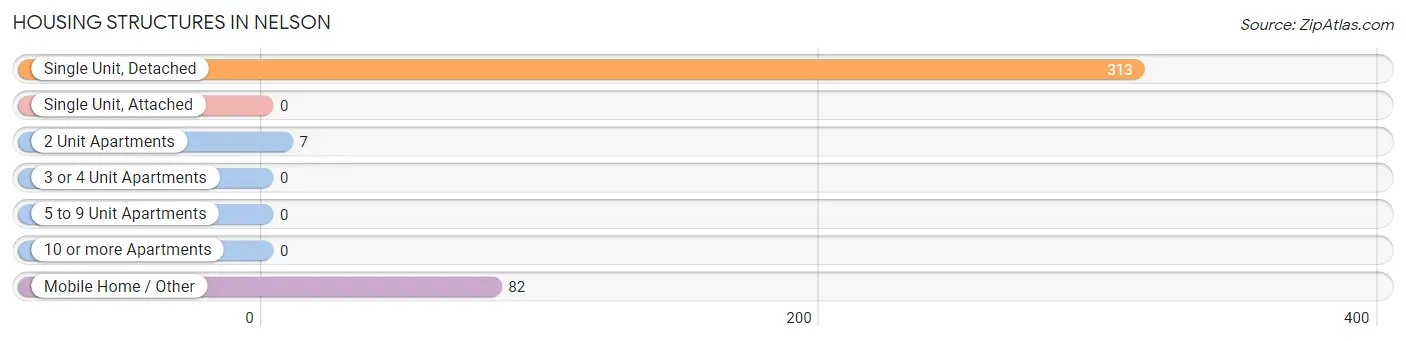
| Structure Type | # Housing Units | % Housing Units |
| Single Unit, Detached | 313 | 77.9% |
| Single Unit, Attached | 0 | 0.0% |
| 2 Unit Apartments | 7 | 1.7% |
| 3 or 4 Unit Apartments | 0 | 0.0% |
| 5 to 9 Unit Apartments | 0 | 0.0% |
| 10 or more Apartments | 0 | 0.0% |
| Mobile Home / Other | 82 | 20.4% |
| Total | 402 | 100.0% |
Housing Structures by Occupancy in Nelson
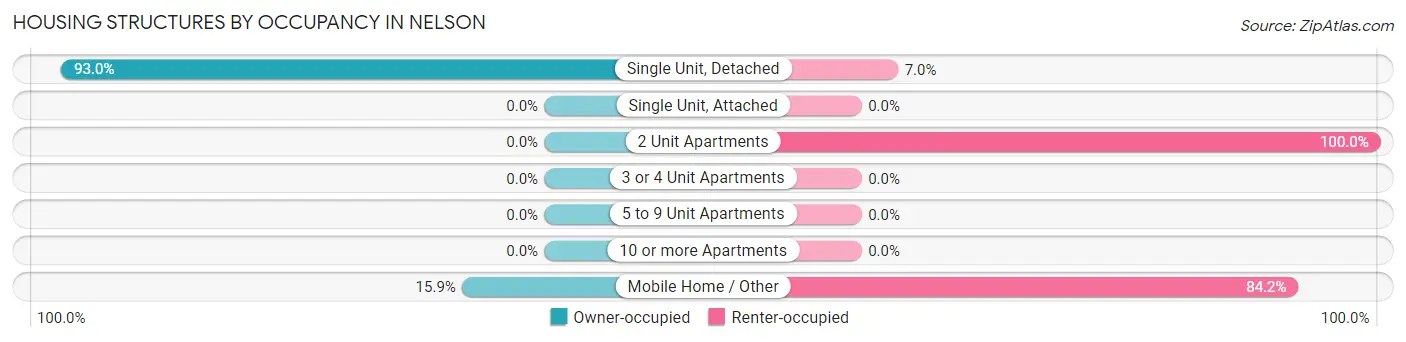
| Structure Type | Owner-occupied | Renter-occupied |
| Single Unit, Detached | 291 (93.0%) | 22 (7.0%) |
| Single Unit, Attached | 0 (0.0%) | 0 (0.0%) |
| 2 Unit Apartments | 0 (0.0%) | 7 (100.0%) |
| 3 or 4 Unit Apartments | 0 (0.0%) | 0 (0.0%) |
| 5 to 9 Unit Apartments | 0 (0.0%) | 0 (0.0%) |
| 10 or more Apartments | 0 (0.0%) | 0 (0.0%) |
| Mobile Home / Other | 13 (15.9%) | 69 (84.2%) |
| Total | 304 (75.6%) | 98 (24.4%) |
Housing Structures by Number of Rooms in Nelson
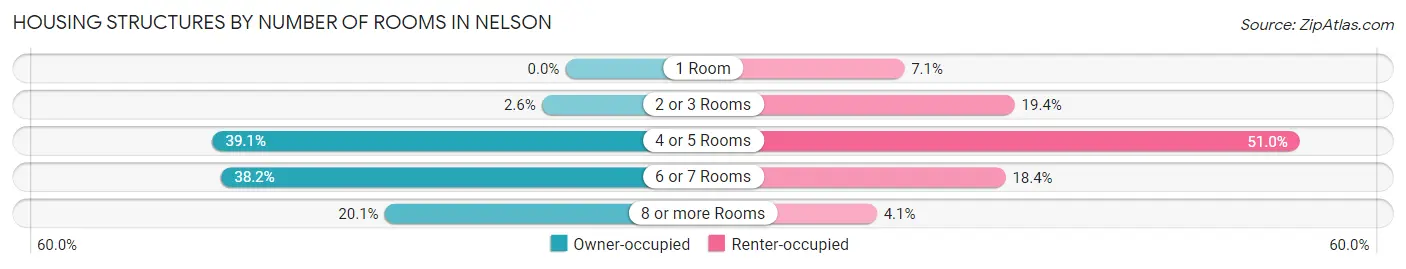
| Number of Rooms | Owner-occupied | Renter-occupied |
| 1 Room | 0 (0.0%) | 7 (7.1%) |
| 2 or 3 Rooms | 8 (2.6%) | 19 (19.4%) |
| 4 or 5 Rooms | 119 (39.1%) | 50 (51.0%) |
| 6 or 7 Rooms | 116 (38.2%) | 18 (18.4%) |
| 8 or more Rooms | 61 (20.1%) | 4 (4.1%) |
| Total | 304 (100.0%) | 98 (100.0%) |
Housing Structure by Heating Type in Nelson
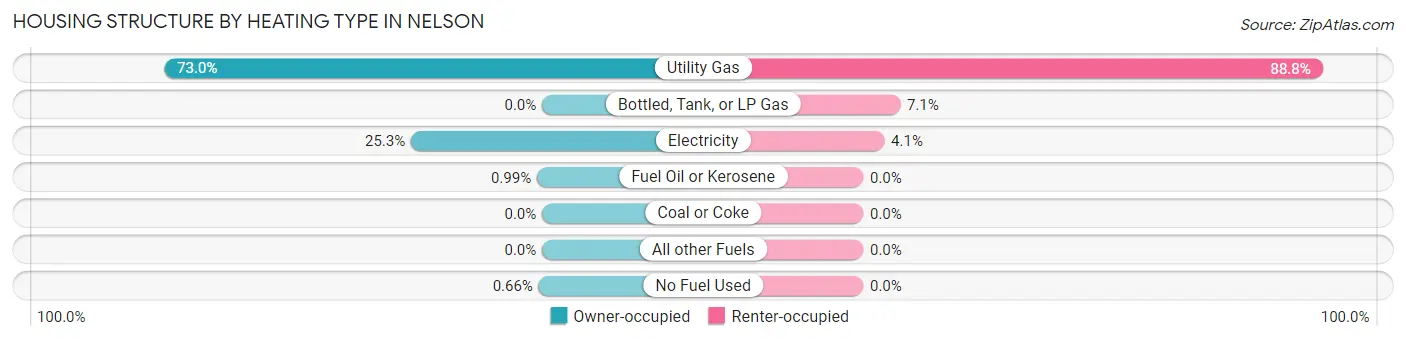
| Heating Type | Owner-occupied | Renter-occupied |
| Utility Gas | 222 (73.0%) | 87 (88.8%) |
| Bottled, Tank, or LP Gas | 0 (0.0%) | 7 (7.1%) |
| Electricity | 77 (25.3%) | 4 (4.1%) |
| Fuel Oil or Kerosene | 3 (1.0%) | 0 (0.0%) |
| Coal or Coke | 0 (0.0%) | 0 (0.0%) |
| All other Fuels | 0 (0.0%) | 0 (0.0%) |
| No Fuel Used | 2 (0.7%) | 0 (0.0%) |
| Total | 304 (100.0%) | 98 (100.0%) |
Household Vehicle Usage in Nelson
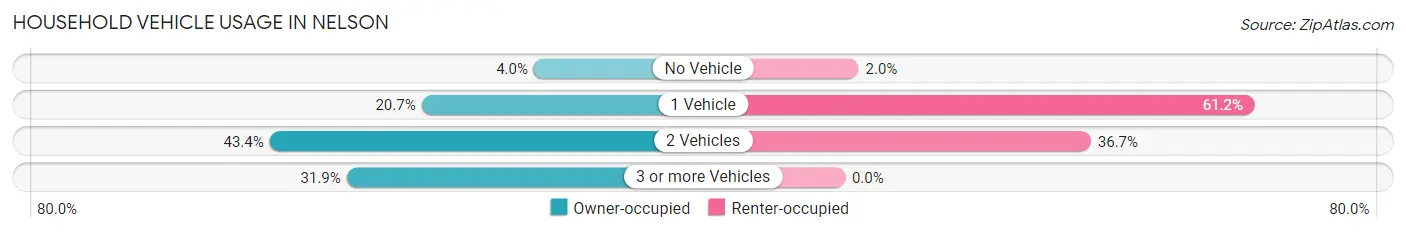
| Vehicles per Household | Owner-occupied | Renter-occupied |
| No Vehicle | 12 (4.0%) | 2 (2.0%) |
| 1 Vehicle | 63 (20.7%) | 60 (61.2%) |
| 2 Vehicles | 132 (43.4%) | 36 (36.7%) |
| 3 or more Vehicles | 97 (31.9%) | 0 (0.0%) |
| Total | 304 (100.0%) | 98 (100.0%) |
Real Estate & Mortgages in Nelson
Real Estate and Mortgage Overview in Nelson
| Characteristic | Without Mortgage | With Mortgage |
| Housing Units | 110 | 194 |
| Median Property Value | - | - |
| Median Household Income | - | - |
| Monthly Housing Costs | $330 | $0 |
| Real Estate Taxes | $682 | $0 |
Property Value by Mortgage Status in Nelson
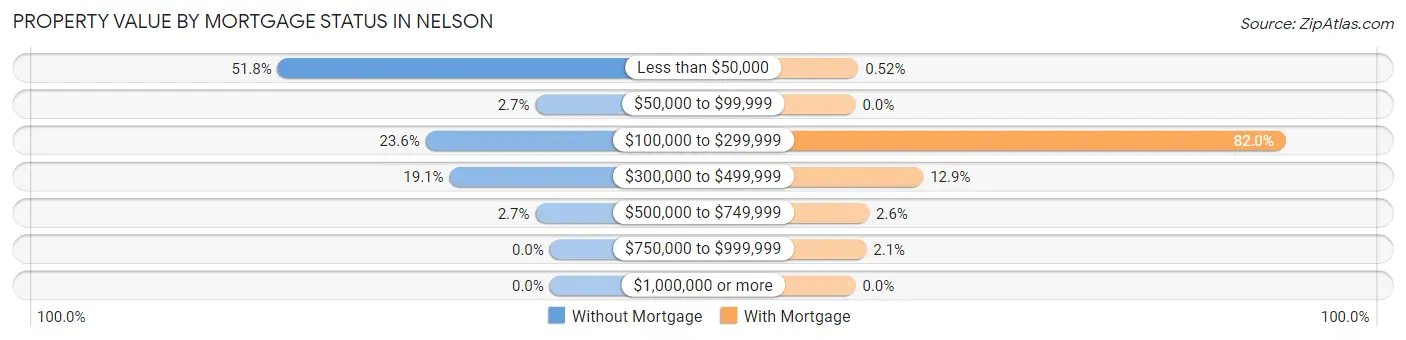
| Property Value | Without Mortgage | With Mortgage |
| Less than $50,000 | 57 (51.8%) | 1 (0.5%) |
| $50,000 to $99,999 | 3 (2.7%) | 0 (0.0%) |
| $100,000 to $299,999 | 26 (23.6%) | 159 (82.0%) |
| $300,000 to $499,999 | 21 (19.1%) | 25 (12.9%) |
| $500,000 to $749,999 | 3 (2.7%) | 5 (2.6%) |
| $750,000 to $999,999 | 0 (0.0%) | 4 (2.1%) |
| $1,000,000 or more | 0 (0.0%) | 0 (0.0%) |
| Total | 110 (100.0%) | 194 (100.0%) |
Household Income by Mortgage Status in Nelson
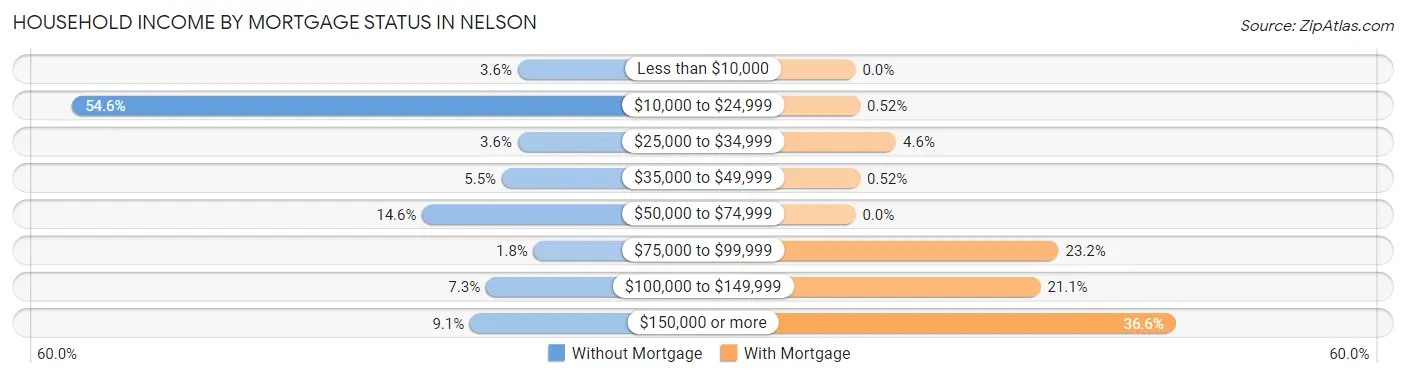
| Household Income | Without Mortgage | With Mortgage |
| Less than $10,000 | 4 (3.6%) | 0 (0.0%) |
| $10,000 to $24,999 | 60 (54.5%) | 1 (0.5%) |
| $25,000 to $34,999 | 4 (3.6%) | 9 (4.6%) |
| $35,000 to $49,999 | 6 (5.4%) | 1 (0.5%) |
| $50,000 to $74,999 | 16 (14.5%) | 0 (0.0%) |
| $75,000 to $99,999 | 2 (1.8%) | 45 (23.2%) |
| $100,000 to $149,999 | 8 (7.3%) | 41 (21.1%) |
| $150,000 or more | 10 (9.1%) | 71 (36.6%) |
| Total | 110 (100.0%) | 194 (100.0%) |
Property Value to Household Income Ratio in Nelson
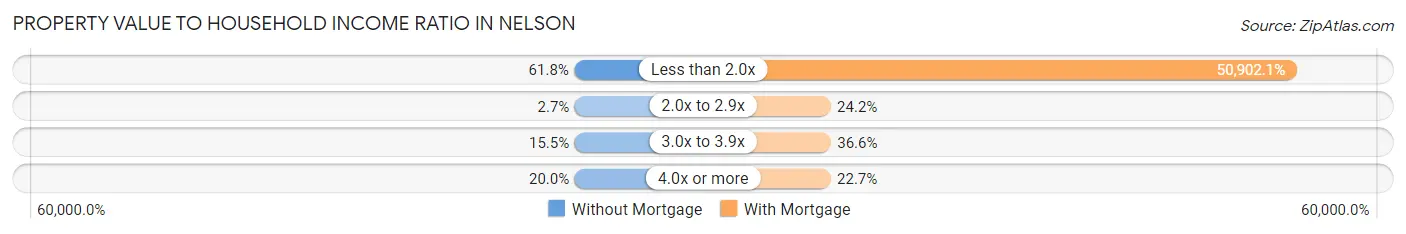
| Value-to-Income Ratio | Without Mortgage | With Mortgage |
| Less than 2.0x | 68 (61.8%) | 98,750 (50,902.1%) |
| 2.0x to 2.9x | 3 (2.7%) | 47 (24.2%) |
| 3.0x to 3.9x | 17 (15.4%) | 71 (36.6%) |
| 4.0x or more | 22 (20.0%) | 44 (22.7%) |
| Total | 110 (100.0%) | 194 (100.0%) |
Real Estate Taxes by Mortgage Status in Nelson
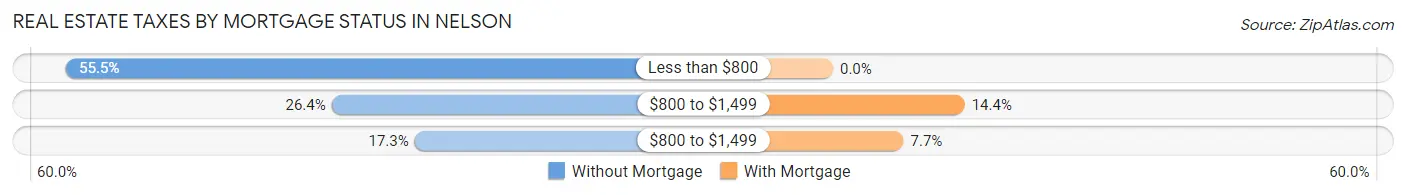
| Property Taxes | Without Mortgage | With Mortgage |
| Less than $800 | 61 (55.4%) | 0 (0.0%) |
| $800 to $1,499 | 29 (26.4%) | 28 (14.4%) |
| $800 to $1,499 | 19 (17.3%) | 15 (7.7%) |
| Total | 110 (100.0%) | 194 (100.0%) |
Health & Disability in Nelson
Health Insurance Coverage by Age in Nelson
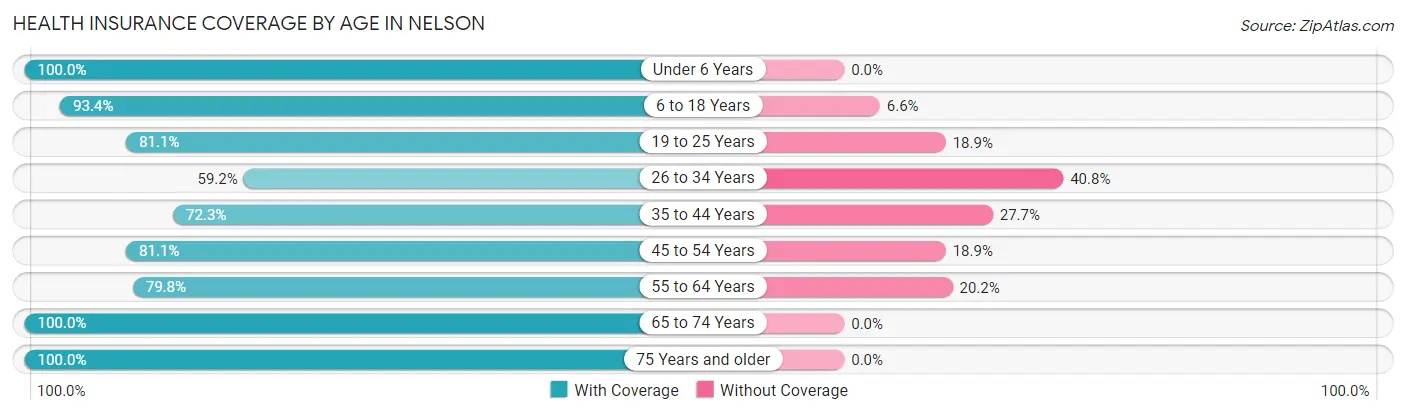
| Age Bracket | With Coverage | Without Coverage |
| Under 6 Years | 67 (100.0%) | 0 (0.0%) |
| 6 to 18 Years | 155 (93.4%) | 11 (6.6%) |
| 19 to 25 Years | 30 (81.1%) | 7 (18.9%) |
| 26 to 34 Years | 71 (59.2%) | 49 (40.8%) |
| 35 to 44 Years | 94 (72.3%) | 36 (27.7%) |
| 45 to 54 Years | 90 (81.1%) | 21 (18.9%) |
| 55 to 64 Years | 87 (79.8%) | 22 (20.2%) |
| 65 to 74 Years | 154 (100.0%) | 0 (0.0%) |
| 75 Years and older | 52 (100.0%) | 0 (0.0%) |
| Total | 800 (84.6%) | 146 (15.4%) |
Health Insurance Coverage by Citizenship Status in Nelson
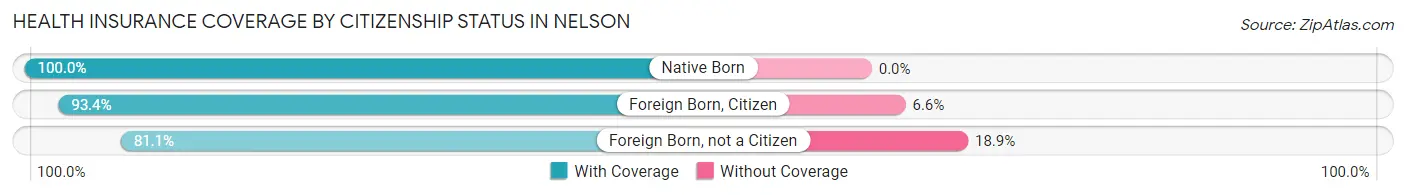
| Citizenship Status | With Coverage | Without Coverage |
| Native Born | 67 (100.0%) | 0 (0.0%) |
| Foreign Born, Citizen | 155 (93.4%) | 11 (6.6%) |
| Foreign Born, not a Citizen | 30 (81.1%) | 7 (18.9%) |
Health Insurance Coverage by Household Income in Nelson
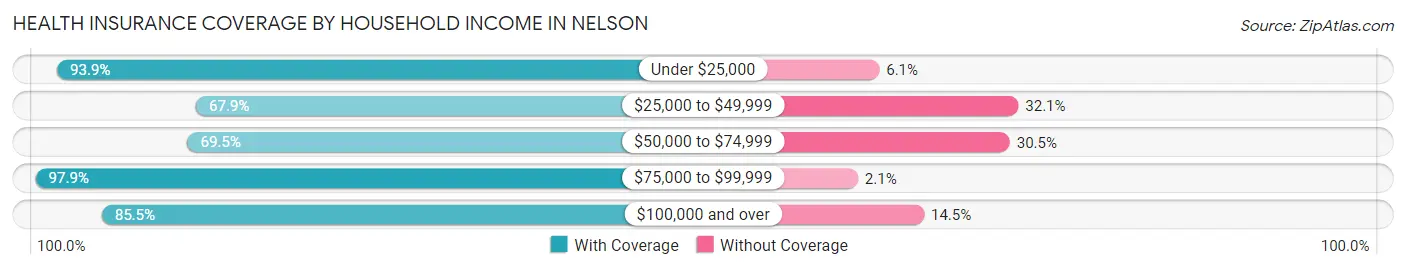
| Household Income | With Coverage | Without Coverage |
| Under $25,000 | 108 (93.9%) | 7 (6.1%) |
| $25,000 to $49,999 | 38 (67.9%) | 18 (32.1%) |
| $50,000 to $74,999 | 141 (69.5%) | 62 (30.5%) |
| $75,000 to $99,999 | 188 (97.9%) | 4 (2.1%) |
| $100,000 and over | 325 (85.5%) | 55 (14.5%) |
Public vs Private Health Insurance Coverage by Age in Nelson
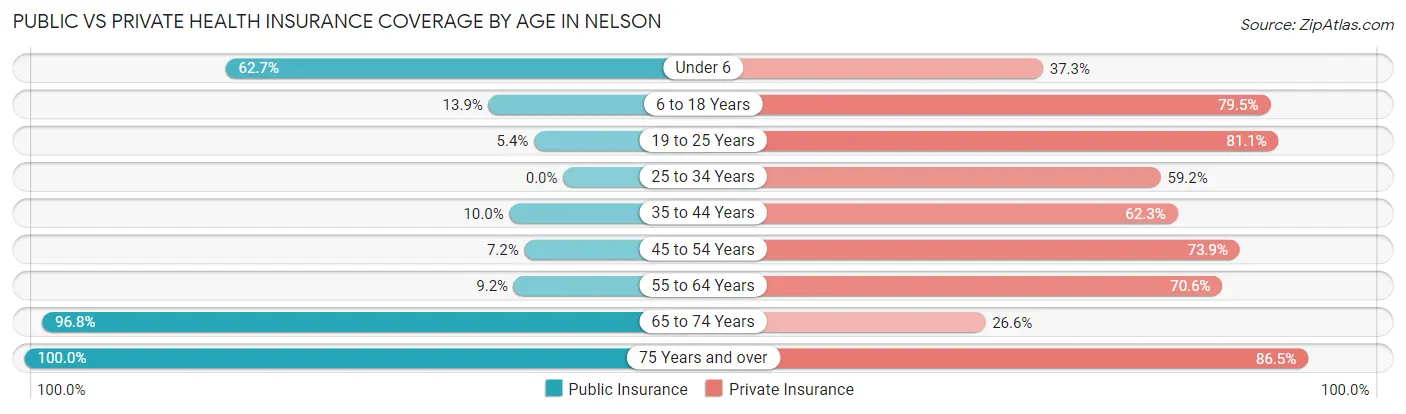
| Age Bracket | Public Insurance | Private Insurance |
| Under 6 | 42 (62.7%) | 25 (37.3%) |
| 6 to 18 Years | 23 (13.9%) | 132 (79.5%) |
| 19 to 25 Years | 2 (5.4%) | 30 (81.1%) |
| 25 to 34 Years | 0 (0.0%) | 71 (59.2%) |
| 35 to 44 Years | 13 (10.0%) | 81 (62.3%) |
| 45 to 54 Years | 8 (7.2%) | 82 (73.9%) |
| 55 to 64 Years | 10 (9.2%) | 77 (70.6%) |
| 65 to 74 Years | 149 (96.8%) | 41 (26.6%) |
| 75 Years and over | 52 (100.0%) | 45 (86.5%) |
| Total | 299 (31.6%) | 584 (61.7%) |
Disability Status by Sex by Age in Nelson
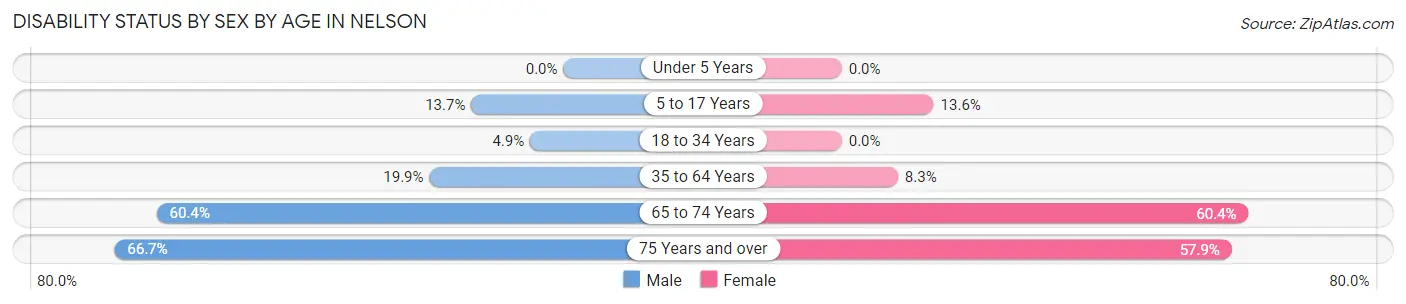
| Age Bracket | Male | Female |
| Under 5 Years | 0 (0.0%) | 0 (0.0%) |
| 5 to 17 Years | 16 (13.7%) | 9 (13.6%) |
| 18 to 34 Years | 4 (4.9%) | 0 (0.0%) |
| 35 to 64 Years | 41 (19.9%) | 12 (8.3%) |
| 65 to 74 Years | 61 (60.4%) | 32 (60.4%) |
| 75 Years and over | 22 (66.7%) | 11 (57.9%) |
Disability Class by Sex by Age in Nelson
Disability Class: Hearing Difficulty
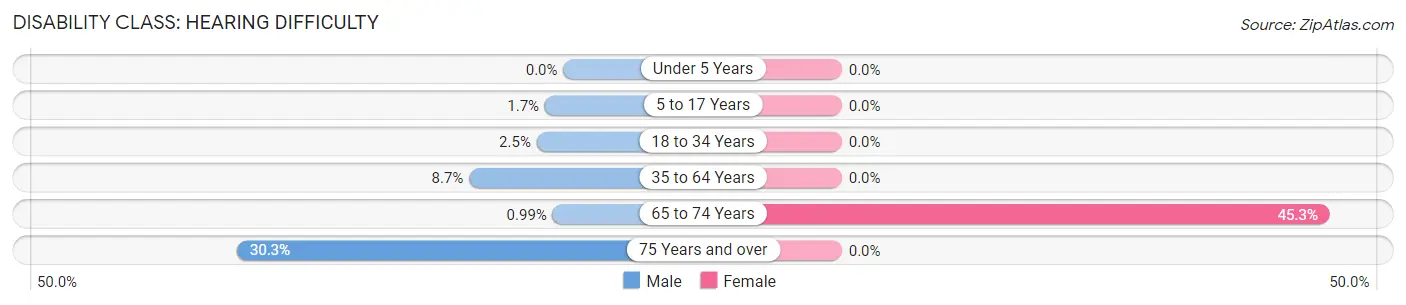
| Age Bracket | Male | Female |
| Under 5 Years | 0 (0.0%) | 0 (0.0%) |
| 5 to 17 Years | 2 (1.7%) | 0 (0.0%) |
| 18 to 34 Years | 2 (2.5%) | 0 (0.0%) |
| 35 to 64 Years | 18 (8.7%) | 0 (0.0%) |
| 65 to 74 Years | 1 (1.0%) | 24 (45.3%) |
| 75 Years and over | 10 (30.3%) | 0 (0.0%) |
Disability Class: Vision Difficulty
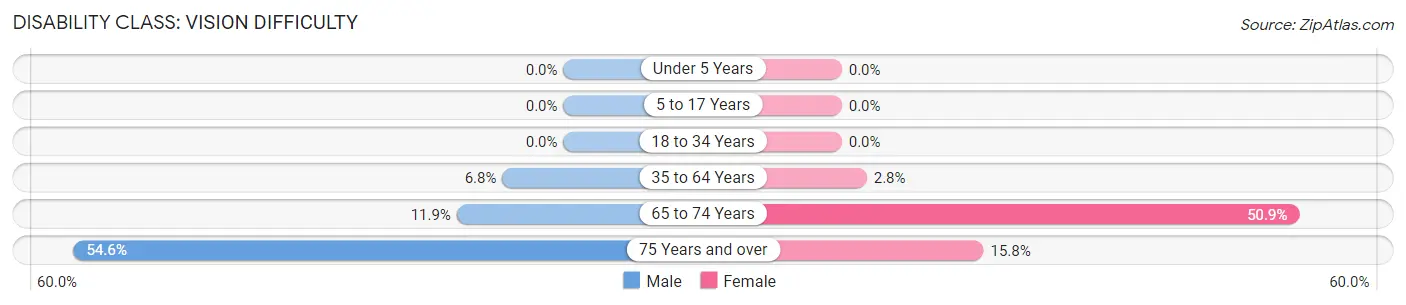
| Age Bracket | Male | Female |
| Under 5 Years | 0 (0.0%) | 0 (0.0%) |
| 5 to 17 Years | 0 (0.0%) | 0 (0.0%) |
| 18 to 34 Years | 0 (0.0%) | 0 (0.0%) |
| 35 to 64 Years | 14 (6.8%) | 4 (2.8%) |
| 65 to 74 Years | 12 (11.9%) | 27 (50.9%) |
| 75 Years and over | 18 (54.5%) | 3 (15.8%) |
Disability Class: Cognitive Difficulty
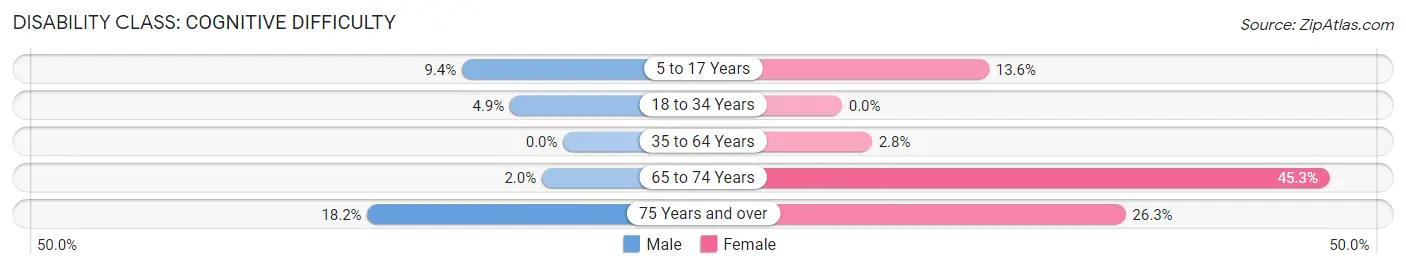
| Age Bracket | Male | Female |
| 5 to 17 Years | 11 (9.4%) | 9 (13.6%) |
| 18 to 34 Years | 4 (4.9%) | 0 (0.0%) |
| 35 to 64 Years | 0 (0.0%) | 4 (2.8%) |
| 65 to 74 Years | 2 (2.0%) | 24 (45.3%) |
| 75 Years and over | 6 (18.2%) | 5 (26.3%) |
Disability Class: Ambulatory Difficulty
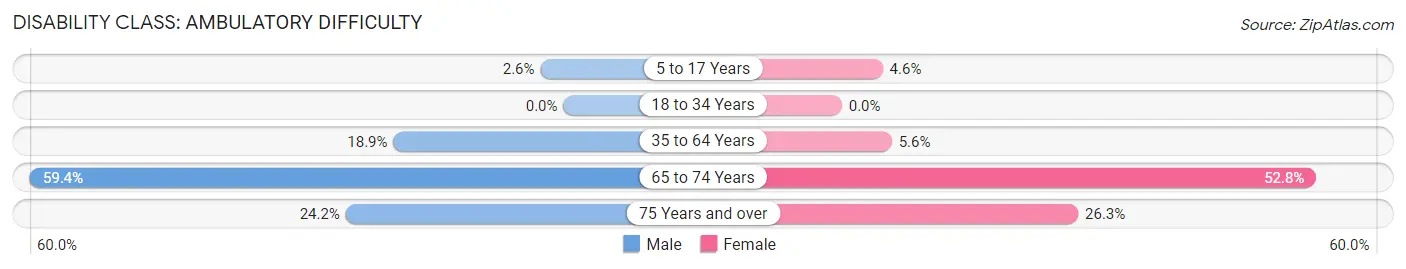
| Age Bracket | Male | Female |
| 5 to 17 Years | 3 (2.6%) | 3 (4.5%) |
| 18 to 34 Years | 0 (0.0%) | 0 (0.0%) |
| 35 to 64 Years | 39 (18.9%) | 8 (5.6%) |
| 65 to 74 Years | 60 (59.4%) | 28 (52.8%) |
| 75 Years and over | 8 (24.2%) | 5 (26.3%) |
Disability Class: Self-Care Difficulty
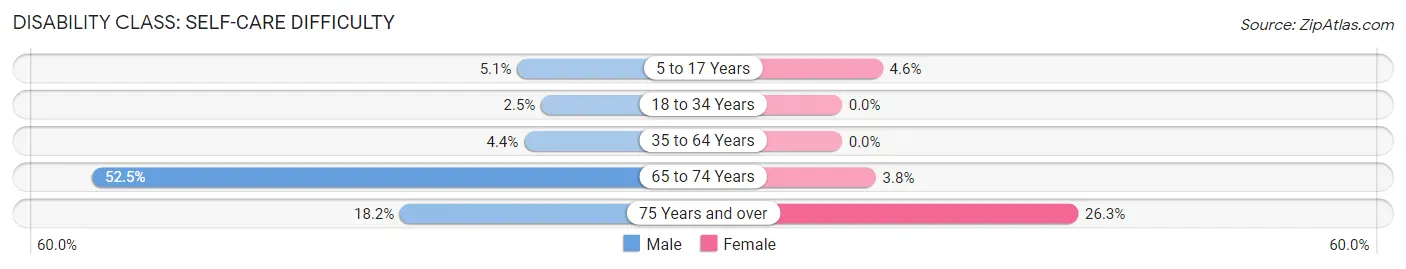
| Age Bracket | Male | Female |
| 5 to 17 Years | 6 (5.1%) | 3 (4.5%) |
| 18 to 34 Years | 2 (2.5%) | 0 (0.0%) |
| 35 to 64 Years | 9 (4.4%) | 0 (0.0%) |
| 65 to 74 Years | 53 (52.5%) | 2 (3.8%) |
| 75 Years and over | 6 (18.2%) | 5 (26.3%) |
Technology Access in Nelson
Computing Device Access in Nelson
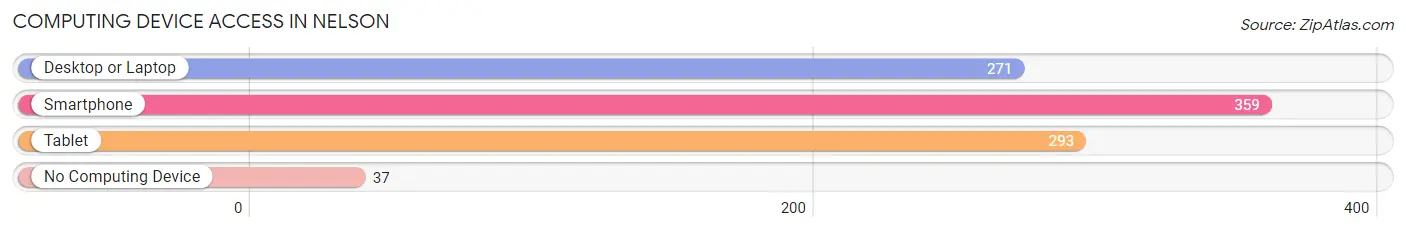
| Device Type | # Households | % Households |
| Desktop or Laptop | 271 | 67.4% |
| Smartphone | 359 | 89.3% |
| Tablet | 293 | 72.9% |
| No Computing Device | 37 | 9.2% |
| Total | 402 | 100.0% |
Internet Access in Nelson
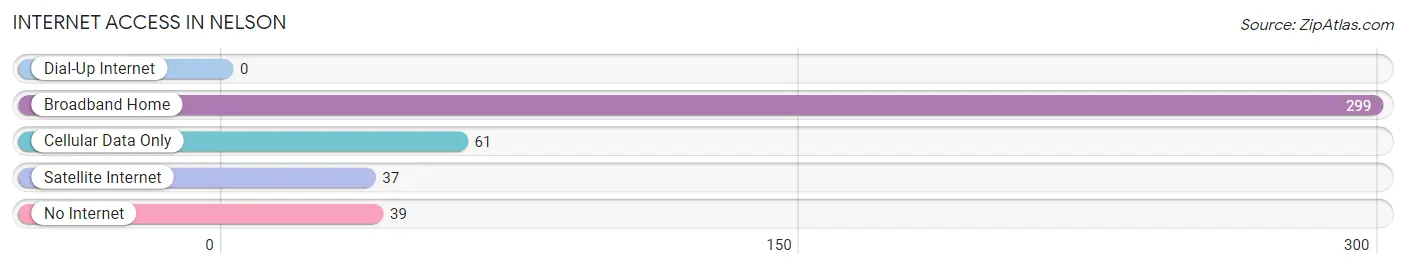
| Internet Type | # Households | % Households |
| Dial-Up Internet | 0 | 0.0% |
| Broadband Home | 299 | 74.4% |
| Cellular Data Only | 61 | 15.2% |
| Satellite Internet | 37 | 9.2% |
| No Internet | 39 | 9.7% |
| Total | 402 | 100.0% |
Nelson Summary
Nelson is a small city located in the state of Georgia, United States. It is situated in the foothills of the Appalachian Mountains, about 30 miles north of Atlanta. The city has a population of approximately 1,500 people and is part of the Cherokee County.
History
Nelson was founded in 1832 by a group of settlers from North Carolina. The city was named after the first settler, William Nelson. The settlers were attracted to the area due to its fertile soil and abundant natural resources. The city quickly grew and by the late 1800s, it had become a thriving agricultural center.
In the early 1900s, the city began to experience a period of industrialization. The first major industry to come to Nelson was the Georgia Marble Company, which opened a quarry in the area in 1906. This was followed by the opening of a cotton mill in 1910. The city continued to grow and by the mid-1900s, it had become a major center for manufacturing and industry.
Geography
Nelson is located in the foothills of the Appalachian Mountains, about 30 miles north of Atlanta. The city is situated in the Cherokee County and is surrounded by the cities of Canton, Woodstock, and Acworth. The city has a total area of 4.2 square miles, with a population density of about 350 people per square mile.
The city is located at an elevation of 1,000 feet above sea level and is situated on the banks of the Etowah River. The climate in Nelson is humid subtropical, with hot summers and mild winters. The average annual temperature is around 70 degrees Fahrenheit.
Economy
Nelson’s economy is largely based on manufacturing and industry. The city is home to several major companies, including Georgia Marble Company, Georgia Pacific, and Georgia Power. The city also has a thriving agricultural sector, with a variety of crops grown in the area.
The city is also home to several small businesses, including restaurants, retail stores, and service providers. The city also has a vibrant tourism industry, with many visitors coming to the area to enjoy the natural beauty of the Appalachian Mountains.
Demographics
As of the 2010 census, the population of Nelson was 1,500 people. The racial makeup of the city was 94.7% White, 2.3% African American, 0.7% Native American, 0.3% Asian, and 1.7% from other races. The median household income in Nelson was $41,250, and the median age was 37.
Nelson is a small city with a rich history and a vibrant economy. The city is home to a diverse population and is a great place to live, work, and play. With its close proximity to Atlanta, Nelson is an ideal place to call home.
Common Questions
What is Per Capita Income in Nelson?
Per Capita income in Nelson is $36,291.
What is the Median Family Income in Nelson?
Median Family Income in Nelson is $89,333.
What is the Median Household income in Nelson?
Median Household Income in Nelson is $66,719.
What is Income or Wage Gap in Nelson?
Income or Wage Gap in Nelson is 50.4%.
Women in Nelson earn 49.6 cents for every dollar earned by a man.
What is Inequality or Gini Index in Nelson?
Inequality or Gini Index in Nelson is 0.41.
What is the Total Population of Nelson?
Total Population of Nelson is 946.
What is the Total Male Population of Nelson?
Total Male Population of Nelson is 538.
What is the Total Female Population of Nelson?
Total Female Population of Nelson is 408.
What is the Ratio of Males per 100 Females in Nelson?
There are 131.86 Males per 100 Females in Nelson.
What is the Ratio of Females per 100 Males in Nelson?
There are 75.84 Females per 100 Males in Nelson.
What is the Median Population Age in Nelson?
Median Population Age in Nelson is 40.5 Years.
What is the Average Family Size in Nelson
Average Family Size in Nelson is 3.3 People.
What is the Average Household Size in Nelson
Average Household Size in Nelson is 2.4 People.
How Large is the Labor Force in Nelson?
There are 498 People in the Labor Forcein in Nelson.
What is the Percentage of People in the Labor Force in Nelson?
66.9% of People are in the Labor Force in Nelson.
What is the Unemployment Rate in Nelson?
Unemployment Rate in Nelson is 2.6%.