Northchase, NC Map & Demographics
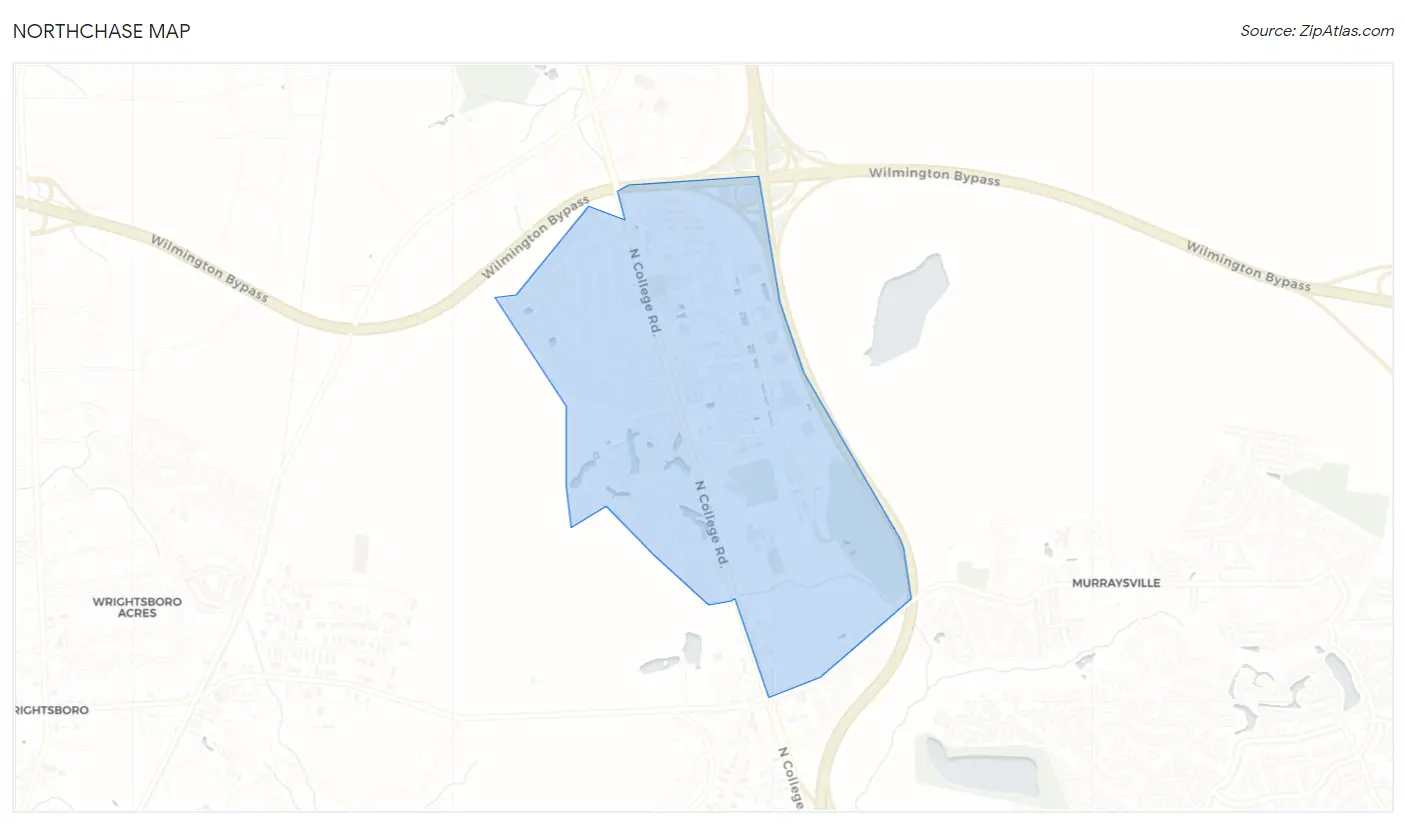
Northchase Map
Northchase Overview
$21,827
PER CAPITA INCOME
$65,436
AVG FAMILY INCOME
$52,122
AVG HOUSEHOLD INCOME
34.6%
WAGE / INCOME GAP [ % ]
65.4¢/ $1
WAGE / INCOME GAP [ $ ]
0.47
INEQUALITY / GINI INDEX
5,543
TOTAL POPULATION
2,828
MALE POPULATION
2,715
FEMALE POPULATION
104.16
MALES / 100 FEMALES
96.00
FEMALES / 100 MALES
27.3
MEDIAN AGE
3.6
AVG FAMILY SIZE
2.6
AVG HOUSEHOLD SIZE
2,807
LABOR FORCE [ PEOPLE ]
72.0%
PERCENT IN LABOR FORCE
18.5%
UNEMPLOYMENT RATE
Income in Northchase
Income Overview in Northchase
Per Capita Income in Northchase is $21,827, while median incomes of families and households are $65,436 and $52,122 respectively.
| Characteristic | Number | Measure |
| Per Capita Income | 5,543 | $21,827 |
| Median Family Income | 1,099 | $65,436 |
| Mean Family Income | 1,099 | $81,815 |
| Median Household Income | 2,109 | $52,122 |
| Mean Household Income | 2,109 | $58,229 |
| Income Deficit | 1,099 | $0 |
| Wage / Income Gap (%) | 5,543 | 34.64% |
| Wage / Income Gap ($) | 5,543 | 65.36¢ per $1 |
| Gini / Inequality Index | 5,543 | 0.47 |
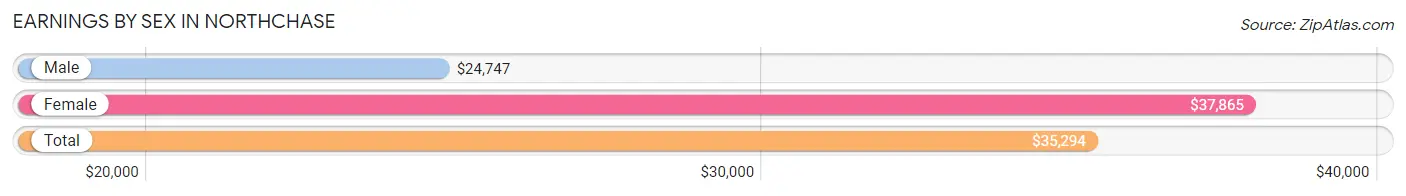
Earnings by Sex in Northchase
Average Earnings in Northchase are $35,294, $24,747 for men and $37,865 for women, a difference of 34.6%.
| Sex | Number | Average Earnings |
| Male | 1,088 (42.8%) | $24,747 |
| Female | 1,456 (57.2%) | $37,865 |
| Total | 2,544 (100.0%) | $35,294 |
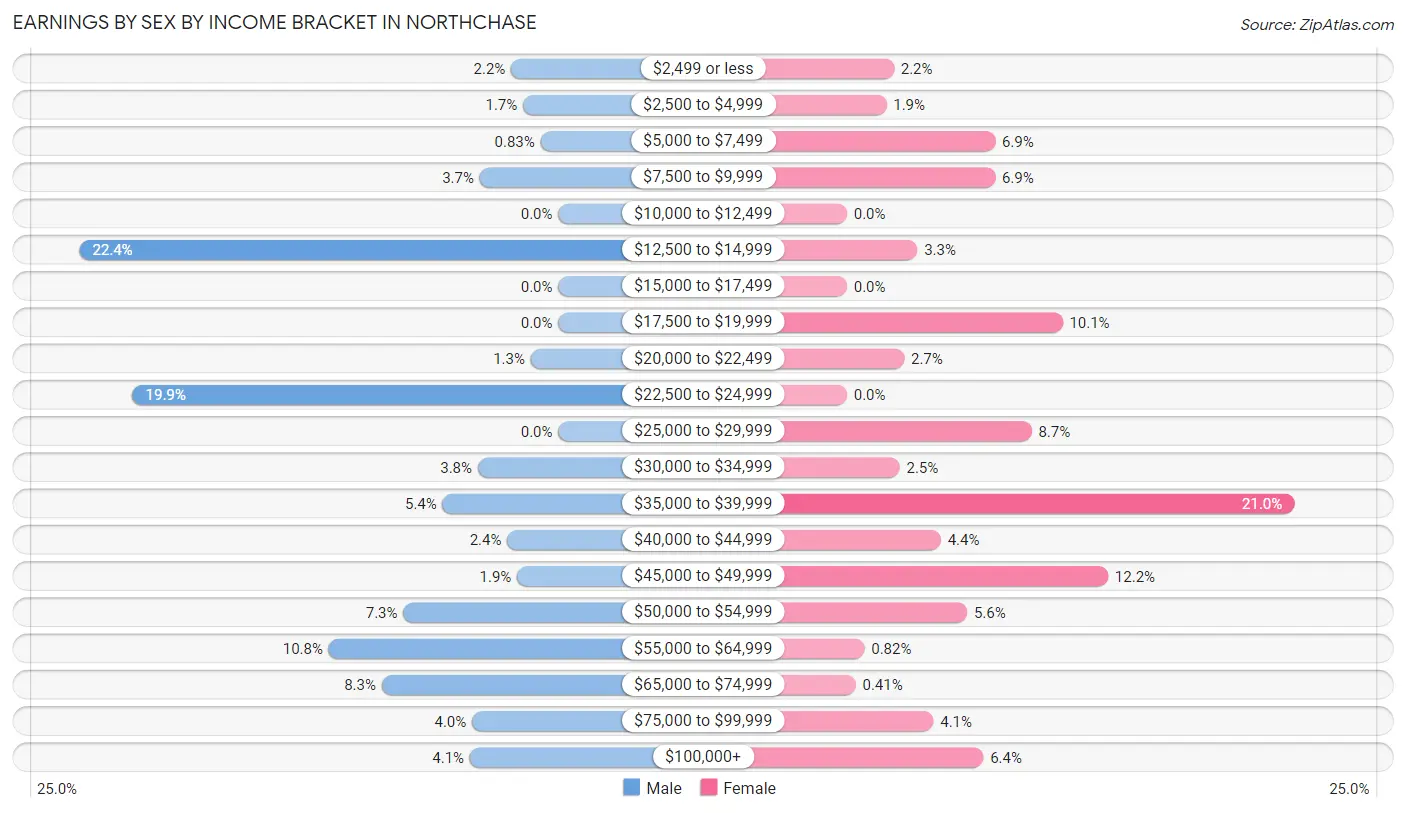
Earnings by Sex by Income Bracket in Northchase
The most common earnings brackets in Northchase are $12,500 to $14,999 for men (244 | 22.4%) and $35,000 to $39,999 for women (305 | 20.9%).
| Income | Male | Female |
| $2,499 or less | 24 (2.2%) | 32 (2.2%) |
| $2,500 to $4,999 | 18 (1.7%) | 27 (1.8%) |
| $5,000 to $7,499 | 9 (0.8%) | 101 (6.9%) |
| $7,500 to $9,999 | 40 (3.7%) | 101 (6.9%) |
| $10,000 to $12,499 | 0 (0.0%) | 0 (0.0%) |
| $12,500 to $14,999 | 244 (22.4%) | 48 (3.3%) |
| $15,000 to $17,499 | 0 (0.0%) | 0 (0.0%) |
| $17,500 to $19,999 | 0 (0.0%) | 147 (10.1%) |
| $20,000 to $22,499 | 14 (1.3%) | 39 (2.7%) |
| $22,500 to $24,999 | 217 (19.9%) | 0 (0.0%) |
| $25,000 to $29,999 | 0 (0.0%) | 126 (8.6%) |
| $30,000 to $34,999 | 41 (3.8%) | 36 (2.5%) |
| $35,000 to $39,999 | 59 (5.4%) | 305 (20.9%) |
| $40,000 to $44,999 | 26 (2.4%) | 64 (4.4%) |
| $45,000 to $49,999 | 21 (1.9%) | 178 (12.2%) |
| $50,000 to $54,999 | 79 (7.3%) | 82 (5.6%) |
| $55,000 to $64,999 | 117 (10.7%) | 12 (0.8%) |
| $65,000 to $74,999 | 90 (8.3%) | 6 (0.4%) |
| $75,000 to $99,999 | 44 (4.0%) | 59 (4.1%) |
| $100,000+ | 45 (4.1%) | 93 (6.4%) |
| Total | 1,088 (100.0%) | 1,456 (100.0%) |
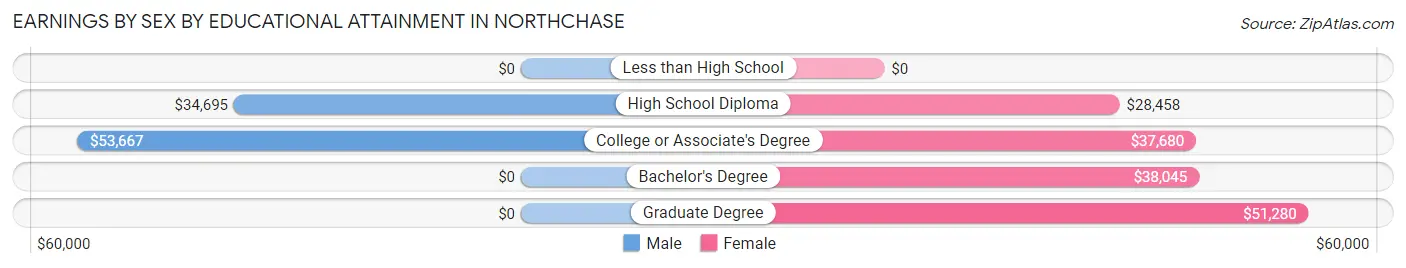
Earnings by Sex by Educational Attainment in Northchase
Average earnings in Northchase are $37,841 for men and $38,029 for women, a difference of 0.5%. Men with an educational attainment of college or associate's degree enjoy the highest average annual earnings of $53,667, while those with high school diploma education earn the least with $34,695. Women with an educational attainment of graduate degree earn the most with the average annual earnings of $51,280, while those with high school diploma education have the smallest earnings of $28,458.
| Educational Attainment | Male Income | Female Income |
| Less than High School | - | - |
| High School Diploma | $34,695 | $28,458 |
| College or Associate's Degree | $53,667 | $37,680 |
| Bachelor's Degree | - | - |
| Graduate Degree | - | - |
| Total | $37,841 | $38,029 |
Family Income in Northchase
Family Income Brackets in Northchase
According to the Northchase family income data, there are 464 families falling into the $50,000 to $74,999 income range, which is the most common income bracket and makes up 42.2% of all families.
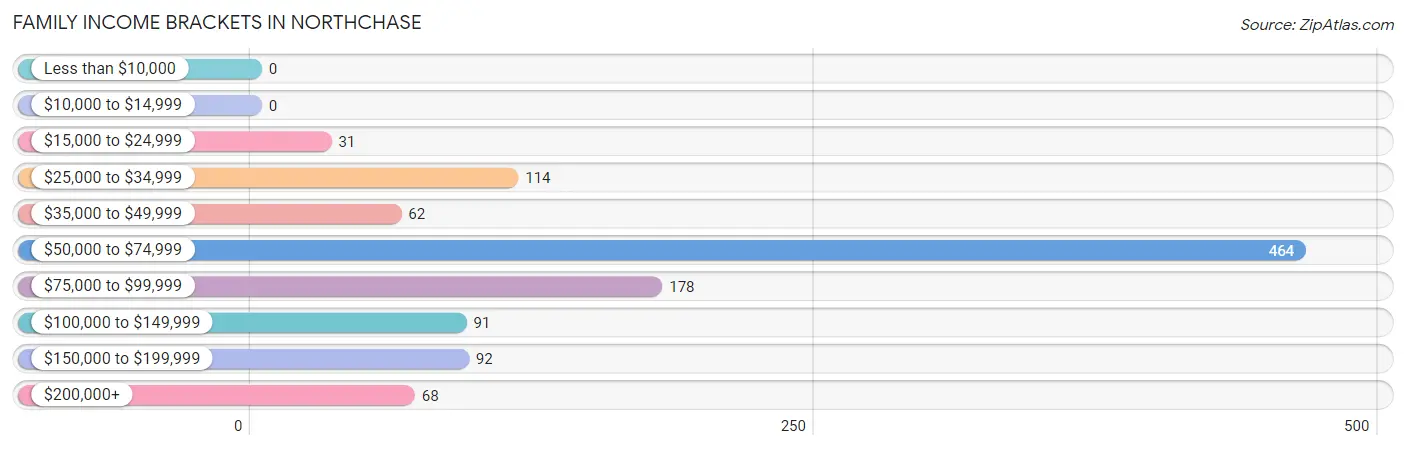
| Income Bracket | # Families | % Families |
| Less than $10,000 | 0 | 0.0% |
| $10,000 to $14,999 | 0 | 0.0% |
| $15,000 to $24,999 | 31 | 2.8% |
| $25,000 to $34,999 | 114 | 10.4% |
| $35,000 to $49,999 | 62 | 5.6% |
| $50,000 to $74,999 | 464 | 42.2% |
| $75,000 to $99,999 | 178 | 16.2% |
| $100,000 to $149,999 | 91 | 8.3% |
| $150,000 to $199,999 | 92 | 8.4% |
| $200,000+ | 68 | 6.2% |
Family Income by Famaliy Size in Northchase
3-person families (225 | 20.5%) account for the highest median family income in Northchase with $91,066 per family, while 2-person families (464 | 42.2%) have the highest median income of $32,677 per family member.
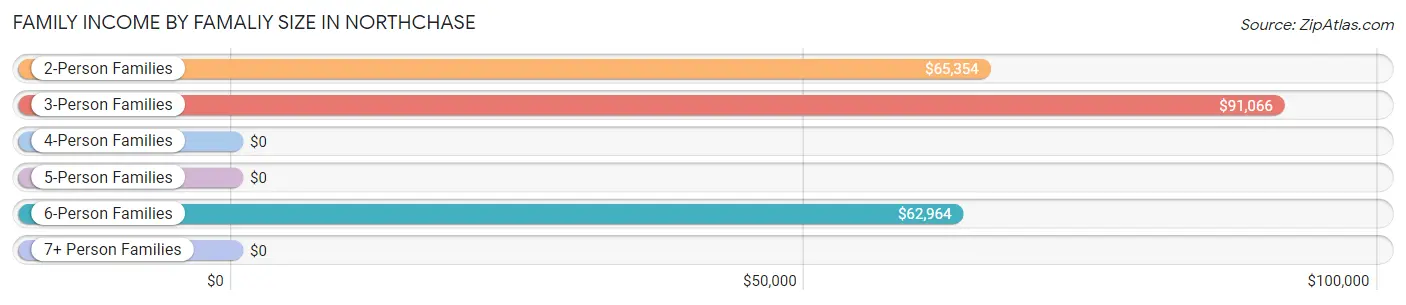
| Income Bracket | # Families | Median Income |
| 2-Person Families | 464 (42.2%) | $65,354 |
| 3-Person Families | 225 (20.5%) | $91,066 |
| 4-Person Families | 82 (7.5%) | $0 |
| 5-Person Families | 68 (6.2%) | $0 |
| 6-Person Families | 228 (20.7%) | $62,964 |
| 7+ Person Families | 32 (2.9%) | $0 |
| Total | 1,099 (100.0%) | $65,436 |
Family Income by Number of Earners in Northchase
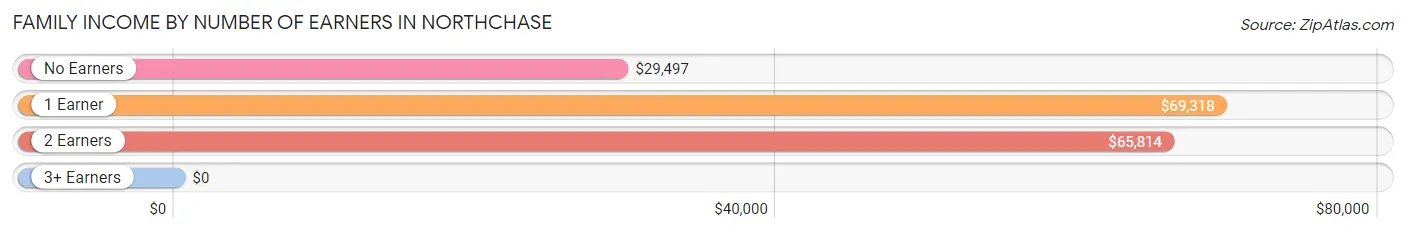
| Number of Earners | # Families | Median Income |
| No Earners | 123 (11.2%) | $29,497 |
| 1 Earner | 232 (21.1%) | $69,318 |
| 2 Earners | 701 (63.8%) | $65,814 |
| 3+ Earners | 43 (3.9%) | $0 |
| Total | 1,099 (100.0%) | $65,436 |
Household Income in Northchase
Household Income Brackets in Northchase
With 521 households falling in the category, the $50,000 to $74,999 income range is the most frequent in Northchase, accounting for 24.7% of all households.

| Income Bracket | # Households | % Households |
| Less than $10,000 | 424 | 20.1% |
| $10,000 to $14,999 | 0 | 0.0% |
| $15,000 to $24,999 | 135 | 6.4% |
| $25,000 to $34,999 | 196 | 9.3% |
| $35,000 to $49,999 | 215 | 10.2% |
| $50,000 to $74,999 | 521 | 24.7% |
| $75,000 to $99,999 | 247 | 11.7% |
| $100,000 to $149,999 | 209 | 9.9% |
| $150,000 to $199,999 | 93 | 4.4% |
| $200,000+ | 67 | 3.2% |
Household Income by Householder Age in Northchase
The median household income in Northchase is $52,122, with the highest median household income of $68,258 found in the 45 to 64 years age bracket for the primary householder. A total of 436 households (20.7%) fall into this category. Meanwhile, the 15 to 24 years age bracket for the primary householder has the lowest median household income of $2,499, with 557 households (26.4%) in this group.
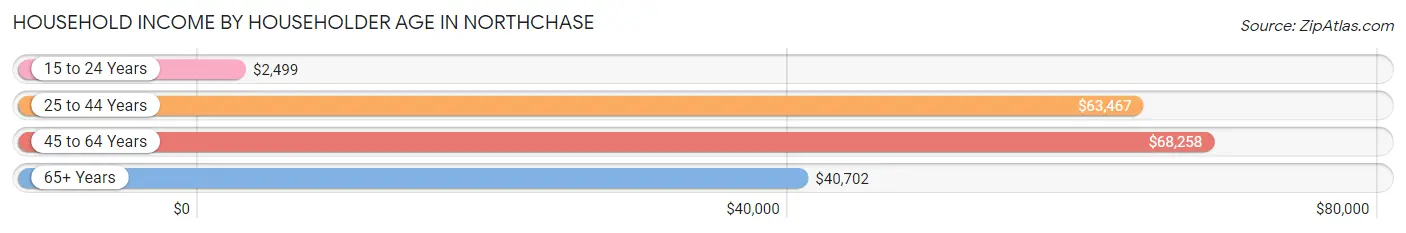
| Income Bracket | # Households | Median Income |
| 15 to 24 Years | 557 (26.4%) | $2,499 |
| 25 to 44 Years | 675 (32.0%) | $63,467 |
| 45 to 64 Years | 436 (20.7%) | $68,258 |
| 65+ Years | 441 (20.9%) | $40,702 |
| Total | 2,109 (100.0%) | $52,122 |
Poverty in Northchase
Income Below Poverty by Sex and Age in Northchase
With 30.0% poverty level for males and 14.2% for females among the residents of Northchase, 18 to 24 year old males and 16 and 17 year old females are the most vulnerable to poverty, with 412 males (70.9%) and 46 females (69.7%) in their respective age groups living below the poverty level.
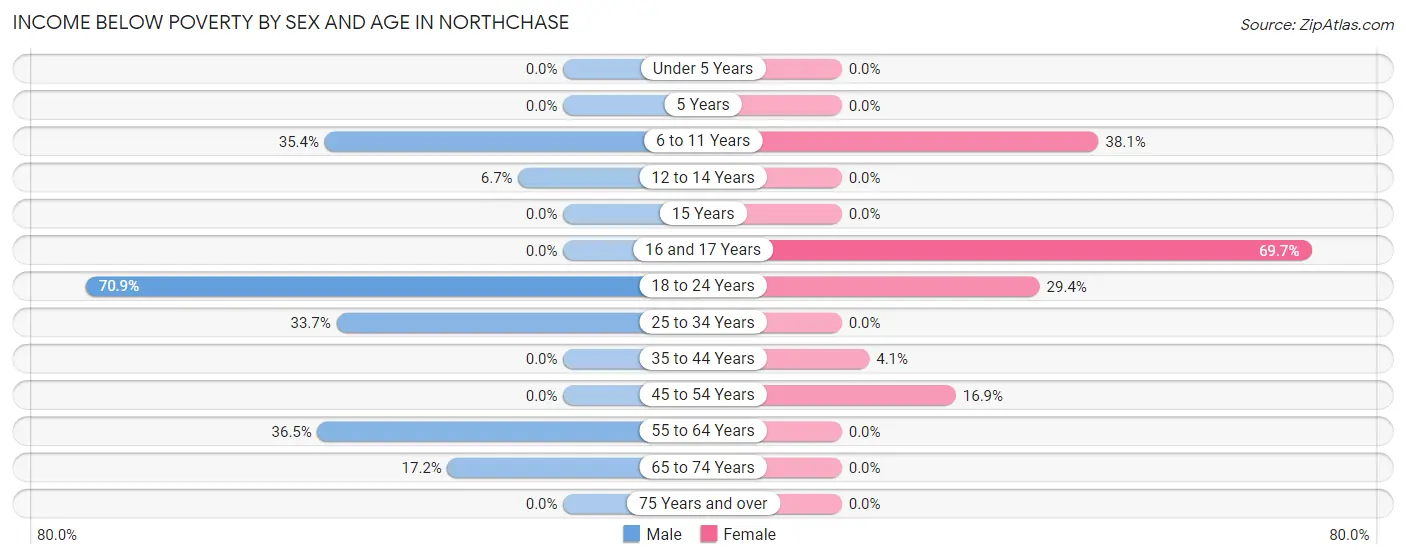
| Age Bracket | Male | Female |
| Under 5 Years | 0 (0.0%) | 0 (0.0%) |
| 5 Years | 0 (0.0%) | 0 (0.0%) |
| 6 to 11 Years | 209 (35.4%) | 151 (38.1%) |
| 12 to 14 Years | 19 (6.7%) | 0 (0.0%) |
| 15 Years | 0 (0.0%) | 0 (0.0%) |
| 16 and 17 Years | 0 (0.0%) | 46 (69.7%) |
| 18 to 24 Years | 412 (70.9%) | 94 (29.4%) |
| 25 to 34 Years | 96 (33.7%) | 0 (0.0%) |
| 35 to 44 Years | 0 (0.0%) | 18 (4.1%) |
| 45 to 54 Years | 0 (0.0%) | 51 (16.9%) |
| 55 to 64 Years | 77 (36.5%) | 0 (0.0%) |
| 65 to 74 Years | 28 (17.2%) | 0 (0.0%) |
| 75 Years and over | 0 (0.0%) | 0 (0.0%) |
| Total | 841 (30.0%) | 360 (14.2%) |
Income Above Poverty by Sex and Age in Northchase
According to the poverty statistics in Northchase, males aged under 5 years and females aged under 5 years are the age groups that are most secure financially, with 100.0% of males and 100.0% of females in these age groups living above the poverty line.
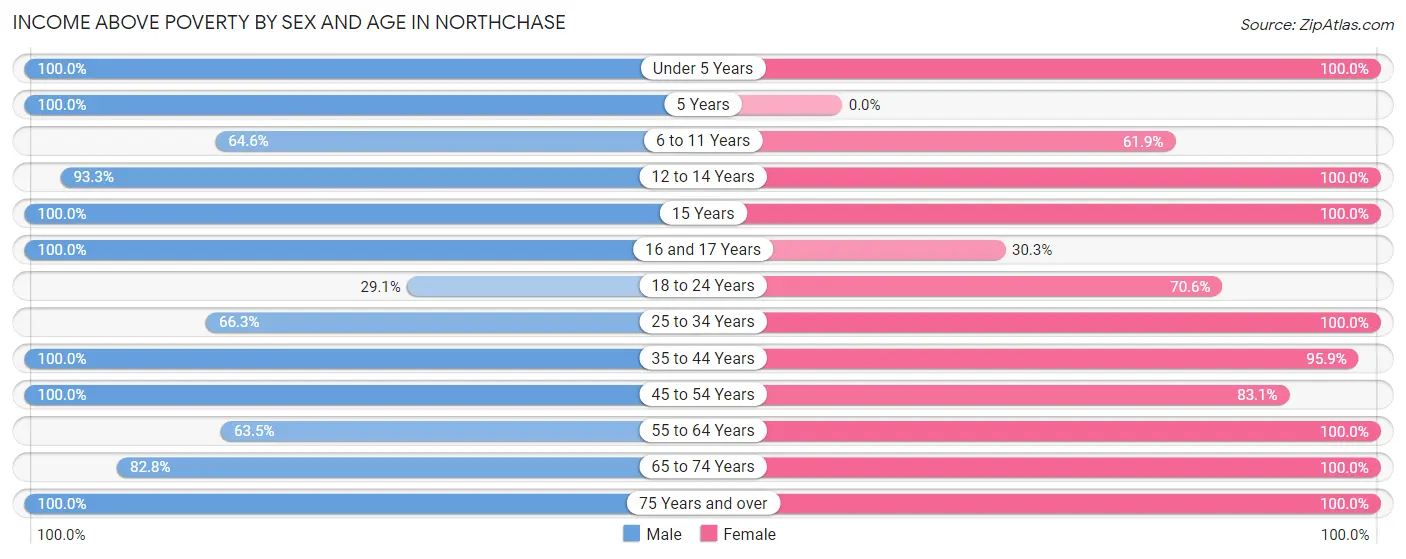
| Age Bracket | Male | Female |
| Under 5 Years | 61 (100.0%) | 93 (100.0%) |
| 5 Years | 18 (100.0%) | 0 (0.0%) |
| 6 to 11 Years | 381 (64.6%) | 245 (61.9%) |
| 12 to 14 Years | 266 (93.3%) | 6 (100.0%) |
| 15 Years | 52 (100.0%) | 59 (100.0%) |
| 16 and 17 Years | 45 (100.0%) | 20 (30.3%) |
| 18 to 24 Years | 169 (29.1%) | 226 (70.6%) |
| 25 to 34 Years | 189 (66.3%) | 283 (100.0%) |
| 35 to 44 Years | 378 (100.0%) | 423 (95.9%) |
| 45 to 54 Years | 78 (100.0%) | 250 (83.1%) |
| 55 to 64 Years | 134 (63.5%) | 157 (100.0%) |
| 65 to 74 Years | 135 (82.8%) | 199 (100.0%) |
| 75 Years and over | 60 (100.0%) | 206 (100.0%) |
| Total | 1,966 (70.0%) | 2,167 (85.8%) |
Income Below Poverty Among Married-Couple Families in Northchase
The poverty statistics for married-couple families in Northchase show that 11.0% or 90 of the total 819 families live below the poverty line. Families with 3 or 4 children have the highest poverty rate of 23.5%, comprising of 77 families. On the other hand, families with 1 or 2 children have the lowest poverty rate of 0.0%, which includes 0 families.
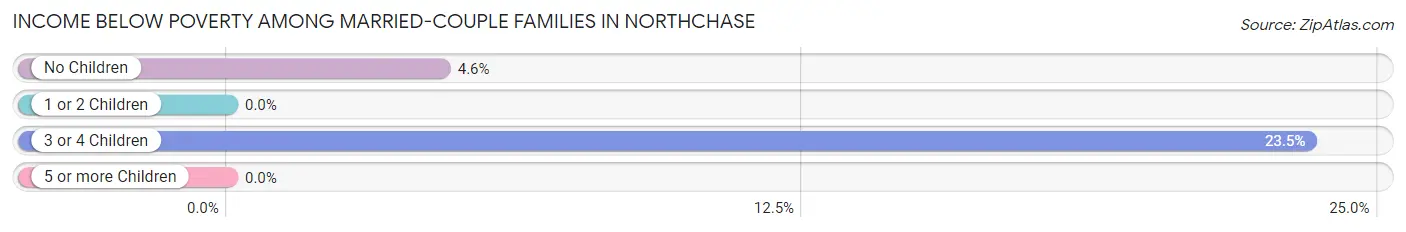
| Children | Above Poverty | Below Poverty |
| No Children | 268 (95.4%) | 13 (4.6%) |
| 1 or 2 Children | 210 (100.0%) | 0 (0.0%) |
| 3 or 4 Children | 251 (76.5%) | 77 (23.5%) |
| 5 or more Children | 0 (0.0%) | 0 (0.0%) |
| Total | 729 (89.0%) | 90 (11.0%) |
Income Below Poverty Among Single-Parent Households in Northchase
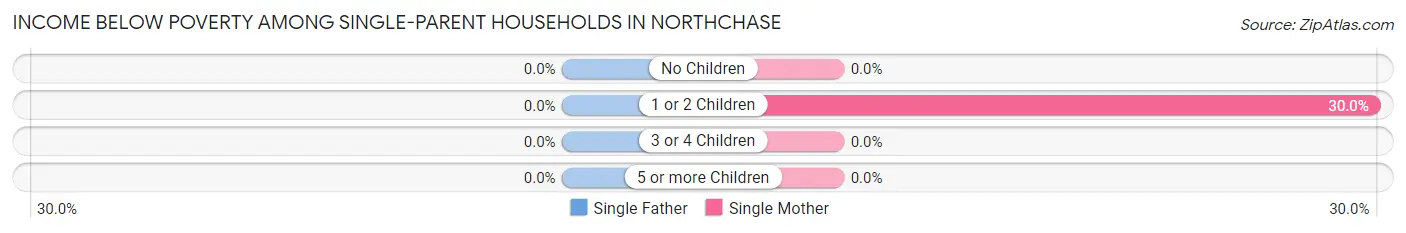
| Children | Single Father | Single Mother |
| No Children | 0 (0.0%) | 0 (0.0%) |
| 1 or 2 Children | 0 (0.0%) | 18 (30.0%) |
| 3 or 4 Children | 0 (0.0%) | 0 (0.0%) |
| 5 or more Children | 0 (0.0%) | 0 (0.0%) |
| Total | 0 (0.0%) | 18 (9.7%) |
Income Below Poverty Among Married-Couple vs Single-Parent Households in Northchase
The poverty data for Northchase shows that 90 of the married-couple family households (11.0%) and 18 of the single-parent households (6.4%) are living below the poverty level. Within the married-couple family households, those with 3 or 4 children have the highest poverty rate, with 77 households (23.5%) falling below the poverty line. Among the single-parent households, those with 1 or 2 children have the highest poverty rate, with 18 household (30.0%) living below poverty.
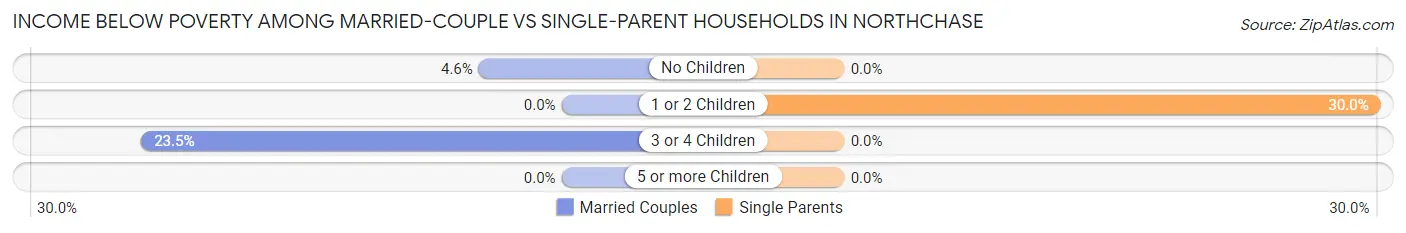
| Children | Married-Couple Families | Single-Parent Households |
| No Children | 13 (4.6%) | 0 (0.0%) |
| 1 or 2 Children | 0 (0.0%) | 18 (30.0%) |
| 3 or 4 Children | 77 (23.5%) | 0 (0.0%) |
| 5 or more Children | 0 (0.0%) | 0 (0.0%) |
| Total | 90 (11.0%) | 18 (6.4%) |
Race in Northchase
The most populous races in Northchase are White / Caucasian (3,816 | 68.8%), Black / African American (1,504 | 27.1%), and Some other Race (150 | 2.7%).
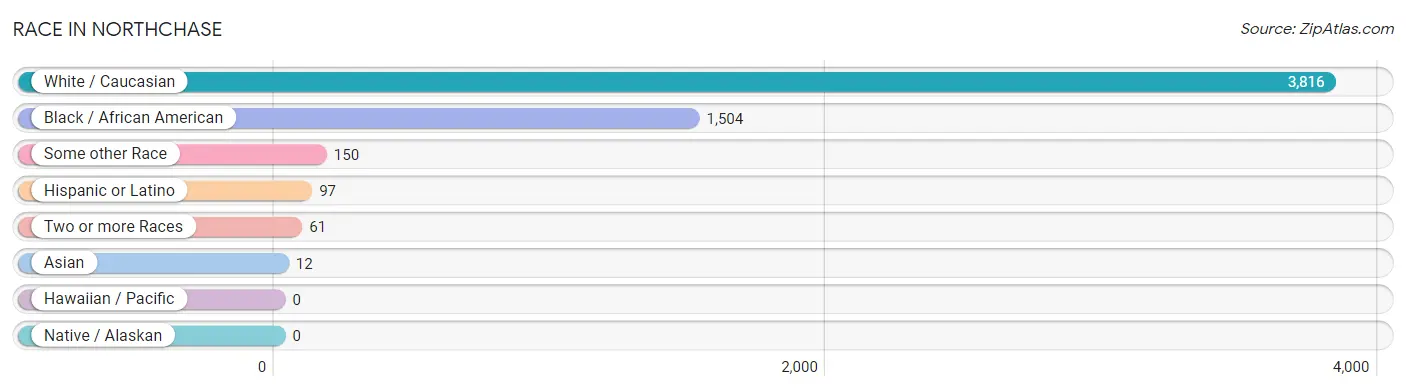
| Race | # Population | % Population |
| Asian | 12 | 0.2% |
| Black / African American | 1,504 | 27.1% |
| Hawaiian / Pacific | 0 | 0.0% |
| Hispanic or Latino | 97 | 1.8% |
| Native / Alaskan | 0 | 0.0% |
| White / Caucasian | 3,816 | 68.8% |
| Two or more Races | 61 | 1.1% |
| Some other Race | 150 | 2.7% |
| Total | 5,543 | 100.0% |
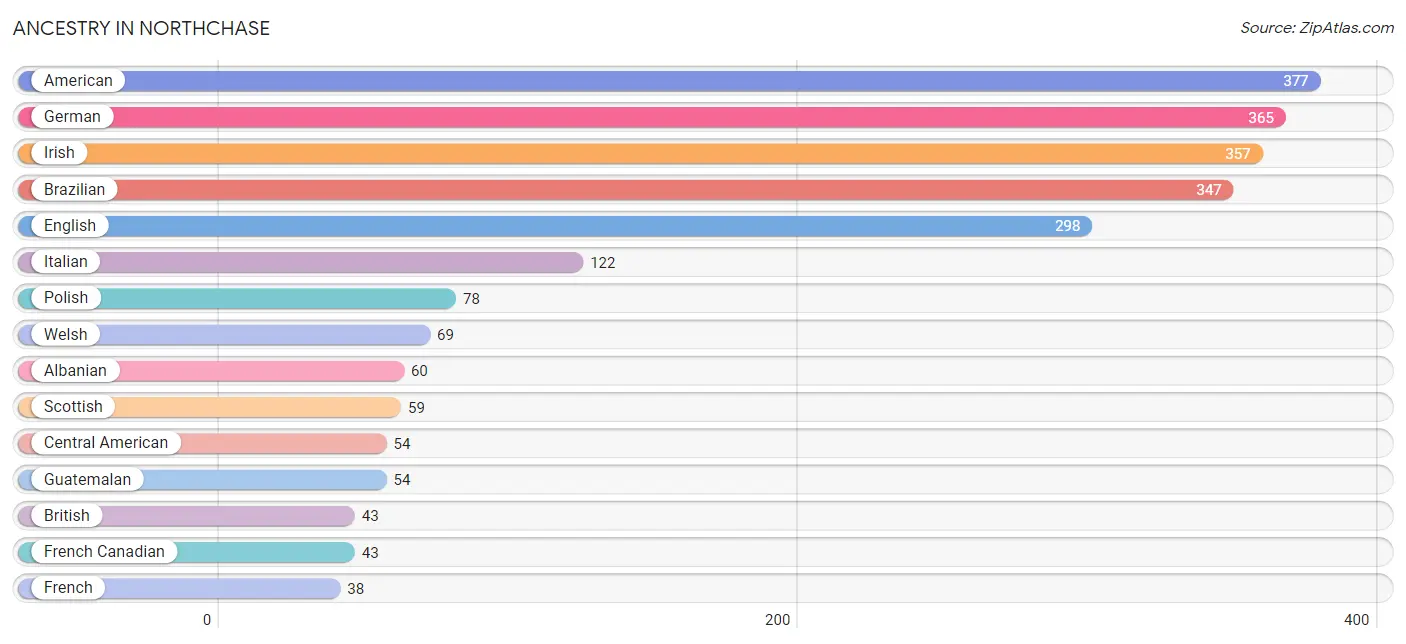
Ancestry in Northchase
The most populous ancestries reported in Northchase are American (377 | 6.8%), German (365 | 6.6%), Irish (357 | 6.4%), Brazilian (347 | 6.3%), and English (298 | 5.4%), together accounting for 31.5% of all Northchase residents.
| Ancestry | # Population | % Population |
| Albanian | 60 | 1.1% |
| American | 377 | 6.8% |
| Brazilian | 347 | 6.3% |
| British | 43 | 0.8% |
| Central American | 54 | 1.0% |
| Cherokee | 15 | 0.3% |
| Colombian | 14 | 0.3% |
| Cuban | 29 | 0.5% |
| Dutch | 17 | 0.3% |
| Eastern European | 4 | 0.1% |
| English | 298 | 5.4% |
| Ethiopian | 20 | 0.4% |
| French | 38 | 0.7% |
| French Canadian | 43 | 0.8% |
| German | 365 | 6.6% |
| Guatemalan | 54 | 1.0% |
| Hungarian | 8 | 0.1% |
| Irish | 357 | 6.4% |
| Italian | 122 | 2.2% |
| Jamaican | 21 | 0.4% |
| Korean | 18 | 0.3% |
| Polish | 78 | 1.4% |
| Scottish | 59 | 1.1% |
| South American | 14 | 0.3% |
| Sri Lankan | 6 | 0.1% |
| Subsaharan African | 37 | 0.7% |
| Ugandan | 17 | 0.3% |
| Welsh | 69 | 1.2% | View All 28 Rows |
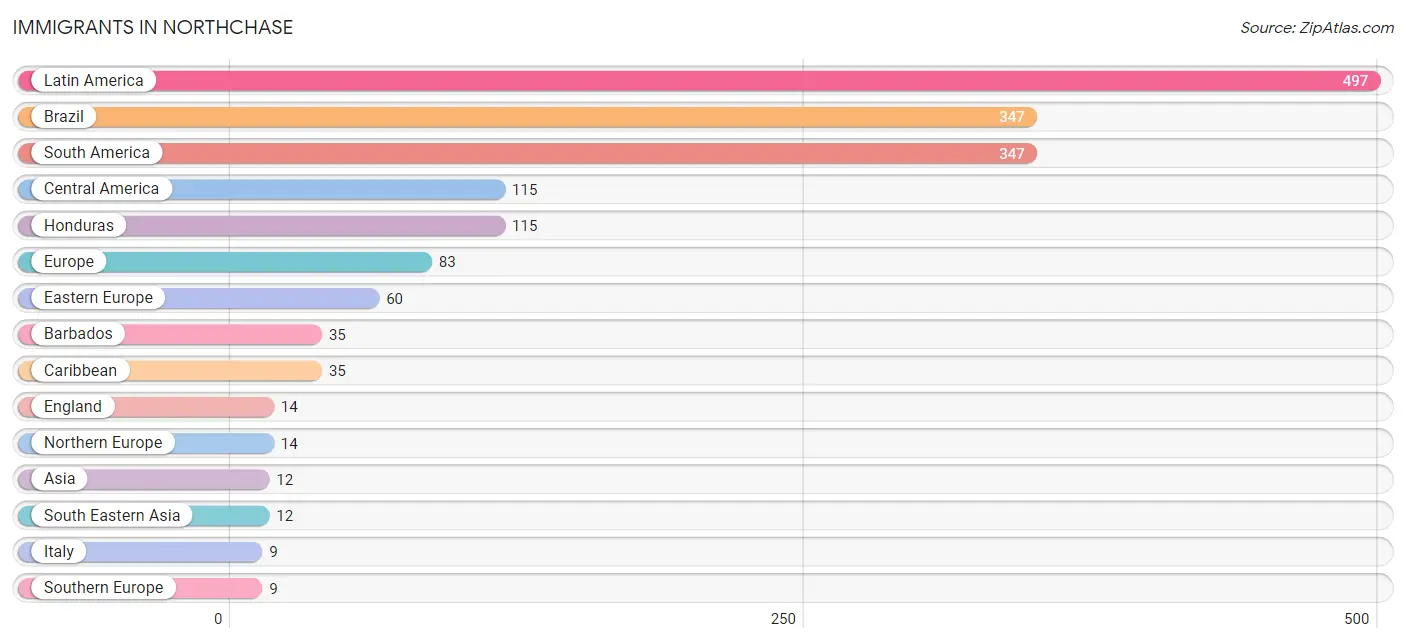
Immigrants in Northchase
The most numerous immigrant groups reported in Northchase came from Latin America (497 | 9.0%), Brazil (347 | 6.3%), South America (347 | 6.3%), Central America (115 | 2.1%), and Honduras (115 | 2.1%), together accounting for 25.6% of all Northchase residents.
| Immigration Origin | # Population | % Population |
| Asia | 12 | 0.2% |
| Barbados | 35 | 0.6% |
| Brazil | 347 | 6.3% |
| Caribbean | 35 | 0.6% |
| Central America | 115 | 2.1% |
| Eastern Europe | 60 | 1.1% |
| England | 14 | 0.3% |
| Europe | 83 | 1.5% |
| Honduras | 115 | 2.1% |
| Italy | 9 | 0.2% |
| Latin America | 497 | 9.0% |
| Northern Europe | 14 | 0.3% |
| Philippines | 6 | 0.1% |
| South America | 347 | 6.3% |
| South Eastern Asia | 12 | 0.2% |
| Southern Europe | 9 | 0.2% |
| Vietnam | 6 | 0.1% | View All 17 Rows |
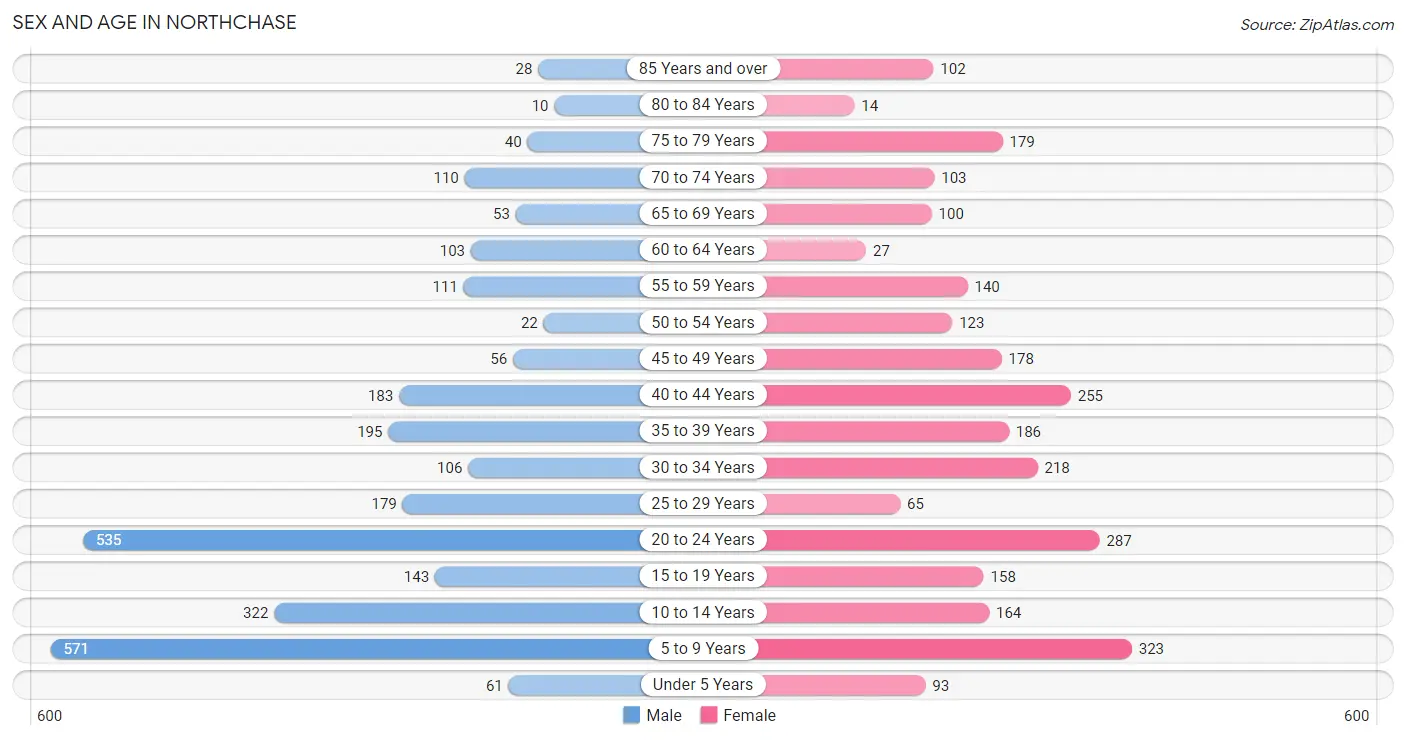
Sex and Age in Northchase
Sex and Age in Northchase
The most populous age groups in Northchase are 5 to 9 Years (571 | 20.2%) for men and 5 to 9 Years (323 | 11.9%) for women.
| Age Bracket | Male | Female |
| Under 5 Years | 61 (2.2%) | 93 (3.4%) |
| 5 to 9 Years | 571 (20.2%) | 323 (11.9%) |
| 10 to 14 Years | 322 (11.4%) | 164 (6.0%) |
| 15 to 19 Years | 143 (5.1%) | 158 (5.8%) |
| 20 to 24 Years | 535 (18.9%) | 287 (10.6%) |
| 25 to 29 Years | 179 (6.3%) | 65 (2.4%) |
| 30 to 34 Years | 106 (3.7%) | 218 (8.0%) |
| 35 to 39 Years | 195 (6.9%) | 186 (6.9%) |
| 40 to 44 Years | 183 (6.5%) | 255 (9.4%) |
| 45 to 49 Years | 56 (2.0%) | 178 (6.6%) |
| 50 to 54 Years | 22 (0.8%) | 123 (4.5%) |
| 55 to 59 Years | 111 (3.9%) | 140 (5.2%) |
| 60 to 64 Years | 103 (3.6%) | 27 (1.0%) |
| 65 to 69 Years | 53 (1.9%) | 100 (3.7%) |
| 70 to 74 Years | 110 (3.9%) | 103 (3.8%) |
| 75 to 79 Years | 40 (1.4%) | 179 (6.6%) |
| 80 to 84 Years | 10 (0.4%) | 14 (0.5%) |
| 85 Years and over | 28 (1.0%) | 102 (3.8%) |
| Total | 2,828 (100.0%) | 2,715 (100.0%) |
Families and Households in Northchase
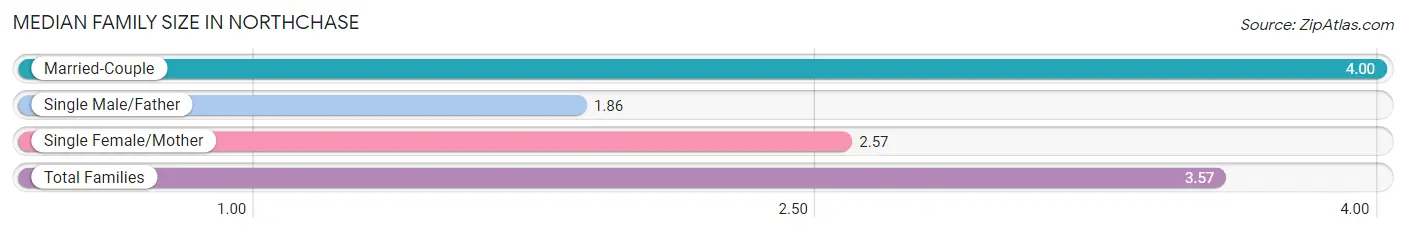
Median Family Size in Northchase
The median family size in Northchase is 3.57 persons per family, with married-couple families (819 | 74.5%) accounting for the largest median family size of 4 persons per family. On the other hand, single male/father families (95 | 8.6%) represent the smallest median family size with 1.86 persons per family.
| Family Type | # Families | Family Size |
| Married-Couple | 819 (74.5%) | 4.00 |
| Single Male/Father | 95 (8.6%) | 1.86 |
| Single Female/Mother | 185 (16.8%) | 2.57 |
| Total Families | 1,099 (100.0%) | 3.57 |
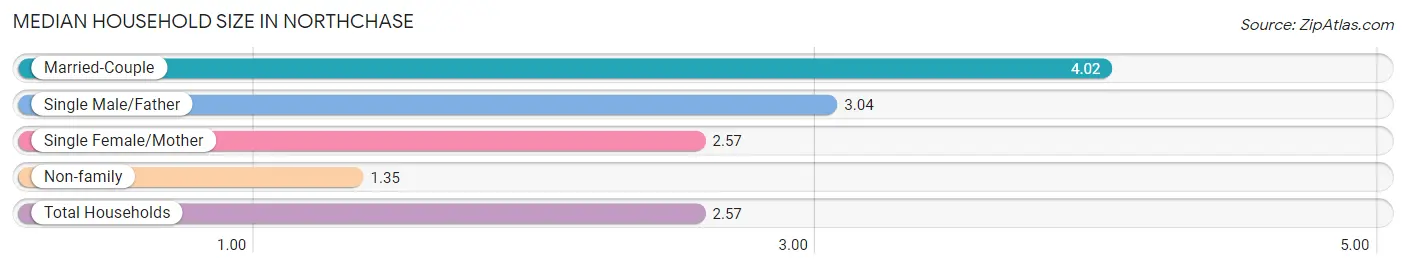
Median Household Size in Northchase
The median household size in Northchase is 2.57 persons per household, with married-couple households (819 | 38.8%) accounting for the largest median household size of 4.02 persons per household. non-family households (1,010 | 47.9%) represent the smallest median household size with 1.35 persons per household.
| Household Type | # Households | Household Size |
| Married-Couple | 819 (38.8%) | 4.02 |
| Single Male/Father | 95 (4.5%) | 3.04 |
| Single Female/Mother | 185 (8.8%) | 2.57 |
| Non-family | 1,010 (47.9%) | 1.35 |
| Total Households | 2,109 (100.0%) | 2.57 |
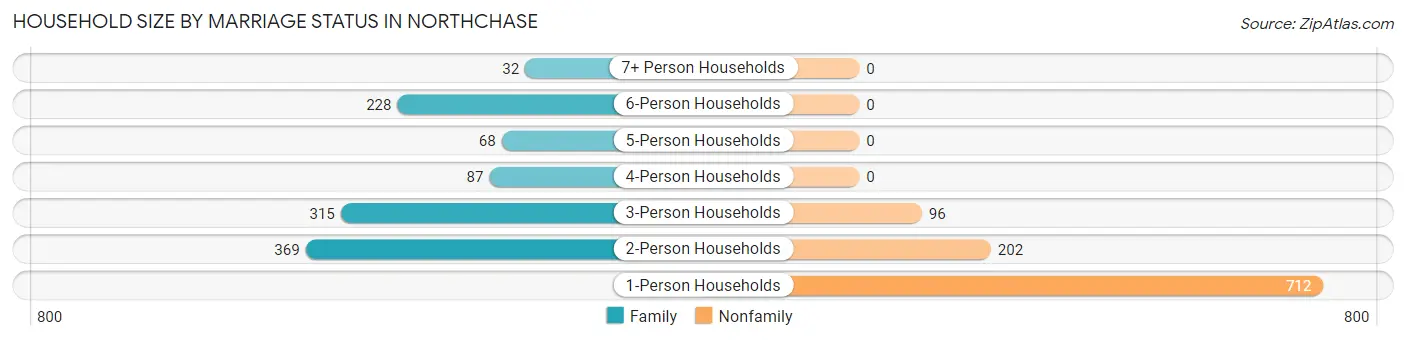
Household Size by Marriage Status in Northchase
Out of a total of 2,109 households in Northchase, 1,099 (52.1%) are family households, while 1,010 (47.9%) are nonfamily households. The most numerous type of family households are 2-person households, comprising 369, and the most common type of nonfamily households are 1-person households, comprising 712.
| Household Size | Family Households | Nonfamily Households |
| 1-Person Households | - | 712 (33.8%) |
| 2-Person Households | 369 (17.5%) | 202 (9.6%) |
| 3-Person Households | 315 (14.9%) | 96 (4.5%) |
| 4-Person Households | 87 (4.1%) | 0 (0.0%) |
| 5-Person Households | 68 (3.2%) | 0 (0.0%) |
| 6-Person Households | 228 (10.8%) | 0 (0.0%) |
| 7+ Person Households | 32 (1.5%) | 0 (0.0%) |
| Total | 1,099 (52.1%) | 1,010 (47.9%) |
Female Fertility in Northchase
Fertility by Age in Northchase
Average fertility rate in Northchase is 17.0 births per 1,000 women. Women in the age bracket of 20 to 34 years have the highest fertility rate with 40.0 births per 1,000 women. Women in the age bracket of 20 to 34 years acount for 100.0% of all women with births.
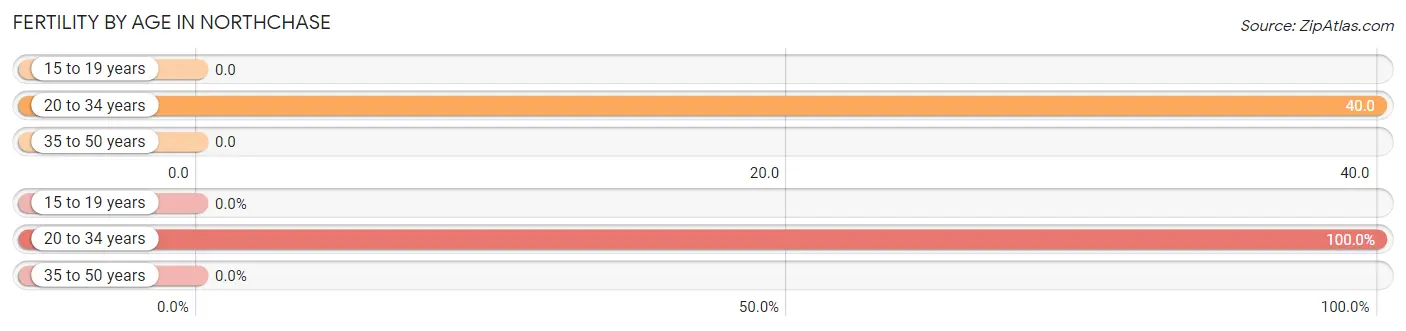
| Age Bracket | Women with Births | Births / 1,000 Women |
| 15 to 19 years | 0 (0.0%) | 0.0 |
| 20 to 34 years | 23 (100.0%) | 40.0 |
| 35 to 50 years | 0 (0.0%) | 0.0 |
| Total | 23 (100.0%) | 17.0 |
Fertility by Age by Marriage Status in Northchase
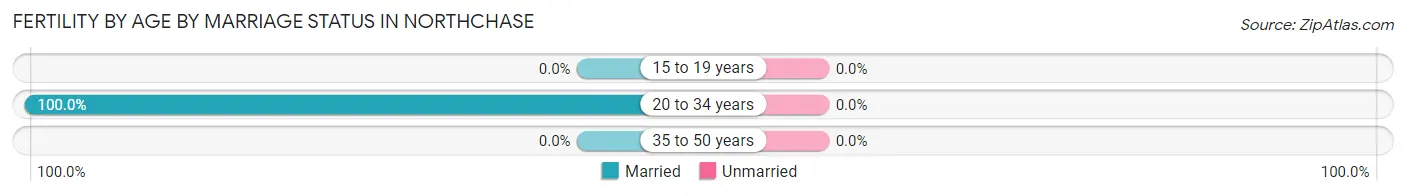
| Age Bracket | Married | Unmarried |
| 15 to 19 years | 0 (0.0%) | 0 (0.0%) |
| 20 to 34 years | 23 (100.0%) | 0 (0.0%) |
| 35 to 50 years | 0 (0.0%) | 0 (0.0%) |
| Total | 23 (100.0%) | 0 (0.0%) |
Fertility by Education in Northchase
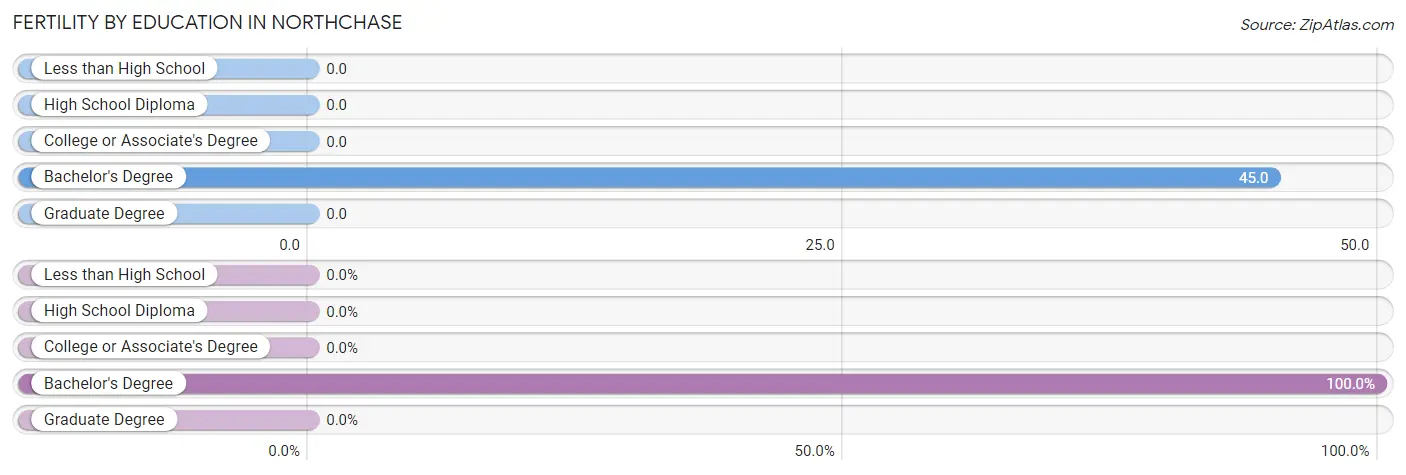
| Educational Attainment | Women with Births | Births / 1,000 Women |
| Less than High School | 0 (0.0%) | 0.0 |
| High School Diploma | 0 (0.0%) | 0.0 |
| College or Associate's Degree | 0 (0.0%) | 0.0 |
| Bachelor's Degree | 23 (100.0%) | 45.0 |
| Graduate Degree | 0 (0.0%) | 0.0 |
| Total | 23 (100.0%) | 17.0 |
Fertility by Education by Marriage Status in Northchase
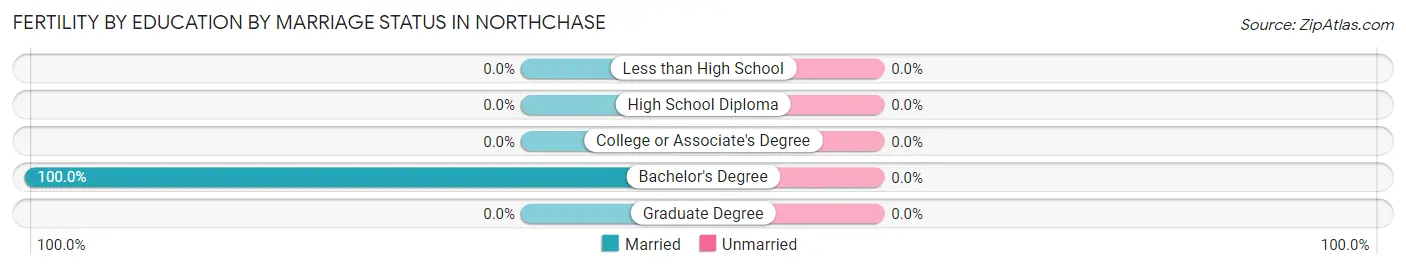
| Educational Attainment | Married | Unmarried |
| Less than High School | 0 (0.0%) | 0 (0.0%) |
| High School Diploma | 0 (0.0%) | 0 (0.0%) |
| College or Associate's Degree | 0 (0.0%) | 0 (0.0%) |
| Bachelor's Degree | 23 (100.0%) | 0 (0.0%) |
| Graduate Degree | 0 (0.0%) | 0 (0.0%) |
| Total | 23 (100.0%) | 0 (0.0%) |
Employment Characteristics in Northchase
Employment by Class of Employer in Northchase
Among the 2,276 employed individuals in Northchase, private company employees (1,562 | 68.6%), state government employees (201 | 8.8%), and federal government employees (185 | 8.1%) make up the most common classes of employment.
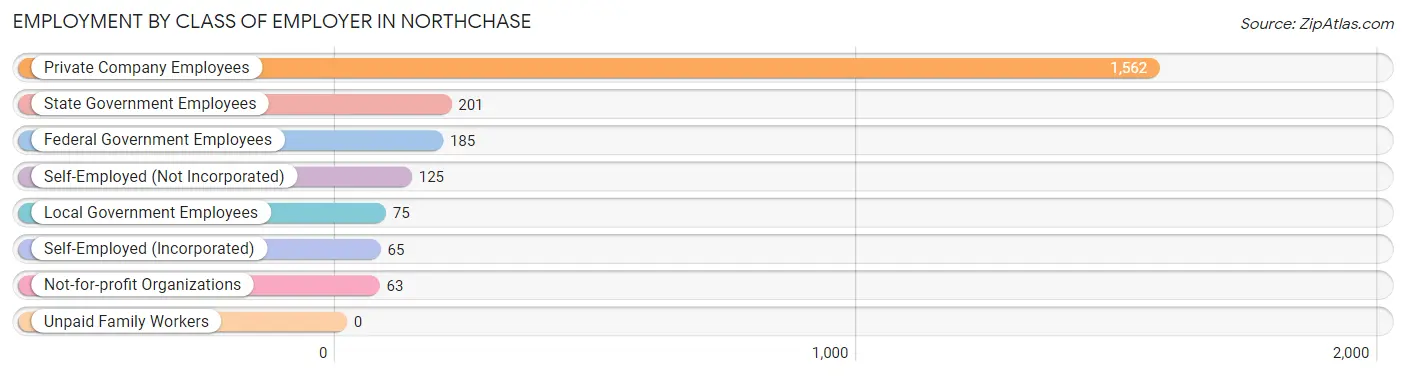
| Employer Class | # Employees | % Employees |
| Private Company Employees | 1,562 | 68.6% |
| Self-Employed (Incorporated) | 65 | 2.9% |
| Self-Employed (Not Incorporated) | 125 | 5.5% |
| Not-for-profit Organizations | 63 | 2.8% |
| Local Government Employees | 75 | 3.3% |
| State Government Employees | 201 | 8.8% |
| Federal Government Employees | 185 | 8.1% |
| Unpaid Family Workers | 0 | 0.0% |
| Total | 2,276 | 100.0% |
Employment Status by Age in Northchase
According to the labor force statistics for Northchase, out of the total population over 16 years of age (3,898), 72.0% or 2,807 individuals are in the labor force, with 18.5% or 519 of them unemployed. The age group with the highest labor force participation rate is 30 to 34 years, with 96.6% or 313 individuals in the labor force. Within the labor force, the 20 to 24 years age range has the highest percentage of unemployed individuals, with 53.0% or 387 of them being unemployed.
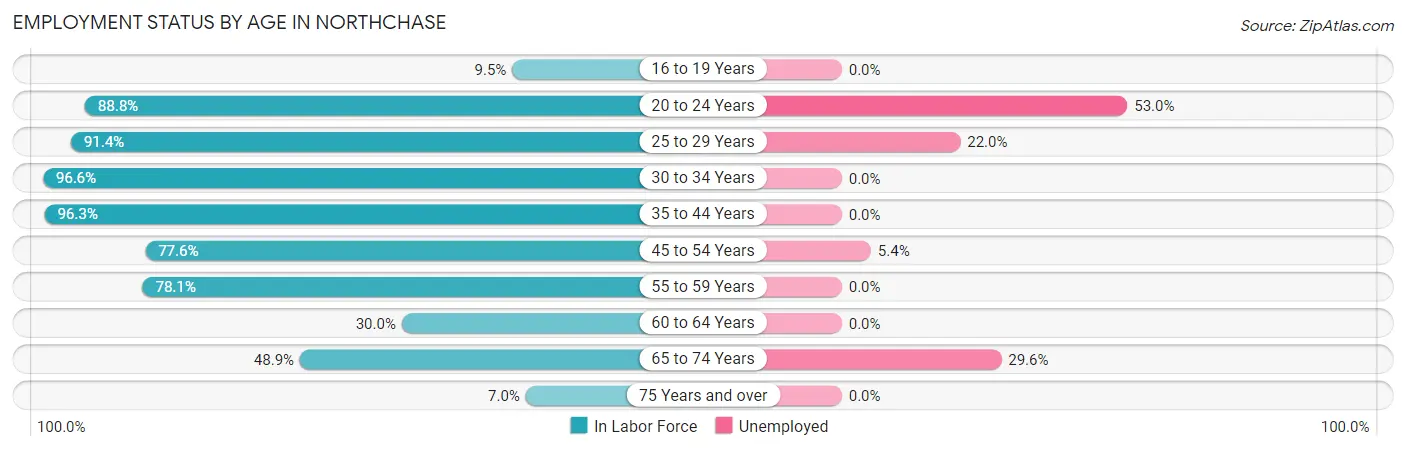
| Age Bracket | In Labor Force | Unemployed |
| 16 to 19 Years | 18 (9.5%) | 0 (0.0%) |
| 20 to 24 Years | 730 (88.8%) | 387 (53.0%) |
| 25 to 29 Years | 223 (91.4%) | 49 (22.0%) |
| 30 to 34 Years | 313 (96.6%) | 0 (0.0%) |
| 35 to 44 Years | 789 (96.3%) | 0 (0.0%) |
| 45 to 54 Years | 294 (77.6%) | 16 (5.4%) |
| 55 to 59 Years | 196 (78.1%) | 0 (0.0%) |
| 60 to 64 Years | 39 (30.0%) | 0 (0.0%) |
| 65 to 74 Years | 179 (48.9%) | 53 (29.6%) |
| 75 Years and over | 26 (7.0%) | 0 (0.0%) |
| Total | 2,807 (72.0%) | 519 (18.5%) |
Employment Status by Educational Attainment in Northchase
According to labor force statistics for Northchase, 86.4% of individuals (1,855) out of the total population between 25 and 64 years of age (2,147) are in the labor force, with 3.6% or 67 of them being unemployed. The group with the highest labor force participation rate are those with the educational attainment of bachelor's degree or higher, with 93.5% or 765 individuals in the labor force. Within the labor force, individuals with bachelor's degree or higher education have the highest percentage of unemployment, with 5.8% or 44 of them being unemployed.
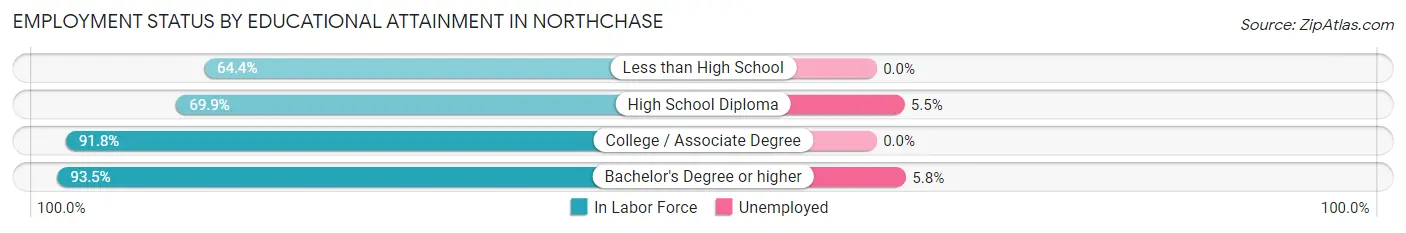
| Educational Attainment | In Labor Force | Unemployed |
| Less than High School | 29 (64.4%) | 0 (0.0%) |
| High School Diploma | 379 (69.9%) | 30 (5.5%) |
| College / Associate Degree | 681 (91.8%) | 0 (0.0%) |
| Bachelor's Degree or higher | 765 (93.5%) | 47 (5.8%) |
| Total | 1,855 (86.4%) | 77 (3.6%) |
Employment Occupations by Sex in Northchase
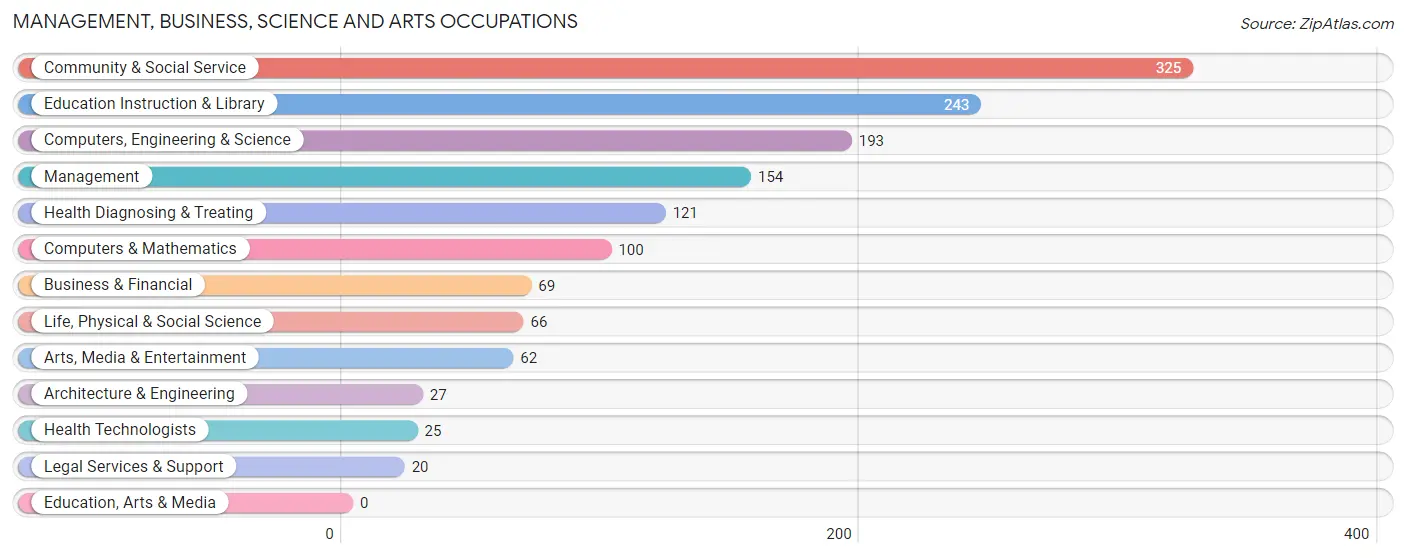
Management, Business, Science and Arts Occupations
The most common Management, Business, Science and Arts occupations in Northchase are Community & Social Service (325 | 14.6%), Education Instruction & Library (243 | 10.9%), Computers, Engineering & Science (193 | 8.7%), Management (154 | 6.9%), and Health Diagnosing & Treating (121 | 5.4%).
Management, Business, Science and Arts Occupations by Sex
Within the Management, Business, Science and Arts occupations in Northchase, the most male-oriented occupations are Architecture & Engineering (100.0%), Computers & Mathematics (95.0%), and Management (77.3%), while the most female-oriented occupations are Legal Services & Support (100.0%), Health Diagnosing & Treating (100.0%), and Health Technologists (100.0%).
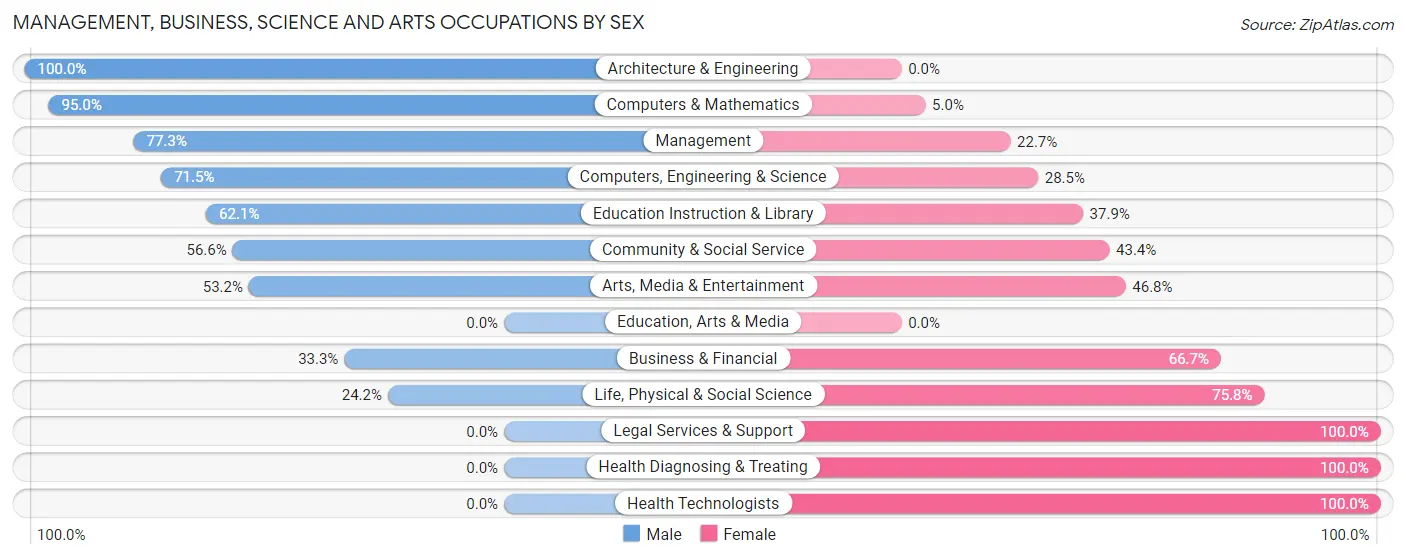
| Occupation | Male | Female |
| Management | 119 (77.3%) | 35 (22.7%) |
| Business & Financial | 23 (33.3%) | 46 (66.7%) |
| Computers, Engineering & Science | 138 (71.5%) | 55 (28.5%) |
| Computers & Mathematics | 95 (95.0%) | 5 (5.0%) |
| Architecture & Engineering | 27 (100.0%) | 0 (0.0%) |
| Life, Physical & Social Science | 16 (24.2%) | 50 (75.8%) |
| Community & Social Service | 184 (56.6%) | 141 (43.4%) |
| Education, Arts & Media | 0 (0.0%) | 0 (0.0%) |
| Legal Services & Support | 0 (0.0%) | 20 (100.0%) |
| Education Instruction & Library | 151 (62.1%) | 92 (37.9%) |
| Arts, Media & Entertainment | 33 (53.2%) | 29 (46.8%) |
| Health Diagnosing & Treating | 0 (0.0%) | 121 (100.0%) |
| Health Technologists | 0 (0.0%) | 25 (100.0%) |
| Total (Category) | 464 (53.8%) | 398 (46.2%) |
| Total (Overall) | 953 (42.7%) | 1,276 (57.3%) |
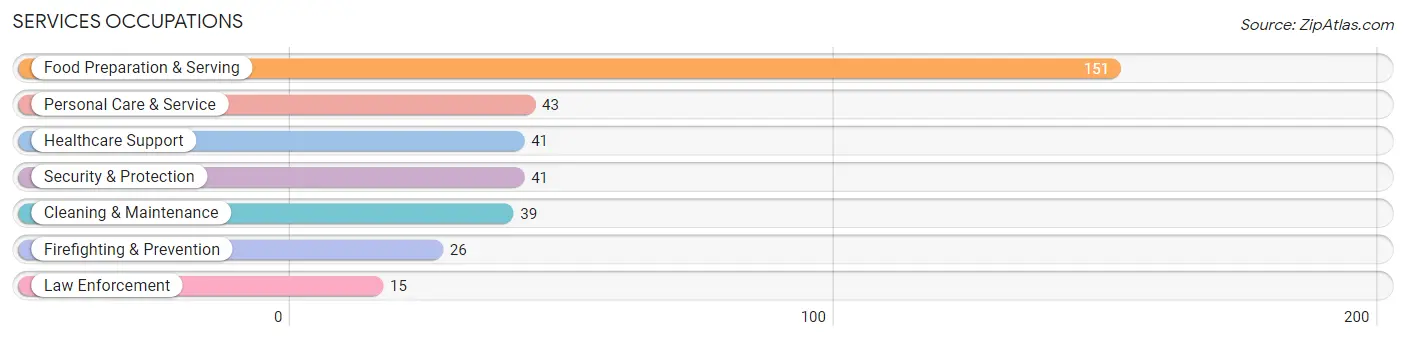
Services Occupations
The most common Services occupations in Northchase are Food Preparation & Serving (151 | 6.8%), Personal Care & Service (43 | 1.9%), Healthcare Support (41 | 1.8%), Security & Protection (41 | 1.8%), and Cleaning & Maintenance (39 | 1.8%).
Services Occupations by Sex
Within the Services occupations in Northchase, the most male-oriented occupations are Law Enforcement (100.0%), Healthcare Support (41.5%), and Security & Protection (36.6%), while the most female-oriented occupations are Firefighting & Prevention (100.0%), Cleaning & Maintenance (100.0%), and Personal Care & Service (100.0%).
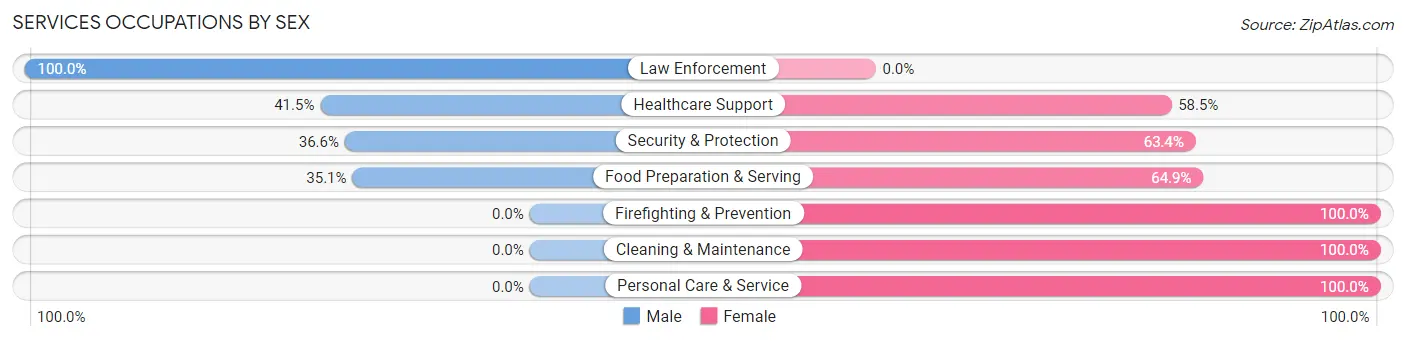
| Occupation | Male | Female |
| Healthcare Support | 17 (41.5%) | 24 (58.5%) |
| Security & Protection | 15 (36.6%) | 26 (63.4%) |
| Firefighting & Prevention | 0 (0.0%) | 26 (100.0%) |
| Law Enforcement | 15 (100.0%) | 0 (0.0%) |
| Food Preparation & Serving | 53 (35.1%) | 98 (64.9%) |
| Cleaning & Maintenance | 0 (0.0%) | 39 (100.0%) |
| Personal Care & Service | 0 (0.0%) | 43 (100.0%) |
| Total (Category) | 85 (27.0%) | 230 (73.0%) |
| Total (Overall) | 953 (42.7%) | 1,276 (57.3%) |
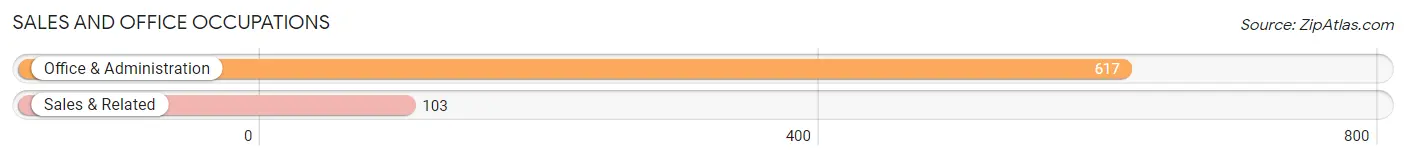
Sales and Office Occupations
The most common Sales and Office occupations in Northchase are Office & Administration (617 | 27.7%), and Sales & Related (103 | 4.6%).
Sales and Office Occupations by Sex
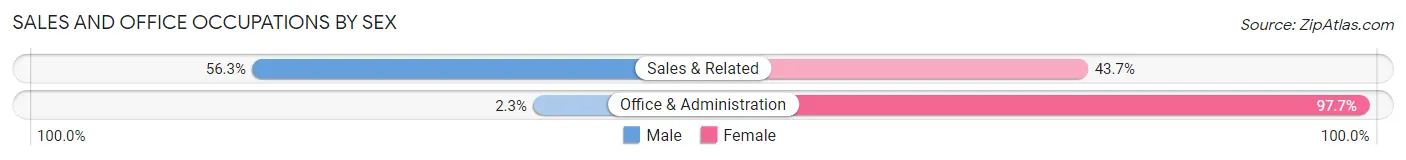
| Occupation | Male | Female |
| Sales & Related | 58 (56.3%) | 45 (43.7%) |
| Office & Administration | 14 (2.3%) | 603 (97.7%) |
| Total (Category) | 72 (10.0%) | 648 (90.0%) |
| Total (Overall) | 953 (42.7%) | 1,276 (57.3%) |
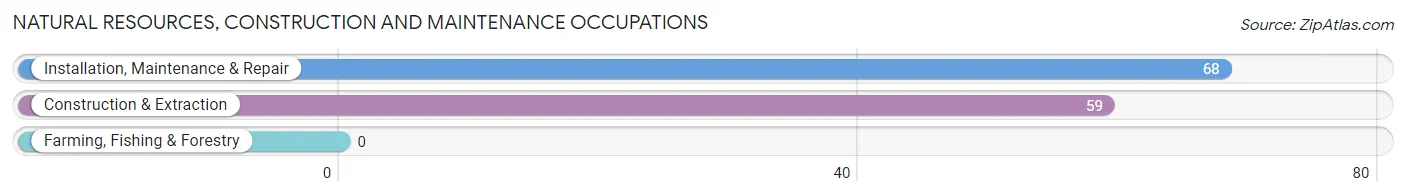
Natural Resources, Construction and Maintenance Occupations
The most common Natural Resources, Construction and Maintenance occupations in Northchase are Installation, Maintenance & Repair (68 | 3.0%), and Construction & Extraction (59 | 2.6%).
Natural Resources, Construction and Maintenance Occupations by Sex
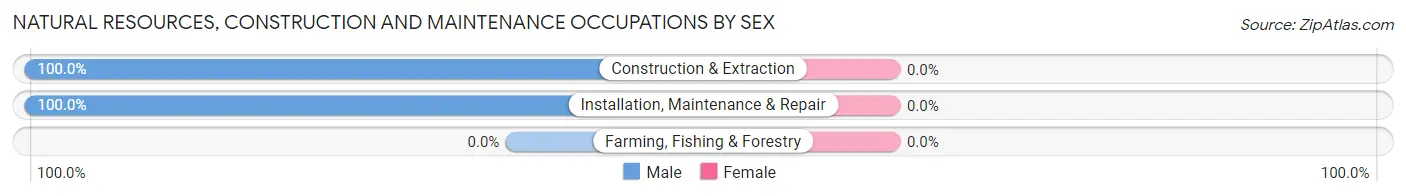
| Occupation | Male | Female |
| Farming, Fishing & Forestry | 0 (0.0%) | 0 (0.0%) |
| Construction & Extraction | 59 (100.0%) | 0 (0.0%) |
| Installation, Maintenance & Repair | 68 (100.0%) | 0 (0.0%) |
| Total (Category) | 127 (100.0%) | 0 (0.0%) |
| Total (Overall) | 953 (42.7%) | 1,276 (57.3%) |
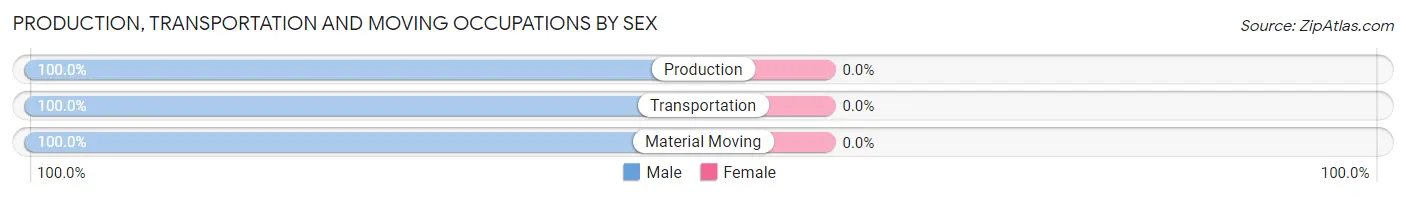
Production, Transportation and Moving Occupations
The most common Production, Transportation and Moving occupations in Northchase are Material Moving (188 | 8.4%), Transportation (11 | 0.5%), and Production (6 | 0.3%).
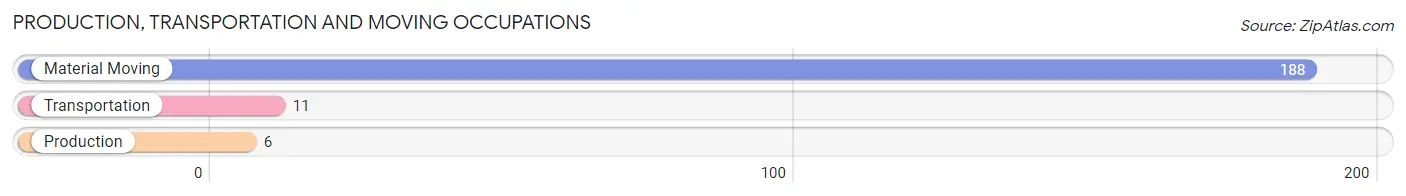
Production, Transportation and Moving Occupations by Sex
| Occupation | Male | Female |
| Production | 6 (100.0%) | 0 (0.0%) |
| Transportation | 11 (100.0%) | 0 (0.0%) |
| Material Moving | 188 (100.0%) | 0 (0.0%) |
| Total (Category) | 205 (100.0%) | 0 (0.0%) |
| Total (Overall) | 953 (42.7%) | 1,276 (57.3%) |
Employment Industries by Sex in Northchase
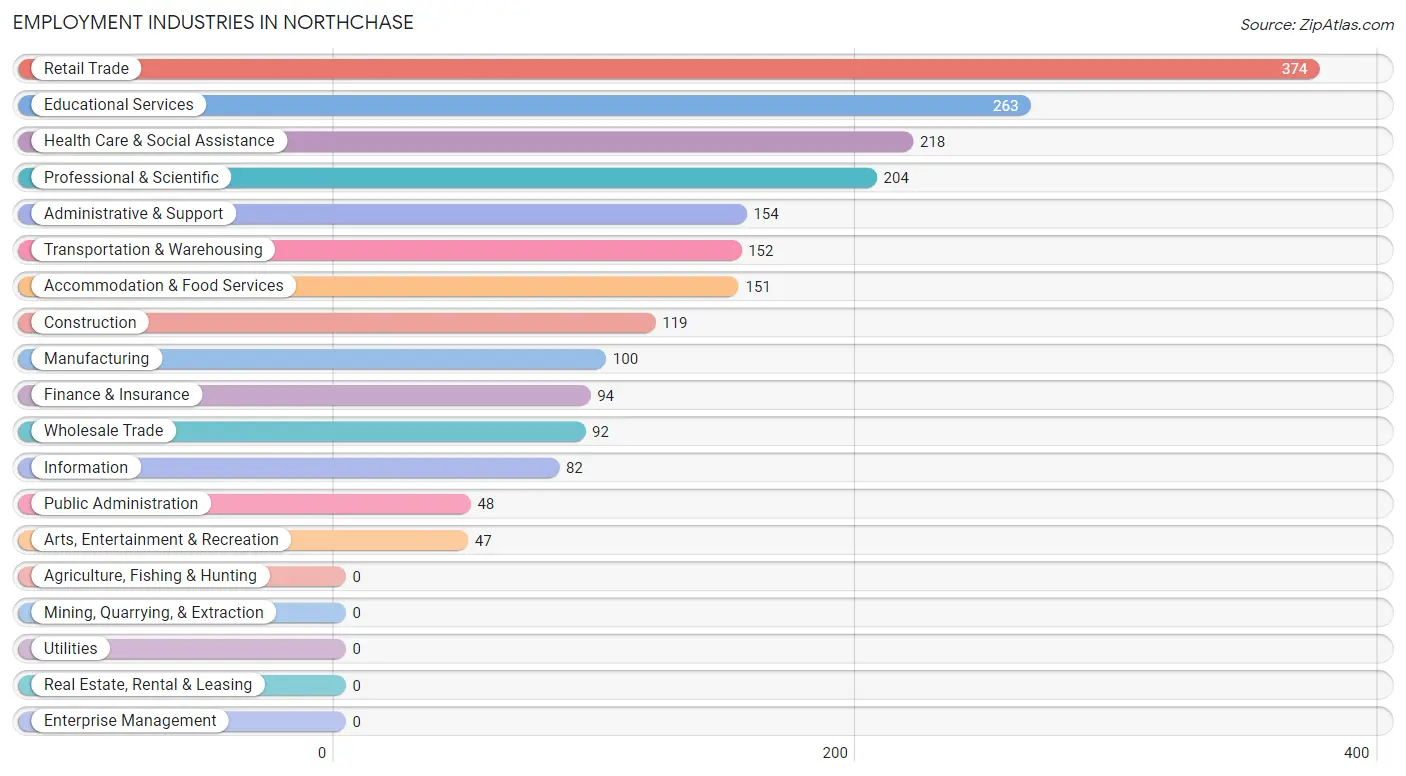
Employment Industries in Northchase
The major employment industries in Northchase include Retail Trade (374 | 16.8%), Educational Services (263 | 11.8%), Health Care & Social Assistance (218 | 9.8%), Professional & Scientific (204 | 9.1%), and Administrative & Support (154 | 6.9%).
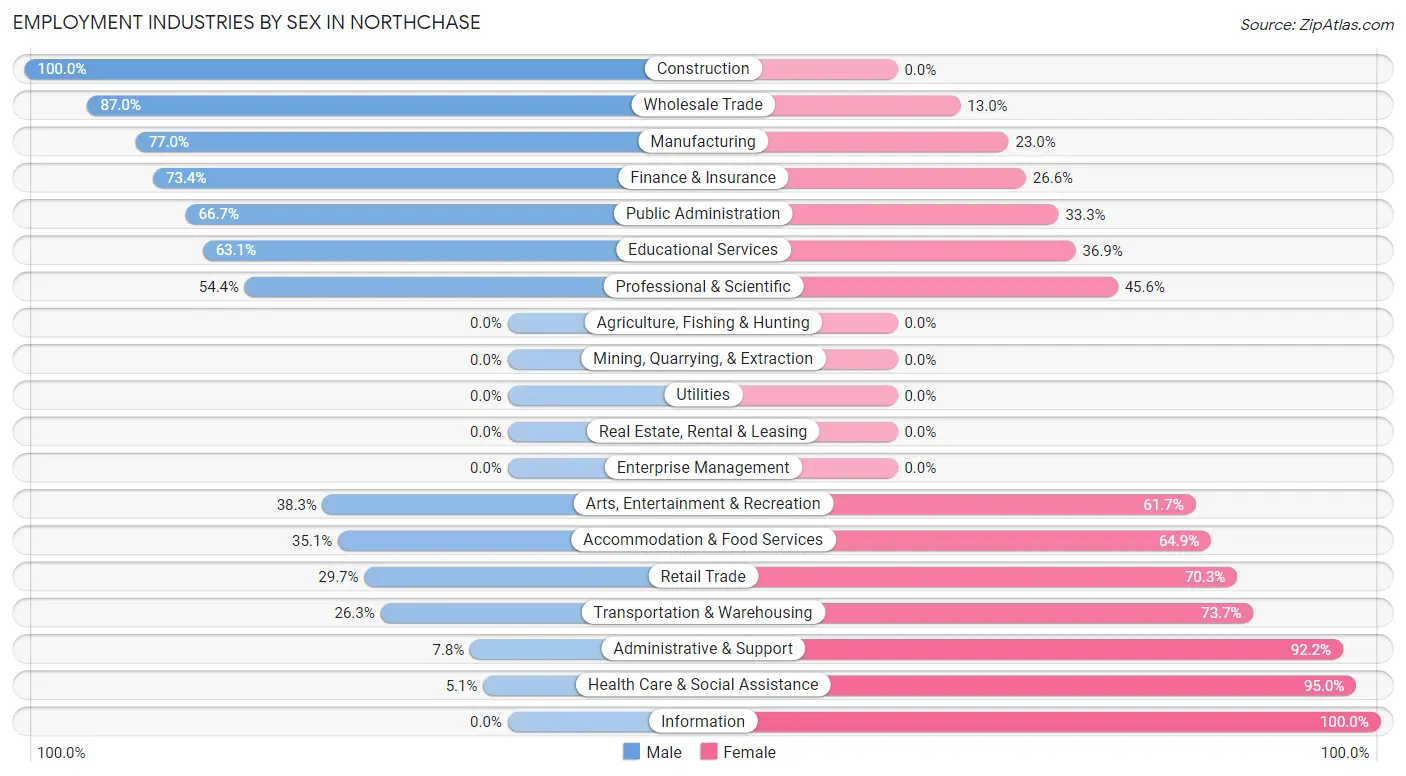
Employment Industries by Sex in Northchase
The Northchase industries that see more men than women are Construction (100.0%), Wholesale Trade (87.0%), and Manufacturing (77.0%), whereas the industries that tend to have a higher number of women are Information (100.0%), Health Care & Social Assistance (95.0%), and Administrative & Support (92.2%).
| Industry | Male | Female |
| Agriculture, Fishing & Hunting | 0 (0.0%) | 0 (0.0%) |
| Mining, Quarrying, & Extraction | 0 (0.0%) | 0 (0.0%) |
| Construction | 119 (100.0%) | 0 (0.0%) |
| Manufacturing | 77 (77.0%) | 23 (23.0%) |
| Wholesale Trade | 80 (87.0%) | 12 (13.0%) |
| Retail Trade | 111 (29.7%) | 263 (70.3%) |
| Transportation & Warehousing | 40 (26.3%) | 112 (73.7%) |
| Utilities | 0 (0.0%) | 0 (0.0%) |
| Information | 0 (0.0%) | 82 (100.0%) |
| Finance & Insurance | 69 (73.4%) | 25 (26.6%) |
| Real Estate, Rental & Leasing | 0 (0.0%) | 0 (0.0%) |
| Professional & Scientific | 111 (54.4%) | 93 (45.6%) |
| Enterprise Management | 0 (0.0%) | 0 (0.0%) |
| Administrative & Support | 12 (7.8%) | 142 (92.2%) |
| Educational Services | 166 (63.1%) | 97 (36.9%) |
| Health Care & Social Assistance | 11 (5.1%) | 207 (95.0%) |
| Arts, Entertainment & Recreation | 18 (38.3%) | 29 (61.7%) |
| Accommodation & Food Services | 53 (35.1%) | 98 (64.9%) |
| Public Administration | 32 (66.7%) | 16 (33.3%) |
| Total | 953 (42.7%) | 1,276 (57.3%) |
Education in Northchase
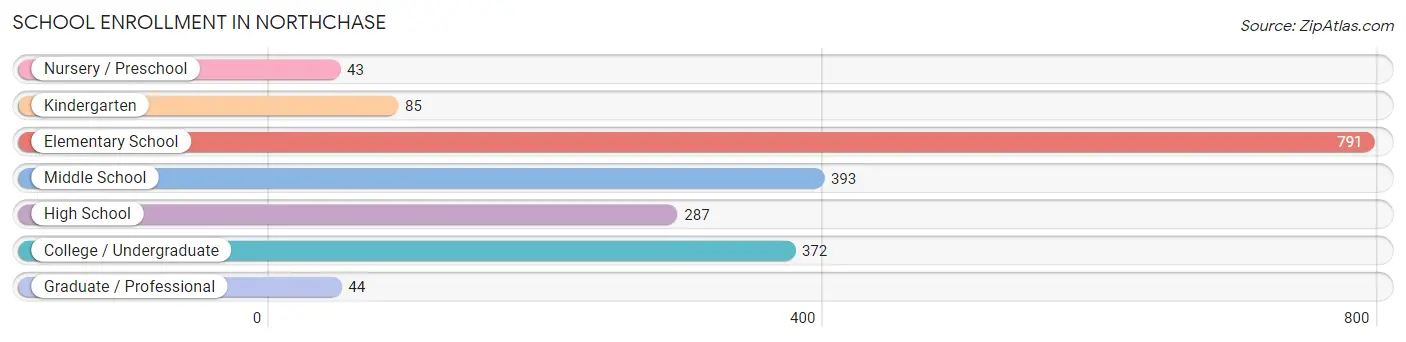
School Enrollment in Northchase
The most common levels of schooling among the 2,015 students in Northchase are elementary school (791 | 39.3%), middle school (393 | 19.5%), and college / undergraduate (372 | 18.5%).
| School Level | # Students | % Students |
| Nursery / Preschool | 43 | 2.1% |
| Kindergarten | 85 | 4.2% |
| Elementary School | 791 | 39.3% |
| Middle School | 393 | 19.5% |
| High School | 287 | 14.2% |
| College / Undergraduate | 372 | 18.5% |
| Graduate / Professional | 44 | 2.2% |
| Total | 2,015 | 100.0% |
School Enrollment by Age by Funding Source in Northchase
Out of a total of 2,015 students who are enrolled in schools in Northchase, 79 (3.9%) attend a private institution, while the remaining 1,936 (96.1%) are enrolled in public schools. The age group of 35 years and over has the highest likelihood of being enrolled in private schools, with 34 (70.8% in the age bracket) enrolled. Conversely, the age group of 3 to 4 year olds has the lowest likelihood of being enrolled in a private school, with 25 (100.0% in the age bracket) attending a public institution.
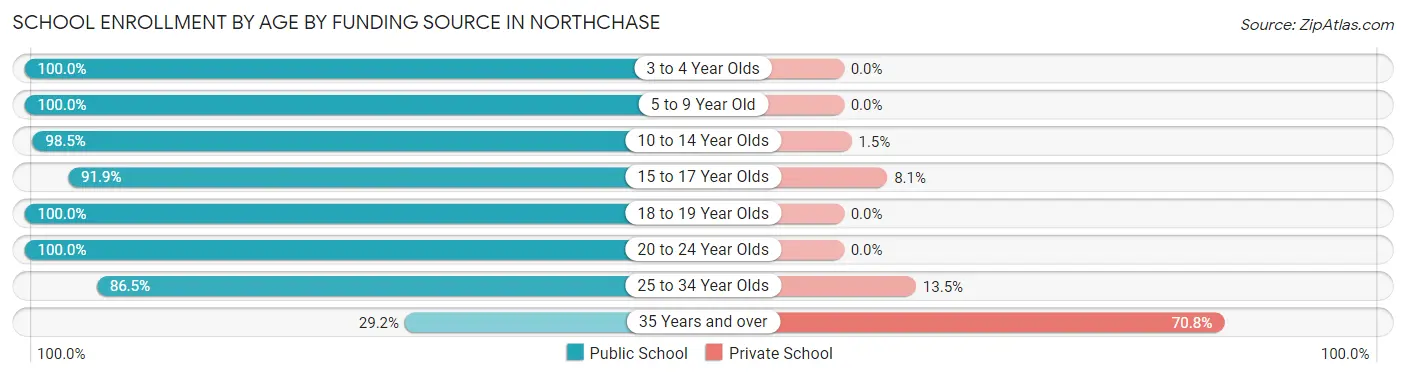
| Age Bracket | Public School | Private School |
| 3 to 4 Year Olds | 25 (100.0%) | 0 (0.0%) |
| 5 to 9 Year Old | 894 (100.0%) | 0 (0.0%) |
| 10 to 14 Year Olds | 406 (98.5%) | 6 (1.5%) |
| 15 to 17 Year Olds | 204 (91.9%) | 18 (8.1%) |
| 18 to 19 Year Olds | 79 (100.0%) | 0 (0.0%) |
| 20 to 24 Year Olds | 179 (100.0%) | 0 (0.0%) |
| 25 to 34 Year Olds | 135 (86.5%) | 21 (13.5%) |
| 35 Years and over | 14 (29.2%) | 34 (70.8%) |
| Total | 1,936 (96.1%) | 79 (3.9%) |
Educational Attainment by Field of Study in Northchase
Business (251 | 23.6%), psychology (151 | 14.2%), literature & languages (151 | 14.2%), education (122 | 11.5%), and science & technology (96 | 9.0%) are the most common fields of study among 1,065 individuals in Northchase who have obtained a bachelor's degree or higher.
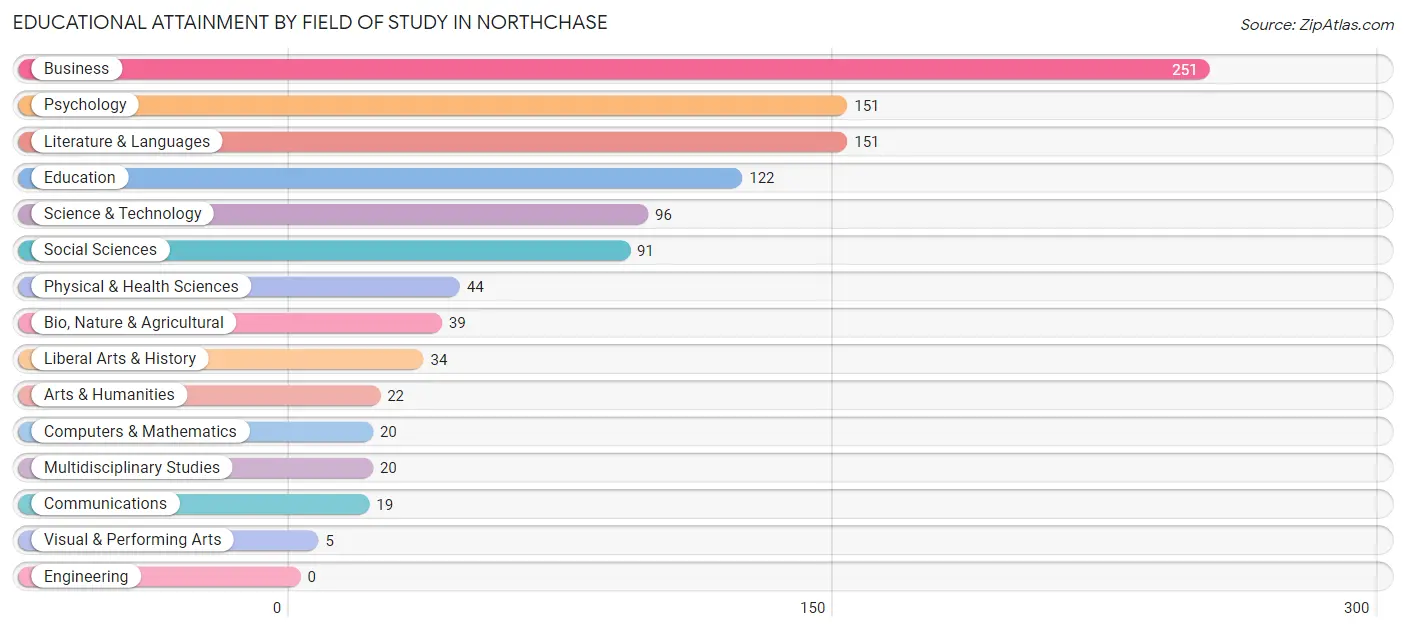
| Field of Study | # Graduates | % Graduates |
| Computers & Mathematics | 20 | 1.9% |
| Bio, Nature & Agricultural | 39 | 3.7% |
| Physical & Health Sciences | 44 | 4.1% |
| Psychology | 151 | 14.2% |
| Social Sciences | 91 | 8.5% |
| Engineering | 0 | 0.0% |
| Multidisciplinary Studies | 20 | 1.9% |
| Science & Technology | 96 | 9.0% |
| Business | 251 | 23.6% |
| Education | 122 | 11.5% |
| Literature & Languages | 151 | 14.2% |
| Liberal Arts & History | 34 | 3.2% |
| Visual & Performing Arts | 5 | 0.5% |
| Communications | 19 | 1.8% |
| Arts & Humanities | 22 | 2.1% |
| Total | 1,065 | 100.0% |
Transportation & Commute in Northchase
Vehicle Availability by Sex in Northchase
The most prevalent vehicle ownership categories in Northchase are males with 2 vehicles (766, accounting for 74.7%) and females with 2 vehicles (864, making up 61.3%).
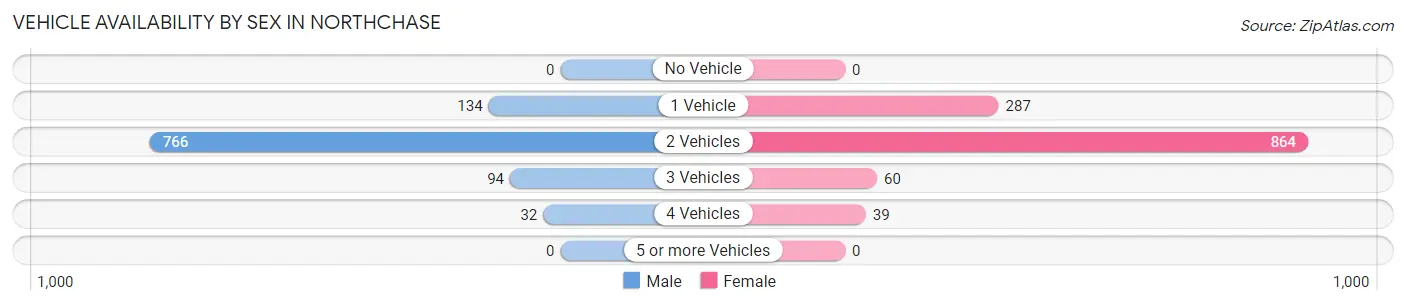
| Vehicles Available | Male | Female |
| No Vehicle | 0 (0.0%) | 0 (0.0%) |
| 1 Vehicle | 134 (13.1%) | 287 (23.0%) |
| 2 Vehicles | 766 (74.7%) | 864 (69.1%) |
| 3 Vehicles | 94 (9.2%) | 60 (4.8%) |
| 4 Vehicles | 32 (3.1%) | 39 (3.1%) |
| 5 or more Vehicles | 0 (0.0%) | 0 (0.0%) |
| Total | 1,026 (100.0%) | 1,250 (100.0%) |
Commute Time in Northchase
The most frequently occuring commute durations in Northchase are 15 to 19 minutes (489 commuters, 27.2%), 20 to 24 minutes (419 commuters, 23.3%), and 5 to 9 minutes (272 commuters, 15.1%).
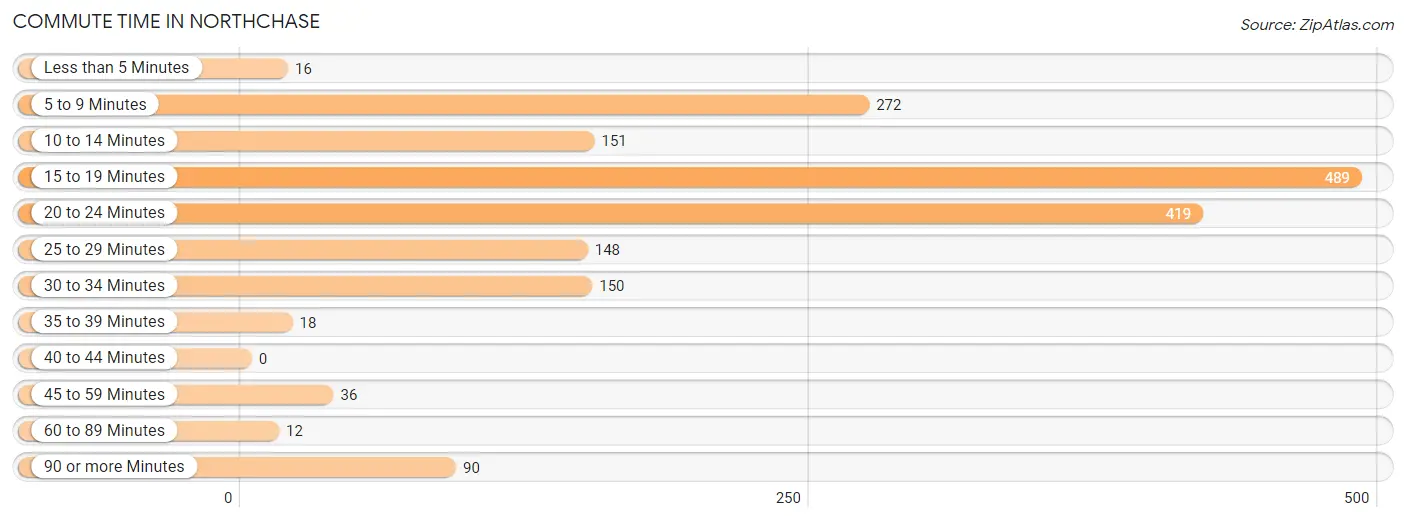
| Commute Time | # Commuters | % Commuters |
| Less than 5 Minutes | 16 | 0.9% |
| 5 to 9 Minutes | 272 | 15.1% |
| 10 to 14 Minutes | 151 | 8.4% |
| 15 to 19 Minutes | 489 | 27.2% |
| 20 to 24 Minutes | 419 | 23.3% |
| 25 to 29 Minutes | 148 | 8.2% |
| 30 to 34 Minutes | 150 | 8.3% |
| 35 to 39 Minutes | 18 | 1.0% |
| 40 to 44 Minutes | 0 | 0.0% |
| 45 to 59 Minutes | 36 | 2.0% |
| 60 to 89 Minutes | 12 | 0.7% |
| 90 or more Minutes | 90 | 5.0% |
Commute Time by Sex in Northchase
The most common commute times in Northchase are 15 to 19 minutes (173 commuters, 21.9%) for males and 15 to 19 minutes (316 commuters, 31.2%) for females.
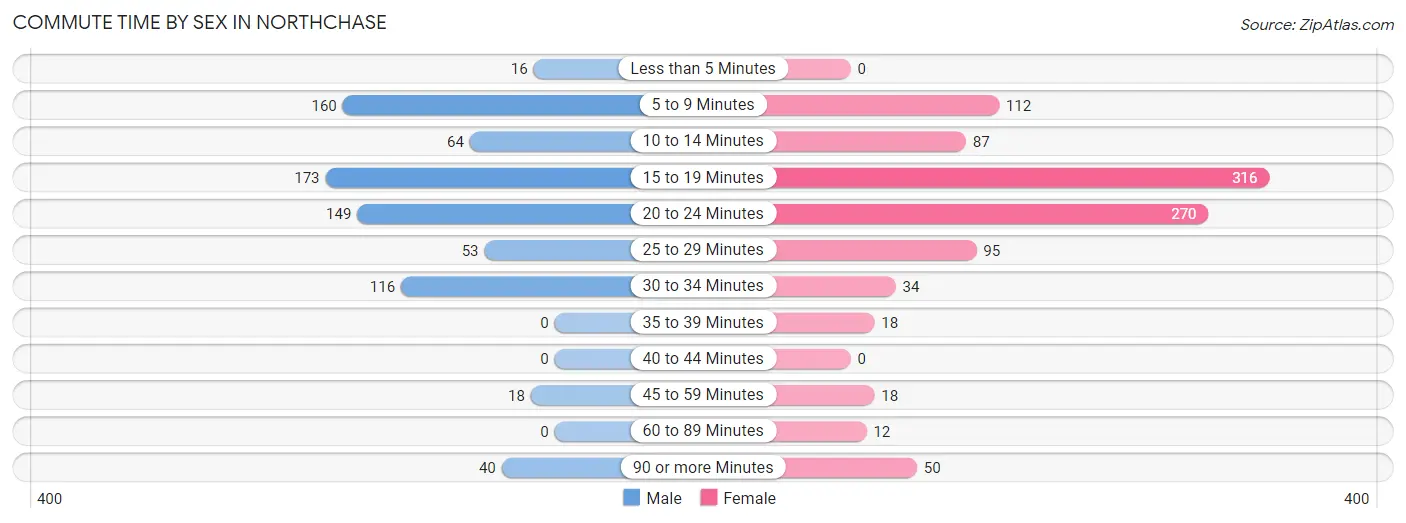
| Commute Time | Male | Female |
| Less than 5 Minutes | 16 (2.0%) | 0 (0.0%) |
| 5 to 9 Minutes | 160 (20.3%) | 112 (11.1%) |
| 10 to 14 Minutes | 64 (8.1%) | 87 (8.6%) |
| 15 to 19 Minutes | 173 (21.9%) | 316 (31.2%) |
| 20 to 24 Minutes | 149 (18.9%) | 270 (26.7%) |
| 25 to 29 Minutes | 53 (6.7%) | 95 (9.4%) |
| 30 to 34 Minutes | 116 (14.7%) | 34 (3.4%) |
| 35 to 39 Minutes | 0 (0.0%) | 18 (1.8%) |
| 40 to 44 Minutes | 0 (0.0%) | 0 (0.0%) |
| 45 to 59 Minutes | 18 (2.3%) | 18 (1.8%) |
| 60 to 89 Minutes | 0 (0.0%) | 12 (1.2%) |
| 90 or more Minutes | 40 (5.1%) | 50 (4.9%) |
Time of Departure to Work by Sex in Northchase
The most frequent times of departure to work in Northchase are 9:00 AM to 9:59 AM (161, 20.4%) for males and 7:00 AM to 7:29 AM (284, 28.1%) for females.
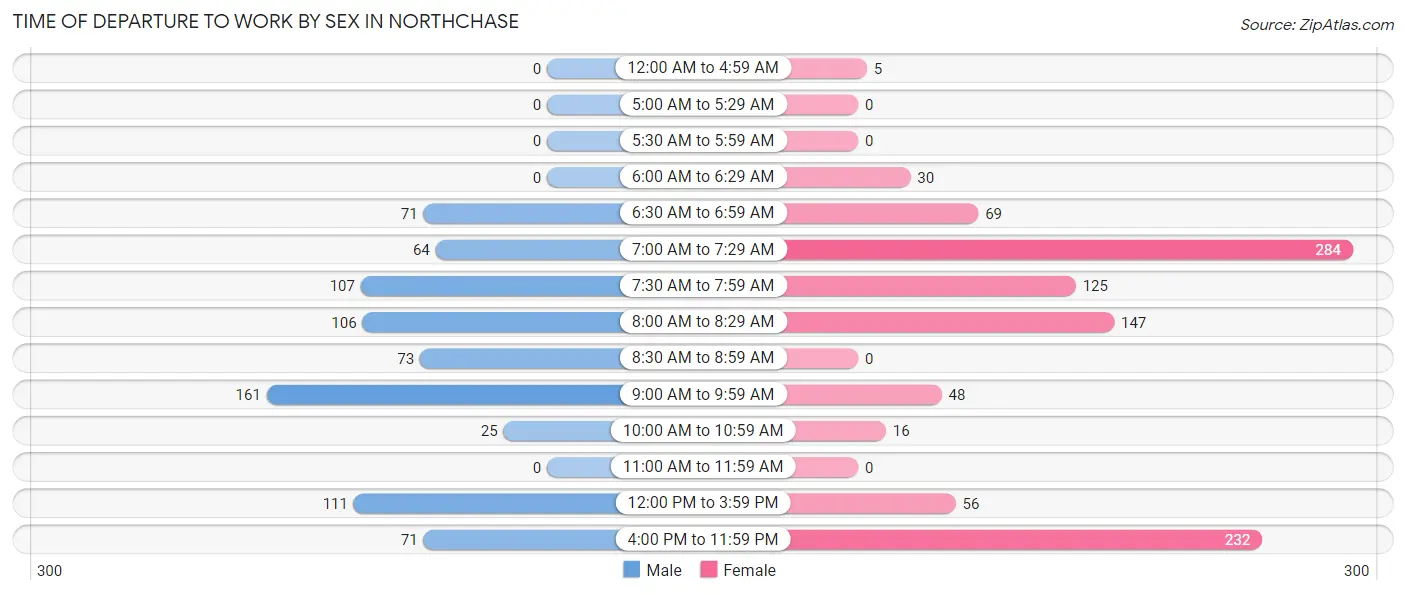
| Time of Departure | Male | Female |
| 12:00 AM to 4:59 AM | 0 (0.0%) | 5 (0.5%) |
| 5:00 AM to 5:29 AM | 0 (0.0%) | 0 (0.0%) |
| 5:30 AM to 5:59 AM | 0 (0.0%) | 0 (0.0%) |
| 6:00 AM to 6:29 AM | 0 (0.0%) | 30 (3.0%) |
| 6:30 AM to 6:59 AM | 71 (9.0%) | 69 (6.8%) |
| 7:00 AM to 7:29 AM | 64 (8.1%) | 284 (28.1%) |
| 7:30 AM to 7:59 AM | 107 (13.6%) | 125 (12.3%) |
| 8:00 AM to 8:29 AM | 106 (13.4%) | 147 (14.5%) |
| 8:30 AM to 8:59 AM | 73 (9.2%) | 0 (0.0%) |
| 9:00 AM to 9:59 AM | 161 (20.4%) | 48 (4.7%) |
| 10:00 AM to 10:59 AM | 25 (3.2%) | 16 (1.6%) |
| 11:00 AM to 11:59 AM | 0 (0.0%) | 0 (0.0%) |
| 12:00 PM to 3:59 PM | 111 (14.1%) | 56 (5.5%) |
| 4:00 PM to 11:59 PM | 71 (9.0%) | 232 (22.9%) |
| Total | 789 (100.0%) | 1,012 (100.0%) |
Housing Occupancy in Northchase
Occupancy by Ownership in Northchase
Of the total 2,109 dwellings in Northchase, owner-occupied units account for 898 (42.6%), while renter-occupied units make up 1,211 (57.4%).
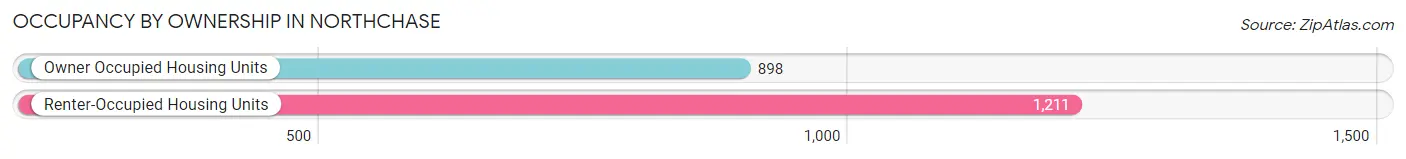
| Occupancy | # Housing Units | % Housing Units |
| Owner Occupied Housing Units | 898 | 42.6% |
| Renter-Occupied Housing Units | 1,211 | 57.4% |
| Total Occupied Housing Units | 2,109 | 100.0% |
Occupancy by Household Size in Northchase
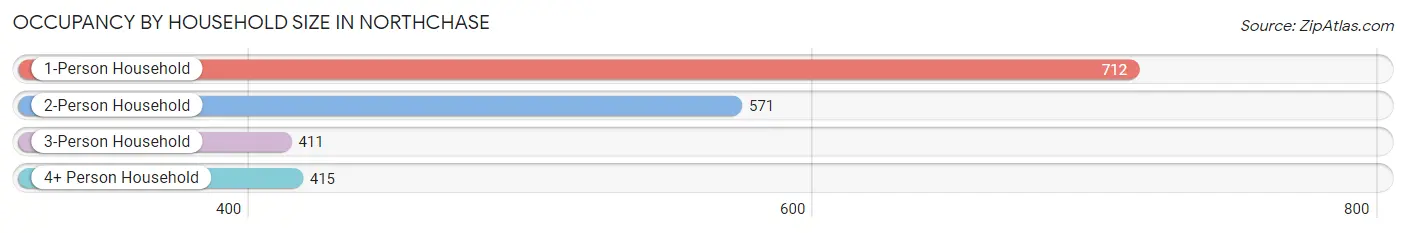
| Household Size | # Housing Units | % Housing Units |
| 1-Person Household | 712 | 33.8% |
| 2-Person Household | 571 | 27.1% |
| 3-Person Household | 411 | 19.5% |
| 4+ Person Household | 415 | 19.7% |
| Total Housing Units | 2,109 | 100.0% |
Occupancy by Ownership by Household Size in Northchase
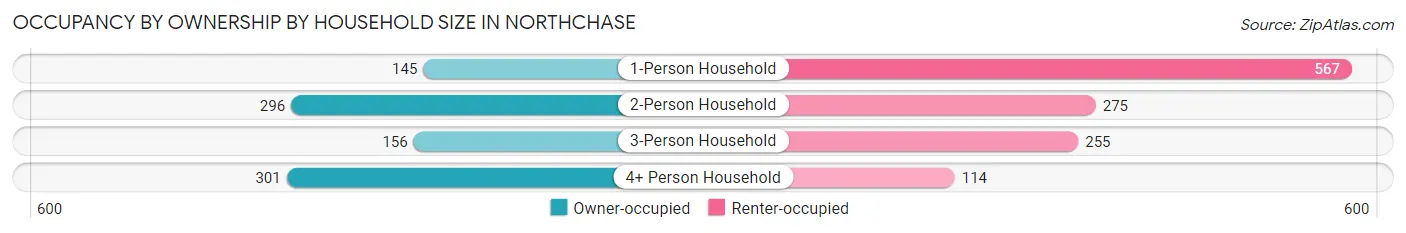
| Household Size | Owner-occupied | Renter-occupied |
| 1-Person Household | 145 (20.4%) | 567 (79.6%) |
| 2-Person Household | 296 (51.8%) | 275 (48.2%) |
| 3-Person Household | 156 (38.0%) | 255 (62.0%) |
| 4+ Person Household | 301 (72.5%) | 114 (27.5%) |
| Total Housing Units | 898 (42.6%) | 1,211 (57.4%) |
Occupancy by Educational Attainment in Northchase
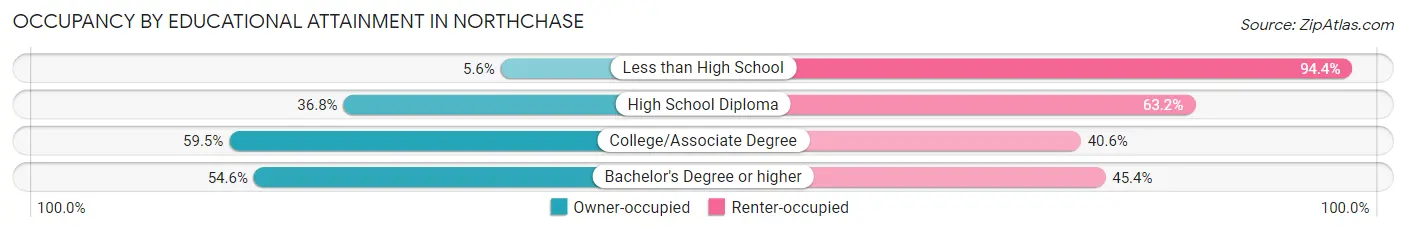
| Household Size | Owner-occupied | Renter-occupied |
| Less than High School | 24 (5.6%) | 403 (94.4%) |
| High School Diploma | 149 (36.8%) | 256 (63.2%) |
| College/Associate Degree | 343 (59.5%) | 234 (40.6%) |
| Bachelor's Degree or higher | 382 (54.6%) | 318 (45.4%) |
Occupancy by Age of Householder in Northchase
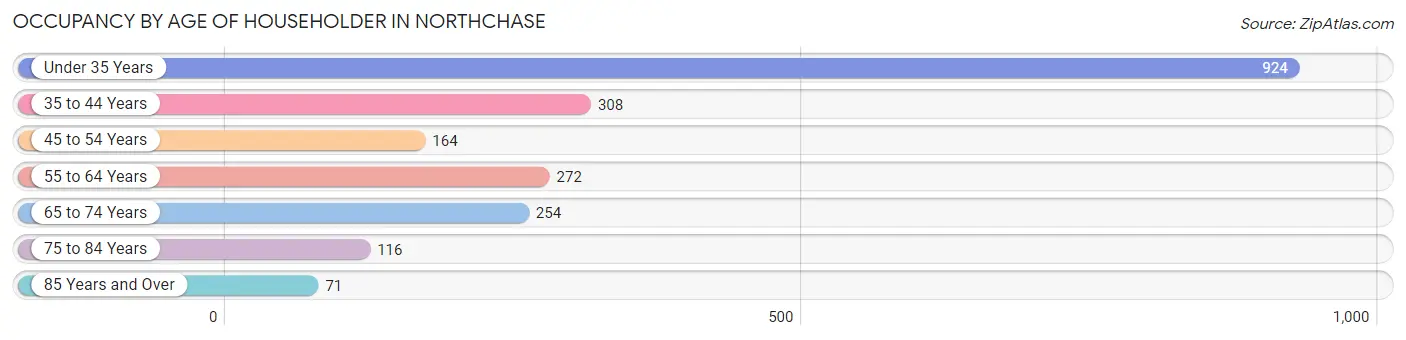
| Age Bracket | # Households | % Households |
| Under 35 Years | 924 | 43.8% |
| 35 to 44 Years | 308 | 14.6% |
| 45 to 54 Years | 164 | 7.8% |
| 55 to 64 Years | 272 | 12.9% |
| 65 to 74 Years | 254 | 12.0% |
| 75 to 84 Years | 116 | 5.5% |
| 85 Years and Over | 71 | 3.4% |
| Total | 2,109 | 100.0% |
Housing Finances in Northchase
Median Income by Occupancy in Northchase
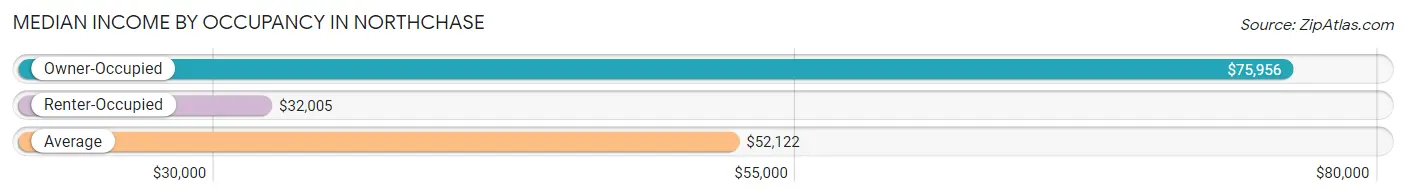
| Occupancy Type | # Households | Median Income |
| Owner-Occupied | 898 (42.6%) | $75,956 |
| Renter-Occupied | 1,211 (57.4%) | $32,005 |
| Average | 2,109 (100.0%) | $52,122 |
Occupancy by Householder Income Bracket in Northchase
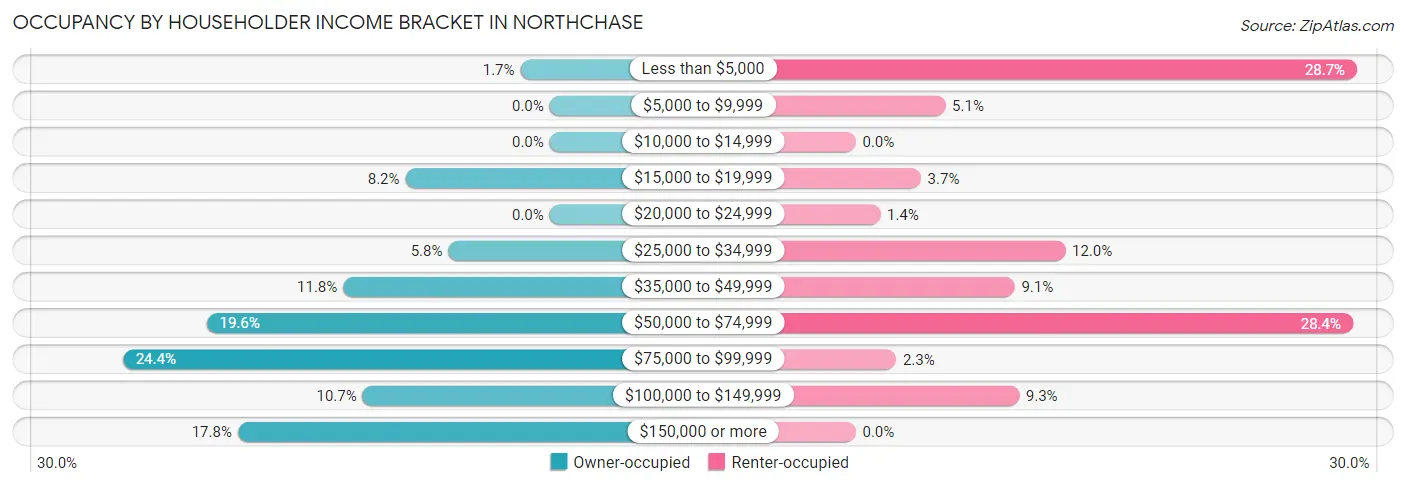
| Income Bracket | Owner-occupied | Renter-occupied |
| Less than $5,000 | 15 (1.7%) | 347 (28.6%) |
| $5,000 to $9,999 | 0 (0.0%) | 62 (5.1%) |
| $10,000 to $14,999 | 0 (0.0%) | 0 (0.0%) |
| $15,000 to $19,999 | 74 (8.2%) | 45 (3.7%) |
| $20,000 to $24,999 | 0 (0.0%) | 17 (1.4%) |
| $25,000 to $34,999 | 52 (5.8%) | 145 (12.0%) |
| $35,000 to $49,999 | 106 (11.8%) | 110 (9.1%) |
| $50,000 to $74,999 | 176 (19.6%) | 344 (28.4%) |
| $75,000 to $99,999 | 219 (24.4%) | 28 (2.3%) |
| $100,000 to $149,999 | 96 (10.7%) | 113 (9.3%) |
| $150,000 or more | 160 (17.8%) | 0 (0.0%) |
| Total | 898 (100.0%) | 1,211 (100.0%) |
Monthly Housing Cost Tiers in Northchase
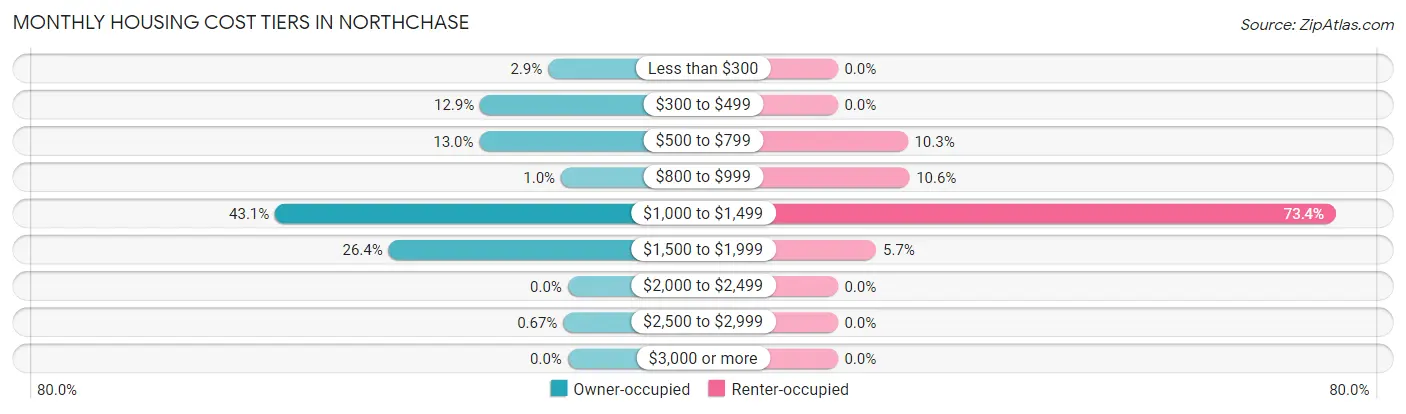
| Monthly Cost | Owner-occupied | Renter-occupied |
| Less than $300 | 26 (2.9%) | 0 (0.0%) |
| $300 to $499 | 116 (12.9%) | 0 (0.0%) |
| $500 to $799 | 117 (13.0%) | 125 (10.3%) |
| $800 to $999 | 9 (1.0%) | 128 (10.6%) |
| $1,000 to $1,499 | 387 (43.1%) | 889 (73.4%) |
| $1,500 to $1,999 | 237 (26.4%) | 69 (5.7%) |
| $2,000 to $2,499 | 0 (0.0%) | 0 (0.0%) |
| $2,500 to $2,999 | 6 (0.7%) | 0 (0.0%) |
| $3,000 or more | 0 (0.0%) | 0 (0.0%) |
| Total | 898 (100.0%) | 1,211 (100.0%) |
Physical Housing Characteristics in Northchase
Housing Structures in Northchase
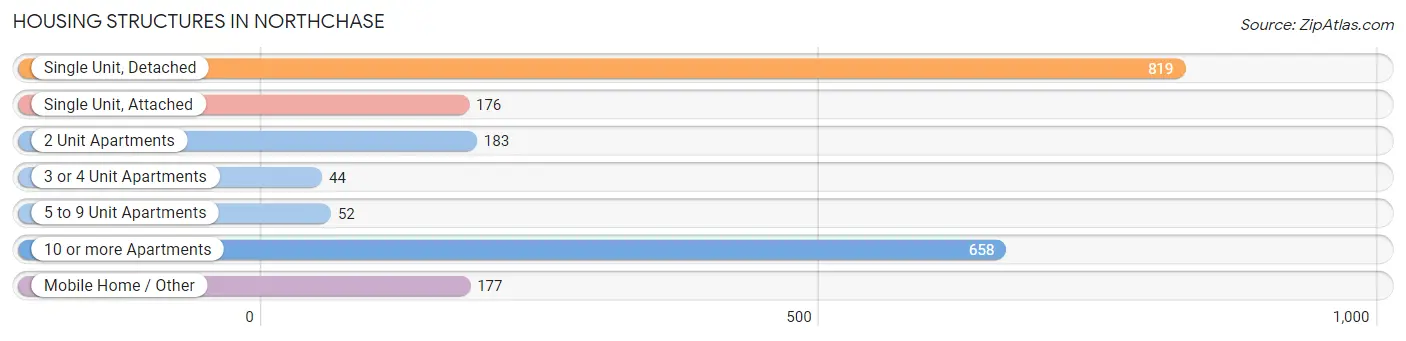
| Structure Type | # Housing Units | % Housing Units |
| Single Unit, Detached | 819 | 38.8% |
| Single Unit, Attached | 176 | 8.4% |
| 2 Unit Apartments | 183 | 8.7% |
| 3 or 4 Unit Apartments | 44 | 2.1% |
| 5 to 9 Unit Apartments | 52 | 2.5% |
| 10 or more Apartments | 658 | 31.2% |
| Mobile Home / Other | 177 | 8.4% |
| Total | 2,109 | 100.0% |
Housing Structures by Occupancy in Northchase
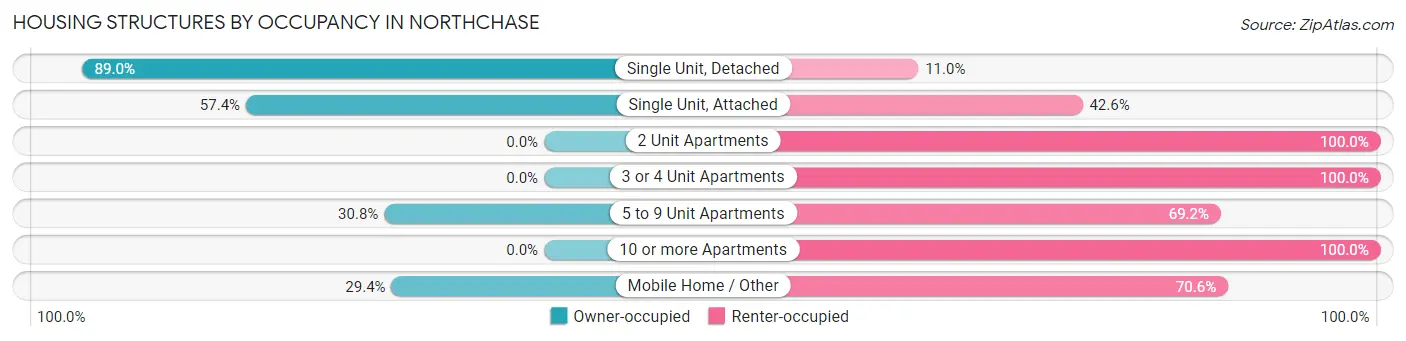
| Structure Type | Owner-occupied | Renter-occupied |
| Single Unit, Detached | 729 (89.0%) | 90 (11.0%) |
| Single Unit, Attached | 101 (57.4%) | 75 (42.6%) |
| 2 Unit Apartments | 0 (0.0%) | 183 (100.0%) |
| 3 or 4 Unit Apartments | 0 (0.0%) | 44 (100.0%) |
| 5 to 9 Unit Apartments | 16 (30.8%) | 36 (69.2%) |
| 10 or more Apartments | 0 (0.0%) | 658 (100.0%) |
| Mobile Home / Other | 52 (29.4%) | 125 (70.6%) |
| Total | 898 (42.6%) | 1,211 (57.4%) |
Housing Structures by Number of Rooms in Northchase
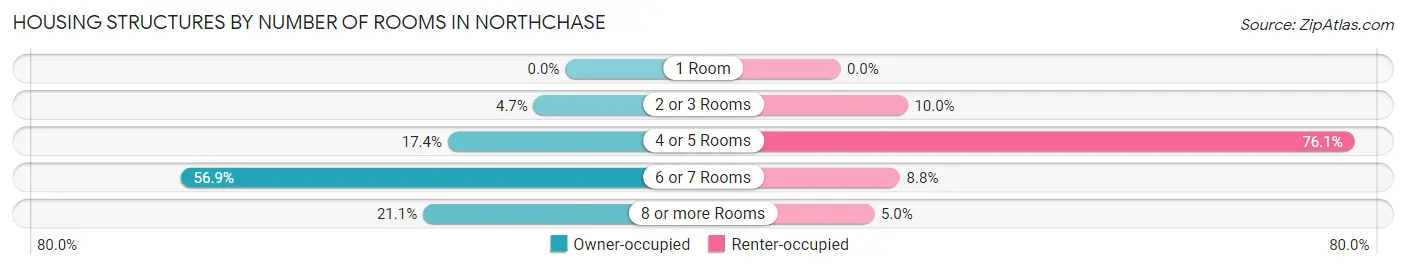
| Number of Rooms | Owner-occupied | Renter-occupied |
| 1 Room | 0 (0.0%) | 0 (0.0%) |
| 2 or 3 Rooms | 42 (4.7%) | 121 (10.0%) |
| 4 or 5 Rooms | 156 (17.4%) | 922 (76.1%) |
| 6 or 7 Rooms | 511 (56.9%) | 107 (8.8%) |
| 8 or more Rooms | 189 (21.0%) | 61 (5.0%) |
| Total | 898 (100.0%) | 1,211 (100.0%) |
Housing Structure by Heating Type in Northchase
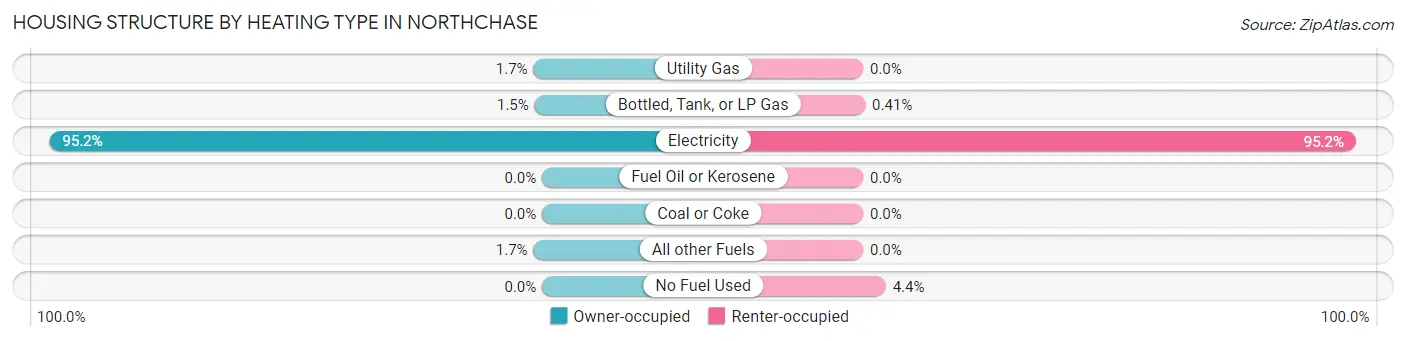
| Heating Type | Owner-occupied | Renter-occupied |
| Utility Gas | 15 (1.7%) | 0 (0.0%) |
| Bottled, Tank, or LP Gas | 13 (1.5%) | 5 (0.4%) |
| Electricity | 855 (95.2%) | 1,153 (95.2%) |
| Fuel Oil or Kerosene | 0 (0.0%) | 0 (0.0%) |
| Coal or Coke | 0 (0.0%) | 0 (0.0%) |
| All other Fuels | 15 (1.7%) | 0 (0.0%) |
| No Fuel Used | 0 (0.0%) | 53 (4.4%) |
| Total | 898 (100.0%) | 1,211 (100.0%) |
Household Vehicle Usage in Northchase
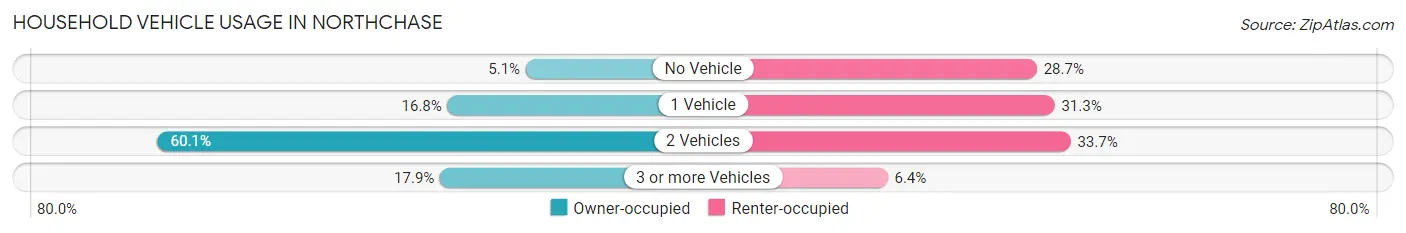
| Vehicles per Household | Owner-occupied | Renter-occupied |
| No Vehicle | 46 (5.1%) | 347 (28.6%) |
| 1 Vehicle | 151 (16.8%) | 379 (31.3%) |
| 2 Vehicles | 540 (60.1%) | 408 (33.7%) |
| 3 or more Vehicles | 161 (17.9%) | 77 (6.4%) |
| Total | 898 (100.0%) | 1,211 (100.0%) |
Real Estate & Mortgages in Northchase
Real Estate and Mortgage Overview in Northchase
| Characteristic | Without Mortgage | With Mortgage |
| Housing Units | 203 | 695 |
| Median Property Value | $263,000 | $277,300 |
| Median Household Income | $77,539 | $130 |
| Monthly Housing Costs | $419 | $0 |
| Real Estate Taxes | $1,248 | $26 |
Property Value by Mortgage Status in Northchase

| Property Value | Without Mortgage | With Mortgage |
| Less than $50,000 | 26 (12.8%) | 26 (3.7%) |
| $50,000 to $99,999 | 0 (0.0%) | 0 (0.0%) |
| $100,000 to $299,999 | 145 (71.4%) | 409 (58.9%) |
| $300,000 to $499,999 | 32 (15.8%) | 254 (36.5%) |
| $500,000 to $749,999 | 0 (0.0%) | 0 (0.0%) |
| $750,000 to $999,999 | 0 (0.0%) | 0 (0.0%) |
| $1,000,000 or more | 0 (0.0%) | 6 (0.9%) |
| Total | 203 (100.0%) | 695 (100.0%) |
Household Income by Mortgage Status in Northchase
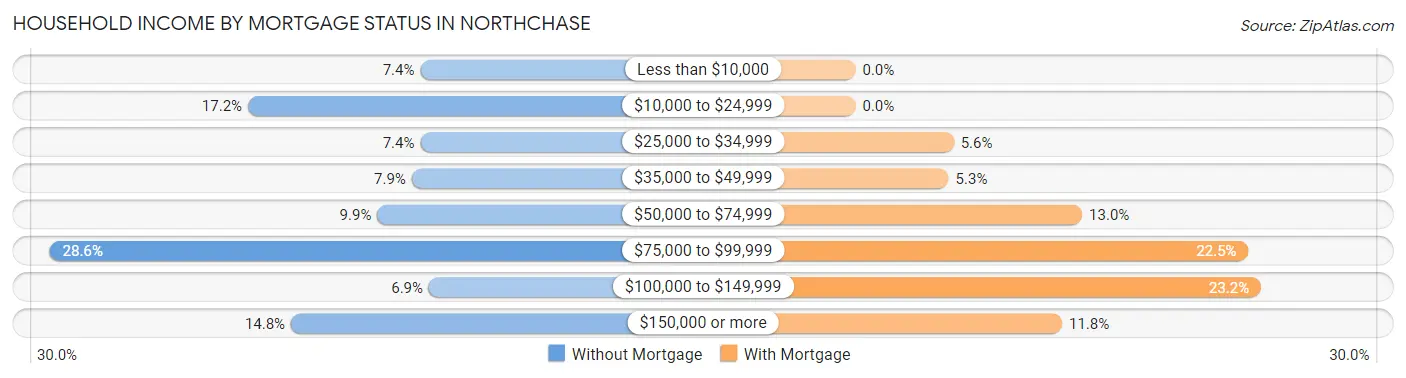
| Household Income | Without Mortgage | With Mortgage |
| Less than $10,000 | 15 (7.4%) | 0 (0.0%) |
| $10,000 to $24,999 | 35 (17.2%) | 0 (0.0%) |
| $25,000 to $34,999 | 15 (7.4%) | 39 (5.6%) |
| $35,000 to $49,999 | 16 (7.9%) | 37 (5.3%) |
| $50,000 to $74,999 | 20 (9.9%) | 90 (13.0%) |
| $75,000 to $99,999 | 58 (28.6%) | 156 (22.5%) |
| $100,000 to $149,999 | 14 (6.9%) | 161 (23.2%) |
| $150,000 or more | 30 (14.8%) | 82 (11.8%) |
| Total | 203 (100.0%) | 695 (100.0%) |
Property Value to Household Income Ratio in Northchase
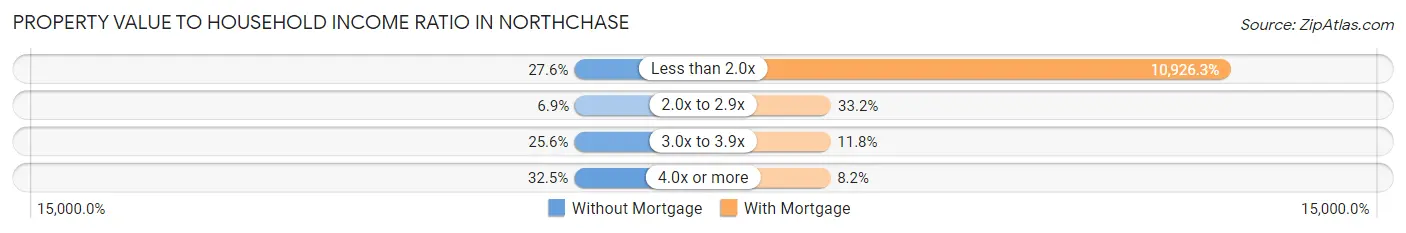
| Value-to-Income Ratio | Without Mortgage | With Mortgage |
| Less than 2.0x | 56 (27.6%) | 75,938 (10,926.3%) |
| 2.0x to 2.9x | 14 (6.9%) | 231 (33.2%) |
| 3.0x to 3.9x | 52 (25.6%) | 82 (11.8%) |
| 4.0x or more | 66 (32.5%) | 57 (8.2%) |
| Total | 203 (100.0%) | 695 (100.0%) |
Real Estate Taxes by Mortgage Status in Northchase
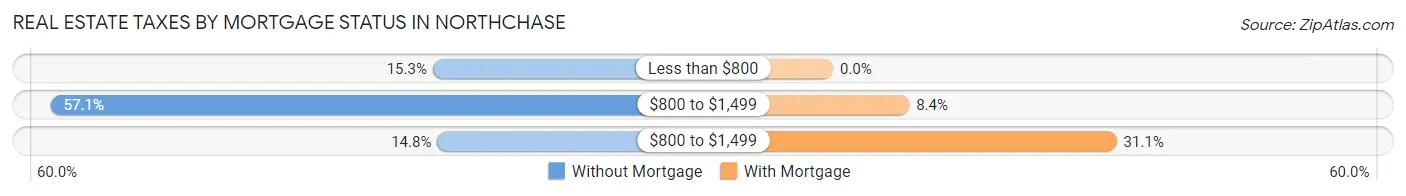
| Property Taxes | Without Mortgage | With Mortgage |
| Less than $800 | 31 (15.3%) | 0 (0.0%) |
| $800 to $1,499 | 116 (57.1%) | 58 (8.4%) |
| $800 to $1,499 | 30 (14.8%) | 216 (31.1%) |
| Total | 203 (100.0%) | 695 (100.0%) |
Health & Disability in Northchase
Health Insurance Coverage by Age in Northchase
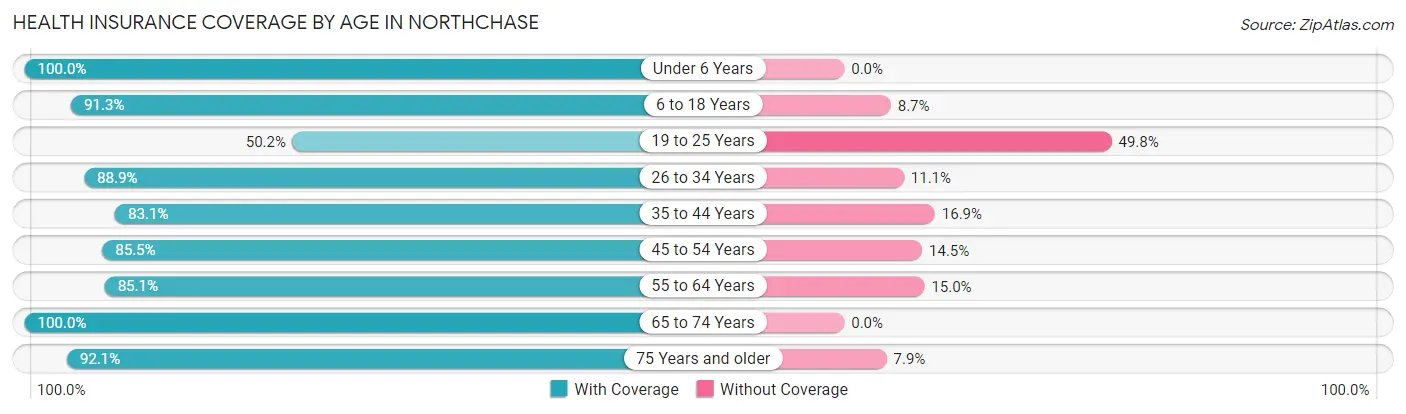
| Age Bracket | With Coverage | Without Coverage |
| Under 6 Years | 257 (100.0%) | 0 (0.0%) |
| 6 to 18 Years | 1,411 (91.3%) | 134 (8.7%) |
| 19 to 25 Years | 443 (50.2%) | 440 (49.8%) |
| 26 to 34 Years | 480 (88.9%) | 60 (11.1%) |
| 35 to 44 Years | 620 (83.1%) | 126 (16.9%) |
| 45 to 54 Years | 324 (85.5%) | 55 (14.5%) |
| 55 to 64 Years | 313 (85.1%) | 55 (14.9%) |
| 65 to 74 Years | 362 (100.0%) | 0 (0.0%) |
| 75 Years and older | 245 (92.1%) | 21 (7.9%) |
| Total | 4,455 (83.3%) | 891 (16.7%) |
Health Insurance Coverage by Citizenship Status in Northchase
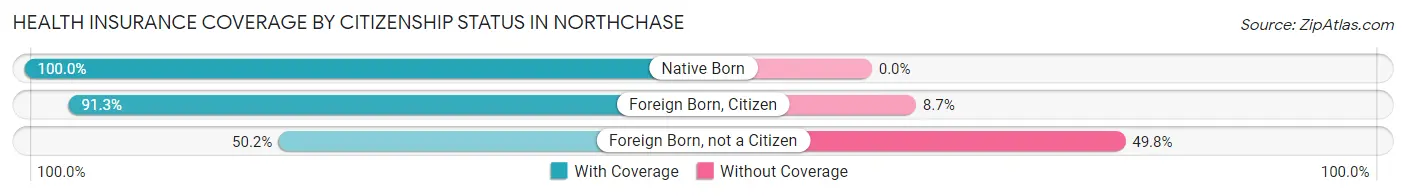
| Citizenship Status | With Coverage | Without Coverage |
| Native Born | 257 (100.0%) | 0 (0.0%) |
| Foreign Born, Citizen | 1,411 (91.3%) | 134 (8.7%) |
| Foreign Born, not a Citizen | 443 (50.2%) | 440 (49.8%) |
Health Insurance Coverage by Household Income in Northchase
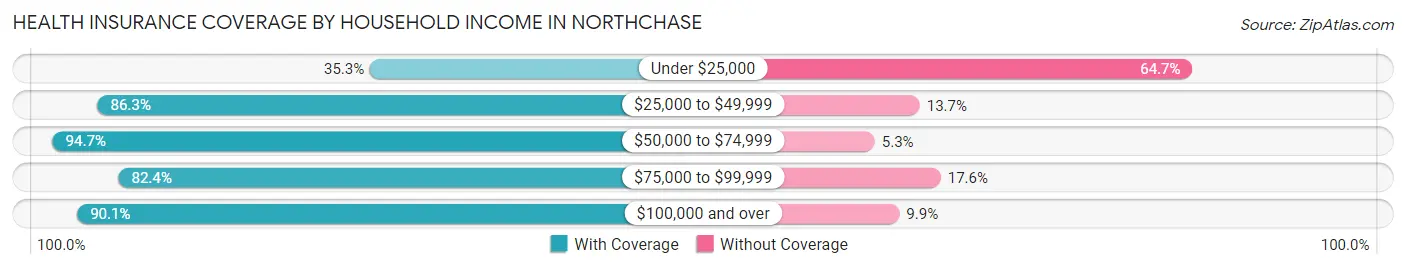
| Household Income | With Coverage | Without Coverage |
| Under $25,000 | 217 (35.3%) | 398 (64.7%) |
| $25,000 to $49,999 | 915 (86.3%) | 145 (13.7%) |
| $50,000 to $74,999 | 1,674 (94.7%) | 93 (5.3%) |
| $75,000 to $99,999 | 716 (82.4%) | 153 (17.6%) |
| $100,000 and over | 933 (90.1%) | 102 (9.9%) |
Public vs Private Health Insurance Coverage by Age in Northchase

| Age Bracket | Public Insurance | Private Insurance |
| Under 6 | 171 (66.5%) | 111 (43.2%) |
| 6 to 18 Years | 451 (29.2%) | 960 (62.1%) |
| 19 to 25 Years | 0 (0.0%) | 443 (50.2%) |
| 25 to 34 Years | 38 (7.0%) | 480 (88.9%) |
| 35 to 44 Years | 34 (4.6%) | 586 (78.5%) |
| 45 to 54 Years | 72 (19.0%) | 252 (66.5%) |
| 55 to 64 Years | 120 (32.6%) | 208 (56.5%) |
| 65 to 74 Years | 352 (97.2%) | 197 (54.4%) |
| 75 Years and over | 245 (92.1%) | 187 (70.3%) |
| Total | 1,483 (27.7%) | 3,424 (64.0%) |
Disability Status by Sex by Age in Northchase
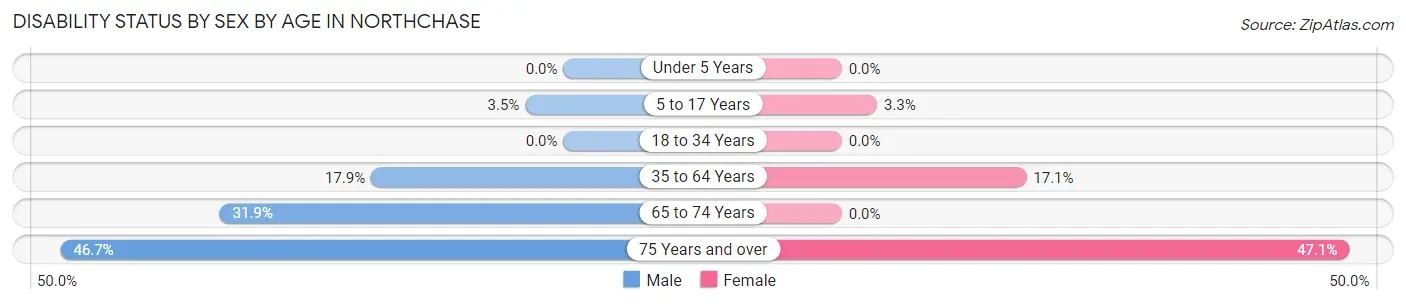
| Age Bracket | Male | Female |
| Under 5 Years | 0 (0.0%) | 0 (0.0%) |
| 5 to 17 Years | 35 (3.5%) | 20 (3.3%) |
| 18 to 34 Years | 0 (0.0%) | 0 (0.0%) |
| 35 to 64 Years | 106 (17.8%) | 154 (17.1%) |
| 65 to 74 Years | 52 (31.9%) | 0 (0.0%) |
| 75 Years and over | 28 (46.7%) | 97 (47.1%) |
Disability Class by Sex by Age in Northchase
Disability Class: Hearing Difficulty
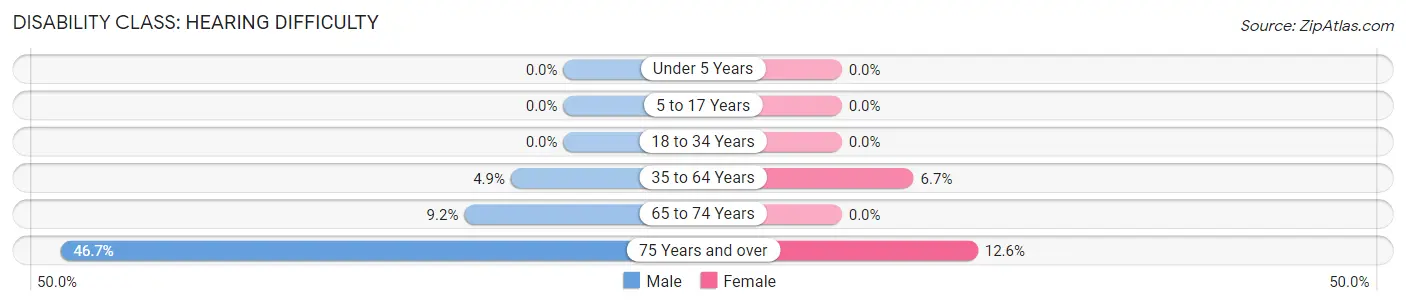
| Age Bracket | Male | Female |
| Under 5 Years | 0 (0.0%) | 0 (0.0%) |
| 5 to 17 Years | 0 (0.0%) | 0 (0.0%) |
| 18 to 34 Years | 0 (0.0%) | 0 (0.0%) |
| 35 to 64 Years | 29 (4.9%) | 60 (6.7%) |
| 65 to 74 Years | 15 (9.2%) | 0 (0.0%) |
| 75 Years and over | 28 (46.7%) | 26 (12.6%) |
Disability Class: Vision Difficulty
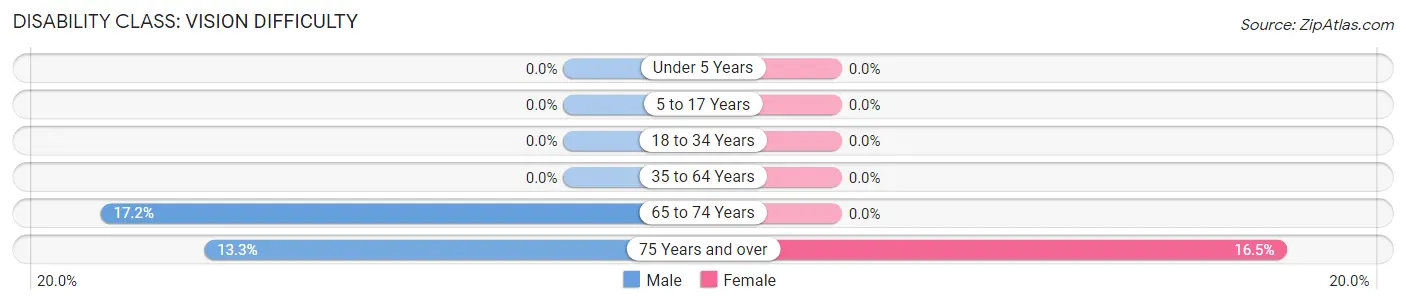
| Age Bracket | Male | Female |
| Under 5 Years | 0 (0.0%) | 0 (0.0%) |
| 5 to 17 Years | 0 (0.0%) | 0 (0.0%) |
| 18 to 34 Years | 0 (0.0%) | 0 (0.0%) |
| 35 to 64 Years | 0 (0.0%) | 0 (0.0%) |
| 65 to 74 Years | 28 (17.2%) | 0 (0.0%) |
| 75 Years and over | 8 (13.3%) | 34 (16.5%) |
Disability Class: Cognitive Difficulty
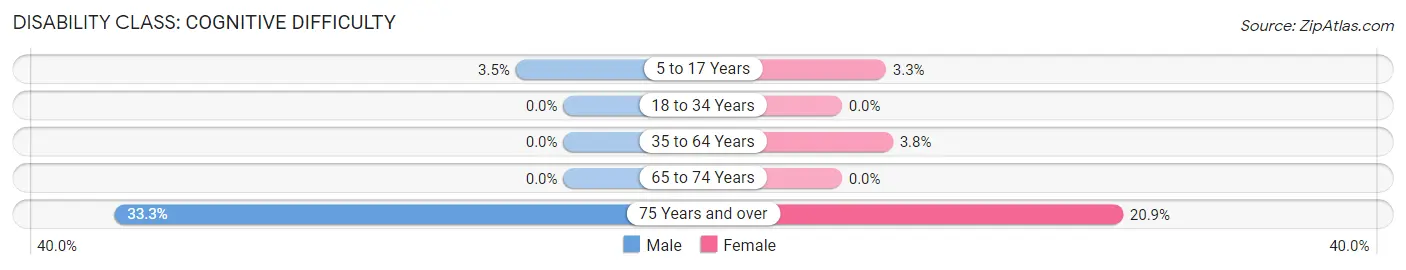
| Age Bracket | Male | Female |
| 5 to 17 Years | 35 (3.5%) | 20 (3.3%) |
| 18 to 34 Years | 0 (0.0%) | 0 (0.0%) |
| 35 to 64 Years | 0 (0.0%) | 34 (3.8%) |
| 65 to 74 Years | 0 (0.0%) | 0 (0.0%) |
| 75 Years and over | 20 (33.3%) | 43 (20.9%) |
Disability Class: Ambulatory Difficulty
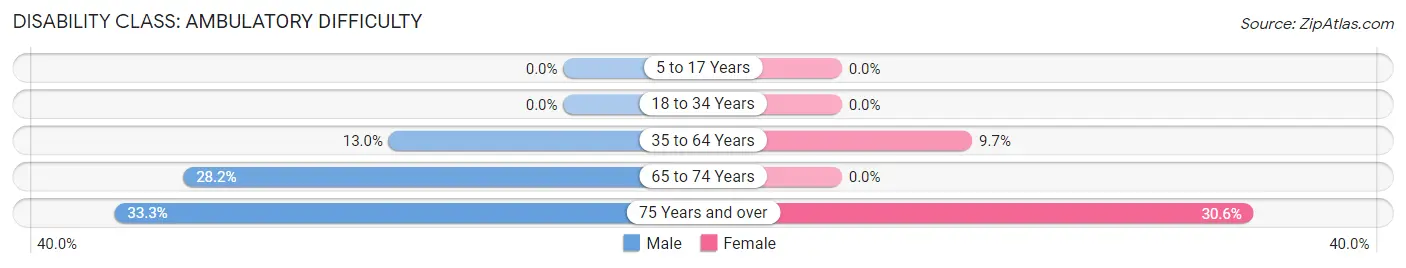
| Age Bracket | Male | Female |
| 5 to 17 Years | 0 (0.0%) | 0 (0.0%) |
| 18 to 34 Years | 0 (0.0%) | 0 (0.0%) |
| 35 to 64 Years | 77 (13.0%) | 87 (9.7%) |
| 65 to 74 Years | 46 (28.2%) | 0 (0.0%) |
| 75 Years and over | 20 (33.3%) | 63 (30.6%) |
Disability Class: Self-Care Difficulty
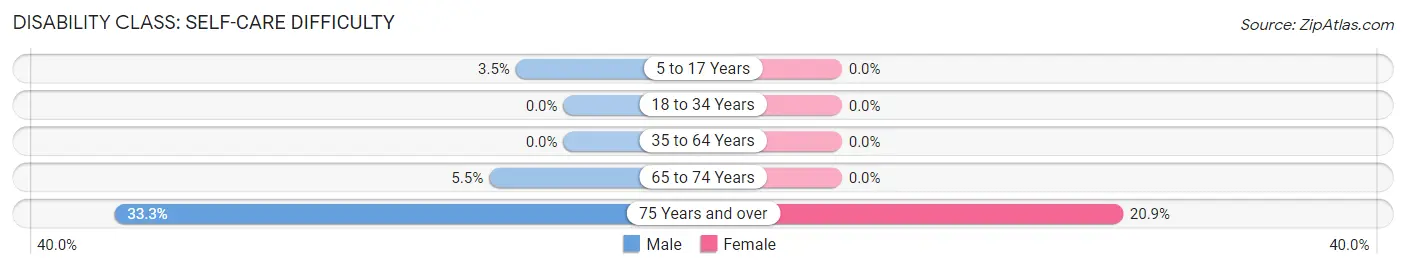
| Age Bracket | Male | Female |
| 5 to 17 Years | 35 (3.5%) | 0 (0.0%) |
| 18 to 34 Years | 0 (0.0%) | 0 (0.0%) |
| 35 to 64 Years | 0 (0.0%) | 0 (0.0%) |
| 65 to 74 Years | 9 (5.5%) | 0 (0.0%) |
| 75 Years and over | 20 (33.3%) | 43 (20.9%) |
Technology Access in Northchase
Computing Device Access in Northchase
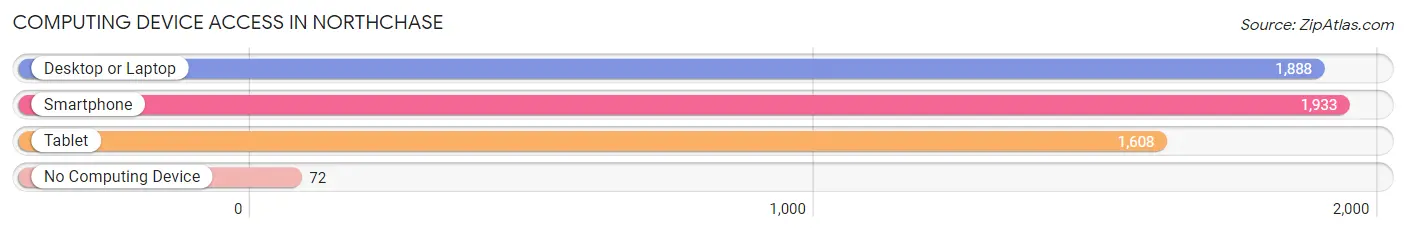
| Device Type | # Households | % Households |
| Desktop or Laptop | 1,888 | 89.5% |
| Smartphone | 1,933 | 91.6% |
| Tablet | 1,608 | 76.2% |
| No Computing Device | 72 | 3.4% |
| Total | 2,109 | 100.0% |
Internet Access in Northchase
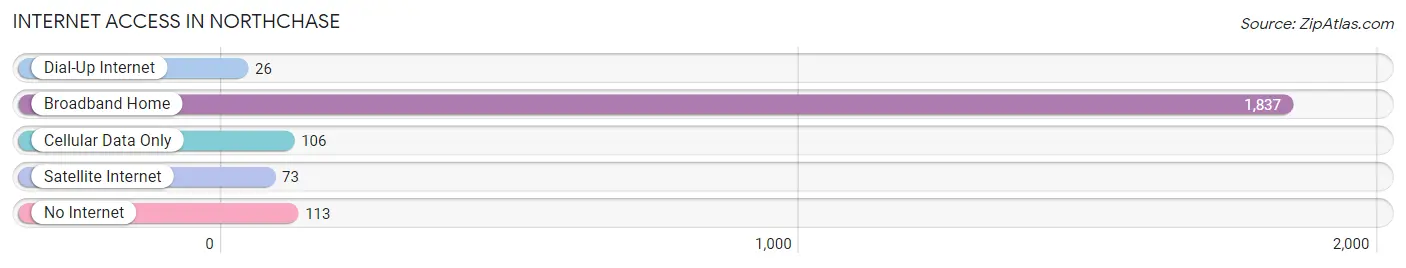
| Internet Type | # Households | % Households |
| Dial-Up Internet | 26 | 1.2% |
| Broadband Home | 1,837 | 87.1% |
| Cellular Data Only | 106 | 5.0% |
| Satellite Internet | 73 | 3.5% |
| No Internet | 113 | 5.4% |
| Total | 2,109 | 100.0% |
Northchase Summary
Northchase is a small unincorporated community located in New Hanover County, North Carolina. It is situated just north of Wilmington, the county seat, and is part of the Wilmington Metropolitan Statistical Area. Northchase is a relatively new community, having been established in the late 1970s.
History
Northchase was established in the late 1970s as a planned community. It was developed by the Northchase Development Corporation, which was founded by local businessman and developer, William B. Jones. The community was designed to be a residential neighborhood with a mix of single-family homes, townhomes, and condominiums. The development was planned to include a variety of amenities, such as a golf course, tennis courts, and a swimming pool.
The community was named after the nearby Northchase Plantation, which was established in the early 1800s. The plantation was owned by the Jones family for several generations and was eventually sold to the Northchase Development Corporation in the late 1970s.
Geography
Northchase is located in New Hanover County, North Carolina. It is situated just north of Wilmington, the county seat, and is part of the Wilmington Metropolitan Statistical Area. The community is bordered by the Cape Fear River to the east and the Intracoastal Waterway to the west.
The community is located in a predominantly flat area, with the highest elevation being just over 30 feet above sea level. The climate in Northchase is classified as humid subtropical, with hot, humid summers and mild winters.
Economy
Northchase is primarily a residential community, with most of its residents employed in the nearby city of Wilmington. The community does not have any major employers, but there are several small businesses located in the area. These include a grocery store, a gas station, and a few restaurants.
The median household income in Northchase is slightly higher than the national average, at $60,000. The unemployment rate is also lower than the national average, at 4.2%.
Demographics
As of the 2010 census, the population of Northchase was 4,845. The racial makeup of the community was 87.3% White, 8.2% African American, 0.7% Asian, and 3.8% from other races. The median age of the population was 42.7 years.
The median household income in Northchase was $60,000, which is slightly higher than the national average. The per capita income was $27,000, which is also higher than the national average. The poverty rate in Northchase was 8.2%, which is lower than the national average.
Conclusion
Northchase is a small unincorporated community located in New Hanover County, North Carolina. It was established in the late 1970s as a planned community and is primarily a residential area. The community is bordered by the Cape Fear River to the east and the Intracoastal Waterway to the west. The population of Northchase is 4,845, with a median household income of $60,000 and a poverty rate of 8.2%. The majority of the population is employed in the nearby city of Wilmington, with a few small businesses located in the area.
Common Questions
What is Per Capita Income in Northchase?
Per Capita income in Northchase is $21,827.
What is the Median Family Income in Northchase?
Median Family Income in Northchase is $65,436.
What is the Median Household income in Northchase?
Median Household Income in Northchase is $52,122.
What is Income or Wage Gap in Northchase?
Income or Wage Gap in Northchase is 34.6%.
Women in Northchase earn 65.4 cents for every dollar earned by a man.
What is Inequality or Gini Index in Northchase?
Inequality or Gini Index in Northchase is 0.47.
What is the Total Population of Northchase?
Total Population of Northchase is 5,543.
What is the Total Male Population of Northchase?
Total Male Population of Northchase is 2,828.
What is the Total Female Population of Northchase?
Total Female Population of Northchase is 2,715.
What is the Ratio of Males per 100 Females in Northchase?
There are 104.16 Males per 100 Females in Northchase.
What is the Ratio of Females per 100 Males in Northchase?
There are 96.00 Females per 100 Males in Northchase.
What is the Median Population Age in Northchase?
Median Population Age in Northchase is 27.3 Years.
What is the Average Family Size in Northchase
Average Family Size in Northchase is 3.6 People.
What is the Average Household Size in Northchase
Average Household Size in Northchase is 2.6 People.
How Large is the Labor Force in Northchase?
There are 2,807 People in the Labor Forcein in Northchase.
What is the Percentage of People in the Labor Force in Northchase?
72.0% of People are in the Labor Force in Northchase.
What is the Unemployment Rate in Northchase?
Unemployment Rate in Northchase is 18.5%.