University City, MO Map & Demographics
University City Map
University City Overview
$63,756
PER CAPITA INCOME
$116,663
AVG FAMILY INCOME
$71,888
AVG HOUSEHOLD INCOME
34.9%
WAGE / INCOME GAP [ % ]
65.1¢/ $1
WAGE / INCOME GAP [ $ ]
0.57
INEQUALITY / GINI INDEX
34,850
TOTAL POPULATION
15,501
MALE POPULATION
19,349
FEMALE POPULATION
80.11
MALES / 100 FEMALES
124.82
FEMALES / 100 MALES
38.4
MEDIAN AGE
2.8
AVG FAMILY SIZE
2.0
AVG HOUSEHOLD SIZE
19,459
LABOR FORCE [ PEOPLE ]
65.5%
PERCENT IN LABOR FORCE
2.0%
UNEMPLOYMENT RATE
University City Area Codes
Income in University City
Income Overview in University City
Per Capita Income in University City is $63,756, while median incomes of families and households are $116,663 and $71,888 respectively.
| Characteristic | Number | Measure |
| Per Capita Income | 34,850 | $63,756 |
| Median Family Income | 8,153 | $116,663 |
| Mean Family Income | 8,153 | $187,024 |
| Median Household Income | 16,796 | $71,888 |
| Mean Household Income | 16,796 | $132,672 |
| Income Deficit | 8,153 | $0 |
| Wage / Income Gap (%) | 34,850 | 34.94% |
| Wage / Income Gap ($) | 34,850 | 65.06¢ per $1 |
| Gini / Inequality Index | 34,850 | 0.57 |
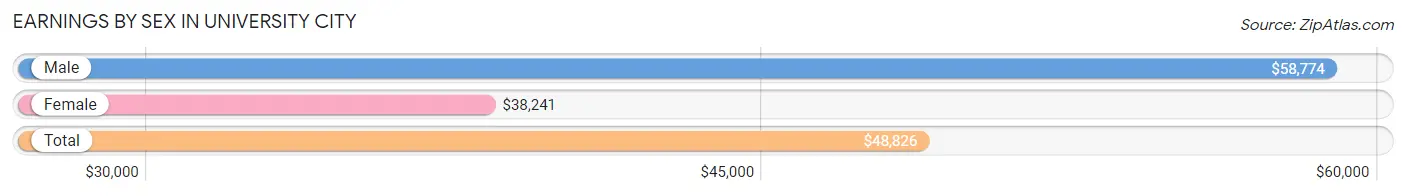
Earnings by Sex in University City
Average Earnings in University City are $48,826, $58,774 for men and $38,241 for women, a difference of 34.9%.
| Sex | Number | Average Earnings |
| Male | 10,028 (47.5%) | $58,774 |
| Female | 11,074 (52.5%) | $38,241 |
| Total | 21,102 (100.0%) | $48,826 |
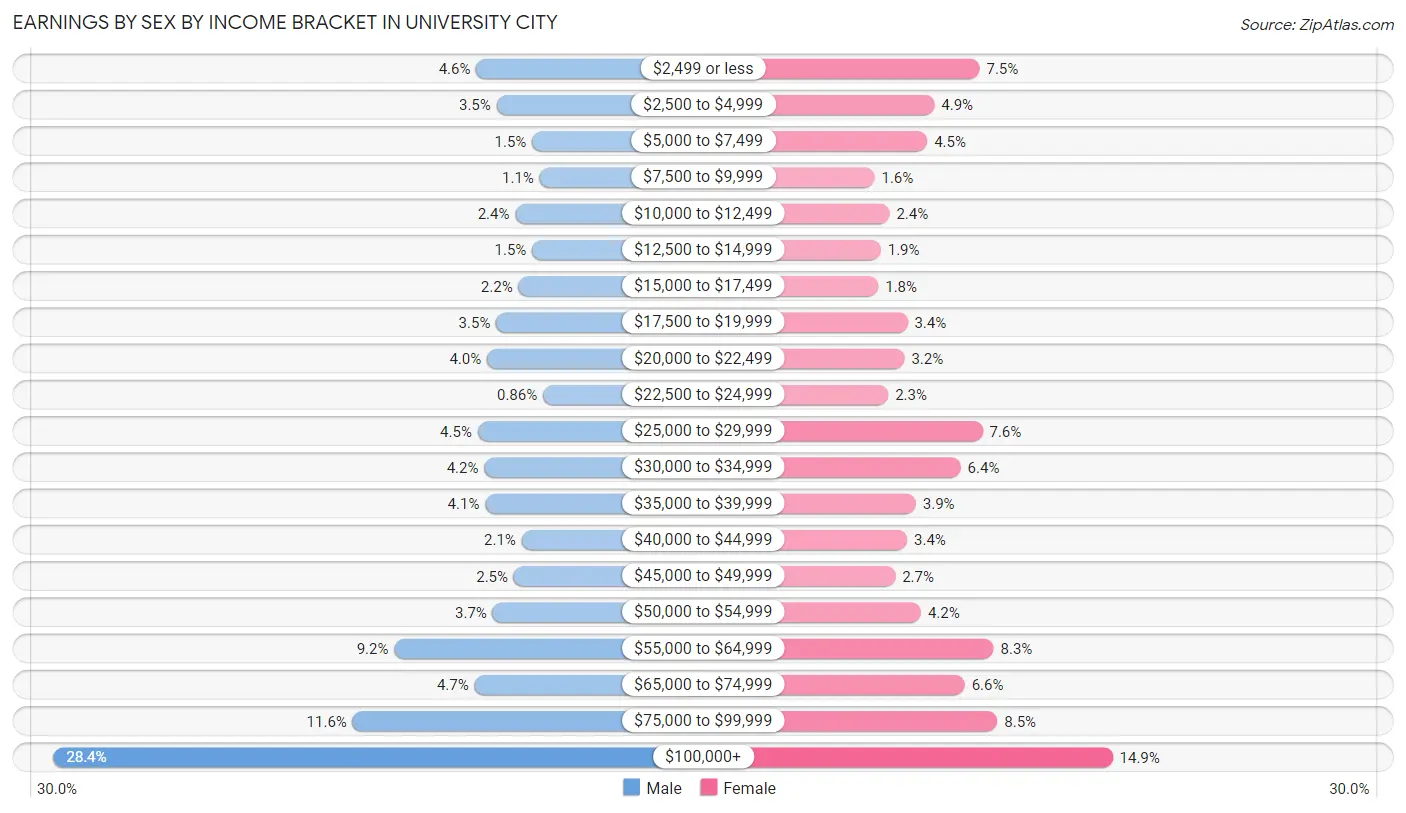
Earnings by Sex by Income Bracket in University City
The most common earnings brackets in University City are $100,000+ for men (2,846 | 28.4%) and $100,000+ for women (1,655 | 14.9%).
| Income | Male | Female |
| $2,499 or less | 462 (4.6%) | 826 (7.5%) |
| $2,500 to $4,999 | 348 (3.5%) | 545 (4.9%) |
| $5,000 to $7,499 | 147 (1.5%) | 500 (4.5%) |
| $7,500 to $9,999 | 105 (1.1%) | 173 (1.6%) |
| $10,000 to $12,499 | 243 (2.4%) | 266 (2.4%) |
| $12,500 to $14,999 | 147 (1.5%) | 211 (1.9%) |
| $15,000 to $17,499 | 225 (2.2%) | 196 (1.8%) |
| $17,500 to $19,999 | 350 (3.5%) | 378 (3.4%) |
| $20,000 to $22,499 | 402 (4.0%) | 359 (3.2%) |
| $22,500 to $24,999 | 86 (0.9%) | 258 (2.3%) |
| $25,000 to $29,999 | 454 (4.5%) | 845 (7.6%) |
| $30,000 to $34,999 | 417 (4.2%) | 709 (6.4%) |
| $35,000 to $39,999 | 412 (4.1%) | 430 (3.9%) |
| $40,000 to $44,999 | 207 (2.1%) | 375 (3.4%) |
| $45,000 to $49,999 | 251 (2.5%) | 301 (2.7%) |
| $50,000 to $54,999 | 370 (3.7%) | 462 (4.2%) |
| $55,000 to $64,999 | 925 (9.2%) | 914 (8.3%) |
| $65,000 to $74,999 | 472 (4.7%) | 734 (6.6%) |
| $75,000 to $99,999 | 1,159 (11.6%) | 937 (8.5%) |
| $100,000+ | 2,846 (28.4%) | 1,655 (14.9%) |
| Total | 10,028 (100.0%) | 11,074 (100.0%) |
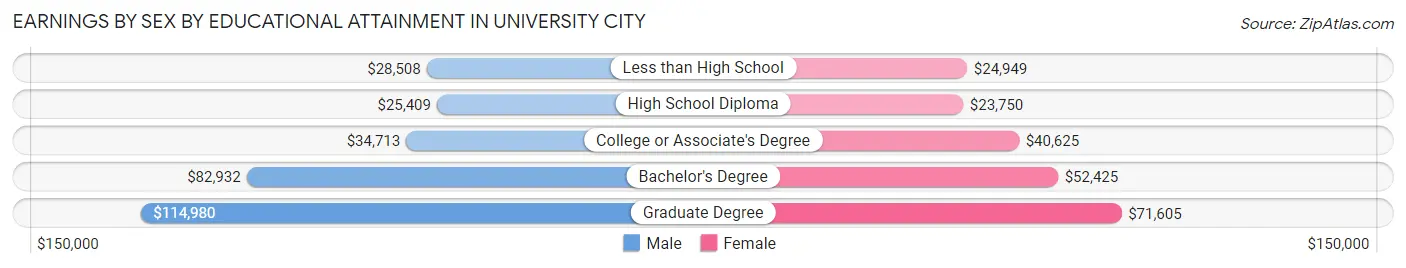
Earnings by Sex by Educational Attainment in University City
Average earnings in University City are $67,513 for men and $51,922 for women, a difference of 23.1%. Men with an educational attainment of graduate degree enjoy the highest average annual earnings of $114,980, while those with high school diploma education earn the least with $25,409. Women with an educational attainment of graduate degree earn the most with the average annual earnings of $71,605, while those with high school diploma education have the smallest earnings of $23,750.
| Educational Attainment | Male Income | Female Income |
| Less than High School | $28,508 | $24,949 |
| High School Diploma | $25,409 | $23,750 |
| College or Associate's Degree | $34,713 | $40,625 |
| Bachelor's Degree | $82,932 | $52,425 |
| Graduate Degree | $114,980 | $71,605 |
| Total | $67,513 | $51,922 |
Family Income in University City
Family Income Brackets in University City
According to the University City family income data, there are 2,112 families falling into the $200,000+ income range, which is the most common income bracket and makes up 25.9% of all families. Conversely, the $10,000 to $14,999 income bracket is the least frequent group with only 57 families (0.7%) belonging to this category.
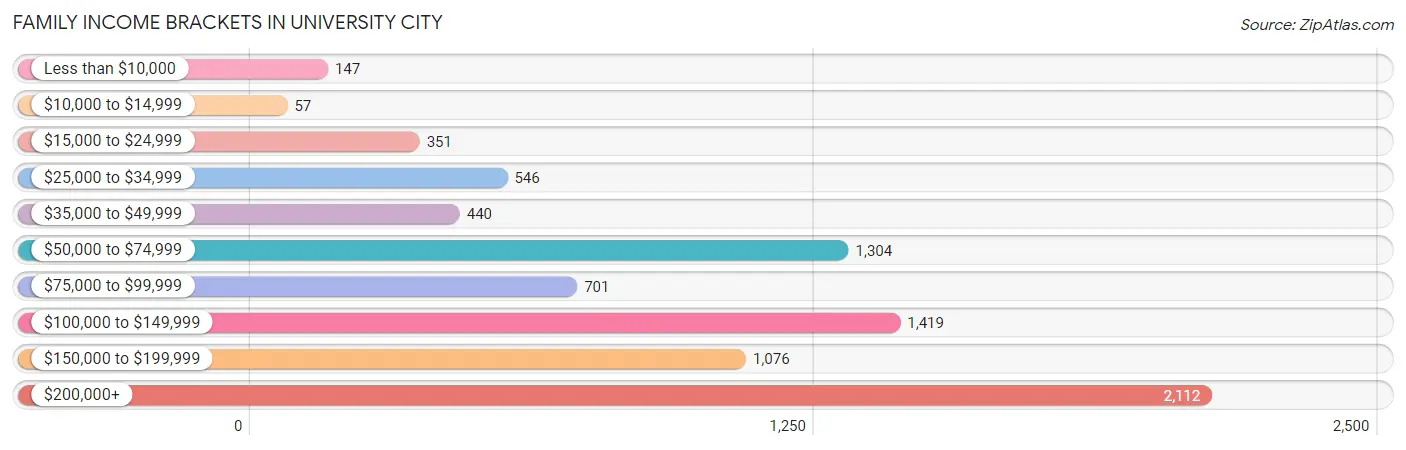
| Income Bracket | # Families | % Families |
| Less than $10,000 | 147 | 1.8% |
| $10,000 to $14,999 | 57 | 0.7% |
| $15,000 to $24,999 | 351 | 4.3% |
| $25,000 to $34,999 | 546 | 6.7% |
| $35,000 to $49,999 | 440 | 5.4% |
| $50,000 to $74,999 | 1,304 | 16.0% |
| $75,000 to $99,999 | 701 | 8.6% |
| $100,000 to $149,999 | 1,419 | 17.4% |
| $150,000 to $199,999 | 1,076 | 13.2% |
| $200,000+ | 2,112 | 25.9% |
Family Income by Famaliy Size in University City
4-person families (1,205 | 14.8%) account for the highest median family income in University City with $214,828 per family, while 2-person families (4,586 | 56.2%) have the highest median income of $60,558 per family member.
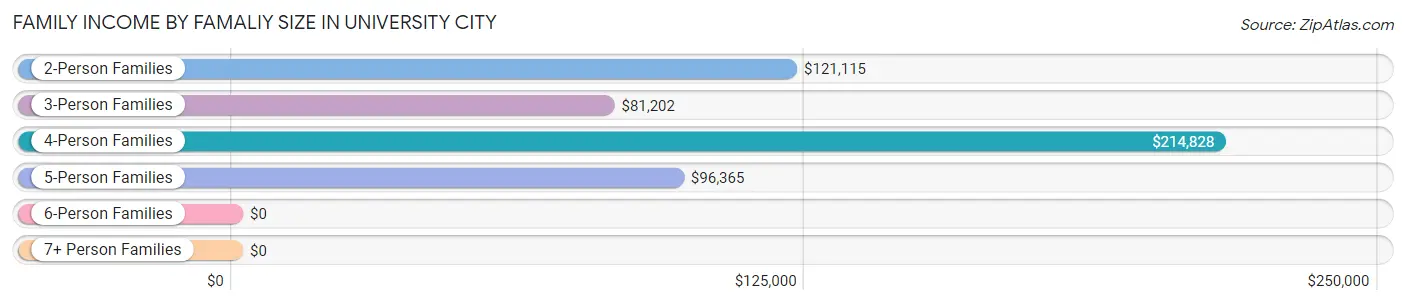
| Income Bracket | # Families | Median Income |
| 2-Person Families | 4,586 (56.2%) | $121,115 |
| 3-Person Families | 1,901 (23.3%) | $81,202 |
| 4-Person Families | 1,205 (14.8%) | $214,828 |
| 5-Person Families | 415 (5.1%) | $96,365 |
| 6-Person Families | 19 (0.2%) | $0 |
| 7+ Person Families | 27 (0.3%) | $0 |
| Total | 8,153 (100.0%) | $116,663 |
Family Income by Number of Earners in University City
The median family income in University City is $116,663, with families comprising 3+ earners (523) having the highest median family income of $243,036, while families with no earners (941) have the lowest median family income of $41,730, accounting for 6.4% and 11.5% of families, respectively.
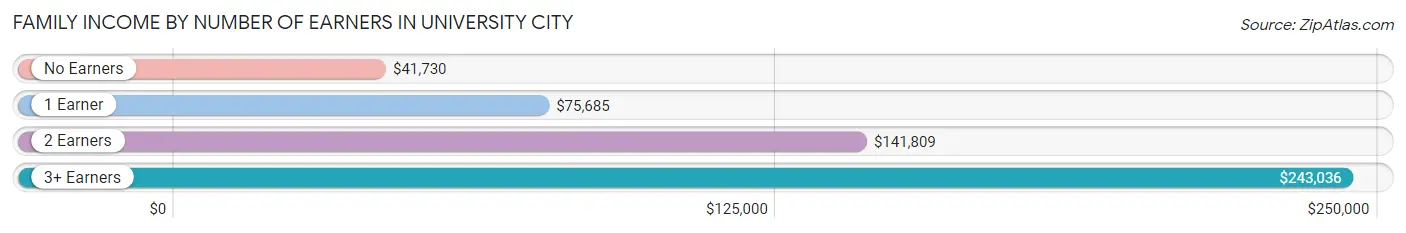
| Number of Earners | # Families | Median Income |
| No Earners | 941 (11.5%) | $41,730 |
| 1 Earner | 2,572 (31.6%) | $75,685 |
| 2 Earners | 4,117 (50.5%) | $141,809 |
| 3+ Earners | 523 (6.4%) | $243,036 |
| Total | 8,153 (100.0%) | $116,663 |
Household Income in University City
Household Income Brackets in University City
With 3,494 households falling in the category, the $50,000 to $74,999 income range is the most frequent in University City, accounting for 20.8% of all households. In contrast, only 605 households (3.6%) fall into the $10,000 to $14,999 income bracket, making it the least populous group.
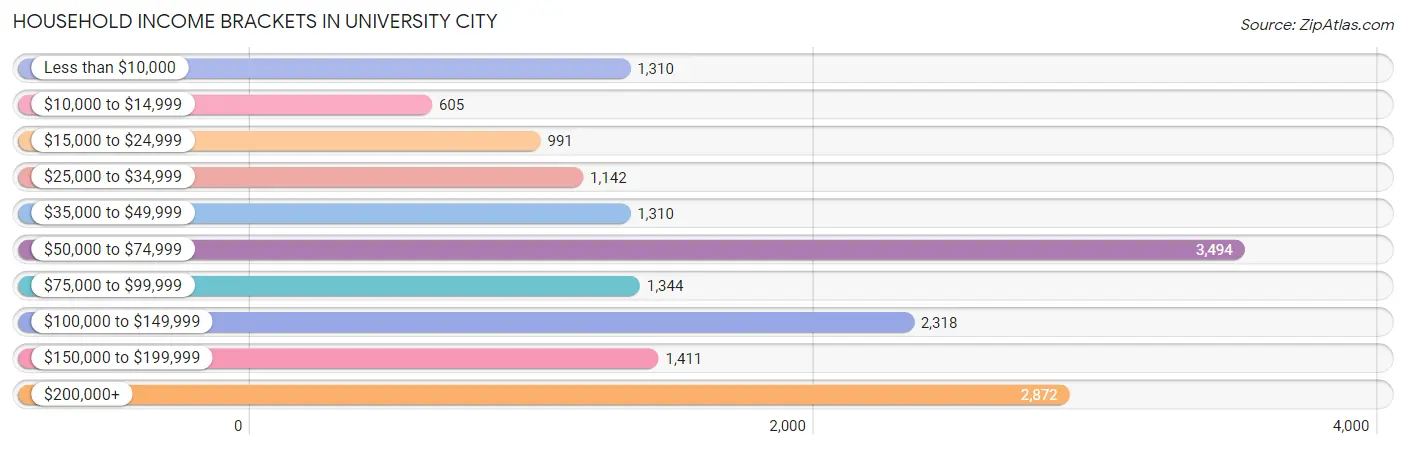
| Income Bracket | # Households | % Households |
| Less than $10,000 | 1,310 | 7.8% |
| $10,000 to $14,999 | 605 | 3.6% |
| $15,000 to $24,999 | 991 | 5.9% |
| $25,000 to $34,999 | 1,142 | 6.8% |
| $35,000 to $49,999 | 1,310 | 7.8% |
| $50,000 to $74,999 | 3,494 | 20.8% |
| $75,000 to $99,999 | 1,344 | 8.0% |
| $100,000 to $149,999 | 2,318 | 13.8% |
| $150,000 to $199,999 | 1,411 | 8.4% |
| $200,000+ | 2,872 | 17.1% |
Household Income by Householder Age in University City
The median household income in University City is $71,888, with the highest median household income of $111,708 found in the 45 to 64 years age bracket for the primary householder. A total of 5,018 households (29.9%) fall into this category. Meanwhile, the 15 to 24 years age bracket for the primary householder has the lowest median household income of $21,308, with 1,671 households (10.0%) in this group.
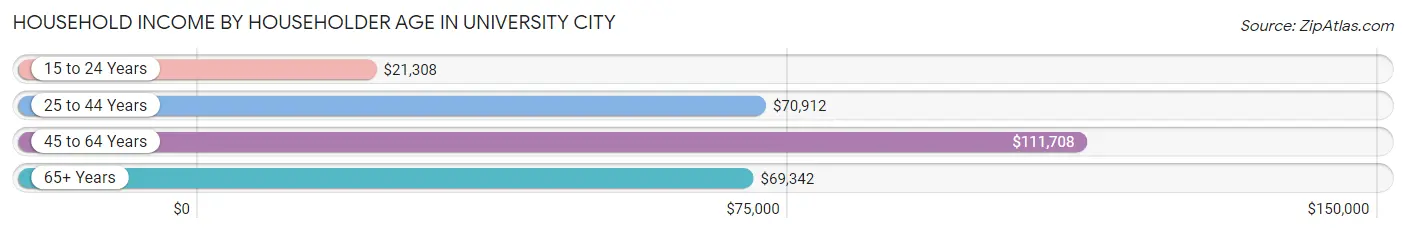
| Income Bracket | # Households | Median Income |
| 15 to 24 Years | 1,671 (10.0%) | $21,308 |
| 25 to 44 Years | 5,799 (34.5%) | $70,912 |
| 45 to 64 Years | 5,018 (29.9%) | $111,708 |
| 65+ Years | 4,308 (25.7%) | $69,342 |
| Total | 16,796 (100.0%) | $71,888 |
Poverty in University City
Income Below Poverty by Sex and Age in University City
With 9.8% poverty level for males and 16.2% for females among the residents of University City, 18 to 24 year old males and 18 to 24 year old females are the most vulnerable to poverty, with 427 males (34.4%) and 1,243 females (46.9%) in their respective age groups living below the poverty level.
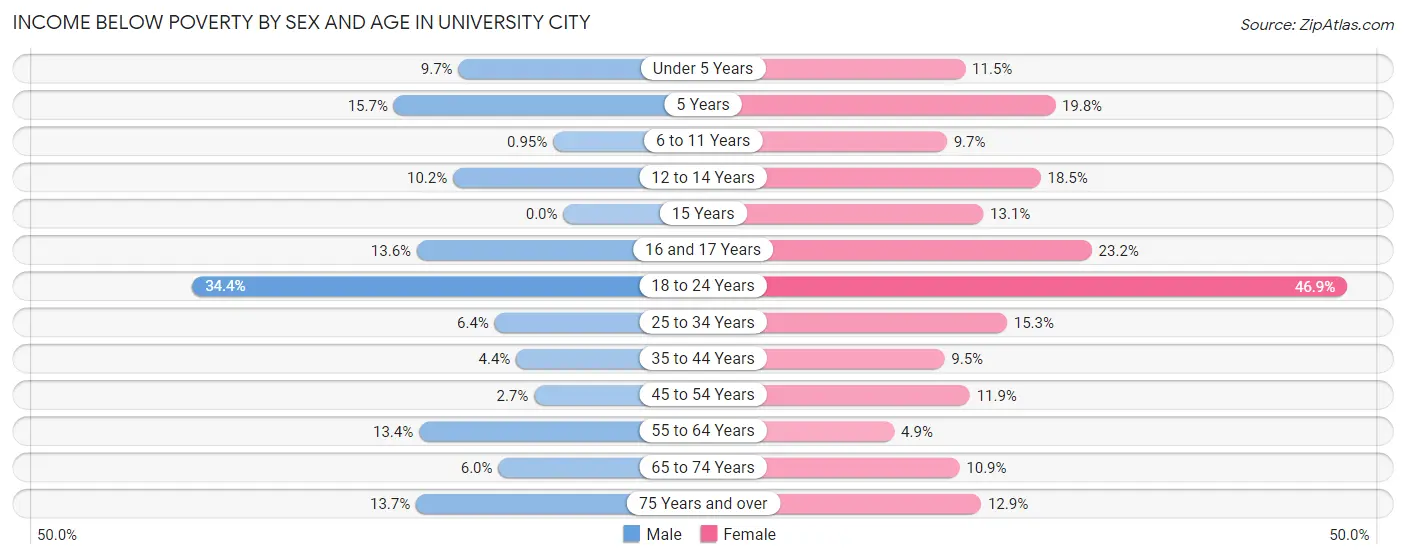
| Age Bracket | Male | Female |
| Under 5 Years | 101 (9.7%) | 112 (11.5%) |
| 5 Years | 37 (15.7%) | 18 (19.8%) |
| 6 to 11 Years | 5 (0.9%) | 99 (9.7%) |
| 12 to 14 Years | 39 (10.2%) | 43 (18.4%) |
| 15 Years | 0 (0.0%) | 42 (13.1%) |
| 16 and 17 Years | 39 (13.6%) | 112 (23.2%) |
| 18 to 24 Years | 427 (34.4%) | 1,243 (46.9%) |
| 25 to 34 Years | 187 (6.4%) | 451 (15.3%) |
| 35 to 44 Years | 79 (4.4%) | 217 (9.5%) |
| 45 to 54 Years | 46 (2.7%) | 164 (11.9%) |
| 55 to 64 Years | 267 (13.4%) | 146 (4.9%) |
| 65 to 74 Years | 99 (6.0%) | 218 (10.9%) |
| 75 Years and over | 143 (13.7%) | 207 (12.9%) |
| Total | 1,469 (9.8%) | 3,072 (16.2%) |
Income Above Poverty by Sex and Age in University City
According to the poverty statistics in University City, males aged 15 years and females aged 55 to 64 years are the age groups that are most secure financially, with 100.0% of males and 95.1% of females in these age groups living above the poverty line.
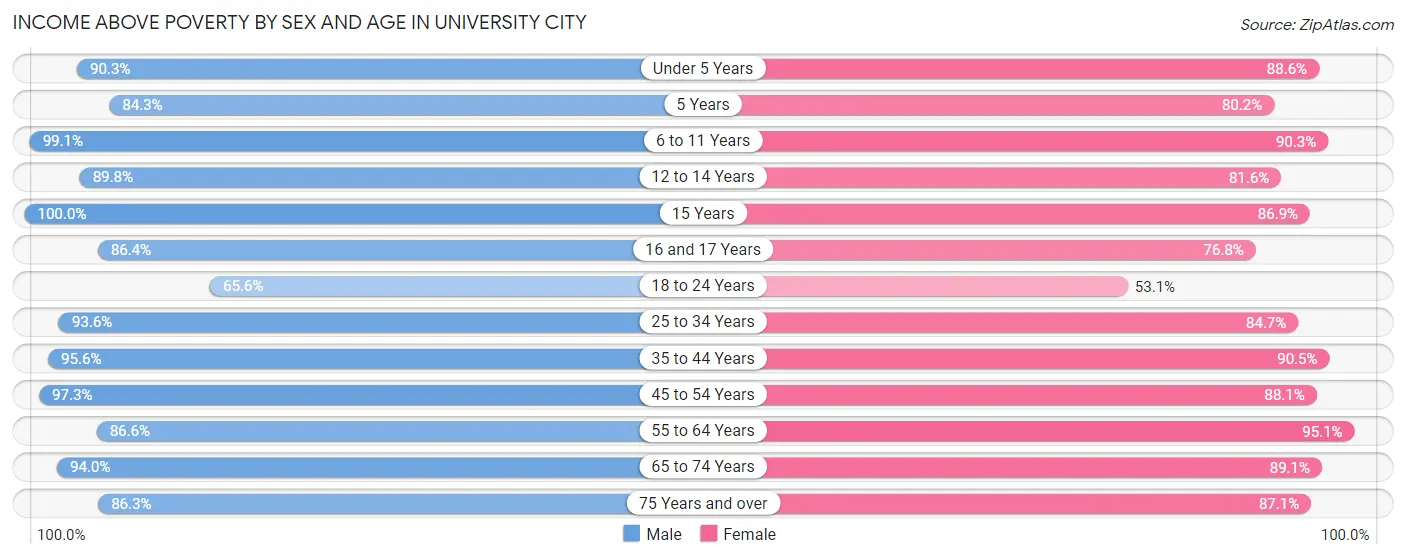
| Age Bracket | Male | Female |
| Under 5 Years | 936 (90.3%) | 866 (88.5%) |
| 5 Years | 198 (84.3%) | 73 (80.2%) |
| 6 to 11 Years | 523 (99.1%) | 917 (90.3%) |
| 12 to 14 Years | 342 (89.8%) | 190 (81.6%) |
| 15 Years | 127 (100.0%) | 278 (86.9%) |
| 16 and 17 Years | 248 (86.4%) | 371 (76.8%) |
| 18 to 24 Years | 813 (65.6%) | 1,408 (53.1%) |
| 25 to 34 Years | 2,749 (93.6%) | 2,494 (84.7%) |
| 35 to 44 Years | 1,724 (95.6%) | 2,063 (90.5%) |
| 45 to 54 Years | 1,654 (97.3%) | 1,218 (88.1%) |
| 55 to 64 Years | 1,727 (86.6%) | 2,860 (95.1%) |
| 65 to 74 Years | 1,543 (94.0%) | 1,781 (89.1%) |
| 75 Years and over | 903 (86.3%) | 1,395 (87.1%) |
| Total | 13,487 (90.2%) | 15,914 (83.8%) |
Income Below Poverty Among Married-Couple Families in University City
The poverty statistics for married-couple families in University City show that 3.5% or 215 of the total 6,183 families live below the poverty line. Families with 3 or 4 children have the highest poverty rate of 11.8%, comprising of 41 families. On the other hand, families with 5 or more children have the lowest poverty rate of 0.0%, which includes 0 families.
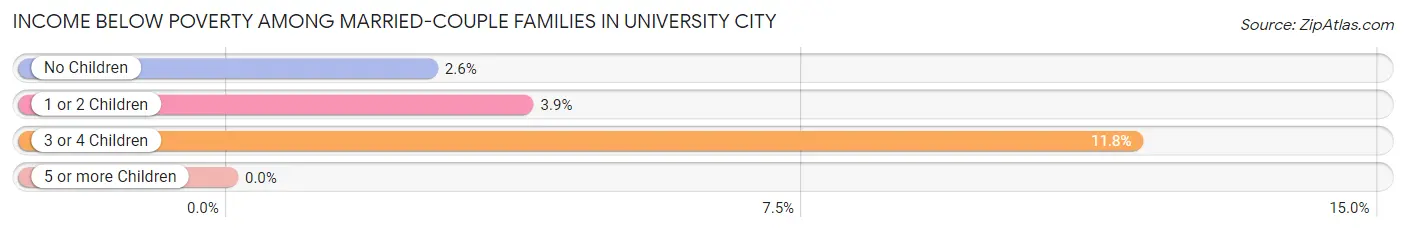
| Children | Above Poverty | Below Poverty |
| No Children | 3,916 (97.4%) | 105 (2.6%) |
| 1 or 2 Children | 1,719 (96.1%) | 69 (3.9%) |
| 3 or 4 Children | 306 (88.2%) | 41 (11.8%) |
| 5 or more Children | 27 (100.0%) | 0 (0.0%) |
| Total | 5,968 (96.5%) | 215 (3.5%) |
Income Below Poverty Among Single-Parent Households in University City
According to the poverty data in University City, 19.2% or 94 single-father households and 11.2% or 166 single-mother households are living below the poverty line. Among single-father households, those with 1 or 2 children have the highest poverty rate, with 94 households (38.4%) experiencing poverty. Likewise, among single-mother households, those with 3 or 4 children have the highest poverty rate, with 21 households (21.9%) falling below the poverty line.
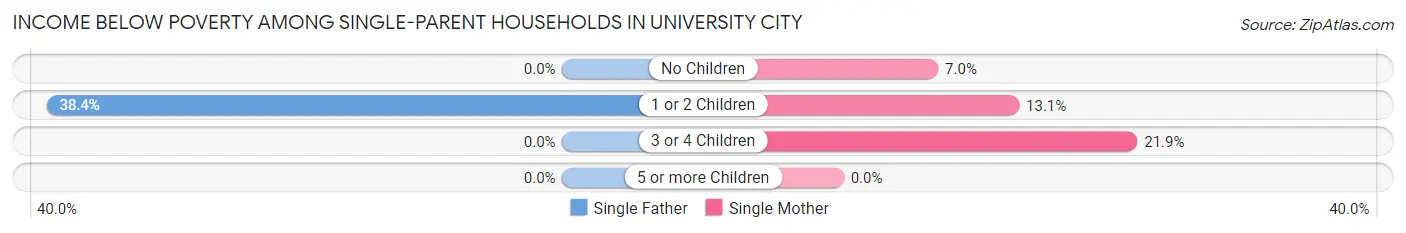
| Children | Single Father | Single Mother |
| No Children | 0 (0.0%) | 42 (7.0%) |
| 1 or 2 Children | 94 (38.4%) | 103 (13.1%) |
| 3 or 4 Children | 0 (0.0%) | 21 (21.9%) |
| 5 or more Children | 0 (0.0%) | 0 (0.0%) |
| Total | 94 (19.2%) | 166 (11.2%) |
Income Below Poverty Among Married-Couple vs Single-Parent Households in University City
The poverty data for University City shows that 215 of the married-couple family households (3.5%) and 260 of the single-parent households (13.2%) are living below the poverty level. Within the married-couple family households, those with 3 or 4 children have the highest poverty rate, with 41 households (11.8%) falling below the poverty line. Among the single-parent households, those with 3 or 4 children have the highest poverty rate, with 21 household (21.9%) living below poverty.
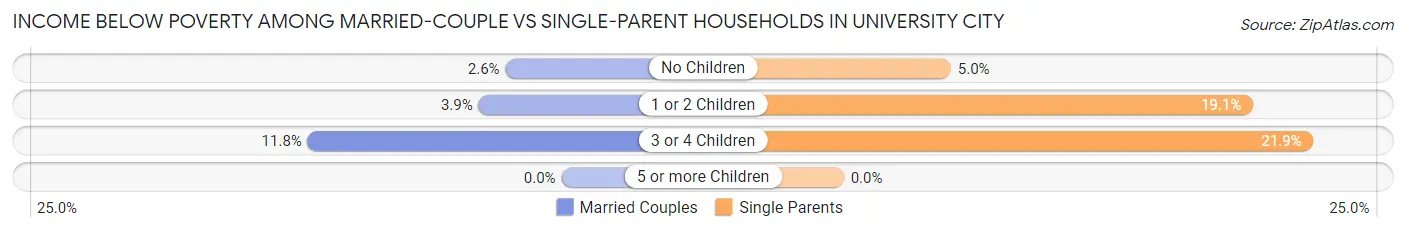
| Children | Married-Couple Families | Single-Parent Households |
| No Children | 105 (2.6%) | 42 (5.0%) |
| 1 or 2 Children | 69 (3.9%) | 197 (19.1%) |
| 3 or 4 Children | 41 (11.8%) | 21 (21.9%) |
| 5 or more Children | 0 (0.0%) | 0 (0.0%) |
| Total | 215 (3.5%) | 260 (13.2%) |
Race in University City
The most populous races in University City are White / Caucasian (19,394 | 55.6%), Black / African American (11,137 | 32.0%), and Asian (2,361 | 6.8%).
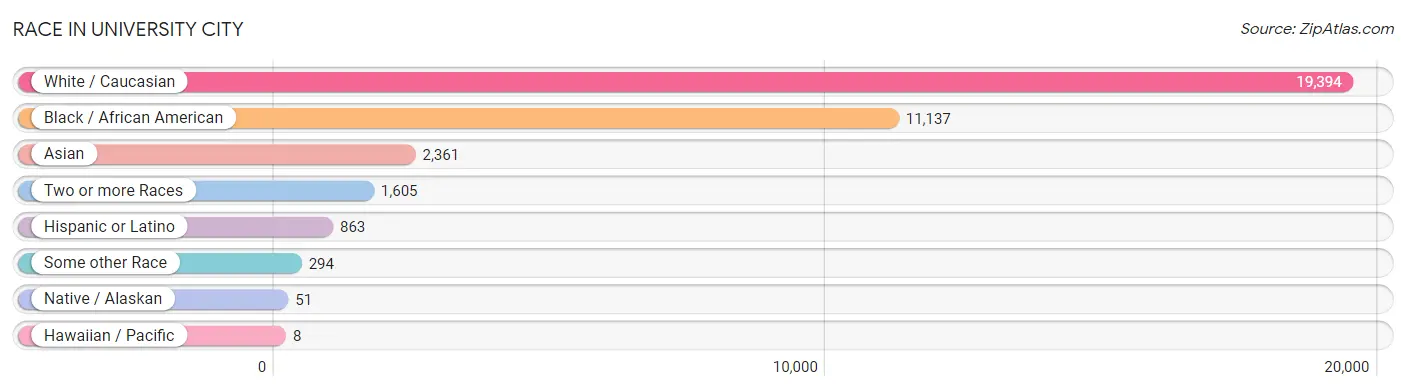
| Race | # Population | % Population |
| Asian | 2,361 | 6.8% |
| Black / African American | 11,137 | 32.0% |
| Hawaiian / Pacific | 8 | 0.0% |
| Hispanic or Latino | 863 | 2.5% |
| Native / Alaskan | 51 | 0.2% |
| White / Caucasian | 19,394 | 55.6% |
| Two or more Races | 1,605 | 4.6% |
| Some other Race | 294 | 0.8% |
| Total | 34,850 | 100.0% |
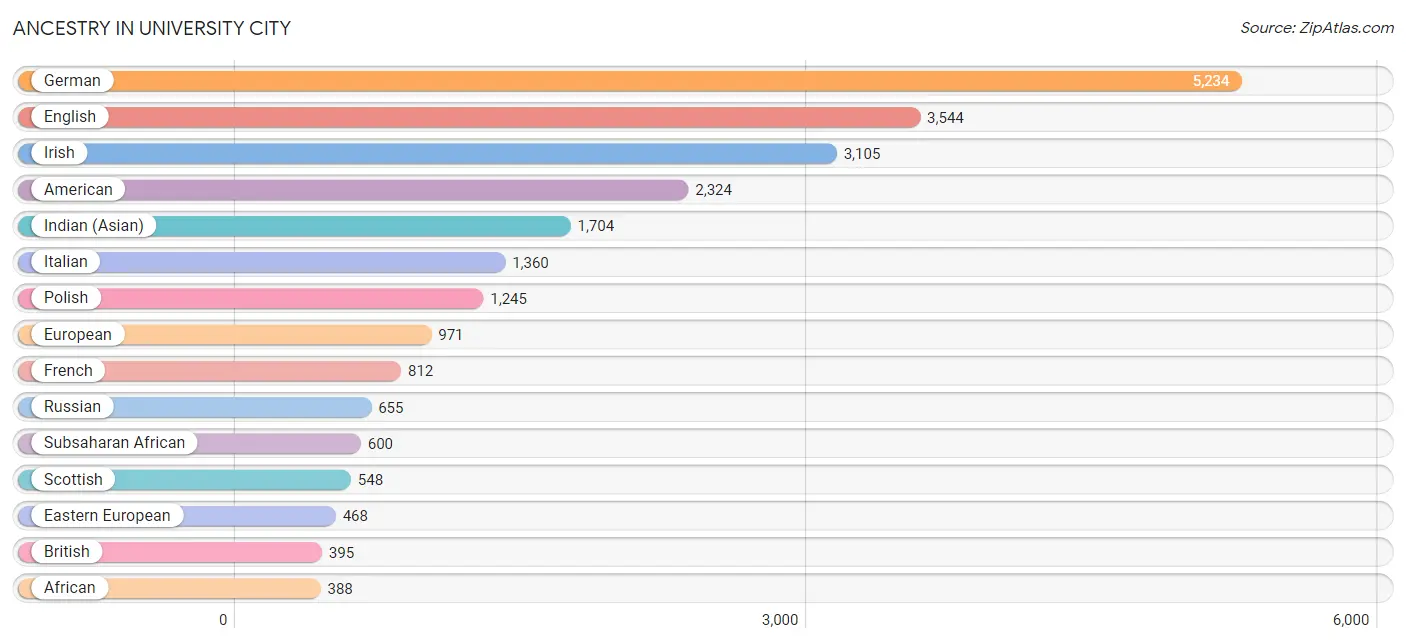
Ancestry in University City
The most populous ancestries reported in University City are German (5,234 | 15.0%), English (3,544 | 10.2%), Irish (3,105 | 8.9%), American (2,324 | 6.7%), and Indian (Asian) (1,704 | 4.9%), together accounting for 45.7% of all University City residents.
| Ancestry | # Population | % Population |
| African | 388 | 1.1% |
| Albanian | 13 | 0.0% |
| Alsatian | 18 | 0.1% |
| American | 2,324 | 6.7% |
| Arab | 111 | 0.3% |
| Argentinean | 14 | 0.0% |
| Armenian | 48 | 0.1% |
| Austrian | 244 | 0.7% |
| Belgian | 55 | 0.2% |
| Bhutanese | 149 | 0.4% |
| British | 395 | 1.1% |
| Burmese | 149 | 0.4% |
| Canadian | 302 | 0.9% |
| Celtic | 2 | 0.0% |
| Central American | 108 | 0.3% |
| Cherokee | 37 | 0.1% |
| Chippewa | 12 | 0.0% |
| Choctaw | 4 | 0.0% |
| Colombian | 18 | 0.1% |
| Croatian | 49 | 0.1% |
| Cuban | 12 | 0.0% |
| Czech | 102 | 0.3% |
| Czechoslovakian | 59 | 0.2% |
| Danish | 22 | 0.1% |
| Dominican | 43 | 0.1% |
| Dutch | 254 | 0.7% |
| Eastern European | 468 | 1.3% |
| English | 3,544 | 10.2% |
| Ethiopian | 30 | 0.1% |
| European | 971 | 2.8% |
| Filipino | 307 | 0.9% |
| Finnish | 37 | 0.1% |
| French | 812 | 2.3% |
| French Canadian | 35 | 0.1% |
| German | 5,234 | 15.0% |
| Greek | 311 | 0.9% |
| Guamanian / Chamorro | 8 | 0.0% |
| Guatemalan | 62 | 0.2% |
| Haitian | 85 | 0.2% |
| Honduran | 46 | 0.1% |
| Hungarian | 104 | 0.3% |
| Indian (Asian) | 1,704 | 4.9% |
| Iranian | 16 | 0.1% |
| Iraqi | 30 | 0.1% |
| Irish | 3,105 | 8.9% |
| Israeli | 48 | 0.1% |
| Italian | 1,360 | 3.9% |
| Jamaican | 33 | 0.1% |
| Kenyan | 60 | 0.2% |
| Korean | 161 | 0.5% |
| Laotian | 20 | 0.1% |
| Latvian | 8 | 0.0% |
| Lebanese | 59 | 0.2% |
| Lithuanian | 96 | 0.3% |
| Macedonian | 12 | 0.0% |
| Mexican | 353 | 1.0% |
| Mongolian | 22 | 0.1% |
| Navajo | 10 | 0.0% |
| Nigerian | 16 | 0.1% |
| Northern European | 54 | 0.2% |
| Norwegian | 242 | 0.7% |
| Osage | 4 | 0.0% |
| Palestinian | 20 | 0.1% |
| Peruvian | 25 | 0.1% |
| Polish | 1,245 | 3.6% |
| Portuguese | 49 | 0.1% |
| Puerto Rican | 67 | 0.2% |
| Romanian | 29 | 0.1% |
| Russian | 655 | 1.9% |
| Samoan | 12 | 0.0% |
| Scandinavian | 83 | 0.2% |
| Scotch-Irish | 263 | 0.7% |
| Scottish | 548 | 1.6% |
| Sierra Leonean | 99 | 0.3% |
| Sioux | 2 | 0.0% |
| Slovene | 21 | 0.1% |
| South American | 75 | 0.2% |
| South American Indian | 18 | 0.1% |
| Spaniard | 103 | 0.3% |
| Spanish | 48 | 0.1% |
| Sri Lankan | 180 | 0.5% |
| Subsaharan African | 600 | 1.7% |
| Sudanese | 7 | 0.0% |
| Swedish | 244 | 0.7% |
| Swiss | 94 | 0.3% |
| Syrian | 9 | 0.0% |
| Thai | 207 | 0.6% |
| Trinidadian and Tobagonian | 11 | 0.0% |
| Turkish | 13 | 0.0% |
| Ukrainian | 196 | 0.6% |
| Uruguayan | 18 | 0.1% |
| Welsh | 213 | 0.6% |
| West Indian | 8 | 0.0% | View All 93 Rows |
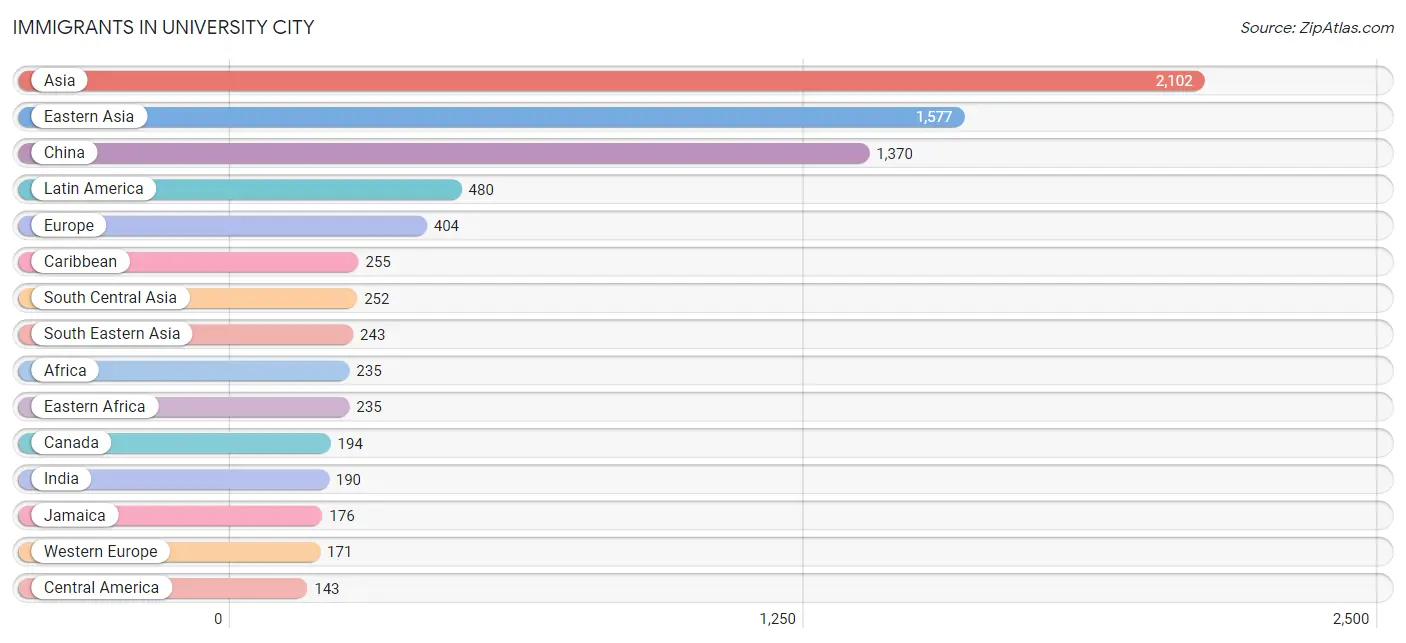
Immigrants in University City
The most numerous immigrant groups reported in University City came from Asia (2,102 | 6.0%), Eastern Asia (1,577 | 4.5%), China (1,370 | 3.9%), Latin America (480 | 1.4%), and Europe (404 | 1.2%), together accounting for 17.0% of all University City residents.
| Immigration Origin | # Population | % Population |
| Africa | 235 | 0.7% |
| Argentina | 14 | 0.0% |
| Asia | 2,102 | 6.0% |
| Australia | 64 | 0.2% |
| Brazil | 20 | 0.1% |
| Canada | 194 | 0.6% |
| Caribbean | 255 | 0.7% |
| Central America | 143 | 0.4% |
| China | 1,370 | 3.9% |
| Colombia | 5 | 0.0% |
| Costa Rica | 31 | 0.1% |
| Croatia | 15 | 0.0% |
| Eastern Africa | 235 | 0.7% |
| Eastern Asia | 1,577 | 4.5% |
| Eastern Europe | 68 | 0.2% |
| England | 9 | 0.0% |
| Ethiopia | 71 | 0.2% |
| Europe | 404 | 1.2% |
| France | 67 | 0.2% |
| Germany | 104 | 0.3% |
| Guatemala | 14 | 0.0% |
| Haiti | 79 | 0.2% |
| Honduras | 16 | 0.1% |
| Hong Kong | 23 | 0.1% |
| India | 190 | 0.5% |
| Indonesia | 9 | 0.0% |
| Iran | 15 | 0.0% |
| Iraq | 30 | 0.1% |
| Jamaica | 176 | 0.5% |
| Japan | 80 | 0.2% |
| Kenya | 50 | 0.1% |
| Korea | 127 | 0.4% |
| Latin America | 480 | 1.4% |
| Mexico | 82 | 0.2% |
| Northern Europe | 69 | 0.2% |
| Oceania | 64 | 0.2% |
| Peru | 25 | 0.1% |
| Philippines | 85 | 0.2% |
| Poland | 32 | 0.1% |
| Romania | 6 | 0.0% |
| South America | 82 | 0.2% |
| South Central Asia | 252 | 0.7% |
| South Eastern Asia | 243 | 0.7% |
| Southern Europe | 96 | 0.3% |
| Spain | 96 | 0.3% |
| Thailand | 22 | 0.1% |
| Uganda | 114 | 0.3% |
| Ukraine | 15 | 0.0% |
| Uruguay | 18 | 0.1% |
| Uzbekistan | 47 | 0.1% |
| Vietnam | 127 | 0.4% |
| Western Asia | 30 | 0.1% |
| Western Europe | 171 | 0.5% | View All 53 Rows |
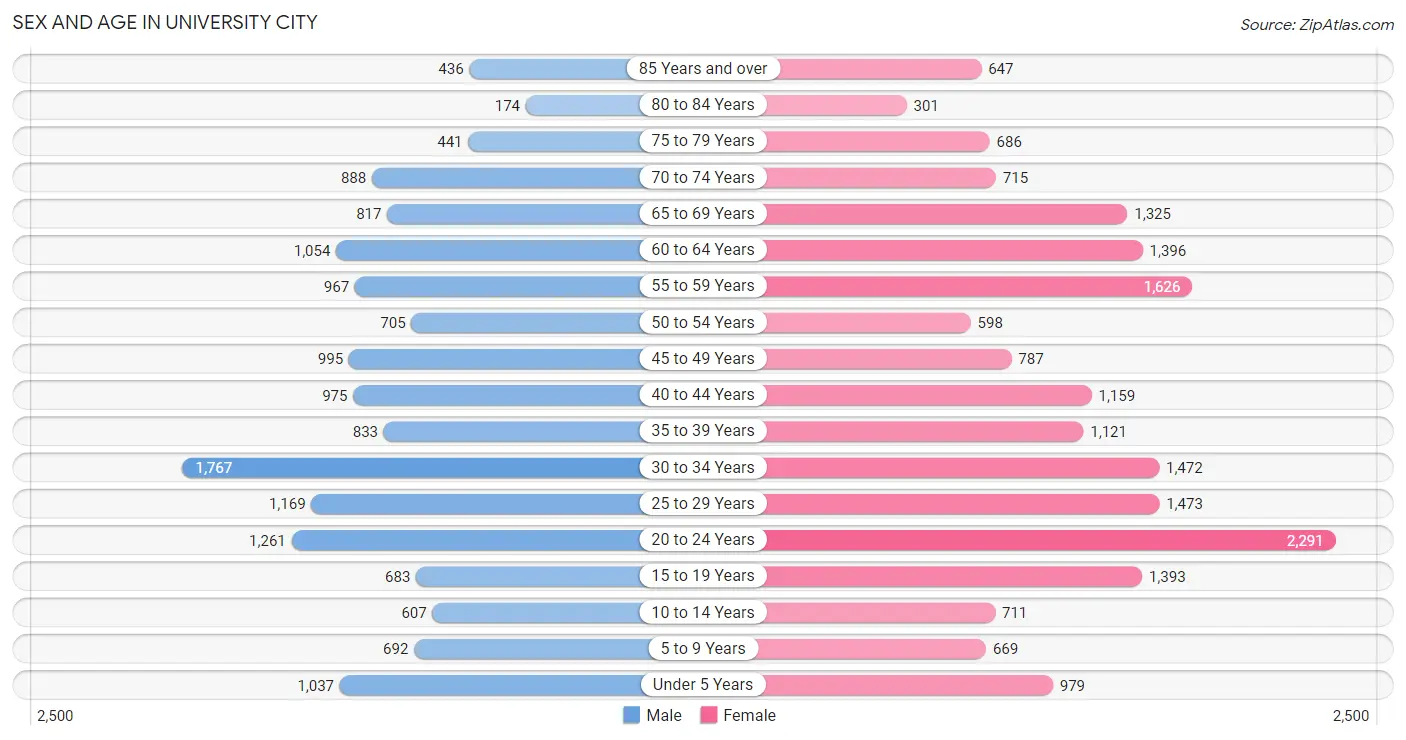
Sex and Age in University City
Sex and Age in University City
The most populous age groups in University City are 30 to 34 Years (1,767 | 11.4%) for men and 20 to 24 Years (2,291 | 11.8%) for women.
| Age Bracket | Male | Female |
| Under 5 Years | 1,037 (6.7%) | 979 (5.1%) |
| 5 to 9 Years | 692 (4.5%) | 669 (3.5%) |
| 10 to 14 Years | 607 (3.9%) | 711 (3.7%) |
| 15 to 19 Years | 683 (4.4%) | 1,393 (7.2%) |
| 20 to 24 Years | 1,261 (8.1%) | 2,291 (11.8%) |
| 25 to 29 Years | 1,169 (7.5%) | 1,473 (7.6%) |
| 30 to 34 Years | 1,767 (11.4%) | 1,472 (7.6%) |
| 35 to 39 Years | 833 (5.4%) | 1,121 (5.8%) |
| 40 to 44 Years | 975 (6.3%) | 1,159 (6.0%) |
| 45 to 49 Years | 995 (6.4%) | 787 (4.1%) |
| 50 to 54 Years | 705 (4.5%) | 598 (3.1%) |
| 55 to 59 Years | 967 (6.2%) | 1,626 (8.4%) |
| 60 to 64 Years | 1,054 (6.8%) | 1,396 (7.2%) |
| 65 to 69 Years | 817 (5.3%) | 1,325 (6.9%) |
| 70 to 74 Years | 888 (5.7%) | 715 (3.7%) |
| 75 to 79 Years | 441 (2.8%) | 686 (3.5%) |
| 80 to 84 Years | 174 (1.1%) | 301 (1.6%) |
| 85 Years and over | 436 (2.8%) | 647 (3.3%) |
| Total | 15,501 (100.0%) | 19,349 (100.0%) |
Families and Households in University City
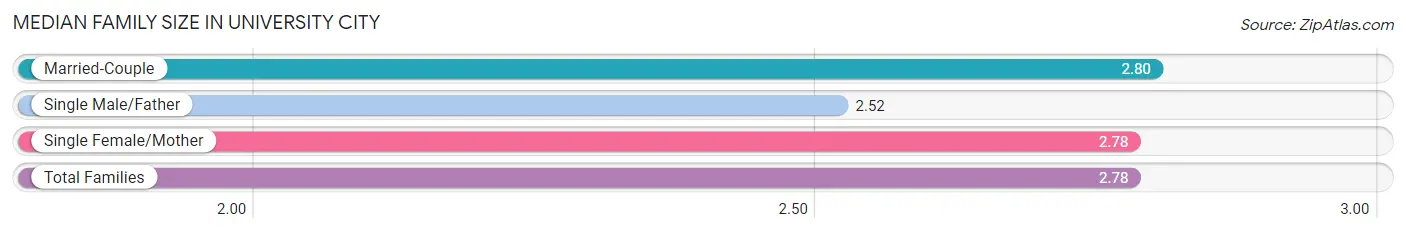
Median Family Size in University City
The median family size in University City is 2.78 persons per family, with married-couple families (6,183 | 75.8%) accounting for the largest median family size of 2.8 persons per family. On the other hand, single male/father families (489 | 6.0%) represent the smallest median family size with 2.52 persons per family.
| Family Type | # Families | Family Size |
| Married-Couple | 6,183 (75.8%) | 2.80 |
| Single Male/Father | 489 (6.0%) | 2.52 |
| Single Female/Mother | 1,481 (18.2%) | 2.78 |
| Total Families | 8,153 (100.0%) | 2.78 |
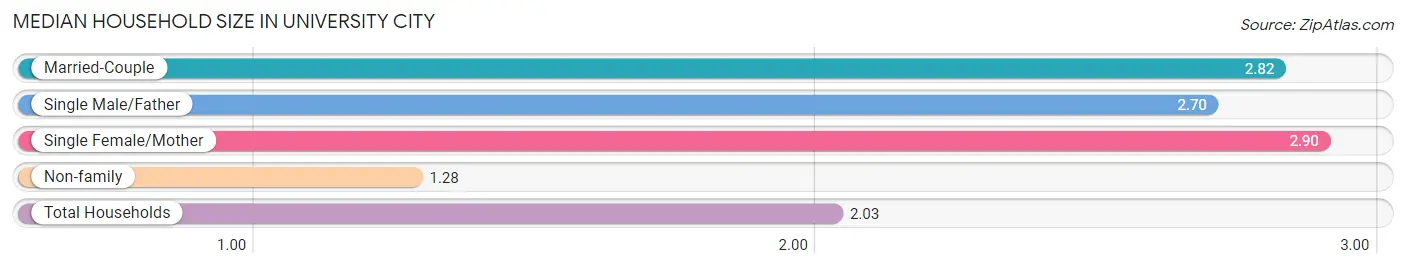
Median Household Size in University City
The median household size in University City is 2.03 persons per household, with single female/mother households (1,481 | 8.8%) accounting for the largest median household size of 2.9 persons per household. non-family households (8,643 | 51.5%) represent the smallest median household size with 1.28 persons per household.
| Household Type | # Households | Household Size |
| Married-Couple | 6,183 (36.8%) | 2.82 |
| Single Male/Father | 489 (2.9%) | 2.70 |
| Single Female/Mother | 1,481 (8.8%) | 2.90 |
| Non-family | 8,643 (51.5%) | 1.28 |
| Total Households | 16,796 (100.0%) | 2.03 |
Household Size by Marriage Status in University City
Out of a total of 16,796 households in University City, 8,153 (48.5%) are family households, while 8,643 (51.5%) are nonfamily households. The most numerous type of family households are 2-person households, comprising 4,441, and the most common type of nonfamily households are 1-person households, comprising 6,846.
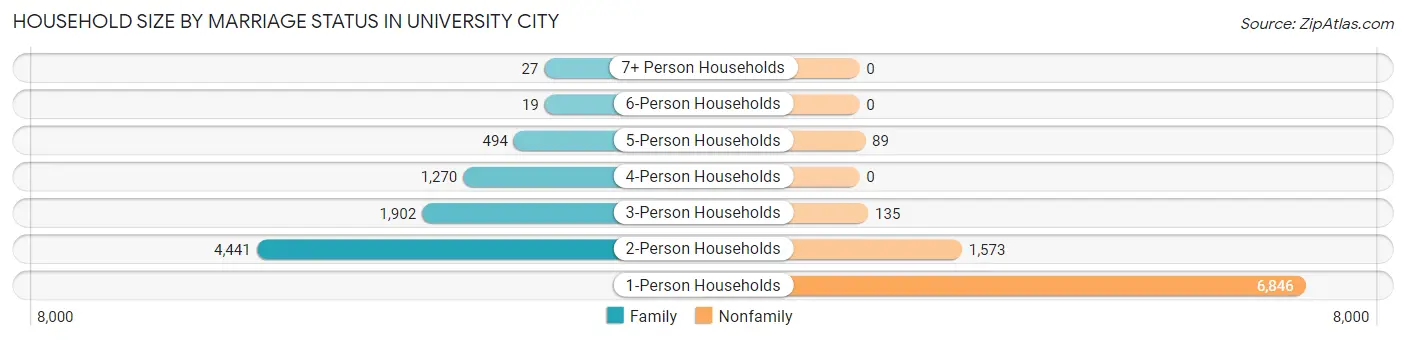
| Household Size | Family Households | Nonfamily Households |
| 1-Person Households | - | 6,846 (40.8%) |
| 2-Person Households | 4,441 (26.4%) | 1,573 (9.4%) |
| 3-Person Households | 1,902 (11.3%) | 135 (0.8%) |
| 4-Person Households | 1,270 (7.6%) | 0 (0.0%) |
| 5-Person Households | 494 (2.9%) | 89 (0.5%) |
| 6-Person Households | 19 (0.1%) | 0 (0.0%) |
| 7+ Person Households | 27 (0.2%) | 0 (0.0%) |
| Total | 8,153 (48.5%) | 8,643 (51.5%) |
Female Fertility in University City
Fertility by Age in University City
Average fertility rate in University City is 58.0 births per 1,000 women. Women in the age bracket of 20 to 34 years have the highest fertility rate with 92.0 births per 1,000 women. Women in the age bracket of 20 to 34 years acount for 84.9% of all women with births.
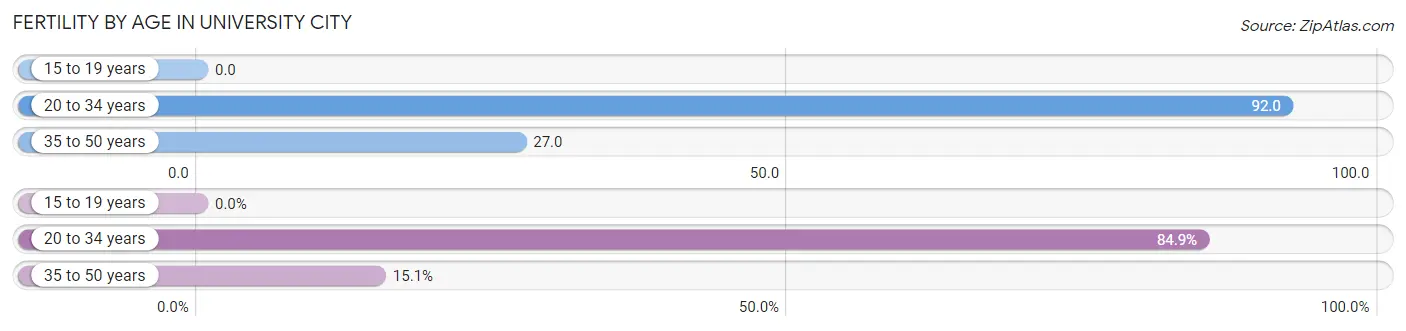
| Age Bracket | Women with Births | Births / 1,000 Women |
| 15 to 19 years | 0 (0.0%) | 0.0 |
| 20 to 34 years | 484 (84.9%) | 92.0 |
| 35 to 50 years | 86 (15.1%) | 27.0 |
| Total | 570 (100.0%) | 58.0 |
Fertility by Age by Marriage Status in University City
91.6% of women with births (570) in University City are married. The highest percentage of unmarried women with births falls into 35 to 50 years age bracket with 26.7% of them unmarried at the time of birth, while the lowest percentage of unmarried women with births belong to 20 to 34 years age bracket with 5.2% of them unmarried.
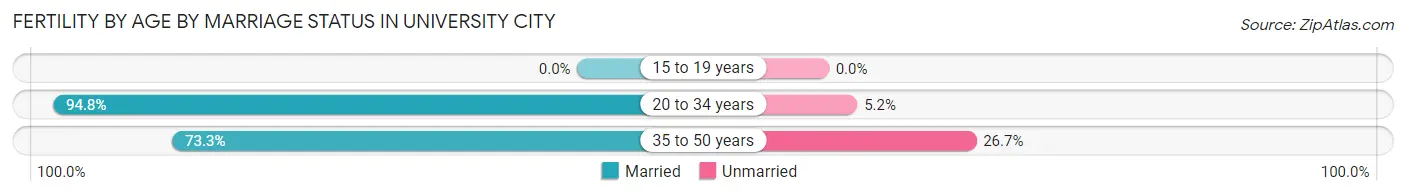
| Age Bracket | Married | Unmarried |
| 15 to 19 years | 0 (0.0%) | 0 (0.0%) |
| 20 to 34 years | 459 (94.8%) | 25 (5.2%) |
| 35 to 50 years | 63 (73.3%) | 23 (26.7%) |
| Total | 522 (91.6%) | 48 (8.4%) |
Fertility by Education in University City
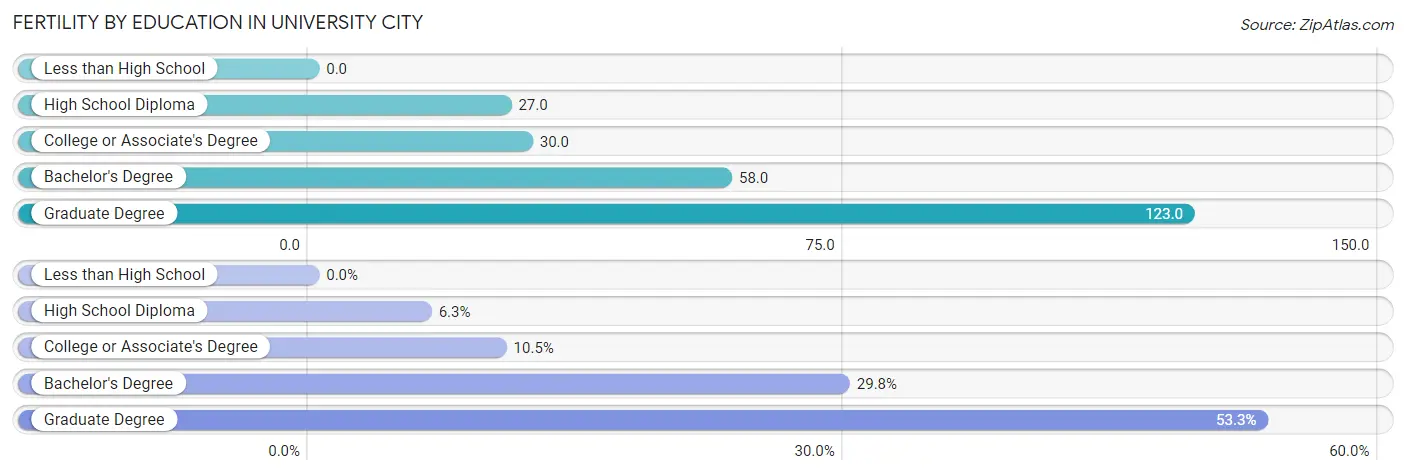
| Educational Attainment | Women with Births | Births / 1,000 Women |
| Less than High School | 0 (0.0%) | 0.0 |
| High School Diploma | 36 (6.3%) | 27.0 |
| College or Associate's Degree | 60 (10.5%) | 30.0 |
| Bachelor's Degree | 170 (29.8%) | 58.0 |
| Graduate Degree | 304 (53.3%) | 123.0 |
| Total | 570 (100.0%) | 58.0 |
Fertility by Education by Marriage Status in University City
8.4% of women with births in University City are unmarried. Women with the educational attainment of high school diploma are most likely to be married with 100.0% of them married at childbirth, while women with the educational attainment of college or associate's degree are least likely to be married with 80.0% of them unmarried at childbirth.
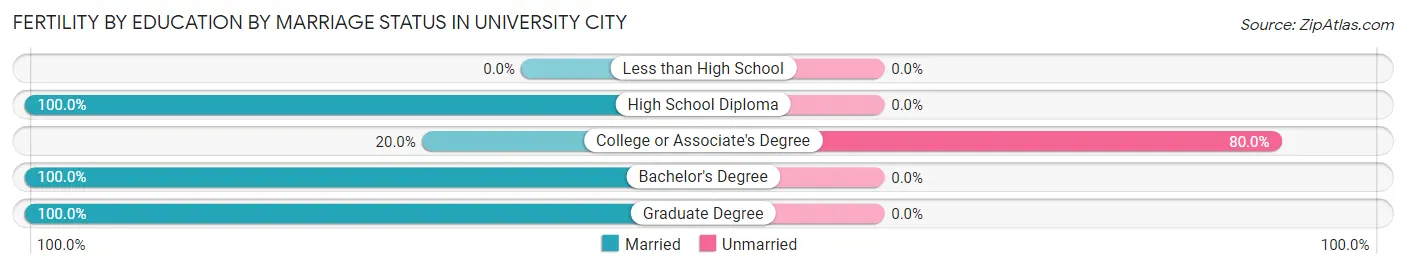
| Educational Attainment | Married | Unmarried |
| Less than High School | 0 (0.0%) | 0 (0.0%) |
| High School Diploma | 36 (100.0%) | 0 (0.0%) |
| College or Associate's Degree | 12 (20.0%) | 48 (80.0%) |
| Bachelor's Degree | 170 (100.0%) | 0 (0.0%) |
| Graduate Degree | 304 (100.0%) | 0 (0.0%) |
| Total | 522 (91.6%) | 48 (8.4%) |
Employment Characteristics in University City
Employment by Class of Employer in University City
Among the 18,701 employed individuals in University City, private company employees (10,650 | 57.0%), not-for-profit organizations (4,065 | 21.7%), and self-employed (not incorporated) (1,031 | 5.5%) make up the most common classes of employment.
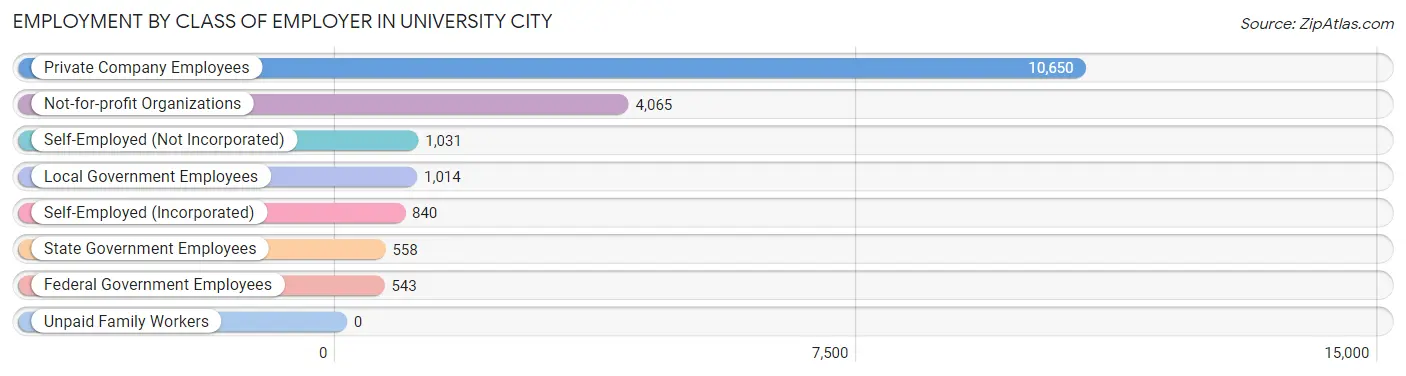
| Employer Class | # Employees | % Employees |
| Private Company Employees | 10,650 | 57.0% |
| Self-Employed (Incorporated) | 840 | 4.5% |
| Self-Employed (Not Incorporated) | 1,031 | 5.5% |
| Not-for-profit Organizations | 4,065 | 21.7% |
| Local Government Employees | 1,014 | 5.4% |
| State Government Employees | 558 | 3.0% |
| Federal Government Employees | 543 | 2.9% |
| Unpaid Family Workers | 0 | 0.0% |
| Total | 18,701 | 100.0% |
Employment Status by Age in University City
According to the labor force statistics for University City, out of the total population over 16 years of age (29,708), 65.5% or 19,459 individuals are in the labor force, with 2.0% or 389 of them unemployed. The age group with the highest labor force participation rate is 45 to 54 years, with 92.9% or 2,866 individuals in the labor force. Within the labor force, the 16 to 19 years age range has the highest percentage of unemployed individuals, with 9.4% or 44 of them being unemployed.
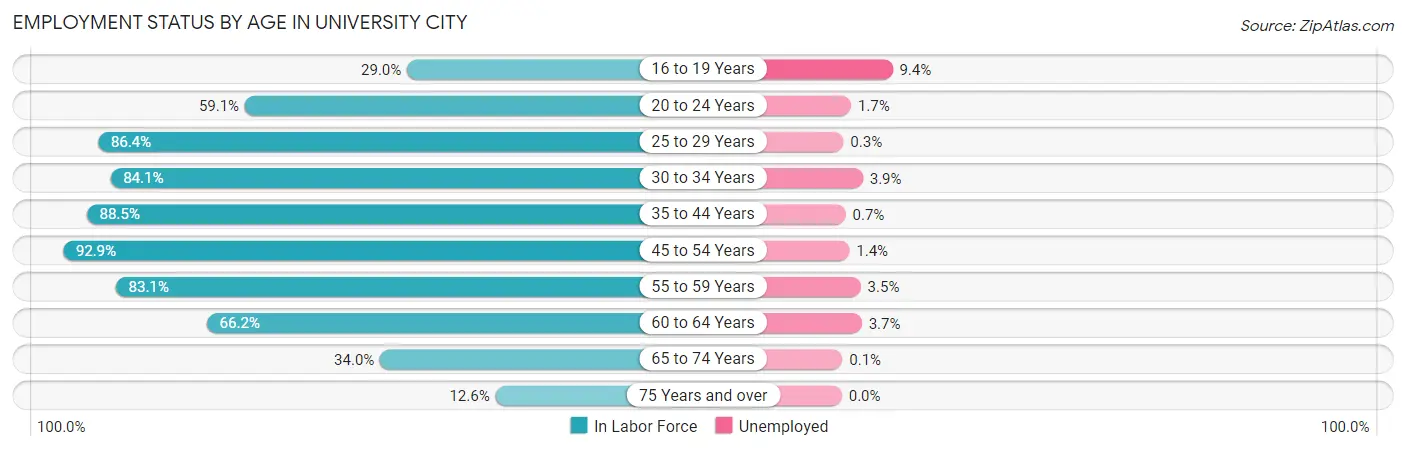
| Age Bracket | In Labor Force | Unemployed |
| 16 to 19 Years | 472 (29.0%) | 44 (9.4%) |
| 20 to 24 Years | 2,099 (59.1%) | 36 (1.7%) |
| 25 to 29 Years | 2,283 (86.4%) | 7 (0.3%) |
| 30 to 34 Years | 2,724 (84.1%) | 106 (3.9%) |
| 35 to 44 Years | 3,618 (88.5%) | 25 (0.7%) |
| 45 to 54 Years | 2,866 (92.9%) | 40 (1.4%) |
| 55 to 59 Years | 2,155 (83.1%) | 75 (3.5%) |
| 60 to 64 Years | 1,622 (66.2%) | 60 (3.7%) |
| 65 to 74 Years | 1,273 (34.0%) | 1 (0.1%) |
| 75 Years and over | 338 (12.6%) | 0 (0.0%) |
| Total | 19,459 (65.5%) | 389 (2.0%) |
Employment Status by Educational Attainment in University City
According to labor force statistics for University City, 84.4% of individuals (15,274) out of the total population between 25 and 64 years of age (18,097) are in the labor force, with 2.0% or 305 of them being unemployed. The group with the highest labor force participation rate are those with the educational attainment of bachelor's degree or higher, with 88.2% or 10,595 individuals in the labor force. Within the labor force, individuals with less than high school education have the highest percentage of unemployment, with 6.0% or 13 of them being unemployed.
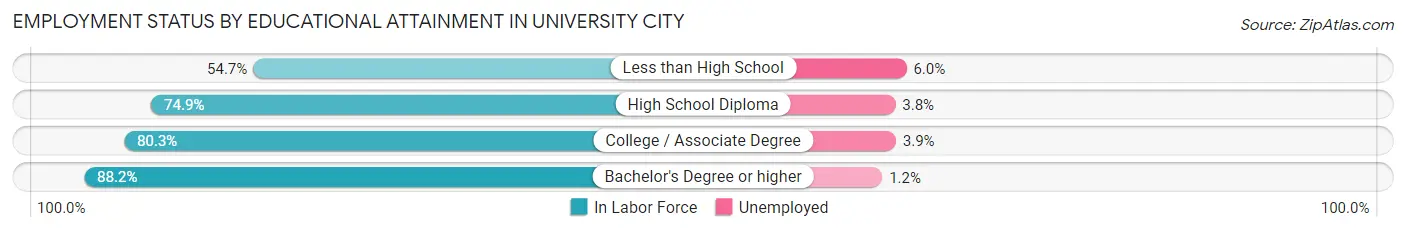
| Educational Attainment | In Labor Force | Unemployed |
| Less than High School | 216 (54.7%) | 24 (6.0%) |
| High School Diploma | 1,647 (74.9%) | 84 (3.8%) |
| College / Associate Degree | 2,802 (80.3%) | 136 (3.9%) |
| Bachelor's Degree or higher | 10,595 (88.2%) | 144 (1.2%) |
| Total | 15,274 (84.4%) | 362 (2.0%) |
Employment Occupations by Sex in University City
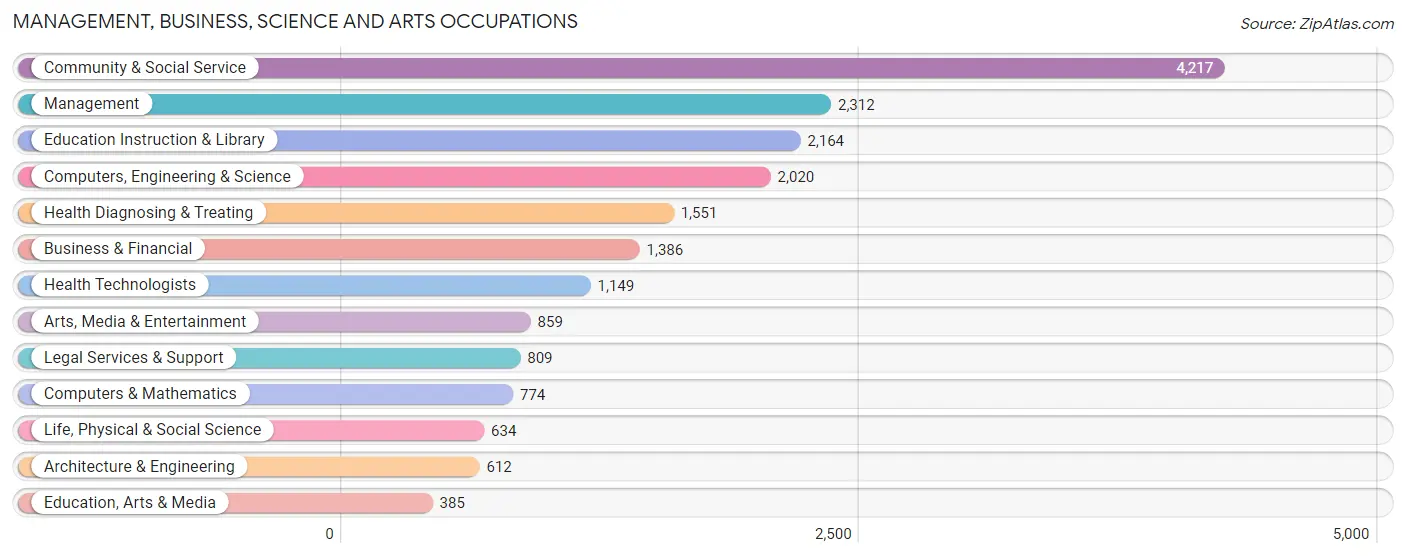
Management, Business, Science and Arts Occupations
The most common Management, Business, Science and Arts occupations in University City are Community & Social Service (4,217 | 22.2%), Management (2,312 | 12.1%), Education Instruction & Library (2,164 | 11.4%), Computers, Engineering & Science (2,020 | 10.6%), and Health Diagnosing & Treating (1,551 | 8.2%).
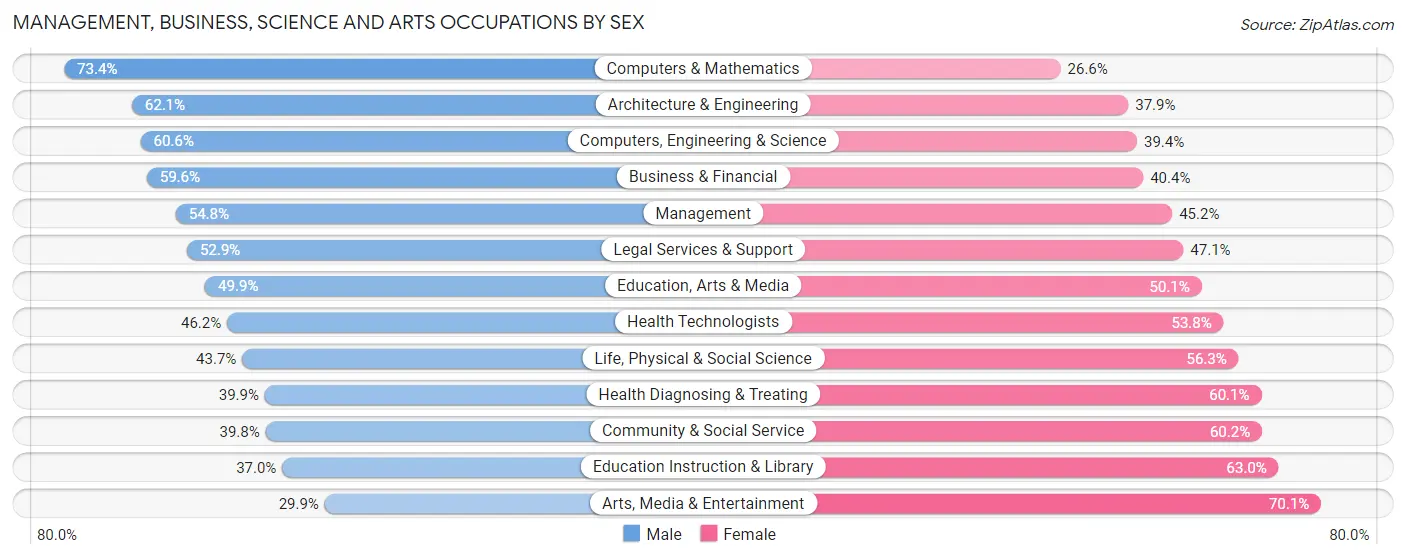
Management, Business, Science and Arts Occupations by Sex
Within the Management, Business, Science and Arts occupations in University City, the most male-oriented occupations are Computers & Mathematics (73.4%), Architecture & Engineering (62.1%), and Computers, Engineering & Science (60.6%), while the most female-oriented occupations are Arts, Media & Entertainment (70.1%), Education Instruction & Library (63.0%), and Community & Social Service (60.2%).
| Occupation | Male | Female |
| Management | 1,266 (54.8%) | 1,046 (45.2%) |
| Business & Financial | 826 (59.6%) | 560 (40.4%) |
| Computers, Engineering & Science | 1,225 (60.6%) | 795 (39.4%) |
| Computers & Mathematics | 568 (73.4%) | 206 (26.6%) |
| Architecture & Engineering | 380 (62.1%) | 232 (37.9%) |
| Life, Physical & Social Science | 277 (43.7%) | 357 (56.3%) |
| Community & Social Service | 1,678 (39.8%) | 2,539 (60.2%) |
| Education, Arts & Media | 192 (49.9%) | 193 (50.1%) |
| Legal Services & Support | 428 (52.9%) | 381 (47.1%) |
| Education Instruction & Library | 801 (37.0%) | 1,363 (63.0%) |
| Arts, Media & Entertainment | 257 (29.9%) | 602 (70.1%) |
| Health Diagnosing & Treating | 619 (39.9%) | 932 (60.1%) |
| Health Technologists | 531 (46.2%) | 618 (53.8%) |
| Total (Category) | 5,614 (48.9%) | 5,872 (51.1%) |
| Total (Overall) | 9,267 (48.7%) | 9,774 (51.3%) |
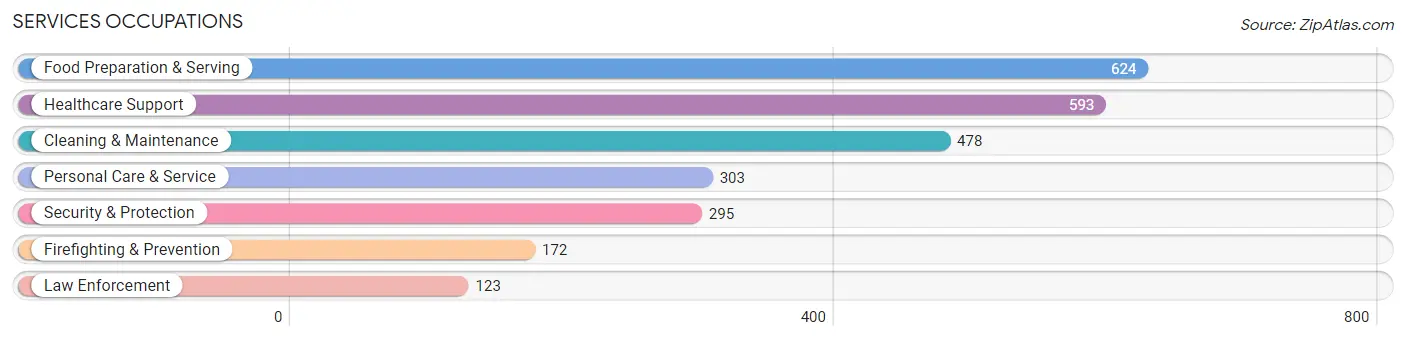
Services Occupations
The most common Services occupations in University City are Food Preparation & Serving (624 | 3.3%), Healthcare Support (593 | 3.1%), Cleaning & Maintenance (478 | 2.5%), Personal Care & Service (303 | 1.6%), and Security & Protection (295 | 1.5%).
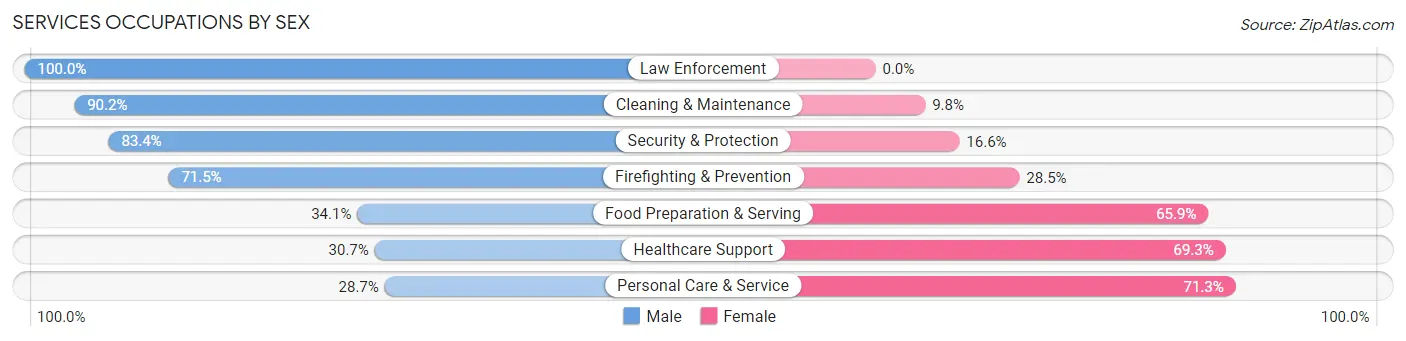
Services Occupations by Sex
Within the Services occupations in University City, the most male-oriented occupations are Law Enforcement (100.0%), Cleaning & Maintenance (90.2%), and Security & Protection (83.4%), while the most female-oriented occupations are Personal Care & Service (71.3%), Healthcare Support (69.3%), and Food Preparation & Serving (65.9%).
| Occupation | Male | Female |
| Healthcare Support | 182 (30.7%) | 411 (69.3%) |
| Security & Protection | 246 (83.4%) | 49 (16.6%) |
| Firefighting & Prevention | 123 (71.5%) | 49 (28.5%) |
| Law Enforcement | 123 (100.0%) | 0 (0.0%) |
| Food Preparation & Serving | 213 (34.1%) | 411 (65.9%) |
| Cleaning & Maintenance | 431 (90.2%) | 47 (9.8%) |
| Personal Care & Service | 87 (28.7%) | 216 (71.3%) |
| Total (Category) | 1,159 (50.5%) | 1,134 (49.4%) |
| Total (Overall) | 9,267 (48.7%) | 9,774 (51.3%) |
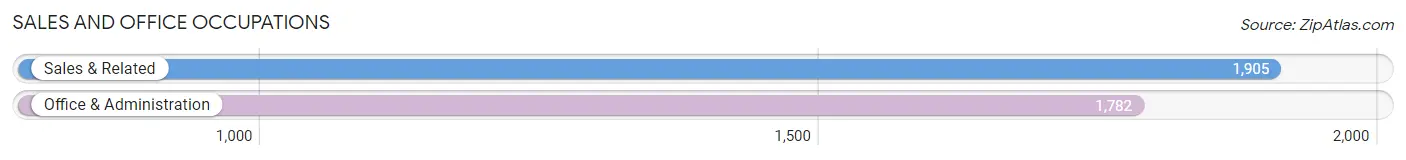
Sales and Office Occupations
The most common Sales and Office occupations in University City are Sales & Related (1,905 | 10.0%), and Office & Administration (1,782 | 9.4%).
Sales and Office Occupations by Sex
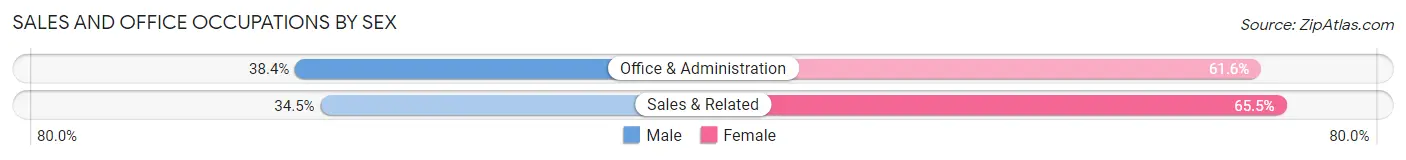
| Occupation | Male | Female |
| Sales & Related | 657 (34.5%) | 1,248 (65.5%) |
| Office & Administration | 684 (38.4%) | 1,098 (61.6%) |
| Total (Category) | 1,341 (36.4%) | 2,346 (63.6%) |
| Total (Overall) | 9,267 (48.7%) | 9,774 (51.3%) |
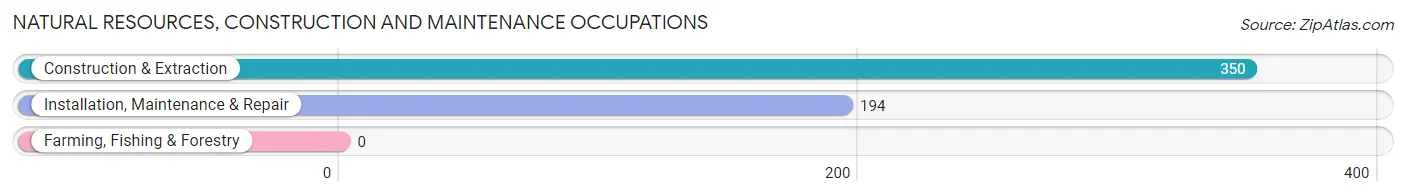
Natural Resources, Construction and Maintenance Occupations
The most common Natural Resources, Construction and Maintenance occupations in University City are Construction & Extraction (350 | 1.8%), and Installation, Maintenance & Repair (194 | 1.0%).
Natural Resources, Construction and Maintenance Occupations by Sex
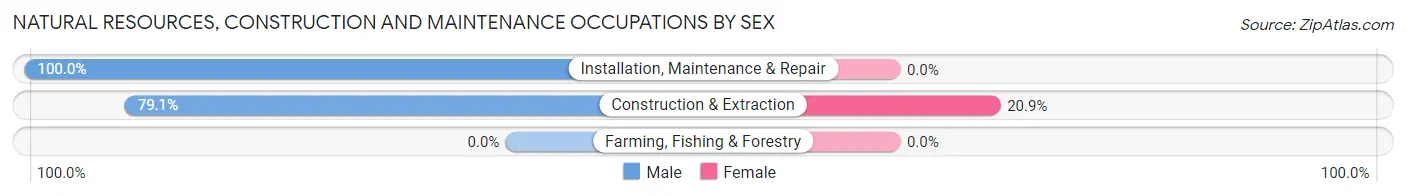
| Occupation | Male | Female |
| Farming, Fishing & Forestry | 0 (0.0%) | 0 (0.0%) |
| Construction & Extraction | 277 (79.1%) | 73 (20.9%) |
| Installation, Maintenance & Repair | 194 (100.0%) | 0 (0.0%) |
| Total (Category) | 471 (86.6%) | 73 (13.4%) |
| Total (Overall) | 9,267 (48.7%) | 9,774 (51.3%) |
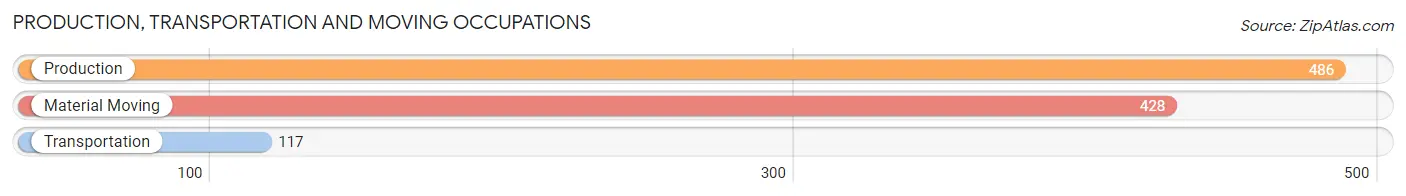
Production, Transportation and Moving Occupations
The most common Production, Transportation and Moving occupations in University City are Production (486 | 2.5%), Material Moving (428 | 2.2%), and Transportation (117 | 0.6%).
Production, Transportation and Moving Occupations by Sex
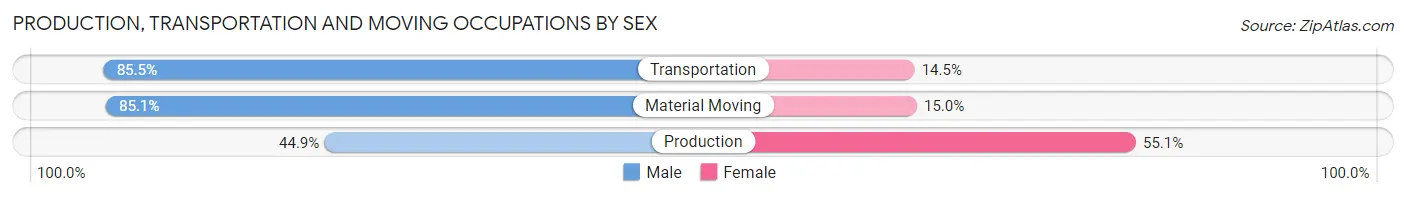
| Occupation | Male | Female |
| Production | 218 (44.9%) | 268 (55.1%) |
| Transportation | 100 (85.5%) | 17 (14.5%) |
| Material Moving | 364 (85.1%) | 64 (14.9%) |
| Total (Category) | 682 (66.1%) | 349 (33.9%) |
| Total (Overall) | 9,267 (48.7%) | 9,774 (51.3%) |
Employment Industries by Sex in University City
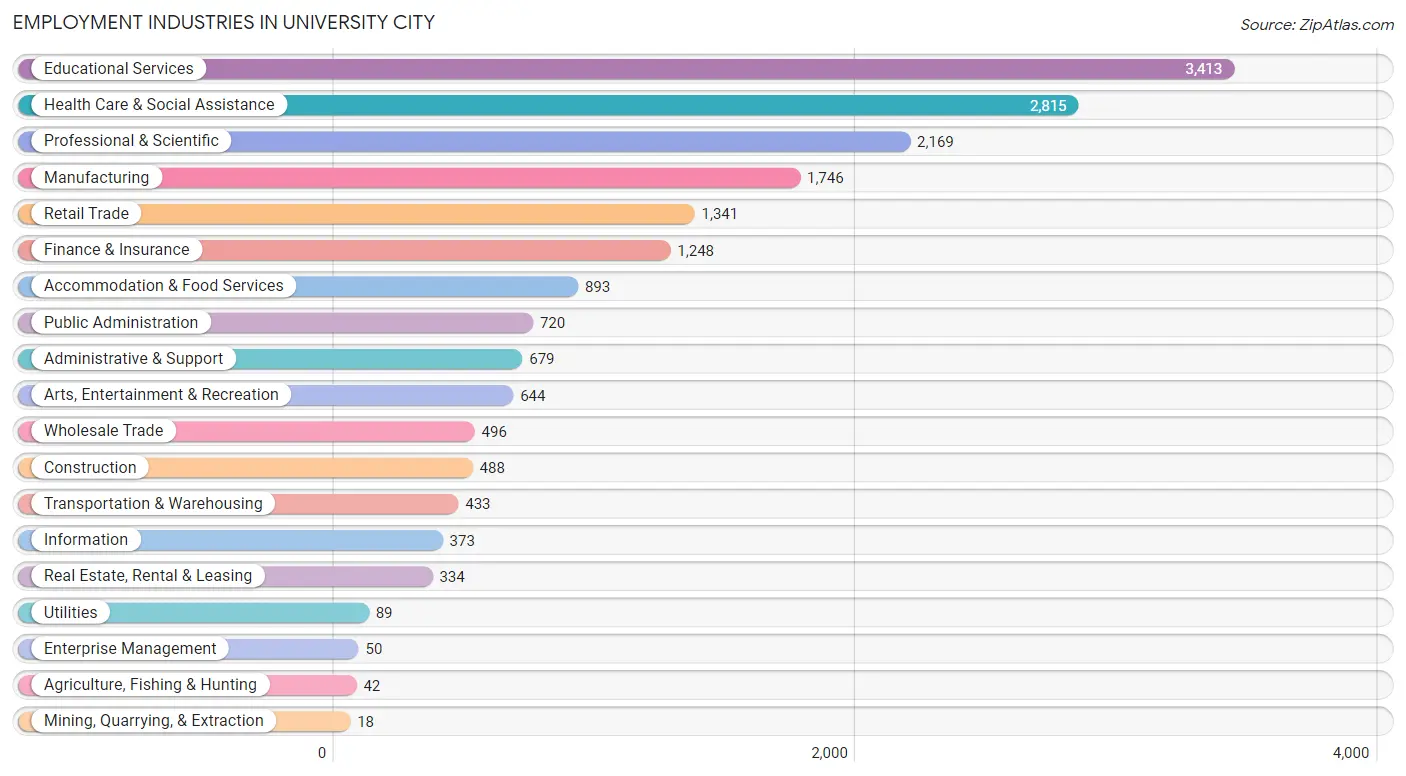
Employment Industries in University City
The major employment industries in University City include Educational Services (3,413 | 17.9%), Health Care & Social Assistance (2,815 | 14.8%), Professional & Scientific (2,169 | 11.4%), Manufacturing (1,746 | 9.2%), and Retail Trade (1,341 | 7.0%).
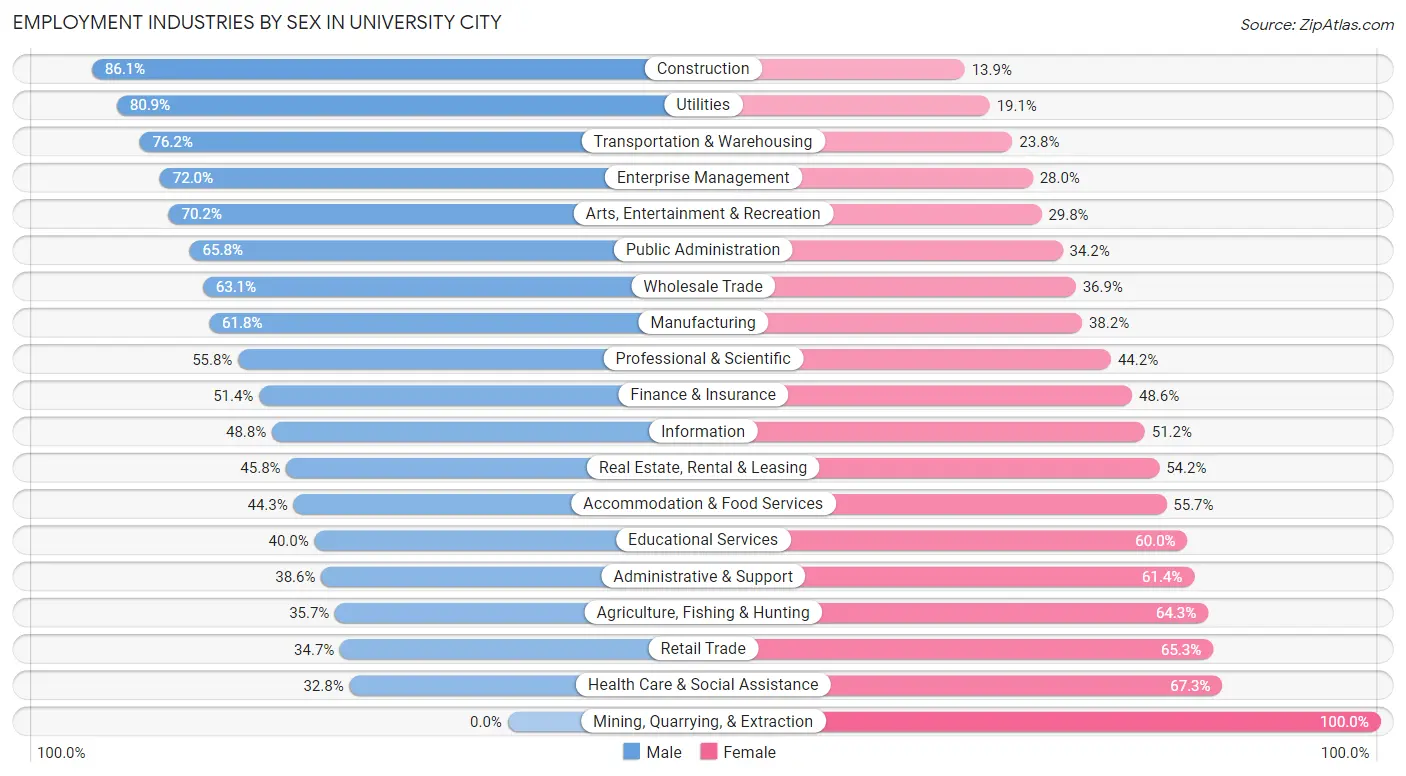
Employment Industries by Sex in University City
The University City industries that see more men than women are Construction (86.1%), Utilities (80.9%), and Transportation & Warehousing (76.2%), whereas the industries that tend to have a higher number of women are Mining, Quarrying, & Extraction (100.0%), Health Care & Social Assistance (67.2%), and Retail Trade (65.3%).
| Industry | Male | Female |
| Agriculture, Fishing & Hunting | 15 (35.7%) | 27 (64.3%) |
| Mining, Quarrying, & Extraction | 0 (0.0%) | 18 (100.0%) |
| Construction | 420 (86.1%) | 68 (13.9%) |
| Manufacturing | 1,079 (61.8%) | 667 (38.2%) |
| Wholesale Trade | 313 (63.1%) | 183 (36.9%) |
| Retail Trade | 465 (34.7%) | 876 (65.3%) |
| Transportation & Warehousing | 330 (76.2%) | 103 (23.8%) |
| Utilities | 72 (80.9%) | 17 (19.1%) |
| Information | 182 (48.8%) | 191 (51.2%) |
| Finance & Insurance | 642 (51.4%) | 606 (48.6%) |
| Real Estate, Rental & Leasing | 153 (45.8%) | 181 (54.2%) |
| Professional & Scientific | 1,210 (55.8%) | 959 (44.2%) |
| Enterprise Management | 36 (72.0%) | 14 (28.0%) |
| Administrative & Support | 262 (38.6%) | 417 (61.4%) |
| Educational Services | 1,365 (40.0%) | 2,048 (60.0%) |
| Health Care & Social Assistance | 922 (32.8%) | 1,893 (67.2%) |
| Arts, Entertainment & Recreation | 452 (70.2%) | 192 (29.8%) |
| Accommodation & Food Services | 396 (44.3%) | 497 (55.7%) |
| Public Administration | 474 (65.8%) | 246 (34.2%) |
| Total | 9,267 (48.7%) | 9,774 (51.3%) |
Education in University City
School Enrollment in University City
The most common levels of schooling among the 8,913 students in University City are graduate / professional (2,534 | 28.4%), college / undergraduate (1,932 | 21.7%), and high school (1,452 | 16.3%).
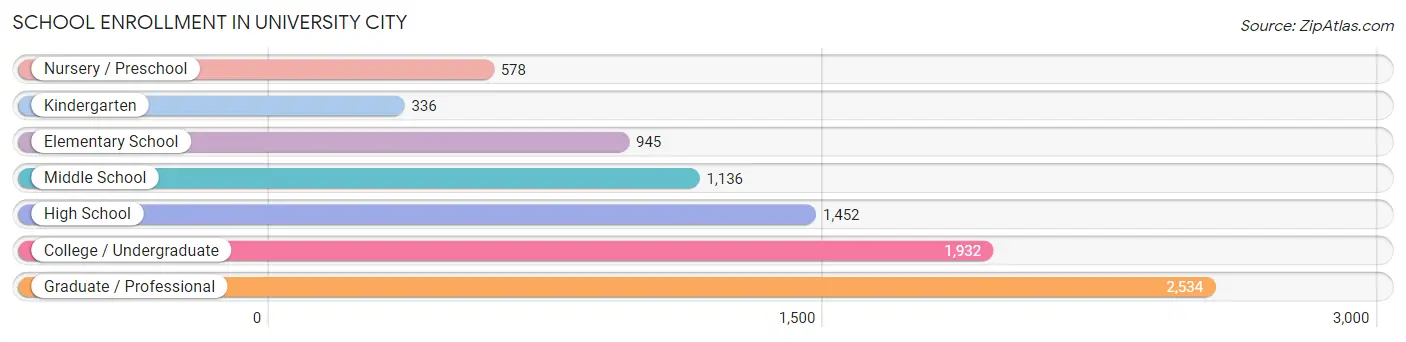
| School Level | # Students | % Students |
| Nursery / Preschool | 578 | 6.5% |
| Kindergarten | 336 | 3.8% |
| Elementary School | 945 | 10.6% |
| Middle School | 1,136 | 12.8% |
| High School | 1,452 | 16.3% |
| College / Undergraduate | 1,932 | 21.7% |
| Graduate / Professional | 2,534 | 28.4% |
| Total | 8,913 | 100.0% |
School Enrollment by Age by Funding Source in University City
Out of a total of 8,913 students who are enrolled in schools in University City, 5,410 (60.7%) attend a private institution, while the remaining 3,503 (39.3%) are enrolled in public schools. The age group of 3 to 4 year olds has the highest likelihood of being enrolled in private schools, with 324 (77.5% in the age bracket) enrolled. Conversely, the age group of 35 years and over has the lowest likelihood of being enrolled in a private school, with 227 (54.4% in the age bracket) attending a public institution.
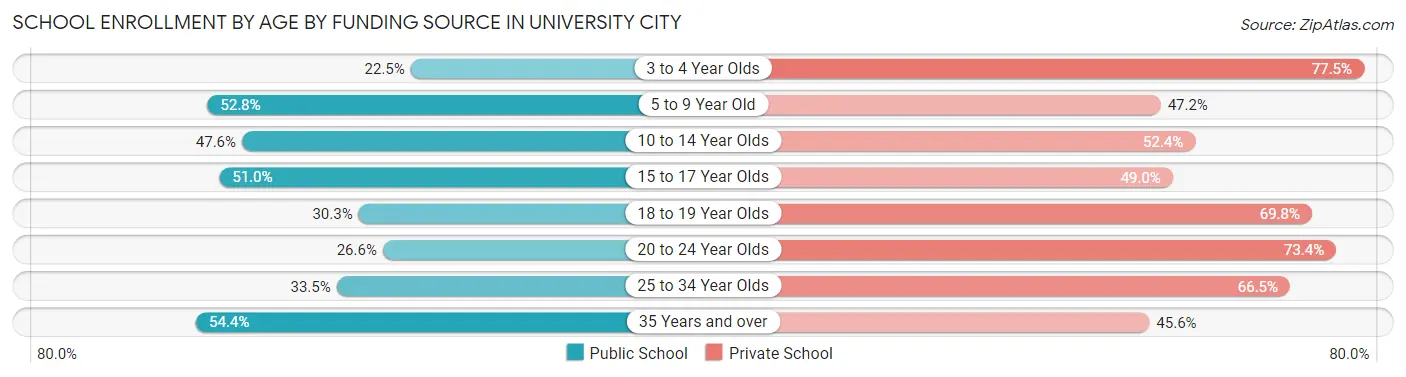
| Age Bracket | Public School | Private School |
| 3 to 4 Year Olds | 94 (22.5%) | 324 (77.5%) |
| 5 to 9 Year Old | 718 (52.8%) | 643 (47.2%) |
| 10 to 14 Year Olds | 613 (47.6%) | 674 (52.4%) |
| 15 to 17 Year Olds | 622 (51.0%) | 598 (49.0%) |
| 18 to 19 Year Olds | 219 (30.2%) | 505 (69.8%) |
| 20 to 24 Year Olds | 601 (26.6%) | 1,656 (73.4%) |
| 25 to 34 Year Olds | 412 (33.5%) | 817 (66.5%) |
| 35 Years and over | 227 (54.4%) | 190 (45.6%) |
| Total | 3,503 (39.3%) | 5,410 (60.7%) |
Educational Attainment by Field of Study in University City
Business (2,685 | 15.9%), social sciences (1,795 | 10.6%), education (1,745 | 10.3%), science & technology (1,462 | 8.6%), and visual & performing arts (1,150 | 6.8%) are the most common fields of study among 16,944 individuals in University City who have obtained a bachelor's degree or higher.
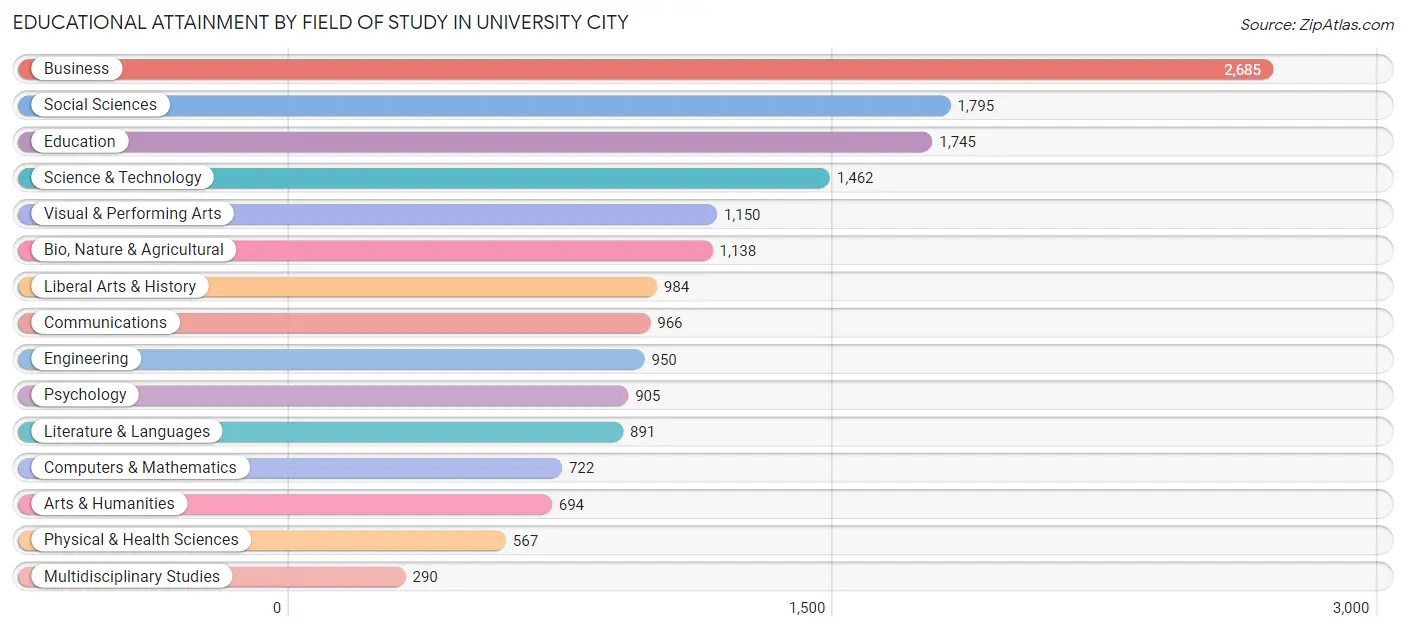
| Field of Study | # Graduates | % Graduates |
| Computers & Mathematics | 722 | 4.3% |
| Bio, Nature & Agricultural | 1,138 | 6.7% |
| Physical & Health Sciences | 567 | 3.4% |
| Psychology | 905 | 5.3% |
| Social Sciences | 1,795 | 10.6% |
| Engineering | 950 | 5.6% |
| Multidisciplinary Studies | 290 | 1.7% |
| Science & Technology | 1,462 | 8.6% |
| Business | 2,685 | 15.9% |
| Education | 1,745 | 10.3% |
| Literature & Languages | 891 | 5.3% |
| Liberal Arts & History | 984 | 5.8% |
| Visual & Performing Arts | 1,150 | 6.8% |
| Communications | 966 | 5.7% |
| Arts & Humanities | 694 | 4.1% |
| Total | 16,944 | 100.0% |
Transportation & Commute in University City
Vehicle Availability by Sex in University City
The most prevalent vehicle ownership categories in University City are males with 2 vehicles (4,569, accounting for 50.3%) and females with 2 vehicles (4,699, making up 48.3%).
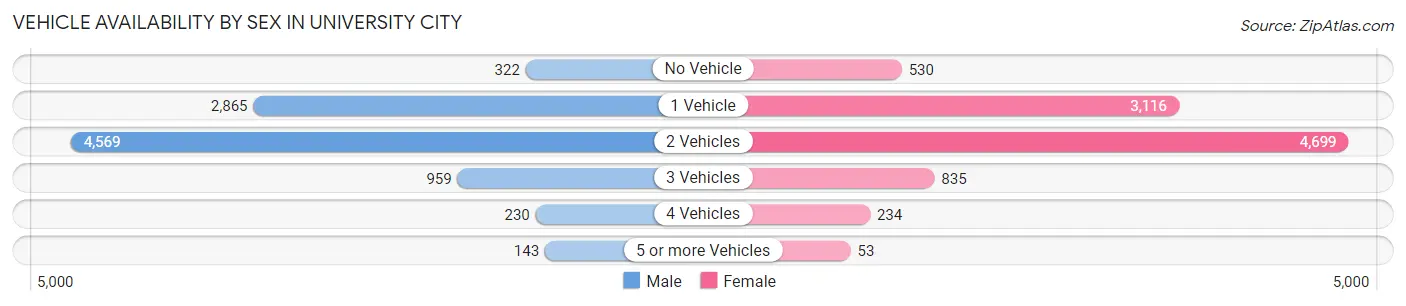
| Vehicles Available | Male | Female |
| No Vehicle | 322 (3.5%) | 530 (5.6%) |
| 1 Vehicle | 2,865 (31.5%) | 3,116 (32.9%) |
| 2 Vehicles | 4,569 (50.3%) | 4,699 (49.6%) |
| 3 Vehicles | 959 (10.5%) | 835 (8.8%) |
| 4 Vehicles | 230 (2.5%) | 234 (2.5%) |
| 5 or more Vehicles | 143 (1.6%) | 53 (0.6%) |
| Total | 9,088 (100.0%) | 9,467 (100.0%) |
Commute Time in University City
The most frequently occuring commute durations in University City are 15 to 19 minutes (3,342 commuters, 21.0%), 20 to 24 minutes (3,287 commuters, 20.7%), and 10 to 14 minutes (2,517 commuters, 15.8%).
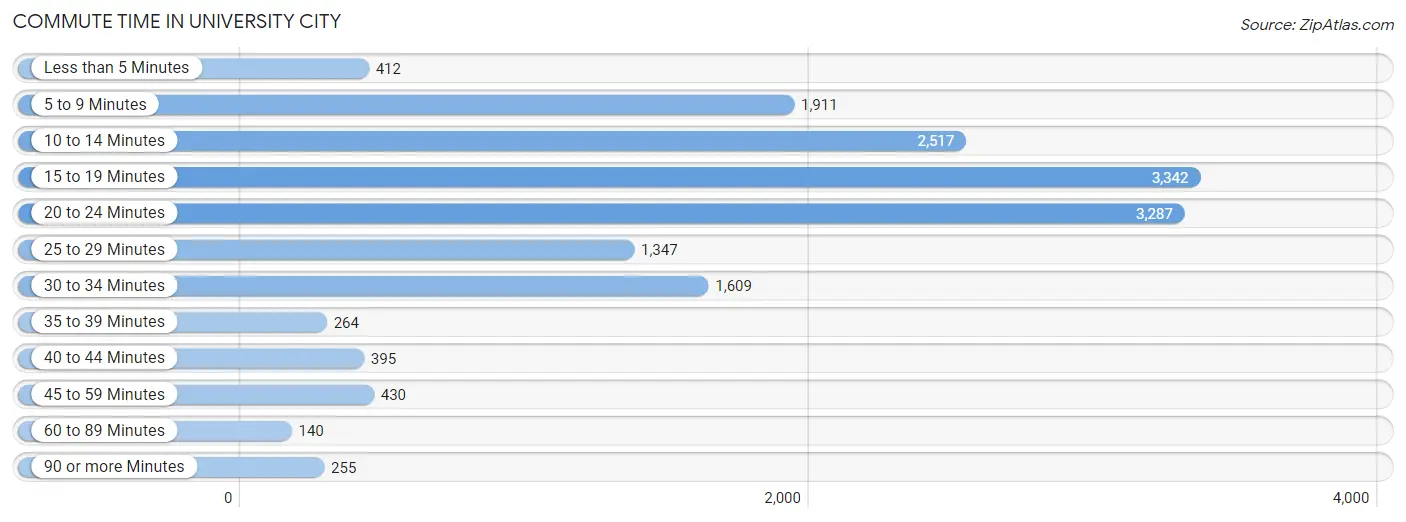
| Commute Time | # Commuters | % Commuters |
| Less than 5 Minutes | 412 | 2.6% |
| 5 to 9 Minutes | 1,911 | 12.0% |
| 10 to 14 Minutes | 2,517 | 15.8% |
| 15 to 19 Minutes | 3,342 | 21.0% |
| 20 to 24 Minutes | 3,287 | 20.7% |
| 25 to 29 Minutes | 1,347 | 8.5% |
| 30 to 34 Minutes | 1,609 | 10.1% |
| 35 to 39 Minutes | 264 | 1.7% |
| 40 to 44 Minutes | 395 | 2.5% |
| 45 to 59 Minutes | 430 | 2.7% |
| 60 to 89 Minutes | 140 | 0.9% |
| 90 or more Minutes | 255 | 1.6% |
Commute Time by Sex in University City
The most common commute times in University City are 20 to 24 minutes (1,459 commuters, 19.0%) for males and 15 to 19 minutes (1,948 commuters, 23.7%) for females.
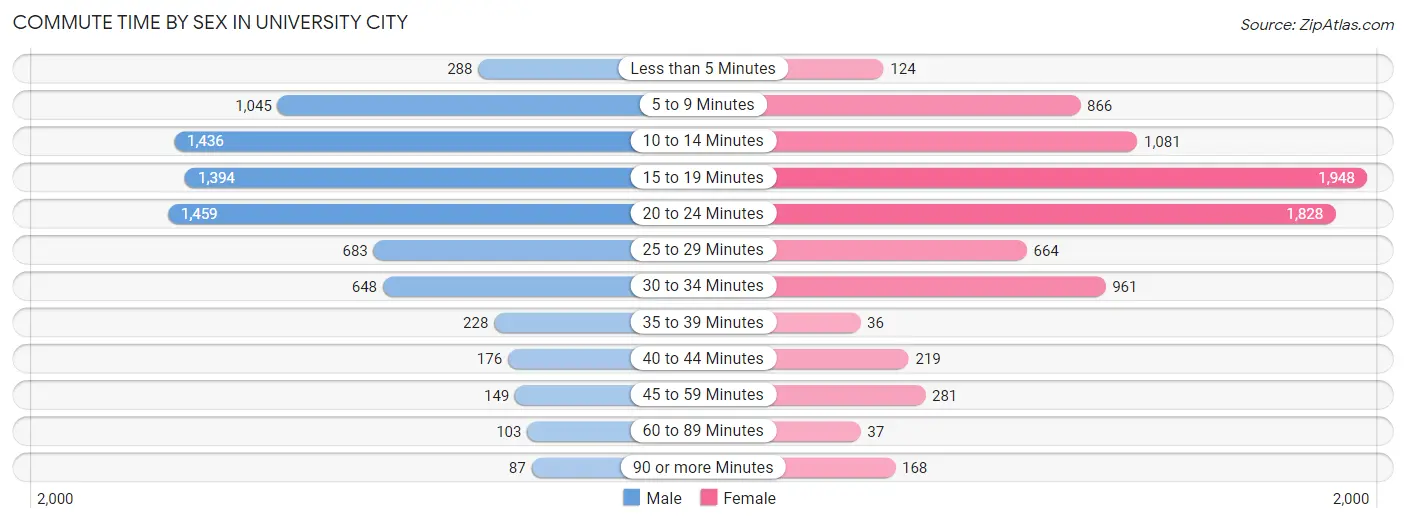
| Commute Time | Male | Female |
| Less than 5 Minutes | 288 (3.7%) | 124 (1.5%) |
| 5 to 9 Minutes | 1,045 (13.6%) | 866 (10.5%) |
| 10 to 14 Minutes | 1,436 (18.7%) | 1,081 (13.2%) |
| 15 to 19 Minutes | 1,394 (18.1%) | 1,948 (23.7%) |
| 20 to 24 Minutes | 1,459 (19.0%) | 1,828 (22.3%) |
| 25 to 29 Minutes | 683 (8.9%) | 664 (8.1%) |
| 30 to 34 Minutes | 648 (8.4%) | 961 (11.7%) |
| 35 to 39 Minutes | 228 (3.0%) | 36 (0.4%) |
| 40 to 44 Minutes | 176 (2.3%) | 219 (2.7%) |
| 45 to 59 Minutes | 149 (1.9%) | 281 (3.4%) |
| 60 to 89 Minutes | 103 (1.3%) | 37 (0.4%) |
| 90 or more Minutes | 87 (1.1%) | 168 (2.1%) |
Time of Departure to Work by Sex in University City
The most frequent times of departure to work in University City are 8:00 AM to 8:29 AM (1,301, 16.9%) for males and 8:00 AM to 8:29 AM (1,335, 16.3%) for females.
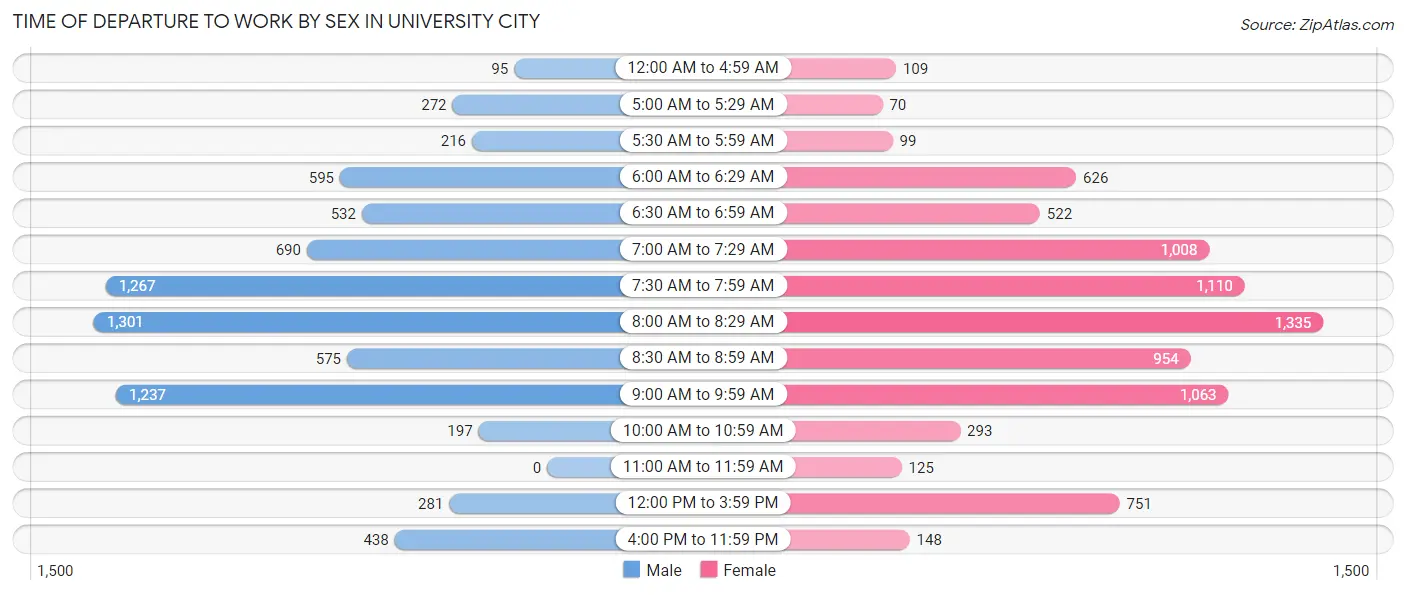
| Time of Departure | Male | Female |
| 12:00 AM to 4:59 AM | 95 (1.2%) | 109 (1.3%) |
| 5:00 AM to 5:29 AM | 272 (3.5%) | 70 (0.9%) |
| 5:30 AM to 5:59 AM | 216 (2.8%) | 99 (1.2%) |
| 6:00 AM to 6:29 AM | 595 (7.7%) | 626 (7.6%) |
| 6:30 AM to 6:59 AM | 532 (6.9%) | 522 (6.4%) |
| 7:00 AM to 7:29 AM | 690 (9.0%) | 1,008 (12.3%) |
| 7:30 AM to 7:59 AM | 1,267 (16.5%) | 1,110 (13.5%) |
| 8:00 AM to 8:29 AM | 1,301 (16.9%) | 1,335 (16.3%) |
| 8:30 AM to 8:59 AM | 575 (7.5%) | 954 (11.6%) |
| 9:00 AM to 9:59 AM | 1,237 (16.1%) | 1,063 (12.9%) |
| 10:00 AM to 10:59 AM | 197 (2.6%) | 293 (3.6%) |
| 11:00 AM to 11:59 AM | 0 (0.0%) | 125 (1.5%) |
| 12:00 PM to 3:59 PM | 281 (3.6%) | 751 (9.1%) |
| 4:00 PM to 11:59 PM | 438 (5.7%) | 148 (1.8%) |
| Total | 7,696 (100.0%) | 8,213 (100.0%) |
Housing Occupancy in University City
Occupancy by Ownership in University City
Of the total 16,796 dwellings in University City, owner-occupied units account for 9,275 (55.2%), while renter-occupied units make up 7,521 (44.8%).
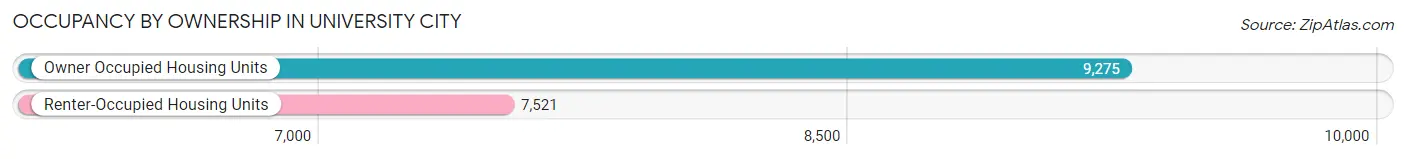
| Occupancy | # Housing Units | % Housing Units |
| Owner Occupied Housing Units | 9,275 | 55.2% |
| Renter-Occupied Housing Units | 7,521 | 44.8% |
| Total Occupied Housing Units | 16,796 | 100.0% |
Occupancy by Household Size in University City
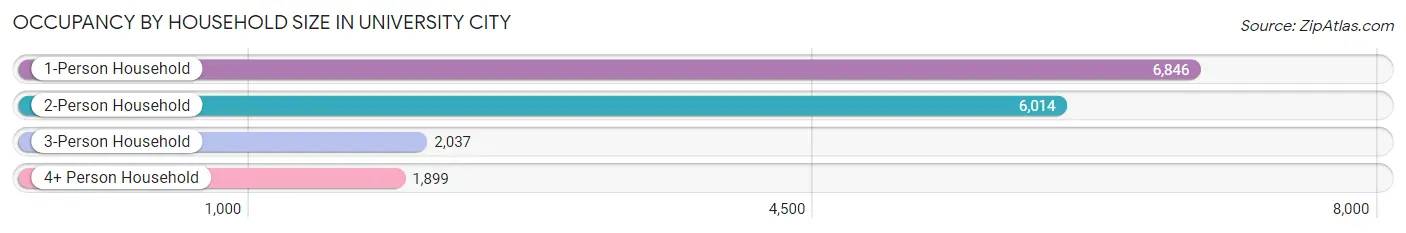
| Household Size | # Housing Units | % Housing Units |
| 1-Person Household | 6,846 | 40.8% |
| 2-Person Household | 6,014 | 35.8% |
| 3-Person Household | 2,037 | 12.1% |
| 4+ Person Household | 1,899 | 11.3% |
| Total Housing Units | 16,796 | 100.0% |
Occupancy by Ownership by Household Size in University City
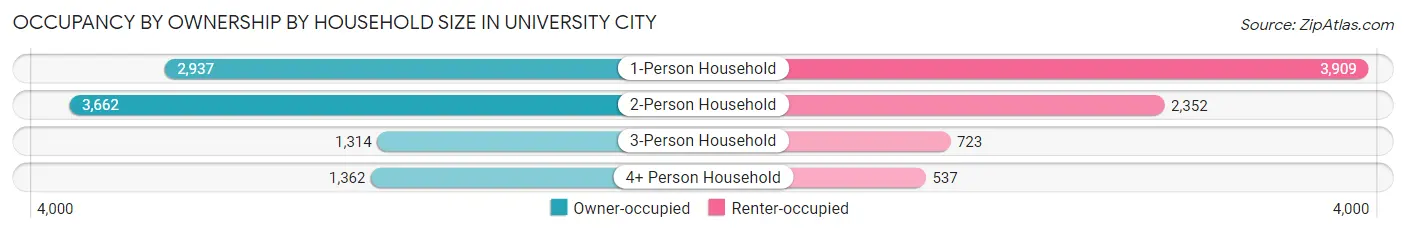
| Household Size | Owner-occupied | Renter-occupied |
| 1-Person Household | 2,937 (42.9%) | 3,909 (57.1%) |
| 2-Person Household | 3,662 (60.9%) | 2,352 (39.1%) |
| 3-Person Household | 1,314 (64.5%) | 723 (35.5%) |
| 4+ Person Household | 1,362 (71.7%) | 537 (28.3%) |
| Total Housing Units | 9,275 (55.2%) | 7,521 (44.8%) |
Occupancy by Educational Attainment in University City
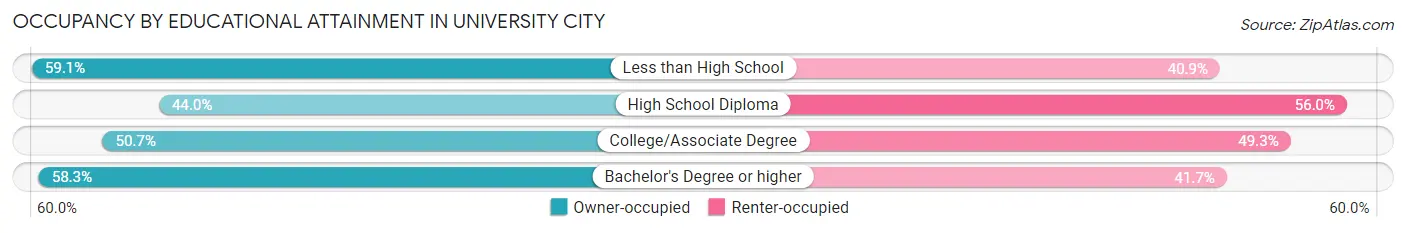
| Household Size | Owner-occupied | Renter-occupied |
| Less than High School | 298 (59.1%) | 206 (40.9%) |
| High School Diploma | 786 (44.0%) | 1,000 (56.0%) |
| College/Associate Degree | 1,785 (50.7%) | 1,734 (49.3%) |
| Bachelor's Degree or higher | 6,406 (58.3%) | 4,581 (41.7%) |
Occupancy by Age of Householder in University City
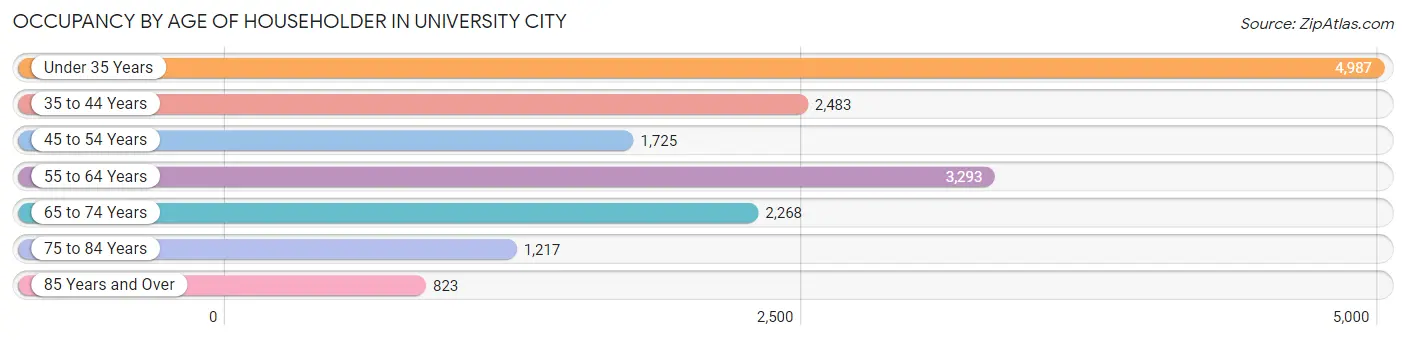
| Age Bracket | # Households | % Households |
| Under 35 Years | 4,987 | 29.7% |
| 35 to 44 Years | 2,483 | 14.8% |
| 45 to 54 Years | 1,725 | 10.3% |
| 55 to 64 Years | 3,293 | 19.6% |
| 65 to 74 Years | 2,268 | 13.5% |
| 75 to 84 Years | 1,217 | 7.2% |
| 85 Years and Over | 823 | 4.9% |
| Total | 16,796 | 100.0% |
Housing Finances in University City
Median Income by Occupancy in University City
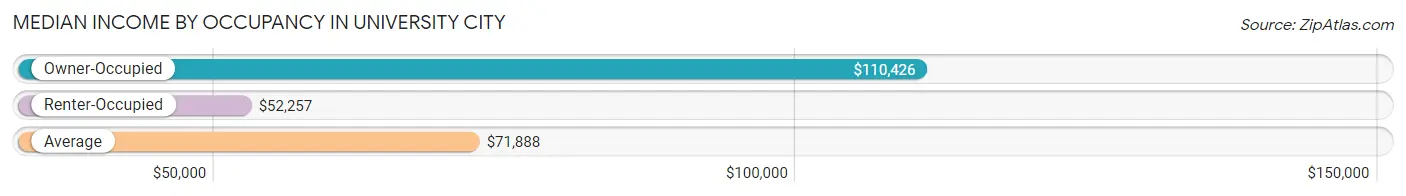
| Occupancy Type | # Households | Median Income |
| Owner-Occupied | 9,275 (55.2%) | $110,426 |
| Renter-Occupied | 7,521 (44.8%) | $52,257 |
| Average | 16,796 (100.0%) | $71,888 |
Occupancy by Householder Income Bracket in University City
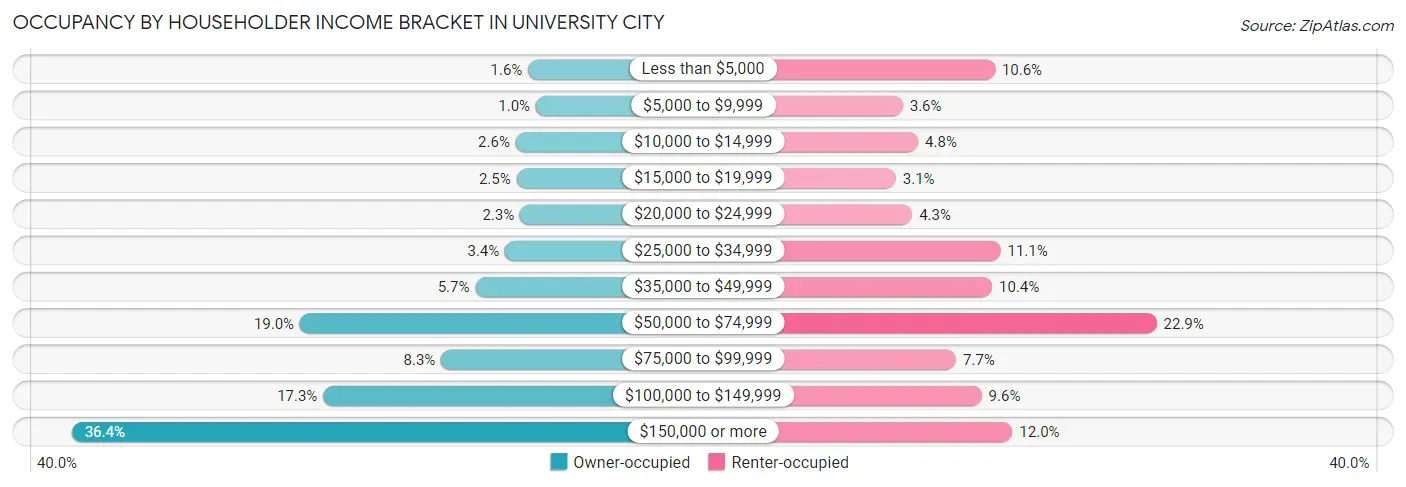
| Income Bracket | Owner-occupied | Renter-occupied |
| Less than $5,000 | 151 (1.6%) | 799 (10.6%) |
| $5,000 to $9,999 | 96 (1.0%) | 271 (3.6%) |
| $10,000 to $14,999 | 239 (2.6%) | 359 (4.8%) |
| $15,000 to $19,999 | 234 (2.5%) | 231 (3.1%) |
| $20,000 to $24,999 | 209 (2.2%) | 325 (4.3%) |
| $25,000 to $34,999 | 314 (3.4%) | 831 (11.1%) |
| $35,000 to $49,999 | 525 (5.7%) | 782 (10.4%) |
| $50,000 to $74,999 | 1,764 (19.0%) | 1,725 (22.9%) |
| $75,000 to $99,999 | 766 (8.3%) | 576 (7.7%) |
| $100,000 to $149,999 | 1,600 (17.2%) | 723 (9.6%) |
| $150,000 or more | 3,377 (36.4%) | 899 (11.9%) |
| Total | 9,275 (100.0%) | 7,521 (100.0%) |
Monthly Housing Cost Tiers in University City
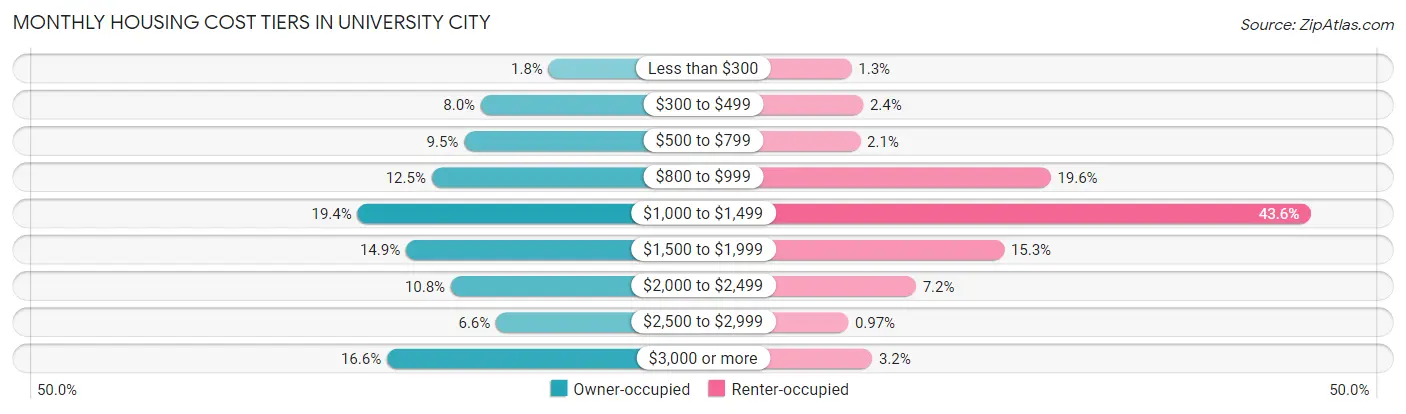
| Monthly Cost | Owner-occupied | Renter-occupied |
| Less than $300 | 162 (1.8%) | 96 (1.3%) |
| $300 to $499 | 741 (8.0%) | 177 (2.4%) |
| $500 to $799 | 884 (9.5%) | 157 (2.1%) |
| $800 to $999 | 1,161 (12.5%) | 1,475 (19.6%) |
| $1,000 to $1,499 | 1,795 (19.4%) | 3,279 (43.6%) |
| $1,500 to $1,999 | 1,381 (14.9%) | 1,153 (15.3%) |
| $2,000 to $2,499 | 997 (10.7%) | 542 (7.2%) |
| $2,500 to $2,999 | 611 (6.6%) | 73 (1.0%) |
| $3,000 or more | 1,543 (16.6%) | 239 (3.2%) |
| Total | 9,275 (100.0%) | 7,521 (100.0%) |
Physical Housing Characteristics in University City
Housing Structures in University City
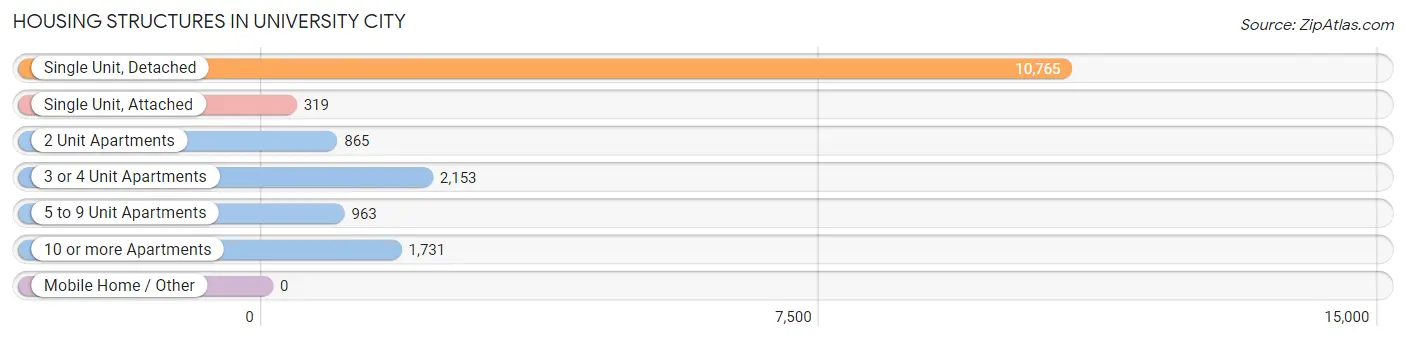
| Structure Type | # Housing Units | % Housing Units |
| Single Unit, Detached | 10,765 | 64.1% |
| Single Unit, Attached | 319 | 1.9% |
| 2 Unit Apartments | 865 | 5.1% |
| 3 or 4 Unit Apartments | 2,153 | 12.8% |
| 5 to 9 Unit Apartments | 963 | 5.7% |
| 10 or more Apartments | 1,731 | 10.3% |
| Mobile Home / Other | 0 | 0.0% |
| Total | 16,796 | 100.0% |
Housing Structures by Occupancy in University City
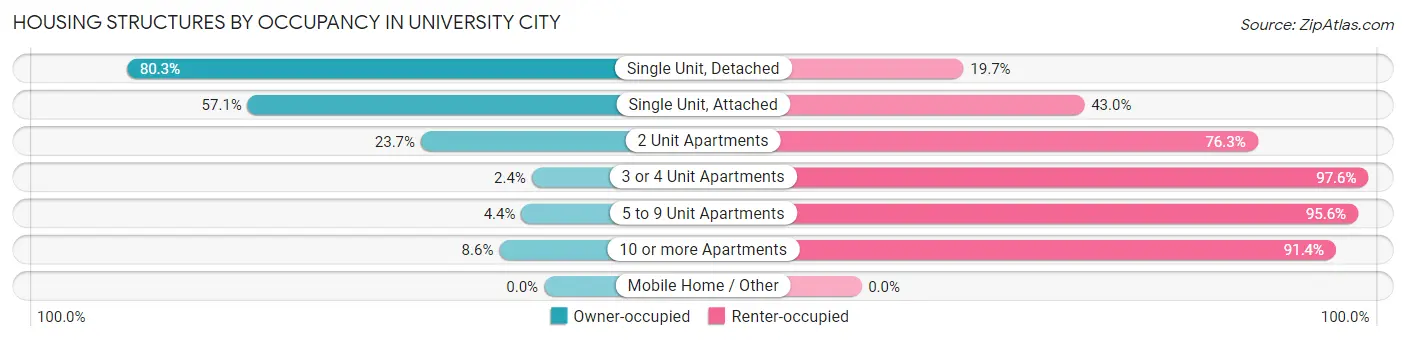
| Structure Type | Owner-occupied | Renter-occupied |
| Single Unit, Detached | 8,646 (80.3%) | 2,119 (19.7%) |
| Single Unit, Attached | 182 (57.1%) | 137 (42.9%) |
| 2 Unit Apartments | 205 (23.7%) | 660 (76.3%) |
| 3 or 4 Unit Apartments | 51 (2.4%) | 2,102 (97.6%) |
| 5 to 9 Unit Apartments | 42 (4.4%) | 921 (95.6%) |
| 10 or more Apartments | 149 (8.6%) | 1,582 (91.4%) |
| Mobile Home / Other | 0 (0.0%) | 0 (0.0%) |
| Total | 9,275 (55.2%) | 7,521 (44.8%) |
Housing Structures by Number of Rooms in University City
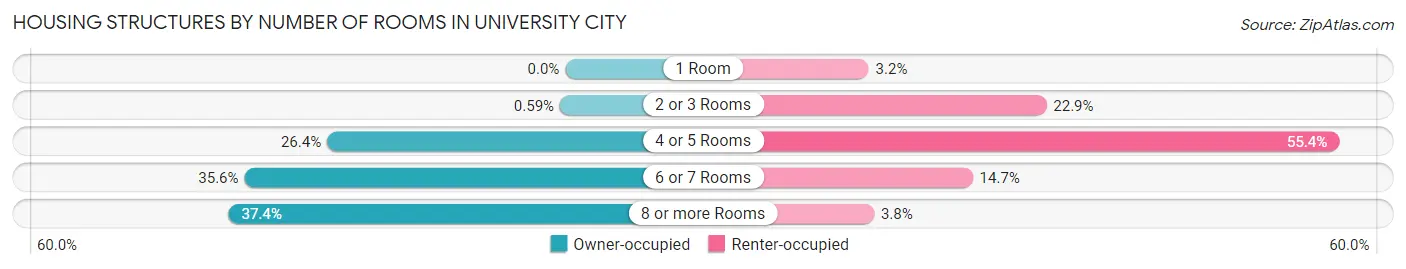
| Number of Rooms | Owner-occupied | Renter-occupied |
| 1 Room | 0 (0.0%) | 240 (3.2%) |
| 2 or 3 Rooms | 55 (0.6%) | 1,723 (22.9%) |
| 4 or 5 Rooms | 2,452 (26.4%) | 4,166 (55.4%) |
| 6 or 7 Rooms | 3,303 (35.6%) | 1,108 (14.7%) |
| 8 or more Rooms | 3,465 (37.4%) | 284 (3.8%) |
| Total | 9,275 (100.0%) | 7,521 (100.0%) |
Housing Structure by Heating Type in University City
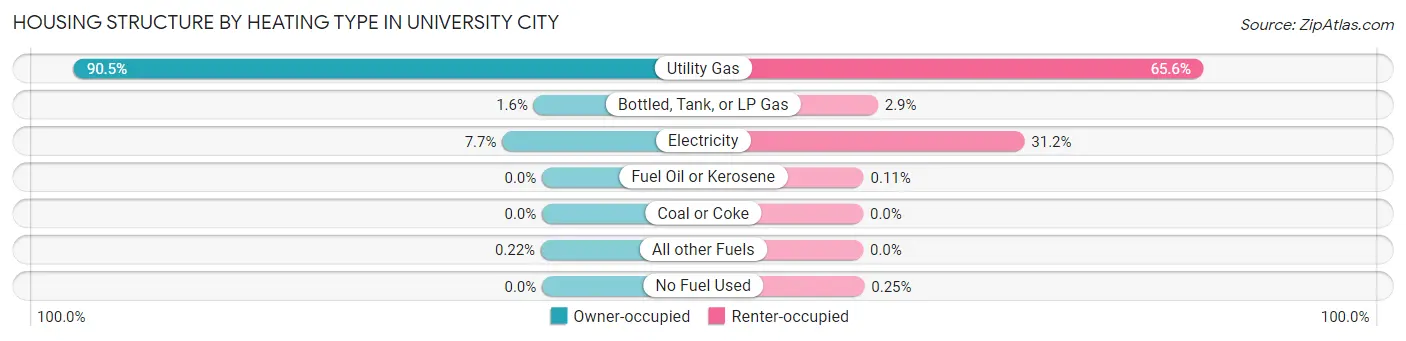
| Heating Type | Owner-occupied | Renter-occupied |
| Utility Gas | 8,393 (90.5%) | 4,936 (65.6%) |
| Bottled, Tank, or LP Gas | 149 (1.6%) | 214 (2.9%) |
| Electricity | 713 (7.7%) | 2,344 (31.2%) |
| Fuel Oil or Kerosene | 0 (0.0%) | 8 (0.1%) |
| Coal or Coke | 0 (0.0%) | 0 (0.0%) |
| All other Fuels | 20 (0.2%) | 0 (0.0%) |
| No Fuel Used | 0 (0.0%) | 19 (0.3%) |
| Total | 9,275 (100.0%) | 7,521 (100.0%) |
Household Vehicle Usage in University City
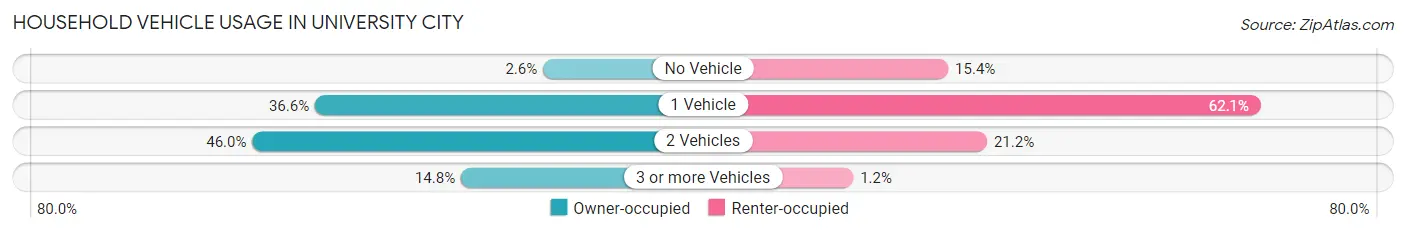
| Vehicles per Household | Owner-occupied | Renter-occupied |
| No Vehicle | 237 (2.6%) | 1,160 (15.4%) |
| 1 Vehicle | 3,397 (36.6%) | 4,672 (62.1%) |
| 2 Vehicles | 4,266 (46.0%) | 1,596 (21.2%) |
| 3 or more Vehicles | 1,375 (14.8%) | 93 (1.2%) |
| Total | 9,275 (100.0%) | 7,521 (100.0%) |
Real Estate & Mortgages in University City
Real Estate and Mortgage Overview in University City
| Characteristic | Without Mortgage | With Mortgage |
| Housing Units | 2,875 | 6,400 |
| Median Property Value | $275,900 | $323,600 |
| Median Household Income | $76,518 | $2,678 |
| Monthly Housing Costs | $741 | $1,543 |
| Real Estate Taxes | $3,274 | $32 |
Property Value by Mortgage Status in University City
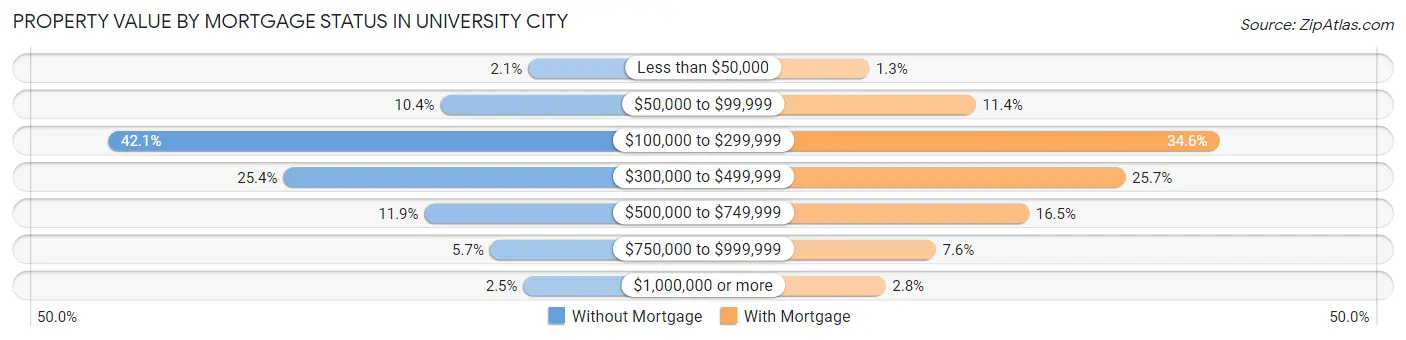
| Property Value | Without Mortgage | With Mortgage |
| Less than $50,000 | 59 (2.1%) | 82 (1.3%) |
| $50,000 to $99,999 | 299 (10.4%) | 732 (11.4%) |
| $100,000 to $299,999 | 1,209 (42.0%) | 2,217 (34.6%) |
| $300,000 to $499,999 | 729 (25.4%) | 1,643 (25.7%) |
| $500,000 to $749,999 | 343 (11.9%) | 1,056 (16.5%) |
| $750,000 to $999,999 | 164 (5.7%) | 488 (7.6%) |
| $1,000,000 or more | 72 (2.5%) | 182 (2.8%) |
| Total | 2,875 (100.0%) | 6,400 (100.0%) |
Household Income by Mortgage Status in University City
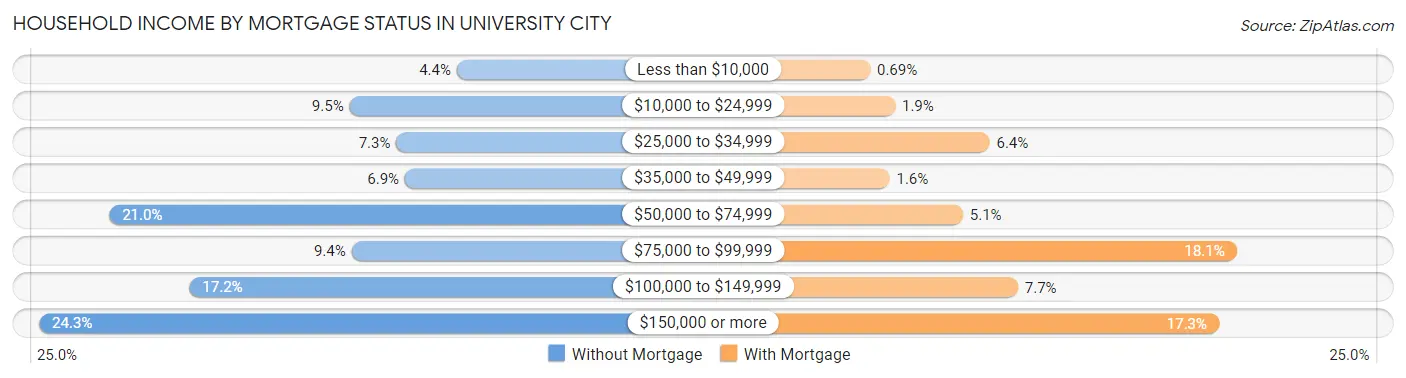
| Household Income | Without Mortgage | With Mortgage |
| Less than $10,000 | 127 (4.4%) | 44 (0.7%) |
| $10,000 to $24,999 | 274 (9.5%) | 120 (1.9%) |
| $25,000 to $34,999 | 210 (7.3%) | 408 (6.4%) |
| $35,000 to $49,999 | 198 (6.9%) | 104 (1.6%) |
| $50,000 to $74,999 | 603 (21.0%) | 327 (5.1%) |
| $75,000 to $99,999 | 271 (9.4%) | 1,161 (18.1%) |
| $100,000 to $149,999 | 493 (17.2%) | 495 (7.7%) |
| $150,000 or more | 699 (24.3%) | 1,107 (17.3%) |
| Total | 2,875 (100.0%) | 6,400 (100.0%) |
Property Value to Household Income Ratio in University City
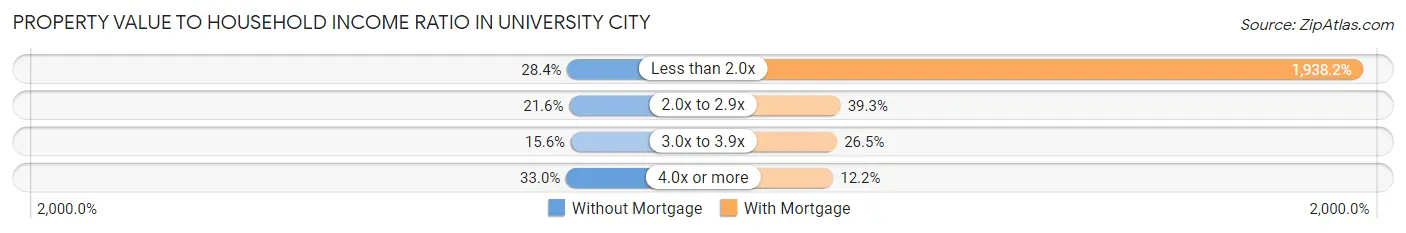
| Value-to-Income Ratio | Without Mortgage | With Mortgage |
| Less than 2.0x | 816 (28.4%) | 124,046 (1,938.2%) |
| 2.0x to 2.9x | 620 (21.6%) | 2,512 (39.3%) |
| 3.0x to 3.9x | 448 (15.6%) | 1,696 (26.5%) |
| 4.0x or more | 948 (33.0%) | 779 (12.2%) |
| Total | 2,875 (100.0%) | 6,400 (100.0%) |
Real Estate Taxes by Mortgage Status in University City
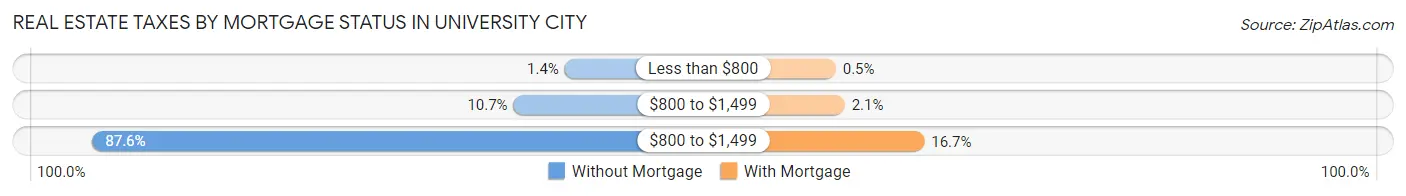
| Property Taxes | Without Mortgage | With Mortgage |
| Less than $800 | 39 (1.4%) | 32 (0.5%) |
| $800 to $1,499 | 308 (10.7%) | 137 (2.1%) |
| $800 to $1,499 | 2,519 (87.6%) | 1,067 (16.7%) |
| Total | 2,875 (100.0%) | 6,400 (100.0%) |
Health & Disability in University City
Health Insurance Coverage by Age in University City
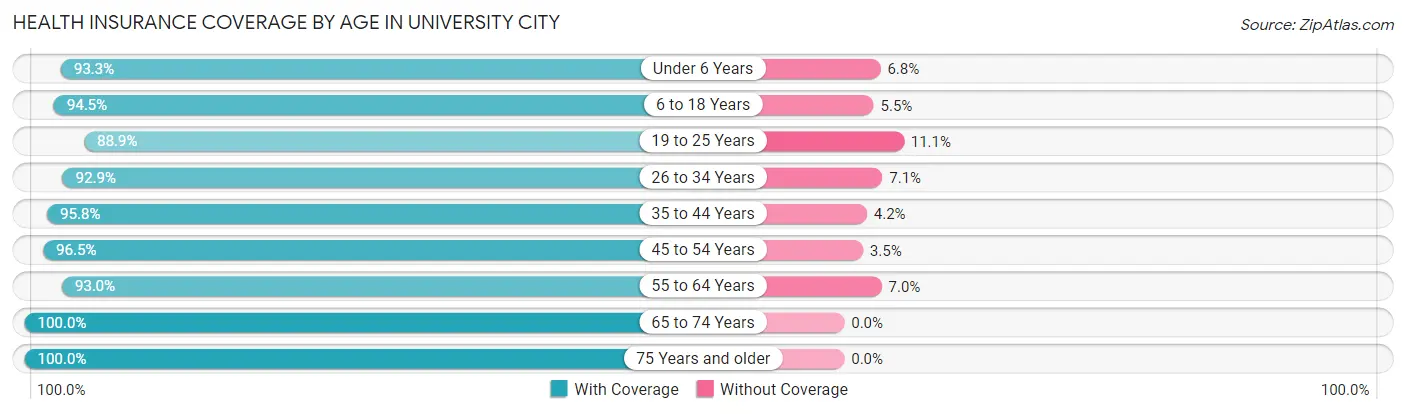
| Age Bracket | With Coverage | Without Coverage |
| Under 6 Years | 2,184 (93.2%) | 158 (6.8%) |
| 6 to 18 Years | 3,791 (94.5%) | 219 (5.5%) |
| 19 to 25 Years | 3,970 (88.9%) | 495 (11.1%) |
| 26 to 34 Years | 4,987 (92.9%) | 381 (7.1%) |
| 35 to 44 Years | 3,903 (95.8%) | 171 (4.2%) |
| 45 to 54 Years | 2,975 (96.5%) | 107 (3.5%) |
| 55 to 64 Years | 4,652 (93.0%) | 348 (7.0%) |
| 65 to 74 Years | 3,641 (100.0%) | 0 (0.0%) |
| 75 Years and older | 2,648 (100.0%) | 0 (0.0%) |
| Total | 32,751 (94.6%) | 1,879 (5.4%) |
Health Insurance Coverage by Citizenship Status in University City
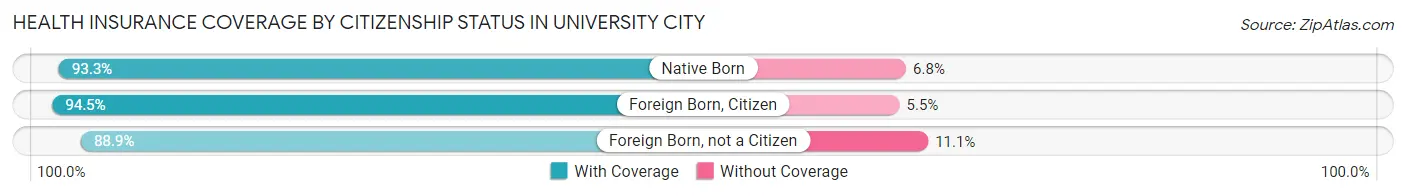
| Citizenship Status | With Coverage | Without Coverage |
| Native Born | 2,184 (93.2%) | 158 (6.8%) |
| Foreign Born, Citizen | 3,791 (94.5%) | 219 (5.5%) |
| Foreign Born, not a Citizen | 3,970 (88.9%) | 495 (11.1%) |
Health Insurance Coverage by Household Income in University City
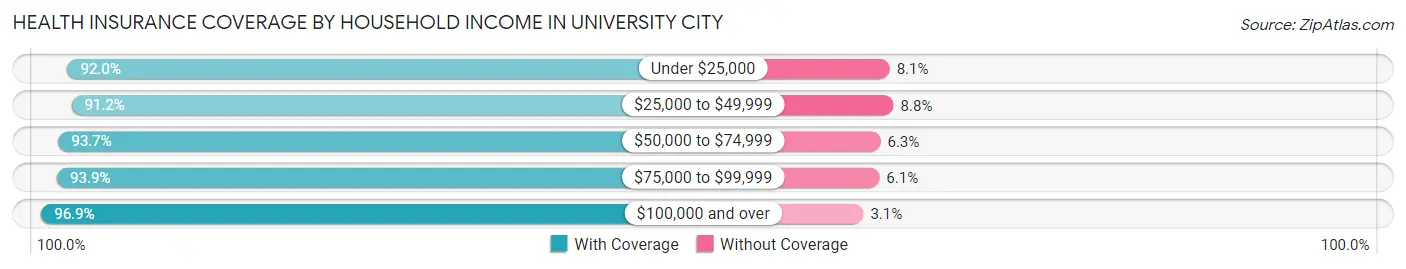
| Household Income | With Coverage | Without Coverage |
| Under $25,000 | 4,205 (91.9%) | 368 (8.1%) |
| $25,000 to $49,999 | 4,507 (91.2%) | 434 (8.8%) |
| $50,000 to $74,999 | 6,095 (93.7%) | 411 (6.3%) |
| $75,000 to $99,999 | 2,476 (93.9%) | 161 (6.1%) |
| $100,000 and over | 14,929 (96.9%) | 483 (3.1%) |
Public vs Private Health Insurance Coverage by Age in University City
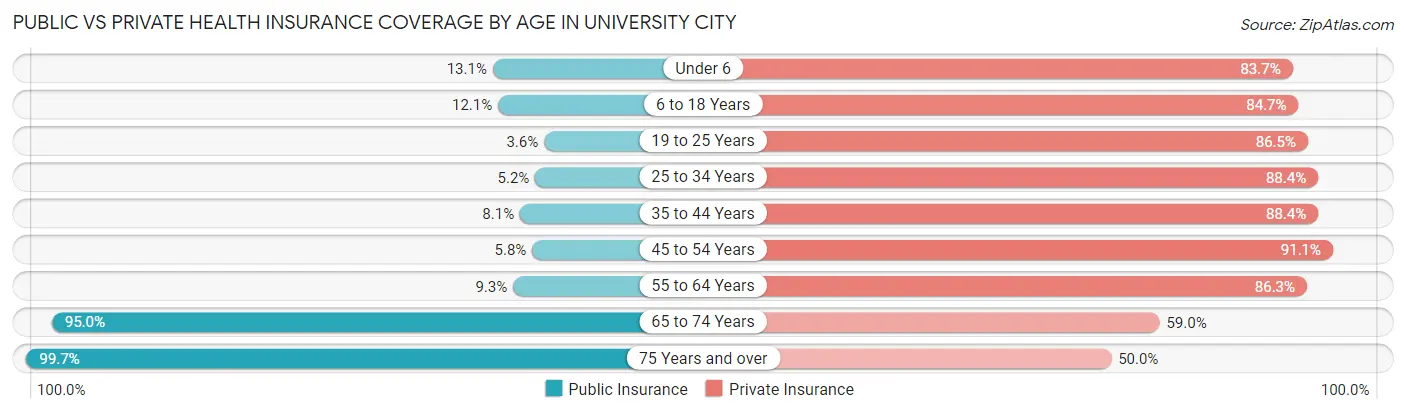
| Age Bracket | Public Insurance | Private Insurance |
| Under 6 | 307 (13.1%) | 1,959 (83.7%) |
| 6 to 18 Years | 486 (12.1%) | 3,398 (84.7%) |
| 19 to 25 Years | 160 (3.6%) | 3,862 (86.5%) |
| 25 to 34 Years | 281 (5.2%) | 4,744 (88.4%) |
| 35 to 44 Years | 328 (8.1%) | 3,601 (88.4%) |
| 45 to 54 Years | 178 (5.8%) | 2,809 (91.1%) |
| 55 to 64 Years | 467 (9.3%) | 4,316 (86.3%) |
| 65 to 74 Years | 3,457 (95.0%) | 2,147 (59.0%) |
| 75 Years and over | 2,639 (99.7%) | 1,324 (50.0%) |
| Total | 8,303 (24.0%) | 28,160 (81.3%) |
Disability Status by Sex by Age in University City
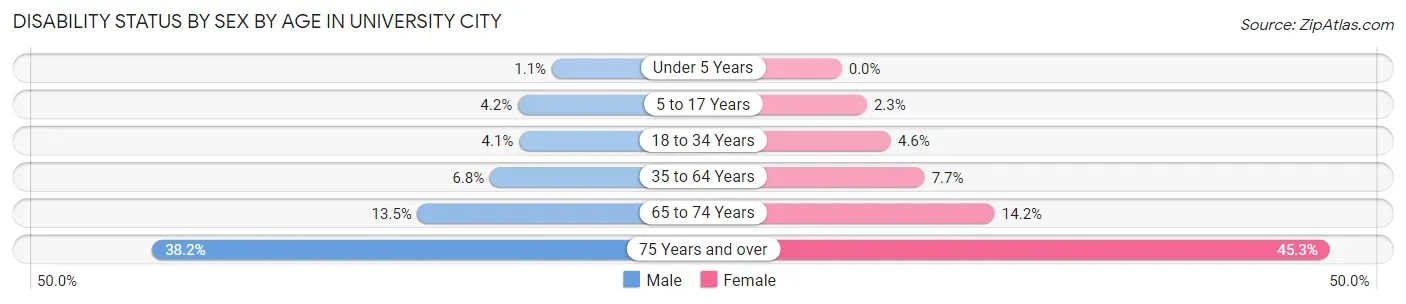
| Age Bracket | Male | Female |
| Under 5 Years | 11 (1.1%) | 0 (0.0%) |
| 5 to 17 Years | 73 (4.2%) | 51 (2.3%) |
| 18 to 34 Years | 182 (4.1%) | 266 (4.6%) |
| 35 to 64 Years | 374 (6.8%) | 513 (7.7%) |
| 65 to 74 Years | 222 (13.5%) | 284 (14.2%) |
| 75 Years and over | 399 (38.2%) | 725 (45.3%) |
Disability Class by Sex by Age in University City
Disability Class: Hearing Difficulty
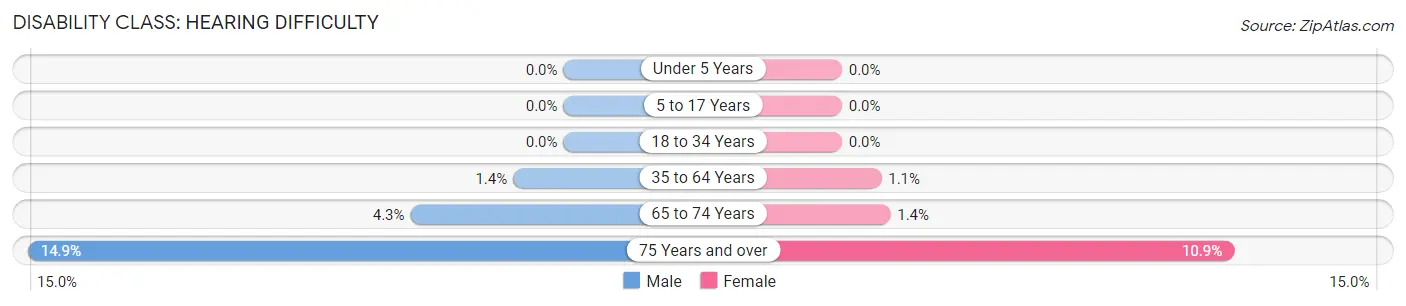
| Age Bracket | Male | Female |
| Under 5 Years | 0 (0.0%) | 0 (0.0%) |
| 5 to 17 Years | 0 (0.0%) | 0 (0.0%) |
| 18 to 34 Years | 0 (0.0%) | 0 (0.0%) |
| 35 to 64 Years | 77 (1.4%) | 73 (1.1%) |
| 65 to 74 Years | 70 (4.3%) | 27 (1.3%) |
| 75 Years and over | 156 (14.9%) | 175 (10.9%) |
Disability Class: Vision Difficulty
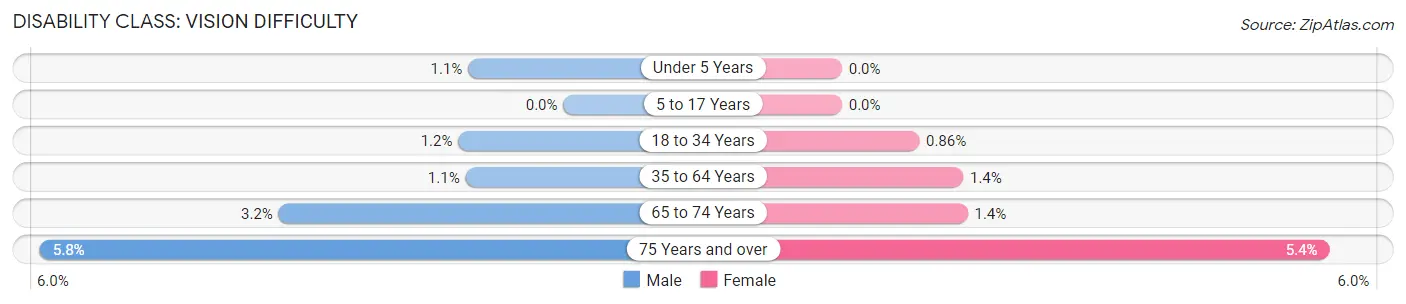
| Age Bracket | Male | Female |
| Under 5 Years | 11 (1.1%) | 0 (0.0%) |
| 5 to 17 Years | 0 (0.0%) | 0 (0.0%) |
| 18 to 34 Years | 52 (1.2%) | 50 (0.9%) |
| 35 to 64 Years | 60 (1.1%) | 90 (1.3%) |
| 65 to 74 Years | 52 (3.2%) | 28 (1.4%) |
| 75 Years and over | 61 (5.8%) | 87 (5.4%) |
Disability Class: Cognitive Difficulty
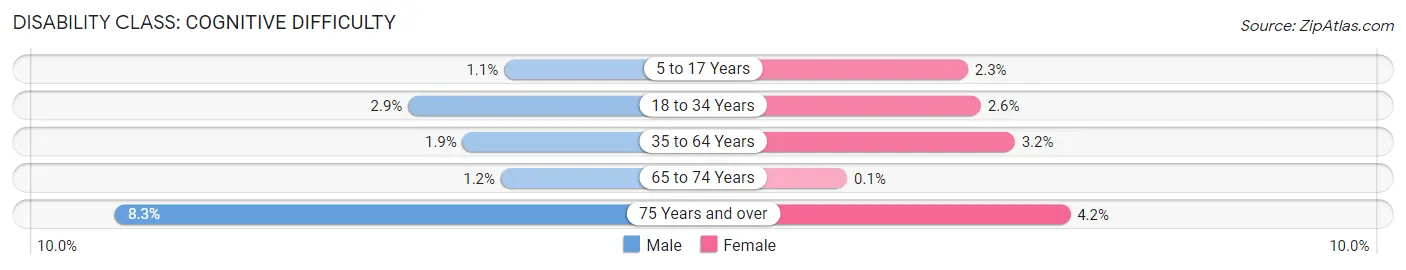
| Age Bracket | Male | Female |
| 5 to 17 Years | 19 (1.1%) | 51 (2.3%) |
| 18 to 34 Years | 128 (2.9%) | 150 (2.6%) |
| 35 to 64 Years | 103 (1.9%) | 214 (3.2%) |
| 65 to 74 Years | 19 (1.2%) | 2 (0.1%) |
| 75 Years and over | 87 (8.3%) | 68 (4.2%) |
Disability Class: Ambulatory Difficulty
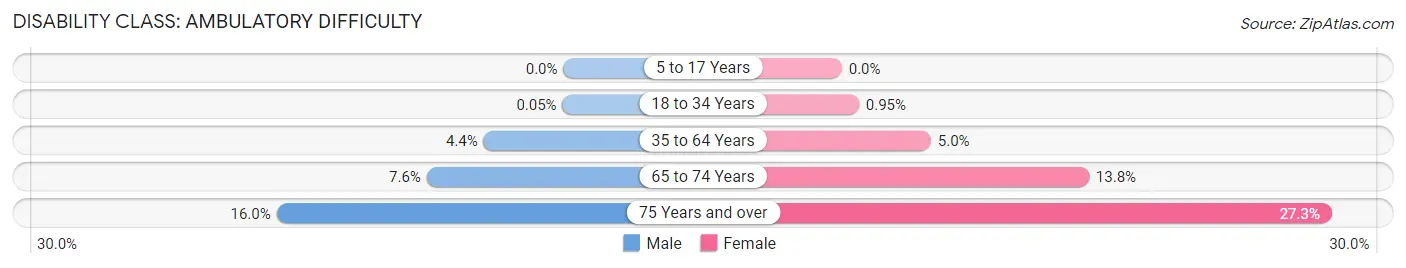
| Age Bracket | Male | Female |
| 5 to 17 Years | 0 (0.0%) | 0 (0.0%) |
| 18 to 34 Years | 2 (0.1%) | 55 (0.9%) |
| 35 to 64 Years | 244 (4.4%) | 330 (5.0%) |
| 65 to 74 Years | 125 (7.6%) | 275 (13.8%) |
| 75 Years and over | 167 (16.0%) | 437 (27.3%) |
Disability Class: Self-Care Difficulty
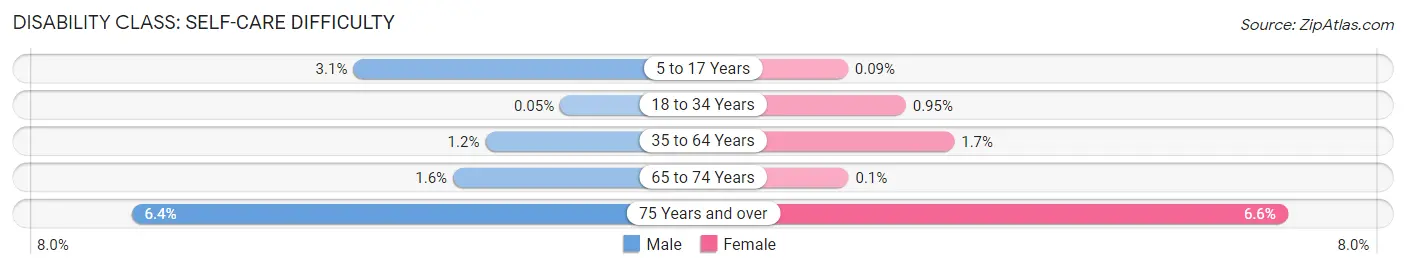
| Age Bracket | Male | Female |
| 5 to 17 Years | 54 (3.1%) | 2 (0.1%) |
| 18 to 34 Years | 2 (0.1%) | 55 (0.9%) |
| 35 to 64 Years | 64 (1.2%) | 111 (1.7%) |
| 65 to 74 Years | 27 (1.6%) | 2 (0.1%) |
| 75 Years and over | 67 (6.4%) | 106 (6.6%) |
Technology Access in University City
Computing Device Access in University City
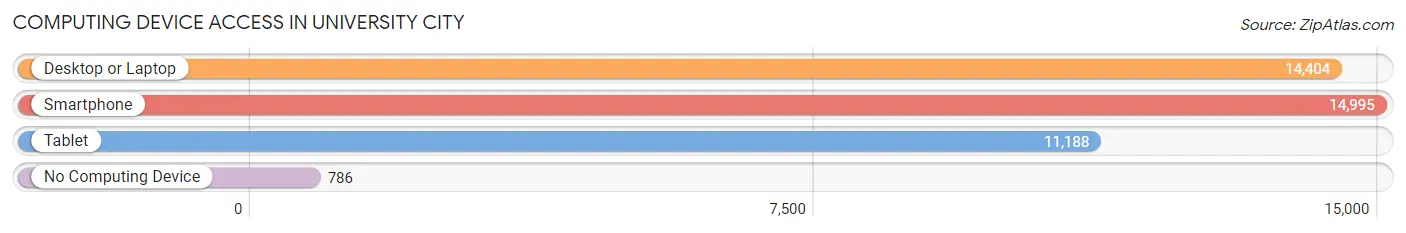
| Device Type | # Households | % Households |
| Desktop or Laptop | 14,404 | 85.8% |
| Smartphone | 14,995 | 89.3% |
| Tablet | 11,188 | 66.6% |
| No Computing Device | 786 | 4.7% |
| Total | 16,796 | 100.0% |
Internet Access in University City
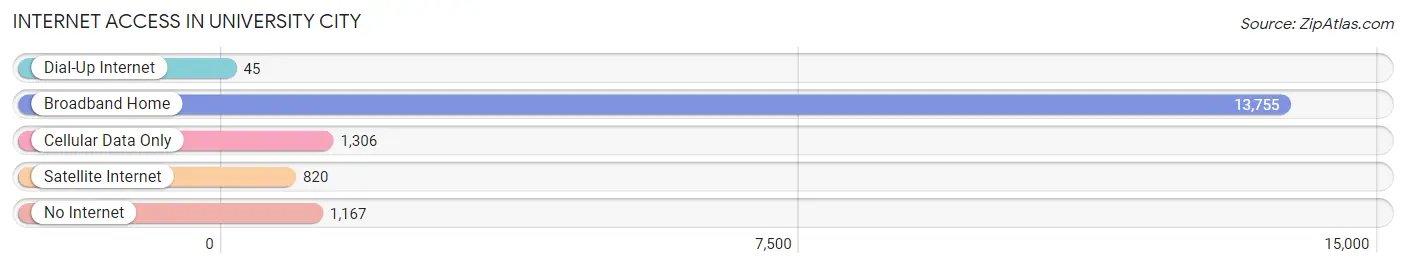
| Internet Type | # Households | % Households |
| Dial-Up Internet | 45 | 0.3% |
| Broadband Home | 13,755 | 81.9% |
| Cellular Data Only | 1,306 | 7.8% |
| Satellite Internet | 820 | 4.9% |
| No Internet | 1,167 | 7.0% |
| Total | 16,796 | 100.0% |
University City Summary
University City, Missouri is a city located in St. Louis County, Missouri, United States. The city is situated on the western edge of St. Louis, and is part of the Greater St. Louis metropolitan area. As of the 2010 census, the city had a population of 35,371.
Geography
University City is located at 38°37′17″N 90°19′20″W (38.6213, -90.3222). According to the United States Census Bureau, the city has a total area of 5.45 square miles (14.11 km2), all land.
History
University City was founded in 1906 by Edward Gardner Lewis, a publisher and entrepreneur. Lewis was a visionary who sought to create a planned community that would be a model for other cities. He named the city after the University of Missouri, which was located in nearby Columbia, Missouri.
The city was designed to be a model of urban planning, with wide streets, ample green space, and a variety of housing types. Lewis also sought to create a city that would be a center of education and culture. He established the University City Public Library, the University City Historical Society, and the University City Arts Council.
Economy
University City is home to a variety of businesses, including retail stores, restaurants, and professional services. The city is also home to several large employers, including Washington University, BJC HealthCare, and Express Scripts.
Demographics
As of the 2010 census, there were 35,371 people, 15,845 households, and 8,945 families residing in the city. The population density was 6,521.3 people per square mile (2,521.2/km2). There were 17,541 housing units at an average density of 3,223.3 per square mile (1,245.2/km2). The racial makeup of the city was 57.2% White, 33.3% African American, 0.3% Native American, 3.2% Asian, 0.1% Pacific Islander, 3.2% from other races, and 2.7% from two or more races. Hispanic or Latino of any race were 6.7% of the population.
There were 15,845 households, out of which 24.2% had children under the age of 18 living with them, 37.2% were married couples living together, 14.2% had a female householder with no husband present, and 44.2% were non-families. 35.2% of all households were made up of individuals, and 10.2% had someone living alone who was 65 years of age or older. The average household size was 2.21 and the average family size was 2.90.
In the city, the population was spread out, with 20.2% under the age of 18, 11.2% from 18 to 24, 30.2% from 25 to 44, 24.2% from 45 to 64, and 14.2% who were 65 years of age or older. The median age was 36 years. For every 100 females, there were 88.2 males. For every 100 females age 18 and over, there were 84.7 males.
The median income for a household in the city was $41,945, and the median income for a family was $54,844. Males had a median income of $41,845 versus $33,945 for females. The per capita income for the city was $27,845. About 8.2% of families and 11.2% of the population were below the poverty line, including 15.2% of those under age 18 and 8.2% of those age 65 or over.
Common Questions
What is Per Capita Income in University City?
Per Capita income in University City is $63,756.
What is the Median Family Income in University City?
Median Family Income in University City is $116,663.
What is the Median Household income in University City?
Median Household Income in University City is $71,888.
What is Income or Wage Gap in University City?
Income or Wage Gap in University City is 34.9%.
Women in University City earn 65.1 cents for every dollar earned by a man.
What is Inequality or Gini Index in University City?
Inequality or Gini Index in University City is 0.57.
What is the Total Population of University City?
Total Population of University City is 34,850.
What is the Total Male Population of University City?
Total Male Population of University City is 15,501.
What is the Total Female Population of University City?
Total Female Population of University City is 19,349.
What is the Ratio of Males per 100 Females in University City?
There are 80.11 Males per 100 Females in University City.
What is the Ratio of Females per 100 Males in University City?
There are 124.82 Females per 100 Males in University City.
What is the Median Population Age in University City?
Median Population Age in University City is 38.4 Years.
What is the Average Family Size in University City
Average Family Size in University City is 2.8 People.
What is the Average Household Size in University City
Average Household Size in University City is 2.0 People.
How Large is the Labor Force in University City?
There are 19,459 People in the Labor Forcein in University City.
What is the Percentage of People in the Labor Force in University City?
65.5% of People are in the Labor Force in University City.
What is the Unemployment Rate in University City?
Unemployment Rate in University City is 2.0%.