Zip Codes with the Highest Percentage of Population Employed in Office & Administration in Laurel, MD
RELATED REPORTS & OPTIONS
Office & Administration
Laurel
Compare Zip Codes
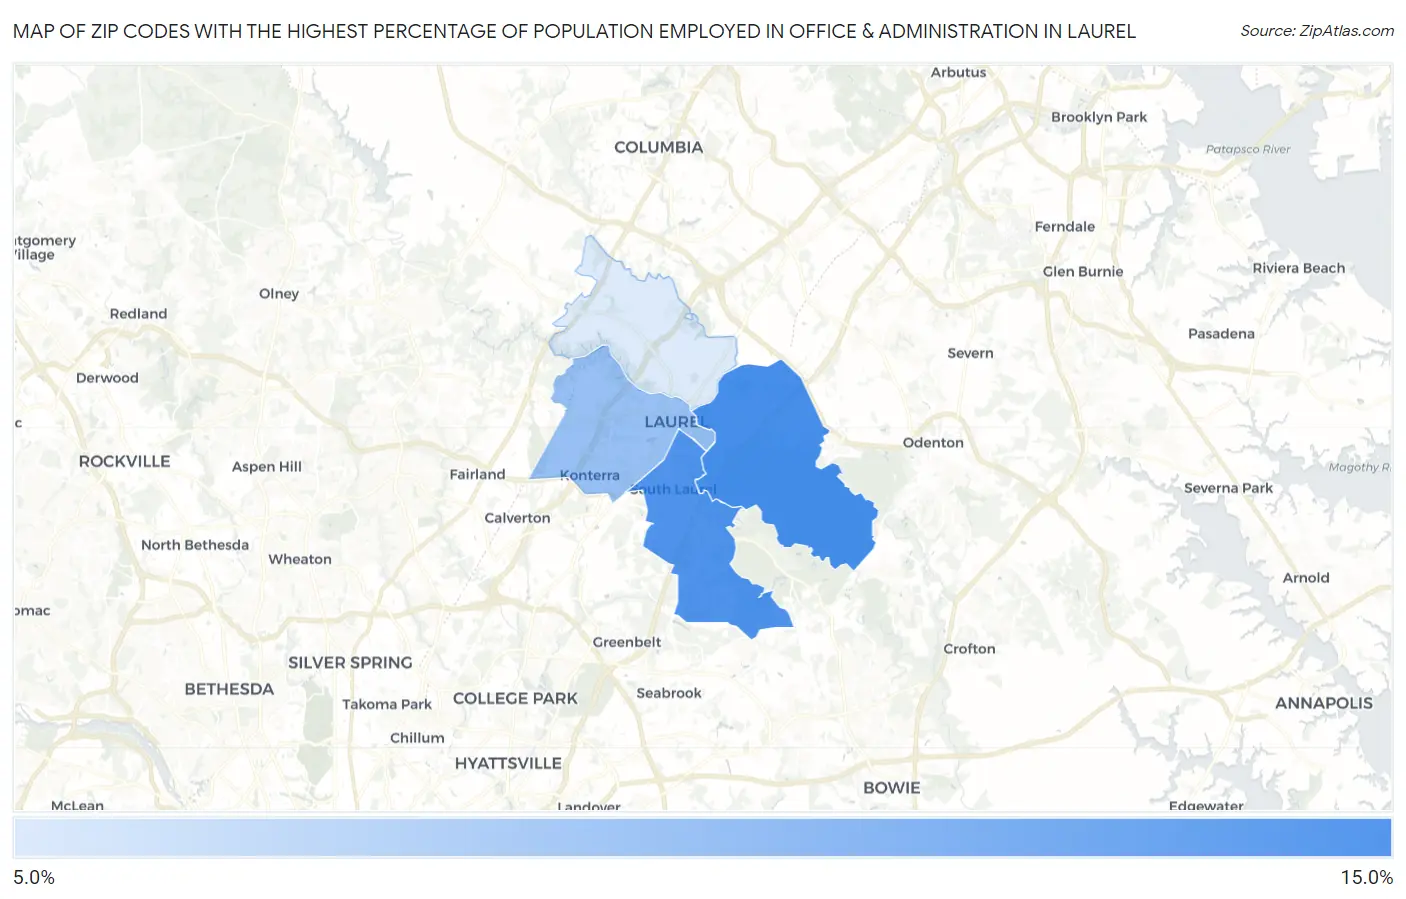
Map of Zip Codes with the Highest Percentage of Population Employed in Office & Administration in Laurel
8.4%
12.6%
Zip Codes with the Highest Percentage of Population Employed in Office & Administration in Laurel, MD
| Zip Code | % Employed | vs State | vs National | |
| 1. | 20724 | 12.6% | 10.4%(+2.26)#126 | 10.9%(+1.79)#8,921 |
| 2. | 20708 | 12.4% | 10.4%(+2.05)#132 | 10.9%(+1.59)#9,449 |
| 3. | 20707 | 10.3% | 10.4%(-0.054)#217 | 10.9%(-0.521)#16,054 |
| 4. | 20723 | 8.4% | 10.4%(-1.95)#291 | 10.9%(-2.42)#21,861 |
1
Common Questions
What are the Top 3 Zip Codes with the Highest Percentage of Population Employed in Office & Administration in Laurel, MD?
Top 3 Zip Codes with the Highest Percentage of Population Employed in Office & Administration in Laurel, MD are:
What zip code has the Highest Percentage of Population Employed in Office & Administration in Laurel, MD?
20724 has the Highest Percentage of Population Employed in Office & Administration in Laurel, MD with 12.6%.
What is the Percentage of Population Employed in Office & Administration in Laurel, MD?
Percentage of Population Employed in Office & Administration in Laurel is 9.9%.
What is the Percentage of Population Employed in Office & Administration in Maryland?
Percentage of Population Employed in Office & Administration in Maryland is 10.4%.
What is the Percentage of Population Employed in Office & Administration in the United States?
Percentage of Population Employed in Office & Administration in the United States is 10.9%.