Zip Codes with the Highest Percentage of Population Employed in Office & Administration in Bowie, MD
RELATED REPORTS & OPTIONS
Office & Administration
Bowie
Compare Zip Codes
Map of Zip Codes with the Highest Percentage of Population Employed in Office & Administration in Bowie
8.2%
14.7%
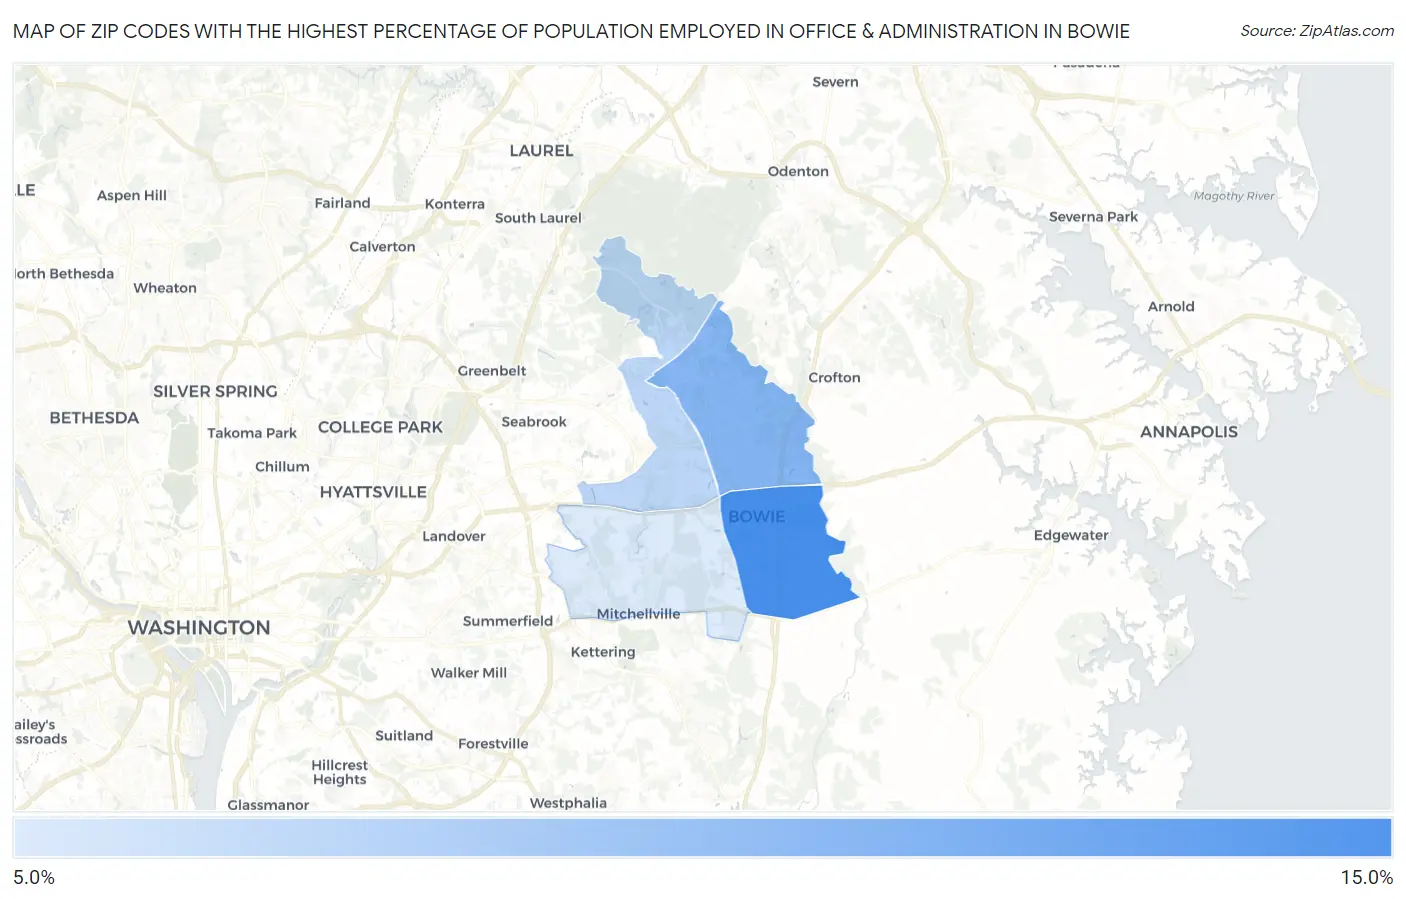
Zip Codes with the Highest Percentage of Population Employed in Office & Administration in Bowie, MD
| Zip Code | % Employed | vs State | vs National | |
| 1. | 20716 | 14.7% | 10.4%(+4.34)#67 | 10.9%(+3.88)#4,924 |
| 2. | 20715 | 11.9% | 10.4%(+1.54)#151 | 10.9%(+1.08)#10,938 |
| 3. | 20720 | 9.6% | 10.4%(-0.760)#248 | 10.9%(-1.23)#18,324 |
| 4. | 20721 | 8.2% | 10.4%(-2.18)#302 | 10.9%(-2.64)#22,494 |
1
Common Questions
What are the Top 3 Zip Codes with the Highest Percentage of Population Employed in Office & Administration in Bowie, MD?
Top 3 Zip Codes with the Highest Percentage of Population Employed in Office & Administration in Bowie, MD are:
What zip code has the Highest Percentage of Population Employed in Office & Administration in Bowie, MD?
20716 has the Highest Percentage of Population Employed in Office & Administration in Bowie, MD with 14.7%.
What is the Percentage of Population Employed in Office & Administration in Bowie, MD?
Percentage of Population Employed in Office & Administration in Bowie is 12.2%.
What is the Percentage of Population Employed in Office & Administration in Maryland?
Percentage of Population Employed in Office & Administration in Maryland is 10.4%.
What is the Percentage of Population Employed in Office & Administration in the United States?
Percentage of Population Employed in Office & Administration in the United States is 10.9%.