Kinloch, MO Map & Demographics
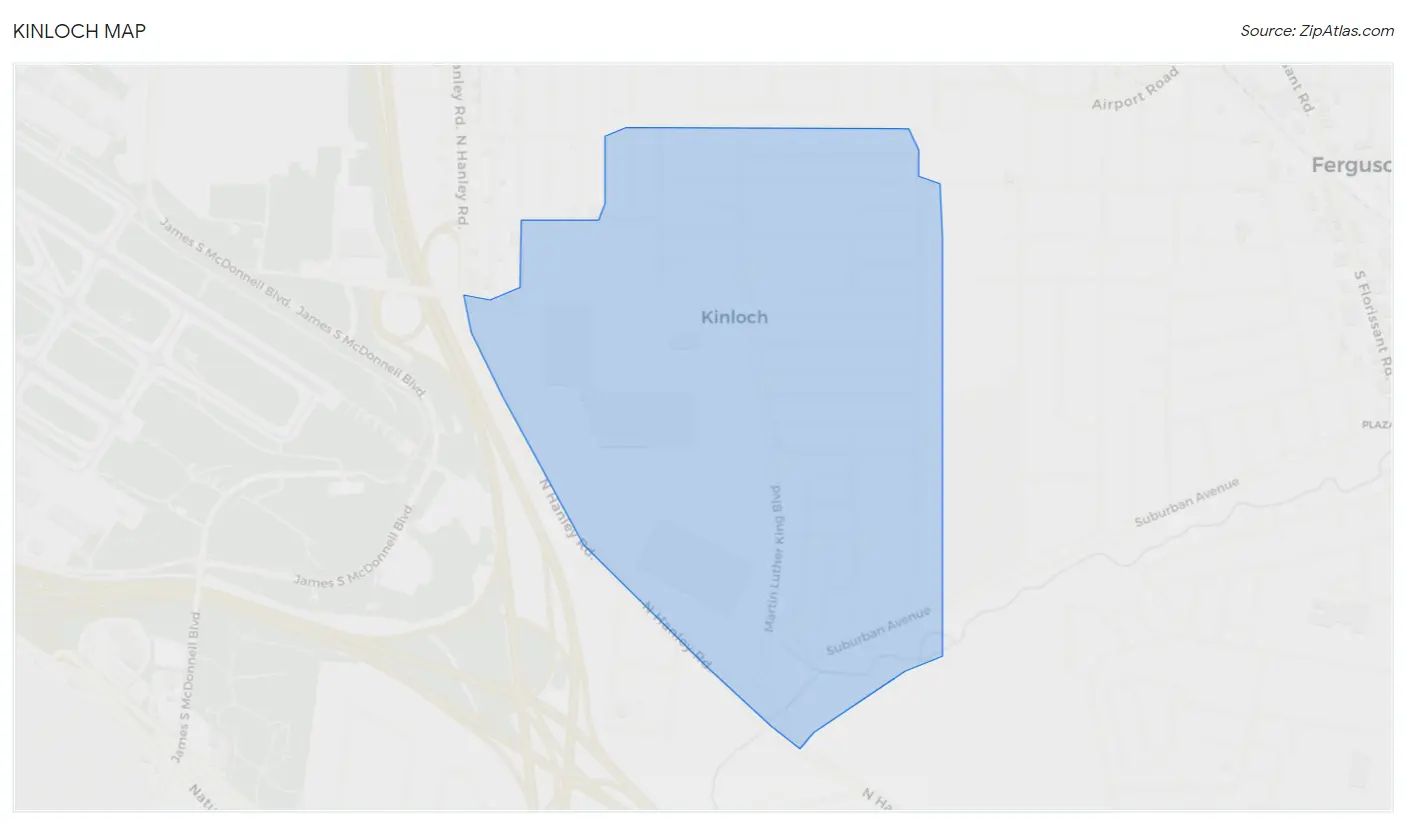
Kinloch Map
Kinloch Overview
$20,810
PER CAPITA INCOME
$30,357
AVG FAMILY INCOME
$38,281
AVG HOUSEHOLD INCOME
9.8%
WAGE / INCOME GAP [ % ]
90.2¢/ $1
WAGE / INCOME GAP [ $ ]
0.40
INEQUALITY / GINI INDEX
291
TOTAL POPULATION
118
MALE POPULATION
173
FEMALE POPULATION
68.21
MALES / 100 FEMALES
146.61
FEMALES / 100 MALES
26.3
MEDIAN AGE
2.8
AVG FAMILY SIZE
2.2
AVG HOUSEHOLD SIZE
177
LABOR FORCE [ PEOPLE ]
73.1%
PERCENT IN LABOR FORCE
1.1%
UNEMPLOYMENT RATE
Kinloch Area Codes
Income in Kinloch
Income Overview in Kinloch
Per Capita Income in Kinloch is $20,810, while median incomes of families and households are $30,357 and $38,281 respectively.
| Characteristic | Number | Measure |
| Per Capita Income | 291 | $20,810 |
| Median Family Income | 56 | $30,357 |
| Mean Family Income | 56 | $32,879 |
| Median Household Income | 127 | $38,281 |
| Mean Household Income | 127 | $44,011 |
| Income Deficit | 56 | $0 |
| Wage / Income Gap (%) | 291 | 9.77% |
| Wage / Income Gap ($) | 291 | 90.23¢ per $1 |
| Gini / Inequality Index | 291 | 0.40 |
Earnings by Sex in Kinloch
Average Earnings in Kinloch are $23,250, $23,750 for men and $21,429 for women, a difference of 9.8%.
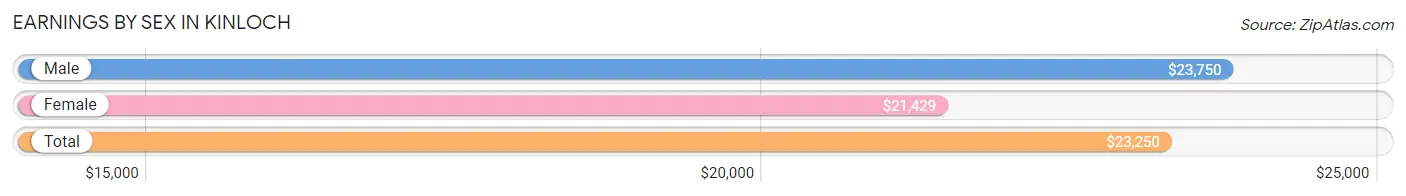
| Sex | Number | Average Earnings |
| Male | 73 (40.8%) | $23,750 |
| Female | 106 (59.2%) | $21,429 |
| Total | 179 (100.0%) | $23,250 |
Earnings by Sex by Income Bracket in Kinloch
The most common earnings brackets in Kinloch are $45,000 to $49,999 for men (18 | 24.7%) and $25,000 to $29,999 for women (15 | 14.1%).
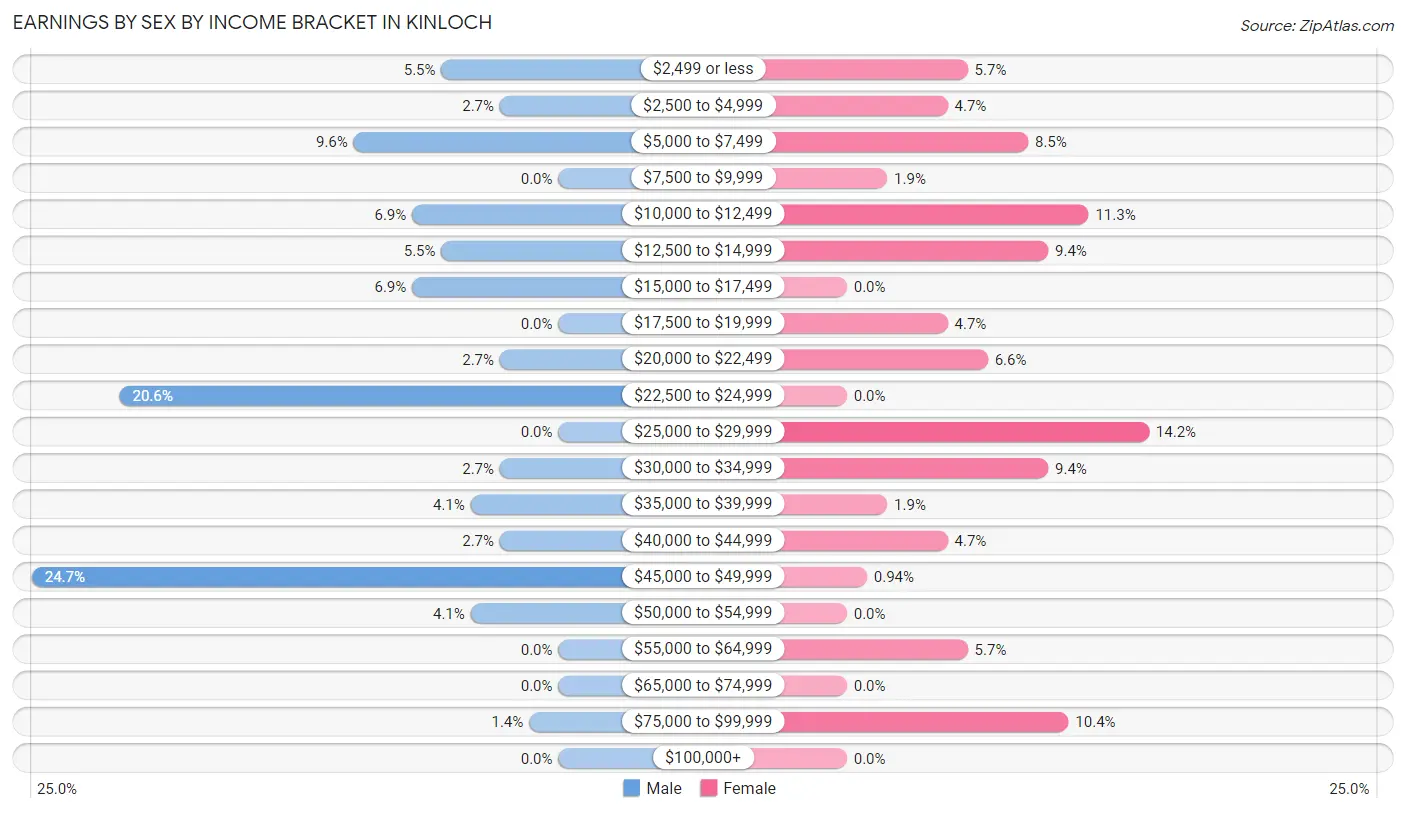
| Income | Male | Female |
| $2,499 or less | 4 (5.5%) | 6 (5.7%) |
| $2,500 to $4,999 | 2 (2.7%) | 5 (4.7%) |
| $5,000 to $7,499 | 7 (9.6%) | 9 (8.5%) |
| $7,500 to $9,999 | 0 (0.0%) | 2 (1.9%) |
| $10,000 to $12,499 | 5 (6.9%) | 12 (11.3%) |
| $12,500 to $14,999 | 4 (5.5%) | 10 (9.4%) |
| $15,000 to $17,499 | 5 (6.9%) | 0 (0.0%) |
| $17,500 to $19,999 | 0 (0.0%) | 5 (4.7%) |
| $20,000 to $22,499 | 2 (2.7%) | 7 (6.6%) |
| $22,500 to $24,999 | 15 (20.5%) | 0 (0.0%) |
| $25,000 to $29,999 | 0 (0.0%) | 15 (14.1%) |
| $30,000 to $34,999 | 2 (2.7%) | 10 (9.4%) |
| $35,000 to $39,999 | 3 (4.1%) | 2 (1.9%) |
| $40,000 to $44,999 | 2 (2.7%) | 5 (4.7%) |
| $45,000 to $49,999 | 18 (24.7%) | 1 (0.9%) |
| $50,000 to $54,999 | 3 (4.1%) | 0 (0.0%) |
| $55,000 to $64,999 | 0 (0.0%) | 6 (5.7%) |
| $65,000 to $74,999 | 0 (0.0%) | 0 (0.0%) |
| $75,000 to $99,999 | 1 (1.4%) | 11 (10.4%) |
| $100,000+ | 0 (0.0%) | 0 (0.0%) |
| Total | 73 (100.0%) | 106 (100.0%) |
Earnings by Sex by Educational Attainment in Kinloch
Average earnings in Kinloch are $38,125 for men and $32,143 for women, a difference of 15.7%. Men with an educational attainment of bachelor's degree enjoy the highest average annual earnings of $38,750, while those with bachelor's degree education earn the least with $38,750. Women with an educational attainment of graduate degree earn the most with the average annual earnings of $76,250, while those with bachelor's degree education have the smallest earnings of $40,250.
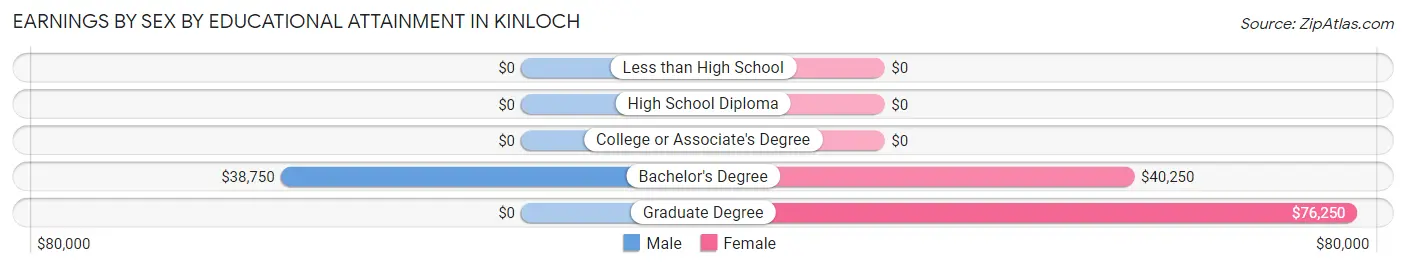
| Educational Attainment | Male Income | Female Income |
| Less than High School | - | - |
| High School Diploma | - | - |
| College or Associate's Degree | - | - |
| Bachelor's Degree | $38,750 | $40,250 |
| Graduate Degree | - | - |
| Total | $38,125 | $32,143 |
Family Income in Kinloch
Family Income Brackets in Kinloch
According to the Kinloch family income data, there are 13 families falling into the $15,000 to $24,999 income range, which is the most common income bracket and makes up 23.2% of all families.
| Income Bracket | # Families | % Families |
| Less than $10,000 | 12 | 21.4% |
| $10,000 to $14,999 | 2 | 3.6% |
| $15,000 to $24,999 | 13 | 23.2% |
| $25,000 to $34,999 | 7 | 12.5% |
| $35,000 to $49,999 | 12 | 21.4% |
| $50,000 to $74,999 | 2 | 3.6% |
| $75,000 to $99,999 | 8 | 14.3% |
| $100,000 to $149,999 | 0 | 0.0% |
| $150,000 to $199,999 | 0 | 0.0% |
| $200,000+ | 0 | 0.0% |
Family Income by Famaliy Size in Kinloch
2-person families (45 | 80.4%) account for the highest median family income in Kinloch with $32,321 per family, while 2-person families (45 | 80.4%) have the highest median income of $16,160 per family member.
| Income Bracket | # Families | Median Income |
| 2-Person Families | 45 (80.4%) | $32,321 |
| 3-Person Families | 6 (10.7%) | $0 |
| 4-Person Families | 0 (0.0%) | $0 |
| 5-Person Families | 0 (0.0%) | $0 |
| 6-Person Families | 5 (8.9%) | $0 |
| 7+ Person Families | 0 (0.0%) | $0 |
| Total | 56 (100.0%) | $30,357 |
Family Income by Number of Earners in Kinloch
| Number of Earners | # Families | Median Income |
| No Earners | 16 (28.6%) | $0 |
| 1 Earner | 28 (50.0%) | $30,714 |
| 2 Earners | 11 (19.6%) | $0 |
| 3+ Earners | 1 (1.8%) | $0 |
| Total | 56 (100.0%) | $30,357 |
Household Income in Kinloch
Household Income Brackets in Kinloch
With 28 households falling in the category, the $35,000 to $49,999 income range is the most frequent in Kinloch, accounting for 22.1% of all households.
| Income Bracket | # Households | % Households |
| Less than $10,000 | 18 | 14.2% |
| $10,000 to $14,999 | 3 | 2.4% |
| $15,000 to $24,999 | 22 | 17.3% |
| $25,000 to $34,999 | 14 | 11.0% |
| $35,000 to $49,999 | 28 | 22.0% |
| $50,000 to $74,999 | 14 | 11.0% |
| $75,000 to $99,999 | 26 | 20.5% |
| $100,000 to $149,999 | 2 | 1.6% |
| $150,000 to $199,999 | 0 | 0.0% |
| $200,000+ | 0 | 0.0% |
Household Income by Householder Age in Kinloch
The median household income in Kinloch is $38,281, with the highest median household income of $46,806 found in the 65+ years age bracket for the primary householder. A total of 21 households (16.5%) fall into this category. Meanwhile, the 45 to 64 years age bracket for the primary householder has the lowest median household income of $0, with 24 households (18.9%) in this group.
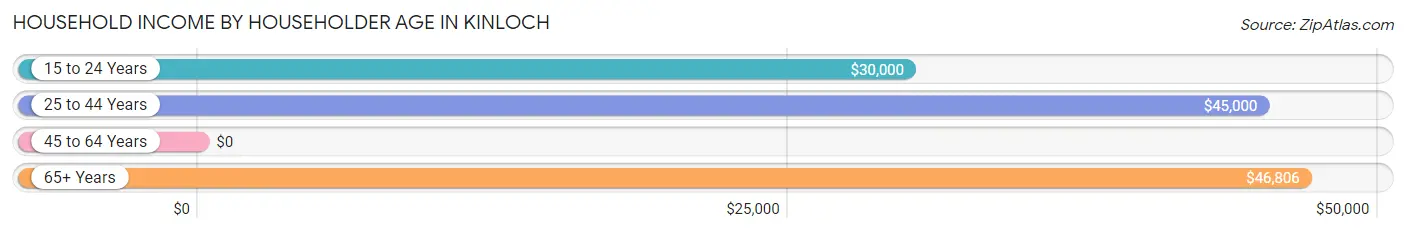
| Income Bracket | # Households | Median Income |
| 15 to 24 Years | 38 (29.9%) | $30,000 |
| 25 to 44 Years | 44 (34.6%) | $45,000 |
| 45 to 64 Years | 24 (18.9%) | $0 |
| 65+ Years | 21 (16.5%) | $46,806 |
| Total | 127 (100.0%) | $38,281 |
Poverty in Kinloch
Income Below Poverty by Sex and Age in Kinloch
With 42.4% poverty level for males and 56.1% for females among the residents of Kinloch, under 5 year old males and under 5 year old females are the most vulnerable to poverty, with 9 males (100.0%) and 9 females (100.0%) in their respective age groups living below the poverty level.
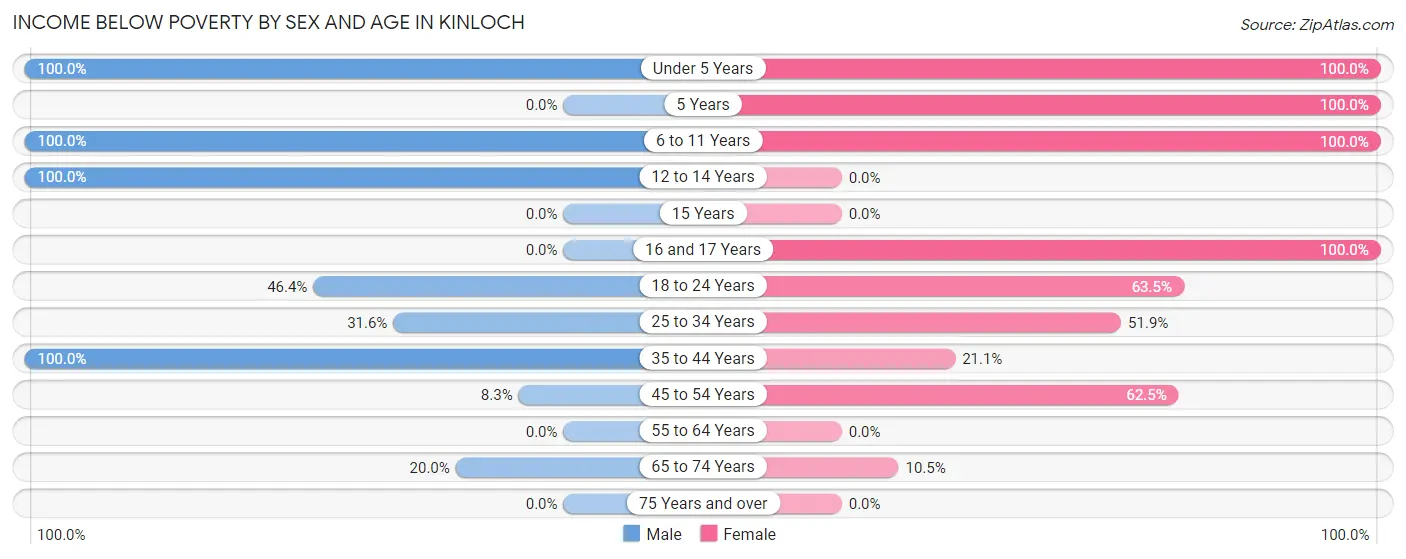
| Age Bracket | Male | Female |
| Under 5 Years | 9 (100.0%) | 9 (100.0%) |
| 5 Years | 0 (0.0%) | 6 (100.0%) |
| 6 to 11 Years | 2 (100.0%) | 15 (100.0%) |
| 12 to 14 Years | 8 (100.0%) | 0 (0.0%) |
| 15 Years | 0 (0.0%) | 0 (0.0%) |
| 16 and 17 Years | 0 (0.0%) | 4 (100.0%) |
| 18 to 24 Years | 13 (46.4%) | 33 (63.5%) |
| 25 to 34 Years | 6 (31.6%) | 14 (51.8%) |
| 35 to 44 Years | 8 (100.0%) | 4 (21.0%) |
| 45 to 54 Years | 2 (8.3%) | 10 (62.5%) |
| 55 to 64 Years | 0 (0.0%) | 0 (0.0%) |
| 65 to 74 Years | 2 (20.0%) | 2 (10.5%) |
| 75 Years and over | 0 (0.0%) | 0 (0.0%) |
| Total | 50 (42.4%) | 97 (56.1%) |
Income Above Poverty by Sex and Age in Kinloch
According to the poverty statistics in Kinloch, males aged 55 to 64 years and females aged 55 to 64 years are the age groups that are most secure financially, with 100.0% of males and 100.0% of females in these age groups living above the poverty line.
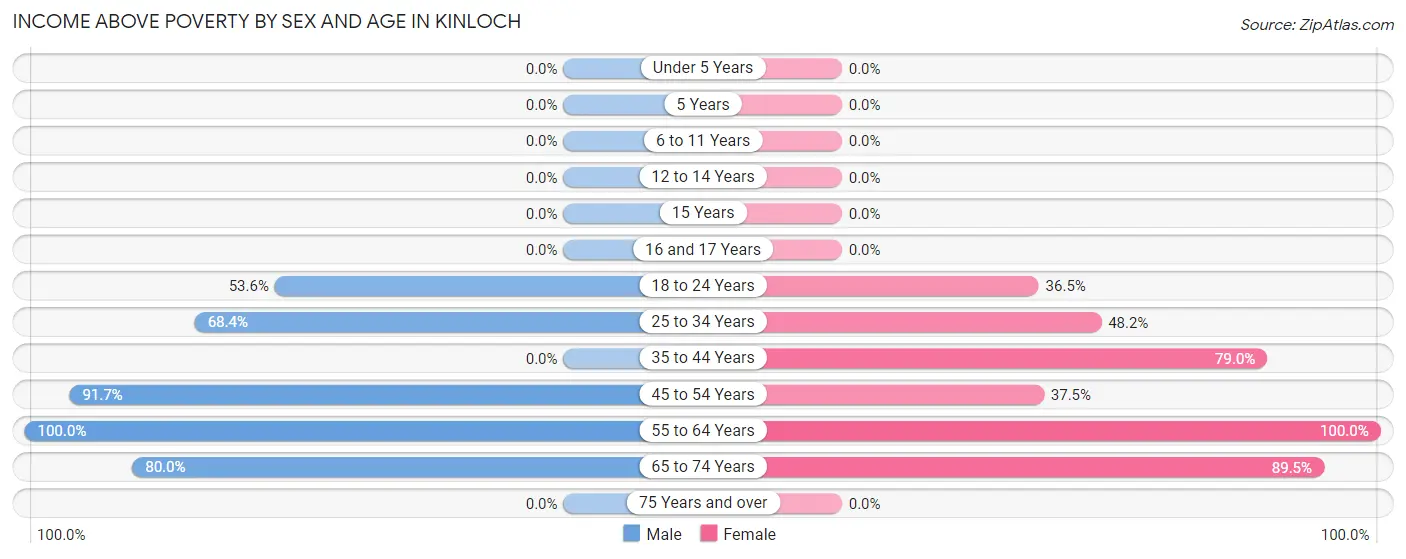
| Age Bracket | Male | Female |
| Under 5 Years | 0 (0.0%) | 0 (0.0%) |
| 5 Years | 0 (0.0%) | 0 (0.0%) |
| 6 to 11 Years | 0 (0.0%) | 0 (0.0%) |
| 12 to 14 Years | 0 (0.0%) | 0 (0.0%) |
| 15 Years | 0 (0.0%) | 0 (0.0%) |
| 16 and 17 Years | 0 (0.0%) | 0 (0.0%) |
| 18 to 24 Years | 15 (53.6%) | 19 (36.5%) |
| 25 to 34 Years | 13 (68.4%) | 13 (48.1%) |
| 35 to 44 Years | 0 (0.0%) | 15 (78.9%) |
| 45 to 54 Years | 22 (91.7%) | 6 (37.5%) |
| 55 to 64 Years | 10 (100.0%) | 6 (100.0%) |
| 65 to 74 Years | 8 (80.0%) | 17 (89.5%) |
| 75 Years and over | 0 (0.0%) | 0 (0.0%) |
| Total | 68 (57.6%) | 76 (43.9%) |
Income Below Poverty Among Married-Couple Families in Kinloch
The poverty statistics for married-couple families in Kinloch show that 16.7% or 4 of the total 24 families live below the poverty line. Families with no children have the highest poverty rate of 16.7%, comprising of 4 families. On the other hand, families with no children have the lowest poverty rate of 16.7%, which includes 4 families.
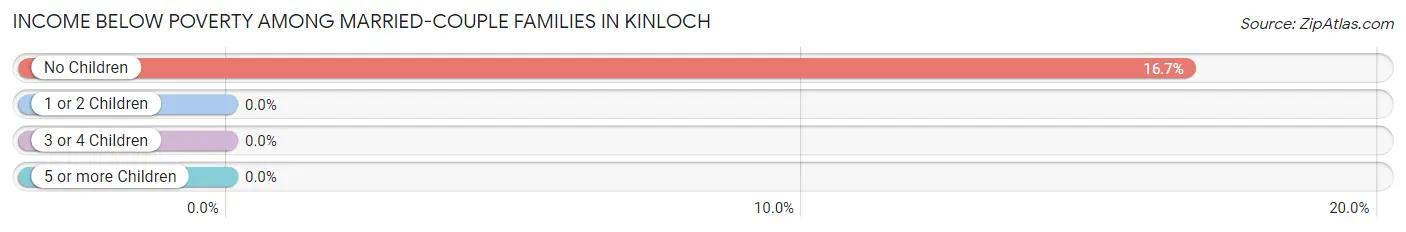
| Children | Above Poverty | Below Poverty |
| No Children | 20 (83.3%) | 4 (16.7%) |
| 1 or 2 Children | 0 (0.0%) | 0 (0.0%) |
| 3 or 4 Children | 0 (0.0%) | 0 (0.0%) |
| 5 or more Children | 0 (0.0%) | 0 (0.0%) |
| Total | 20 (83.3%) | 4 (16.7%) |
Income Below Poverty Among Single-Parent Households in Kinloch
| Children | Single Father | Single Mother |
| No Children | 0 (0.0%) | 1 (10.0%) |
| 1 or 2 Children | 0 (0.0%) | 15 (100.0%) |
| 3 or 4 Children | 0 (0.0%) | 0 (0.0%) |
| 5 or more Children | 0 (0.0%) | 5 (100.0%) |
| Total | 0 (0.0%) | 21 (70.0%) |
Income Below Poverty Among Married-Couple vs Single-Parent Households in Kinloch
The poverty data for Kinloch shows that 4 of the married-couple family households (16.7%) and 21 of the single-parent households (65.6%) are living below the poverty level. Within the married-couple family households, those with no children have the highest poverty rate, with 4 households (16.7%) falling below the poverty line. Among the single-parent households, those with 1 or 2 children have the highest poverty rate, with 15 household (100.0%) living below poverty.
| Children | Married-Couple Families | Single-Parent Households |
| No Children | 4 (16.7%) | 1 (8.3%) |
| 1 or 2 Children | 0 (0.0%) | 15 (100.0%) |
| 3 or 4 Children | 0 (0.0%) | 0 (0.0%) |
| 5 or more Children | 0 (0.0%) | 5 (100.0%) |
| Total | 4 (16.7%) | 21 (65.6%) |
Race in Kinloch
The most populous races in Kinloch are Black / African American (147 | 50.5%), White / Caucasian (119 | 40.9%), and Hispanic or Latino (42 | 14.4%).
| Race | # Population | % Population |
| Asian | 2 | 0.7% |
| Black / African American | 147 | 50.5% |
| Hawaiian / Pacific | 6 | 2.1% |
| Hispanic or Latino | 42 | 14.4% |
| Native / Alaskan | 5 | 1.7% |
| White / Caucasian | 119 | 40.9% |
| Two or more Races | 11 | 3.8% |
| Some other Race | 1 | 0.3% |
| Total | 291 | 100.0% |
Ancestry in Kinloch
The most populous ancestries reported in Kinloch are Mexican (42 | 14.4%), Irish (27 | 9.3%), German (21 | 7.2%), English (15 | 5.1%), and French (8 | 2.8%), together accounting for 38.8% of all Kinloch residents.
| Ancestry | # Population | % Population |
| African | 2 | 0.7% |
| American | 2 | 0.7% |
| British | 2 | 0.7% |
| Central American Indian | 1 | 0.3% |
| Cherokee | 2 | 0.7% |
| English | 15 | 5.1% |
| French | 8 | 2.8% |
| French Canadian | 2 | 0.7% |
| German | 21 | 7.2% |
| Guamanian / Chamorro | 1 | 0.3% |
| Hungarian | 2 | 0.7% |
| Indian (Asian) | 2 | 0.7% |
| Irish | 27 | 9.3% |
| Italian | 2 | 0.7% |
| Jamaican | 2 | 0.7% |
| Marshallese | 5 | 1.7% |
| Mexican | 42 | 14.4% |
| Northern European | 2 | 0.7% |
| Polish | 2 | 0.7% |
| Russian | 3 | 1.0% |
| Senegalese | 3 | 1.0% |
| Sioux | 6 | 2.1% |
| Subsaharan African | 5 | 1.7% |
| Welsh | 2 | 0.7% | View All 24 Rows |
Immigrants in Kinloch
The most numerous immigrant groups reported in Kinloch came from Central America (5 | 1.7%), Latin America (5 | 1.7%), Mexico (5 | 1.7%), Micronesia (5 | 1.7%), and Oceania (5 | 1.7%), together accounting for 8.6% of all Kinloch residents.
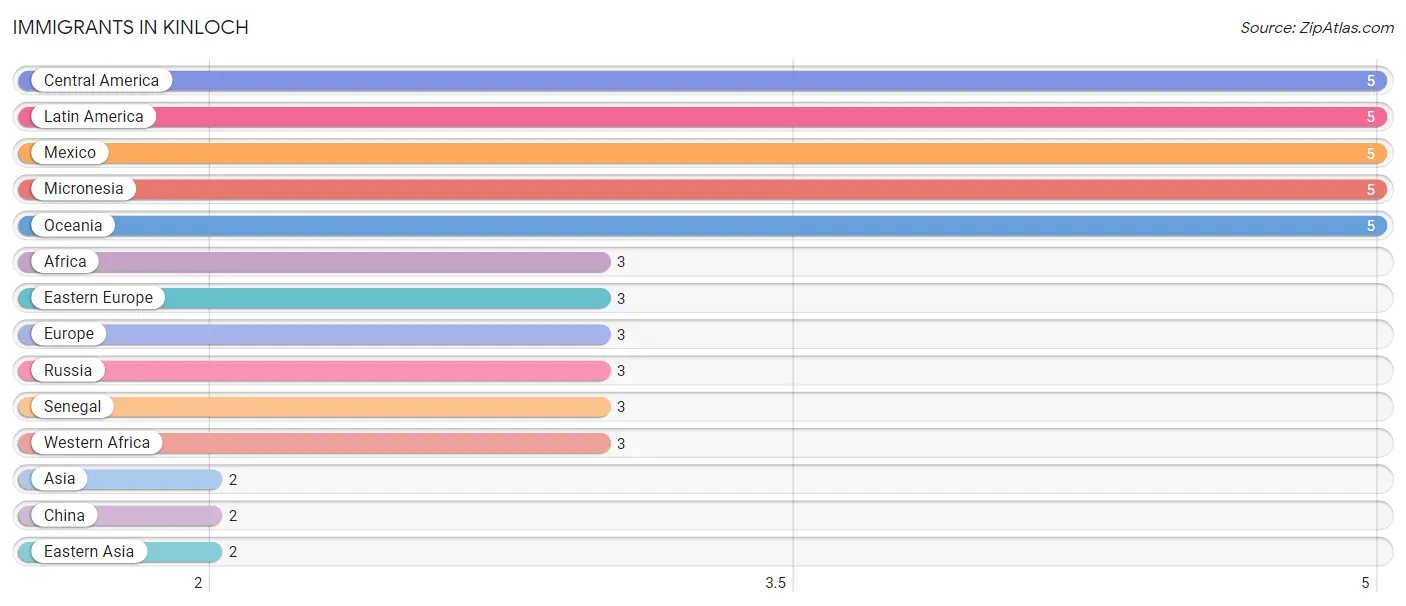
| Immigration Origin | # Population | % Population |
| Africa | 3 | 1.0% |
| Asia | 2 | 0.7% |
| Central America | 5 | 1.7% |
| China | 2 | 0.7% |
| Eastern Asia | 2 | 0.7% |
| Eastern Europe | 3 | 1.0% |
| Europe | 3 | 1.0% |
| Latin America | 5 | 1.7% |
| Mexico | 5 | 1.7% |
| Micronesia | 5 | 1.7% |
| Oceania | 5 | 1.7% |
| Russia | 3 | 1.0% |
| Senegal | 3 | 1.0% |
| Western Africa | 3 | 1.0% | View All 14 Rows |
Sex and Age in Kinloch
Sex and Age in Kinloch
The most populous age groups in Kinloch are 50 to 54 Years (22 | 18.6%) for men and 20 to 24 Years (46 | 26.6%) for women.
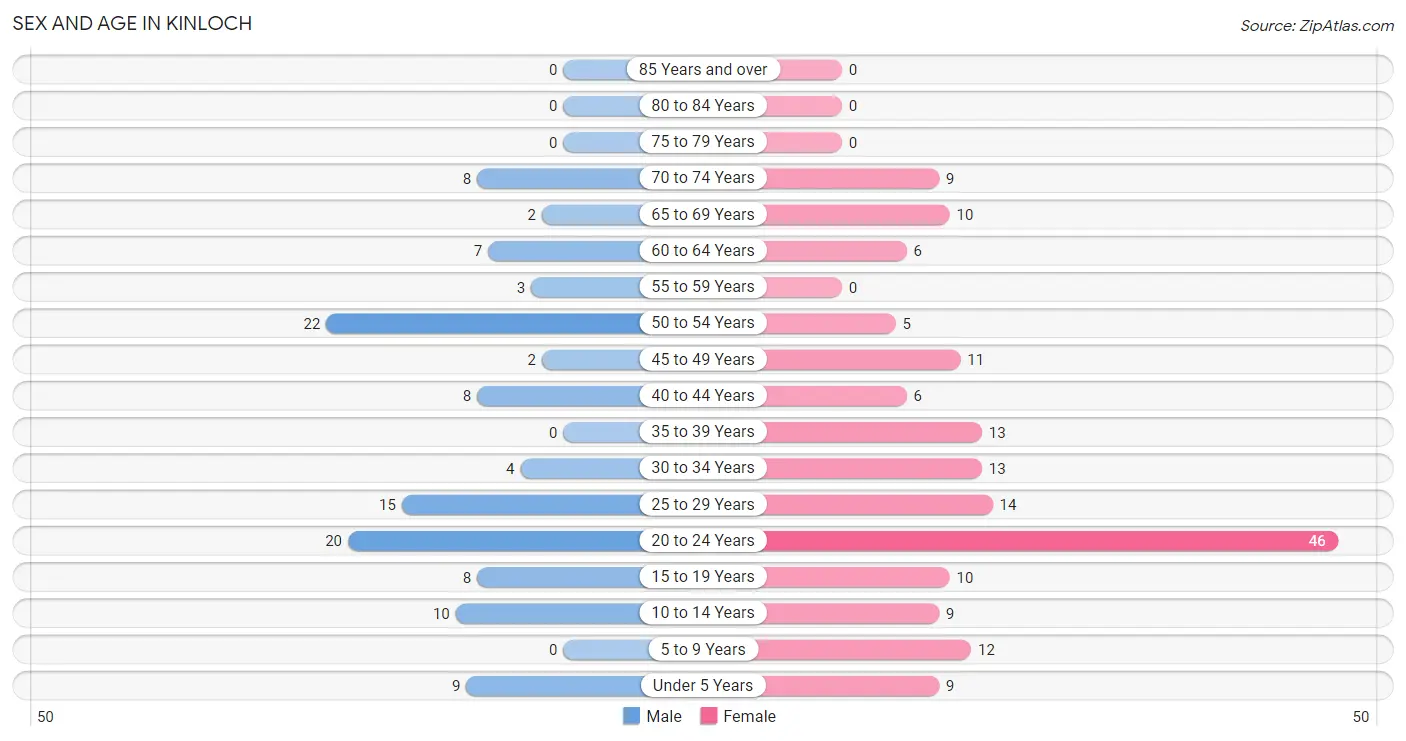
| Age Bracket | Male | Female |
| Under 5 Years | 9 (7.6%) | 9 (5.2%) |
| 5 to 9 Years | 0 (0.0%) | 12 (6.9%) |
| 10 to 14 Years | 10 (8.5%) | 9 (5.2%) |
| 15 to 19 Years | 8 (6.8%) | 10 (5.8%) |
| 20 to 24 Years | 20 (17.0%) | 46 (26.6%) |
| 25 to 29 Years | 15 (12.7%) | 14 (8.1%) |
| 30 to 34 Years | 4 (3.4%) | 13 (7.5%) |
| 35 to 39 Years | 0 (0.0%) | 13 (7.5%) |
| 40 to 44 Years | 8 (6.8%) | 6 (3.5%) |
| 45 to 49 Years | 2 (1.7%) | 11 (6.4%) |
| 50 to 54 Years | 22 (18.6%) | 5 (2.9%) |
| 55 to 59 Years | 3 (2.5%) | 0 (0.0%) |
| 60 to 64 Years | 7 (5.9%) | 6 (3.5%) |
| 65 to 69 Years | 2 (1.7%) | 10 (5.8%) |
| 70 to 74 Years | 8 (6.8%) | 9 (5.2%) |
| 75 to 79 Years | 0 (0.0%) | 0 (0.0%) |
| 80 to 84 Years | 0 (0.0%) | 0 (0.0%) |
| 85 Years and over | 0 (0.0%) | 0 (0.0%) |
| Total | 118 (100.0%) | 173 (100.0%) |
Families and Households in Kinloch
Median Family Size in Kinloch
The median family size in Kinloch is 2.75 persons per family, with single female/mother families (30 | 53.6%) accounting for the largest median family size of 3.4 persons per family. On the other hand, married-couple families (24 | 42.9%) represent the smallest median family size with 2.00 persons per family.
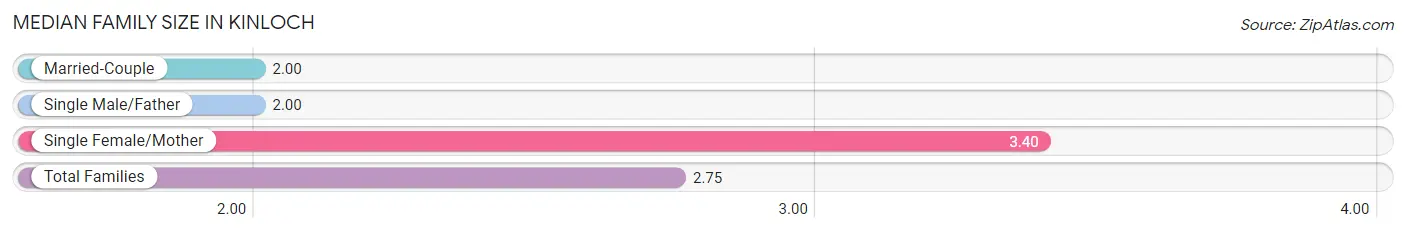
| Family Type | # Families | Family Size |
| Married-Couple | 24 (42.9%) | 2.00 |
| Single Male/Father | 2 (3.6%) | 2.00 |
| Single Female/Mother | 30 (53.6%) | 3.40 |
| Total Families | 56 (100.0%) | 2.75 |
Median Household Size in Kinloch
The median household size in Kinloch is 2.17 persons per household, with single female/mother households (30 | 23.6%) accounting for the largest median household size of 3.47 persons per household. non-family households (71 | 55.9%) represent the smallest median household size with 1.65 persons per household.
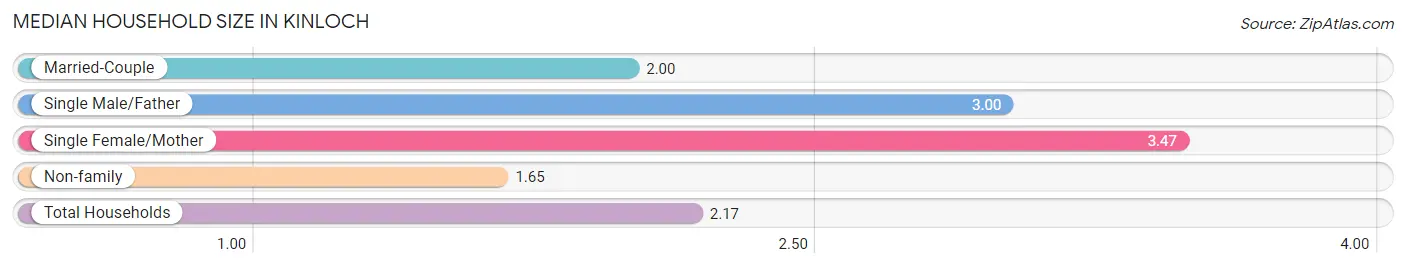
| Household Type | # Households | Household Size |
| Married-Couple | 24 (18.9%) | 2.00 |
| Single Male/Father | 2 (1.6%) | 3.00 |
| Single Female/Mother | 30 (23.6%) | 3.47 |
| Non-family | 71 (55.9%) | 1.65 |
| Total Households | 127 (100.0%) | 2.17 |
Household Size by Marriage Status in Kinloch
Out of a total of 127 households in Kinloch, 56 (44.1%) are family households, while 71 (55.9%) are nonfamily households. The most numerous type of family households are 2-person households, comprising 41, and the most common type of nonfamily households are 1-person households, comprising 38.
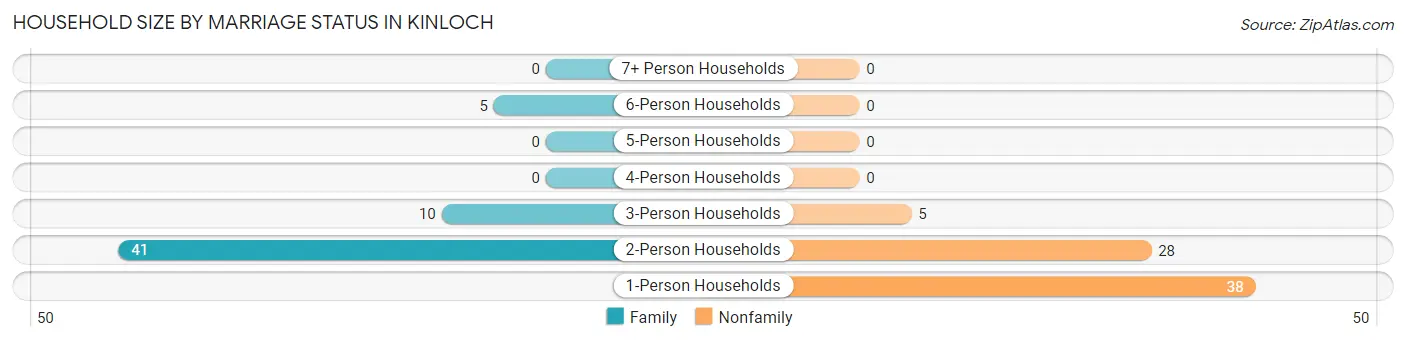
| Household Size | Family Households | Nonfamily Households |
| 1-Person Households | - | 38 (29.9%) |
| 2-Person Households | 41 (32.3%) | 28 (22.1%) |
| 3-Person Households | 10 (7.9%) | 5 (3.9%) |
| 4-Person Households | 0 (0.0%) | 0 (0.0%) |
| 5-Person Households | 0 (0.0%) | 0 (0.0%) |
| 6-Person Households | 5 (3.9%) | 0 (0.0%) |
| 7+ Person Households | 0 (0.0%) | 0 (0.0%) |
| Total | 56 (44.1%) | 71 (55.9%) |
Female Fertility in Kinloch
Fertility by Age in Kinloch
Average fertility rate in Kinloch is 97.0 births per 1,000 women. Women in the age bracket of 15 to 19 years have the highest fertility rate with 200.0 births per 1,000 women. Women in the age bracket of 20 to 34 years acount for 81.8% of all women with births.
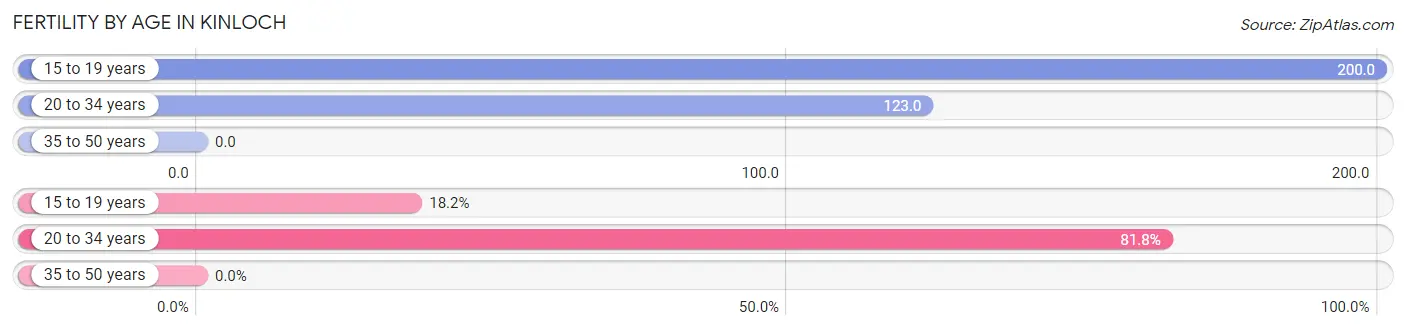
| Age Bracket | Women with Births | Births / 1,000 Women |
| 15 to 19 years | 2 (18.2%) | 200.0 |
| 20 to 34 years | 9 (81.8%) | 123.0 |
| 35 to 50 years | 0 (0.0%) | 0.0 |
| Total | 11 (100.0%) | 97.0 |
Fertility by Age by Marriage Status in Kinloch
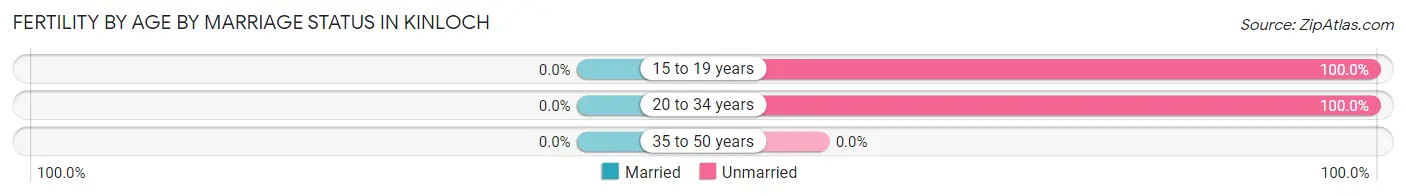
| Age Bracket | Married | Unmarried |
| 15 to 19 years | 0 (0.0%) | 2 (100.0%) |
| 20 to 34 years | 0 (0.0%) | 9 (100.0%) |
| 35 to 50 years | 0 (0.0%) | 0 (0.0%) |
| Total | 0 (0.0%) | 11 (100.0%) |
Fertility by Education in Kinloch
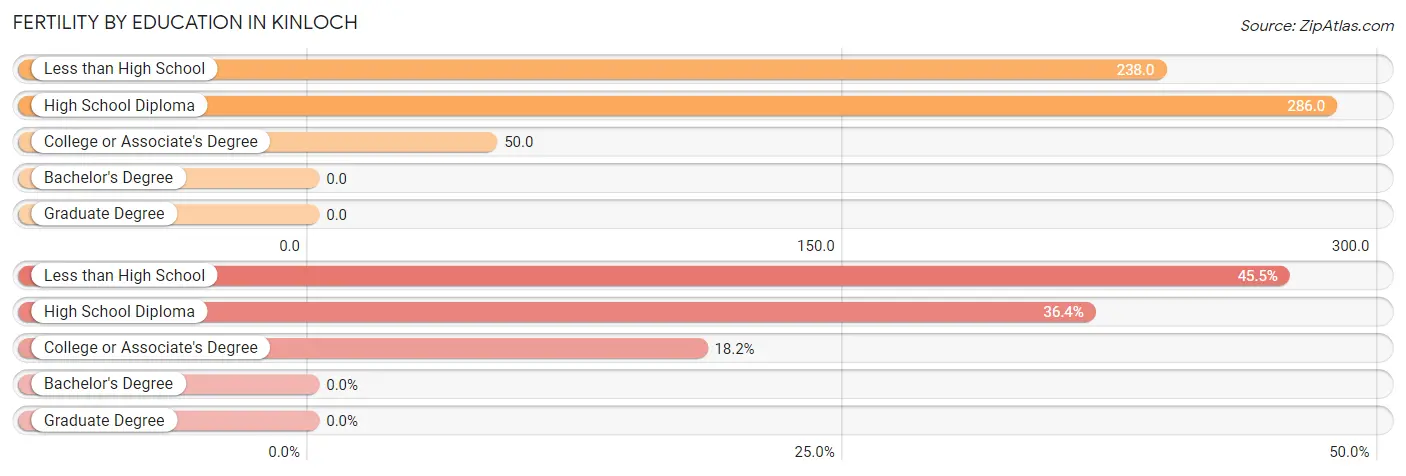
| Educational Attainment | Women with Births | Births / 1,000 Women |
| Less than High School | 5 (45.5%) | 238.0 |
| High School Diploma | 4 (36.4%) | 286.0 |
| College or Associate's Degree | 2 (18.2%) | 50.0 |
| Bachelor's Degree | 0 (0.0%) | 0.0 |
| Graduate Degree | 0 (0.0%) | 0.0 |
| Total | 11 (100.0%) | 97.0 |
Fertility by Education by Marriage Status in Kinloch
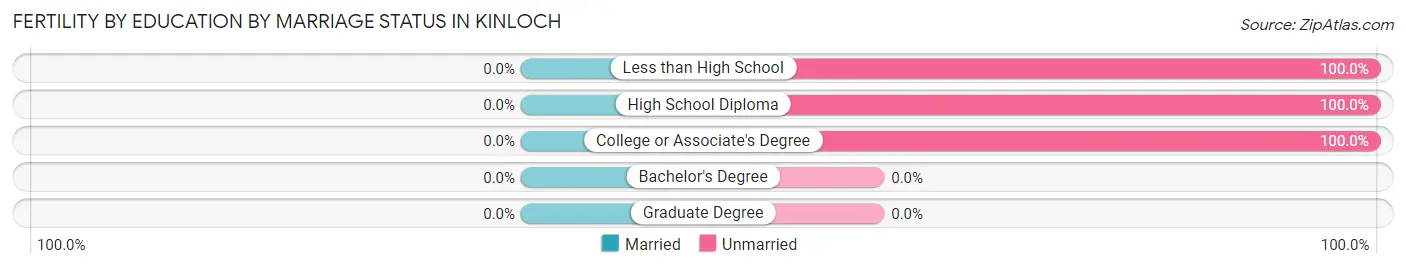
| Educational Attainment | Married | Unmarried |
| Less than High School | 0 (0.0%) | 5 (100.0%) |
| High School Diploma | 0 (0.0%) | 4 (100.0%) |
| College or Associate's Degree | 0 (0.0%) | 2 (100.0%) |
| Bachelor's Degree | 0 (0.0%) | 0 (0.0%) |
| Graduate Degree | 0 (0.0%) | 0 (0.0%) |
| Total | 0 (0.0%) | 11 (100.0%) |
Employment Characteristics in Kinloch
Employment by Class of Employer in Kinloch
Among the 175 employed individuals in Kinloch, private company employees (123 | 70.3%), state government employees (29 | 16.6%), and not-for-profit organizations (10 | 5.7%) make up the most common classes of employment.
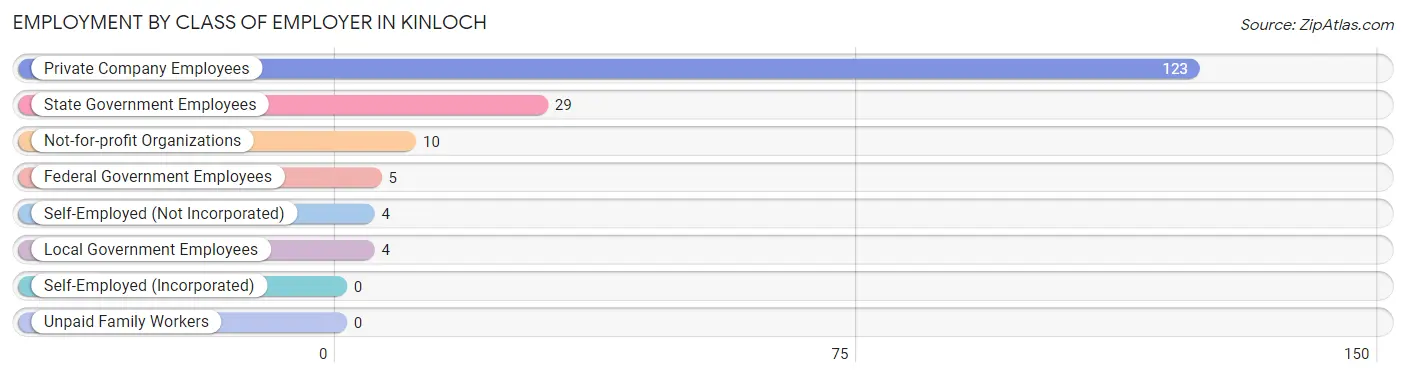
| Employer Class | # Employees | % Employees |
| Private Company Employees | 123 | 70.3% |
| Self-Employed (Incorporated) | 0 | 0.0% |
| Self-Employed (Not Incorporated) | 4 | 2.3% |
| Not-for-profit Organizations | 10 | 5.7% |
| Local Government Employees | 4 | 2.3% |
| State Government Employees | 29 | 16.6% |
| Federal Government Employees | 5 | 2.9% |
| Unpaid Family Workers | 0 | 0.0% |
| Total | 175 | 100.0% |
Employment Status by Age in Kinloch
According to the labor force statistics for Kinloch, out of the total population over 16 years of age (242), 73.1% or 177 individuals are in the labor force, with 1.1% or 2 of them unemployed. The age group with the highest labor force participation rate is 55 to 59 years, with 100.0% or 3 individuals in the labor force. Within the labor force, the 65 to 74 years age range has the highest percentage of unemployed individuals, with 66.7% or 2 of them being unemployed.
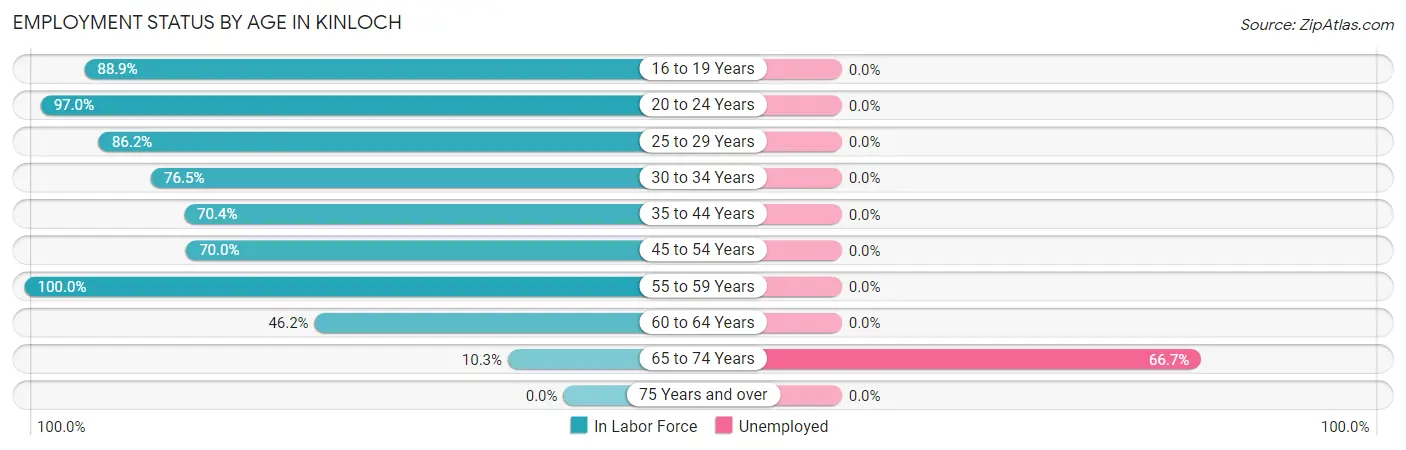
| Age Bracket | In Labor Force | Unemployed |
| 16 to 19 Years | 16 (88.9%) | 0 (0.0%) |
| 20 to 24 Years | 64 (97.0%) | 0 (0.0%) |
| 25 to 29 Years | 25 (86.2%) | 0 (0.0%) |
| 30 to 34 Years | 13 (76.5%) | 0 (0.0%) |
| 35 to 44 Years | 19 (70.4%) | 0 (0.0%) |
| 45 to 54 Years | 28 (70.0%) | 0 (0.0%) |
| 55 to 59 Years | 3 (100.0%) | 0 (0.0%) |
| 60 to 64 Years | 6 (46.2%) | 0 (0.0%) |
| 65 to 74 Years | 3 (10.3%) | 2 (66.7%) |
| 75 Years and over | 0 (0.0%) | 0 (0.0%) |
| Total | 177 (73.1%) | 2 (1.1%) |
Employment Status by Educational Attainment in Kinloch
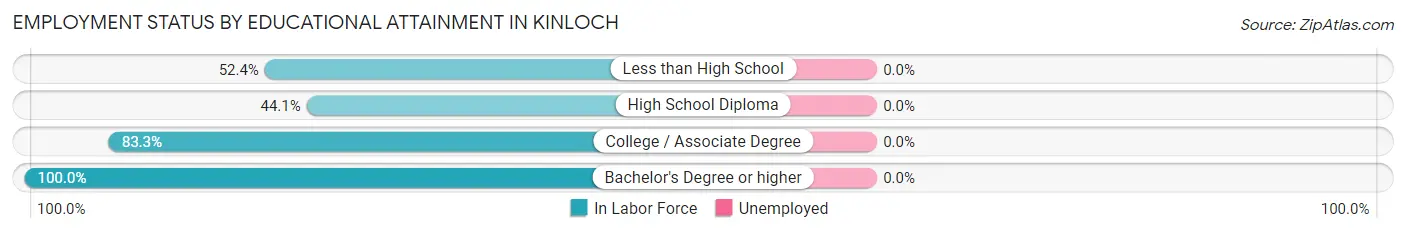
| Educational Attainment | In Labor Force | Unemployed |
| Less than High School | 11 (52.4%) | 0 (0.0%) |
| High School Diploma | 15 (44.1%) | 0 (0.0%) |
| College / Associate Degree | 30 (83.3%) | 0 (0.0%) |
| Bachelor's Degree or higher | 38 (100.0%) | 0 (0.0%) |
| Total | 94 (72.9%) | 0 (0.0%) |
Employment Occupations by Sex in Kinloch
Management, Business, Science and Arts Occupations
The most common Management, Business, Science and Arts occupations in Kinloch are Management (18 | 10.3%), Community & Social Service (17 | 9.7%), Business & Financial (11 | 6.3%), Education Instruction & Library (8 | 4.6%), and Health Diagnosing & Treating (7 | 4.0%).
Management, Business, Science and Arts Occupations by Sex
Within the Management, Business, Science and Arts occupations in Kinloch, the most male-oriented occupations are Architecture & Engineering (100.0%), Arts, Media & Entertainment (100.0%), and Community & Social Service (64.7%), while the most female-oriented occupations are Management (100.0%), Education, Arts & Media (100.0%), and Health Diagnosing & Treating (100.0%).
| Occupation | Male | Female |
| Management | 0 (0.0%) | 18 (100.0%) |
| Business & Financial | 2 (18.2%) | 9 (81.8%) |
| Computers, Engineering & Science | 3 (50.0%) | 3 (50.0%) |
| Computers & Mathematics | 2 (40.0%) | 3 (60.0%) |
| Architecture & Engineering | 1 (100.0%) | 0 (0.0%) |
| Life, Physical & Social Science | 0 (0.0%) | 0 (0.0%) |
| Community & Social Service | 11 (64.7%) | 6 (35.3%) |
| Education, Arts & Media | 0 (0.0%) | 3 (100.0%) |
| Legal Services & Support | 0 (0.0%) | 0 (0.0%) |
| Education Instruction & Library | 5 (62.5%) | 3 (37.5%) |
| Arts, Media & Entertainment | 6 (100.0%) | 0 (0.0%) |
| Health Diagnosing & Treating | 0 (0.0%) | 7 (100.0%) |
| Health Technologists | 0 (0.0%) | 3 (100.0%) |
| Total (Category) | 16 (27.1%) | 43 (72.9%) |
| Total (Overall) | 73 (41.7%) | 102 (58.3%) |
Services Occupations
The most common Services occupations in Kinloch are Food Preparation & Serving (34 | 19.4%), Cleaning & Maintenance (15 | 8.6%), Healthcare Support (4 | 2.3%), and Personal Care & Service (2 | 1.1%).
Services Occupations by Sex
Within the Services occupations in Kinloch, the most male-oriented occupations are Cleaning & Maintenance (80.0%), and Food Preparation & Serving (32.4%), while the most female-oriented occupations are Healthcare Support (100.0%), Personal Care & Service (100.0%), and Food Preparation & Serving (67.6%).
| Occupation | Male | Female |
| Healthcare Support | 0 (0.0%) | 4 (100.0%) |
| Security & Protection | 0 (0.0%) | 0 (0.0%) |
| Firefighting & Prevention | 0 (0.0%) | 0 (0.0%) |
| Law Enforcement | 0 (0.0%) | 0 (0.0%) |
| Food Preparation & Serving | 11 (32.4%) | 23 (67.6%) |
| Cleaning & Maintenance | 12 (80.0%) | 3 (20.0%) |
| Personal Care & Service | 0 (0.0%) | 2 (100.0%) |
| Total (Category) | 23 (41.8%) | 32 (58.2%) |
| Total (Overall) | 73 (41.7%) | 102 (58.3%) |
Sales and Office Occupations
The most common Sales and Office occupations in Kinloch are Office & Administration (17 | 9.7%), and Sales & Related (15 | 8.6%).

Sales and Office Occupations by Sex
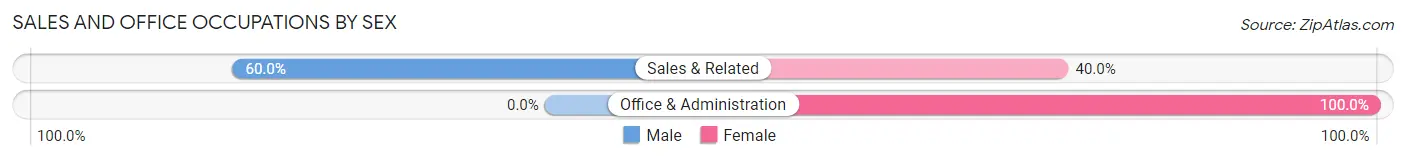
| Occupation | Male | Female |
| Sales & Related | 9 (60.0%) | 6 (40.0%) |
| Office & Administration | 0 (0.0%) | 17 (100.0%) |
| Total (Category) | 9 (28.1%) | 23 (71.9%) |
| Total (Overall) | 73 (41.7%) | 102 (58.3%) |
Natural Resources, Construction and Maintenance Occupations
The most common Natural Resources, Construction and Maintenance occupations in Kinloch are , and Construction & Extraction (12 | 6.9%).
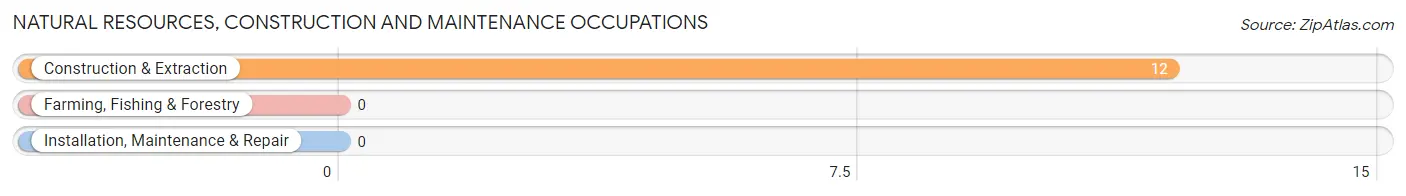
Natural Resources, Construction and Maintenance Occupations by Sex
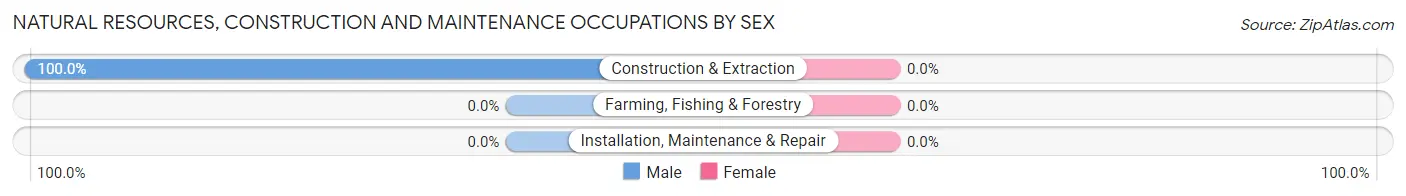
| Occupation | Male | Female |
| Farming, Fishing & Forestry | 0 (0.0%) | 0 (0.0%) |
| Construction & Extraction | 12 (100.0%) | 0 (0.0%) |
| Installation, Maintenance & Repair | 0 (0.0%) | 0 (0.0%) |
| Total (Category) | 12 (100.0%) | 0 (0.0%) |
| Total (Overall) | 73 (41.7%) | 102 (58.3%) |
Production, Transportation and Moving Occupations
The most common Production, Transportation and Moving occupations in Kinloch are Material Moving (14 | 8.0%), Transportation (2 | 1.1%), and Production (1 | 0.6%).
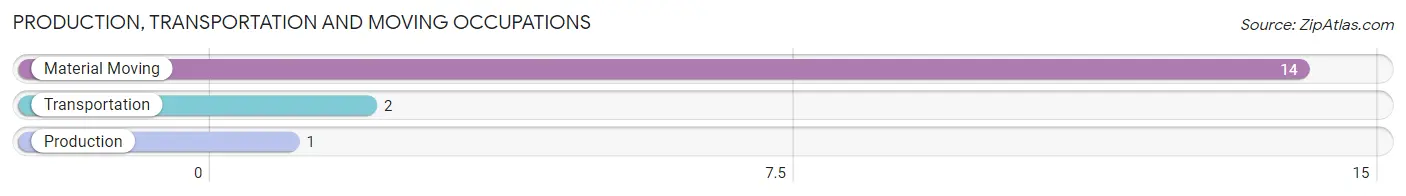
Production, Transportation and Moving Occupations by Sex
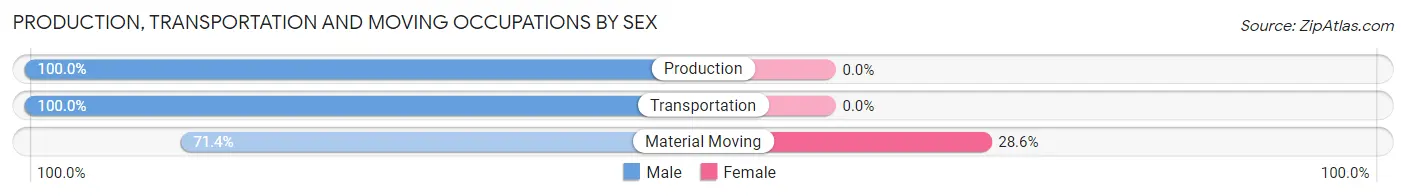
| Occupation | Male | Female |
| Production | 1 (100.0%) | 0 (0.0%) |
| Transportation | 2 (100.0%) | 0 (0.0%) |
| Material Moving | 10 (71.4%) | 4 (28.6%) |
| Total (Category) | 13 (76.5%) | 4 (23.5%) |
| Total (Overall) | 73 (41.7%) | 102 (58.3%) |
Employment Industries by Sex in Kinloch
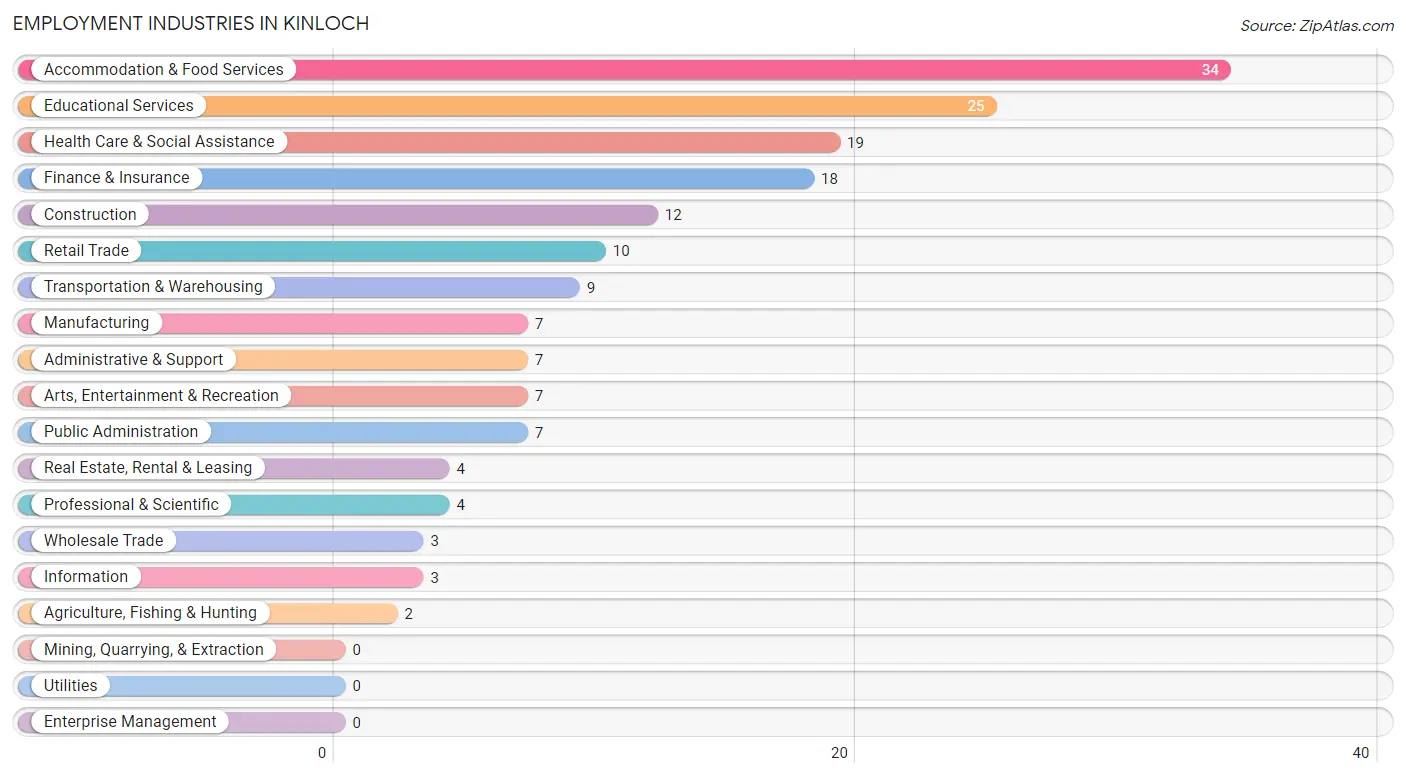
Employment Industries in Kinloch
The major employment industries in Kinloch include Accommodation & Food Services (34 | 19.4%), Educational Services (25 | 14.3%), Health Care & Social Assistance (19 | 10.9%), Finance & Insurance (18 | 10.3%), and Construction (12 | 6.9%).
Employment Industries by Sex in Kinloch
The Kinloch industries that see more men than women are Construction (100.0%), Manufacturing (100.0%), and Information (100.0%), whereas the industries that tend to have a higher number of women are Agriculture, Fishing & Hunting (100.0%), Wholesale Trade (100.0%), and Real Estate, Rental & Leasing (100.0%).
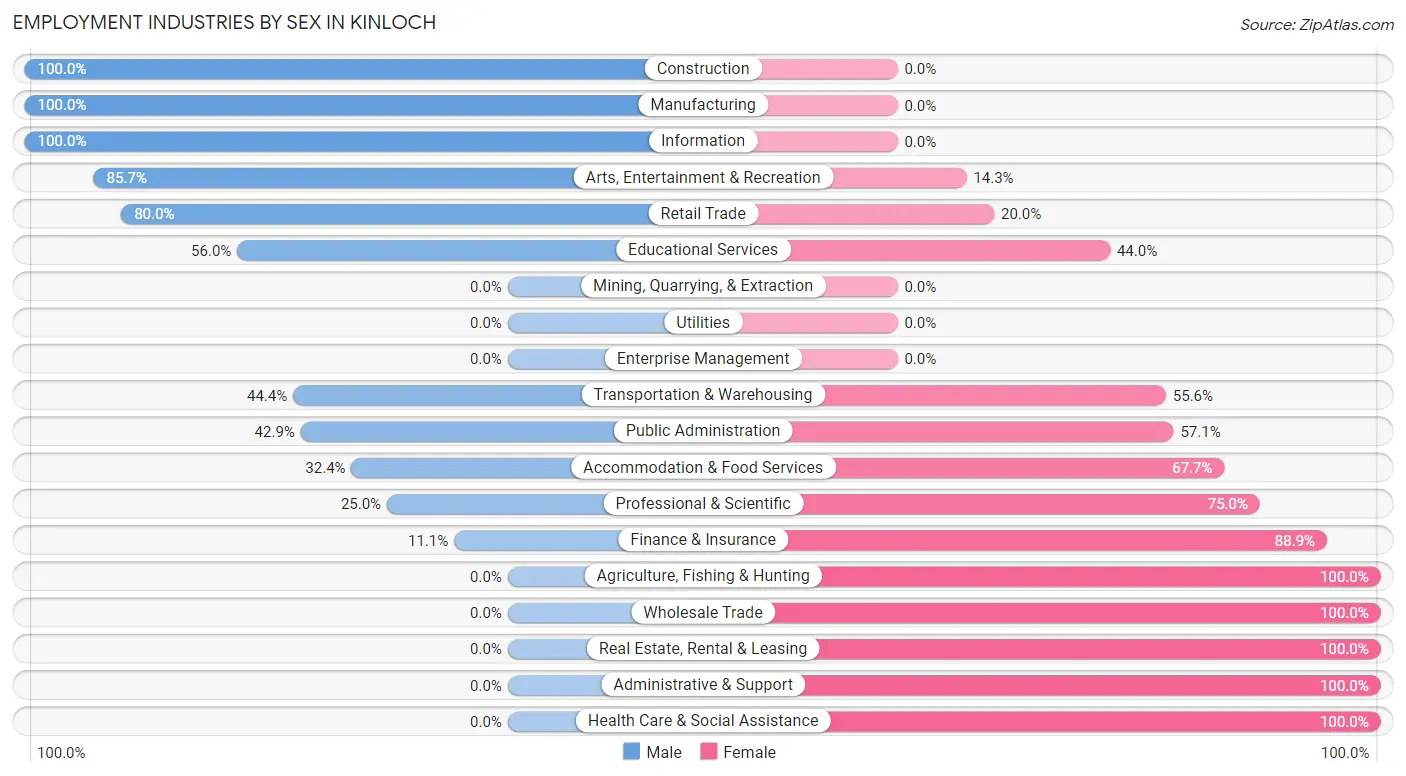
| Industry | Male | Female |
| Agriculture, Fishing & Hunting | 0 (0.0%) | 2 (100.0%) |
| Mining, Quarrying, & Extraction | 0 (0.0%) | 0 (0.0%) |
| Construction | 12 (100.0%) | 0 (0.0%) |
| Manufacturing | 7 (100.0%) | 0 (0.0%) |
| Wholesale Trade | 0 (0.0%) | 3 (100.0%) |
| Retail Trade | 8 (80.0%) | 2 (20.0%) |
| Transportation & Warehousing | 4 (44.4%) | 5 (55.6%) |
| Utilities | 0 (0.0%) | 0 (0.0%) |
| Information | 3 (100.0%) | 0 (0.0%) |
| Finance & Insurance | 2 (11.1%) | 16 (88.9%) |
| Real Estate, Rental & Leasing | 0 (0.0%) | 4 (100.0%) |
| Professional & Scientific | 1 (25.0%) | 3 (75.0%) |
| Enterprise Management | 0 (0.0%) | 0 (0.0%) |
| Administrative & Support | 0 (0.0%) | 7 (100.0%) |
| Educational Services | 14 (56.0%) | 11 (44.0%) |
| Health Care & Social Assistance | 0 (0.0%) | 19 (100.0%) |
| Arts, Entertainment & Recreation | 6 (85.7%) | 1 (14.3%) |
| Accommodation & Food Services | 11 (32.4%) | 23 (67.6%) |
| Public Administration | 3 (42.9%) | 4 (57.1%) |
| Total | 73 (41.7%) | 102 (58.3%) |
Education in Kinloch
School Enrollment in Kinloch
The most common levels of schooling among the 92 students in Kinloch are college / undergraduate (41 | 44.6%), middle school (19 | 20.6%), and nursery / preschool (13 | 14.1%).
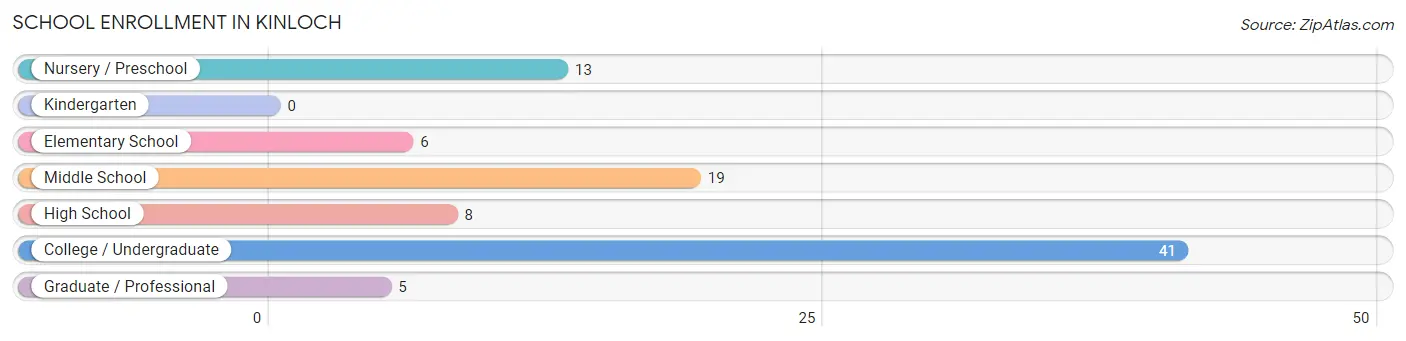
| School Level | # Students | % Students |
| Nursery / Preschool | 13 | 14.1% |
| Kindergarten | 0 | 0.0% |
| Elementary School | 6 | 6.5% |
| Middle School | 19 | 20.6% |
| High School | 8 | 8.7% |
| College / Undergraduate | 41 | 44.6% |
| Graduate / Professional | 5 | 5.4% |
| Total | 92 | 100.0% |
School Enrollment by Age by Funding Source in Kinloch
Out of a total of 92 students who are enrolled in schools in Kinloch, 3 (3.3%) attend a private institution, while the remaining 89 (96.7%) are enrolled in public schools. The age group of 18 to 19 year olds has the highest likelihood of being enrolled in private schools, with 2 (20.0% in the age bracket) enrolled. Conversely, the age group of 3 to 4 year olds has the lowest likelihood of being enrolled in a private school, with 7 (100.0% in the age bracket) attending a public institution.
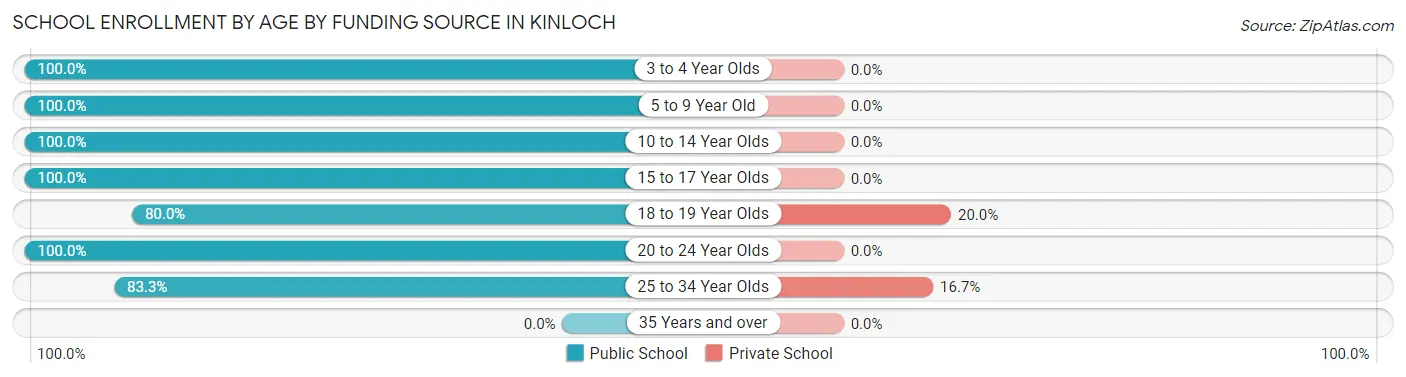
| Age Bracket | Public School | Private School |
| 3 to 4 Year Olds | 7 (100.0%) | 0 (0.0%) |
| 5 to 9 Year Old | 12 (100.0%) | 0 (0.0%) |
| 10 to 14 Year Olds | 19 (100.0%) | 0 (0.0%) |
| 15 to 17 Year Olds | 4 (100.0%) | 0 (0.0%) |
| 18 to 19 Year Olds | 8 (80.0%) | 2 (20.0%) |
| 20 to 24 Year Olds | 34 (100.0%) | 0 (0.0%) |
| 25 to 34 Year Olds | 5 (83.3%) | 1 (16.7%) |
| 35 Years and over | 0 (0.0%) | 0 (0.0%) |
| Total | 89 (96.7%) | 3 (3.3%) |
Educational Attainment by Field of Study in Kinloch
Arts & humanities (13 | 30.2%), science & technology (11 | 25.6%), business (5 | 11.6%), bio, nature & agricultural (4 | 9.3%), and psychology (4 | 9.3%) are the most common fields of study among 43 individuals in Kinloch who have obtained a bachelor's degree or higher.
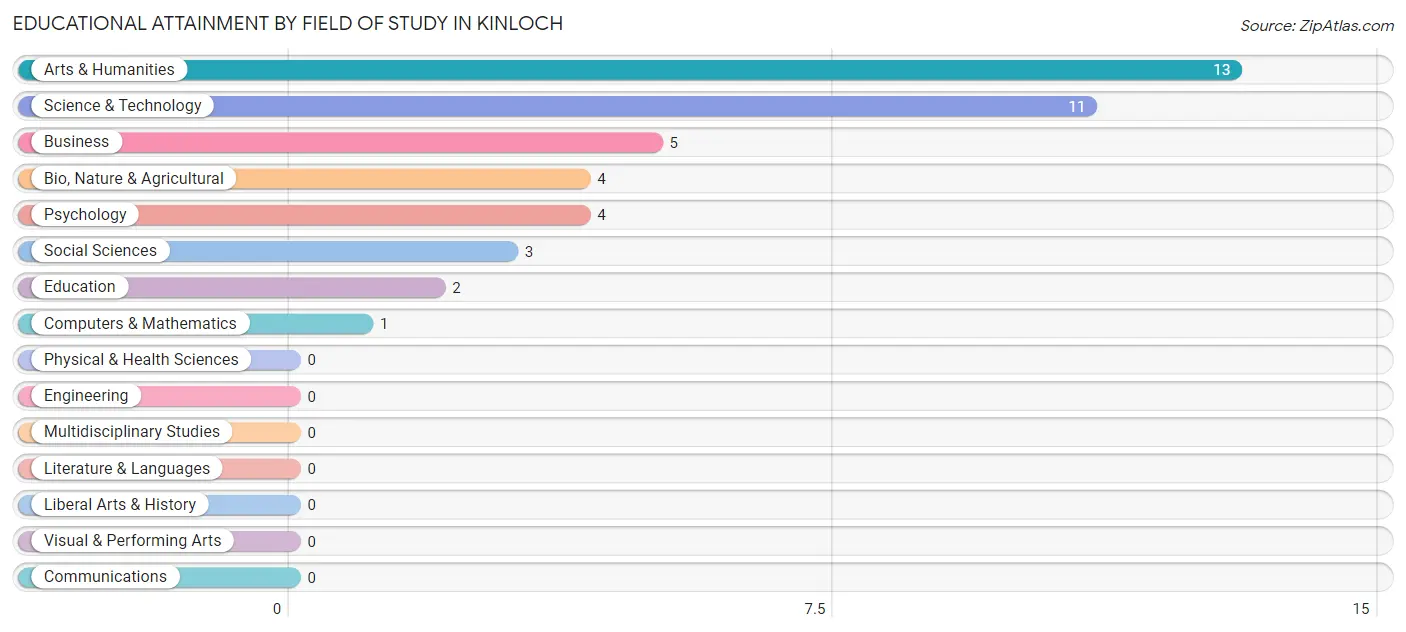
| Field of Study | # Graduates | % Graduates |
| Computers & Mathematics | 1 | 2.3% |
| Bio, Nature & Agricultural | 4 | 9.3% |
| Physical & Health Sciences | 0 | 0.0% |
| Psychology | 4 | 9.3% |
| Social Sciences | 3 | 7.0% |
| Engineering | 0 | 0.0% |
| Multidisciplinary Studies | 0 | 0.0% |
| Science & Technology | 11 | 25.6% |
| Business | 5 | 11.6% |
| Education | 2 | 4.6% |
| Literature & Languages | 0 | 0.0% |
| Liberal Arts & History | 0 | 0.0% |
| Visual & Performing Arts | 0 | 0.0% |
| Communications | 0 | 0.0% |
| Arts & Humanities | 13 | 30.2% |
| Total | 43 | 100.0% |
Transportation & Commute in Kinloch
Vehicle Availability by Sex in Kinloch
The most prevalent vehicle ownership categories in Kinloch are males with 2 vehicles (39, accounting for 54.9%) and females with 2 vehicles (58, making up 38.2%).
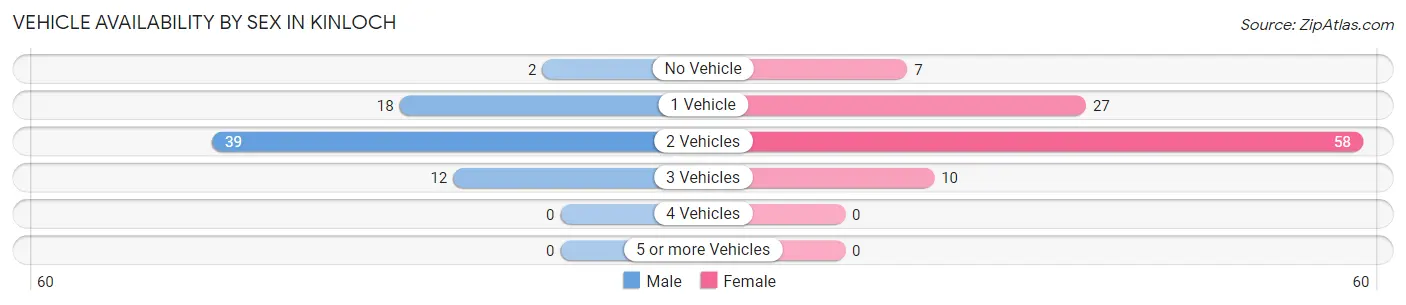
| Vehicles Available | Male | Female |
| No Vehicle | 2 (2.8%) | 7 (6.9%) |
| 1 Vehicle | 18 (25.4%) | 27 (26.5%) |
| 2 Vehicles | 39 (54.9%) | 58 (56.9%) |
| 3 Vehicles | 12 (16.9%) | 10 (9.8%) |
| 4 Vehicles | 0 (0.0%) | 0 (0.0%) |
| 5 or more Vehicles | 0 (0.0%) | 0 (0.0%) |
| Total | 71 (100.0%) | 102 (100.0%) |
Commute Time in Kinloch
The most frequently occuring commute durations in Kinloch are 15 to 19 minutes (34 commuters, 21.4%), 10 to 14 minutes (29 commuters, 18.2%), and 20 to 24 minutes (18 commuters, 11.3%).
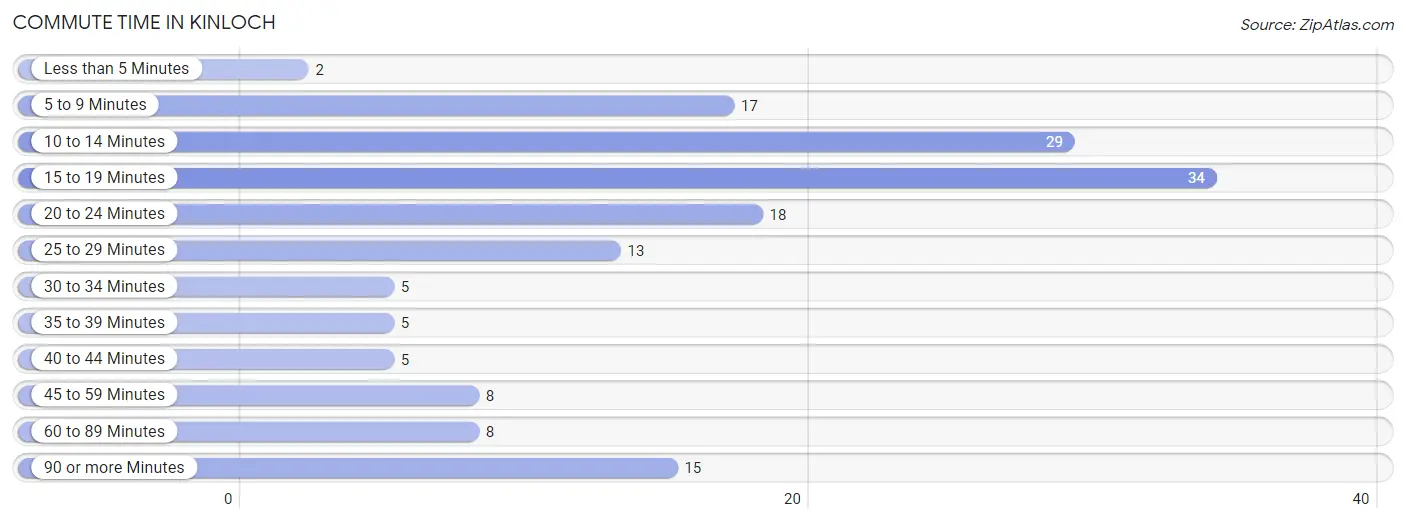
| Commute Time | # Commuters | % Commuters |
| Less than 5 Minutes | 2 | 1.3% |
| 5 to 9 Minutes | 17 | 10.7% |
| 10 to 14 Minutes | 29 | 18.2% |
| 15 to 19 Minutes | 34 | 21.4% |
| 20 to 24 Minutes | 18 | 11.3% |
| 25 to 29 Minutes | 13 | 8.2% |
| 30 to 34 Minutes | 5 | 3.1% |
| 35 to 39 Minutes | 5 | 3.1% |
| 40 to 44 Minutes | 5 | 3.1% |
| 45 to 59 Minutes | 8 | 5.0% |
| 60 to 89 Minutes | 8 | 5.0% |
| 90 or more Minutes | 15 | 9.4% |
Commute Time by Sex in Kinloch
The most common commute times in Kinloch are 10 to 14 minutes (15 commuters, 20.8%) for males and 15 to 19 minutes (22 commuters, 25.3%) for females.
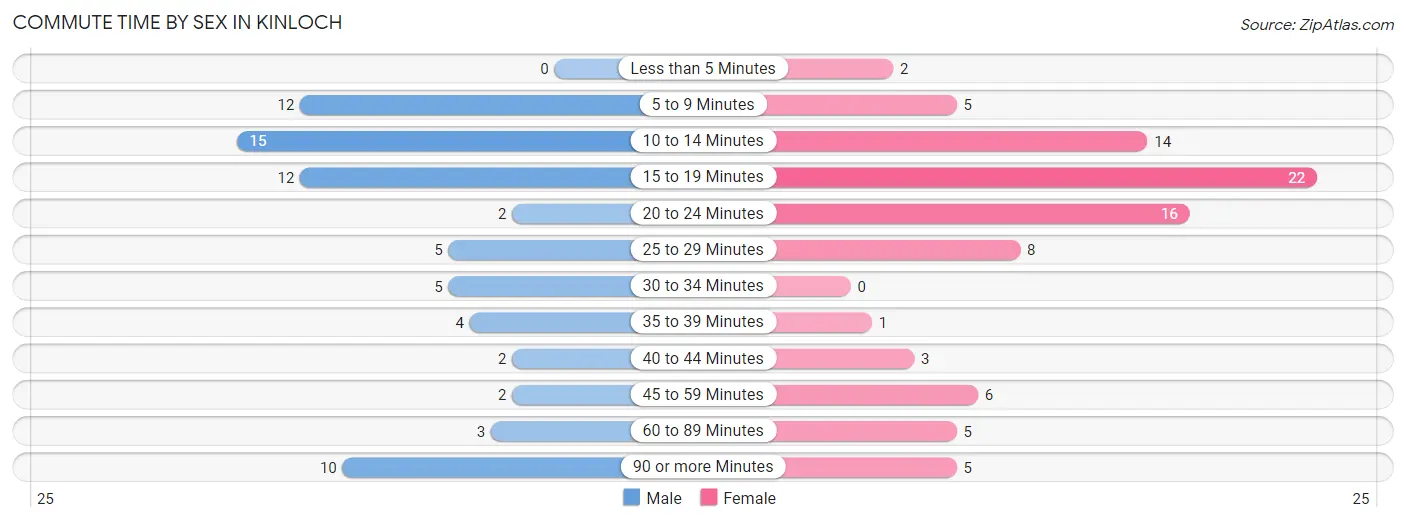
| Commute Time | Male | Female |
| Less than 5 Minutes | 0 (0.0%) | 2 (2.3%) |
| 5 to 9 Minutes | 12 (16.7%) | 5 (5.8%) |
| 10 to 14 Minutes | 15 (20.8%) | 14 (16.1%) |
| 15 to 19 Minutes | 12 (16.7%) | 22 (25.3%) |
| 20 to 24 Minutes | 2 (2.8%) | 16 (18.4%) |
| 25 to 29 Minutes | 5 (6.9%) | 8 (9.2%) |
| 30 to 34 Minutes | 5 (6.9%) | 0 (0.0%) |
| 35 to 39 Minutes | 4 (5.6%) | 1 (1.1%) |
| 40 to 44 Minutes | 2 (2.8%) | 3 (3.5%) |
| 45 to 59 Minutes | 2 (2.8%) | 6 (6.9%) |
| 60 to 89 Minutes | 3 (4.2%) | 5 (5.8%) |
| 90 or more Minutes | 10 (13.9%) | 5 (5.8%) |
Time of Departure to Work by Sex in Kinloch
The most frequent times of departure to work in Kinloch are 6:00 AM to 6:29 AM (21, 29.2%) for males and 12:00 PM to 3:59 PM (26, 29.9%) for females.
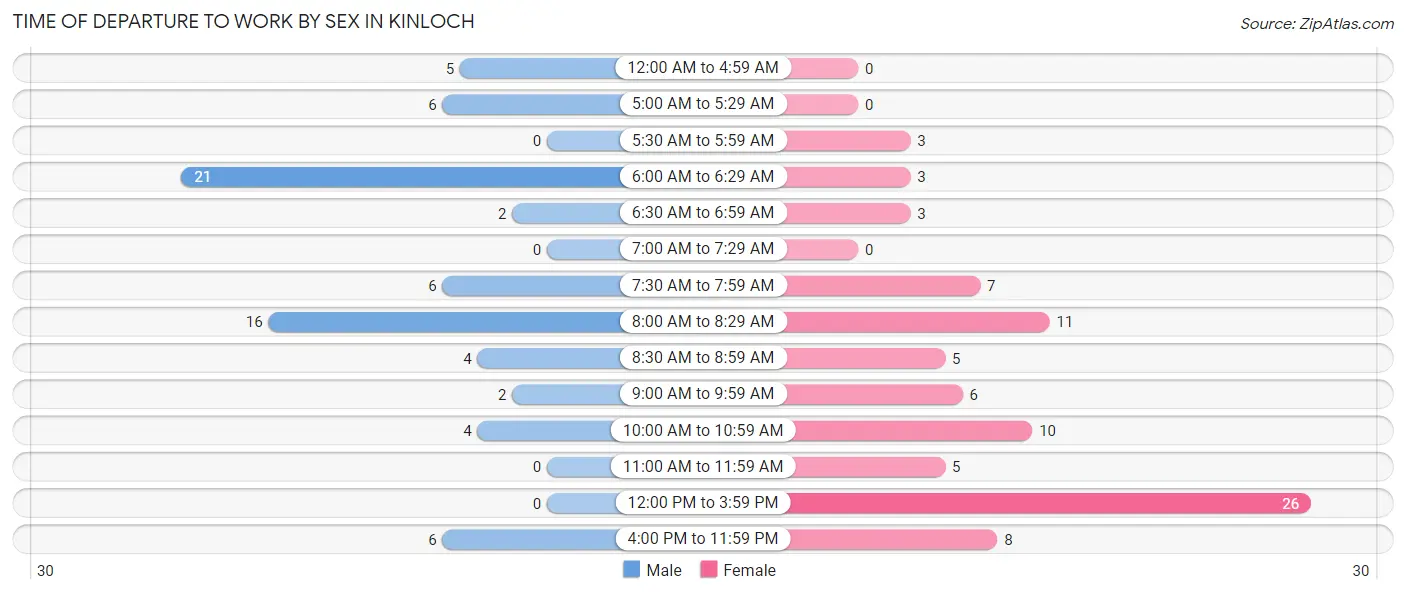
| Time of Departure | Male | Female |
| 12:00 AM to 4:59 AM | 5 (6.9%) | 0 (0.0%) |
| 5:00 AM to 5:29 AM | 6 (8.3%) | 0 (0.0%) |
| 5:30 AM to 5:59 AM | 0 (0.0%) | 3 (3.5%) |
| 6:00 AM to 6:29 AM | 21 (29.2%) | 3 (3.5%) |
| 6:30 AM to 6:59 AM | 2 (2.8%) | 3 (3.5%) |
| 7:00 AM to 7:29 AM | 0 (0.0%) | 0 (0.0%) |
| 7:30 AM to 7:59 AM | 6 (8.3%) | 7 (8.1%) |
| 8:00 AM to 8:29 AM | 16 (22.2%) | 11 (12.6%) |
| 8:30 AM to 8:59 AM | 4 (5.6%) | 5 (5.8%) |
| 9:00 AM to 9:59 AM | 2 (2.8%) | 6 (6.9%) |
| 10:00 AM to 10:59 AM | 4 (5.6%) | 10 (11.5%) |
| 11:00 AM to 11:59 AM | 0 (0.0%) | 5 (5.8%) |
| 12:00 PM to 3:59 PM | 0 (0.0%) | 26 (29.9%) |
| 4:00 PM to 11:59 PM | 6 (8.3%) | 8 (9.2%) |
| Total | 72 (100.0%) | 87 (100.0%) |
Housing Occupancy in Kinloch
Occupancy by Ownership in Kinloch
Of the total 127 dwellings in Kinloch, owner-occupied units account for 37 (29.1%), while renter-occupied units make up 90 (70.9%).
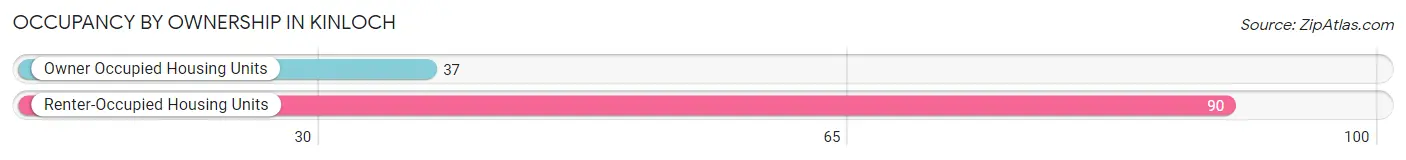
| Occupancy | # Housing Units | % Housing Units |
| Owner Occupied Housing Units | 37 | 29.1% |
| Renter-Occupied Housing Units | 90 | 70.9% |
| Total Occupied Housing Units | 127 | 100.0% |
Occupancy by Household Size in Kinloch
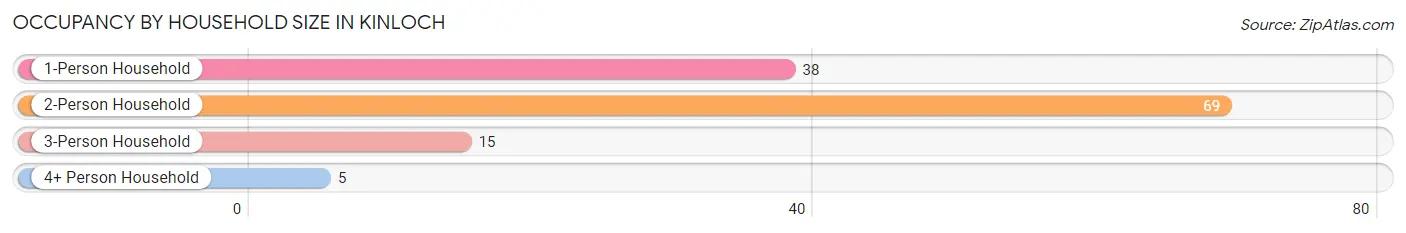
| Household Size | # Housing Units | % Housing Units |
| 1-Person Household | 38 | 29.9% |
| 2-Person Household | 69 | 54.3% |
| 3-Person Household | 15 | 11.8% |
| 4+ Person Household | 5 | 3.9% |
| Total Housing Units | 127 | 100.0% |
Occupancy by Ownership by Household Size in Kinloch
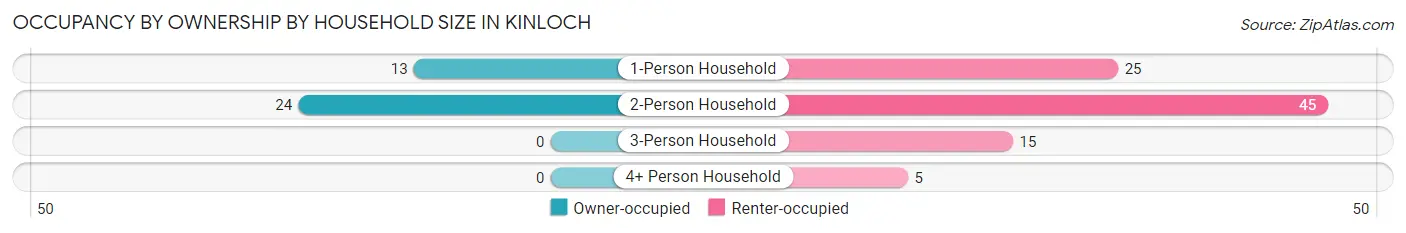
| Household Size | Owner-occupied | Renter-occupied |
| 1-Person Household | 13 (34.2%) | 25 (65.8%) |
| 2-Person Household | 24 (34.8%) | 45 (65.2%) |
| 3-Person Household | 0 (0.0%) | 15 (100.0%) |
| 4+ Person Household | 0 (0.0%) | 5 (100.0%) |
| Total Housing Units | 37 (29.1%) | 90 (70.9%) |
Occupancy by Educational Attainment in Kinloch
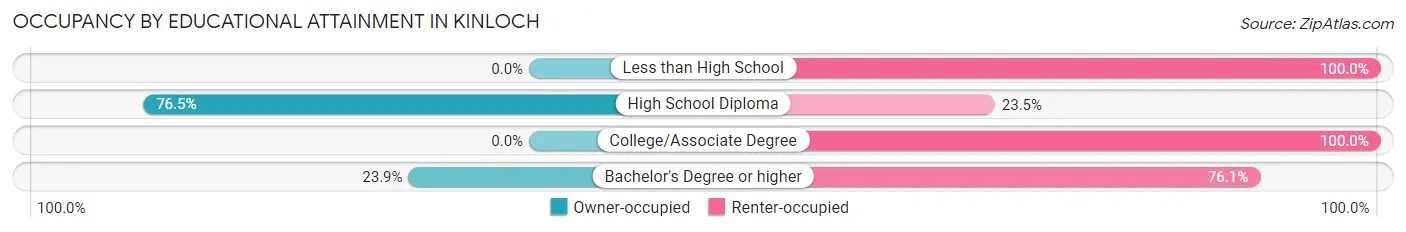
| Household Size | Owner-occupied | Renter-occupied |
| Less than High School | 0 (0.0%) | 13 (100.0%) |
| High School Diploma | 26 (76.5%) | 8 (23.5%) |
| College/Associate Degree | 0 (0.0%) | 34 (100.0%) |
| Bachelor's Degree or higher | 11 (23.9%) | 35 (76.1%) |
Occupancy by Age of Householder in Kinloch
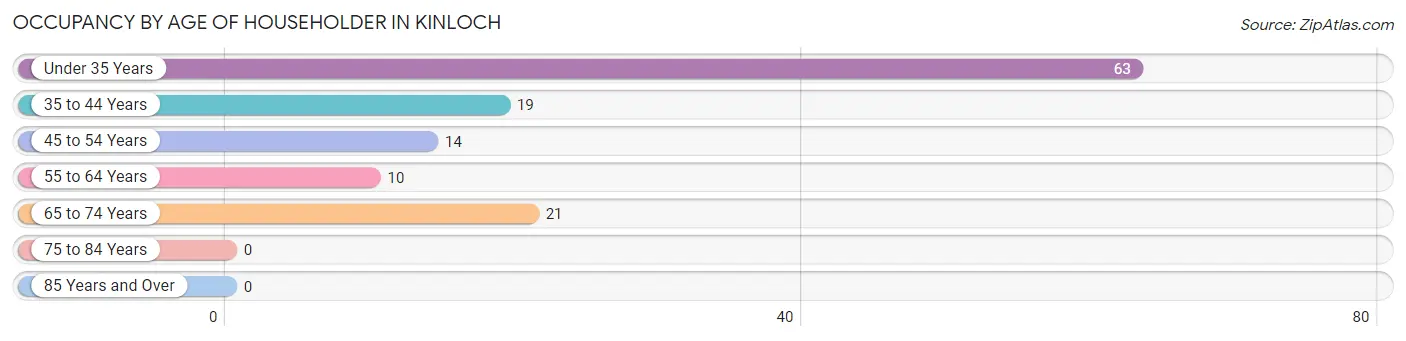
| Age Bracket | # Households | % Households |
| Under 35 Years | 63 | 49.6% |
| 35 to 44 Years | 19 | 15.0% |
| 45 to 54 Years | 14 | 11.0% |
| 55 to 64 Years | 10 | 7.9% |
| 65 to 74 Years | 21 | 16.5% |
| 75 to 84 Years | 0 | 0.0% |
| 85 Years and Over | 0 | 0.0% |
| Total | 127 | 100.0% |
Housing Finances in Kinloch
Median Income by Occupancy in Kinloch
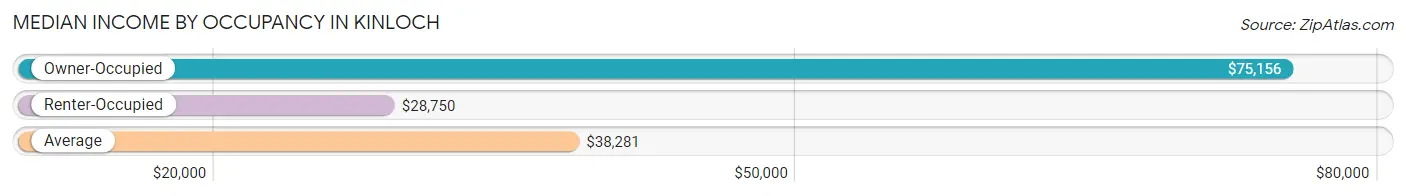
| Occupancy Type | # Households | Median Income |
| Owner-Occupied | 37 (29.1%) | $75,156 |
| Renter-Occupied | 90 (70.9%) | $28,750 |
| Average | 127 (100.0%) | $38,281 |
Occupancy by Householder Income Bracket in Kinloch
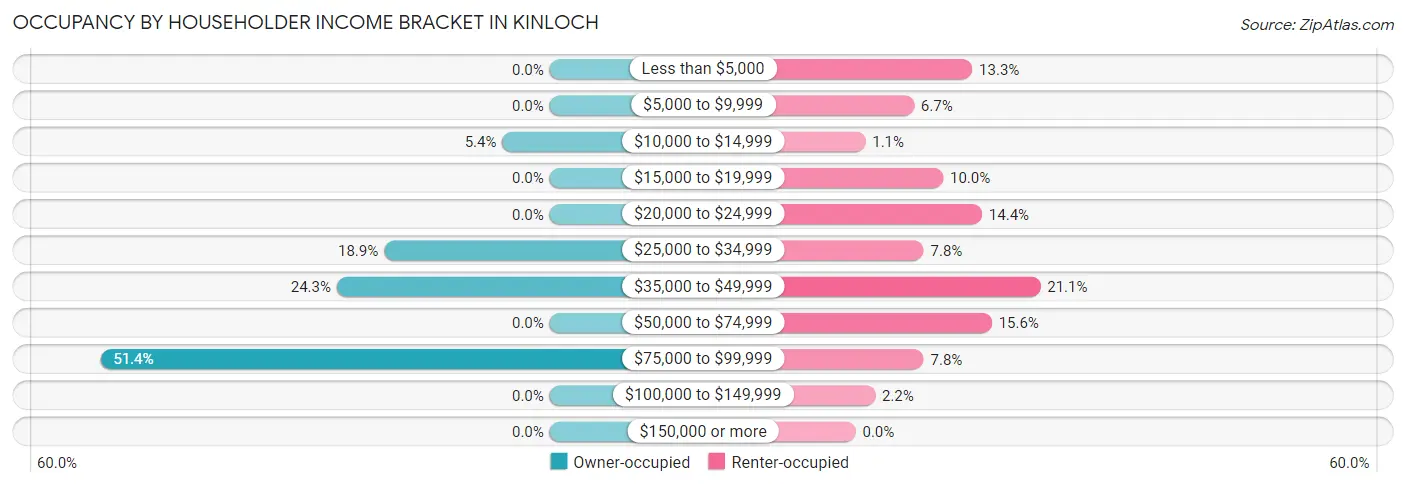
| Income Bracket | Owner-occupied | Renter-occupied |
| Less than $5,000 | 0 (0.0%) | 12 (13.3%) |
| $5,000 to $9,999 | 0 (0.0%) | 6 (6.7%) |
| $10,000 to $14,999 | 2 (5.4%) | 1 (1.1%) |
| $15,000 to $19,999 | 0 (0.0%) | 9 (10.0%) |
| $20,000 to $24,999 | 0 (0.0%) | 13 (14.4%) |
| $25,000 to $34,999 | 7 (18.9%) | 7 (7.8%) |
| $35,000 to $49,999 | 9 (24.3%) | 19 (21.1%) |
| $50,000 to $74,999 | 0 (0.0%) | 14 (15.6%) |
| $75,000 to $99,999 | 19 (51.3%) | 7 (7.8%) |
| $100,000 to $149,999 | 0 (0.0%) | 2 (2.2%) |
| $150,000 or more | 0 (0.0%) | 0 (0.0%) |
| Total | 37 (100.0%) | 90 (100.0%) |
Monthly Housing Cost Tiers in Kinloch
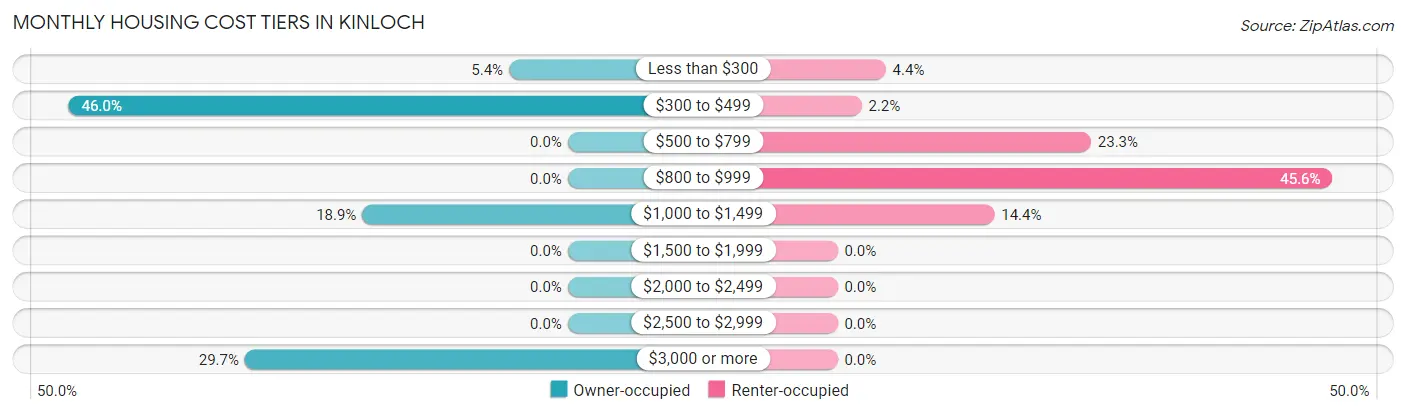
| Monthly Cost | Owner-occupied | Renter-occupied |
| Less than $300 | 2 (5.4%) | 4 (4.4%) |
| $300 to $499 | 17 (46.0%) | 2 (2.2%) |
| $500 to $799 | 0 (0.0%) | 21 (23.3%) |
| $800 to $999 | 0 (0.0%) | 41 (45.6%) |
| $1,000 to $1,499 | 7 (18.9%) | 13 (14.4%) |
| $1,500 to $1,999 | 0 (0.0%) | 0 (0.0%) |
| $2,000 to $2,499 | 0 (0.0%) | 0 (0.0%) |
| $2,500 to $2,999 | 0 (0.0%) | 0 (0.0%) |
| $3,000 or more | 11 (29.7%) | 0 (0.0%) |
| Total | 37 (100.0%) | 90 (100.0%) |
Physical Housing Characteristics in Kinloch
Housing Structures in Kinloch
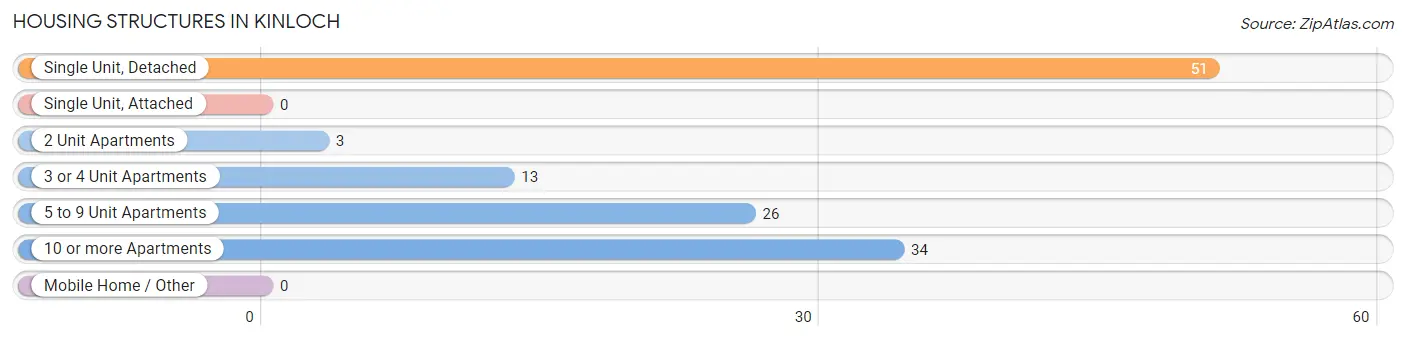
| Structure Type | # Housing Units | % Housing Units |
| Single Unit, Detached | 51 | 40.2% |
| Single Unit, Attached | 0 | 0.0% |
| 2 Unit Apartments | 3 | 2.4% |
| 3 or 4 Unit Apartments | 13 | 10.2% |
| 5 to 9 Unit Apartments | 26 | 20.5% |
| 10 or more Apartments | 34 | 26.8% |
| Mobile Home / Other | 0 | 0.0% |
| Total | 127 | 100.0% |
Housing Structures by Occupancy in Kinloch
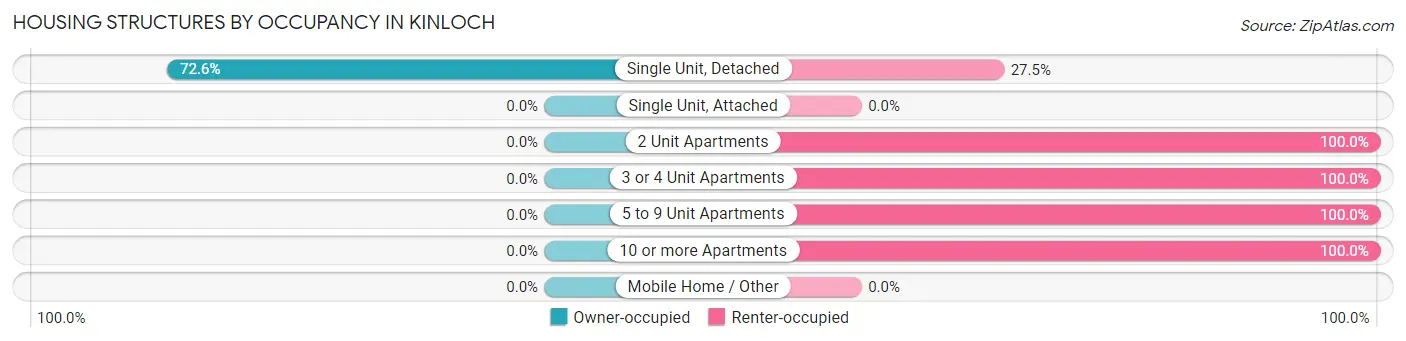
| Structure Type | Owner-occupied | Renter-occupied |
| Single Unit, Detached | 37 (72.6%) | 14 (27.5%) |
| Single Unit, Attached | 0 (0.0%) | 0 (0.0%) |
| 2 Unit Apartments | 0 (0.0%) | 3 (100.0%) |
| 3 or 4 Unit Apartments | 0 (0.0%) | 13 (100.0%) |
| 5 to 9 Unit Apartments | 0 (0.0%) | 26 (100.0%) |
| 10 or more Apartments | 0 (0.0%) | 34 (100.0%) |
| Mobile Home / Other | 0 (0.0%) | 0 (0.0%) |
| Total | 37 (29.1%) | 90 (70.9%) |
Housing Structures by Number of Rooms in Kinloch
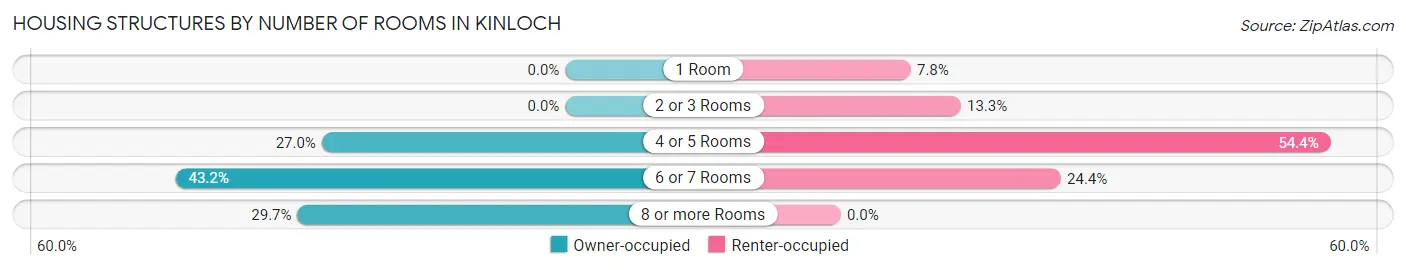
| Number of Rooms | Owner-occupied | Renter-occupied |
| 1 Room | 0 (0.0%) | 7 (7.8%) |
| 2 or 3 Rooms | 0 (0.0%) | 12 (13.3%) |
| 4 or 5 Rooms | 10 (27.0%) | 49 (54.4%) |
| 6 or 7 Rooms | 16 (43.2%) | 22 (24.4%) |
| 8 or more Rooms | 11 (29.7%) | 0 (0.0%) |
| Total | 37 (100.0%) | 90 (100.0%) |
Housing Structure by Heating Type in Kinloch
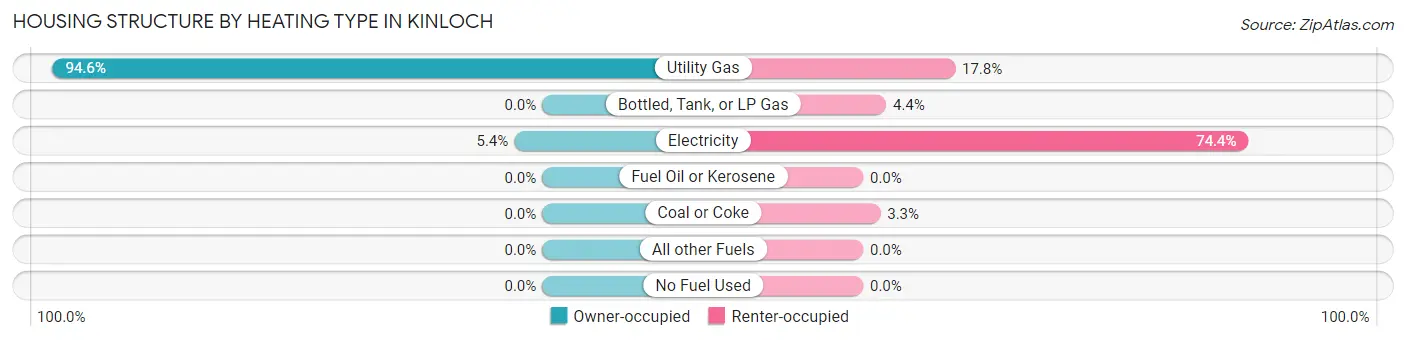
| Heating Type | Owner-occupied | Renter-occupied |
| Utility Gas | 35 (94.6%) | 16 (17.8%) |
| Bottled, Tank, or LP Gas | 0 (0.0%) | 4 (4.4%) |
| Electricity | 2 (5.4%) | 67 (74.4%) |
| Fuel Oil or Kerosene | 0 (0.0%) | 0 (0.0%) |
| Coal or Coke | 0 (0.0%) | 3 (3.3%) |
| All other Fuels | 0 (0.0%) | 0 (0.0%) |
| No Fuel Used | 0 (0.0%) | 0 (0.0%) |
| Total | 37 (100.0%) | 90 (100.0%) |
Household Vehicle Usage in Kinloch
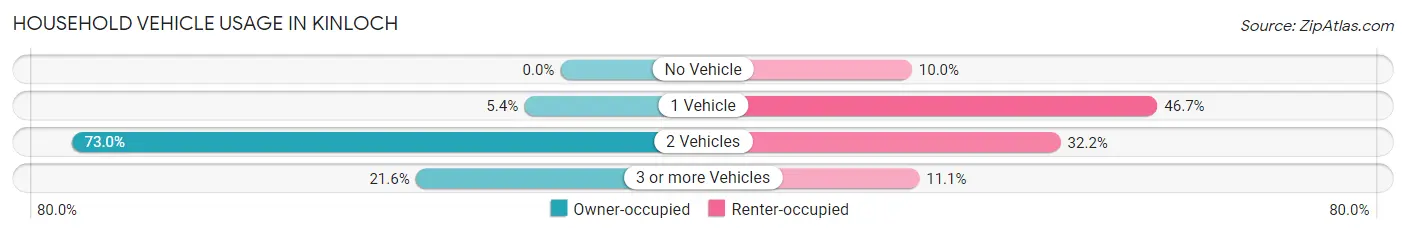
| Vehicles per Household | Owner-occupied | Renter-occupied |
| No Vehicle | 0 (0.0%) | 9 (10.0%) |
| 1 Vehicle | 2 (5.4%) | 42 (46.7%) |
| 2 Vehicles | 27 (73.0%) | 29 (32.2%) |
| 3 or more Vehicles | 8 (21.6%) | 10 (11.1%) |
| Total | 37 (100.0%) | 90 (100.0%) |
Real Estate & Mortgages in Kinloch
Real Estate and Mortgage Overview in Kinloch
| Characteristic | Without Mortgage | With Mortgage |
| Housing Units | 37 | 0 |
| Median Property Value | - | - |
| Median Household Income | $75,156 | $0 |
| Monthly Housing Costs | - | - |
| Real Estate Taxes | - | - |
Property Value by Mortgage Status in Kinloch
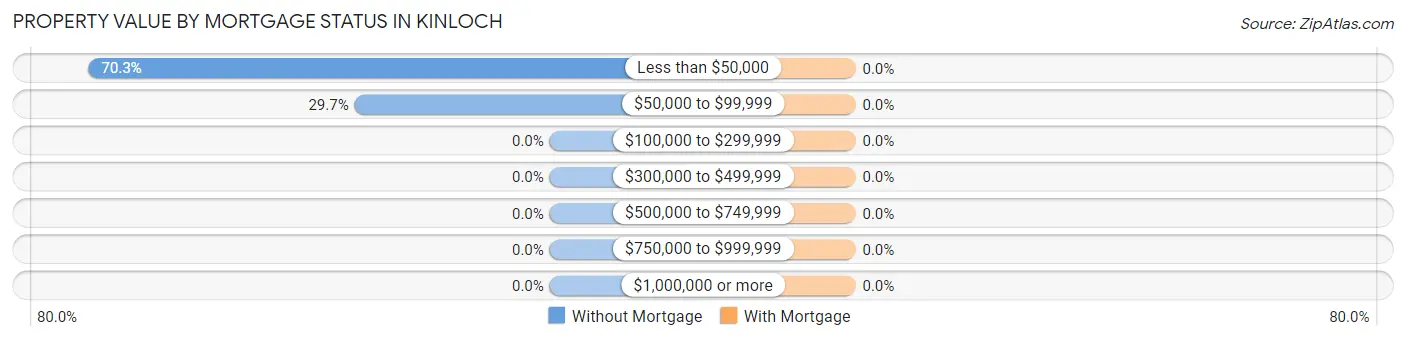
| Property Value | Without Mortgage | With Mortgage |
| Less than $50,000 | 26 (70.3%) | 0 (0.0%) |
| $50,000 to $99,999 | 11 (29.7%) | 0 (0.0%) |
| $100,000 to $299,999 | 0 (0.0%) | 0 (0.0%) |
| $300,000 to $499,999 | 0 (0.0%) | 0 (0.0%) |
| $500,000 to $749,999 | 0 (0.0%) | 0 (0.0%) |
| $750,000 to $999,999 | 0 (0.0%) | 0 (0.0%) |
| $1,000,000 or more | 0 (0.0%) | 0 (0.0%) |
| Total | 37 (100.0%) | 0 (0.0%) |
Household Income by Mortgage Status in Kinloch
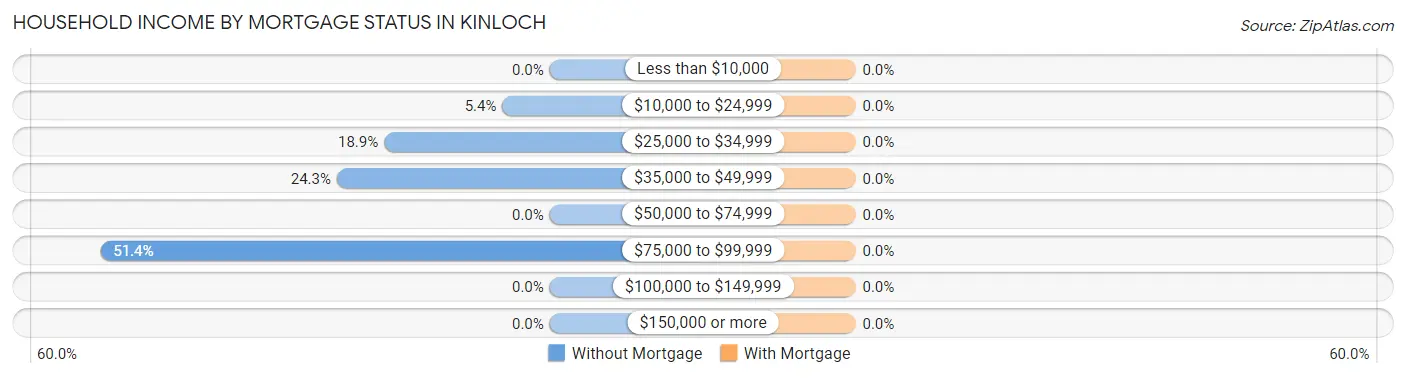
| Household Income | Without Mortgage | With Mortgage |
| Less than $10,000 | 0 (0.0%) | 0 (0.0%) |
| $10,000 to $24,999 | 2 (5.4%) | 0 (0.0%) |
| $25,000 to $34,999 | 7 (18.9%) | 0 (0.0%) |
| $35,000 to $49,999 | 9 (24.3%) | 0 (0.0%) |
| $50,000 to $74,999 | 0 (0.0%) | 0 (0.0%) |
| $75,000 to $99,999 | 19 (51.3%) | 0 (0.0%) |
| $100,000 to $149,999 | 0 (0.0%) | 0 (0.0%) |
| $150,000 or more | 0 (0.0%) | 0 (0.0%) |
| Total | 37 (100.0%) | 0 (0.0%) |
Property Value to Household Income Ratio in Kinloch
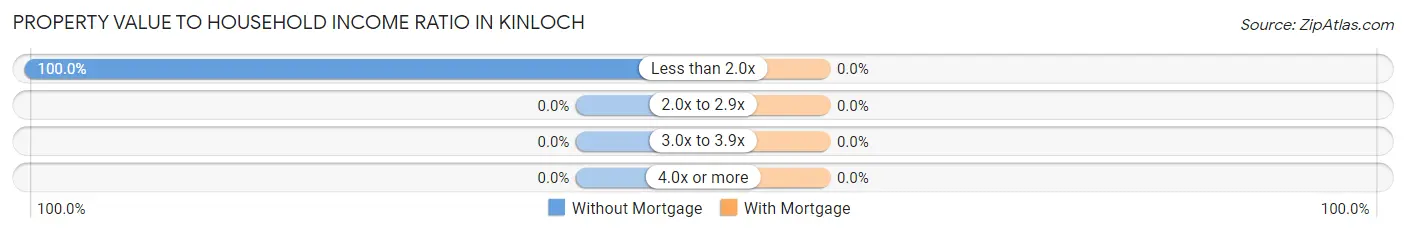
| Value-to-Income Ratio | Without Mortgage | With Mortgage |
| Less than 2.0x | 37 (100.0%) | 0 (0.0%) |
| 2.0x to 2.9x | 0 (0.0%) | 0 (0.0%) |
| 3.0x to 3.9x | 0 (0.0%) | 0 (0.0%) |
| 4.0x or more | 0 (0.0%) | 0 (0.0%) |
| Total | 37 (100.0%) | 0 (0.0%) |
Real Estate Taxes by Mortgage Status in Kinloch
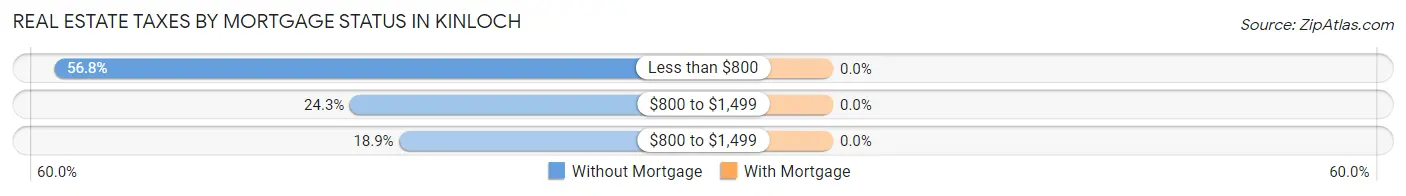
| Property Taxes | Without Mortgage | With Mortgage |
| Less than $800 | 21 (56.8%) | 0 (0.0%) |
| $800 to $1,499 | 9 (24.3%) | 0 (0.0%) |
| $800 to $1,499 | 7 (18.9%) | 0 (0.0%) |
| Total | 37 (100.0%) | 0 (0.0%) |
Health & Disability in Kinloch
Health Insurance Coverage by Age in Kinloch
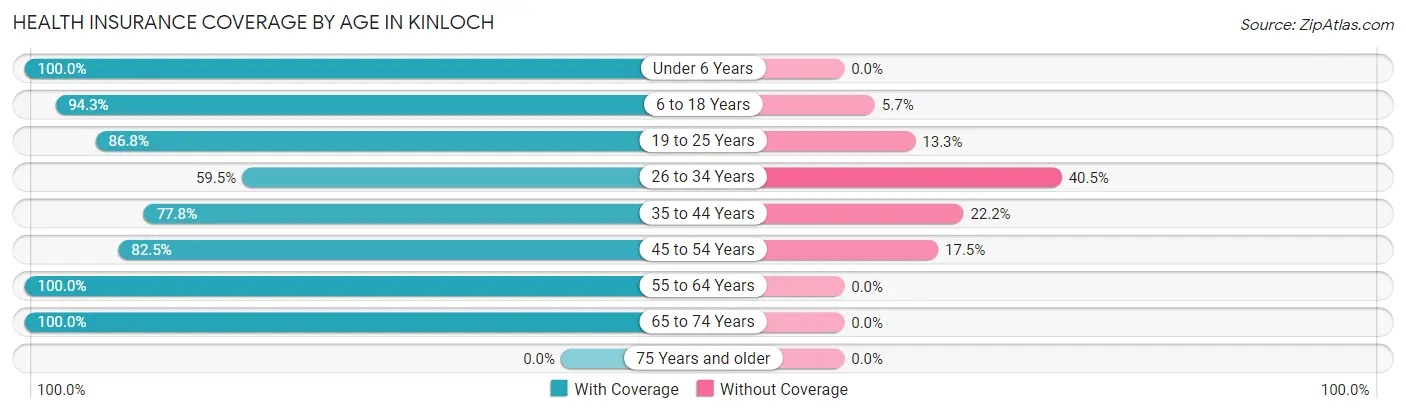
| Age Bracket | With Coverage | Without Coverage |
| Under 6 Years | 24 (100.0%) | 0 (0.0%) |
| 6 to 18 Years | 33 (94.3%) | 2 (5.7%) |
| 19 to 25 Years | 72 (86.8%) | 11 (13.3%) |
| 26 to 34 Years | 22 (59.5%) | 15 (40.5%) |
| 35 to 44 Years | 21 (77.8%) | 6 (22.2%) |
| 45 to 54 Years | 33 (82.5%) | 7 (17.5%) |
| 55 to 64 Years | 16 (100.0%) | 0 (0.0%) |
| 65 to 74 Years | 29 (100.0%) | 0 (0.0%) |
| 75 Years and older | 0 (0.0%) | 0 (0.0%) |
| Total | 250 (85.9%) | 41 (14.1%) |
Health Insurance Coverage by Citizenship Status in Kinloch
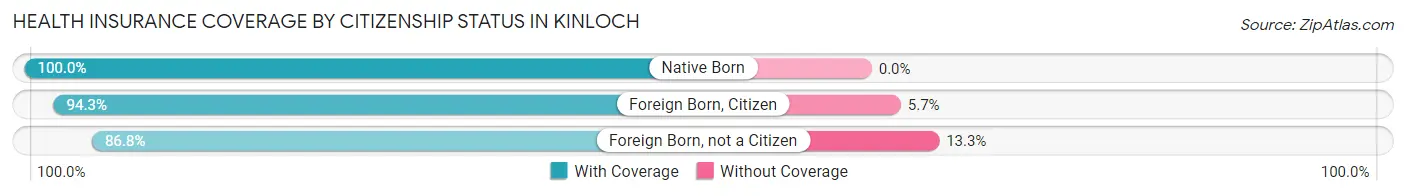
| Citizenship Status | With Coverage | Without Coverage |
| Native Born | 24 (100.0%) | 0 (0.0%) |
| Foreign Born, Citizen | 33 (94.3%) | 2 (5.7%) |
| Foreign Born, not a Citizen | 72 (86.8%) | 11 (13.3%) |
Health Insurance Coverage by Household Income in Kinloch
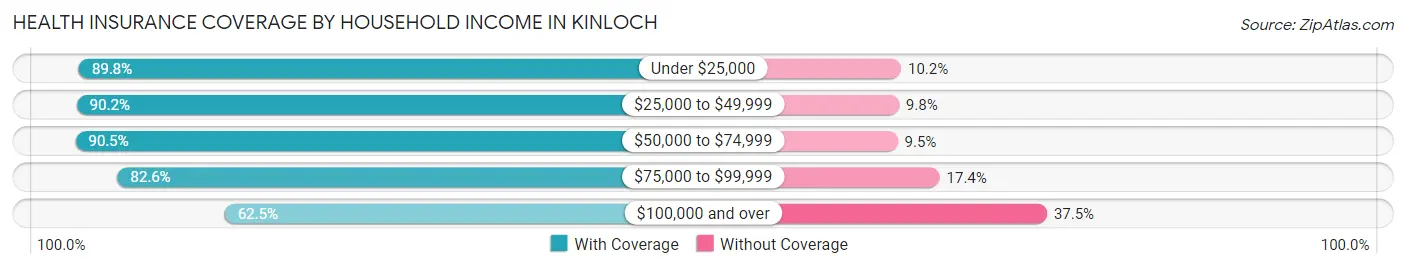
| Household Income | With Coverage | Without Coverage |
| Under $25,000 | 106 (89.8%) | 12 (10.2%) |
| $25,000 to $49,999 | 74 (90.2%) | 8 (9.8%) |
| $50,000 to $74,999 | 19 (90.5%) | 2 (9.5%) |
| $75,000 to $99,999 | 38 (82.6%) | 8 (17.4%) |
| $100,000 and over | 5 (62.5%) | 3 (37.5%) |
Public vs Private Health Insurance Coverage by Age in Kinloch
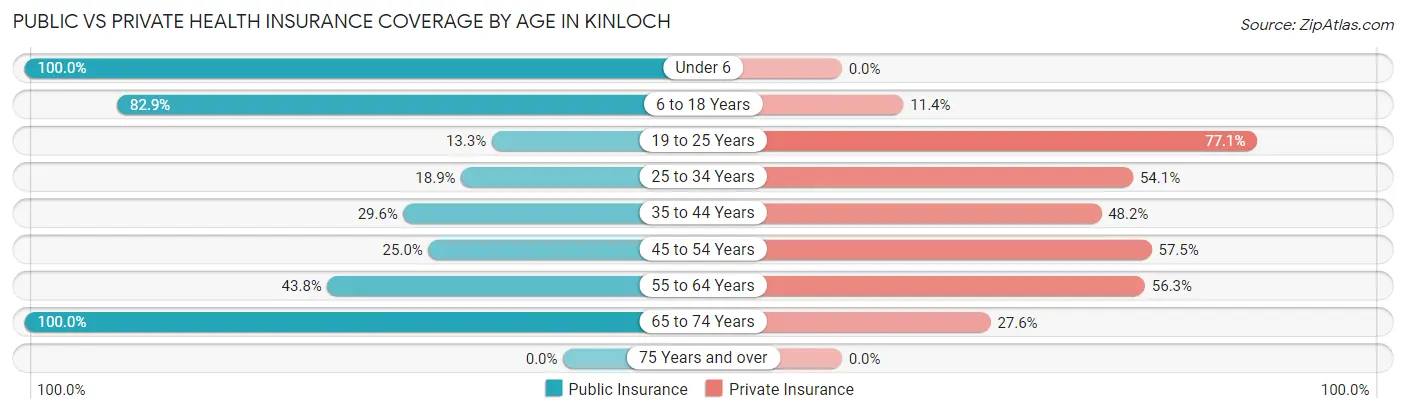
| Age Bracket | Public Insurance | Private Insurance |
| Under 6 | 24 (100.0%) | 0 (0.0%) |
| 6 to 18 Years | 29 (82.9%) | 4 (11.4%) |
| 19 to 25 Years | 11 (13.3%) | 64 (77.1%) |
| 25 to 34 Years | 7 (18.9%) | 20 (54.0%) |
| 35 to 44 Years | 8 (29.6%) | 13 (48.1%) |
| 45 to 54 Years | 10 (25.0%) | 23 (57.5%) |
| 55 to 64 Years | 7 (43.8%) | 9 (56.2%) |
| 65 to 74 Years | 29 (100.0%) | 8 (27.6%) |
| 75 Years and over | 0 (0.0%) | 0 (0.0%) |
| Total | 125 (43.0%) | 141 (48.4%) |
Disability Status by Sex by Age in Kinloch
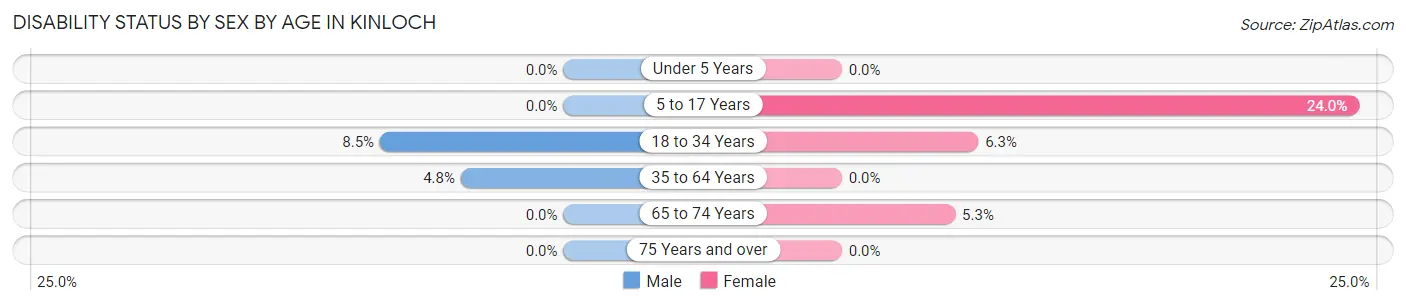
| Age Bracket | Male | Female |
| Under 5 Years | 0 (0.0%) | 0 (0.0%) |
| 5 to 17 Years | 0 (0.0%) | 6 (24.0%) |
| 18 to 34 Years | 4 (8.5%) | 5 (6.3%) |
| 35 to 64 Years | 2 (4.8%) | 0 (0.0%) |
| 65 to 74 Years | 0 (0.0%) | 1 (5.3%) |
| 75 Years and over | 0 (0.0%) | 0 (0.0%) |
Disability Class by Sex by Age in Kinloch
Disability Class: Hearing Difficulty
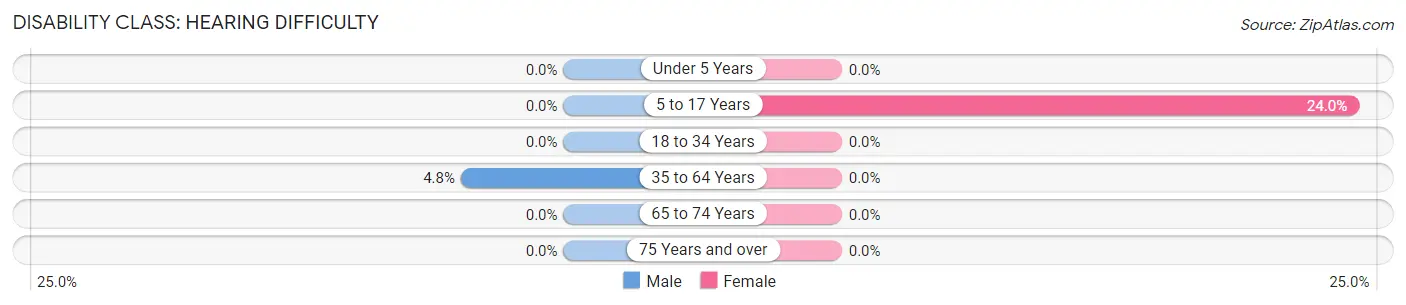
| Age Bracket | Male | Female |
| Under 5 Years | 0 (0.0%) | 0 (0.0%) |
| 5 to 17 Years | 0 (0.0%) | 6 (24.0%) |
| 18 to 34 Years | 0 (0.0%) | 0 (0.0%) |
| 35 to 64 Years | 2 (4.8%) | 0 (0.0%) |
| 65 to 74 Years | 0 (0.0%) | 0 (0.0%) |
| 75 Years and over | 0 (0.0%) | 0 (0.0%) |
Disability Class: Vision Difficulty
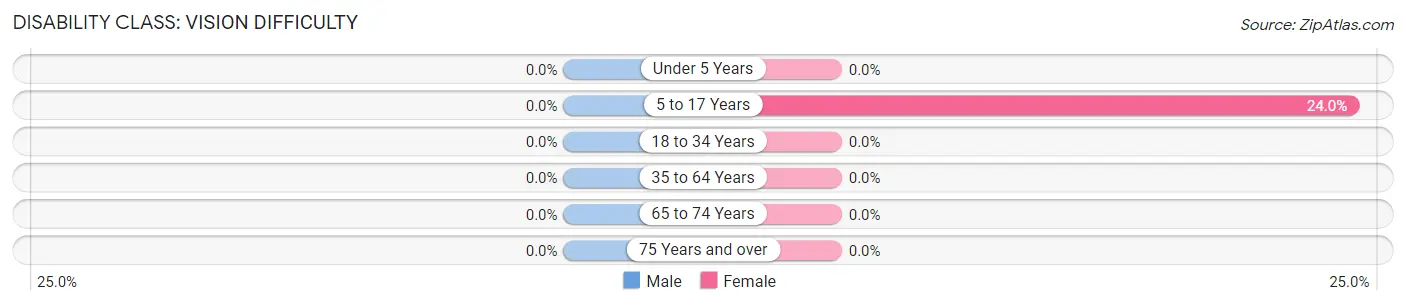
| Age Bracket | Male | Female |
| Under 5 Years | 0 (0.0%) | 0 (0.0%) |
| 5 to 17 Years | 0 (0.0%) | 6 (24.0%) |
| 18 to 34 Years | 0 (0.0%) | 0 (0.0%) |
| 35 to 64 Years | 0 (0.0%) | 0 (0.0%) |
| 65 to 74 Years | 0 (0.0%) | 0 (0.0%) |
| 75 Years and over | 0 (0.0%) | 0 (0.0%) |
Disability Class: Cognitive Difficulty
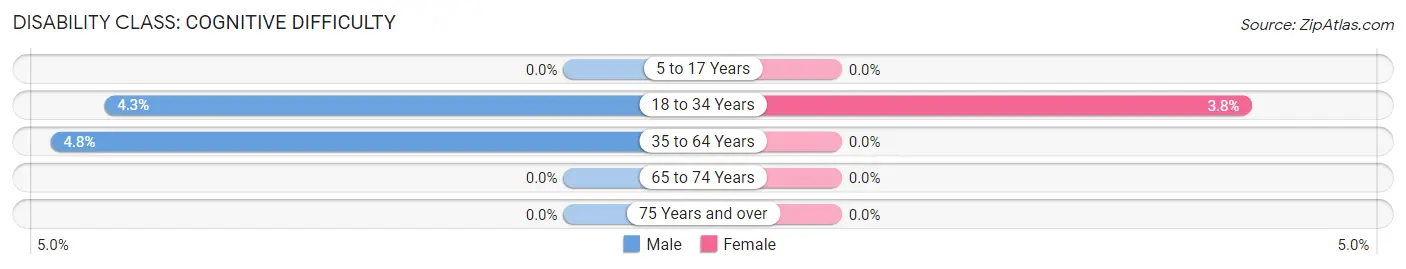
| Age Bracket | Male | Female |
| 5 to 17 Years | 0 (0.0%) | 0 (0.0%) |
| 18 to 34 Years | 2 (4.3%) | 3 (3.8%) |
| 35 to 64 Years | 2 (4.8%) | 0 (0.0%) |
| 65 to 74 Years | 0 (0.0%) | 0 (0.0%) |
| 75 Years and over | 0 (0.0%) | 0 (0.0%) |
Disability Class: Ambulatory Difficulty
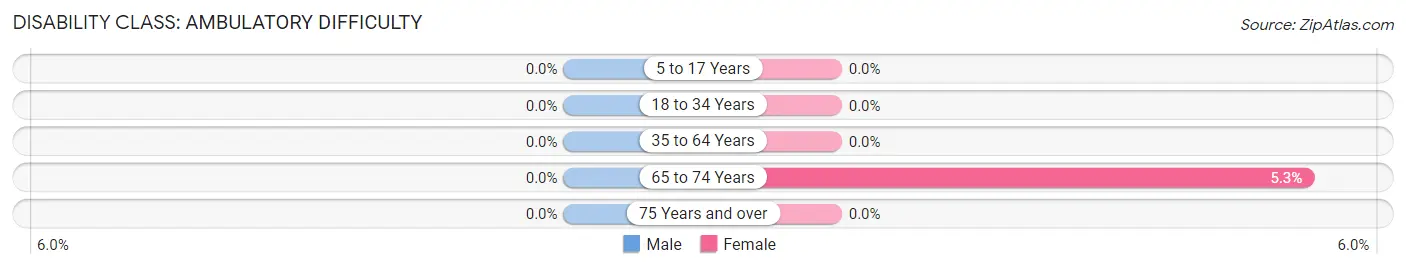
| Age Bracket | Male | Female |
| 5 to 17 Years | 0 (0.0%) | 0 (0.0%) |
| 18 to 34 Years | 0 (0.0%) | 0 (0.0%) |
| 35 to 64 Years | 0 (0.0%) | 0 (0.0%) |
| 65 to 74 Years | 0 (0.0%) | 1 (5.3%) |
| 75 Years and over | 0 (0.0%) | 0 (0.0%) |
Disability Class: Self-Care Difficulty
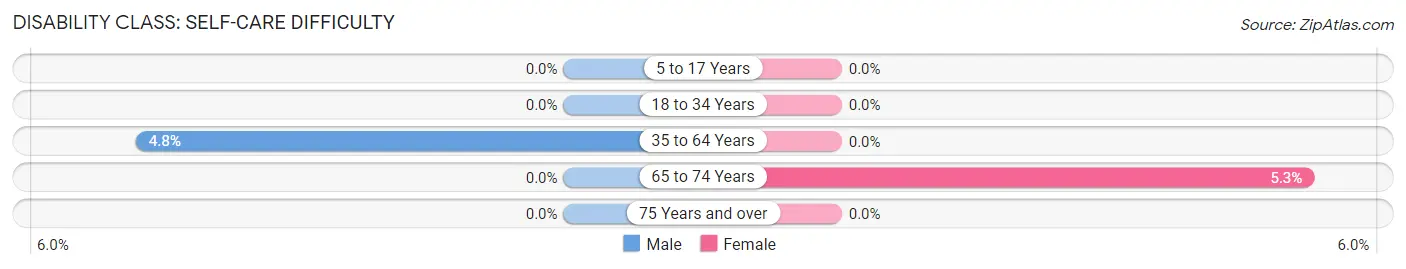
| Age Bracket | Male | Female |
| 5 to 17 Years | 0 (0.0%) | 0 (0.0%) |
| 18 to 34 Years | 0 (0.0%) | 0 (0.0%) |
| 35 to 64 Years | 2 (4.8%) | 0 (0.0%) |
| 65 to 74 Years | 0 (0.0%) | 1 (5.3%) |
| 75 Years and over | 0 (0.0%) | 0 (0.0%) |
Technology Access in Kinloch
Computing Device Access in Kinloch
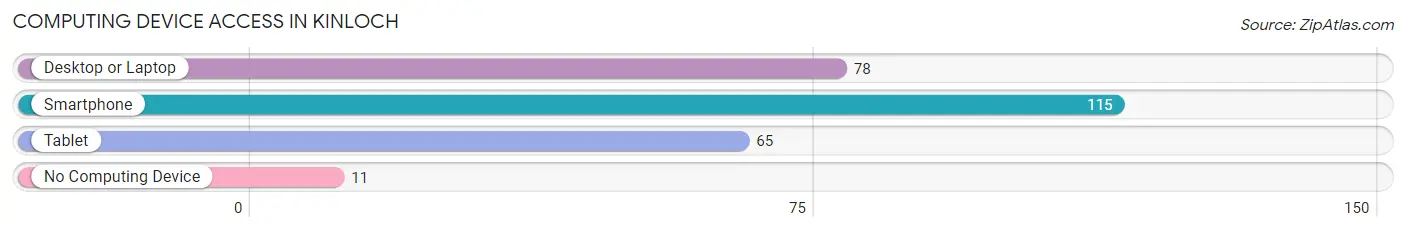
| Device Type | # Households | % Households |
| Desktop or Laptop | 78 | 61.4% |
| Smartphone | 115 | 90.5% |
| Tablet | 65 | 51.2% |
| No Computing Device | 11 | 8.7% |
| Total | 127 | 100.0% |
Internet Access in Kinloch
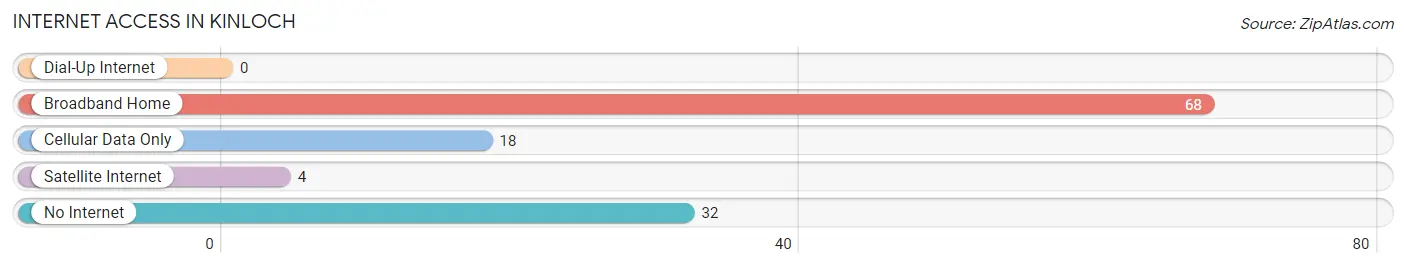
| Internet Type | # Households | % Households |
| Dial-Up Internet | 0 | 0.0% |
| Broadband Home | 68 | 53.5% |
| Cellular Data Only | 18 | 14.2% |
| Satellite Internet | 4 | 3.2% |
| No Internet | 32 | 25.2% |
| Total | 127 | 100.0% |
Kinloch Summary
Kinloch, Missouri is a small city located in St. Louis County, Missouri. It is situated on the banks of the Missouri River, just north of St. Louis. The city was founded in 1855 and incorporated in 1872. It is the oldest African-American municipality in the state of Missouri.
History
Kinloch was founded by freed slaves in 1855. The city was named after the Scottish town of Kinloch, which was the birthplace of the first African-American settler, William Kinloch. The city was incorporated in 1872 and was the first African-American municipality in the state of Missouri.
In the late 19th century, Kinloch was a thriving community with a population of over 1,000 people. The city was home to a variety of businesses, including a hotel, a bank, a newspaper, and a school. The city was also home to a number of churches, including the First African Methodist Episcopal Church, which was founded in 1872.
In the early 20th century, Kinloch experienced a period of decline. The Great Depression and the construction of the nearby Lambert-St. Louis International Airport caused many of the businesses and residents to leave the city. By the 1950s, the population had dropped to just over 500 people.
In the late 20th century, Kinloch experienced a period of revitalization. The city was designated as a National Historic District in 1978 and the Kinloch Historical Society was founded in 1982. The city also received a grant from the U.S. Department of Housing and Urban Development in the 1990s, which allowed for the construction of new housing and the renovation of existing buildings.
Geography
Kinloch is located in St. Louis County, Missouri. It is situated on the banks of the Missouri River, just north of St. Louis. The city covers an area of 1.2 square miles and has a population of 1,845 people, according to the 2010 census.
The city is located in a predominantly residential area, with a few commercial businesses located along the main thoroughfares. The city is also home to a number of parks, including Kinloch Park, which features a playground, a basketball court, and a baseball field.
Economy
The economy of Kinloch is largely based on the service industry. The city is home to a variety of businesses, including restaurants, retail stores, and professional services. The city is also home to a number of manufacturing companies, including a steel mill and a printing company.
The city is also home to a number of government offices, including the St. Louis County Courthouse and the St. Louis County Police Department. The city is also home to a number of educational institutions, including the Kinloch School District and the Kinloch Community College.
Demographics
According to the 2010 census, the population of Kinloch was 1,845 people. The racial makeup of the city was 95.3% African American, 2.2% White, 0.3% Native American, 0.2% Asian, 0.1% Pacific Islander, and 1.9% from other races. The median household income was $25,938 and the median family income was $30,938.
The city is served by the Kinloch School District, which includes two elementary schools, a middle school, and a high school. The city is also home to a number of churches, including the First African Methodist Episcopal Church, which was founded in 1872.
Conclusion
Kinloch, Missouri is a small city located in St. Louis County, Missouri. It is situated on the banks of the Missouri River, just north of St. Louis. The city was founded in 1855 and incorporated in 1872. It is the oldest African-American municipality in the state of Missouri. The city has a population of 1,845 people, according to the 2010 census, and is largely based on the service industry. The city is home to a variety of businesses, including restaurants, retail stores, and professional services. The city is also home to a number of government offices, including the St. Louis County Courthouse and the St. Louis County Police Department. The city is served by the Kinloch School District, which includes two elementary schools, a middle school, and a high school. The city is also home to a number of churches, including the First African Methodist Episcopal Church, which was founded in 1872.
Common Questions
What is Per Capita Income in Kinloch?
Per Capita income in Kinloch is $20,810.
What is the Median Family Income in Kinloch?
Median Family Income in Kinloch is $30,357.
What is the Median Household income in Kinloch?
Median Household Income in Kinloch is $38,281.
What is Income or Wage Gap in Kinloch?
Income or Wage Gap in Kinloch is 9.8%.
Women in Kinloch earn 90.2 cents for every dollar earned by a man.
What is Inequality or Gini Index in Kinloch?
Inequality or Gini Index in Kinloch is 0.40.
What is the Total Population of Kinloch?
Total Population of Kinloch is 291.
What is the Total Male Population of Kinloch?
Total Male Population of Kinloch is 118.
What is the Total Female Population of Kinloch?
Total Female Population of Kinloch is 173.
What is the Ratio of Males per 100 Females in Kinloch?
There are 68.21 Males per 100 Females in Kinloch.
What is the Ratio of Females per 100 Males in Kinloch?
There are 146.61 Females per 100 Males in Kinloch.
What is the Median Population Age in Kinloch?
Median Population Age in Kinloch is 26.3 Years.
What is the Average Family Size in Kinloch
Average Family Size in Kinloch is 2.8 People.
What is the Average Household Size in Kinloch
Average Household Size in Kinloch is 2.2 People.
How Large is the Labor Force in Kinloch?
There are 177 People in the Labor Forcein in Kinloch.
What is the Percentage of People in the Labor Force in Kinloch?
73.1% of People are in the Labor Force in Kinloch.
What is the Unemployment Rate in Kinloch?
Unemployment Rate in Kinloch is 1.1%.