Timberlane, LA Map & Demographics
Timberlane Map
Timberlane Overview
$27,908
PER CAPITA INCOME
$71,875
AVG FAMILY INCOME
$64,591
AVG HOUSEHOLD INCOME
9.6%
WAGE / INCOME GAP [ % ]
90.4¢/ $1
WAGE / INCOME GAP [ $ ]
$8,318
FAMILY INCOME DEFICIT
0.49
INEQUALITY / GINI INDEX
10,912
TOTAL POPULATION
4,819
MALE POPULATION
6,093
FEMALE POPULATION
79.09
MALES / 100 FEMALES
126.44
FEMALES / 100 MALES
32.7
MEDIAN AGE
3.6
AVG FAMILY SIZE
3.0
AVG HOUSEHOLD SIZE
5,092
LABOR FORCE [ PEOPLE ]
67.2%
PERCENT IN LABOR FORCE
10.9%
UNEMPLOYMENT RATE
Income in Timberlane
Income Overview in Timberlane
Per Capita Income in Timberlane is $27,908, while median incomes of families and households are $71,875 and $64,591 respectively.
| Characteristic | Number | Measure |
| Per Capita Income | 10,912 | $27,908 |
| Median Family Income | 2,627 | $71,875 |
| Mean Family Income | 2,627 | $100,470 |
| Median Household Income | 3,647 | $64,591 |
| Mean Household Income | 3,647 | $93,035 |
| Income Deficit | 2,627 | $8,318 |
| Wage / Income Gap (%) | 10,912 | 9.56% |
| Wage / Income Gap ($) | 10,912 | 90.44¢ per $1 |
| Gini / Inequality Index | 10,912 | 0.49 |
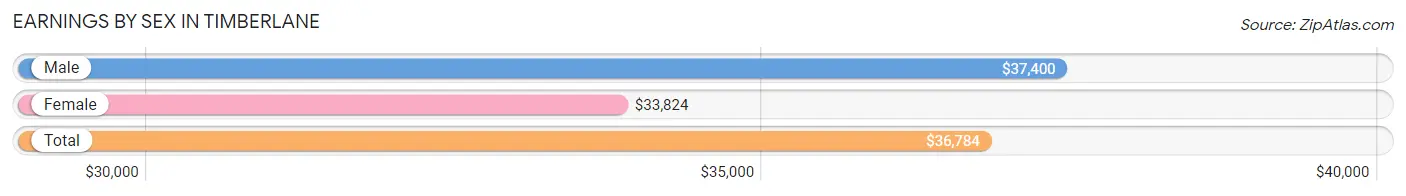
Earnings by Sex in Timberlane
Average Earnings in Timberlane are $36,784, $37,400 for men and $33,824 for women, a difference of 9.6%.
| Sex | Number | Average Earnings |
| Male | 2,499 (49.1%) | $37,400 |
| Female | 2,588 (50.9%) | $33,824 |
| Total | 5,087 (100.0%) | $36,784 |
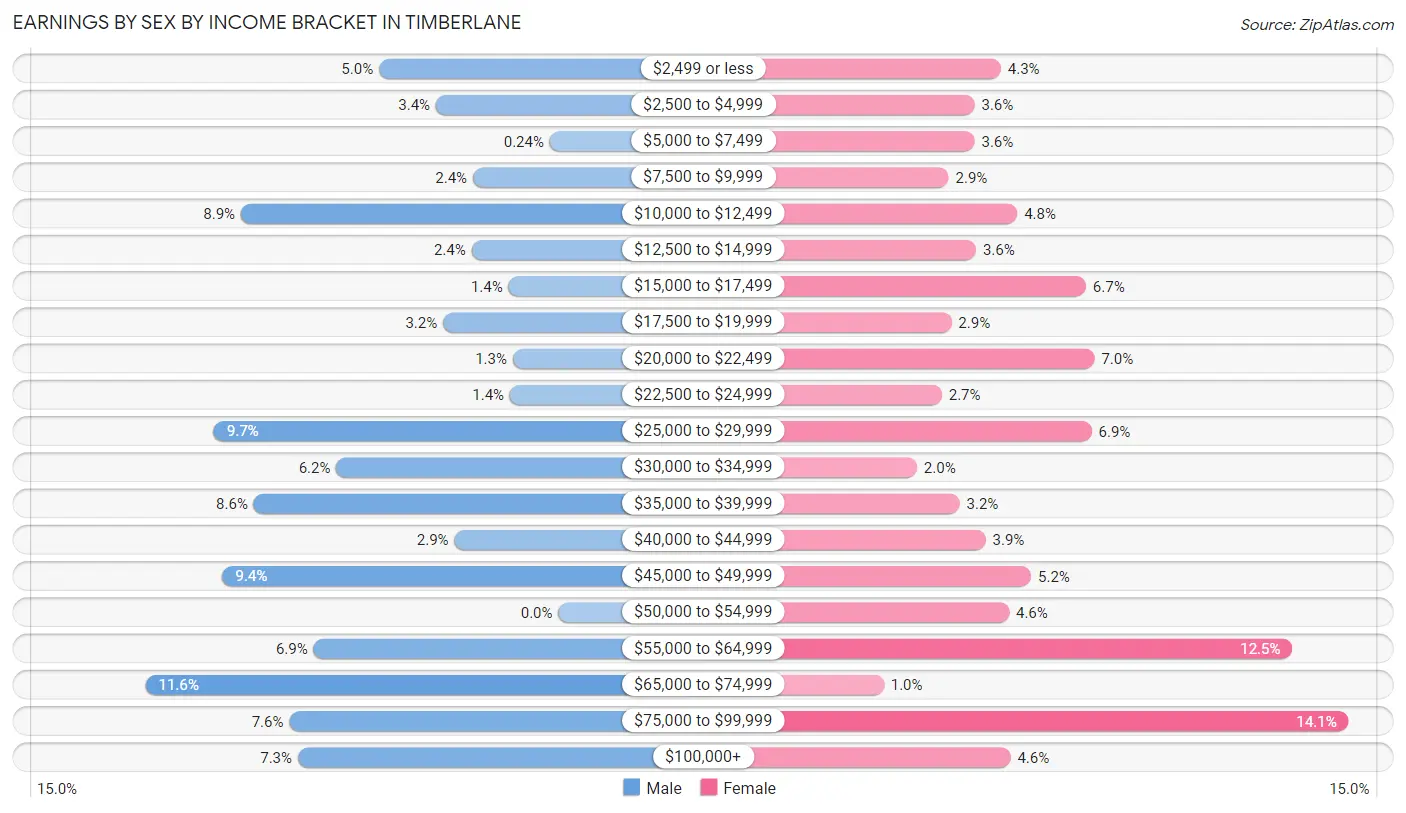
Earnings by Sex by Income Bracket in Timberlane
The most common earnings brackets in Timberlane are $65,000 to $74,999 for men (290 | 11.6%) and $75,000 to $99,999 for women (365 | 14.1%).
| Income | Male | Female |
| $2,499 or less | 126 (5.0%) | 112 (4.3%) |
| $2,500 to $4,999 | 86 (3.4%) | 93 (3.6%) |
| $5,000 to $7,499 | 6 (0.2%) | 93 (3.6%) |
| $7,500 to $9,999 | 60 (2.4%) | 74 (2.9%) |
| $10,000 to $12,499 | 223 (8.9%) | 124 (4.8%) |
| $12,500 to $14,999 | 61 (2.4%) | 94 (3.6%) |
| $15,000 to $17,499 | 35 (1.4%) | 174 (6.7%) |
| $17,500 to $19,999 | 81 (3.2%) | 76 (2.9%) |
| $20,000 to $22,499 | 32 (1.3%) | 180 (7.0%) |
| $22,500 to $24,999 | 34 (1.4%) | 69 (2.7%) |
| $25,000 to $29,999 | 242 (9.7%) | 178 (6.9%) |
| $30,000 to $34,999 | 156 (6.2%) | 51 (2.0%) |
| $35,000 to $39,999 | 214 (8.6%) | 82 (3.2%) |
| $40,000 to $44,999 | 73 (2.9%) | 101 (3.9%) |
| $45,000 to $49,999 | 236 (9.4%) | 134 (5.2%) |
| $50,000 to $54,999 | 0 (0.0%) | 118 (4.6%) |
| $55,000 to $64,999 | 172 (6.9%) | 324 (12.5%) |
| $65,000 to $74,999 | 290 (11.6%) | 27 (1.0%) |
| $75,000 to $99,999 | 189 (7.6%) | 365 (14.1%) |
| $100,000+ | 183 (7.3%) | 119 (4.6%) |
| Total | 2,499 (100.0%) | 2,588 (100.0%) |
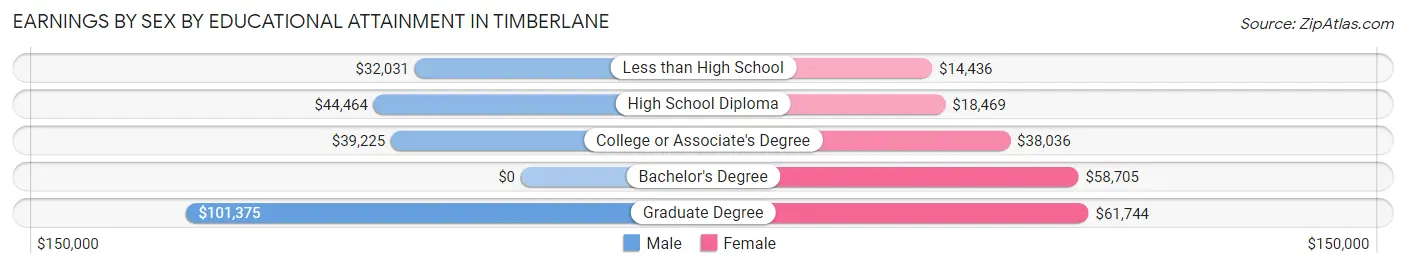
Earnings by Sex by Educational Attainment in Timberlane
Average earnings in Timberlane are $43,534 for men and $39,513 for women, a difference of 9.2%. Men with an educational attainment of graduate degree enjoy the highest average annual earnings of $101,375, while those with less than high school education earn the least with $32,031. Women with an educational attainment of graduate degree earn the most with the average annual earnings of $61,744, while those with less than high school education have the smallest earnings of $14,436.
| Educational Attainment | Male Income | Female Income |
| Less than High School | $32,031 | $14,436 |
| High School Diploma | $44,464 | $18,469 |
| College or Associate's Degree | $39,225 | $38,036 |
| Bachelor's Degree | - | - |
| Graduate Degree | $101,375 | $61,744 |
| Total | $43,534 | $39,513 |
Family Income in Timberlane
Family Income Brackets in Timberlane
According to the Timberlane family income data, there are 512 families falling into the $100,000 to $149,999 income range, which is the most common income bracket and makes up 19.5% of all families. Conversely, the less than $10,000 income bracket is the least frequent group with only 32 families (1.2%) belonging to this category.
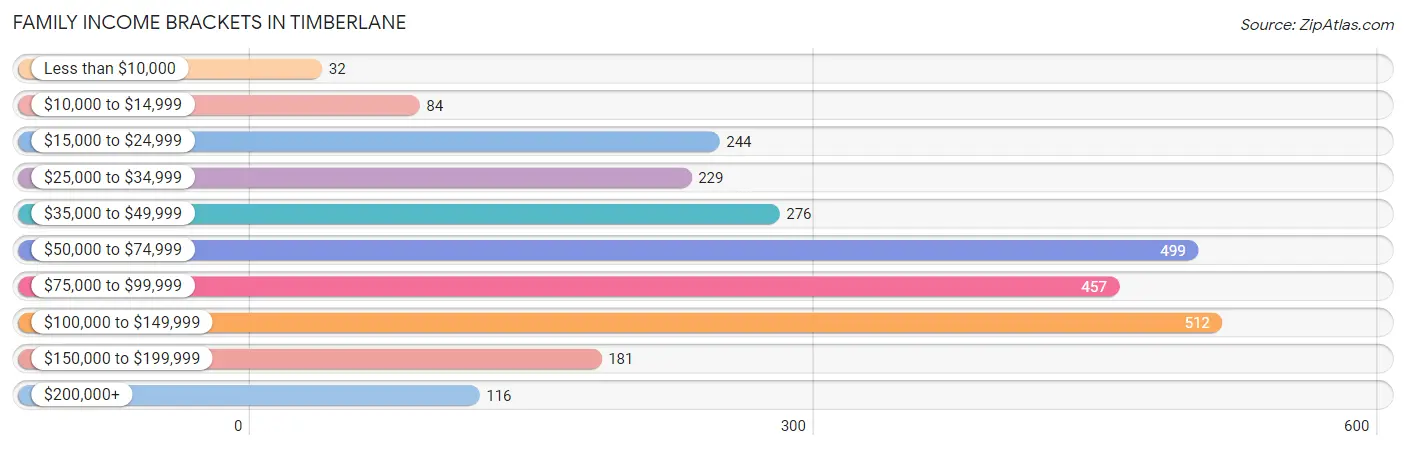
| Income Bracket | # Families | % Families |
| Less than $10,000 | 32 | 1.2% |
| $10,000 to $14,999 | 84 | 3.2% |
| $15,000 to $24,999 | 244 | 9.3% |
| $25,000 to $34,999 | 229 | 8.7% |
| $35,000 to $49,999 | 276 | 10.5% |
| $50,000 to $74,999 | 499 | 19.0% |
| $75,000 to $99,999 | 457 | 17.4% |
| $100,000 to $149,999 | 512 | 19.5% |
| $150,000 to $199,999 | 181 | 6.9% |
| $200,000+ | 116 | 4.4% |
Family Income by Famaliy Size in Timberlane
5-person families (179 | 6.8%) account for the highest median family income in Timberlane with $150,673 per family, while 2-person families (854 | 32.5%) have the highest median income of $34,206 per family member.
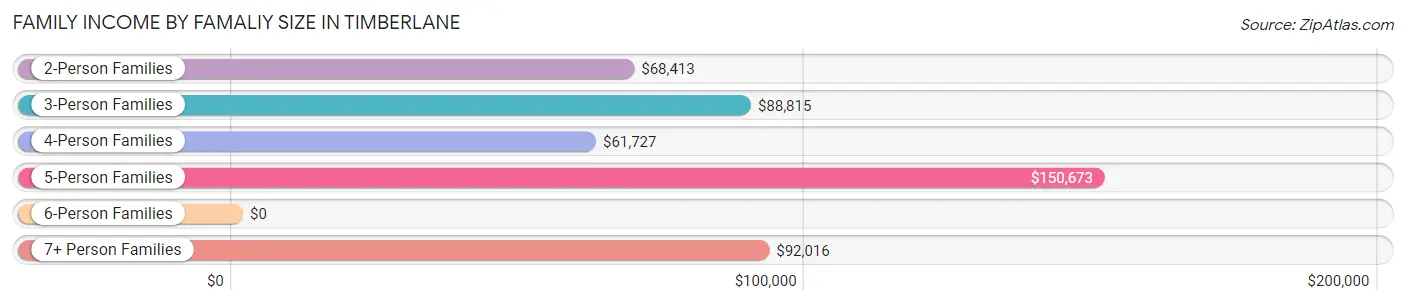
| Income Bracket | # Families | Median Income |
| 2-Person Families | 854 (32.5%) | $68,413 |
| 3-Person Families | 579 (22.0%) | $88,815 |
| 4-Person Families | 724 (27.6%) | $61,727 |
| 5-Person Families | 179 (6.8%) | $150,673 |
| 6-Person Families | 241 (9.2%) | $0 |
| 7+ Person Families | 50 (1.9%) | $92,016 |
| Total | 2,627 (100.0%) | $71,875 |
Family Income by Number of Earners in Timberlane
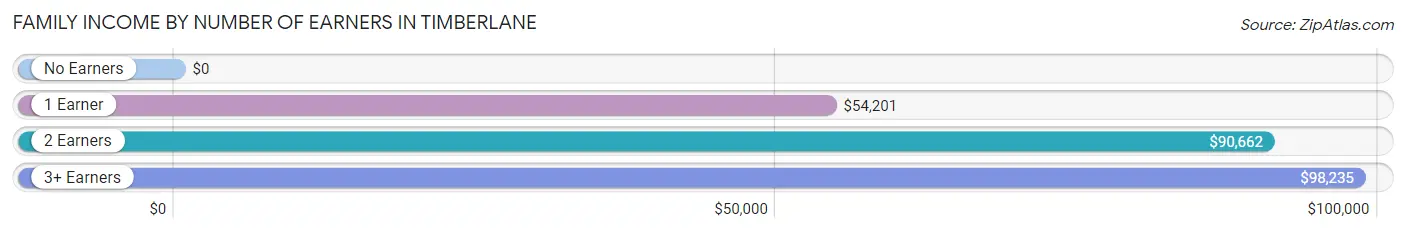
| Number of Earners | # Families | Median Income |
| No Earners | 223 (8.5%) | $0 |
| 1 Earner | 949 (36.1%) | $54,201 |
| 2 Earners | 1,301 (49.5%) | $90,662 |
| 3+ Earners | 154 (5.9%) | $98,235 |
| Total | 2,627 (100.0%) | $71,875 |
Household Income in Timberlane
Household Income Brackets in Timberlane
With 711 households falling in the category, the $50,000 to $74,999 income range is the most frequent in Timberlane, accounting for 19.5% of all households. In contrast, only 88 households (2.4%) fall into the $10,000 to $14,999 income bracket, making it the least populous group.
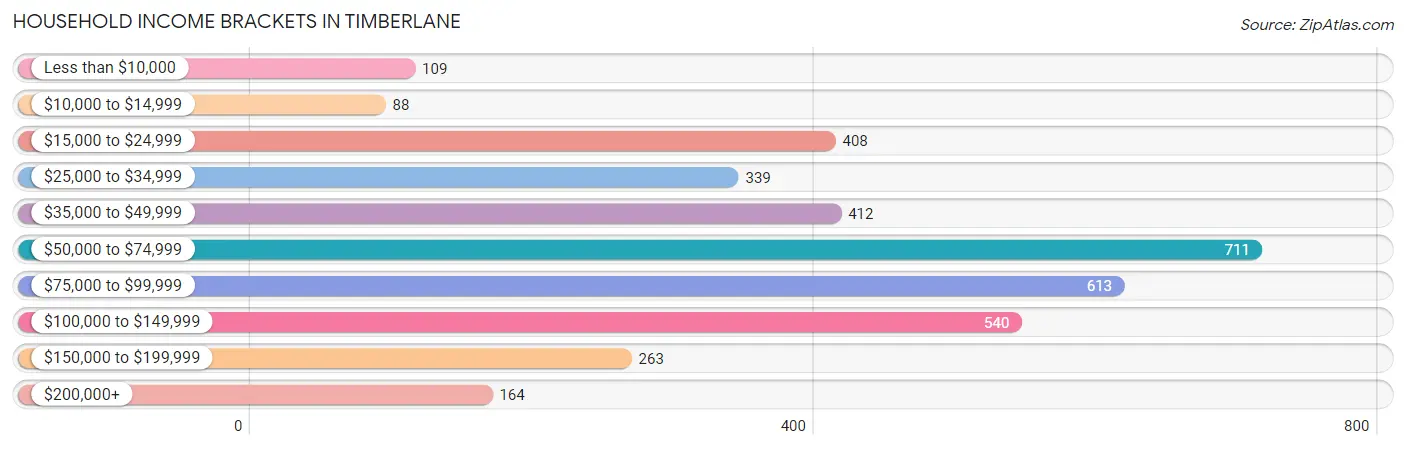
| Income Bracket | # Households | % Households |
| Less than $10,000 | 109 | 3.0% |
| $10,000 to $14,999 | 88 | 2.4% |
| $15,000 to $24,999 | 408 | 11.2% |
| $25,000 to $34,999 | 339 | 9.3% |
| $35,000 to $49,999 | 412 | 11.3% |
| $50,000 to $74,999 | 711 | 19.5% |
| $75,000 to $99,999 | 613 | 16.8% |
| $100,000 to $149,999 | 540 | 14.8% |
| $150,000 to $199,999 | 263 | 7.2% |
| $200,000+ | 164 | 4.5% |
Household Income by Householder Age in Timberlane
The median household income in Timberlane is $64,591, with the highest median household income of $84,951 found in the 45 to 64 years age bracket for the primary householder. A total of 1,173 households (32.2%) fall into this category. Meanwhile, the 15 to 24 years age bracket for the primary householder has the lowest median household income of $27,034, with 109 households (3.0%) in this group.
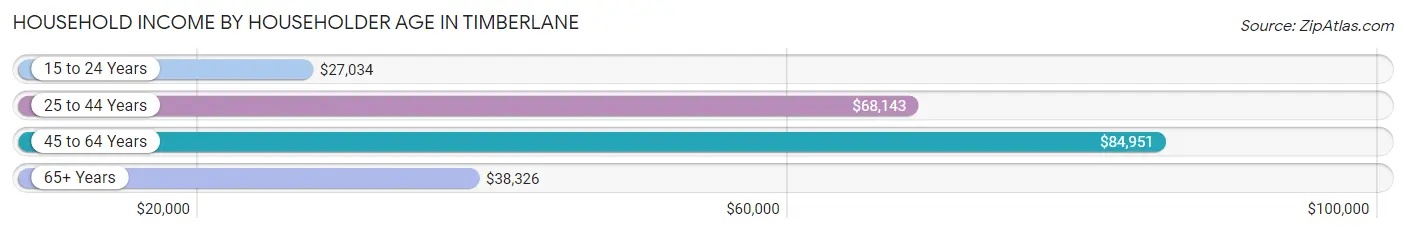
| Income Bracket | # Households | Median Income |
| 15 to 24 Years | 109 (3.0%) | $27,034 |
| 25 to 44 Years | 1,470 (40.3%) | $68,143 |
| 45 to 64 Years | 1,173 (32.2%) | $84,951 |
| 65+ Years | 895 (24.5%) | $38,326 |
| Total | 3,647 (100.0%) | $64,591 |
Poverty in Timberlane
Income Below Poverty by Sex and Age in Timberlane
With 18.1% poverty level for males and 18.3% for females among the residents of Timberlane, 25 to 34 year old males and under 5 year old females are the most vulnerable to poverty, with 175 males (38.8%) and 282 females (29.7%) in their respective age groups living below the poverty level.
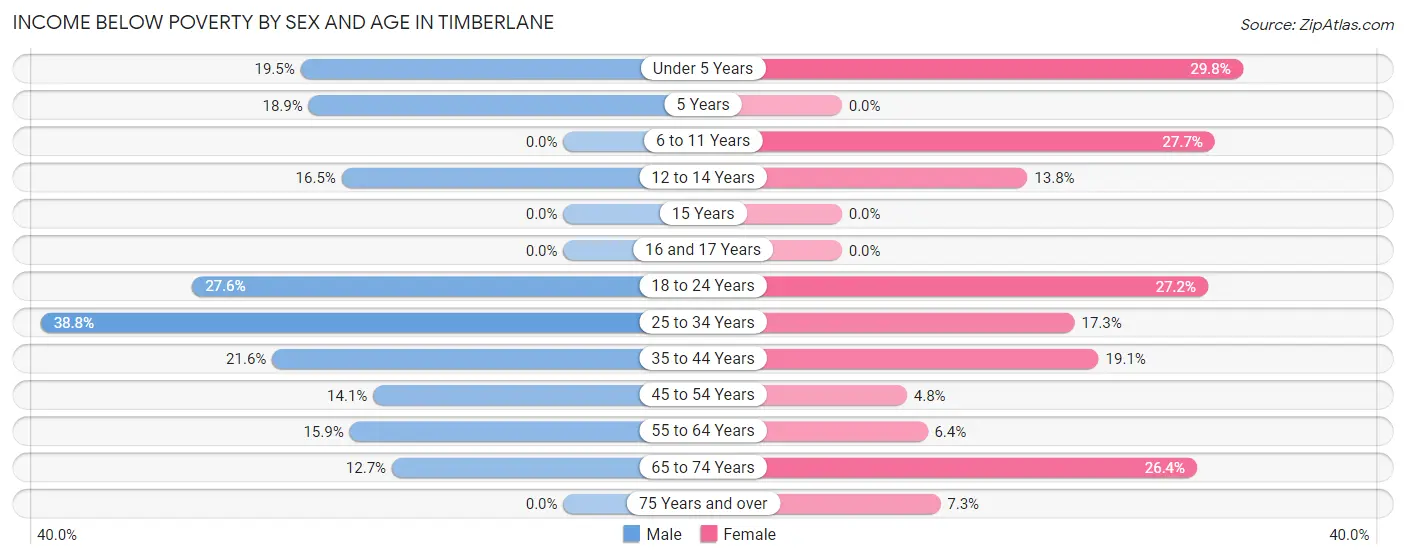
| Age Bracket | Male | Female |
| Under 5 Years | 95 (19.5%) | 282 (29.7%) |
| 5 Years | 14 (18.9%) | 0 (0.0%) |
| 6 to 11 Years | 0 (0.0%) | 181 (27.7%) |
| 12 to 14 Years | 67 (16.5%) | 51 (13.8%) |
| 15 Years | 0 (0.0%) | 0 (0.0%) |
| 16 and 17 Years | 0 (0.0%) | 0 (0.0%) |
| 18 to 24 Years | 127 (27.6%) | 97 (27.2%) |
| 25 to 34 Years | 175 (38.8%) | 175 (17.3%) |
| 35 to 44 Years | 197 (21.6%) | 144 (19.1%) |
| 45 to 54 Years | 83 (14.1%) | 29 (4.8%) |
| 55 to 64 Years | 71 (15.9%) | 32 (6.4%) |
| 65 to 74 Years | 41 (12.7%) | 97 (26.4%) |
| 75 Years and over | 0 (0.0%) | 23 (7.3%) |
| Total | 870 (18.1%) | 1,111 (18.3%) |
Income Above Poverty by Sex and Age in Timberlane
According to the poverty statistics in Timberlane, males aged 6 to 11 years and females aged 5 years are the age groups that are most secure financially, with 100.0% of males and 100.0% of females in these age groups living above the poverty line.
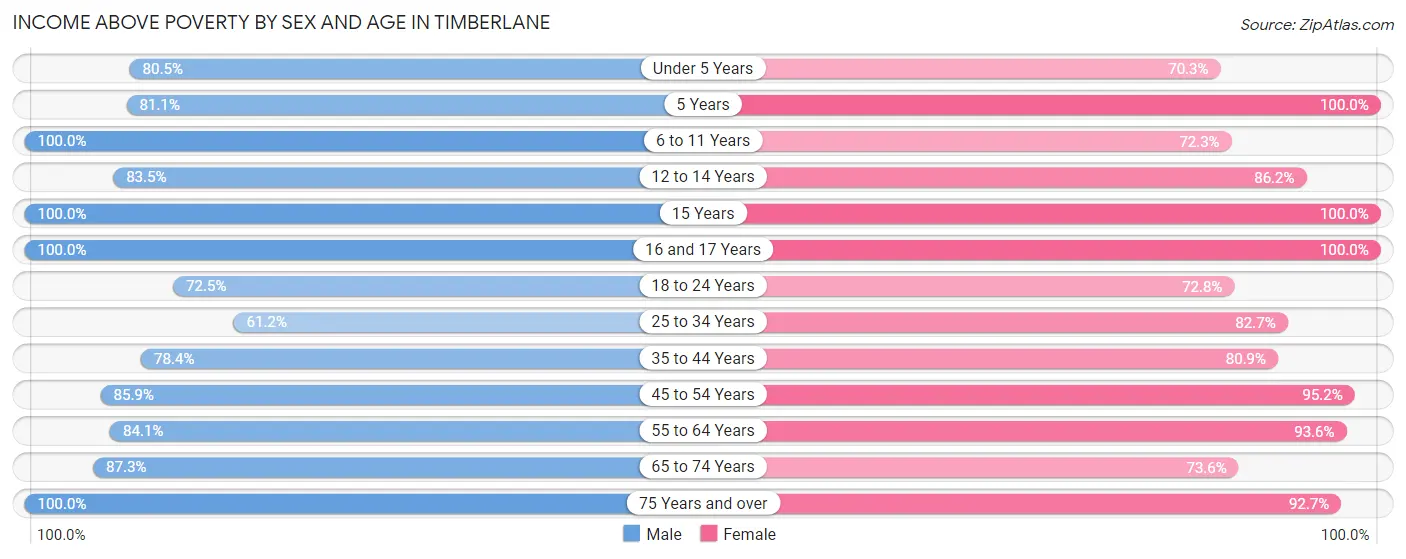
| Age Bracket | Male | Female |
| Under 5 Years | 392 (80.5%) | 666 (70.3%) |
| 5 Years | 60 (81.1%) | 20 (100.0%) |
| 6 to 11 Years | 341 (100.0%) | 473 (72.3%) |
| 12 to 14 Years | 340 (83.5%) | 319 (86.2%) |
| 15 Years | 19 (100.0%) | 15 (100.0%) |
| 16 and 17 Years | 41 (100.0%) | 150 (100.0%) |
| 18 to 24 Years | 334 (72.5%) | 260 (72.8%) |
| 25 to 34 Years | 276 (61.2%) | 838 (82.7%) |
| 35 to 44 Years | 714 (78.4%) | 611 (80.9%) |
| 45 to 54 Years | 505 (85.9%) | 572 (95.2%) |
| 55 to 64 Years | 376 (84.1%) | 471 (93.6%) |
| 65 to 74 Years | 281 (87.3%) | 271 (73.6%) |
| 75 Years and over | 244 (100.0%) | 291 (92.7%) |
| Total | 3,923 (81.9%) | 4,957 (81.7%) |
Income Below Poverty Among Married-Couple Families in Timberlane
The poverty statistics for married-couple families in Timberlane show that 12.6% or 228 of the total 1,816 families live below the poverty line. Families with 3 or 4 children have the highest poverty rate of 50.4%, comprising of 135 families. On the other hand, families with 5 or more children have the lowest poverty rate of 0.0%, which includes 0 families.
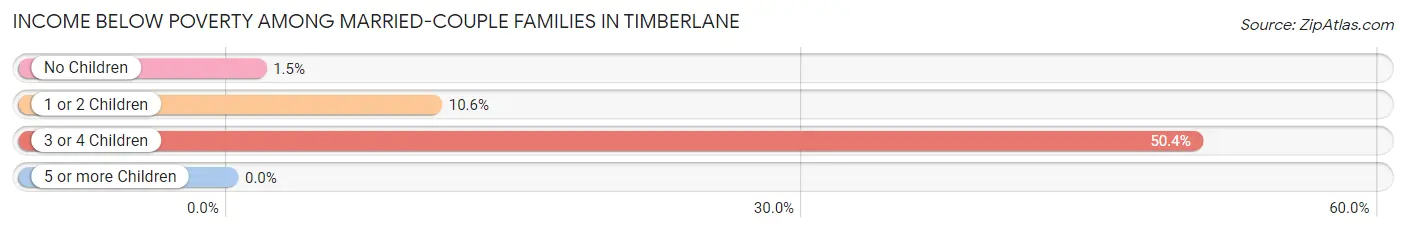
| Children | Above Poverty | Below Poverty |
| No Children | 735 (98.5%) | 11 (1.5%) |
| 1 or 2 Children | 689 (89.4%) | 82 (10.6%) |
| 3 or 4 Children | 133 (49.6%) | 135 (50.4%) |
| 5 or more Children | 31 (100.0%) | 0 (0.0%) |
| Total | 1,588 (87.4%) | 228 (12.6%) |
Income Below Poverty Among Single-Parent Households in Timberlane
According to the poverty data in Timberlane, 39.4% or 82 single-father households and 26.5% or 160 single-mother households are living below the poverty line. Among single-father households, those with no children have the highest poverty rate, with 67 households (59.8%) experiencing poverty. Likewise, among single-mother households, those with no children have the highest poverty rate, with 68 households (48.9%) falling below the poverty line.
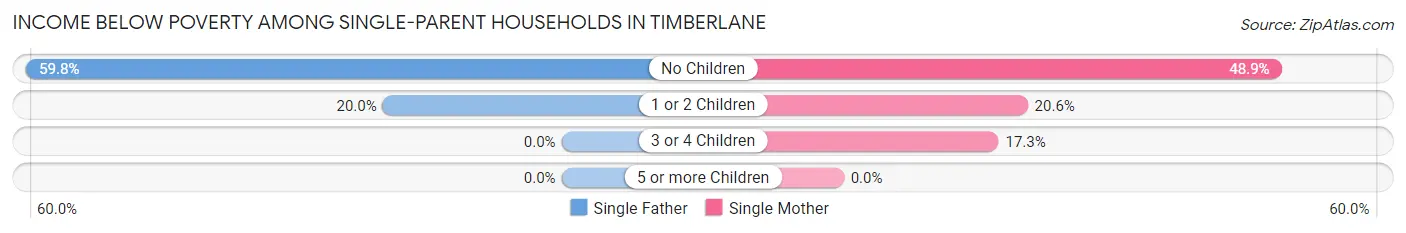
| Children | Single Father | Single Mother |
| No Children | 67 (59.8%) | 68 (48.9%) |
| 1 or 2 Children | 15 (20.0%) | 74 (20.6%) |
| 3 or 4 Children | 0 (0.0%) | 18 (17.3%) |
| 5 or more Children | 0 (0.0%) | 0 (0.0%) |
| Total | 82 (39.4%) | 160 (26.5%) |
Income Below Poverty Among Married-Couple vs Single-Parent Households in Timberlane
The poverty data for Timberlane shows that 228 of the married-couple family households (12.6%) and 242 of the single-parent households (29.8%) are living below the poverty level. Within the married-couple family households, those with 3 or 4 children have the highest poverty rate, with 135 households (50.4%) falling below the poverty line. Among the single-parent households, those with no children have the highest poverty rate, with 135 household (53.8%) living below poverty.
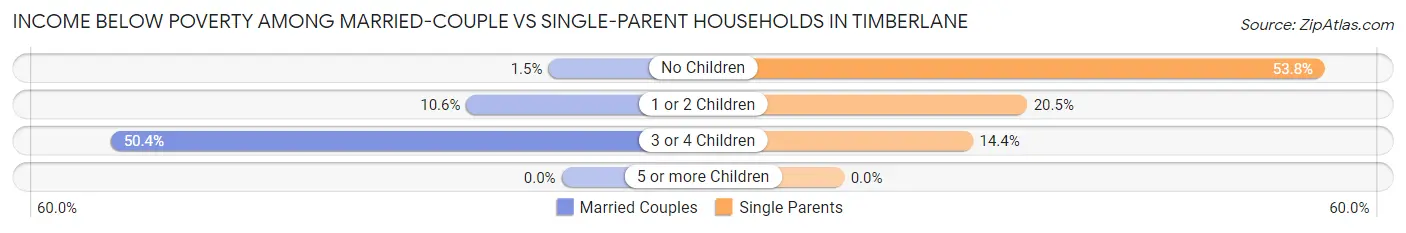
| Children | Married-Couple Families | Single-Parent Households |
| No Children | 11 (1.5%) | 135 (53.8%) |
| 1 or 2 Children | 82 (10.6%) | 89 (20.5%) |
| 3 or 4 Children | 135 (50.4%) | 18 (14.4%) |
| 5 or more Children | 0 (0.0%) | 0 (0.0%) |
| Total | 228 (12.6%) | 242 (29.8%) |
Race in Timberlane
The most populous races in Timberlane are Black / African American (4,953 | 45.4%), White / Caucasian (3,846 | 35.2%), and Hispanic or Latino (1,985 | 18.2%).
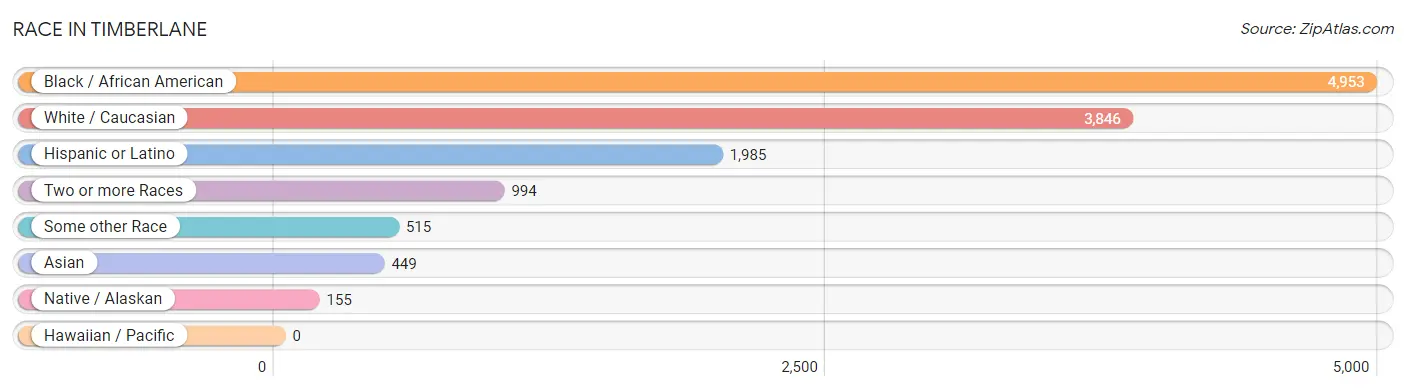
| Race | # Population | % Population |
| Asian | 449 | 4.1% |
| Black / African American | 4,953 | 45.4% |
| Hawaiian / Pacific | 0 | 0.0% |
| Hispanic or Latino | 1,985 | 18.2% |
| Native / Alaskan | 155 | 1.4% |
| White / Caucasian | 3,846 | 35.2% |
| Two or more Races | 994 | 9.1% |
| Some other Race | 515 | 4.7% |
| Total | 10,912 | 100.0% |
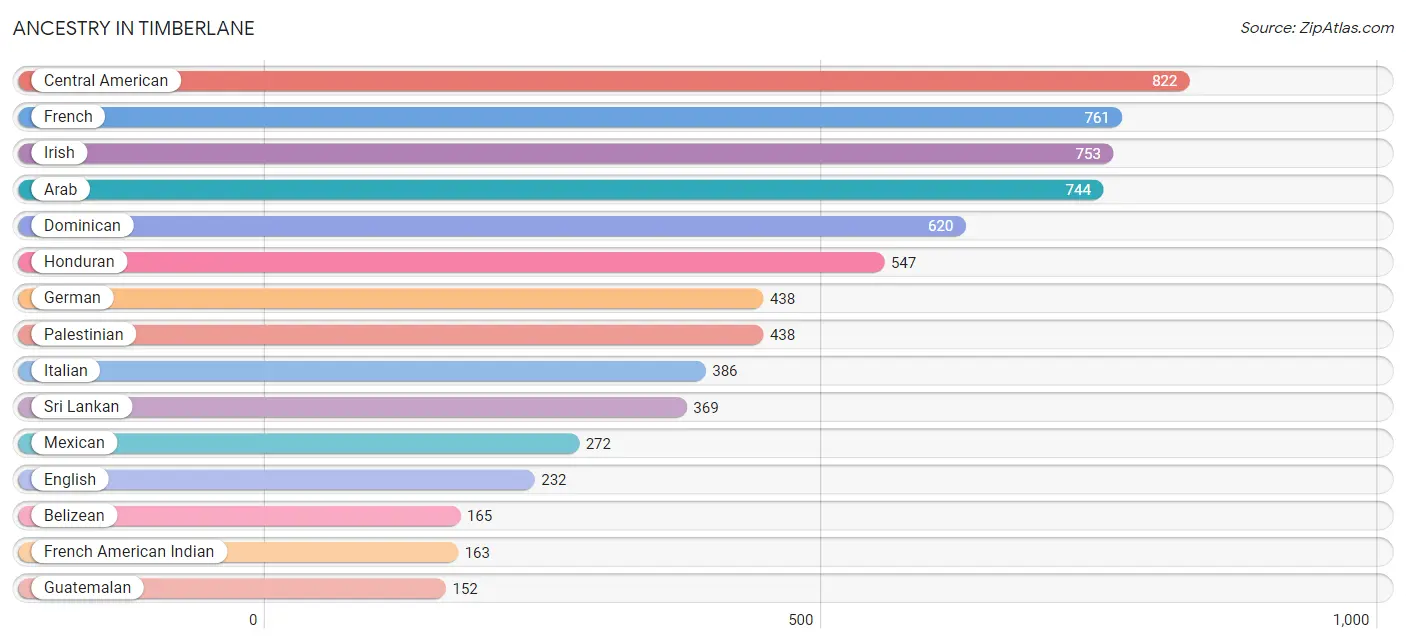
Ancestry in Timberlane
The most populous ancestries reported in Timberlane are Central American (822 | 7.5%), French (761 | 7.0%), Irish (753 | 6.9%), Arab (744 | 6.8%), and Dominican (620 | 5.7%), together accounting for 33.9% of all Timberlane residents.
| Ancestry | # Population | % Population |
| American | 104 | 0.9% |
| Arab | 744 | 6.8% |
| Belizean | 165 | 1.5% |
| British | 28 | 0.3% |
| Burmese | 14 | 0.1% |
| Cajun | 11 | 0.1% |
| Central American | 822 | 7.5% |
| Central American Indian | 64 | 0.6% |
| Colombian | 49 | 0.4% |
| Cuban | 32 | 0.3% |
| Dominican | 620 | 5.7% |
| Dutch | 42 | 0.4% |
| English | 232 | 2.1% |
| European | 35 | 0.3% |
| French | 761 | 7.0% |
| French American Indian | 163 | 1.5% |
| French Canadian | 21 | 0.2% |
| German | 438 | 4.0% |
| Guatemalan | 152 | 1.4% |
| Haitian | 88 | 0.8% |
| Honduran | 547 | 5.0% |
| Indian (Asian) | 12 | 0.1% |
| Irish | 753 | 6.9% |
| Italian | 386 | 3.5% |
| Jamaican | 28 | 0.3% |
| Korean | 18 | 0.2% |
| Mexican | 272 | 2.5% |
| Nicaraguan | 123 | 1.1% |
| Pakistani | 36 | 0.3% |
| Palestinian | 438 | 4.0% |
| Polish | 42 | 0.4% |
| Portuguese | 5 | 0.1% |
| Puerto Rican | 136 | 1.3% |
| Russian | 32 | 0.3% |
| Scotch-Irish | 16 | 0.2% |
| Scottish | 143 | 1.3% |
| Senegalese | 58 | 0.5% |
| South American | 49 | 0.4% |
| Spaniard | 18 | 0.2% |
| Spanish | 17 | 0.2% |
| Sri Lankan | 369 | 3.4% |
| Subsaharan African | 76 | 0.7% |
| Syrian | 11 | 0.1% |
| Ukrainian | 16 | 0.2% |
| Welsh | 23 | 0.2% |
| West Indian | 15 | 0.1% | View All 46 Rows |
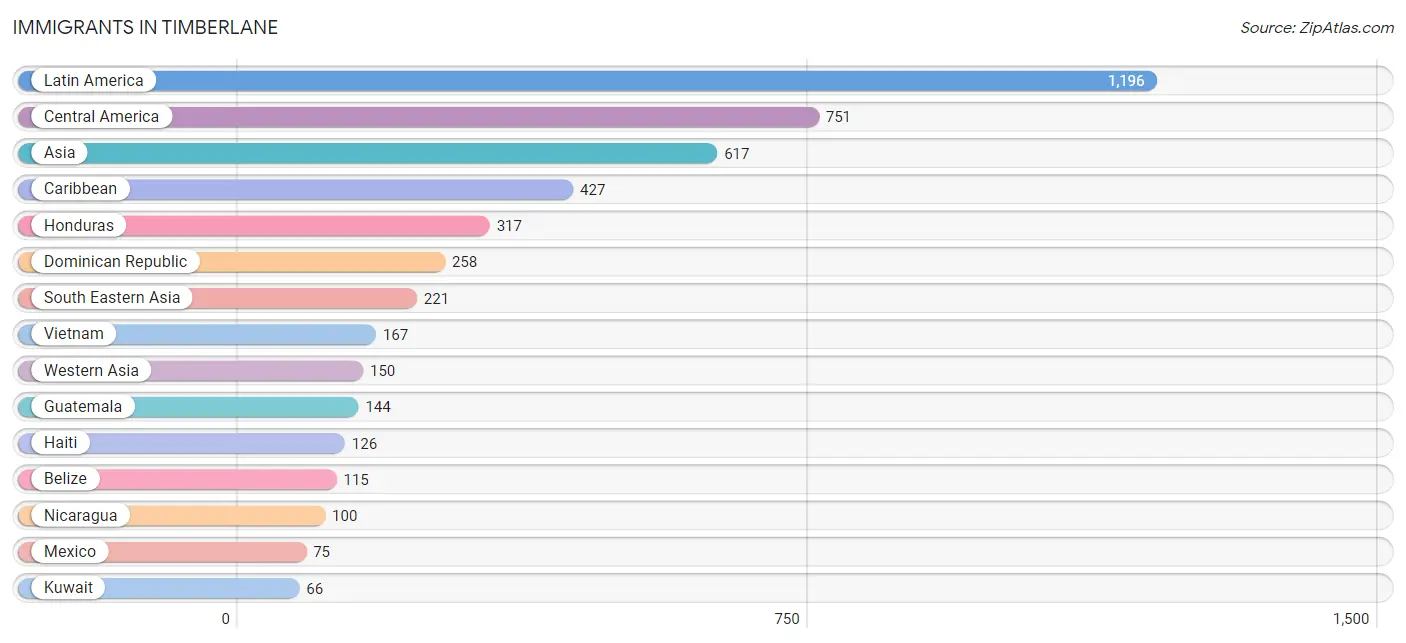
Immigrants in Timberlane
The most numerous immigrant groups reported in Timberlane came from Latin America (1,196 | 11.0%), Central America (751 | 6.9%), Asia (617 | 5.7%), Caribbean (427 | 3.9%), and Honduras (317 | 2.9%), together accounting for 30.3% of all Timberlane residents.
| Immigration Origin | # Population | % Population |
| Africa | 20 | 0.2% |
| Asia | 617 | 5.7% |
| Belize | 115 | 1.1% |
| Caribbean | 427 | 3.9% |
| Central America | 751 | 6.9% |
| Colombia | 18 | 0.2% |
| Cuba | 15 | 0.1% |
| Dominican Republic | 258 | 2.4% |
| Eastern Asia | 14 | 0.1% |
| England | 28 | 0.3% |
| Europe | 28 | 0.3% |
| Guatemala | 144 | 1.3% |
| Haiti | 126 | 1.1% |
| Honduras | 317 | 2.9% |
| Israel | 28 | 0.3% |
| Jamaica | 28 | 0.3% |
| Jordan | 56 | 0.5% |
| Korea | 14 | 0.1% |
| Kuwait | 66 | 0.6% |
| Latin America | 1,196 | 11.0% |
| Mexico | 75 | 0.7% |
| Nicaragua | 100 | 0.9% |
| Northern Europe | 28 | 0.3% |
| Philippines | 18 | 0.2% |
| Senegal | 20 | 0.2% |
| South America | 18 | 0.2% |
| South Eastern Asia | 221 | 2.0% |
| Thailand | 36 | 0.3% |
| Vietnam | 167 | 1.5% |
| Western Africa | 20 | 0.2% |
| Western Asia | 150 | 1.4% | View All 31 Rows |
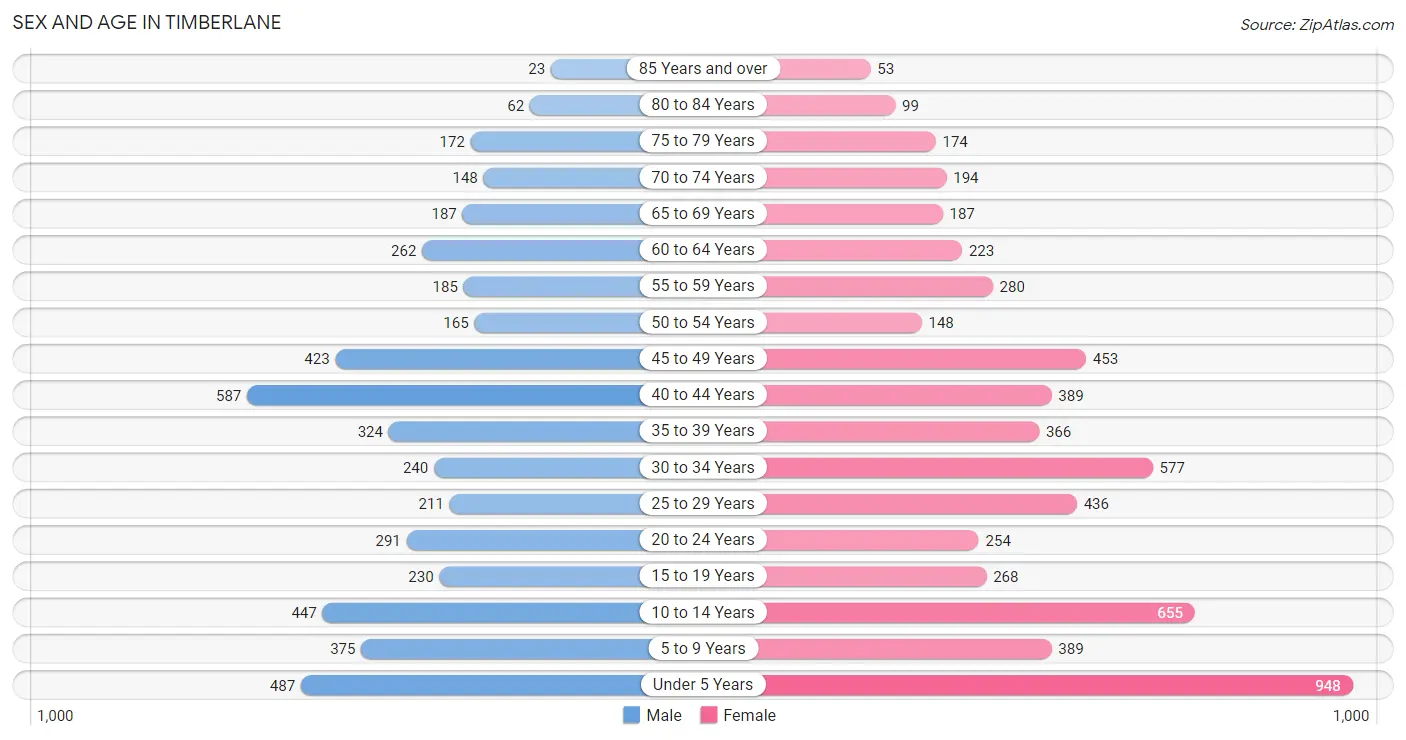
Sex and Age in Timberlane
Sex and Age in Timberlane
The most populous age groups in Timberlane are 40 to 44 Years (587 | 12.2%) for men and Under 5 Years (948 | 15.6%) for women.
| Age Bracket | Male | Female |
| Under 5 Years | 487 (10.1%) | 948 (15.6%) |
| 5 to 9 Years | 375 (7.8%) | 389 (6.4%) |
| 10 to 14 Years | 447 (9.3%) | 655 (10.7%) |
| 15 to 19 Years | 230 (4.8%) | 268 (4.4%) |
| 20 to 24 Years | 291 (6.0%) | 254 (4.2%) |
| 25 to 29 Years | 211 (4.4%) | 436 (7.2%) |
| 30 to 34 Years | 240 (5.0%) | 577 (9.5%) |
| 35 to 39 Years | 324 (6.7%) | 366 (6.0%) |
| 40 to 44 Years | 587 (12.2%) | 389 (6.4%) |
| 45 to 49 Years | 423 (8.8%) | 453 (7.4%) |
| 50 to 54 Years | 165 (3.4%) | 148 (2.4%) |
| 55 to 59 Years | 185 (3.8%) | 280 (4.6%) |
| 60 to 64 Years | 262 (5.4%) | 223 (3.7%) |
| 65 to 69 Years | 187 (3.9%) | 187 (3.1%) |
| 70 to 74 Years | 148 (3.1%) | 194 (3.2%) |
| 75 to 79 Years | 172 (3.6%) | 174 (2.9%) |
| 80 to 84 Years | 62 (1.3%) | 99 (1.6%) |
| 85 Years and over | 23 (0.5%) | 53 (0.9%) |
| Total | 4,819 (100.0%) | 6,093 (100.0%) |
Families and Households in Timberlane
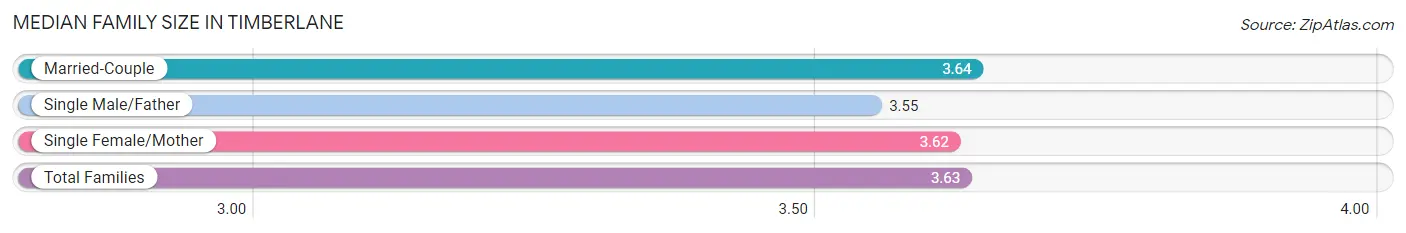
Median Family Size in Timberlane
The median family size in Timberlane is 3.63 persons per family, with married-couple families (1,816 | 69.1%) accounting for the largest median family size of 3.64 persons per family. On the other hand, single male/father families (208 | 7.9%) represent the smallest median family size with 3.55 persons per family.
| Family Type | # Families | Family Size |
| Married-Couple | 1,816 (69.1%) | 3.64 |
| Single Male/Father | 208 (7.9%) | 3.55 |
| Single Female/Mother | 603 (23.0%) | 3.62 |
| Total Families | 2,627 (100.0%) | 3.63 |
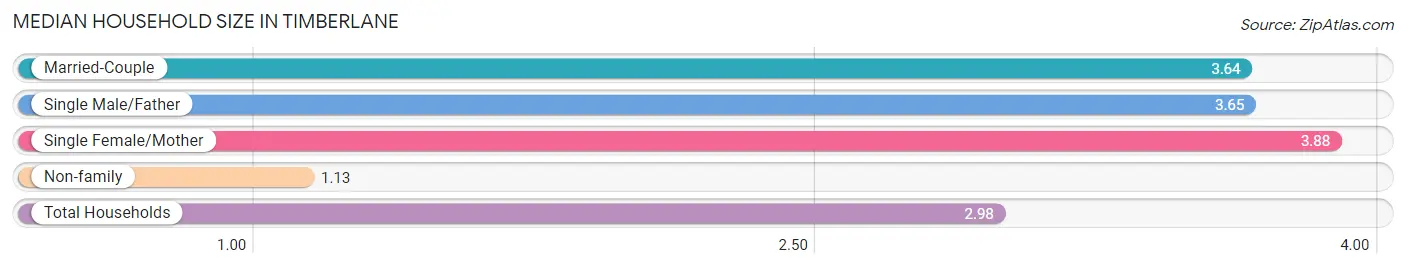
Median Household Size in Timberlane
The median household size in Timberlane is 2.98 persons per household, with single female/mother households (603 | 16.5%) accounting for the largest median household size of 3.88 persons per household. non-family households (1,020 | 28.0%) represent the smallest median household size with 1.13 persons per household.
| Household Type | # Households | Household Size |
| Married-Couple | 1,816 (49.8%) | 3.64 |
| Single Male/Father | 208 (5.7%) | 3.65 |
| Single Female/Mother | 603 (16.5%) | 3.88 |
| Non-family | 1,020 (28.0%) | 1.13 |
| Total Households | 3,647 (100.0%) | 2.98 |
Household Size by Marriage Status in Timberlane
Out of a total of 3,647 households in Timberlane, 2,627 (72.0%) are family households, while 1,020 (28.0%) are nonfamily households. The most numerous type of family households are 4-person households, comprising 807, and the most common type of nonfamily households are 1-person households, comprising 926.
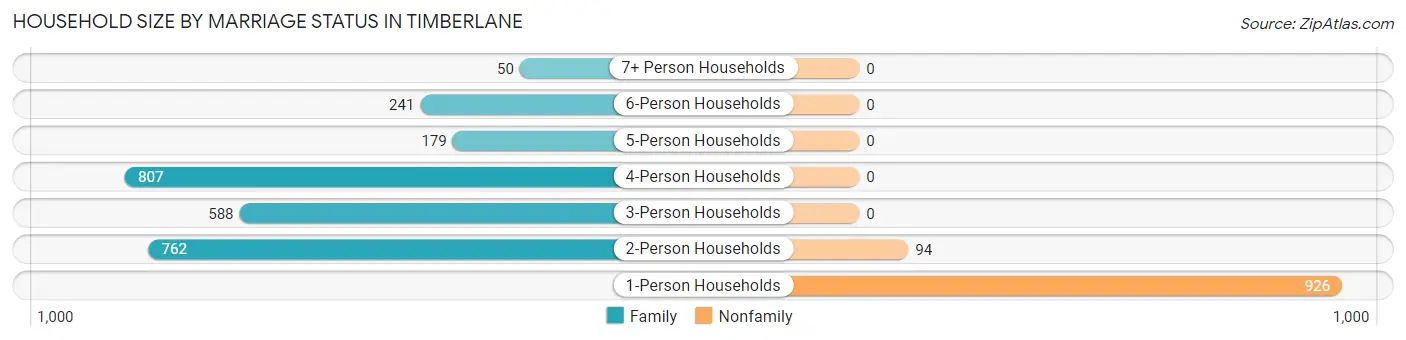
| Household Size | Family Households | Nonfamily Households |
| 1-Person Households | - | 926 (25.4%) |
| 2-Person Households | 762 (20.9%) | 94 (2.6%) |
| 3-Person Households | 588 (16.1%) | 0 (0.0%) |
| 4-Person Households | 807 (22.1%) | 0 (0.0%) |
| 5-Person Households | 179 (4.9%) | 0 (0.0%) |
| 6-Person Households | 241 (6.6%) | 0 (0.0%) |
| 7+ Person Households | 50 (1.4%) | 0 (0.0%) |
| Total | 2,627 (72.0%) | 1,020 (28.0%) |
Female Fertility in Timberlane
Fertility by Age in Timberlane
Average fertility rate in Timberlane is 36.0 births per 1,000 women. Women in the age bracket of 20 to 34 years have the highest fertility rate with 79.0 births per 1,000 women. Women in the age bracket of 20 to 34 years acount for 100.0% of all women with births.
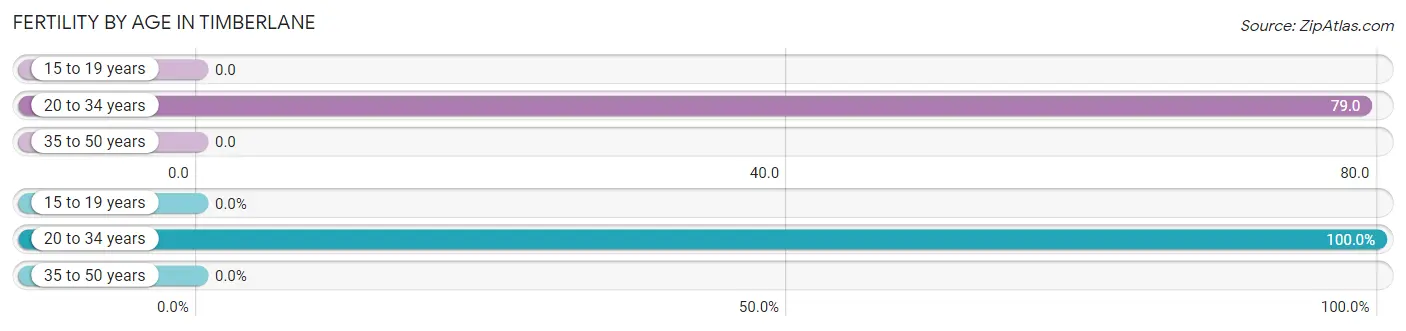
| Age Bracket | Women with Births | Births / 1,000 Women |
| 15 to 19 years | 0 (0.0%) | 0.0 |
| 20 to 34 years | 100 (100.0%) | 79.0 |
| 35 to 50 years | 0 (0.0%) | 0.0 |
| Total | 100 (100.0%) | 36.0 |
Fertility by Age by Marriage Status in Timberlane
42.0% of women with births (100) in Timberlane are married. The highest percentage of unmarried women with births falls into 20 to 34 years age bracket with 58.0% of them unmarried at the time of birth, while the lowest percentage of unmarried women with births belong to 20 to 34 years age bracket with 58.0% of them unmarried.
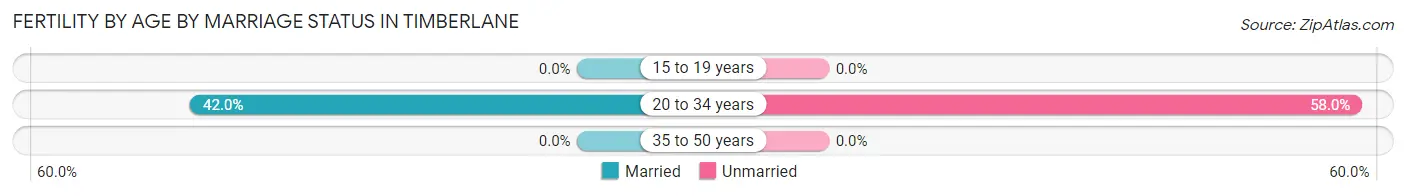
| Age Bracket | Married | Unmarried |
| 15 to 19 years | 0 (0.0%) | 0 (0.0%) |
| 20 to 34 years | 42 (42.0%) | 58 (58.0%) |
| 35 to 50 years | 0 (0.0%) | 0 (0.0%) |
| Total | 42 (42.0%) | 58 (58.0%) |
Fertility by Education in Timberlane
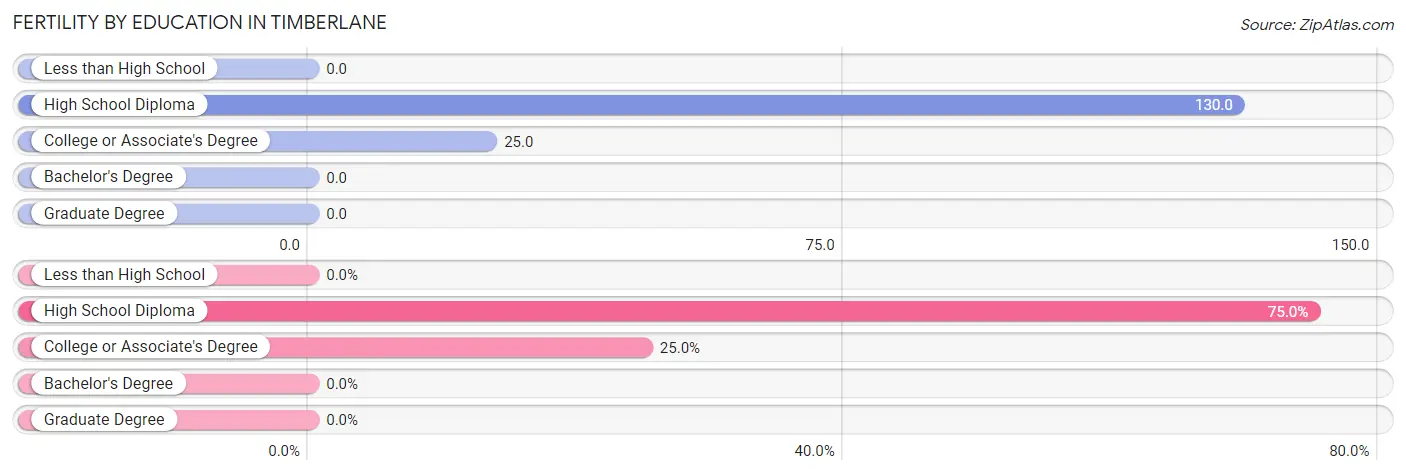
| Educational Attainment | Women with Births | Births / 1,000 Women |
| Less than High School | 0 (0.0%) | 0.0 |
| High School Diploma | 75 (75.0%) | 130.0 |
| College or Associate's Degree | 25 (25.0%) | 25.0 |
| Bachelor's Degree | 0 (0.0%) | 0.0 |
| Graduate Degree | 0 (0.0%) | 0.0 |
| Total | 100 (100.0%) | 36.0 |
Fertility by Education by Marriage Status in Timberlane
58.0% of women with births in Timberlane are unmarried. Women with the educational attainment of college or associate's degree are most likely to be married with 88.0% of them married at childbirth, while women with the educational attainment of high school diploma are least likely to be married with 73.3% of them unmarried at childbirth.
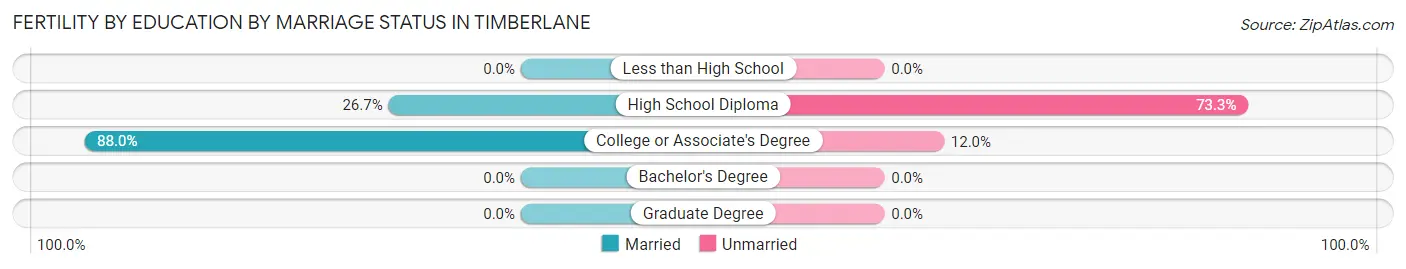
| Educational Attainment | Married | Unmarried |
| Less than High School | 0 (0.0%) | 0 (0.0%) |
| High School Diploma | 20 (26.7%) | 55 (73.3%) |
| College or Associate's Degree | 22 (88.0%) | 3 (12.0%) |
| Bachelor's Degree | 0 (0.0%) | 0 (0.0%) |
| Graduate Degree | 0 (0.0%) | 0 (0.0%) |
| Total | 42 (42.0%) | 58 (58.0%) |
Employment Characteristics in Timberlane
Employment by Class of Employer in Timberlane
Among the 4,273 employed individuals in Timberlane, private company employees (3,018 | 70.6%), not-for-profit organizations (415 | 9.7%), and self-employed (not incorporated) (226 | 5.3%) make up the most common classes of employment.
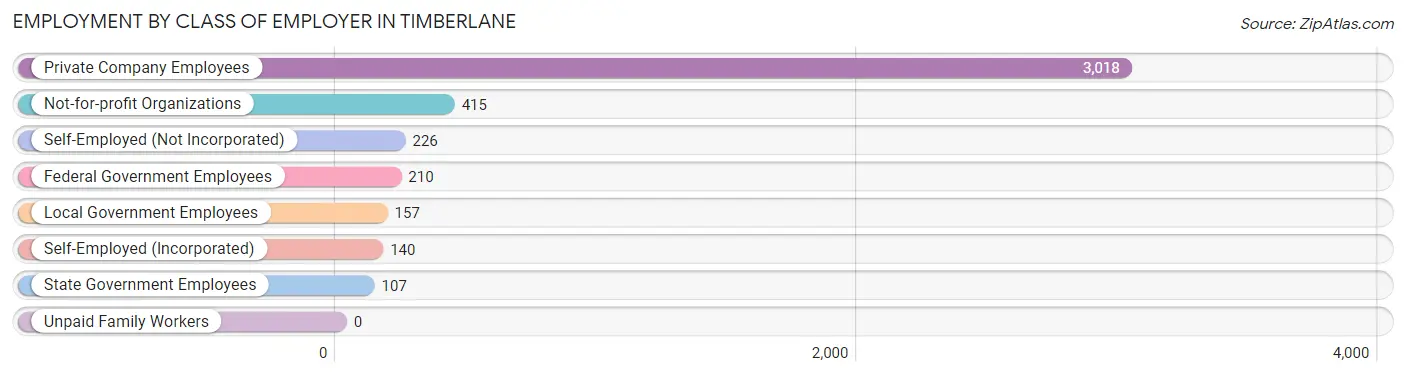
| Employer Class | # Employees | % Employees |
| Private Company Employees | 3,018 | 70.6% |
| Self-Employed (Incorporated) | 140 | 3.3% |
| Self-Employed (Not Incorporated) | 226 | 5.3% |
| Not-for-profit Organizations | 415 | 9.7% |
| Local Government Employees | 157 | 3.7% |
| State Government Employees | 107 | 2.5% |
| Federal Government Employees | 210 | 4.9% |
| Unpaid Family Workers | 0 | 0.0% |
| Total | 4,273 | 100.0% |
Employment Status by Age in Timberlane
According to the labor force statistics for Timberlane, out of the total population over 16 years of age (7,577), 67.2% or 5,092 individuals are in the labor force, with 10.9% or 555 of them unemployed. The age group with the highest labor force participation rate is 30 to 34 years, with 90.5% or 739 individuals in the labor force. Within the labor force, the 16 to 19 years age range has the highest percentage of unemployed individuals, with 37.8% or 37 of them being unemployed.
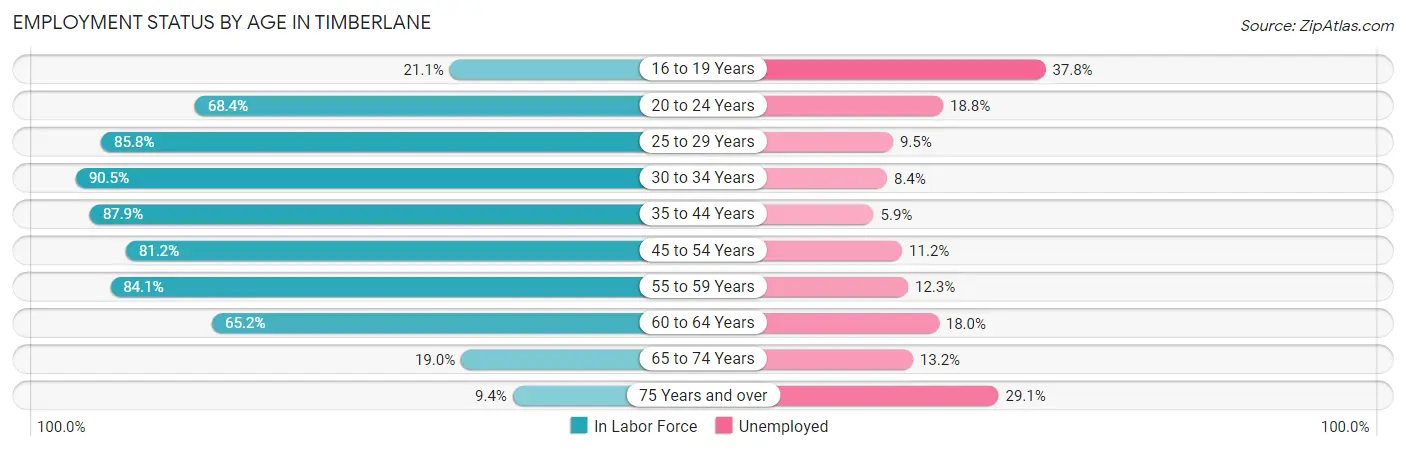
| Age Bracket | In Labor Force | Unemployed |
| 16 to 19 Years | 98 (21.1%) | 37 (37.8%) |
| 20 to 24 Years | 373 (68.4%) | 70 (18.8%) |
| 25 to 29 Years | 555 (85.8%) | 53 (9.5%) |
| 30 to 34 Years | 739 (90.5%) | 62 (8.4%) |
| 35 to 44 Years | 1,464 (87.9%) | 86 (5.9%) |
| 45 to 54 Years | 965 (81.2%) | 108 (11.2%) |
| 55 to 59 Years | 391 (84.1%) | 48 (12.3%) |
| 60 to 64 Years | 316 (65.2%) | 57 (18.0%) |
| 65 to 74 Years | 136 (19.0%) | 18 (13.2%) |
| 75 Years and over | 55 (9.4%) | 16 (29.1%) |
| Total | 5,092 (67.2%) | 555 (10.9%) |
Employment Status by Educational Attainment in Timberlane
According to labor force statistics for Timberlane, 84.1% of individuals (4,431) out of the total population between 25 and 64 years of age (5,269) are in the labor force, with 9.3% or 412 of them being unemployed. The group with the highest labor force participation rate are those with the educational attainment of bachelor's degree or higher, with 94.3% or 1,217 individuals in the labor force. Within the labor force, individuals with high school diploma education have the highest percentage of unemployment, with 13.2% or 176 of them being unemployed.
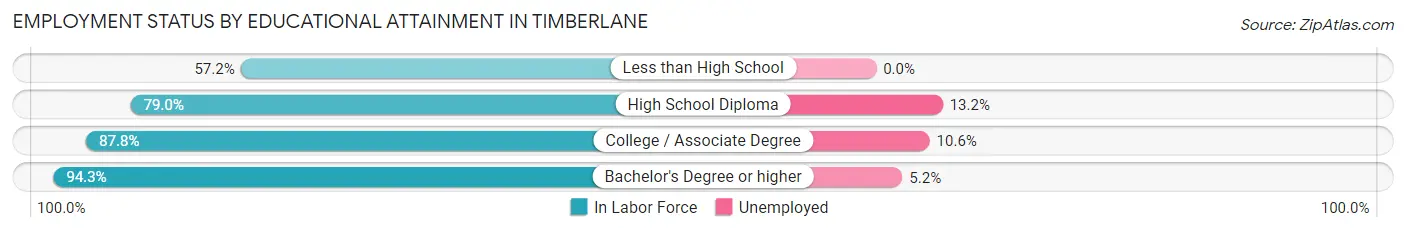
| Educational Attainment | In Labor Force | Unemployed |
| Less than High School | 242 (57.2%) | 0 (0.0%) |
| High School Diploma | 1,337 (79.0%) | 223 (13.2%) |
| College / Associate Degree | 1,636 (87.8%) | 197 (10.6%) |
| Bachelor's Degree or higher | 1,217 (94.3%) | 67 (5.2%) |
| Total | 4,431 (84.1%) | 490 (9.3%) |
Employment Occupations by Sex in Timberlane
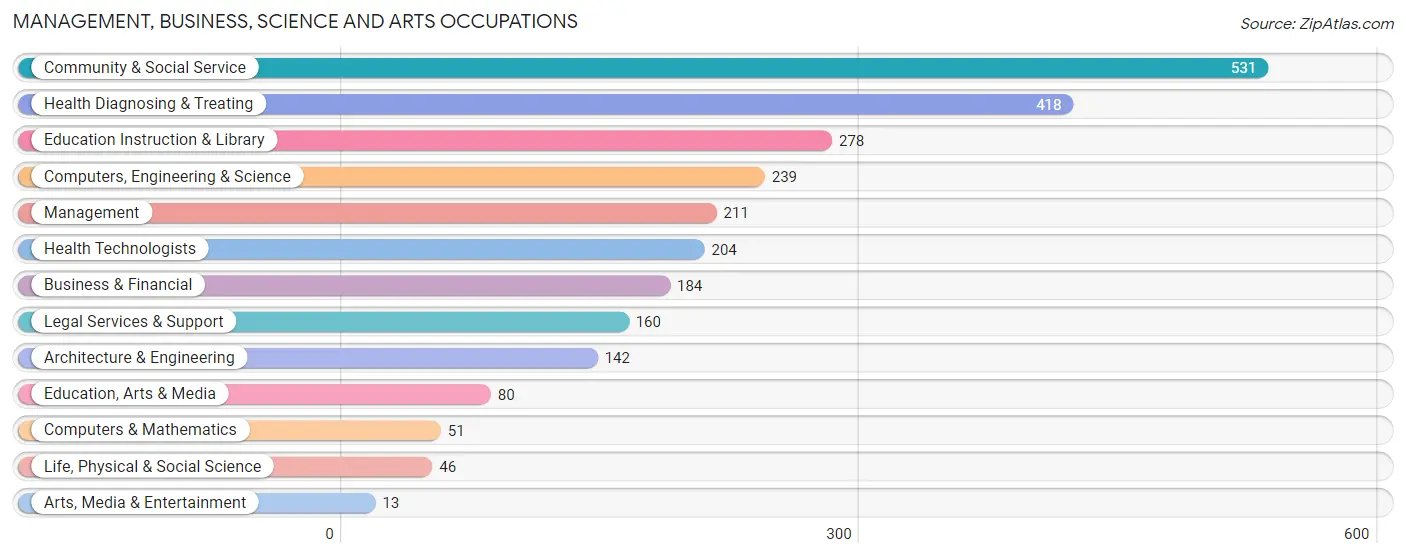
Management, Business, Science and Arts Occupations
The most common Management, Business, Science and Arts occupations in Timberlane are Community & Social Service (531 | 11.7%), Health Diagnosing & Treating (418 | 9.2%), Education Instruction & Library (278 | 6.1%), Computers, Engineering & Science (239 | 5.3%), and Management (211 | 4.6%).
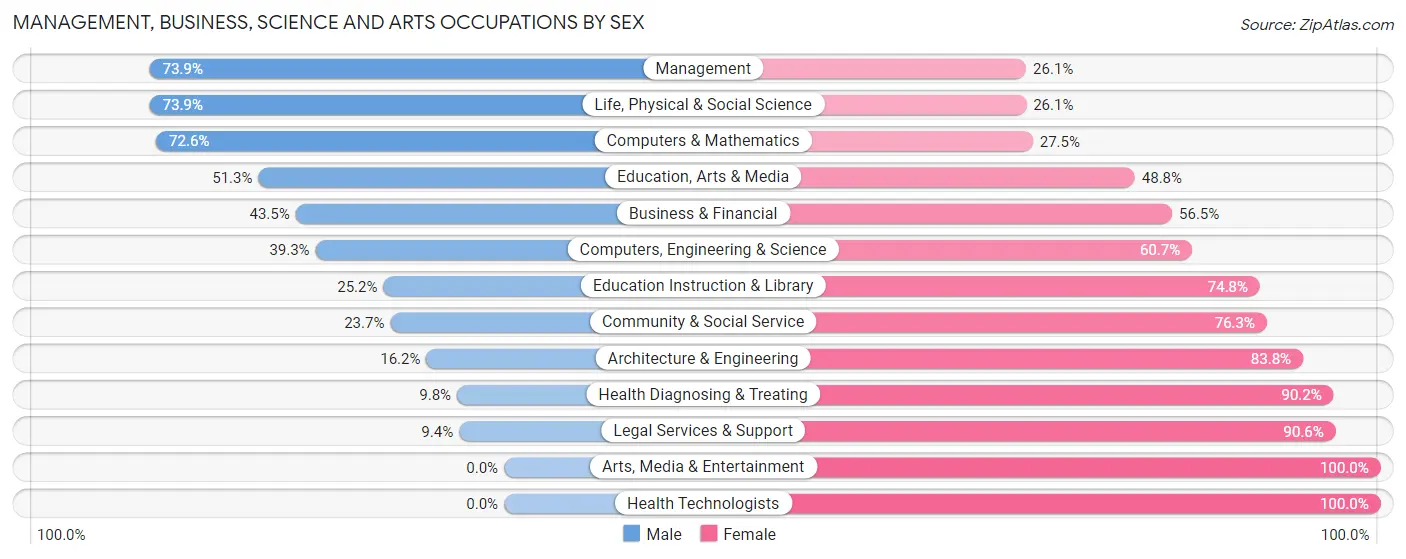
Management, Business, Science and Arts Occupations by Sex
Within the Management, Business, Science and Arts occupations in Timberlane, the most male-oriented occupations are Management (73.9%), Life, Physical & Social Science (73.9%), and Computers & Mathematics (72.6%), while the most female-oriented occupations are Arts, Media & Entertainment (100.0%), Health Technologists (100.0%), and Legal Services & Support (90.6%).
| Occupation | Male | Female |
| Management | 156 (73.9%) | 55 (26.1%) |
| Business & Financial | 80 (43.5%) | 104 (56.5%) |
| Computers, Engineering & Science | 94 (39.3%) | 145 (60.7%) |
| Computers & Mathematics | 37 (72.6%) | 14 (27.5%) |
| Architecture & Engineering | 23 (16.2%) | 119 (83.8%) |
| Life, Physical & Social Science | 34 (73.9%) | 12 (26.1%) |
| Community & Social Service | 126 (23.7%) | 405 (76.3%) |
| Education, Arts & Media | 41 (51.2%) | 39 (48.7%) |
| Legal Services & Support | 15 (9.4%) | 145 (90.6%) |
| Education Instruction & Library | 70 (25.2%) | 208 (74.8%) |
| Arts, Media & Entertainment | 0 (0.0%) | 13 (100.0%) |
| Health Diagnosing & Treating | 41 (9.8%) | 377 (90.2%) |
| Health Technologists | 0 (0.0%) | 204 (100.0%) |
| Total (Category) | 497 (31.4%) | 1,086 (68.6%) |
| Total (Overall) | 2,213 (48.8%) | 2,325 (51.2%) |
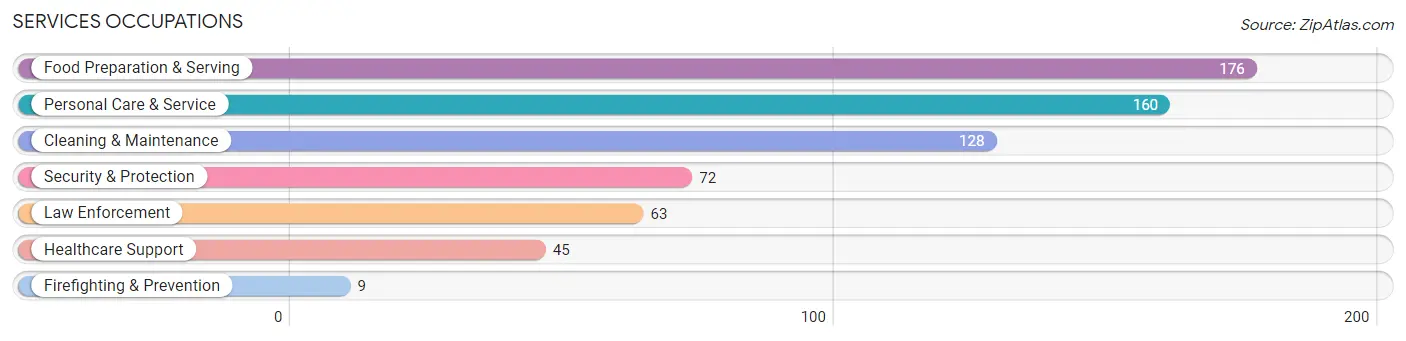
Services Occupations
The most common Services occupations in Timberlane are Food Preparation & Serving (176 | 3.9%), Personal Care & Service (160 | 3.5%), Cleaning & Maintenance (128 | 2.8%), Security & Protection (72 | 1.6%), and Law Enforcement (63 | 1.4%).
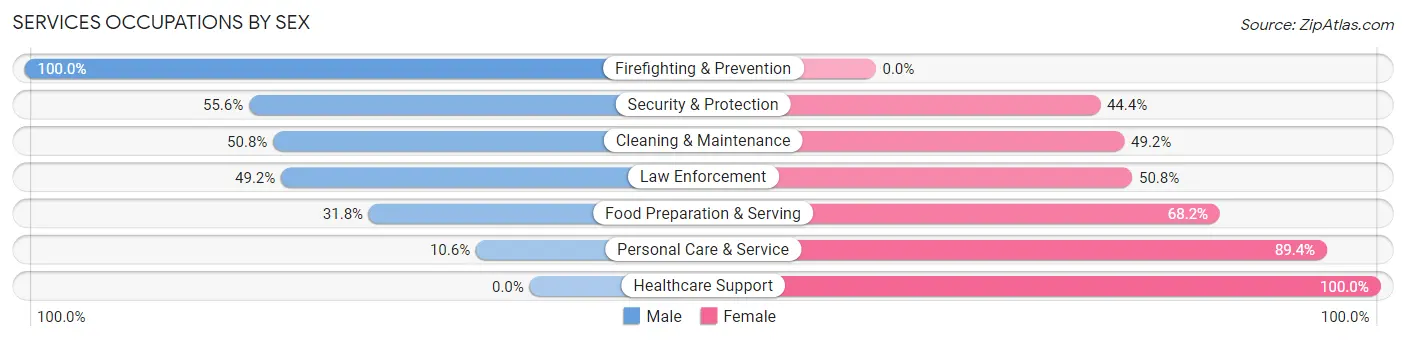
Services Occupations by Sex
Within the Services occupations in Timberlane, the most male-oriented occupations are Firefighting & Prevention (100.0%), Security & Protection (55.6%), and Cleaning & Maintenance (50.8%), while the most female-oriented occupations are Healthcare Support (100.0%), Personal Care & Service (89.4%), and Food Preparation & Serving (68.2%).
| Occupation | Male | Female |
| Healthcare Support | 0 (0.0%) | 45 (100.0%) |
| Security & Protection | 40 (55.6%) | 32 (44.4%) |
| Firefighting & Prevention | 9 (100.0%) | 0 (0.0%) |
| Law Enforcement | 31 (49.2%) | 32 (50.8%) |
| Food Preparation & Serving | 56 (31.8%) | 120 (68.2%) |
| Cleaning & Maintenance | 65 (50.8%) | 63 (49.2%) |
| Personal Care & Service | 17 (10.6%) | 143 (89.4%) |
| Total (Category) | 178 (30.6%) | 403 (69.4%) |
| Total (Overall) | 2,213 (48.8%) | 2,325 (51.2%) |
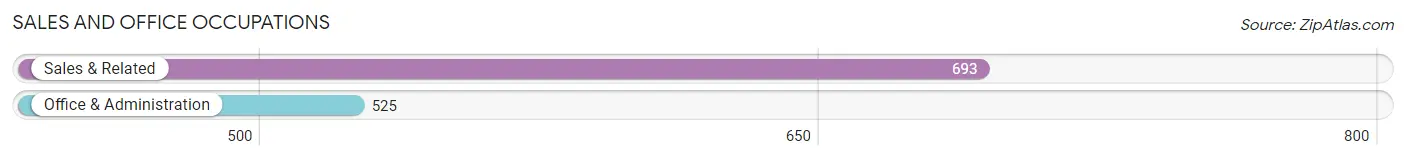
Sales and Office Occupations
The most common Sales and Office occupations in Timberlane are Sales & Related (693 | 15.3%), and Office & Administration (525 | 11.6%).
Sales and Office Occupations by Sex
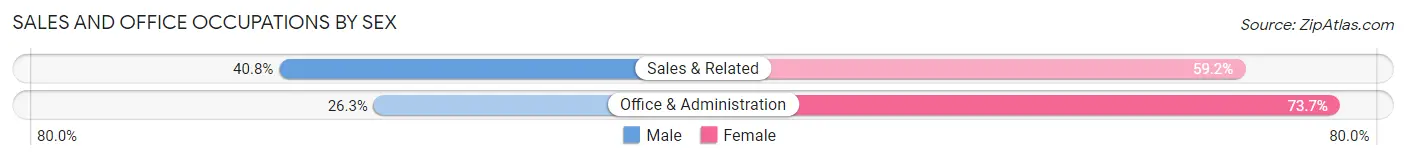
| Occupation | Male | Female |
| Sales & Related | 283 (40.8%) | 410 (59.2%) |
| Office & Administration | 138 (26.3%) | 387 (73.7%) |
| Total (Category) | 421 (34.6%) | 797 (65.4%) |
| Total (Overall) | 2,213 (48.8%) | 2,325 (51.2%) |
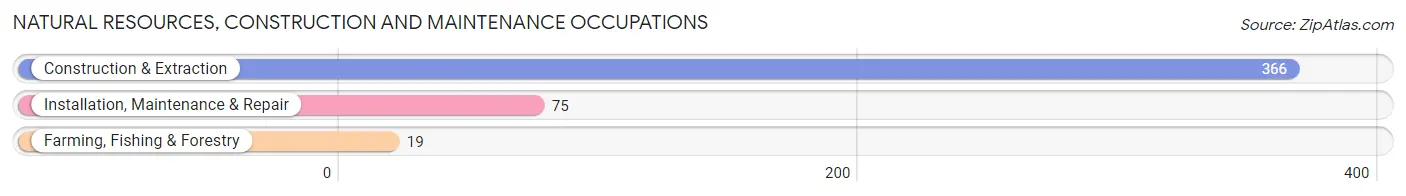
Natural Resources, Construction and Maintenance Occupations
The most common Natural Resources, Construction and Maintenance occupations in Timberlane are Construction & Extraction (366 | 8.1%), Installation, Maintenance & Repair (75 | 1.7%), and Farming, Fishing & Forestry (19 | 0.4%).
Natural Resources, Construction and Maintenance Occupations by Sex
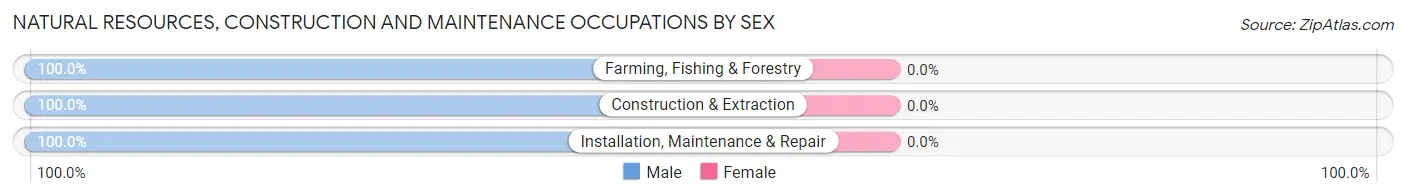
| Occupation | Male | Female |
| Farming, Fishing & Forestry | 19 (100.0%) | 0 (0.0%) |
| Construction & Extraction | 366 (100.0%) | 0 (0.0%) |
| Installation, Maintenance & Repair | 75 (100.0%) | 0 (0.0%) |
| Total (Category) | 460 (100.0%) | 0 (0.0%) |
| Total (Overall) | 2,213 (48.8%) | 2,325 (51.2%) |
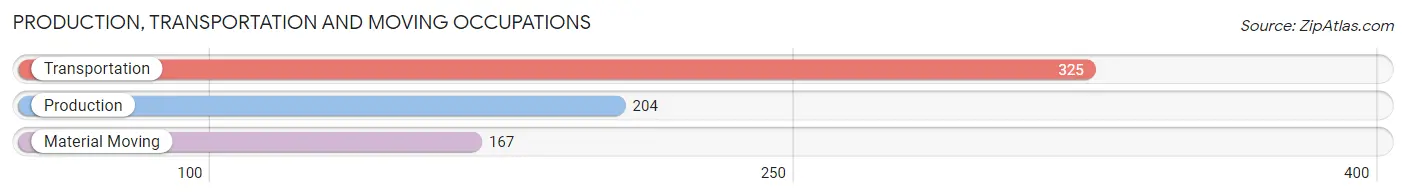
Production, Transportation and Moving Occupations
The most common Production, Transportation and Moving occupations in Timberlane are Transportation (325 | 7.2%), Production (204 | 4.5%), and Material Moving (167 | 3.7%).
Production, Transportation and Moving Occupations by Sex
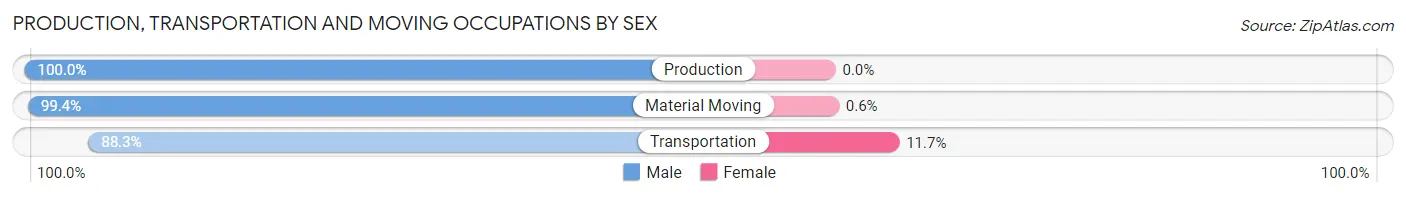
| Occupation | Male | Female |
| Production | 204 (100.0%) | 0 (0.0%) |
| Transportation | 287 (88.3%) | 38 (11.7%) |
| Material Moving | 166 (99.4%) | 1 (0.6%) |
| Total (Category) | 657 (94.4%) | 39 (5.6%) |
| Total (Overall) | 2,213 (48.8%) | 2,325 (51.2%) |
Employment Industries by Sex in Timberlane
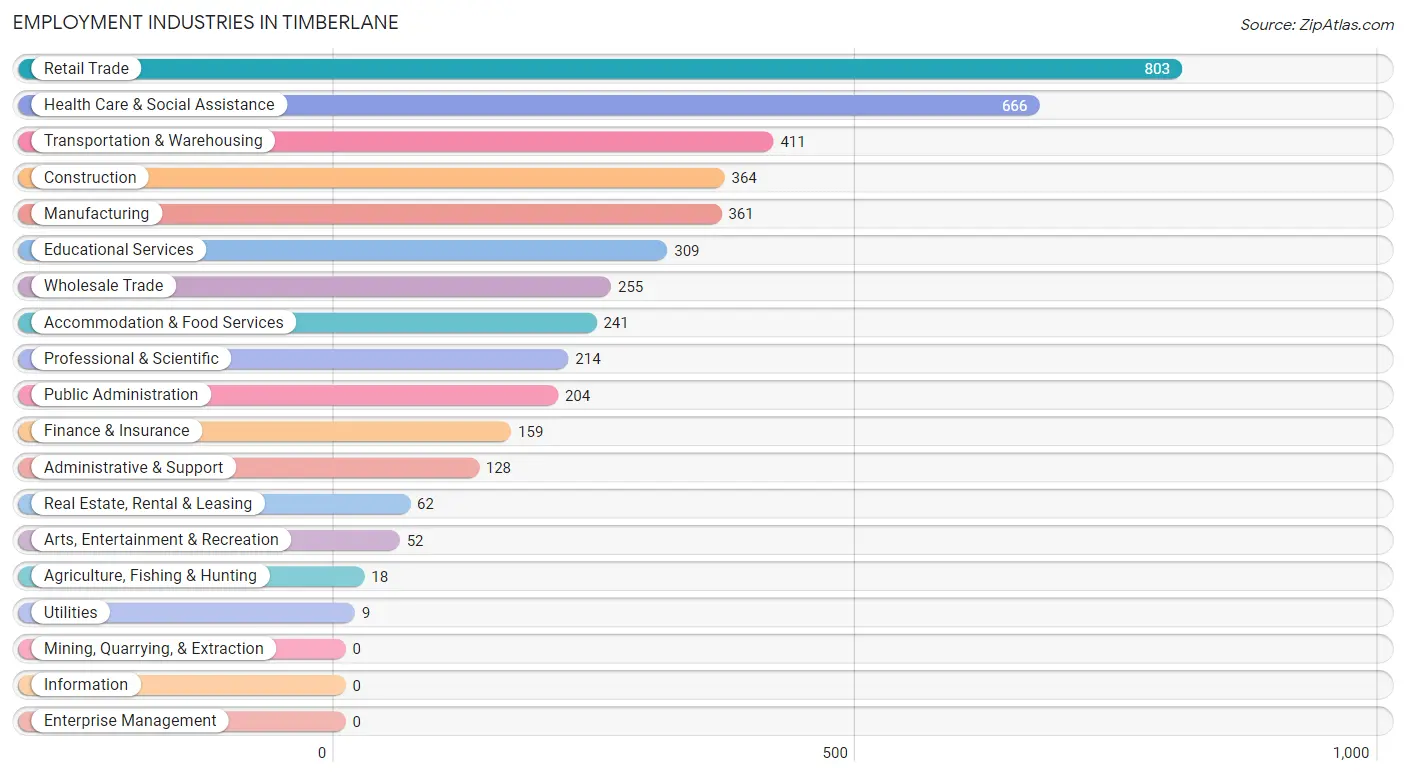
Employment Industries in Timberlane
The major employment industries in Timberlane include Retail Trade (803 | 17.7%), Health Care & Social Assistance (666 | 14.7%), Transportation & Warehousing (411 | 9.1%), Construction (364 | 8.0%), and Manufacturing (361 | 8.0%).
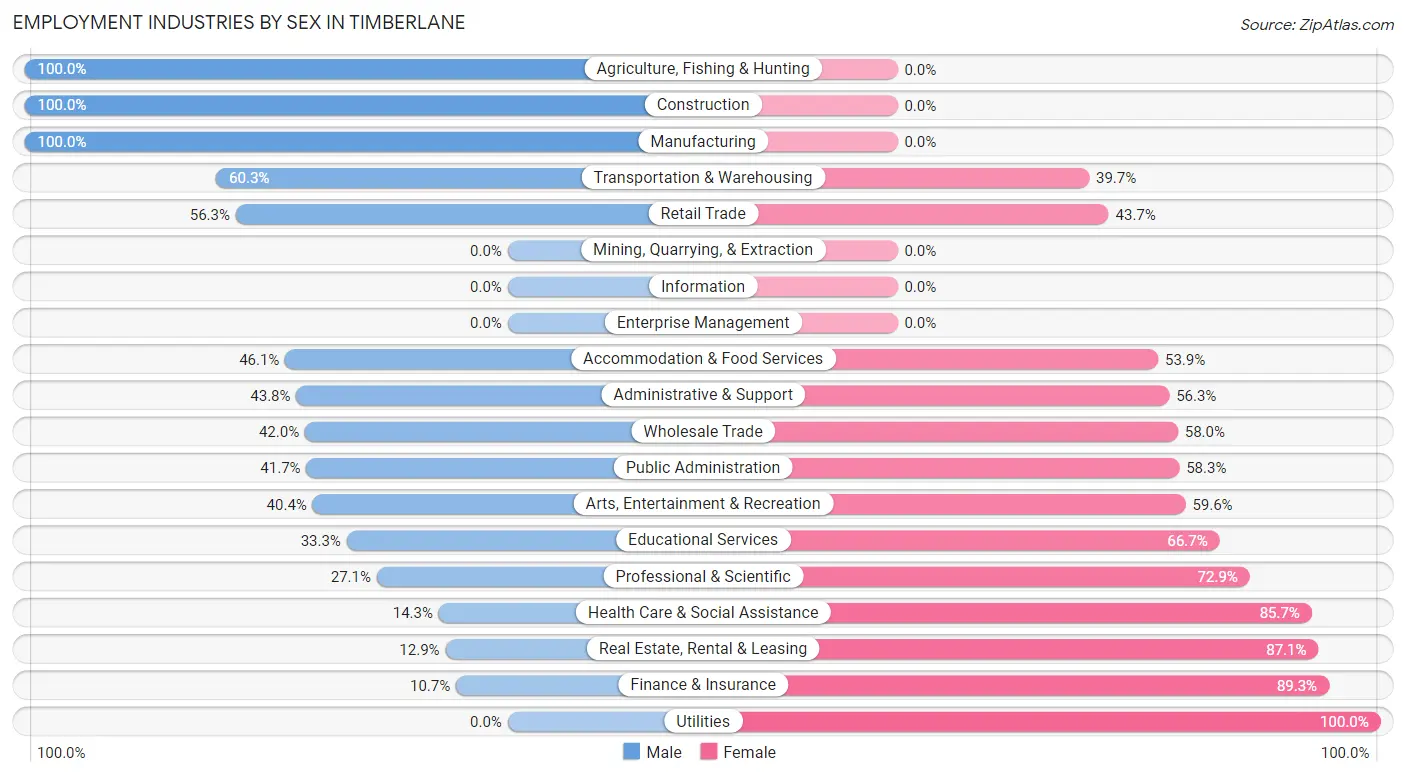
Employment Industries by Sex in Timberlane
The Timberlane industries that see more men than women are Agriculture, Fishing & Hunting (100.0%), Construction (100.0%), and Manufacturing (100.0%), whereas the industries that tend to have a higher number of women are Utilities (100.0%), Finance & Insurance (89.3%), and Real Estate, Rental & Leasing (87.1%).
| Industry | Male | Female |
| Agriculture, Fishing & Hunting | 18 (100.0%) | 0 (0.0%) |
| Mining, Quarrying, & Extraction | 0 (0.0%) | 0 (0.0%) |
| Construction | 364 (100.0%) | 0 (0.0%) |
| Manufacturing | 361 (100.0%) | 0 (0.0%) |
| Wholesale Trade | 107 (42.0%) | 148 (58.0%) |
| Retail Trade | 452 (56.3%) | 351 (43.7%) |
| Transportation & Warehousing | 248 (60.3%) | 163 (39.7%) |
| Utilities | 0 (0.0%) | 9 (100.0%) |
| Information | 0 (0.0%) | 0 (0.0%) |
| Finance & Insurance | 17 (10.7%) | 142 (89.3%) |
| Real Estate, Rental & Leasing | 8 (12.9%) | 54 (87.1%) |
| Professional & Scientific | 58 (27.1%) | 156 (72.9%) |
| Enterprise Management | 0 (0.0%) | 0 (0.0%) |
| Administrative & Support | 56 (43.8%) | 72 (56.2%) |
| Educational Services | 103 (33.3%) | 206 (66.7%) |
| Health Care & Social Assistance | 95 (14.3%) | 571 (85.7%) |
| Arts, Entertainment & Recreation | 21 (40.4%) | 31 (59.6%) |
| Accommodation & Food Services | 111 (46.1%) | 130 (53.9%) |
| Public Administration | 85 (41.7%) | 119 (58.3%) |
| Total | 2,213 (48.8%) | 2,325 (51.2%) |
Education in Timberlane
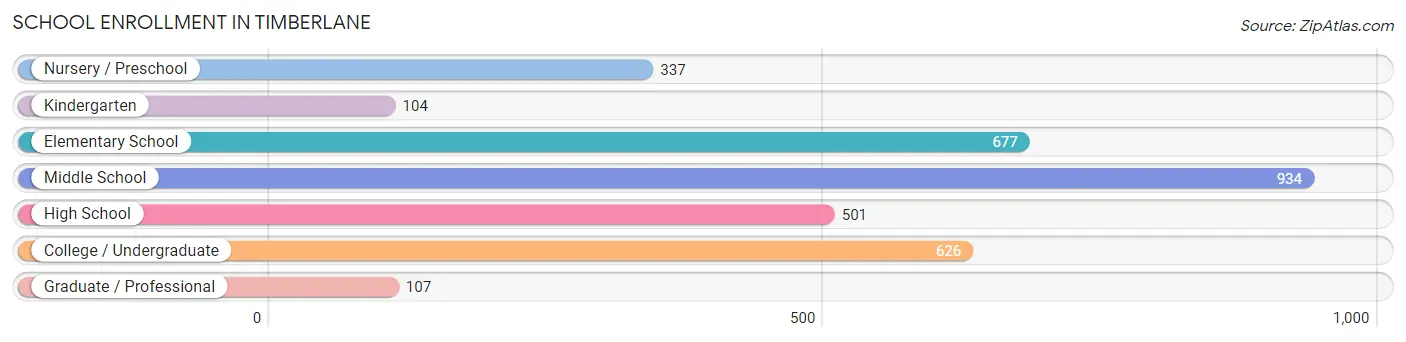
School Enrollment in Timberlane
The most common levels of schooling among the 3,286 students in Timberlane are middle school (934 | 28.4%), elementary school (677 | 20.6%), and college / undergraduate (626 | 19.1%).
| School Level | # Students | % Students |
| Nursery / Preschool | 337 | 10.3% |
| Kindergarten | 104 | 3.2% |
| Elementary School | 677 | 20.6% |
| Middle School | 934 | 28.4% |
| High School | 501 | 15.2% |
| College / Undergraduate | 626 | 19.1% |
| Graduate / Professional | 107 | 3.3% |
| Total | 3,286 | 100.0% |
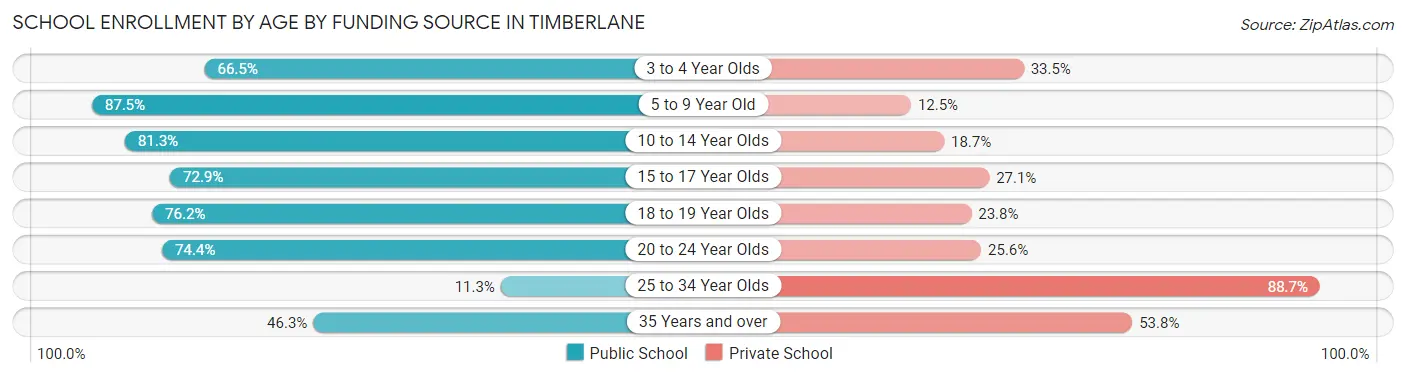
School Enrollment by Age by Funding Source in Timberlane
Out of a total of 3,286 students who are enrolled in schools in Timberlane, 861 (26.2%) attend a private institution, while the remaining 2,425 (73.8%) are enrolled in public schools. The age group of 25 to 34 year olds has the highest likelihood of being enrolled in private schools, with 141 (88.7% in the age bracket) enrolled. Conversely, the age group of 5 to 9 year old has the lowest likelihood of being enrolled in a private school, with 656 (87.5% in the age bracket) attending a public institution.
| Age Bracket | Public School | Private School |
| 3 to 4 Year Olds | 224 (66.5%) | 113 (33.5%) |
| 5 to 9 Year Old | 656 (87.5%) | 94 (12.5%) |
| 10 to 14 Year Olds | 896 (81.3%) | 206 (18.7%) |
| 15 to 17 Year Olds | 164 (72.9%) | 61 (27.1%) |
| 18 to 19 Year Olds | 170 (76.2%) | 53 (23.8%) |
| 20 to 24 Year Olds | 186 (74.4%) | 64 (25.6%) |
| 25 to 34 Year Olds | 18 (11.3%) | 141 (88.7%) |
| 35 Years and over | 111 (46.3%) | 129 (53.7%) |
| Total | 2,425 (73.8%) | 861 (26.2%) |
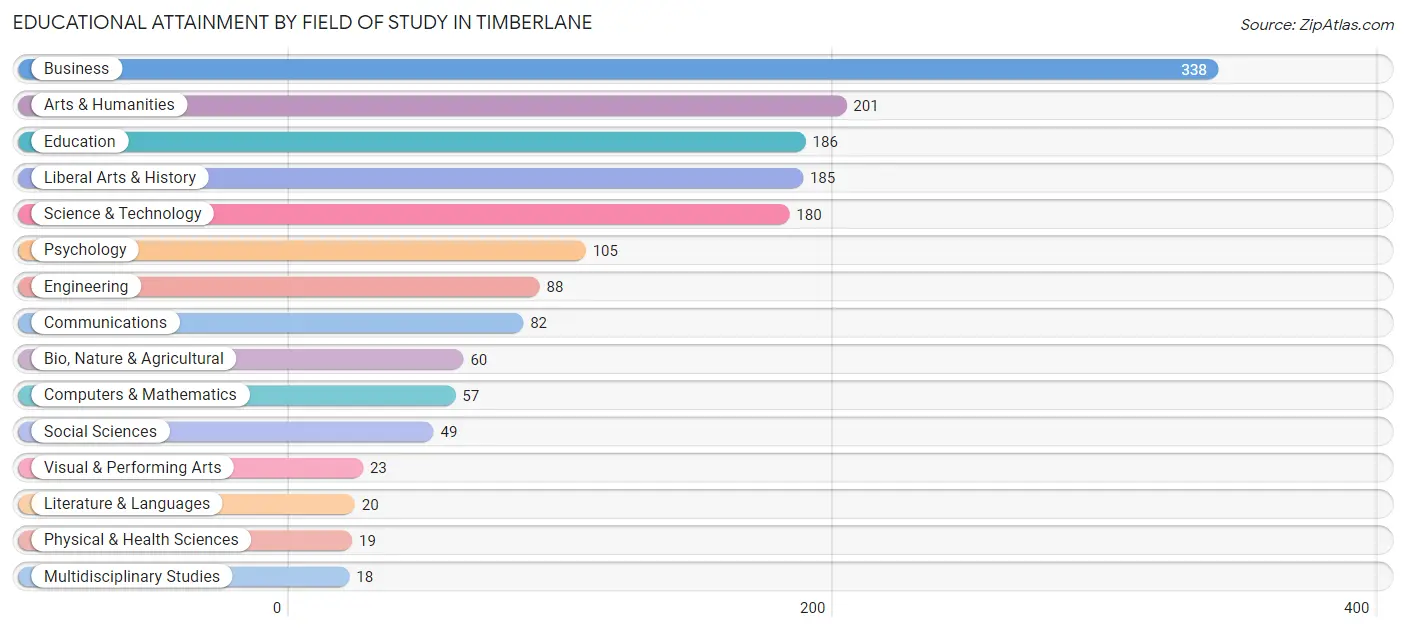
Educational Attainment by Field of Study in Timberlane
Business (338 | 21.0%), arts & humanities (201 | 12.5%), education (186 | 11.6%), liberal arts & history (185 | 11.5%), and science & technology (180 | 11.2%) are the most common fields of study among 1,611 individuals in Timberlane who have obtained a bachelor's degree or higher.
| Field of Study | # Graduates | % Graduates |
| Computers & Mathematics | 57 | 3.5% |
| Bio, Nature & Agricultural | 60 | 3.7% |
| Physical & Health Sciences | 19 | 1.2% |
| Psychology | 105 | 6.5% |
| Social Sciences | 49 | 3.0% |
| Engineering | 88 | 5.5% |
| Multidisciplinary Studies | 18 | 1.1% |
| Science & Technology | 180 | 11.2% |
| Business | 338 | 21.0% |
| Education | 186 | 11.6% |
| Literature & Languages | 20 | 1.2% |
| Liberal Arts & History | 185 | 11.5% |
| Visual & Performing Arts | 23 | 1.4% |
| Communications | 82 | 5.1% |
| Arts & Humanities | 201 | 12.5% |
| Total | 1,611 | 100.0% |
Transportation & Commute in Timberlane
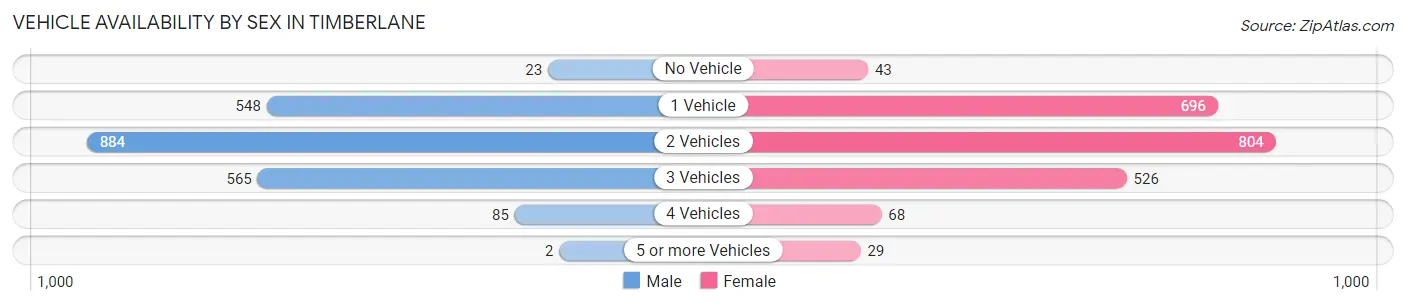
Vehicle Availability by Sex in Timberlane
The most prevalent vehicle ownership categories in Timberlane are males with 2 vehicles (884, accounting for 42.0%) and females with 2 vehicles (804, making up 40.8%).
| Vehicles Available | Male | Female |
| No Vehicle | 23 (1.1%) | 43 (2.0%) |
| 1 Vehicle | 548 (26.0%) | 696 (32.1%) |
| 2 Vehicles | 884 (42.0%) | 804 (37.1%) |
| 3 Vehicles | 565 (26.8%) | 526 (24.3%) |
| 4 Vehicles | 85 (4.0%) | 68 (3.1%) |
| 5 or more Vehicles | 2 (0.1%) | 29 (1.3%) |
| Total | 2,107 (100.0%) | 2,166 (100.0%) |
Commute Time in Timberlane
The most frequently occuring commute durations in Timberlane are 30 to 34 minutes (988 commuters, 23.8%), 20 to 24 minutes (904 commuters, 21.8%), and 15 to 19 minutes (634 commuters, 15.3%).
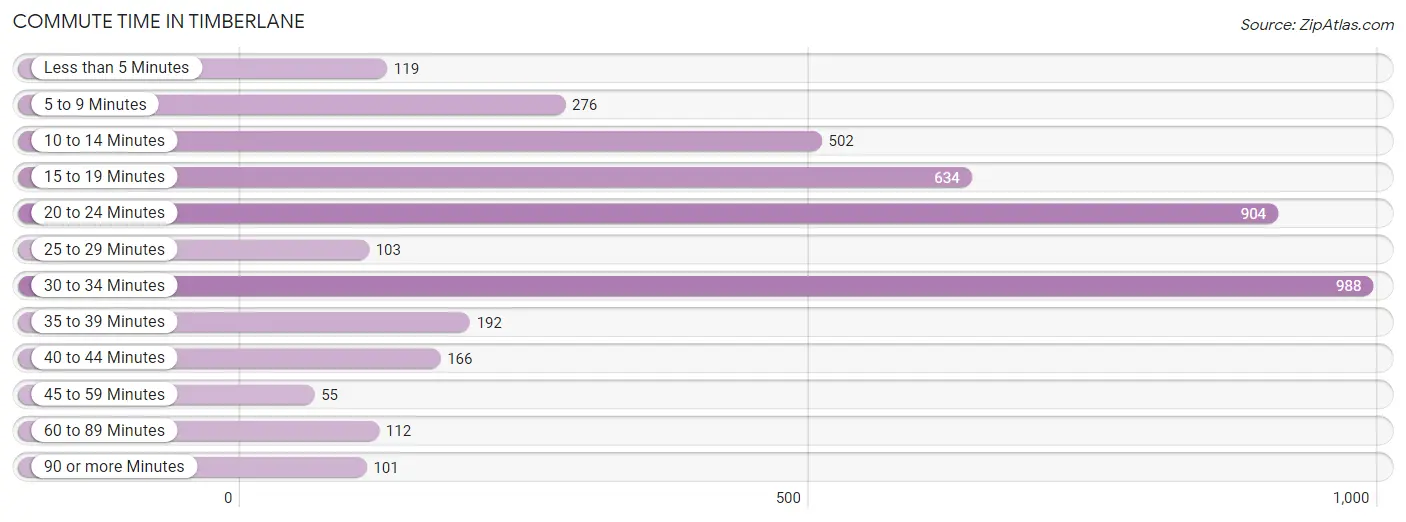
| Commute Time | # Commuters | % Commuters |
| Less than 5 Minutes | 119 | 2.9% |
| 5 to 9 Minutes | 276 | 6.7% |
| 10 to 14 Minutes | 502 | 12.1% |
| 15 to 19 Minutes | 634 | 15.3% |
| 20 to 24 Minutes | 904 | 21.8% |
| 25 to 29 Minutes | 103 | 2.5% |
| 30 to 34 Minutes | 988 | 23.8% |
| 35 to 39 Minutes | 192 | 4.6% |
| 40 to 44 Minutes | 166 | 4.0% |
| 45 to 59 Minutes | 55 | 1.3% |
| 60 to 89 Minutes | 112 | 2.7% |
| 90 or more Minutes | 101 | 2.4% |
Commute Time by Sex in Timberlane
The most common commute times in Timberlane are 30 to 34 minutes (508 commuters, 24.9%) for males and 30 to 34 minutes (480 commuters, 22.8%) for females.
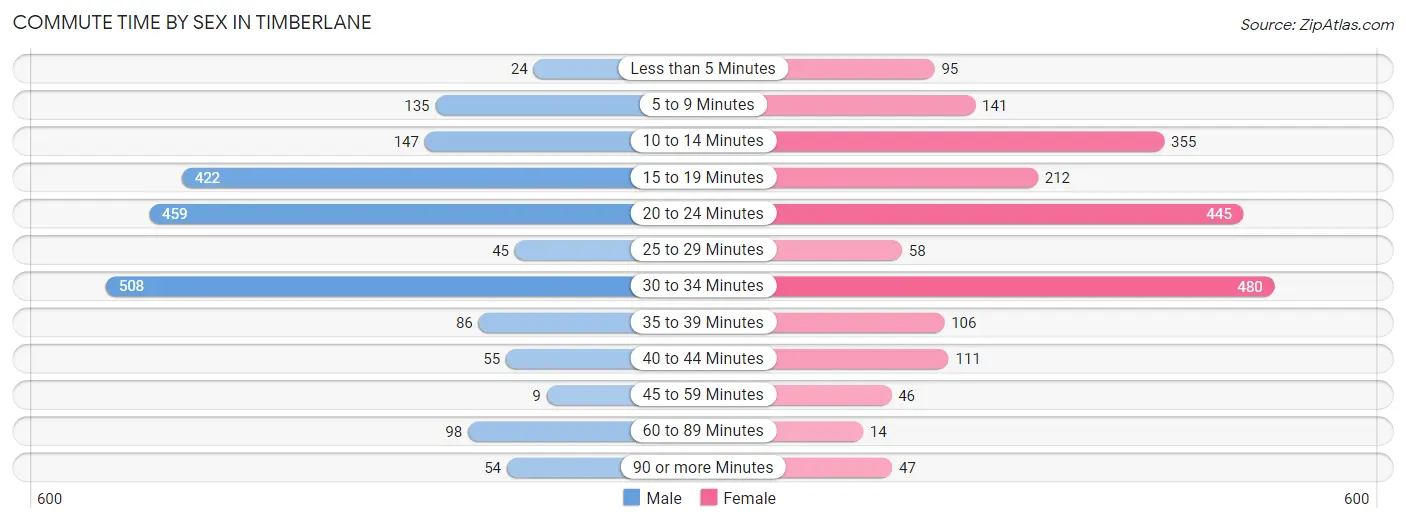
| Commute Time | Male | Female |
| Less than 5 Minutes | 24 (1.2%) | 95 (4.5%) |
| 5 to 9 Minutes | 135 (6.6%) | 141 (6.7%) |
| 10 to 14 Minutes | 147 (7.2%) | 355 (16.8%) |
| 15 to 19 Minutes | 422 (20.7%) | 212 (10.1%) |
| 20 to 24 Minutes | 459 (22.5%) | 445 (21.1%) |
| 25 to 29 Minutes | 45 (2.2%) | 58 (2.8%) |
| 30 to 34 Minutes | 508 (24.9%) | 480 (22.8%) |
| 35 to 39 Minutes | 86 (4.2%) | 106 (5.0%) |
| 40 to 44 Minutes | 55 (2.7%) | 111 (5.3%) |
| 45 to 59 Minutes | 9 (0.4%) | 46 (2.2%) |
| 60 to 89 Minutes | 98 (4.8%) | 14 (0.7%) |
| 90 or more Minutes | 54 (2.6%) | 47 (2.2%) |
Time of Departure to Work by Sex in Timberlane
The most frequent times of departure to work in Timberlane are 8:00 AM to 8:29 AM (426, 20.9%) for males and 12:00 PM to 3:59 PM (281, 13.3%) for females.
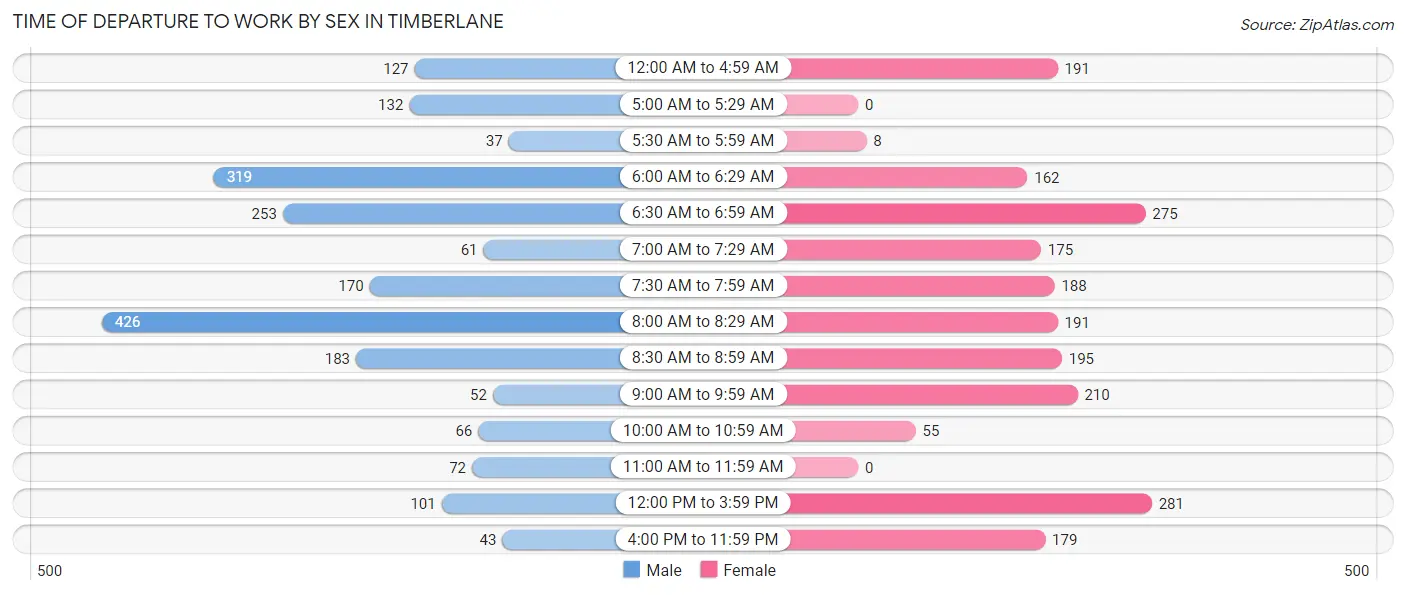
| Time of Departure | Male | Female |
| 12:00 AM to 4:59 AM | 127 (6.2%) | 191 (9.0%) |
| 5:00 AM to 5:29 AM | 132 (6.5%) | 0 (0.0%) |
| 5:30 AM to 5:59 AM | 37 (1.8%) | 8 (0.4%) |
| 6:00 AM to 6:29 AM | 319 (15.6%) | 162 (7.7%) |
| 6:30 AM to 6:59 AM | 253 (12.4%) | 275 (13.0%) |
| 7:00 AM to 7:29 AM | 61 (3.0%) | 175 (8.3%) |
| 7:30 AM to 7:59 AM | 170 (8.3%) | 188 (8.9%) |
| 8:00 AM to 8:29 AM | 426 (20.9%) | 191 (9.0%) |
| 8:30 AM to 8:59 AM | 183 (9.0%) | 195 (9.2%) |
| 9:00 AM to 9:59 AM | 52 (2.5%) | 210 (10.0%) |
| 10:00 AM to 10:59 AM | 66 (3.2%) | 55 (2.6%) |
| 11:00 AM to 11:59 AM | 72 (3.5%) | 0 (0.0%) |
| 12:00 PM to 3:59 PM | 101 (5.0%) | 281 (13.3%) |
| 4:00 PM to 11:59 PM | 43 (2.1%) | 179 (8.5%) |
| Total | 2,042 (100.0%) | 2,110 (100.0%) |
Housing Occupancy in Timberlane
Occupancy by Ownership in Timberlane
Of the total 3,647 dwellings in Timberlane, owner-occupied units account for 2,664 (73.1%), while renter-occupied units make up 983 (27.0%).
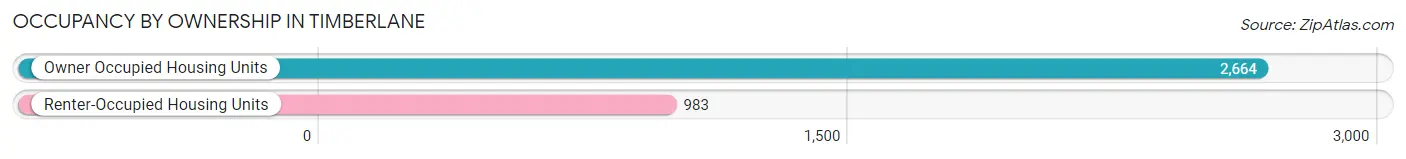
| Occupancy | # Housing Units | % Housing Units |
| Owner Occupied Housing Units | 2,664 | 73.1% |
| Renter-Occupied Housing Units | 983 | 27.0% |
| Total Occupied Housing Units | 3,647 | 100.0% |
Occupancy by Household Size in Timberlane
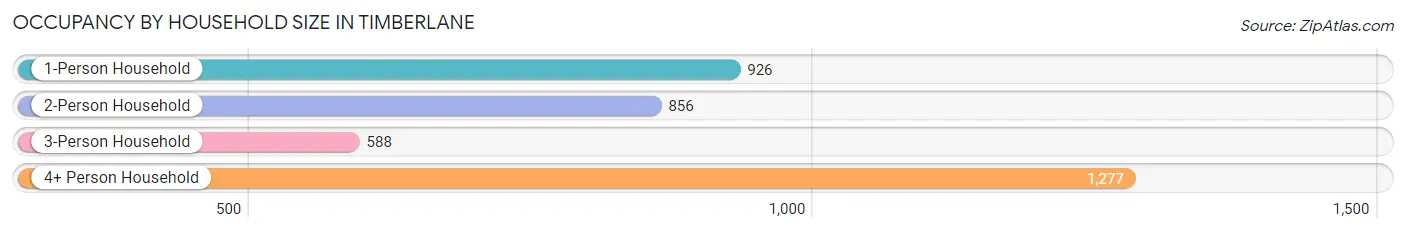
| Household Size | # Housing Units | % Housing Units |
| 1-Person Household | 926 | 25.4% |
| 2-Person Household | 856 | 23.5% |
| 3-Person Household | 588 | 16.1% |
| 4+ Person Household | 1,277 | 35.0% |
| Total Housing Units | 3,647 | 100.0% |
Occupancy by Ownership by Household Size in Timberlane
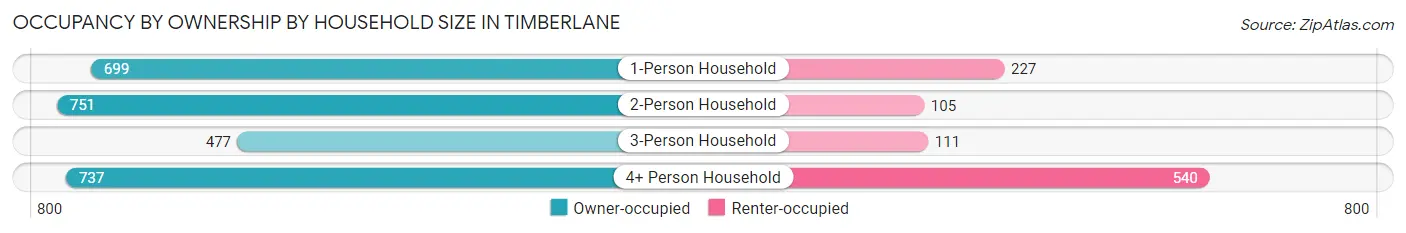
| Household Size | Owner-occupied | Renter-occupied |
| 1-Person Household | 699 (75.5%) | 227 (24.5%) |
| 2-Person Household | 751 (87.7%) | 105 (12.3%) |
| 3-Person Household | 477 (81.1%) | 111 (18.9%) |
| 4+ Person Household | 737 (57.7%) | 540 (42.3%) |
| Total Housing Units | 2,664 (73.1%) | 983 (27.0%) |
Occupancy by Educational Attainment in Timberlane
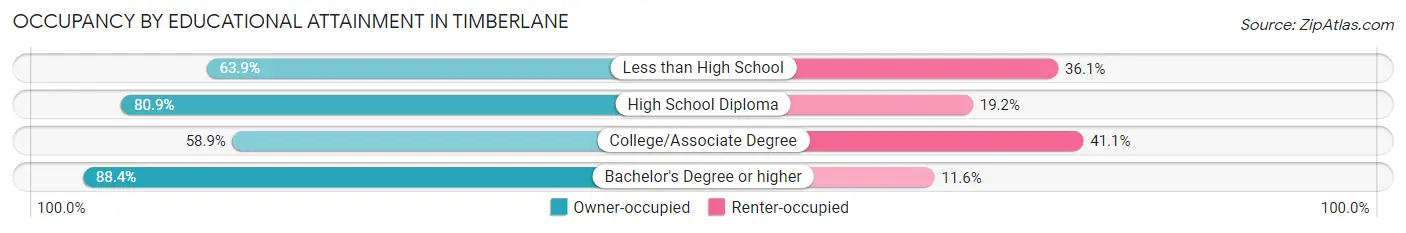
| Household Size | Owner-occupied | Renter-occupied |
| Less than High School | 186 (63.9%) | 105 (36.1%) |
| High School Diploma | 895 (80.8%) | 212 (19.2%) |
| College/Associate Degree | 811 (58.9%) | 565 (41.1%) |
| Bachelor's Degree or higher | 772 (88.4%) | 101 (11.6%) |
Occupancy by Age of Householder in Timberlane
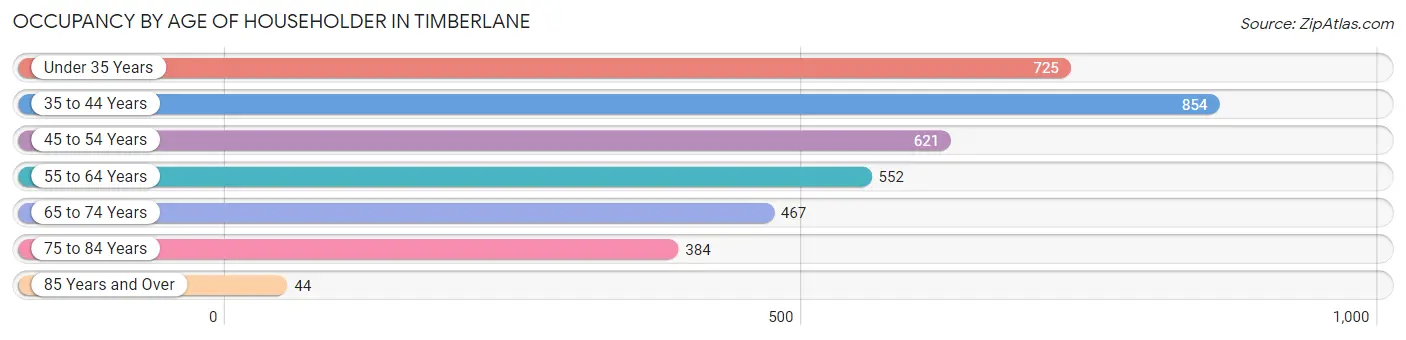
| Age Bracket | # Households | % Households |
| Under 35 Years | 725 | 19.9% |
| 35 to 44 Years | 854 | 23.4% |
| 45 to 54 Years | 621 | 17.0% |
| 55 to 64 Years | 552 | 15.1% |
| 65 to 74 Years | 467 | 12.8% |
| 75 to 84 Years | 384 | 10.5% |
| 85 Years and Over | 44 | 1.2% |
| Total | 3,647 | 100.0% |
Housing Finances in Timberlane
Median Income by Occupancy in Timberlane
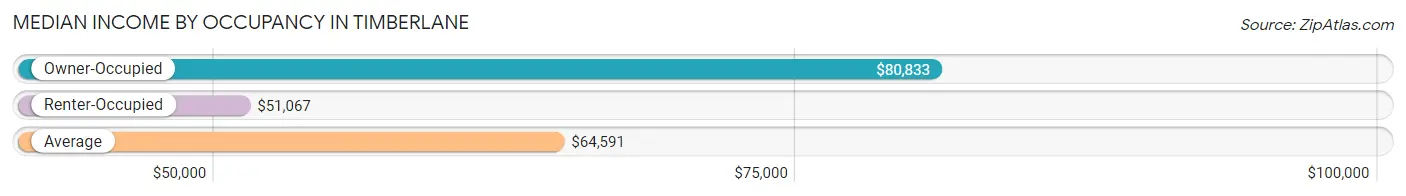
| Occupancy Type | # Households | Median Income |
| Owner-Occupied | 2,664 (73.1%) | $80,833 |
| Renter-Occupied | 983 (27.0%) | $51,067 |
| Average | 3,647 (100.0%) | $64,591 |
Occupancy by Householder Income Bracket in Timberlane
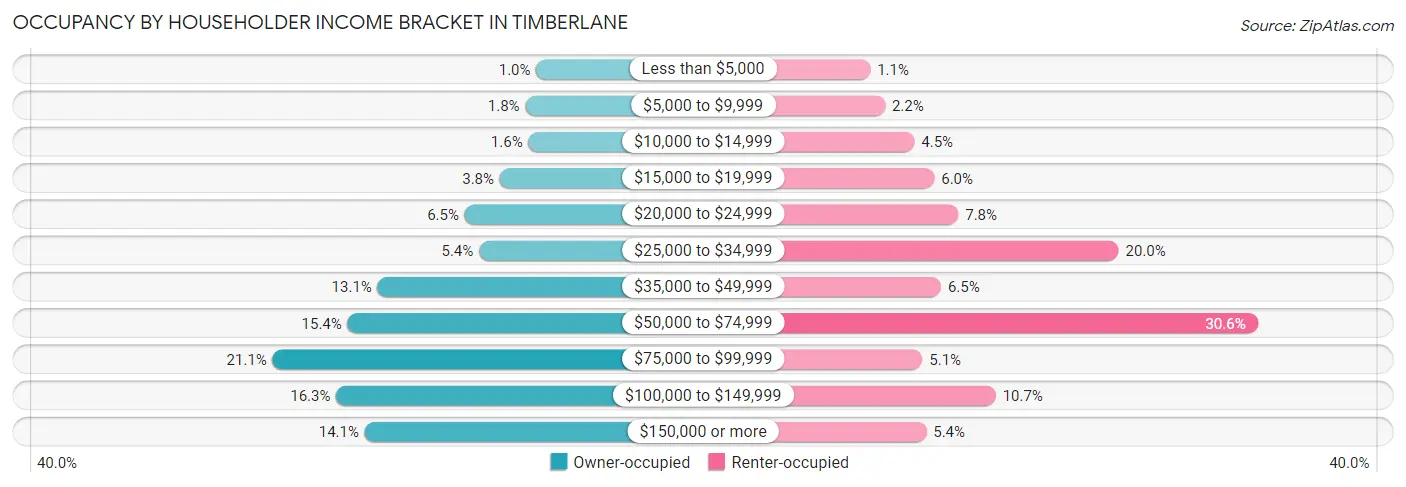
| Income Bracket | Owner-occupied | Renter-occupied |
| Less than $5,000 | 27 (1.0%) | 11 (1.1%) |
| $5,000 to $9,999 | 49 (1.8%) | 22 (2.2%) |
| $10,000 to $14,999 | 43 (1.6%) | 44 (4.5%) |
| $15,000 to $19,999 | 101 (3.8%) | 59 (6.0%) |
| $20,000 to $24,999 | 172 (6.5%) | 77 (7.8%) |
| $25,000 to $34,999 | 143 (5.4%) | 197 (20.0%) |
| $35,000 to $49,999 | 349 (13.1%) | 64 (6.5%) |
| $50,000 to $74,999 | 410 (15.4%) | 301 (30.6%) |
| $75,000 to $99,999 | 562 (21.1%) | 50 (5.1%) |
| $100,000 to $149,999 | 433 (16.3%) | 105 (10.7%) |
| $150,000 or more | 375 (14.1%) | 53 (5.4%) |
| Total | 2,664 (100.0%) | 983 (100.0%) |
Monthly Housing Cost Tiers in Timberlane
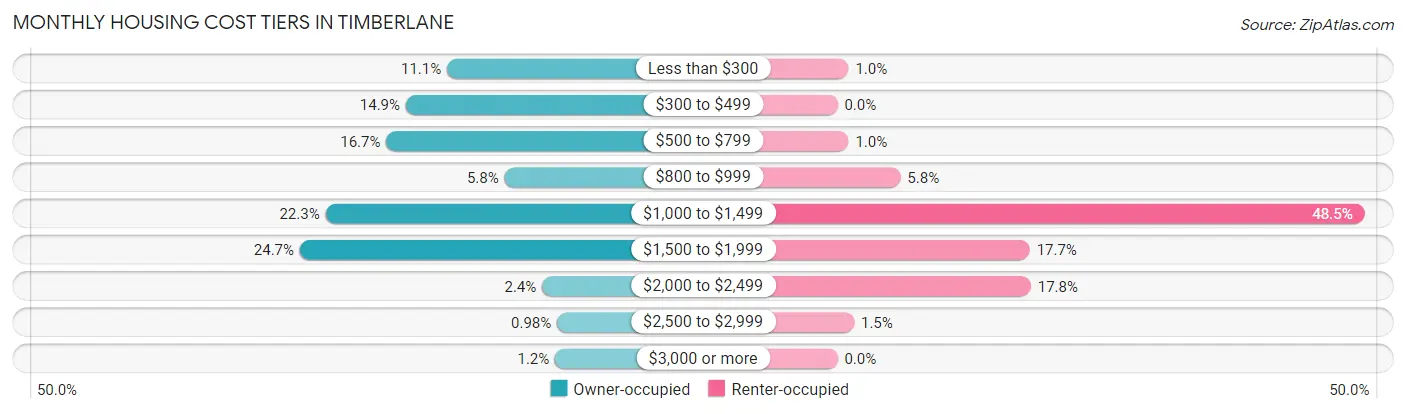
| Monthly Cost | Owner-occupied | Renter-occupied |
| Less than $300 | 296 (11.1%) | 10 (1.0%) |
| $300 to $499 | 397 (14.9%) | 0 (0.0%) |
| $500 to $799 | 445 (16.7%) | 10 (1.0%) |
| $800 to $999 | 155 (5.8%) | 57 (5.8%) |
| $1,000 to $1,499 | 594 (22.3%) | 477 (48.5%) |
| $1,500 to $1,999 | 657 (24.7%) | 174 (17.7%) |
| $2,000 to $2,499 | 63 (2.4%) | 175 (17.8%) |
| $2,500 to $2,999 | 26 (1.0%) | 15 (1.5%) |
| $3,000 or more | 31 (1.2%) | 0 (0.0%) |
| Total | 2,664 (100.0%) | 983 (100.0%) |
Physical Housing Characteristics in Timberlane
Housing Structures in Timberlane
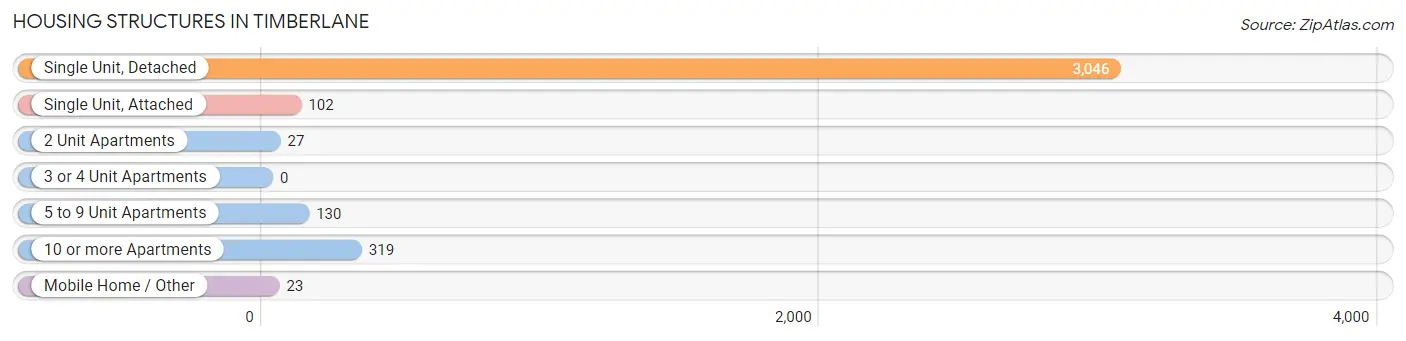
| Structure Type | # Housing Units | % Housing Units |
| Single Unit, Detached | 3,046 | 83.5% |
| Single Unit, Attached | 102 | 2.8% |
| 2 Unit Apartments | 27 | 0.7% |
| 3 or 4 Unit Apartments | 0 | 0.0% |
| 5 to 9 Unit Apartments | 130 | 3.6% |
| 10 or more Apartments | 319 | 8.7% |
| Mobile Home / Other | 23 | 0.6% |
| Total | 3,647 | 100.0% |
Housing Structures by Occupancy in Timberlane
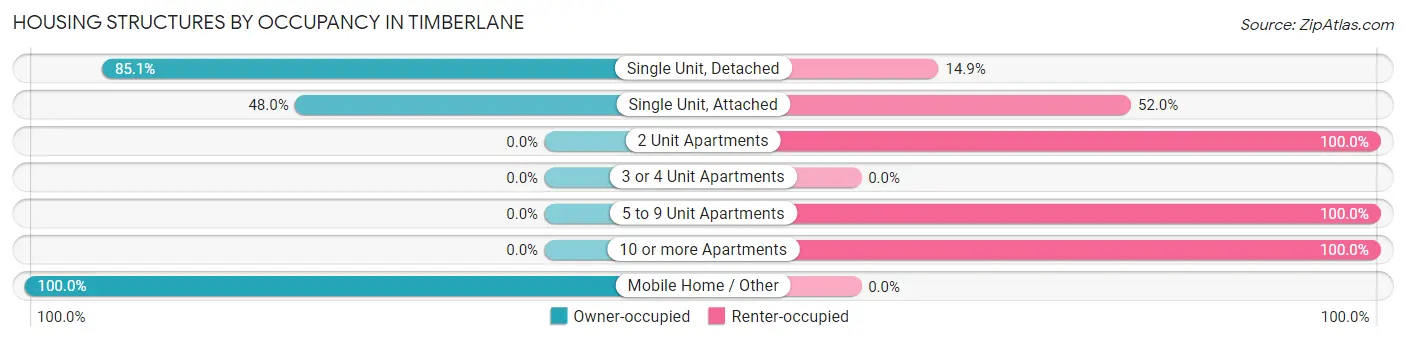
| Structure Type | Owner-occupied | Renter-occupied |
| Single Unit, Detached | 2,592 (85.1%) | 454 (14.9%) |
| Single Unit, Attached | 49 (48.0%) | 53 (52.0%) |
| 2 Unit Apartments | 0 (0.0%) | 27 (100.0%) |
| 3 or 4 Unit Apartments | 0 (0.0%) | 0 (0.0%) |
| 5 to 9 Unit Apartments | 0 (0.0%) | 130 (100.0%) |
| 10 or more Apartments | 0 (0.0%) | 319 (100.0%) |
| Mobile Home / Other | 23 (100.0%) | 0 (0.0%) |
| Total | 2,664 (73.1%) | 983 (27.0%) |
Housing Structures by Number of Rooms in Timberlane
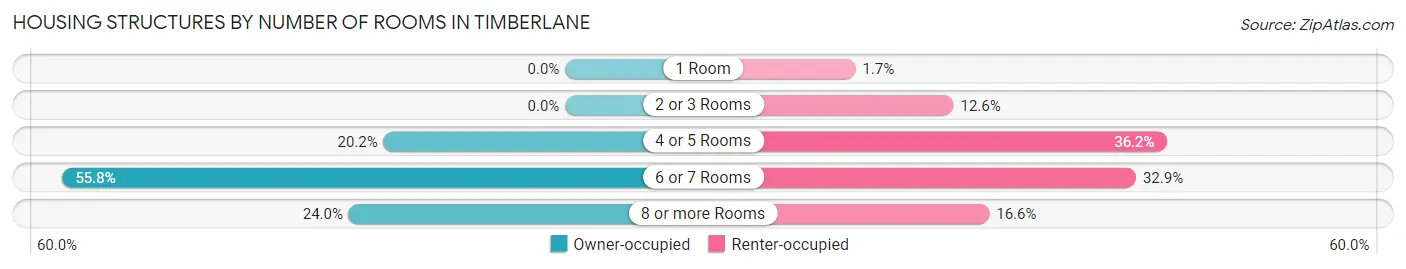
| Number of Rooms | Owner-occupied | Renter-occupied |
| 1 Room | 0 (0.0%) | 17 (1.7%) |
| 2 or 3 Rooms | 0 (0.0%) | 124 (12.6%) |
| 4 or 5 Rooms | 537 (20.2%) | 356 (36.2%) |
| 6 or 7 Rooms | 1,487 (55.8%) | 323 (32.9%) |
| 8 or more Rooms | 640 (24.0%) | 163 (16.6%) |
| Total | 2,664 (100.0%) | 983 (100.0%) |
Housing Structure by Heating Type in Timberlane
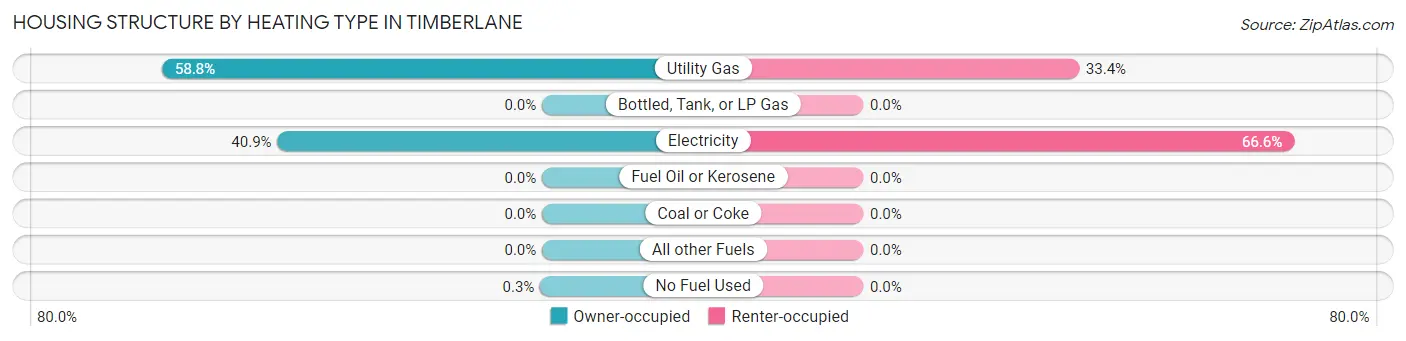
| Heating Type | Owner-occupied | Renter-occupied |
| Utility Gas | 1,566 (58.8%) | 328 (33.4%) |
| Bottled, Tank, or LP Gas | 0 (0.0%) | 0 (0.0%) |
| Electricity | 1,090 (40.9%) | 655 (66.6%) |
| Fuel Oil or Kerosene | 0 (0.0%) | 0 (0.0%) |
| Coal or Coke | 0 (0.0%) | 0 (0.0%) |
| All other Fuels | 0 (0.0%) | 0 (0.0%) |
| No Fuel Used | 8 (0.3%) | 0 (0.0%) |
| Total | 2,664 (100.0%) | 983 (100.0%) |
Household Vehicle Usage in Timberlane
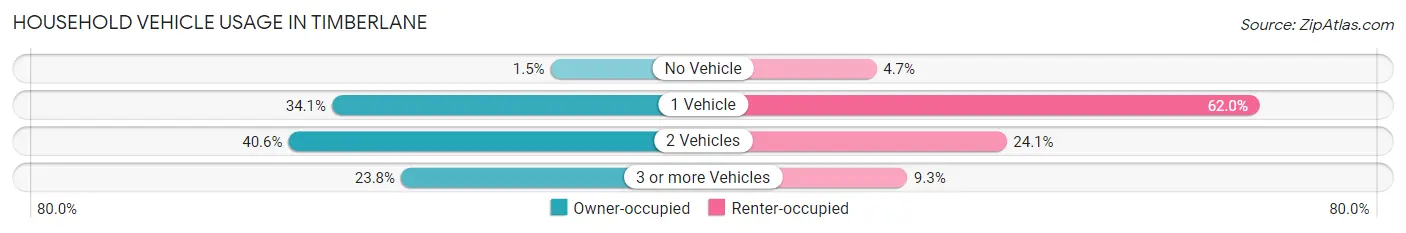
| Vehicles per Household | Owner-occupied | Renter-occupied |
| No Vehicle | 39 (1.5%) | 46 (4.7%) |
| 1 Vehicle | 909 (34.1%) | 609 (62.0%) |
| 2 Vehicles | 1,082 (40.6%) | 237 (24.1%) |
| 3 or more Vehicles | 634 (23.8%) | 91 (9.3%) |
| Total | 2,664 (100.0%) | 983 (100.0%) |
Real Estate & Mortgages in Timberlane
Real Estate and Mortgage Overview in Timberlane
| Characteristic | Without Mortgage | With Mortgage |
| Housing Units | 1,157 | 1,507 |
| Median Property Value | $193,300 | $199,600 |
| Median Household Income | $64,215 | $204 |
| Monthly Housing Costs | $455 | $31 |
| Real Estate Taxes | $696 | $82 |
Property Value by Mortgage Status in Timberlane
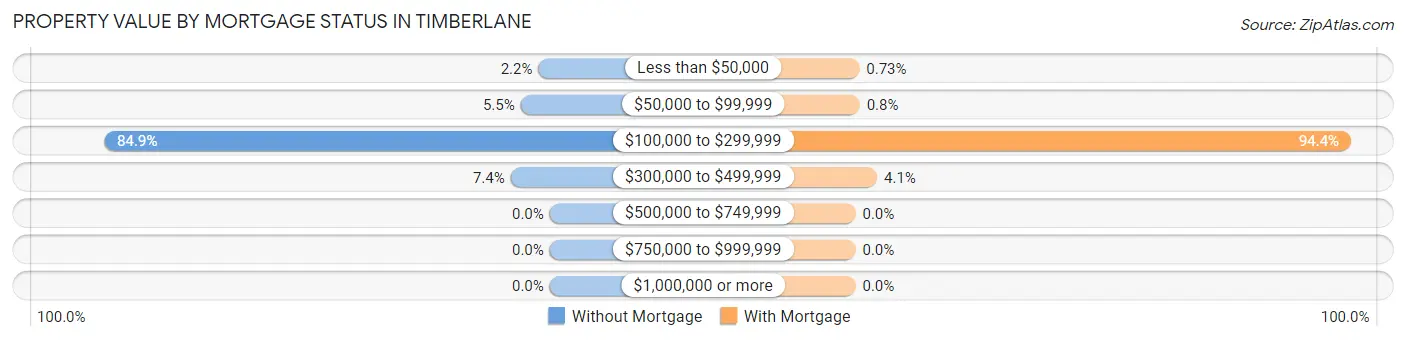
| Property Value | Without Mortgage | With Mortgage |
| Less than $50,000 | 25 (2.2%) | 11 (0.7%) |
| $50,000 to $99,999 | 64 (5.5%) | 12 (0.8%) |
| $100,000 to $299,999 | 982 (84.9%) | 1,422 (94.4%) |
| $300,000 to $499,999 | 86 (7.4%) | 62 (4.1%) |
| $500,000 to $749,999 | 0 (0.0%) | 0 (0.0%) |
| $750,000 to $999,999 | 0 (0.0%) | 0 (0.0%) |
| $1,000,000 or more | 0 (0.0%) | 0 (0.0%) |
| Total | 1,157 (100.0%) | 1,507 (100.0%) |
Household Income by Mortgage Status in Timberlane
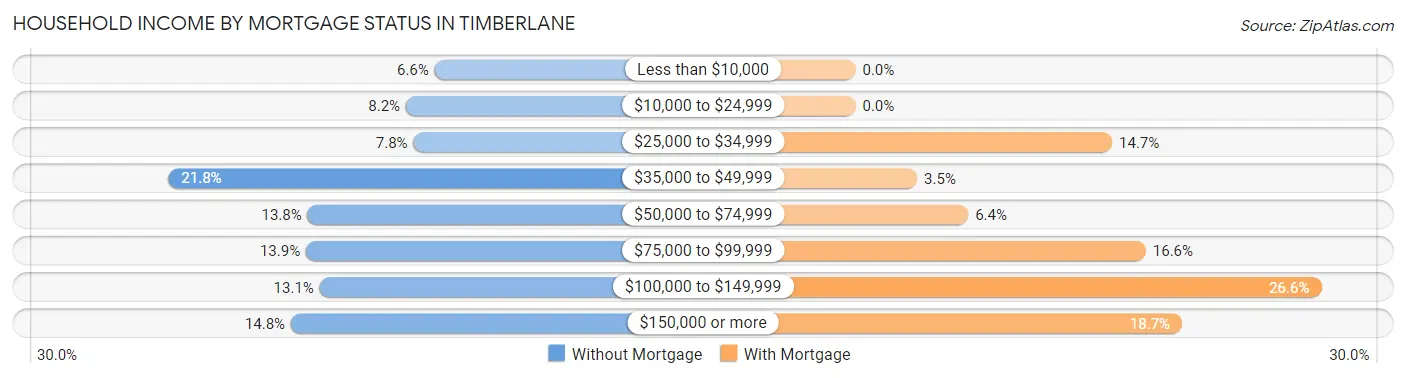
| Household Income | Without Mortgage | With Mortgage |
| Less than $10,000 | 76 (6.6%) | 0 (0.0%) |
| $10,000 to $24,999 | 95 (8.2%) | 0 (0.0%) |
| $25,000 to $34,999 | 90 (7.8%) | 221 (14.7%) |
| $35,000 to $49,999 | 252 (21.8%) | 53 (3.5%) |
| $50,000 to $74,999 | 160 (13.8%) | 97 (6.4%) |
| $75,000 to $99,999 | 161 (13.9%) | 250 (16.6%) |
| $100,000 to $149,999 | 152 (13.1%) | 401 (26.6%) |
| $150,000 or more | 171 (14.8%) | 281 (18.6%) |
| Total | 1,157 (100.0%) | 1,507 (100.0%) |
Property Value to Household Income Ratio in Timberlane
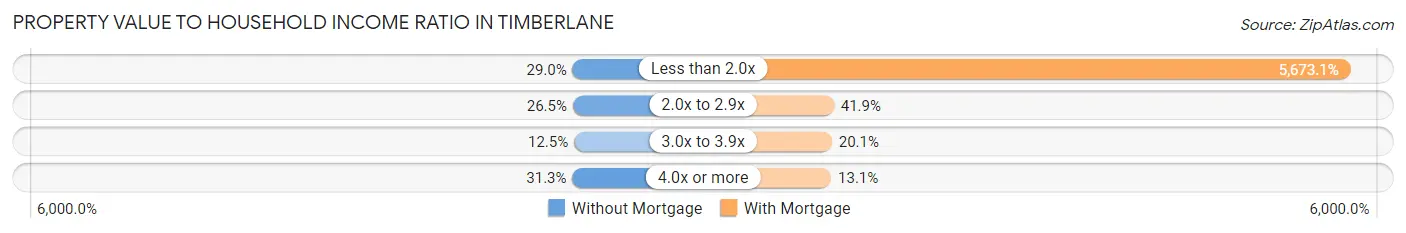
| Value-to-Income Ratio | Without Mortgage | With Mortgage |
| Less than 2.0x | 335 (28.9%) | 85,494 (5,673.1%) |
| 2.0x to 2.9x | 306 (26.5%) | 631 (41.9%) |
| 3.0x to 3.9x | 144 (12.4%) | 303 (20.1%) |
| 4.0x or more | 362 (31.3%) | 198 (13.1%) |
| Total | 1,157 (100.0%) | 1,507 (100.0%) |
Real Estate Taxes by Mortgage Status in Timberlane
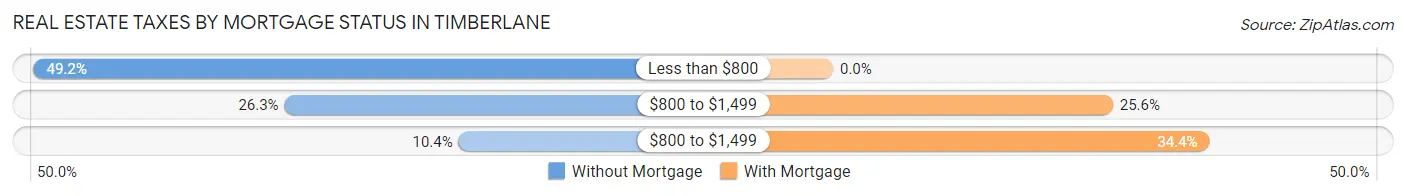
| Property Taxes | Without Mortgage | With Mortgage |
| Less than $800 | 569 (49.2%) | 0 (0.0%) |
| $800 to $1,499 | 304 (26.3%) | 385 (25.6%) |
| $800 to $1,499 | 120 (10.4%) | 518 (34.4%) |
| Total | 1,157 (100.0%) | 1,507 (100.0%) |
Health & Disability in Timberlane
Health Insurance Coverage by Age in Timberlane
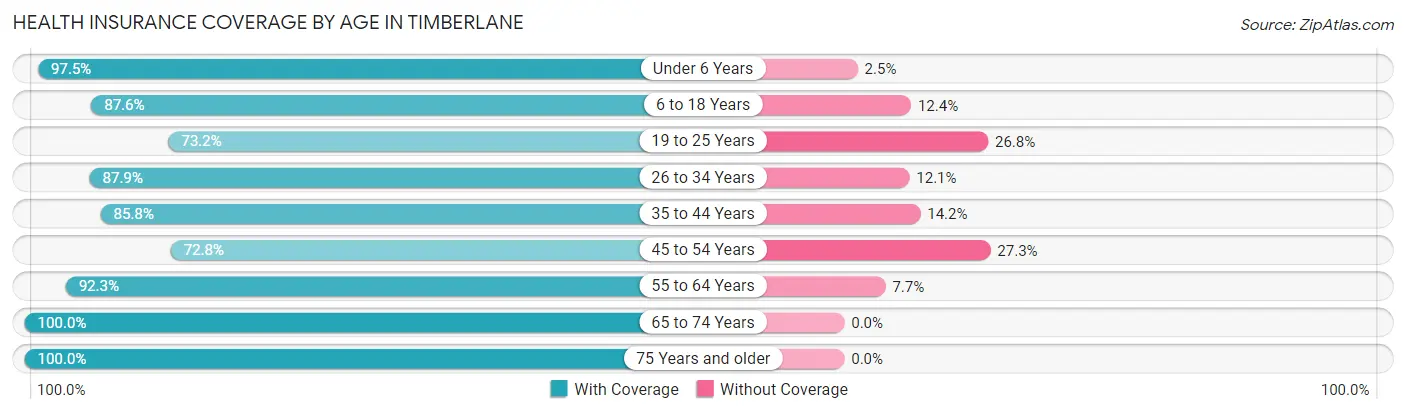
| Age Bracket | With Coverage | Without Coverage |
| Under 6 Years | 1,491 (97.5%) | 38 (2.5%) |
| 6 to 18 Years | 1,943 (87.6%) | 276 (12.4%) |
| 19 to 25 Years | 464 (73.2%) | 170 (26.8%) |
| 26 to 34 Years | 1,253 (87.9%) | 173 (12.1%) |
| 35 to 44 Years | 1,430 (85.8%) | 236 (14.2%) |
| 45 to 54 Years | 865 (72.8%) | 324 (27.3%) |
| 55 to 64 Years | 877 (92.3%) | 73 (7.7%) |
| 65 to 74 Years | 690 (100.0%) | 0 (0.0%) |
| 75 Years and older | 558 (100.0%) | 0 (0.0%) |
| Total | 9,571 (88.1%) | 1,290 (11.9%) |
Health Insurance Coverage by Citizenship Status in Timberlane
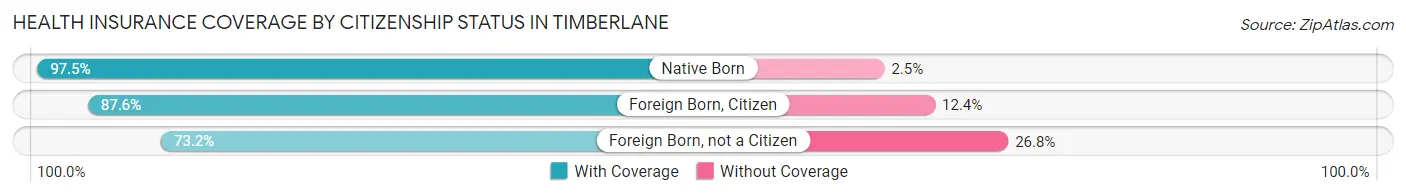
| Citizenship Status | With Coverage | Without Coverage |
| Native Born | 1,491 (97.5%) | 38 (2.5%) |
| Foreign Born, Citizen | 1,943 (87.6%) | 276 (12.4%) |
| Foreign Born, not a Citizen | 464 (73.2%) | 170 (26.8%) |
Health Insurance Coverage by Household Income in Timberlane
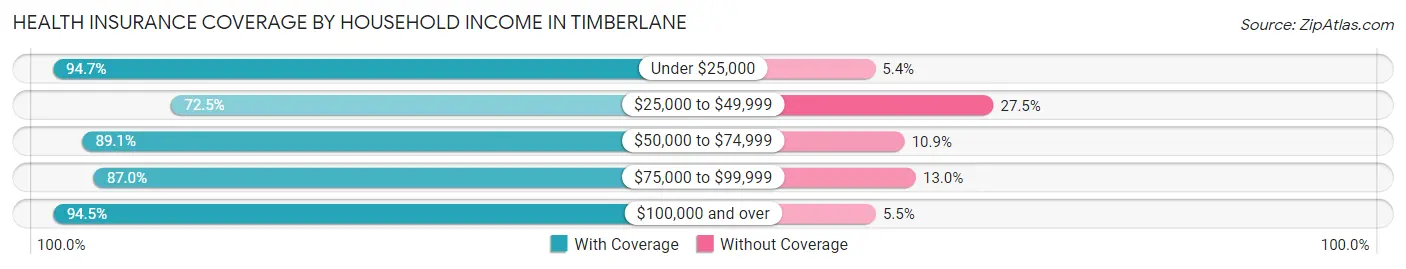
| Household Income | With Coverage | Without Coverage |
| Under $25,000 | 1,344 (94.7%) | 76 (5.3%) |
| $25,000 to $49,999 | 1,473 (72.5%) | 559 (27.5%) |
| $50,000 to $74,999 | 1,880 (89.1%) | 229 (10.9%) |
| $75,000 to $99,999 | 1,584 (87.0%) | 236 (13.0%) |
| $100,000 and over | 3,287 (94.5%) | 190 (5.5%) |
Public vs Private Health Insurance Coverage by Age in Timberlane
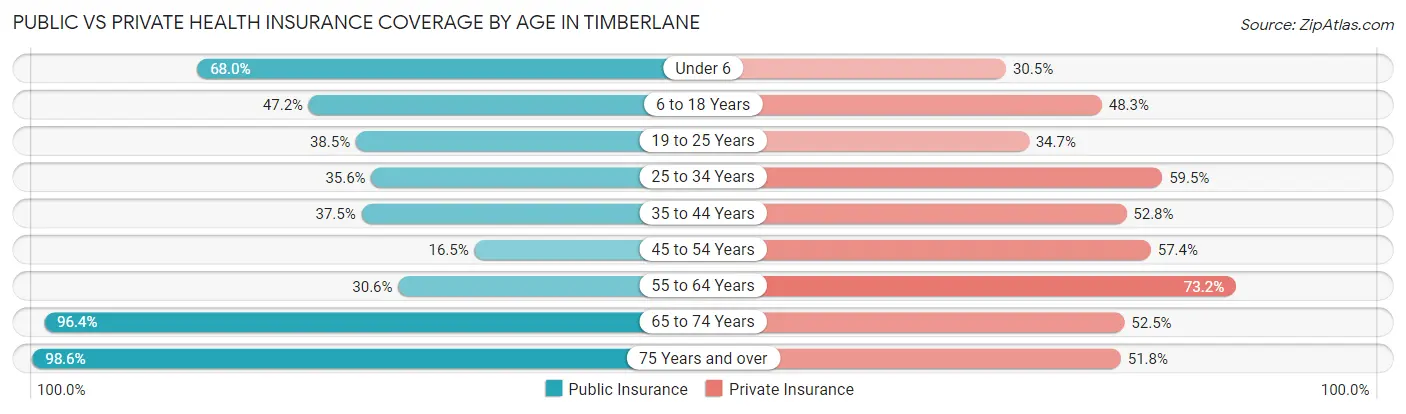
| Age Bracket | Public Insurance | Private Insurance |
| Under 6 | 1,039 (67.9%) | 466 (30.5%) |
| 6 to 18 Years | 1,048 (47.2%) | 1,071 (48.3%) |
| 19 to 25 Years | 244 (38.5%) | 220 (34.7%) |
| 25 to 34 Years | 508 (35.6%) | 848 (59.5%) |
| 35 to 44 Years | 624 (37.4%) | 880 (52.8%) |
| 45 to 54 Years | 196 (16.5%) | 682 (57.4%) |
| 55 to 64 Years | 291 (30.6%) | 695 (73.2%) |
| 65 to 74 Years | 665 (96.4%) | 362 (52.5%) |
| 75 Years and over | 550 (98.6%) | 289 (51.8%) |
| Total | 5,165 (47.6%) | 5,513 (50.8%) |
Disability Status by Sex by Age in Timberlane
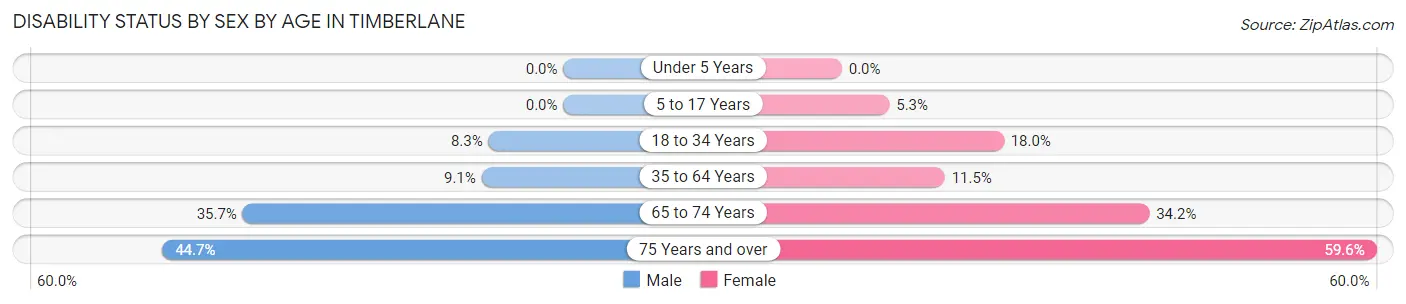
| Age Bracket | Male | Female |
| Under 5 Years | 0 (0.0%) | 0 (0.0%) |
| 5 to 17 Years | 0 (0.0%) | 64 (5.3%) |
| 18 to 34 Years | 76 (8.3%) | 247 (18.0%) |
| 35 to 64 Years | 177 (9.1%) | 213 (11.5%) |
| 65 to 74 Years | 115 (35.7%) | 126 (34.2%) |
| 75 Years and over | 109 (44.7%) | 187 (59.6%) |
Disability Class by Sex by Age in Timberlane
Disability Class: Hearing Difficulty
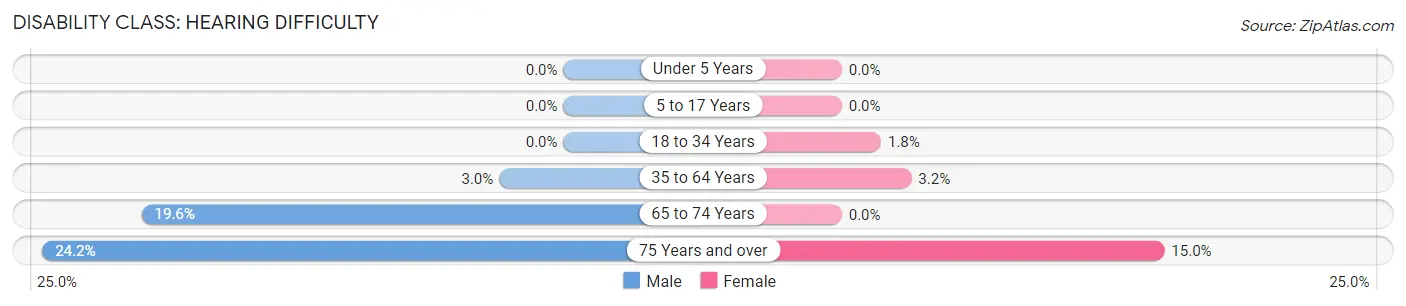
| Age Bracket | Male | Female |
| Under 5 Years | 0 (0.0%) | 0 (0.0%) |
| 5 to 17 Years | 0 (0.0%) | 0 (0.0%) |
| 18 to 34 Years | 0 (0.0%) | 25 (1.8%) |
| 35 to 64 Years | 58 (3.0%) | 60 (3.2%) |
| 65 to 74 Years | 63 (19.6%) | 0 (0.0%) |
| 75 Years and over | 59 (24.2%) | 47 (15.0%) |
Disability Class: Vision Difficulty
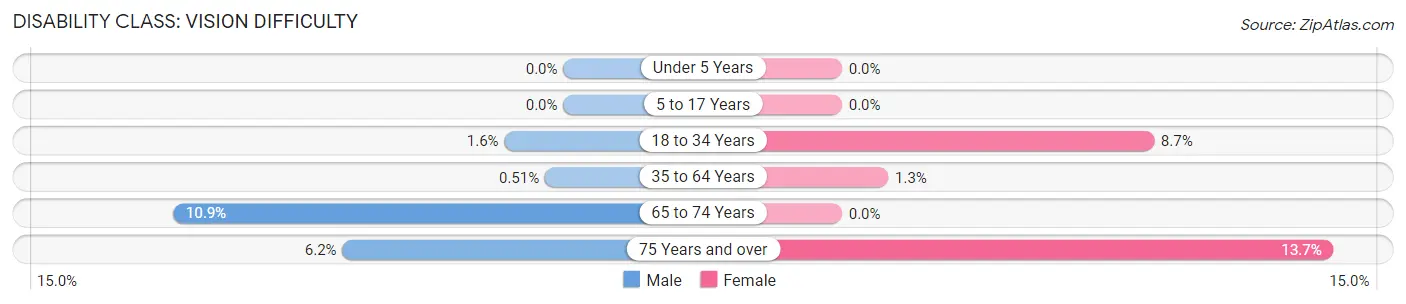
| Age Bracket | Male | Female |
| Under 5 Years | 0 (0.0%) | 0 (0.0%) |
| 5 to 17 Years | 0 (0.0%) | 0 (0.0%) |
| 18 to 34 Years | 15 (1.6%) | 119 (8.7%) |
| 35 to 64 Years | 10 (0.5%) | 24 (1.3%) |
| 65 to 74 Years | 35 (10.9%) | 0 (0.0%) |
| 75 Years and over | 15 (6.1%) | 43 (13.7%) |
Disability Class: Cognitive Difficulty
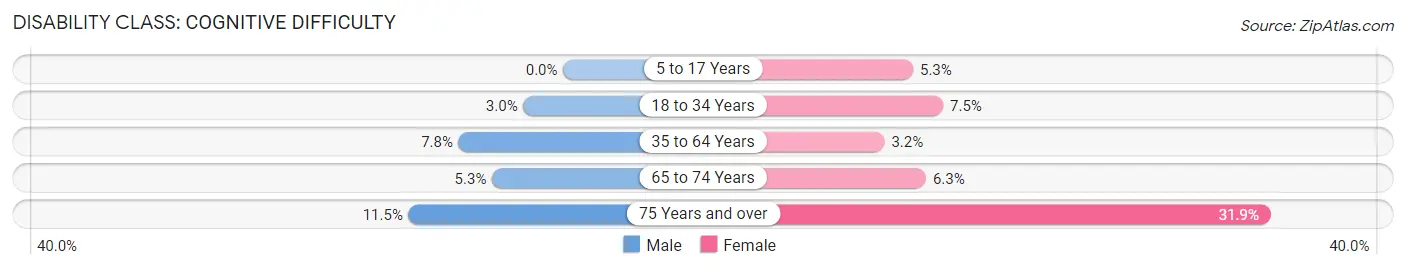
| Age Bracket | Male | Female |
| 5 to 17 Years | 0 (0.0%) | 64 (5.3%) |
| 18 to 34 Years | 27 (3.0%) | 103 (7.5%) |
| 35 to 64 Years | 151 (7.8%) | 59 (3.2%) |
| 65 to 74 Years | 17 (5.3%) | 23 (6.2%) |
| 75 Years and over | 28 (11.5%) | 100 (31.9%) |
Disability Class: Ambulatory Difficulty
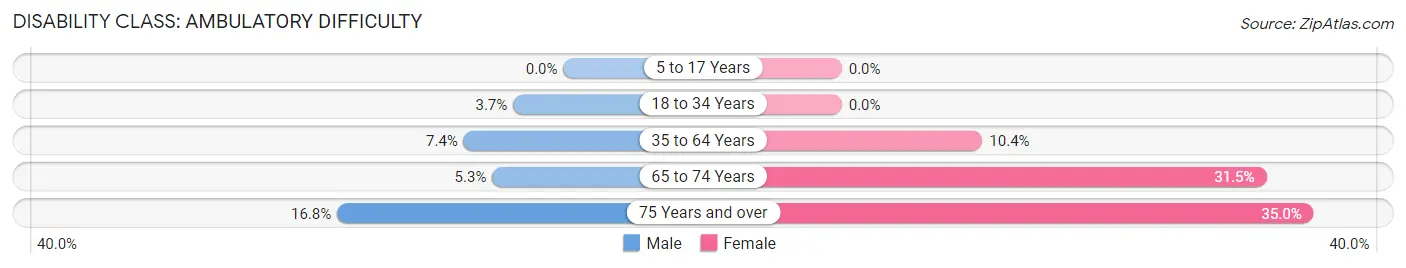
| Age Bracket | Male | Female |
| 5 to 17 Years | 0 (0.0%) | 0 (0.0%) |
| 18 to 34 Years | 34 (3.7%) | 0 (0.0%) |
| 35 to 64 Years | 144 (7.4%) | 194 (10.4%) |
| 65 to 74 Years | 17 (5.3%) | 116 (31.5%) |
| 75 Years and over | 41 (16.8%) | 110 (35.0%) |
Disability Class: Self-Care Difficulty
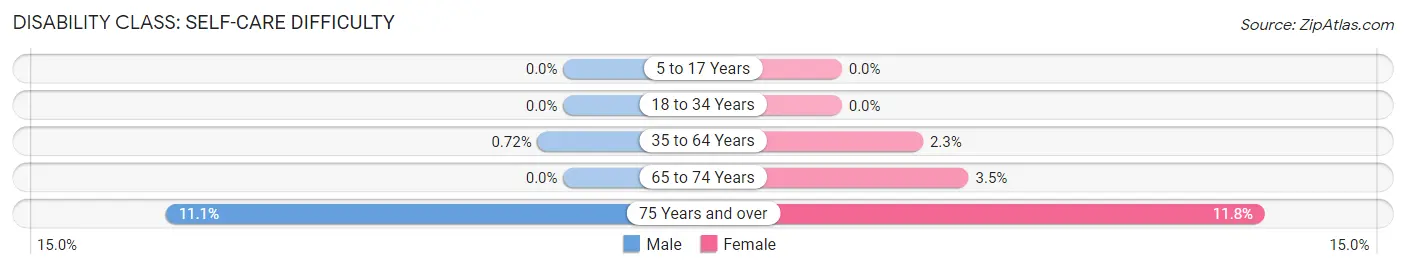
| Age Bracket | Male | Female |
| 5 to 17 Years | 0 (0.0%) | 0 (0.0%) |
| 18 to 34 Years | 0 (0.0%) | 0 (0.0%) |
| 35 to 64 Years | 14 (0.7%) | 42 (2.3%) |
| 65 to 74 Years | 0 (0.0%) | 13 (3.5%) |
| 75 Years and over | 27 (11.1%) | 37 (11.8%) |
Technology Access in Timberlane
Computing Device Access in Timberlane
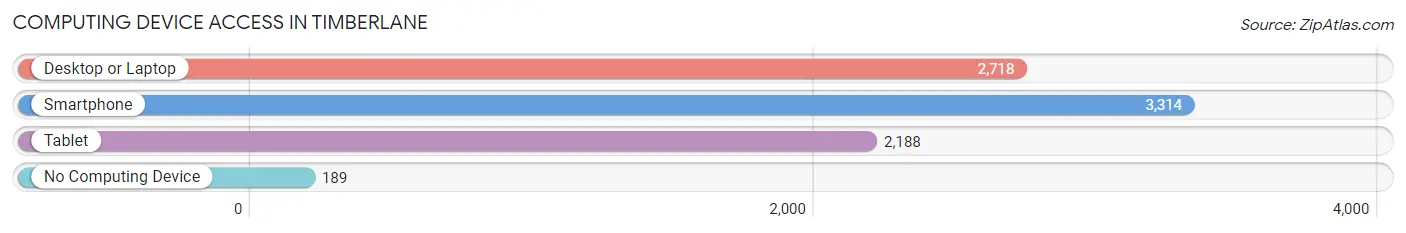
| Device Type | # Households | % Households |
| Desktop or Laptop | 2,718 | 74.5% |
| Smartphone | 3,314 | 90.9% |
| Tablet | 2,188 | 60.0% |
| No Computing Device | 189 | 5.2% |
| Total | 3,647 | 100.0% |
Internet Access in Timberlane
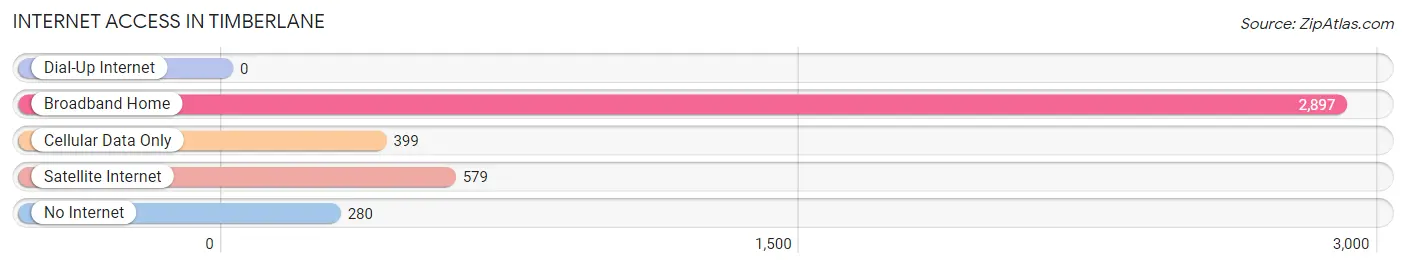
| Internet Type | # Households | % Households |
| Dial-Up Internet | 0 | 0.0% |
| Broadband Home | 2,897 | 79.4% |
| Cellular Data Only | 399 | 10.9% |
| Satellite Internet | 579 | 15.9% |
| No Internet | 280 | 7.7% |
| Total | 3,647 | 100.0% |
Timberlane Summary
Timberlane is a small unincorporated community located in the parish of St. Tammany, Louisiana. It is situated on the north shore of Lake Pontchartrain, approximately 25 miles north of New Orleans. The community is bordered by the towns of Slidell and Pearl River.
History
The area that is now known as Timberlane was originally inhabited by Native Americans, including the Choctaw and Houma tribes. The first European settlers arrived in the area in the late 1700s, and the community was officially established in 1820. The name Timberlane was derived from the abundance of timber in the area.
In the early 1900s, the area was primarily used for timber harvesting and farming. The timber industry was the main source of income for the community, and the area was known for its high-quality lumber.
Geography
Timberlane is located in the northern part of St. Tammany Parish, Louisiana. It is situated on the north shore of Lake Pontchartrain, approximately 25 miles north of New Orleans. The community is bordered by the towns of Slidell and Pearl River.
The terrain of Timberlane is mostly flat, with some rolling hills. The area is heavily forested, with a variety of hardwood and pine trees. The climate is humid subtropical, with hot, humid summers and mild winters.
Economy
The economy of Timberlane is largely based on the timber industry. The area is known for its high-quality lumber, and the timber industry is the main source of income for the community.
In addition to the timber industry, the area is also home to a variety of small businesses, including restaurants, retail stores, and service providers. The community also has a few small manufacturing companies.
Demographics
As of the 2010 census, the population of Timberlane was 1,845. The racial makeup of the community was 94.3% White, 2.2% African American, 0.7% Native American, 0.3% Asian, 0.1% Pacific Islander, and 2.4% from other races.
The median household income in Timberlane was $45,000, and the median family income was $50,000. The per capita income was $20,000. The unemployment rate was 5.2%.
The majority of the population (90.3%) was born in the United States, and the majority of the population (90.3%) spoke English as their primary language. The largest ancestry groups in Timberlane were German (25.3%), Irish (17.3%), French (14.3%), and English (13.3%).
Common Questions
What is Per Capita Income in Timberlane?
Per Capita income in Timberlane is $27,908.
What is the Median Family Income in Timberlane?
Median Family Income in Timberlane is $71,875.
What is the Median Household income in Timberlane?
Median Household Income in Timberlane is $64,591.
What is Income or Wage Gap in Timberlane?
Income or Wage Gap in Timberlane is 9.6%.
Women in Timberlane earn 90.4 cents for every dollar earned by a man.
What is Family Income Deficit in Timberlane?
Family Income Deficit in Timberlane is $8,318.
Families that are below poverty line in Timberlane earn $8,318 less on average than the poverty threshold level.
What is Inequality or Gini Index in Timberlane?
Inequality or Gini Index in Timberlane is 0.49.
What is the Total Population of Timberlane?
Total Population of Timberlane is 10,912.
What is the Total Male Population of Timberlane?
Total Male Population of Timberlane is 4,819.
What is the Total Female Population of Timberlane?
Total Female Population of Timberlane is 6,093.
What is the Ratio of Males per 100 Females in Timberlane?
There are 79.09 Males per 100 Females in Timberlane.
What is the Ratio of Females per 100 Males in Timberlane?
There are 126.44 Females per 100 Males in Timberlane.
What is the Median Population Age in Timberlane?
Median Population Age in Timberlane is 32.7 Years.
What is the Average Family Size in Timberlane
Average Family Size in Timberlane is 3.6 People.
What is the Average Household Size in Timberlane
Average Household Size in Timberlane is 3.0 People.
How Large is the Labor Force in Timberlane?
There are 5,092 People in the Labor Forcein in Timberlane.
What is the Percentage of People in the Labor Force in Timberlane?
67.2% of People are in the Labor Force in Timberlane.
What is the Unemployment Rate in Timberlane?
Unemployment Rate in Timberlane is 10.9%.