Riverdale, GA Map & Demographics
Riverdale Map
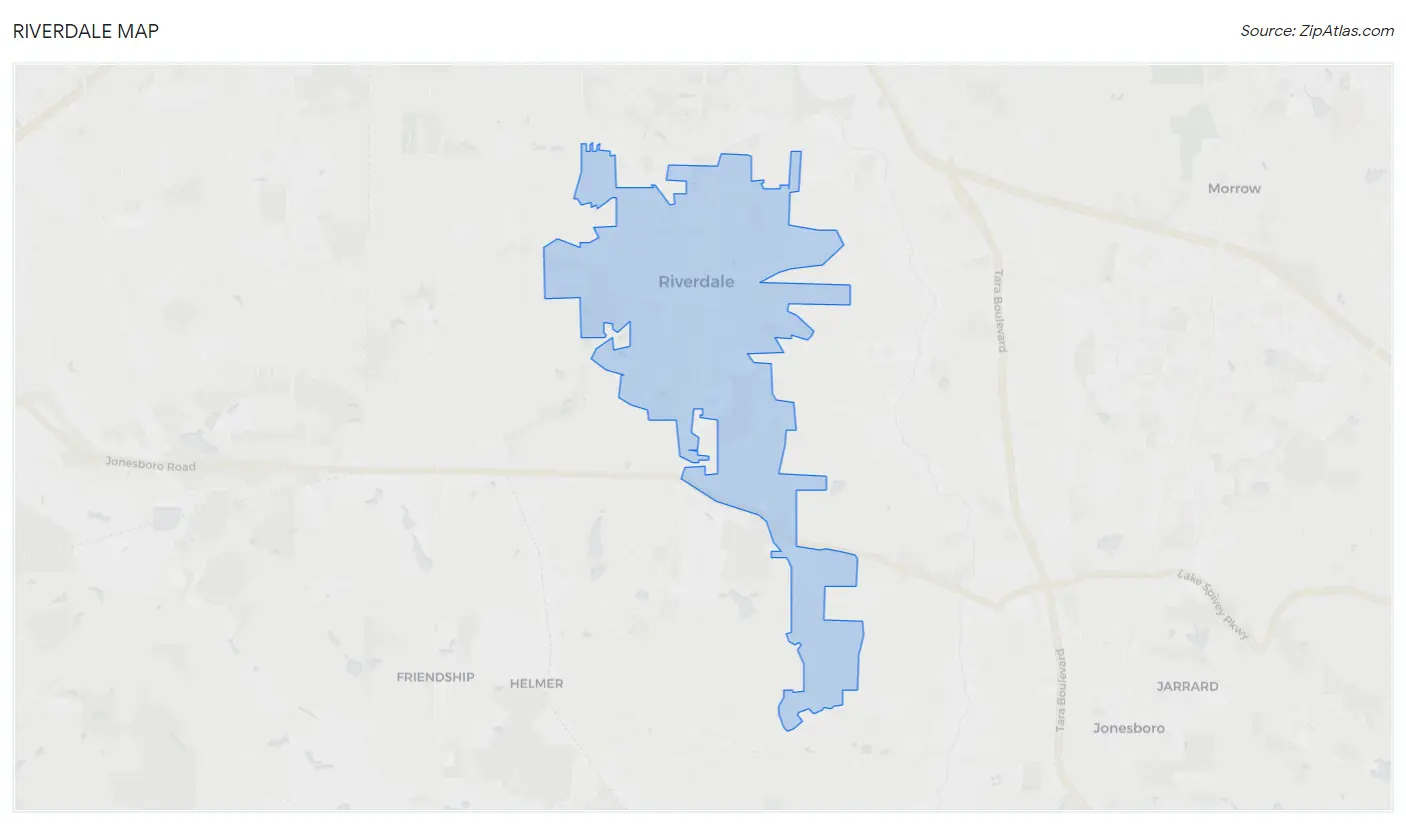
Riverdale Overview
$29,406
PER CAPITA INCOME
$78,099
AVG FAMILY INCOME
$61,622
AVG HOUSEHOLD INCOME
5.3%
WAGE / INCOME GAP [ % ]
94.7¢/ $1
WAGE / INCOME GAP [ $ ]
0.43
INEQUALITY / GINI INDEX
14,933
TOTAL POPULATION
7,082
MALE POPULATION
7,851
FEMALE POPULATION
90.21
MALES / 100 FEMALES
110.86
FEMALES / 100 MALES
37.4
MEDIAN AGE
3.3
AVG FAMILY SIZE
2.6
AVG HOUSEHOLD SIZE
8,263
LABOR FORCE [ PEOPLE ]
69.0%
PERCENT IN LABOR FORCE
3.0%
UNEMPLOYMENT RATE
Income in Riverdale
Income Overview in Riverdale
Per Capita Income in Riverdale is $29,406, while median incomes of families and households are $78,099 and $61,622 respectively.
| Characteristic | Number | Measure |
| Per Capita Income | 14,933 | $29,406 |
| Median Family Income | 3,507 | $78,099 |
| Mean Family Income | 3,507 | $96,453 |
| Median Household Income | 5,715 | $61,622 |
| Mean Household Income | 5,715 | $78,502 |
| Income Deficit | 3,507 | $0 |
| Wage / Income Gap (%) | 14,933 | 5.28% |
| Wage / Income Gap ($) | 14,933 | 94.72¢ per $1 |
| Gini / Inequality Index | 14,933 | 0.43 |
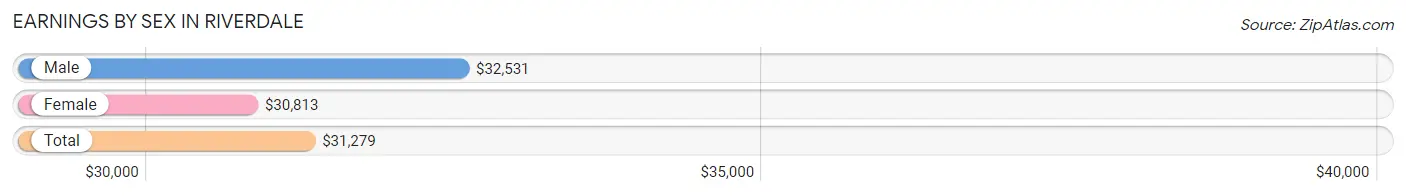
Earnings by Sex in Riverdale
Average Earnings in Riverdale are $31,279, $32,531 for men and $30,813 for women, a difference of 5.3%.
| Sex | Number | Average Earnings |
| Male | 3,772 (45.2%) | $32,531 |
| Female | 4,581 (54.8%) | $30,813 |
| Total | 8,353 (100.0%) | $31,279 |
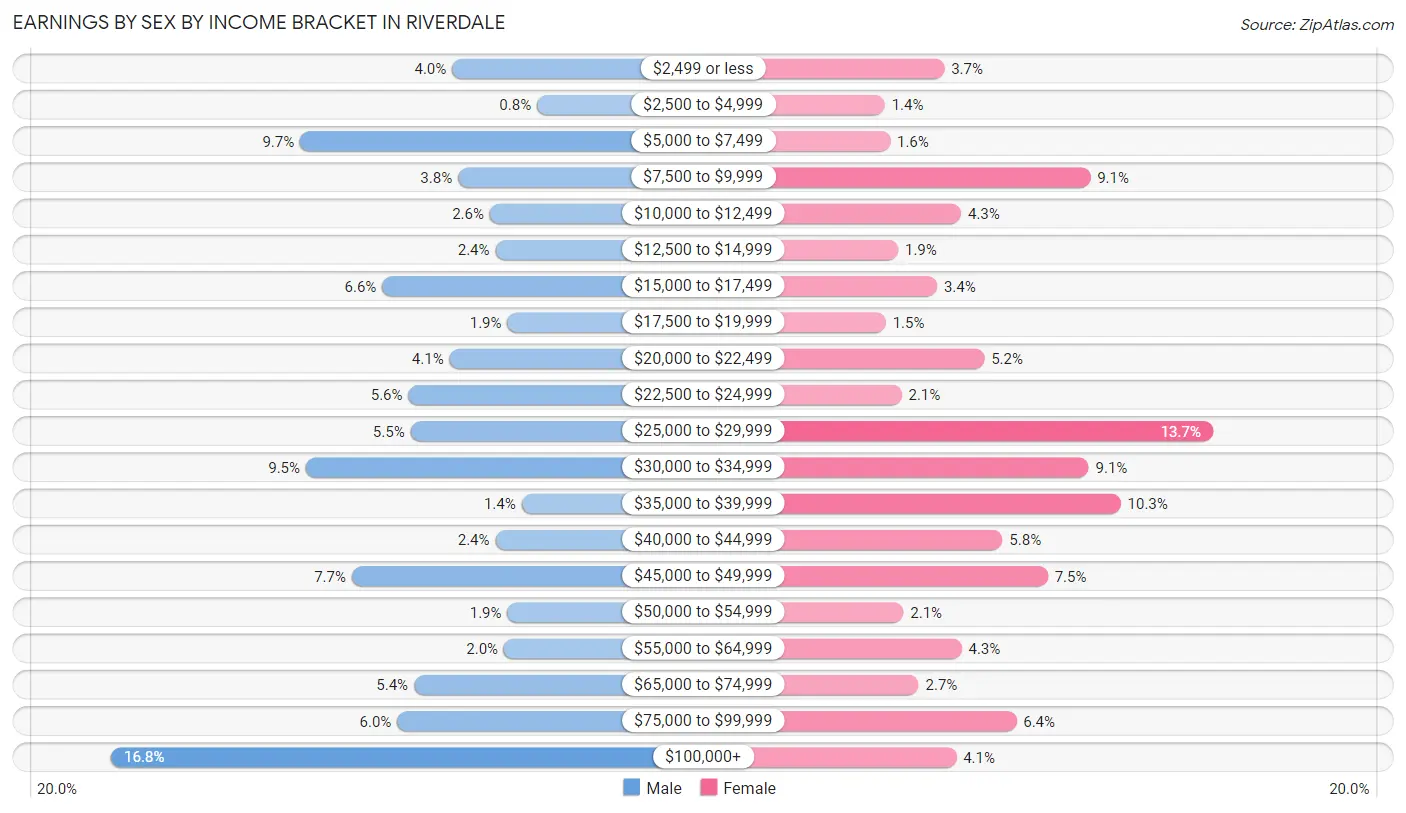
Earnings by Sex by Income Bracket in Riverdale
The most common earnings brackets in Riverdale are $100,000+ for men (632 | 16.8%) and $25,000 to $29,999 for women (628 | 13.7%).
| Income | Male | Female |
| $2,499 or less | 150 (4.0%) | 167 (3.6%) |
| $2,500 to $4,999 | 30 (0.8%) | 65 (1.4%) |
| $5,000 to $7,499 | 365 (9.7%) | 74 (1.6%) |
| $7,500 to $9,999 | 142 (3.8%) | 418 (9.1%) |
| $10,000 to $12,499 | 97 (2.6%) | 196 (4.3%) |
| $12,500 to $14,999 | 89 (2.4%) | 88 (1.9%) |
| $15,000 to $17,499 | 249 (6.6%) | 155 (3.4%) |
| $17,500 to $19,999 | 72 (1.9%) | 67 (1.5%) |
| $20,000 to $22,499 | 154 (4.1%) | 236 (5.1%) |
| $22,500 to $24,999 | 212 (5.6%) | 94 (2.1%) |
| $25,000 to $29,999 | 209 (5.5%) | 628 (13.7%) |
| $30,000 to $34,999 | 357 (9.5%) | 415 (9.1%) |
| $35,000 to $39,999 | 52 (1.4%) | 470 (10.3%) |
| $40,000 to $44,999 | 89 (2.4%) | 267 (5.8%) |
| $45,000 to $49,999 | 292 (7.7%) | 345 (7.5%) |
| $50,000 to $54,999 | 72 (1.9%) | 97 (2.1%) |
| $55,000 to $64,999 | 77 (2.0%) | 197 (4.3%) |
| $65,000 to $74,999 | 204 (5.4%) | 123 (2.7%) |
| $75,000 to $99,999 | 228 (6.0%) | 291 (6.4%) |
| $100,000+ | 632 (16.8%) | 188 (4.1%) |
| Total | 3,772 (100.0%) | 4,581 (100.0%) |
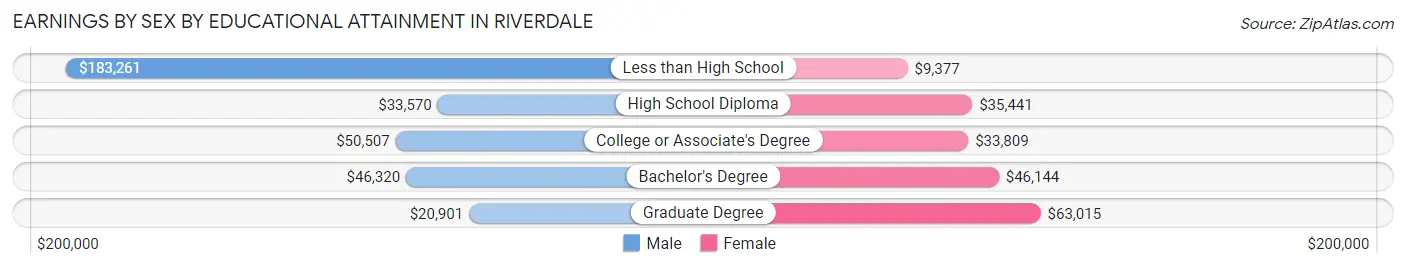
Earnings by Sex by Educational Attainment in Riverdale
Average earnings in Riverdale are $42,139 for men and $33,713 for women, a difference of 20.0%. Men with an educational attainment of less than high school enjoy the highest average annual earnings of $183,261, while those with graduate degree education earn the least with $20,901. Women with an educational attainment of graduate degree earn the most with the average annual earnings of $63,015, while those with less than high school education have the smallest earnings of $9,377.
| Educational Attainment | Male Income | Female Income |
| Less than High School | $183,261 | $9,377 |
| High School Diploma | $33,570 | $35,441 |
| College or Associate's Degree | $50,507 | $33,809 |
| Bachelor's Degree | $46,320 | $46,144 |
| Graduate Degree | $20,901 | $63,015 |
| Total | $42,139 | $33,713 |
Family Income in Riverdale
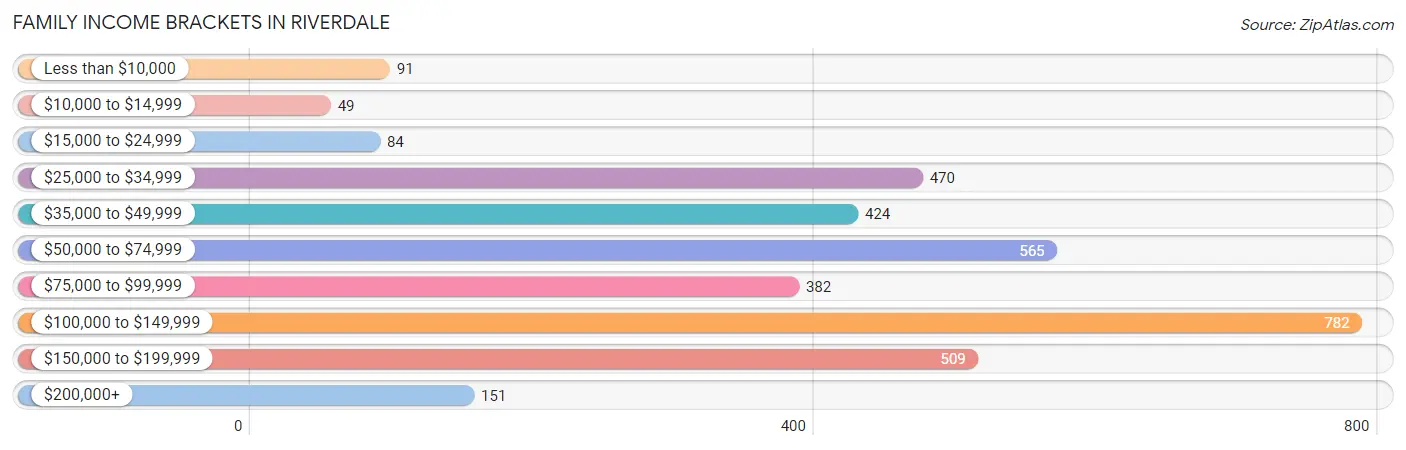
Family Income Brackets in Riverdale
According to the Riverdale family income data, there are 782 families falling into the $100,000 to $149,999 income range, which is the most common income bracket and makes up 22.3% of all families. Conversely, the $10,000 to $14,999 income bracket is the least frequent group with only 49 families (1.4%) belonging to this category.
| Income Bracket | # Families | % Families |
| Less than $10,000 | 91 | 2.6% |
| $10,000 to $14,999 | 49 | 1.4% |
| $15,000 to $24,999 | 84 | 2.4% |
| $25,000 to $34,999 | 470 | 13.4% |
| $35,000 to $49,999 | 424 | 12.1% |
| $50,000 to $74,999 | 565 | 16.1% |
| $75,000 to $99,999 | 382 | 10.9% |
| $100,000 to $149,999 | 782 | 22.3% |
| $150,000 to $199,999 | 509 | 14.5% |
| $200,000+ | 151 | 4.3% |
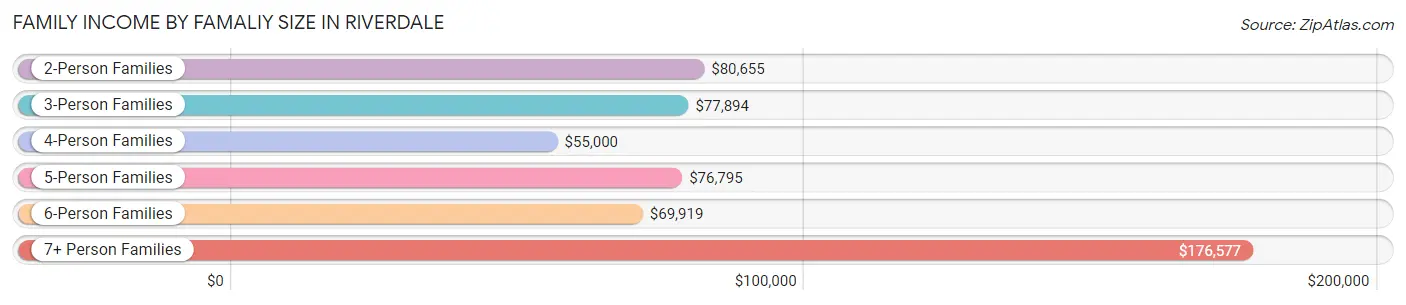
Family Income by Famaliy Size in Riverdale
7+ person families (101 | 2.9%) account for the highest median family income in Riverdale with $176,577 per family, while 2-person families (1,493 | 42.6%) have the highest median income of $40,328 per family member.
| Income Bracket | # Families | Median Income |
| 2-Person Families | 1,493 (42.6%) | $80,655 |
| 3-Person Families | 1,057 (30.1%) | $77,894 |
| 4-Person Families | 428 (12.2%) | $55,000 |
| 5-Person Families | 294 (8.4%) | $76,795 |
| 6-Person Families | 134 (3.8%) | $69,919 |
| 7+ Person Families | 101 (2.9%) | $176,577 |
| Total | 3,507 (100.0%) | $78,099 |
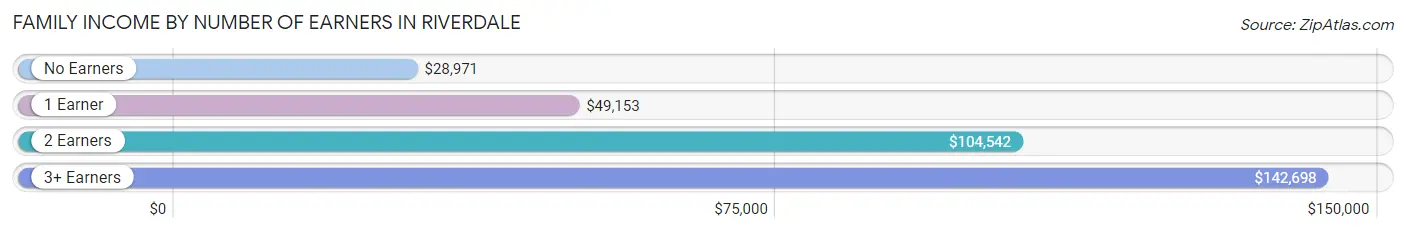
Family Income by Number of Earners in Riverdale
The median family income in Riverdale is $78,099, with families comprising 3+ earners (689) having the highest median family income of $142,698, while families with no earners (290) have the lowest median family income of $28,971, accounting for 19.7% and 8.3% of families, respectively.
| Number of Earners | # Families | Median Income |
| No Earners | 290 (8.3%) | $28,971 |
| 1 Earner | 1,122 (32.0%) | $49,153 |
| 2 Earners | 1,406 (40.1%) | $104,542 |
| 3+ Earners | 689 (19.7%) | $142,698 |
| Total | 3,507 (100.0%) | $78,099 |
Household Income in Riverdale
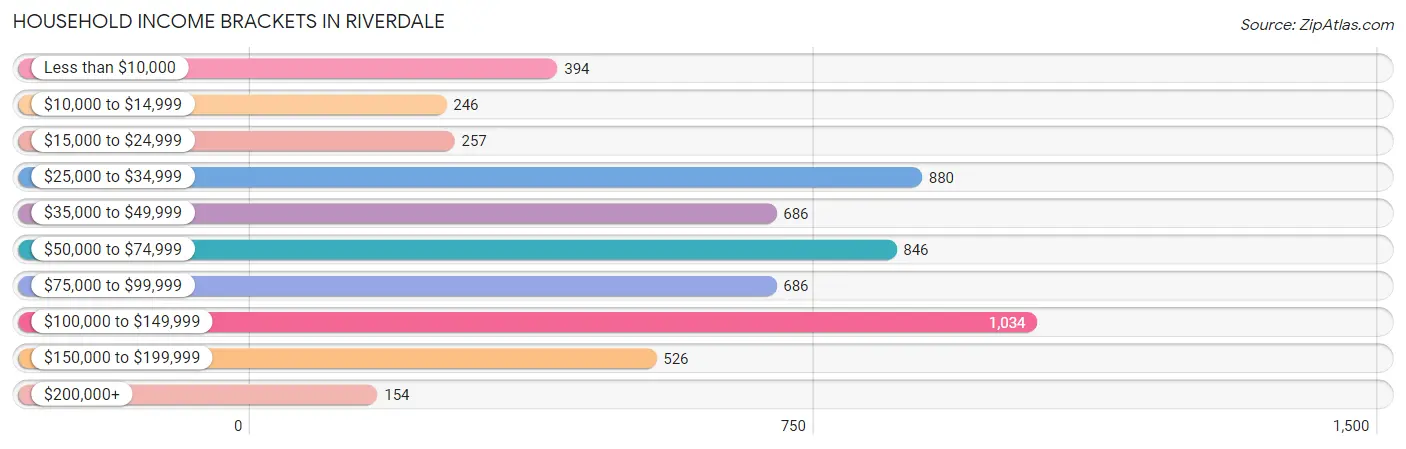
Household Income Brackets in Riverdale
With 1,034 households falling in the category, the $100,000 to $149,999 income range is the most frequent in Riverdale, accounting for 18.1% of all households. In contrast, only 154 households (2.7%) fall into the $200,000+ income bracket, making it the least populous group.
| Income Bracket | # Households | % Households |
| Less than $10,000 | 394 | 6.9% |
| $10,000 to $14,999 | 246 | 4.3% |
| $15,000 to $24,999 | 257 | 4.5% |
| $25,000 to $34,999 | 880 | 15.4% |
| $35,000 to $49,999 | 686 | 12.0% |
| $50,000 to $74,999 | 846 | 14.8% |
| $75,000 to $99,999 | 686 | 12.0% |
| $100,000 to $149,999 | 1,034 | 18.1% |
| $150,000 to $199,999 | 526 | 9.2% |
| $200,000+ | 154 | 2.7% |
Household Income by Householder Age in Riverdale
The median household income in Riverdale is $61,622, with the highest median household income of $81,395 found in the 45 to 64 years age bracket for the primary householder. A total of 2,994 households (52.4%) fall into this category. Meanwhile, the 15 to 24 years age bracket for the primary householder has the lowest median household income of $33,839, with 114 households (2.0%) in this group.
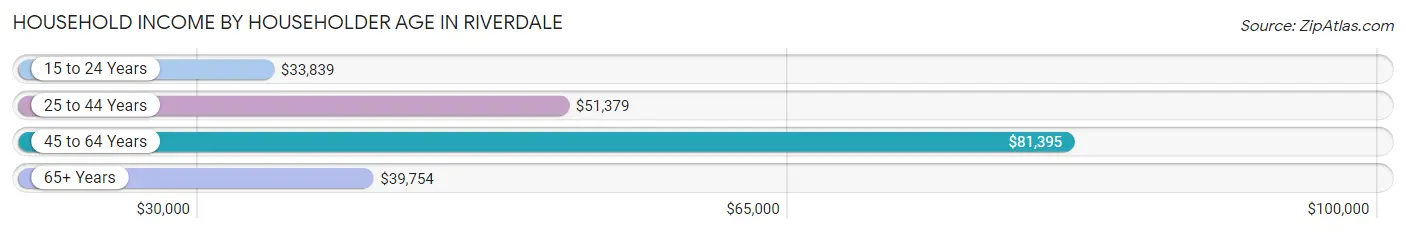
| Income Bracket | # Households | Median Income |
| 15 to 24 Years | 114 (2.0%) | $33,839 |
| 25 to 44 Years | 1,644 (28.8%) | $51,379 |
| 45 to 64 Years | 2,994 (52.4%) | $81,395 |
| 65+ Years | 963 (16.9%) | $39,754 |
| Total | 5,715 (100.0%) | $61,622 |
Poverty in Riverdale
Income Below Poverty by Sex and Age in Riverdale
With 15.0% poverty level for males and 14.2% for females among the residents of Riverdale, 15 year old males and 15 year old females are the most vulnerable to poverty, with 13 males (65.0%) and 39 females (100.0%) in their respective age groups living below the poverty level.
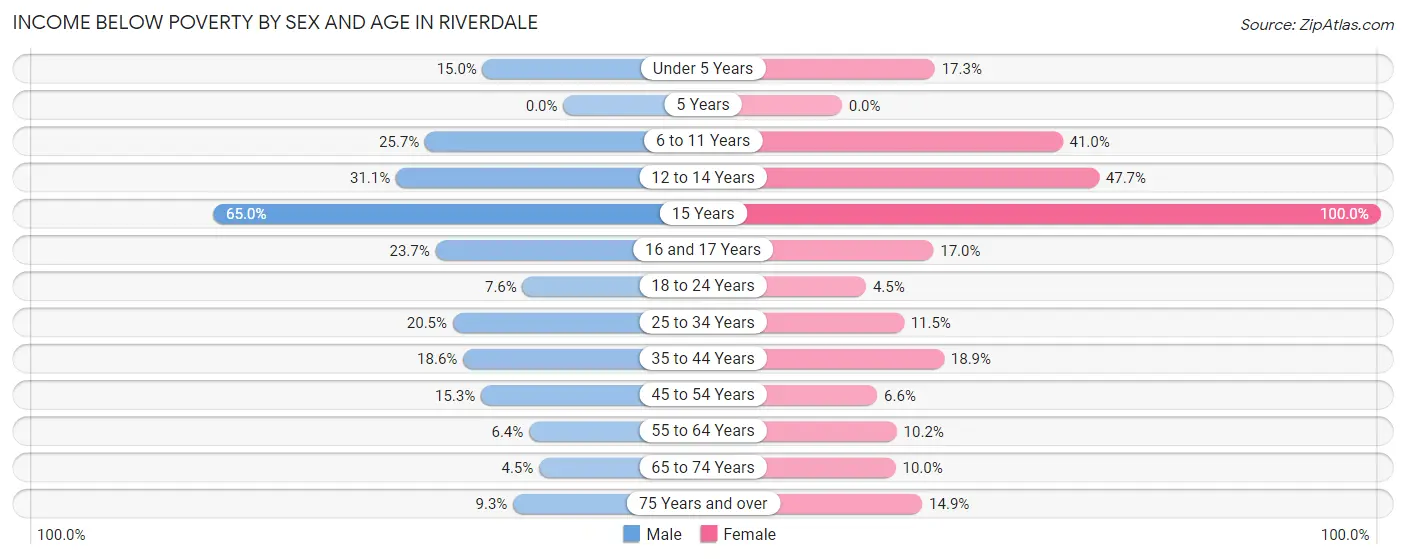
| Age Bracket | Male | Female |
| Under 5 Years | 84 (15.0%) | 74 (17.2%) |
| 5 Years | 0 (0.0%) | 0 (0.0%) |
| 6 to 11 Years | 166 (25.7%) | 209 (41.0%) |
| 12 to 14 Years | 109 (31.0%) | 73 (47.7%) |
| 15 Years | 13 (65.0%) | 39 (100.0%) |
| 16 and 17 Years | 74 (23.7%) | 27 (17.0%) |
| 18 to 24 Years | 63 (7.6%) | 32 (4.5%) |
| 25 to 34 Years | 184 (20.5%) | 136 (11.5%) |
| 35 to 44 Years | 143 (18.6%) | 190 (18.9%) |
| 45 to 54 Years | 111 (15.3%) | 79 (6.6%) |
| 55 to 64 Years | 70 (6.4%) | 133 (10.2%) |
| 65 to 74 Years | 25 (4.5%) | 58 (10.0%) |
| 75 Years and over | 11 (9.3%) | 54 (14.9%) |
| Total | 1,053 (15.0%) | 1,104 (14.2%) |
Income Above Poverty by Sex and Age in Riverdale
According to the poverty statistics in Riverdale, males aged 5 years and females aged 5 years are the age groups that are most secure financially, with 100.0% of males and 100.0% of females in these age groups living above the poverty line.
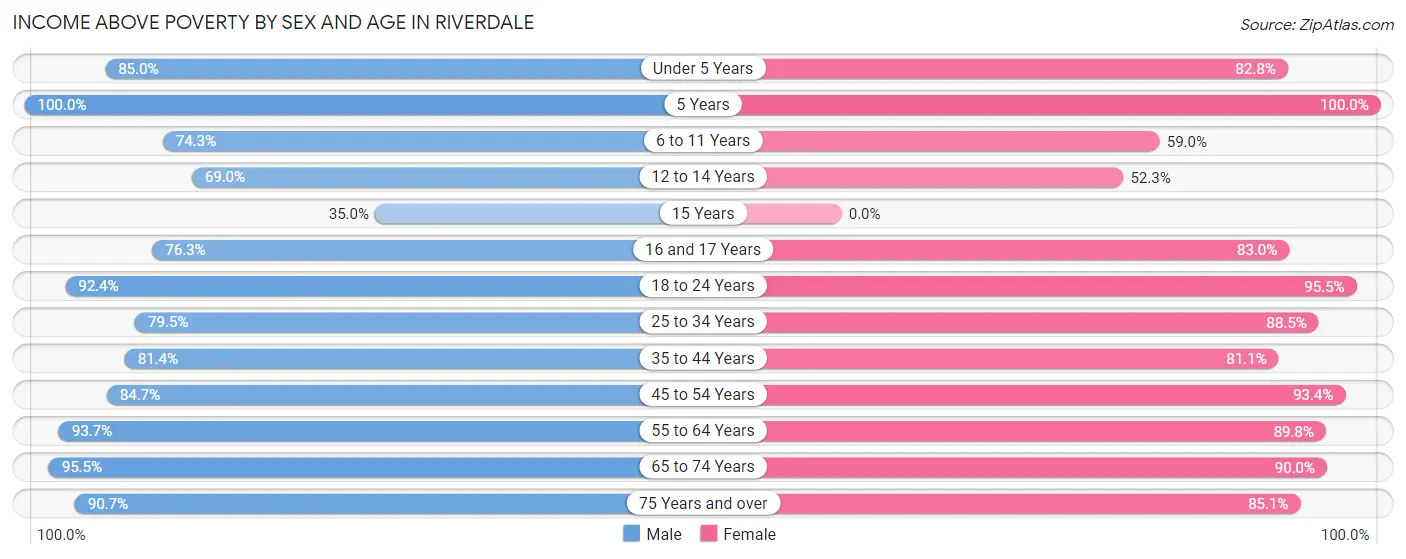
| Age Bracket | Male | Female |
| Under 5 Years | 477 (85.0%) | 355 (82.8%) |
| 5 Years | 108 (100.0%) | 140 (100.0%) |
| 6 to 11 Years | 481 (74.3%) | 301 (59.0%) |
| 12 to 14 Years | 242 (69.0%) | 80 (52.3%) |
| 15 Years | 7 (35.0%) | 0 (0.0%) |
| 16 and 17 Years | 238 (76.3%) | 132 (83.0%) |
| 18 to 24 Years | 770 (92.4%) | 680 (95.5%) |
| 25 to 34 Years | 713 (79.5%) | 1,048 (88.5%) |
| 35 to 44 Years | 626 (81.4%) | 813 (81.1%) |
| 45 to 54 Years | 616 (84.7%) | 1,126 (93.4%) |
| 55 to 64 Years | 1,033 (93.6%) | 1,173 (89.8%) |
| 65 to 74 Years | 531 (95.5%) | 524 (90.0%) |
| 75 Years and over | 107 (90.7%) | 308 (85.1%) |
| Total | 5,949 (85.0%) | 6,680 (85.8%) |
Income Below Poverty Among Married-Couple Families in Riverdale
The poverty statistics for married-couple families in Riverdale show that 5.9% or 103 of the total 1,733 families live below the poverty line. Families with 3 or 4 children have the highest poverty rate of 50.8%, comprising of 93 families. On the other hand, families with 1 or 2 children have the lowest poverty rate of 0.3%, which includes 1 families.
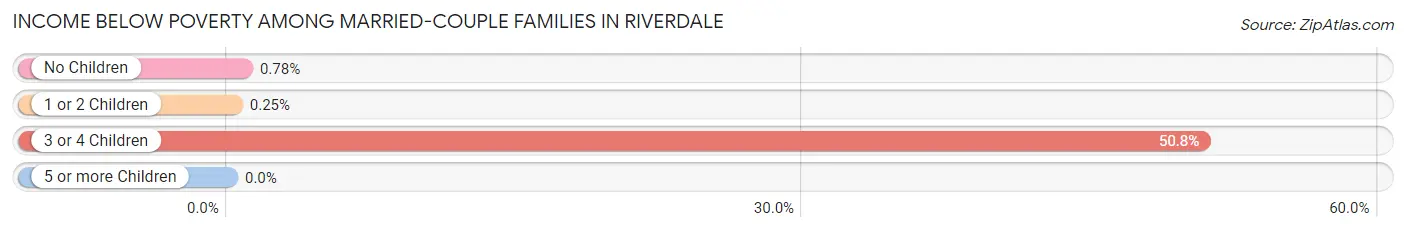
| Children | Above Poverty | Below Poverty |
| No Children | 1,138 (99.2%) | 9 (0.8%) |
| 1 or 2 Children | 402 (99.8%) | 1 (0.3%) |
| 3 or 4 Children | 90 (49.2%) | 93 (50.8%) |
| 5 or more Children | 0 (0.0%) | 0 (0.0%) |
| Total | 1,630 (94.1%) | 103 (5.9%) |
Income Below Poverty Among Single-Parent Households in Riverdale
According to the poverty data in Riverdale, 12.7% or 63 single-father households and 13.2% or 169 single-mother households are living below the poverty line. Among single-father households, those with 1 or 2 children have the highest poverty rate, with 63 households (50.4%) experiencing poverty. Likewise, among single-mother households, those with 1 or 2 children have the highest poverty rate, with 106 households (20.0%) falling below the poverty line.
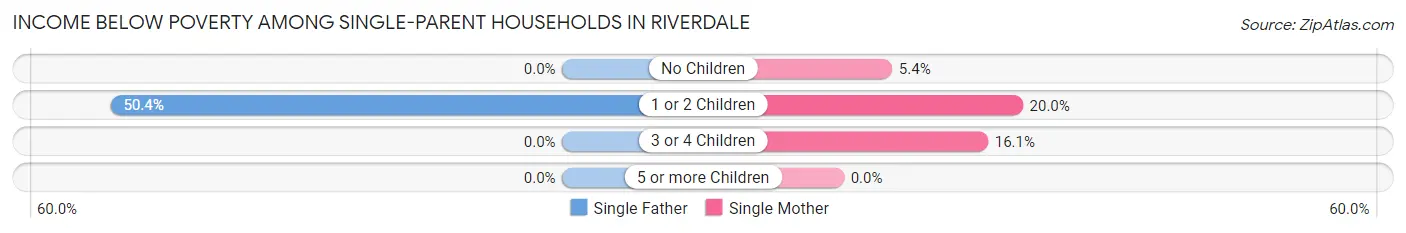
| Children | Single Father | Single Mother |
| No Children | 0 (0.0%) | 29 (5.4%) |
| 1 or 2 Children | 63 (50.4%) | 106 (20.0%) |
| 3 or 4 Children | 0 (0.0%) | 34 (16.1%) |
| 5 or more Children | 0 (0.0%) | 0 (0.0%) |
| Total | 63 (12.7%) | 169 (13.2%) |
Income Below Poverty Among Married-Couple vs Single-Parent Households in Riverdale
The poverty data for Riverdale shows that 103 of the married-couple family households (5.9%) and 232 of the single-parent households (13.1%) are living below the poverty level. Within the married-couple family households, those with 3 or 4 children have the highest poverty rate, with 93 households (50.8%) falling below the poverty line. Among the single-parent households, those with 1 or 2 children have the highest poverty rate, with 169 household (25.8%) living below poverty.
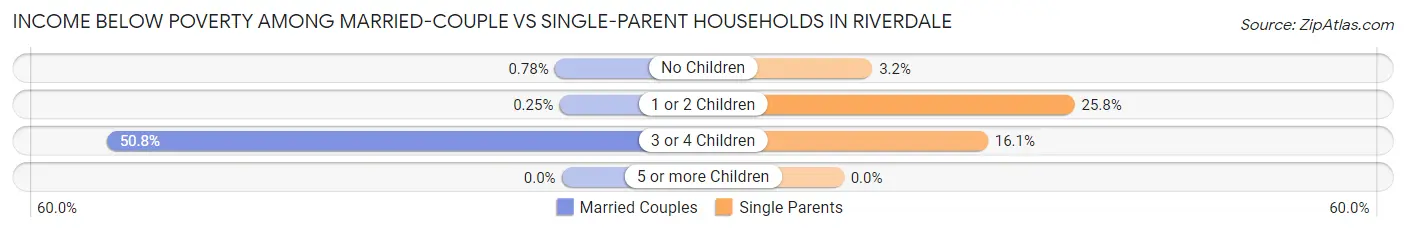
| Children | Married-Couple Families | Single-Parent Households |
| No Children | 9 (0.8%) | 29 (3.2%) |
| 1 or 2 Children | 1 (0.3%) | 169 (25.8%) |
| 3 or 4 Children | 93 (50.8%) | 34 (16.1%) |
| 5 or more Children | 0 (0.0%) | 0 (0.0%) |
| Total | 103 (5.9%) | 232 (13.1%) |
Race in Riverdale
The most populous races in Riverdale are Black / African American (12,606 | 84.4%), Asian (984 | 6.6%), and White / Caucasian (810 | 5.4%).
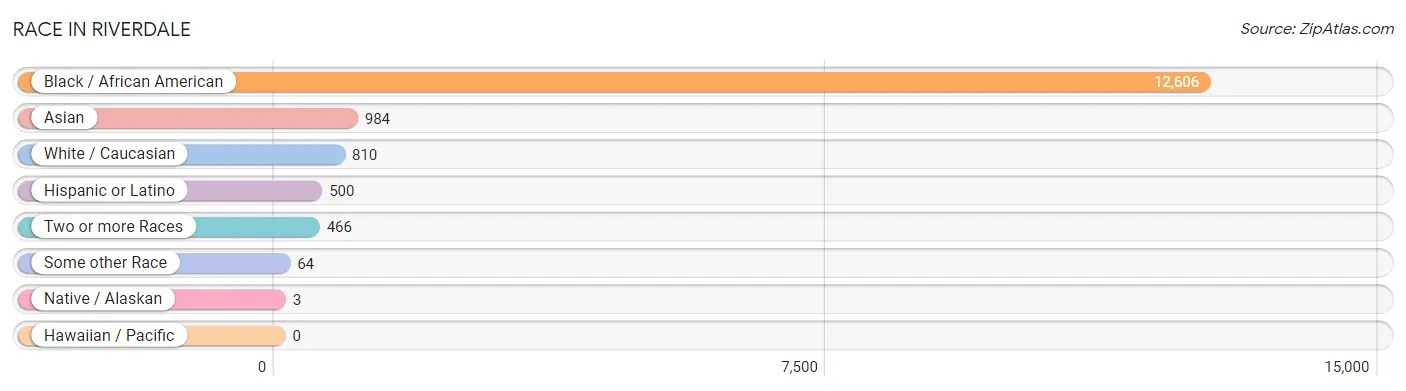
| Race | # Population | % Population |
| Asian | 984 | 6.6% |
| Black / African American | 12,606 | 84.4% |
| Hawaiian / Pacific | 0 | 0.0% |
| Hispanic or Latino | 500 | 3.4% |
| Native / Alaskan | 3 | 0.0% |
| White / Caucasian | 810 | 5.4% |
| Two or more Races | 466 | 3.1% |
| Some other Race | 64 | 0.4% |
| Total | 14,933 | 100.0% |
Ancestry in Riverdale
The most populous ancestries reported in Riverdale are Subsaharan African (1,283 | 8.6%), Nigerian (702 | 4.7%), American (461 | 3.1%), Indian (Asian) (454 | 3.0%), and African (430 | 2.9%), together accounting for 22.3% of all Riverdale residents.
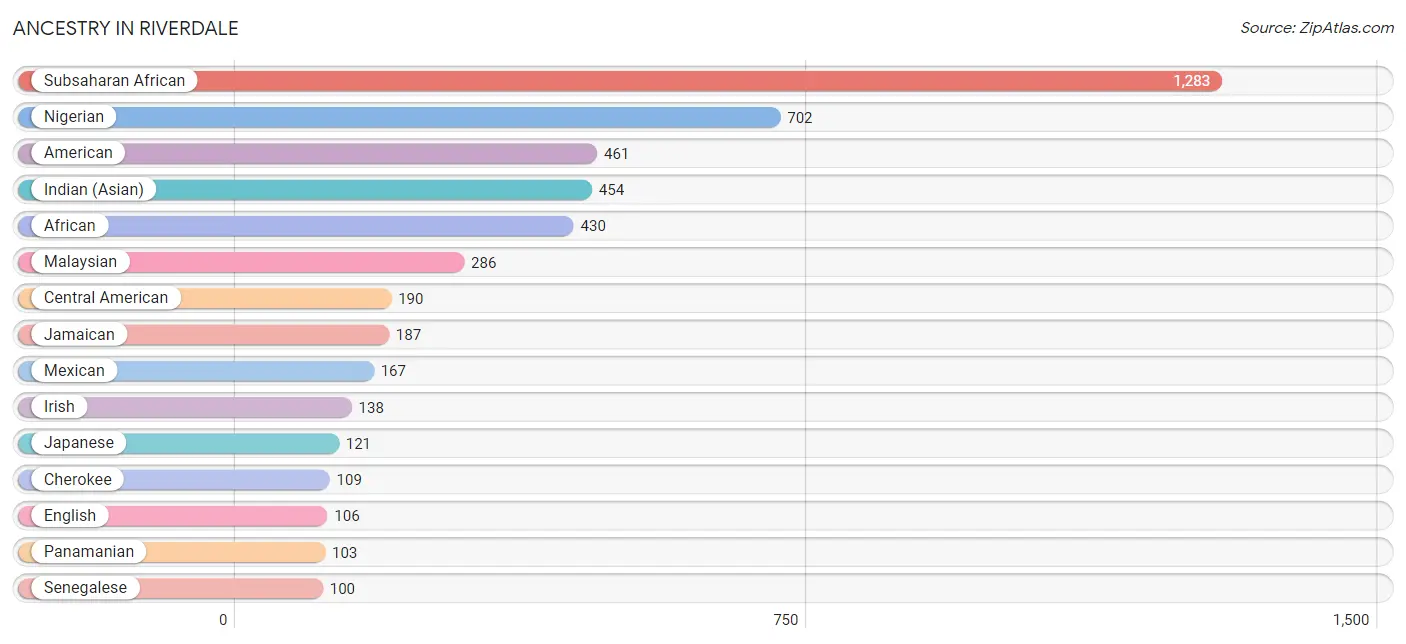
| Ancestry | # Population | % Population |
| African | 430 | 2.9% |
| American | 461 | 3.1% |
| Blackfeet | 75 | 0.5% |
| Burmese | 5 | 0.0% |
| Central American | 190 | 1.3% |
| Cherokee | 109 | 0.7% |
| Creek | 21 | 0.1% |
| Dominican | 47 | 0.3% |
| English | 106 | 0.7% |
| European | 5 | 0.0% |
| French | 29 | 0.2% |
| German | 89 | 0.6% |
| Ghanaian | 87 | 0.6% |
| Guamanian / Chamorro | 42 | 0.3% |
| Guatemalan | 7 | 0.1% |
| Guyanese | 12 | 0.1% |
| Indian (Asian) | 454 | 3.0% |
| Irish | 138 | 0.9% |
| Italian | 72 | 0.5% |
| Jamaican | 187 | 1.3% |
| Japanese | 121 | 0.8% |
| Korean | 46 | 0.3% |
| Laotian | 44 | 0.3% |
| Liberian | 6 | 0.0% |
| Malaysian | 286 | 1.9% |
| Mexican | 167 | 1.1% |
| Native Hawaiian | 42 | 0.3% |
| Nigerian | 702 | 4.7% |
| Panamanian | 103 | 0.7% |
| Polish | 95 | 0.6% |
| Puerto Rican | 48 | 0.3% |
| Salvadoran | 80 | 0.5% |
| Scotch-Irish | 24 | 0.2% |
| Scottish | 32 | 0.2% |
| Senegalese | 100 | 0.7% |
| South American | 26 | 0.2% |
| Sri Lankan | 76 | 0.5% |
| Subsaharan African | 1,283 | 8.6% |
| Thai | 38 | 0.3% |
| Trinidadian and Tobagonian | 34 | 0.2% |
| Uruguayan | 26 | 0.2% |
| West Indian | 35 | 0.2% | View All 42 Rows |
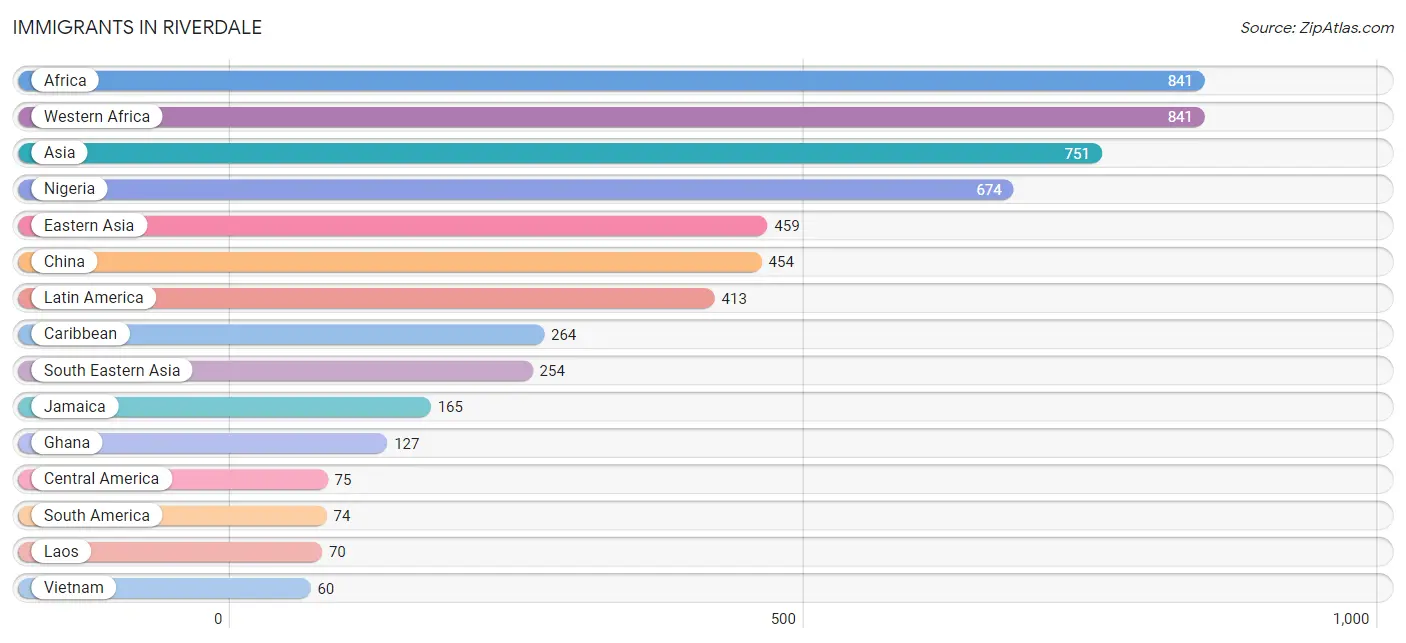
Immigrants in Riverdale
The most numerous immigrant groups reported in Riverdale came from Africa (841 | 5.6%), Western Africa (841 | 5.6%), Asia (751 | 5.0%), Nigeria (674 | 4.5%), and Eastern Asia (459 | 3.1%), together accounting for 23.9% of all Riverdale residents.
| Immigration Origin | # Population | % Population |
| Africa | 841 | 5.6% |
| Asia | 751 | 5.0% |
| Cambodia | 43 | 0.3% |
| Caribbean | 264 | 1.8% |
| Central America | 75 | 0.5% |
| Chile | 22 | 0.2% |
| China | 454 | 3.0% |
| Cuba | 7 | 0.1% |
| Dominican Republic | 27 | 0.2% |
| Eastern Asia | 459 | 3.1% |
| Europe | 17 | 0.1% |
| Germany | 17 | 0.1% |
| Ghana | 127 | 0.9% |
| Guatemala | 7 | 0.1% |
| Guyana | 26 | 0.2% |
| India | 38 | 0.3% |
| Indonesia | 44 | 0.3% |
| Jamaica | 165 | 1.1% |
| Korea | 5 | 0.0% |
| Laos | 70 | 0.5% |
| Latin America | 413 | 2.8% |
| Liberia | 6 | 0.0% |
| Mexico | 13 | 0.1% |
| Nigeria | 674 | 4.5% |
| Panama | 55 | 0.4% |
| Philippines | 37 | 0.3% |
| Senegal | 28 | 0.2% |
| South America | 74 | 0.5% |
| South Central Asia | 38 | 0.3% |
| South Eastern Asia | 254 | 1.7% |
| Trinidad and Tobago | 22 | 0.2% |
| Uruguay | 26 | 0.2% |
| Vietnam | 60 | 0.4% |
| Western Africa | 841 | 5.6% |
| Western Europe | 17 | 0.1% | View All 35 Rows |
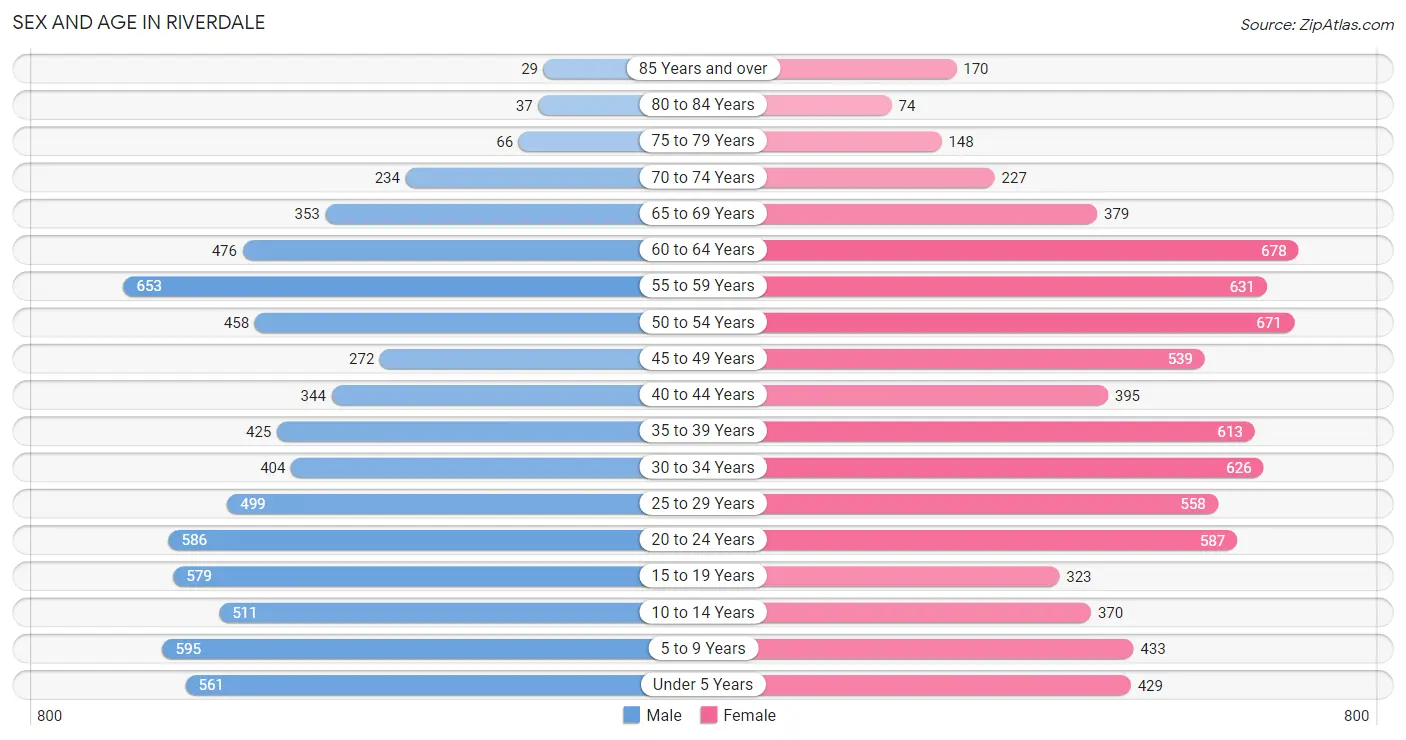
Sex and Age in Riverdale
Sex and Age in Riverdale
The most populous age groups in Riverdale are 55 to 59 Years (653 | 9.2%) for men and 60 to 64 Years (678 | 8.6%) for women.
| Age Bracket | Male | Female |
| Under 5 Years | 561 (7.9%) | 429 (5.5%) |
| 5 to 9 Years | 595 (8.4%) | 433 (5.5%) |
| 10 to 14 Years | 511 (7.2%) | 370 (4.7%) |
| 15 to 19 Years | 579 (8.2%) | 323 (4.1%) |
| 20 to 24 Years | 586 (8.3%) | 587 (7.5%) |
| 25 to 29 Years | 499 (7.0%) | 558 (7.1%) |
| 30 to 34 Years | 404 (5.7%) | 626 (8.0%) |
| 35 to 39 Years | 425 (6.0%) | 613 (7.8%) |
| 40 to 44 Years | 344 (4.9%) | 395 (5.0%) |
| 45 to 49 Years | 272 (3.8%) | 539 (6.9%) |
| 50 to 54 Years | 458 (6.5%) | 671 (8.6%) |
| 55 to 59 Years | 653 (9.2%) | 631 (8.0%) |
| 60 to 64 Years | 476 (6.7%) | 678 (8.6%) |
| 65 to 69 Years | 353 (5.0%) | 379 (4.8%) |
| 70 to 74 Years | 234 (3.3%) | 227 (2.9%) |
| 75 to 79 Years | 66 (0.9%) | 148 (1.9%) |
| 80 to 84 Years | 37 (0.5%) | 74 (0.9%) |
| 85 Years and over | 29 (0.4%) | 170 (2.2%) |
| Total | 7,082 (100.0%) | 7,851 (100.0%) |
Families and Households in Riverdale
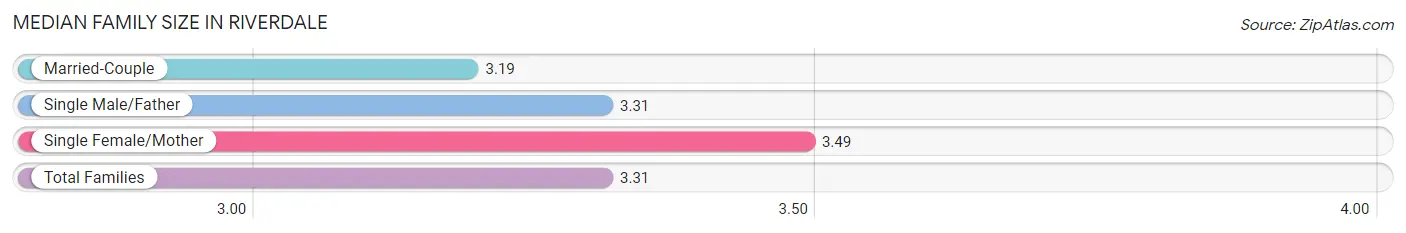
Median Family Size in Riverdale
The median family size in Riverdale is 3.31 persons per family, with single female/mother families (1,279 | 36.5%) accounting for the largest median family size of 3.49 persons per family. On the other hand, married-couple families (1,733 | 49.4%) represent the smallest median family size with 3.19 persons per family.
| Family Type | # Families | Family Size |
| Married-Couple | 1,733 (49.4%) | 3.19 |
| Single Male/Father | 495 (14.1%) | 3.31 |
| Single Female/Mother | 1,279 (36.5%) | 3.49 |
| Total Families | 3,507 (100.0%) | 3.31 |
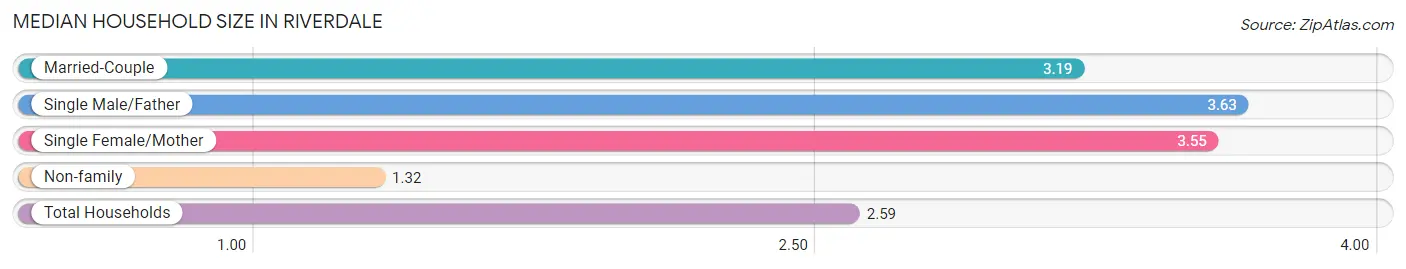
Median Household Size in Riverdale
The median household size in Riverdale is 2.59 persons per household, with single male/father households (495 | 8.7%) accounting for the largest median household size of 3.63 persons per household. non-family households (2,208 | 38.6%) represent the smallest median household size with 1.32 persons per household.
| Household Type | # Households | Household Size |
| Married-Couple | 1,733 (30.3%) | 3.19 |
| Single Male/Father | 495 (8.7%) | 3.63 |
| Single Female/Mother | 1,279 (22.4%) | 3.55 |
| Non-family | 2,208 (38.6%) | 1.32 |
| Total Households | 5,715 (100.0%) | 2.59 |
Household Size by Marriage Status in Riverdale
Out of a total of 5,715 households in Riverdale, 3,507 (61.4%) are family households, while 2,208 (38.6%) are nonfamily households. The most numerous type of family households are 2-person households, comprising 1,456, and the most common type of nonfamily households are 1-person households, comprising 1,683.
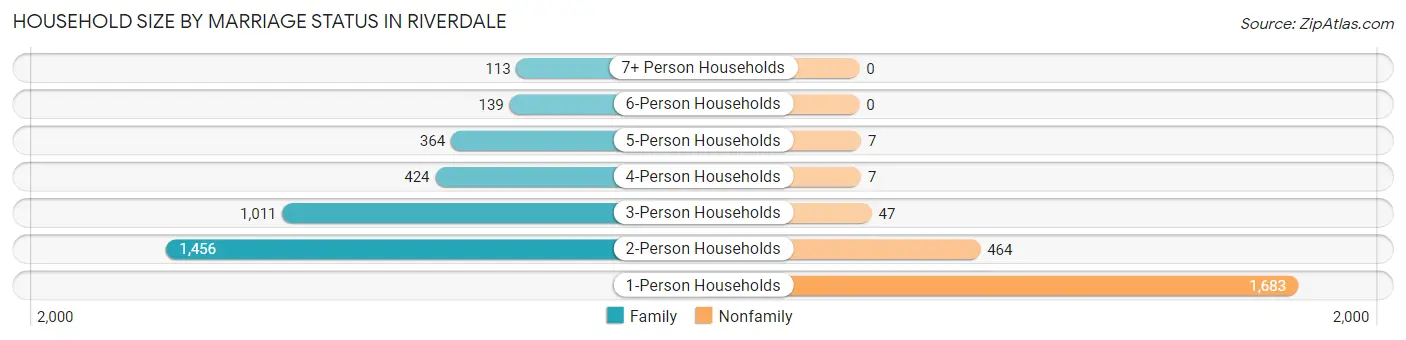
| Household Size | Family Households | Nonfamily Households |
| 1-Person Households | - | 1,683 (29.4%) |
| 2-Person Households | 1,456 (25.5%) | 464 (8.1%) |
| 3-Person Households | 1,011 (17.7%) | 47 (0.8%) |
| 4-Person Households | 424 (7.4%) | 7 (0.1%) |
| 5-Person Households | 364 (6.4%) | 7 (0.1%) |
| 6-Person Households | 139 (2.4%) | 0 (0.0%) |
| 7+ Person Households | 113 (2.0%) | 0 (0.0%) |
| Total | 3,507 (61.4%) | 2,208 (38.6%) |
Female Fertility in Riverdale
Fertility by Age in Riverdale
Average fertility rate in Riverdale is 47.0 births per 1,000 women. Women in the age bracket of 35 to 50 years have the highest fertility rate with 79.0 births per 1,000 women. Women in the age bracket of 35 to 50 years acount for 71.5% of all women with births.
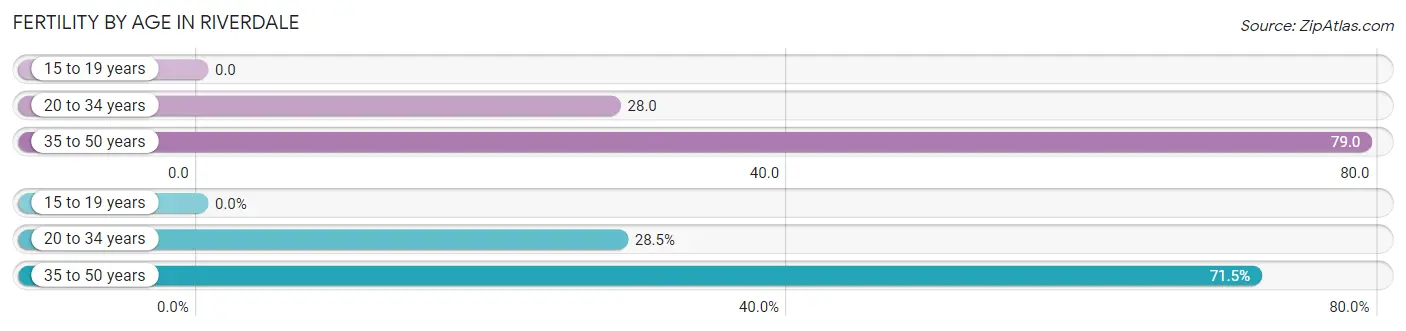
| Age Bracket | Women with Births | Births / 1,000 Women |
| 15 to 19 years | 0 (0.0%) | 0.0 |
| 20 to 34 years | 49 (28.5%) | 28.0 |
| 35 to 50 years | 123 (71.5%) | 79.0 |
| Total | 172 (100.0%) | 47.0 |
Fertility by Age by Marriage Status in Riverdale
48.3% of women with births (172) in Riverdale are married. The highest percentage of unmarried women with births falls into 35 to 50 years age bracket with 52.0% of them unmarried at the time of birth, while the lowest percentage of unmarried women with births belong to 20 to 34 years age bracket with 51.0% of them unmarried.
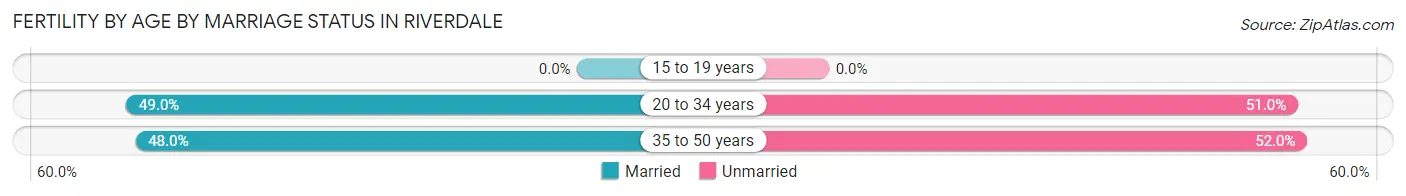
| Age Bracket | Married | Unmarried |
| 15 to 19 years | 0 (0.0%) | 0 (0.0%) |
| 20 to 34 years | 24 (49.0%) | 25 (51.0%) |
| 35 to 50 years | 59 (48.0%) | 64 (52.0%) |
| Total | 83 (48.3%) | 89 (51.7%) |
Fertility by Education in Riverdale
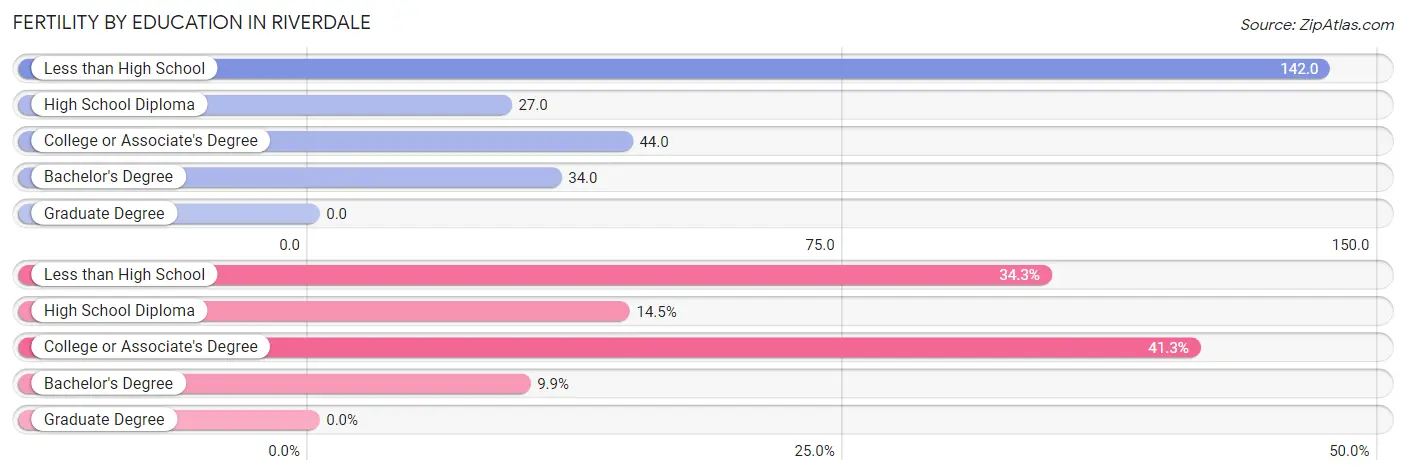
| Educational Attainment | Women with Births | Births / 1,000 Women |
| Less than High School | 59 (34.3%) | 142.0 |
| High School Diploma | 25 (14.5%) | 27.0 |
| College or Associate's Degree | 71 (41.3%) | 44.0 |
| Bachelor's Degree | 17 (9.9%) | 34.0 |
| Graduate Degree | 0 (0.0%) | 0.0 |
| Total | 172 (100.0%) | 47.0 |
Fertility by Education by Marriage Status in Riverdale
51.7% of women with births in Riverdale are unmarried. Women with the educational attainment of college or associate's degree are most likely to be married with 100.0% of them married at childbirth, while women with the educational attainment of less than high school are least likely to be married with 100.0% of them unmarried at childbirth.
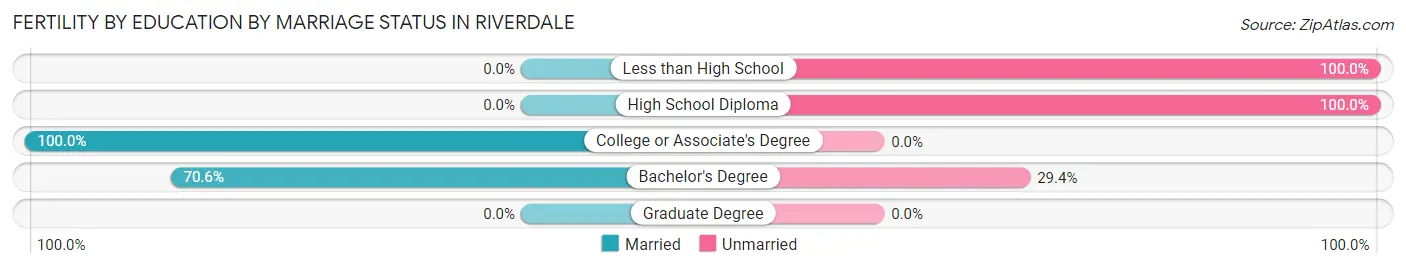
| Educational Attainment | Married | Unmarried |
| Less than High School | 0 (0.0%) | 59 (100.0%) |
| High School Diploma | 0 (0.0%) | 25 (100.0%) |
| College or Associate's Degree | 71 (100.0%) | 0 (0.0%) |
| Bachelor's Degree | 12 (70.6%) | 5 (29.4%) |
| Graduate Degree | 0 (0.0%) | 0 (0.0%) |
| Total | 83 (48.3%) | 89 (51.7%) |
Employment Characteristics in Riverdale
Employment by Class of Employer in Riverdale
Among the 7,261 employed individuals in Riverdale, private company employees (5,430 | 74.8%), local government employees (529 | 7.3%), and self-employed (not incorporated) (416 | 5.7%) make up the most common classes of employment.
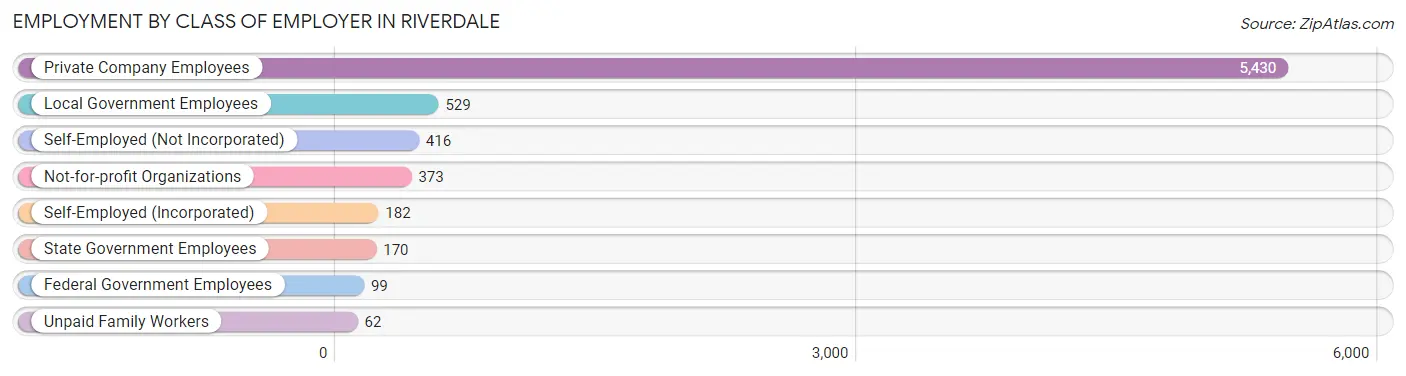
| Employer Class | # Employees | % Employees |
| Private Company Employees | 5,430 | 74.8% |
| Self-Employed (Incorporated) | 182 | 2.5% |
| Self-Employed (Not Incorporated) | 416 | 5.7% |
| Not-for-profit Organizations | 373 | 5.1% |
| Local Government Employees | 529 | 7.3% |
| State Government Employees | 170 | 2.3% |
| Federal Government Employees | 99 | 1.4% |
| Unpaid Family Workers | 62 | 0.9% |
| Total | 7,261 | 100.0% |
Employment Status by Age in Riverdale
According to the labor force statistics for Riverdale, out of the total population over 16 years of age (11,975), 69.0% or 8,263 individuals are in the labor force, with 3.0% or 248 of them unemployed. The age group with the highest labor force participation rate is 45 to 54 years, with 90.2% or 1,750 individuals in the labor force. Within the labor force, the 60 to 64 years age range has the highest percentage of unemployed individuals, with 11.4% or 60 of them being unemployed.
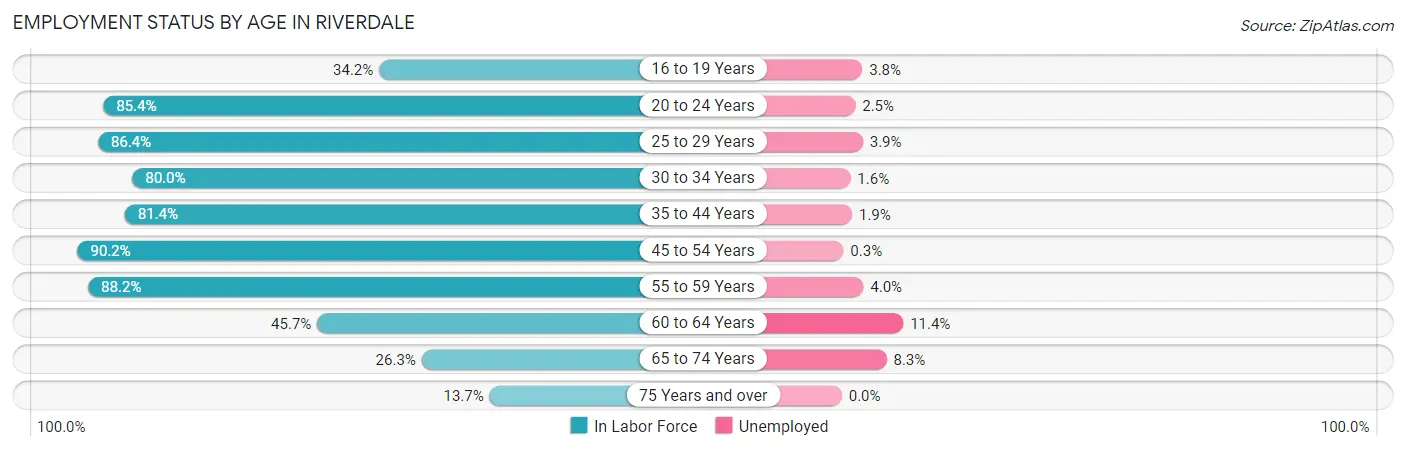
| Age Bracket | In Labor Force | Unemployed |
| 16 to 19 Years | 288 (34.2%) | 11 (3.8%) |
| 20 to 24 Years | 1,002 (85.4%) | 25 (2.5%) |
| 25 to 29 Years | 913 (86.4%) | 36 (3.9%) |
| 30 to 34 Years | 824 (80.0%) | 13 (1.6%) |
| 35 to 44 Years | 1,446 (81.4%) | 27 (1.9%) |
| 45 to 54 Years | 1,750 (90.2%) | 5 (0.3%) |
| 55 to 59 Years | 1,132 (88.2%) | 45 (4.0%) |
| 60 to 64 Years | 527 (45.7%) | 60 (11.4%) |
| 65 to 74 Years | 314 (26.3%) | 26 (8.3%) |
| 75 Years and over | 72 (13.7%) | 0 (0.0%) |
| Total | 8,263 (69.0%) | 248 (3.0%) |
Employment Status by Educational Attainment in Riverdale
According to labor force statistics for Riverdale, 80.0% of individuals (6,594) out of the total population between 25 and 64 years of age (8,242) are in the labor force, with 2.8% or 185 of them being unemployed. The group with the highest labor force participation rate are those with the educational attainment of bachelor's degree or higher, with 89.1% or 1,336 individuals in the labor force. Within the labor force, individuals with bachelor's degree or higher education have the highest percentage of unemployment, with 6.2% or 83 of them being unemployed.
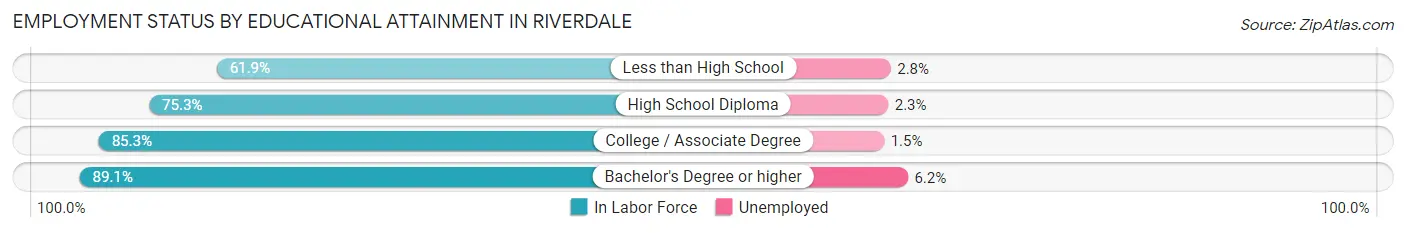
| Educational Attainment | In Labor Force | Unemployed |
| Less than High School | 633 (61.9%) | 29 (2.8%) |
| High School Diploma | 1,944 (75.3%) | 59 (2.3%) |
| College / Associate Degree | 2,678 (85.3%) | 47 (1.5%) |
| Bachelor's Degree or higher | 1,336 (89.1%) | 93 (6.2%) |
| Total | 6,594 (80.0%) | 231 (2.8%) |
Employment Occupations by Sex in Riverdale
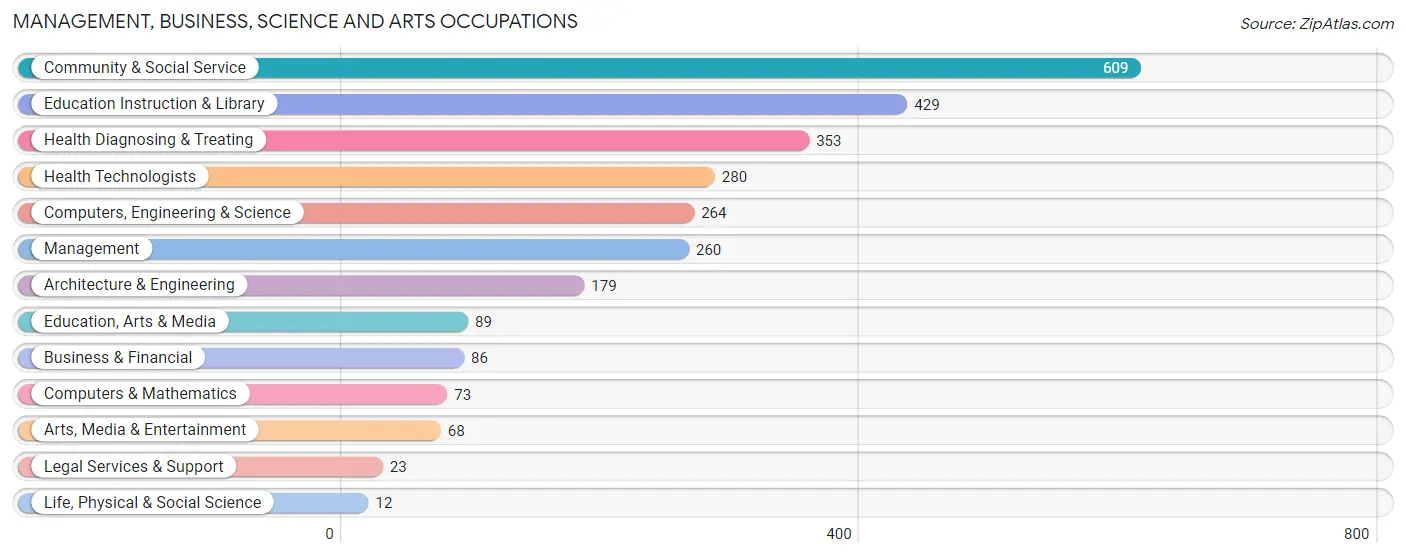
Management, Business, Science and Arts Occupations
The most common Management, Business, Science and Arts occupations in Riverdale are Community & Social Service (609 | 7.6%), Education Instruction & Library (429 | 5.3%), Health Diagnosing & Treating (353 | 4.4%), Health Technologists (280 | 3.5%), and Computers, Engineering & Science (264 | 3.3%).
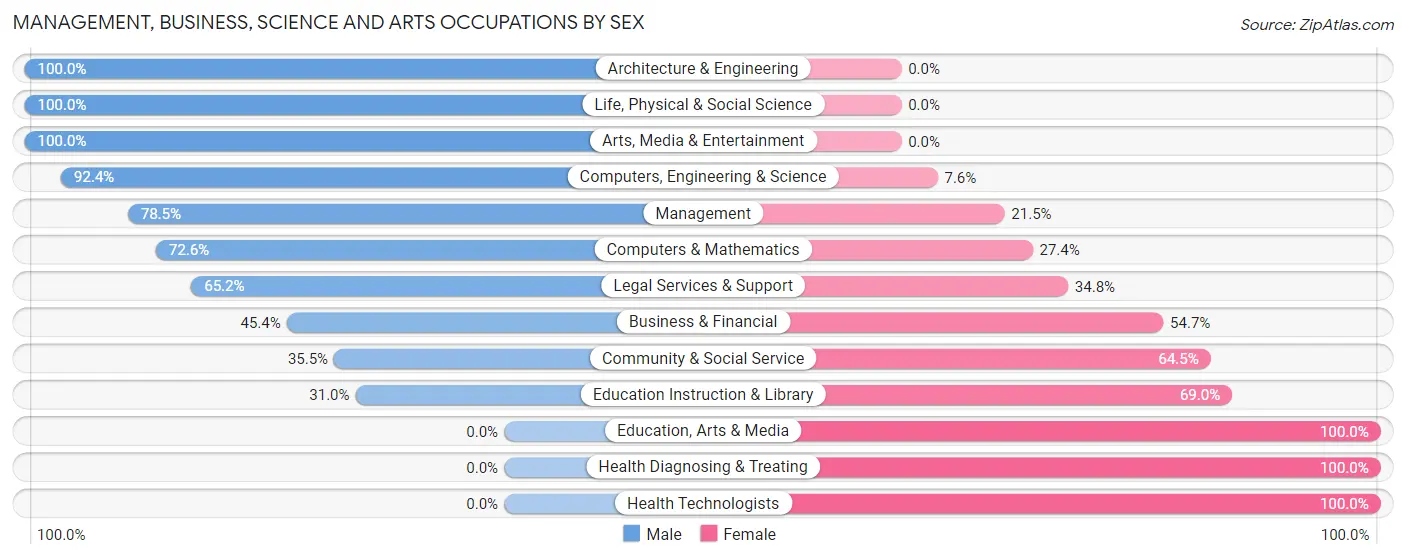
Management, Business, Science and Arts Occupations by Sex
Within the Management, Business, Science and Arts occupations in Riverdale, the most male-oriented occupations are Architecture & Engineering (100.0%), Life, Physical & Social Science (100.0%), and Arts, Media & Entertainment (100.0%), while the most female-oriented occupations are Education, Arts & Media (100.0%), Health Diagnosing & Treating (100.0%), and Health Technologists (100.0%).
| Occupation | Male | Female |
| Management | 204 (78.5%) | 56 (21.5%) |
| Business & Financial | 39 (45.4%) | 47 (54.6%) |
| Computers, Engineering & Science | 244 (92.4%) | 20 (7.6%) |
| Computers & Mathematics | 53 (72.6%) | 20 (27.4%) |
| Architecture & Engineering | 179 (100.0%) | 0 (0.0%) |
| Life, Physical & Social Science | 12 (100.0%) | 0 (0.0%) |
| Community & Social Service | 216 (35.5%) | 393 (64.5%) |
| Education, Arts & Media | 0 (0.0%) | 89 (100.0%) |
| Legal Services & Support | 15 (65.2%) | 8 (34.8%) |
| Education Instruction & Library | 133 (31.0%) | 296 (69.0%) |
| Arts, Media & Entertainment | 68 (100.0%) | 0 (0.0%) |
| Health Diagnosing & Treating | 0 (0.0%) | 353 (100.0%) |
| Health Technologists | 0 (0.0%) | 280 (100.0%) |
| Total (Category) | 703 (44.7%) | 869 (55.3%) |
| Total (Overall) | 3,631 (45.3%) | 4,387 (54.7%) |
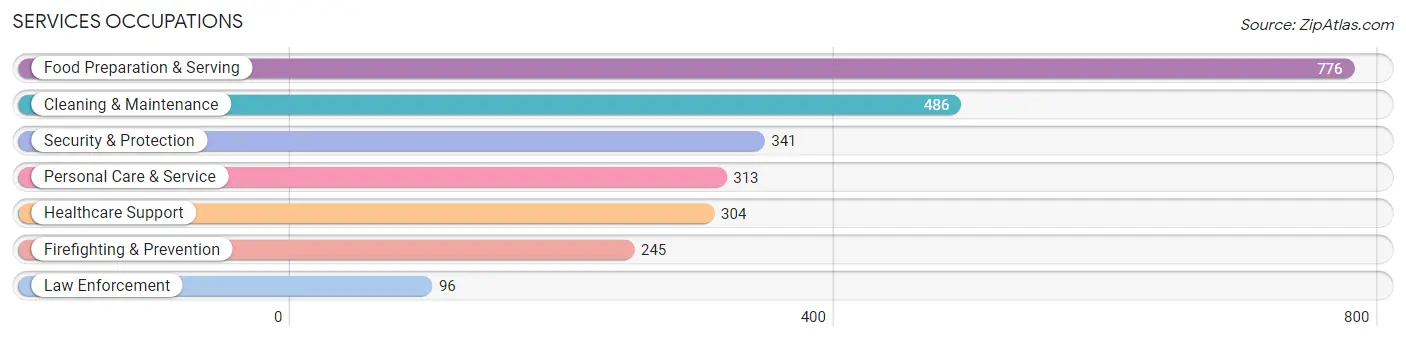
Services Occupations
The most common Services occupations in Riverdale are Food Preparation & Serving (776 | 9.7%), Cleaning & Maintenance (486 | 6.1%), Security & Protection (341 | 4.3%), Personal Care & Service (313 | 3.9%), and Healthcare Support (304 | 3.8%).
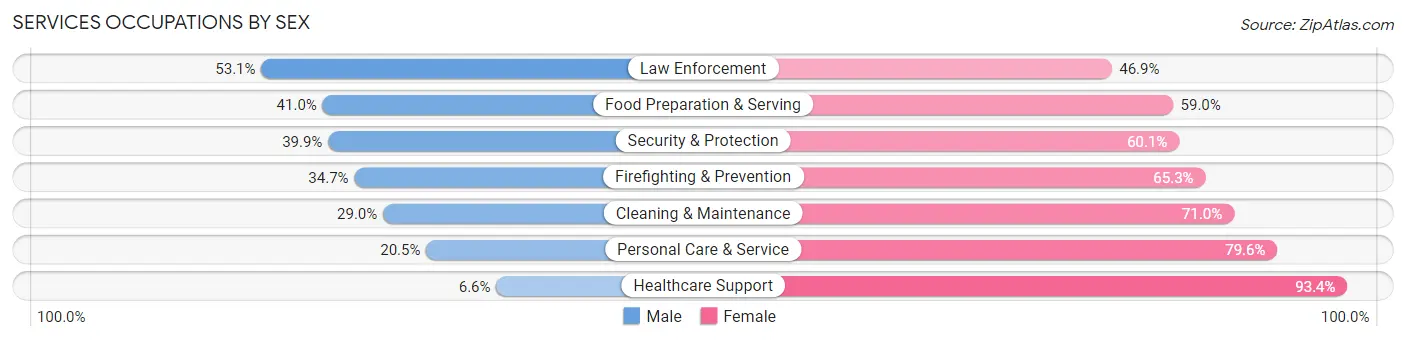
Services Occupations by Sex
Within the Services occupations in Riverdale, the most male-oriented occupations are Law Enforcement (53.1%), Food Preparation & Serving (41.0%), and Security & Protection (39.9%), while the most female-oriented occupations are Healthcare Support (93.4%), Personal Care & Service (79.5%), and Cleaning & Maintenance (71.0%).
| Occupation | Male | Female |
| Healthcare Support | 20 (6.6%) | 284 (93.4%) |
| Security & Protection | 136 (39.9%) | 205 (60.1%) |
| Firefighting & Prevention | 85 (34.7%) | 160 (65.3%) |
| Law Enforcement | 51 (53.1%) | 45 (46.9%) |
| Food Preparation & Serving | 318 (41.0%) | 458 (59.0%) |
| Cleaning & Maintenance | 141 (29.0%) | 345 (71.0%) |
| Personal Care & Service | 64 (20.4%) | 249 (79.5%) |
| Total (Category) | 679 (30.6%) | 1,541 (69.4%) |
| Total (Overall) | 3,631 (45.3%) | 4,387 (54.7%) |
Sales and Office Occupations
The most common Sales and Office occupations in Riverdale are Office & Administration (948 | 11.8%), and Sales & Related (705 | 8.8%).
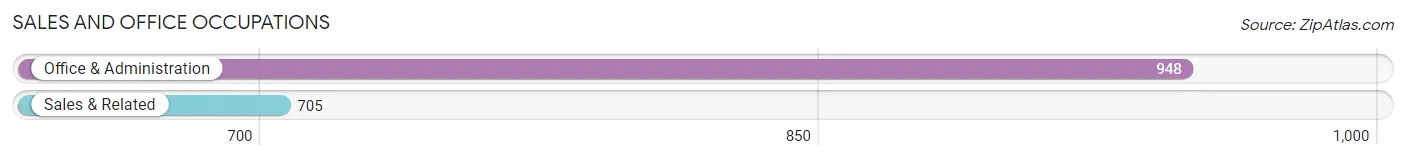
Sales and Office Occupations by Sex
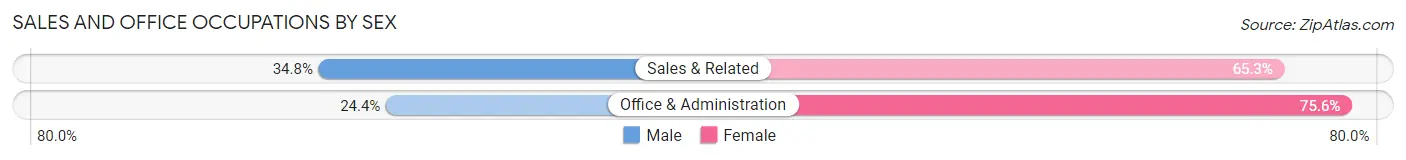
| Occupation | Male | Female |
| Sales & Related | 245 (34.7%) | 460 (65.2%) |
| Office & Administration | 231 (24.4%) | 717 (75.6%) |
| Total (Category) | 476 (28.8%) | 1,177 (71.2%) |
| Total (Overall) | 3,631 (45.3%) | 4,387 (54.7%) |
Natural Resources, Construction and Maintenance Occupations
The most common Natural Resources, Construction and Maintenance occupations in Riverdale are Construction & Extraction (225 | 2.8%), and Installation, Maintenance & Repair (183 | 2.3%).
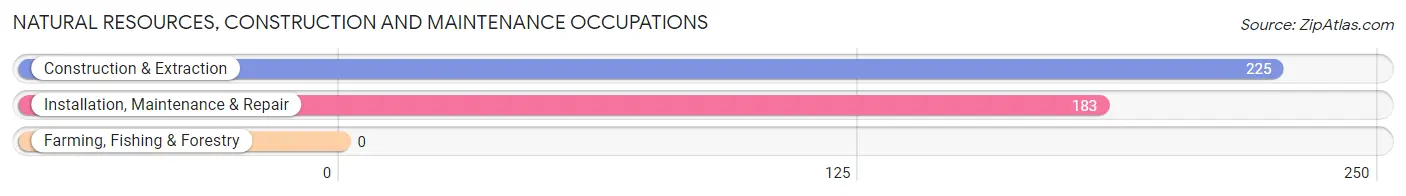
Natural Resources, Construction and Maintenance Occupations by Sex
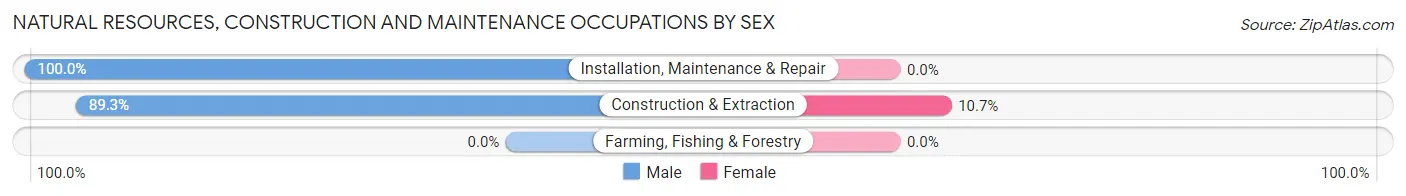
| Occupation | Male | Female |
| Farming, Fishing & Forestry | 0 (0.0%) | 0 (0.0%) |
| Construction & Extraction | 201 (89.3%) | 24 (10.7%) |
| Installation, Maintenance & Repair | 183 (100.0%) | 0 (0.0%) |
| Total (Category) | 384 (94.1%) | 24 (5.9%) |
| Total (Overall) | 3,631 (45.3%) | 4,387 (54.7%) |
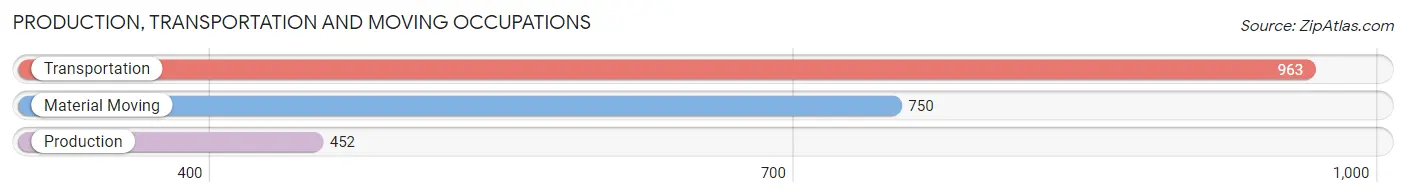
Production, Transportation and Moving Occupations
The most common Production, Transportation and Moving occupations in Riverdale are Transportation (963 | 12.0%), Material Moving (750 | 9.3%), and Production (452 | 5.6%).
Production, Transportation and Moving Occupations by Sex
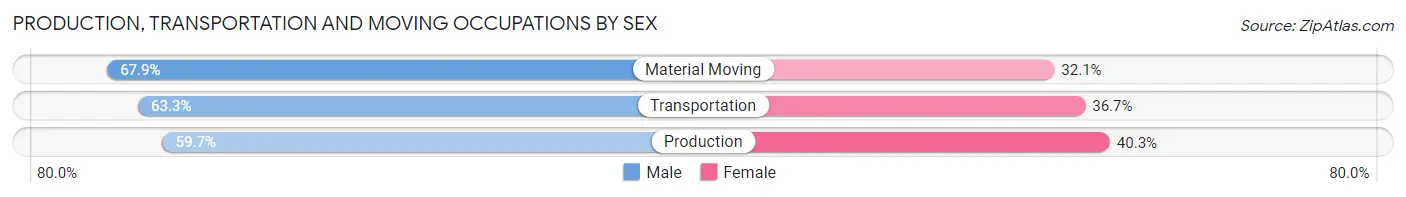
| Occupation | Male | Female |
| Production | 270 (59.7%) | 182 (40.3%) |
| Transportation | 610 (63.3%) | 353 (36.7%) |
| Material Moving | 509 (67.9%) | 241 (32.1%) |
| Total (Category) | 1,389 (64.2%) | 776 (35.8%) |
| Total (Overall) | 3,631 (45.3%) | 4,387 (54.7%) |
Employment Industries by Sex in Riverdale
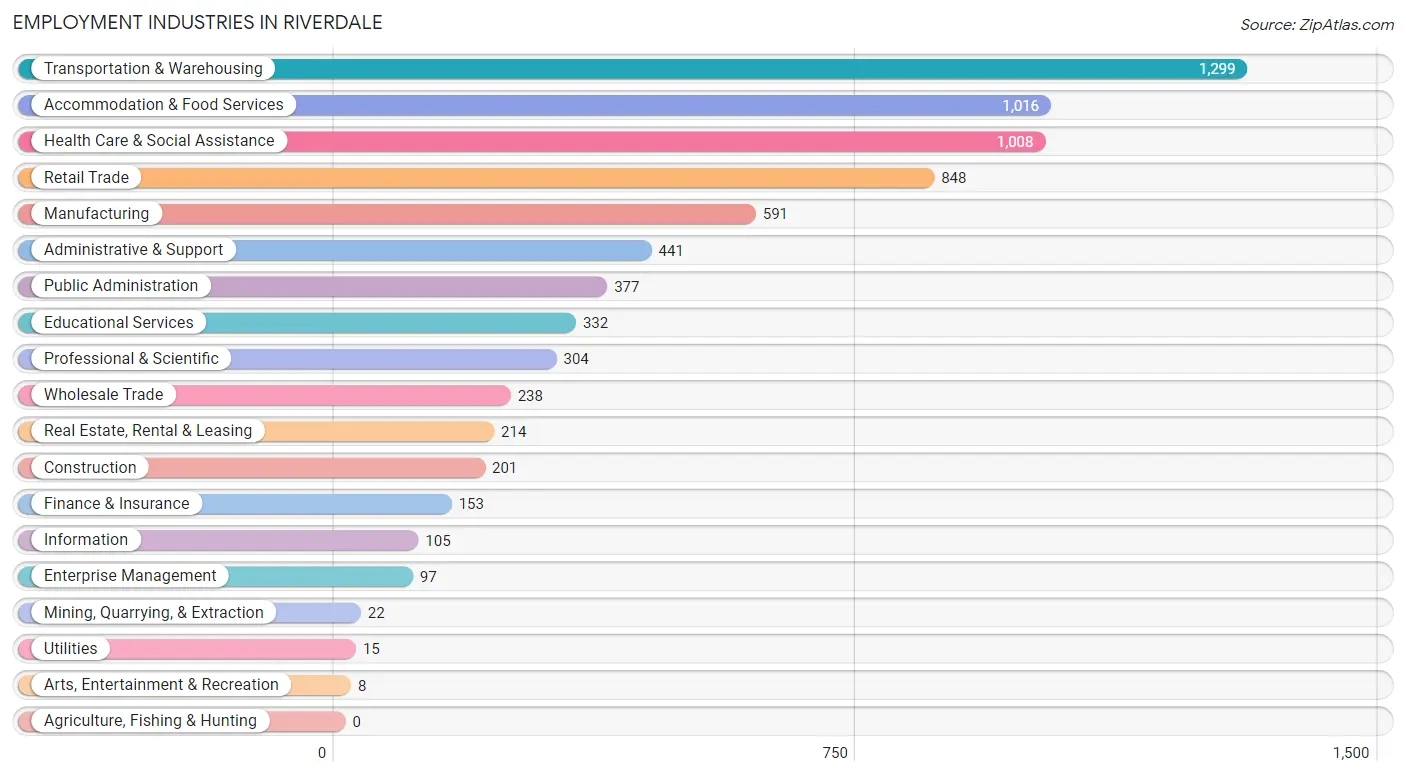
Employment Industries in Riverdale
The major employment industries in Riverdale include Transportation & Warehousing (1,299 | 16.2%), Accommodation & Food Services (1,016 | 12.7%), Health Care & Social Assistance (1,008 | 12.6%), Retail Trade (848 | 10.6%), and Manufacturing (591 | 7.4%).
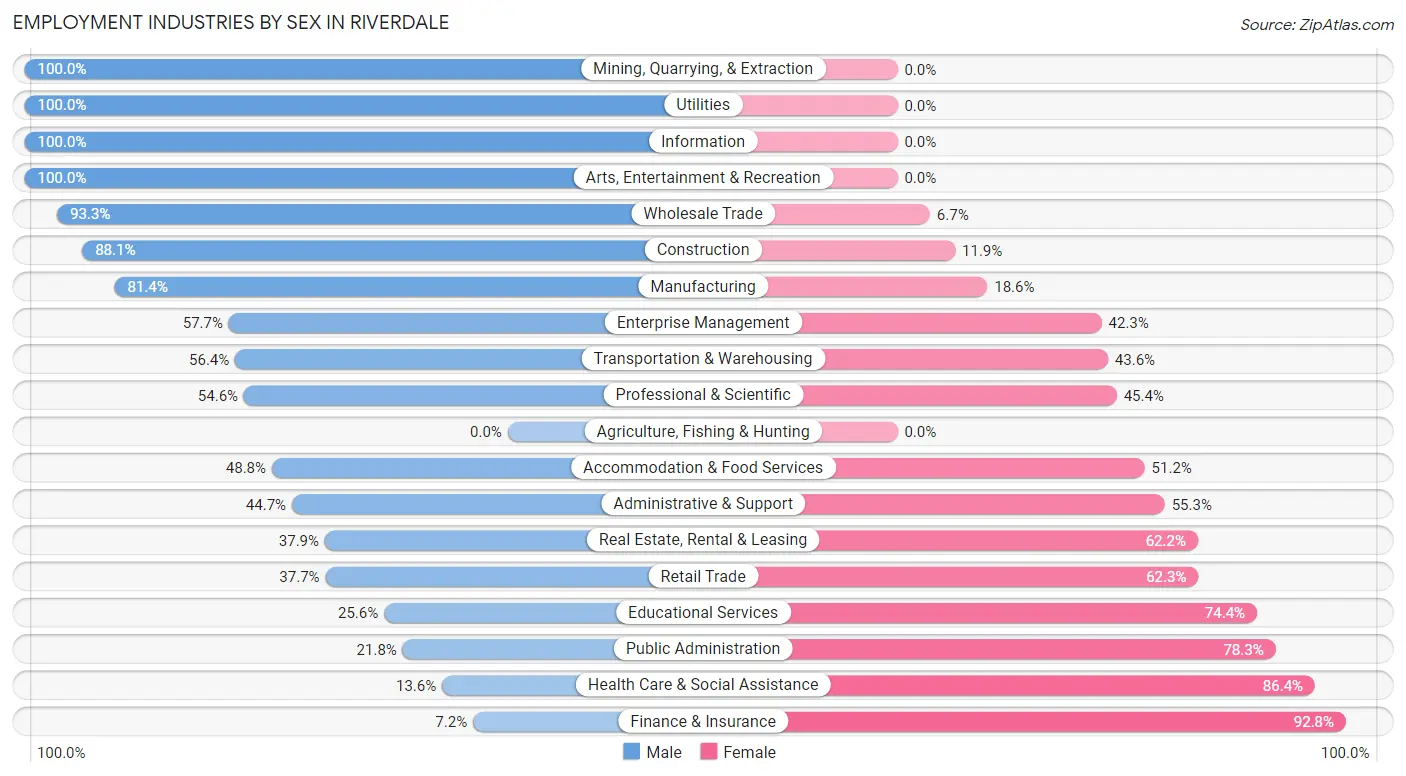
Employment Industries by Sex in Riverdale
The Riverdale industries that see more men than women are Mining, Quarrying, & Extraction (100.0%), Utilities (100.0%), and Information (100.0%), whereas the industries that tend to have a higher number of women are Finance & Insurance (92.8%), Health Care & Social Assistance (86.4%), and Public Administration (78.2%).
| Industry | Male | Female |
| Agriculture, Fishing & Hunting | 0 (0.0%) | 0 (0.0%) |
| Mining, Quarrying, & Extraction | 22 (100.0%) | 0 (0.0%) |
| Construction | 177 (88.1%) | 24 (11.9%) |
| Manufacturing | 481 (81.4%) | 110 (18.6%) |
| Wholesale Trade | 222 (93.3%) | 16 (6.7%) |
| Retail Trade | 320 (37.7%) | 528 (62.3%) |
| Transportation & Warehousing | 733 (56.4%) | 566 (43.6%) |
| Utilities | 15 (100.0%) | 0 (0.0%) |
| Information | 105 (100.0%) | 0 (0.0%) |
| Finance & Insurance | 11 (7.2%) | 142 (92.8%) |
| Real Estate, Rental & Leasing | 81 (37.9%) | 133 (62.2%) |
| Professional & Scientific | 166 (54.6%) | 138 (45.4%) |
| Enterprise Management | 56 (57.7%) | 41 (42.3%) |
| Administrative & Support | 197 (44.7%) | 244 (55.3%) |
| Educational Services | 85 (25.6%) | 247 (74.4%) |
| Health Care & Social Assistance | 137 (13.6%) | 871 (86.4%) |
| Arts, Entertainment & Recreation | 8 (100.0%) | 0 (0.0%) |
| Accommodation & Food Services | 496 (48.8%) | 520 (51.2%) |
| Public Administration | 82 (21.7%) | 295 (78.2%) |
| Total | 3,631 (45.3%) | 4,387 (54.7%) |
Education in Riverdale
School Enrollment in Riverdale
The most common levels of schooling among the 3,677 students in Riverdale are college / undergraduate (833 | 22.7%), elementary school (781 | 21.2%), and middle school (735 | 20.0%).
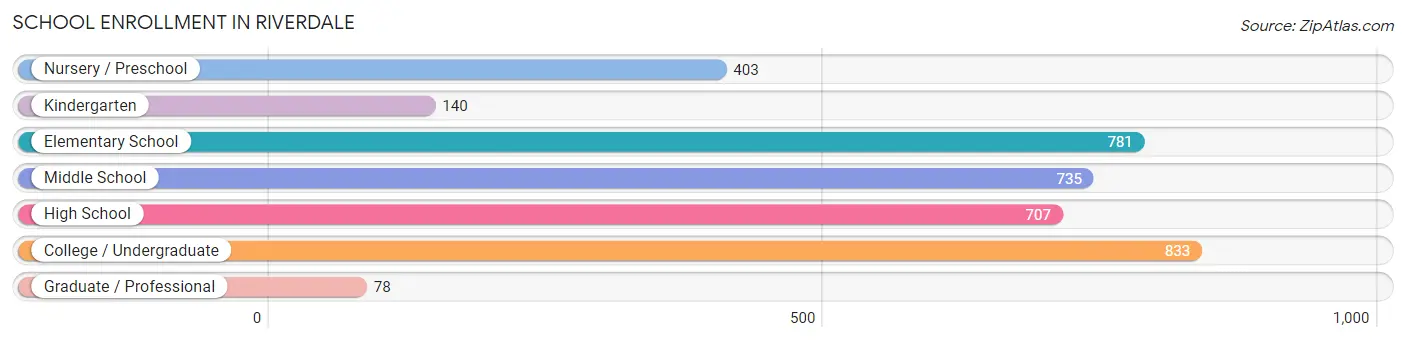
| School Level | # Students | % Students |
| Nursery / Preschool | 403 | 11.0% |
| Kindergarten | 140 | 3.8% |
| Elementary School | 781 | 21.2% |
| Middle School | 735 | 20.0% |
| High School | 707 | 19.2% |
| College / Undergraduate | 833 | 22.7% |
| Graduate / Professional | 78 | 2.1% |
| Total | 3,677 | 100.0% |
School Enrollment by Age by Funding Source in Riverdale
Out of a total of 3,677 students who are enrolled in schools in Riverdale, 879 (23.9%) attend a private institution, while the remaining 2,798 (76.1%) are enrolled in public schools. The age group of 3 to 4 year olds has the highest likelihood of being enrolled in private schools, with 212 (73.1% in the age bracket) enrolled. Conversely, the age group of 18 to 19 year olds has the lowest likelihood of being enrolled in a private school, with 121 (100.0% in the age bracket) attending a public institution.
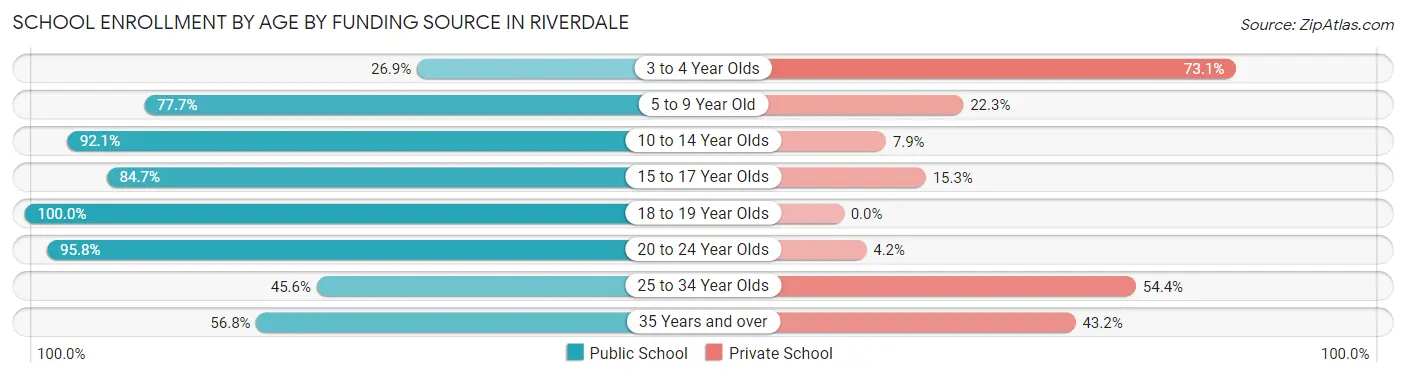
| Age Bracket | Public School | Private School |
| 3 to 4 Year Olds | 78 (26.9%) | 212 (73.1%) |
| 5 to 9 Year Old | 782 (77.7%) | 224 (22.3%) |
| 10 to 14 Year Olds | 785 (92.1%) | 67 (7.9%) |
| 15 to 17 Year Olds | 449 (84.7%) | 81 (15.3%) |
| 18 to 19 Year Olds | 121 (100.0%) | 0 (0.0%) |
| 20 to 24 Year Olds | 296 (95.8%) | 13 (4.2%) |
| 25 to 34 Year Olds | 139 (45.6%) | 166 (54.4%) |
| 35 Years and over | 150 (56.8%) | 114 (43.2%) |
| Total | 2,798 (76.1%) | 879 (23.9%) |
Educational Attainment by Field of Study in Riverdale
Business (618 | 32.9%), science & technology (204 | 10.9%), social sciences (196 | 10.4%), education (156 | 8.3%), and arts & humanities (130 | 6.9%) are the most common fields of study among 1,879 individuals in Riverdale who have obtained a bachelor's degree or higher.
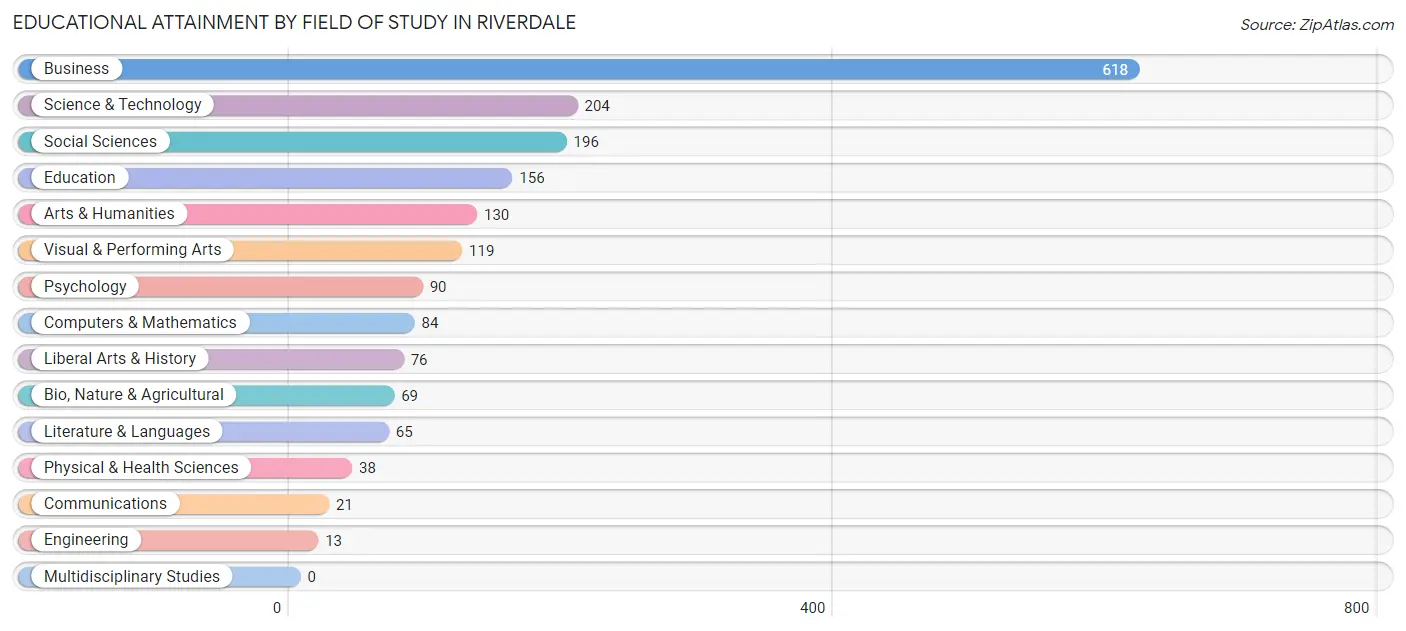
| Field of Study | # Graduates | % Graduates |
| Computers & Mathematics | 84 | 4.5% |
| Bio, Nature & Agricultural | 69 | 3.7% |
| Physical & Health Sciences | 38 | 2.0% |
| Psychology | 90 | 4.8% |
| Social Sciences | 196 | 10.4% |
| Engineering | 13 | 0.7% |
| Multidisciplinary Studies | 0 | 0.0% |
| Science & Technology | 204 | 10.9% |
| Business | 618 | 32.9% |
| Education | 156 | 8.3% |
| Literature & Languages | 65 | 3.5% |
| Liberal Arts & History | 76 | 4.0% |
| Visual & Performing Arts | 119 | 6.3% |
| Communications | 21 | 1.1% |
| Arts & Humanities | 130 | 6.9% |
| Total | 1,879 | 100.0% |
Transportation & Commute in Riverdale
Vehicle Availability by Sex in Riverdale
The most prevalent vehicle ownership categories in Riverdale are males with 2 vehicles (1,039, accounting for 30.8%) and females with 2 vehicles (1,328, making up 26.7%).
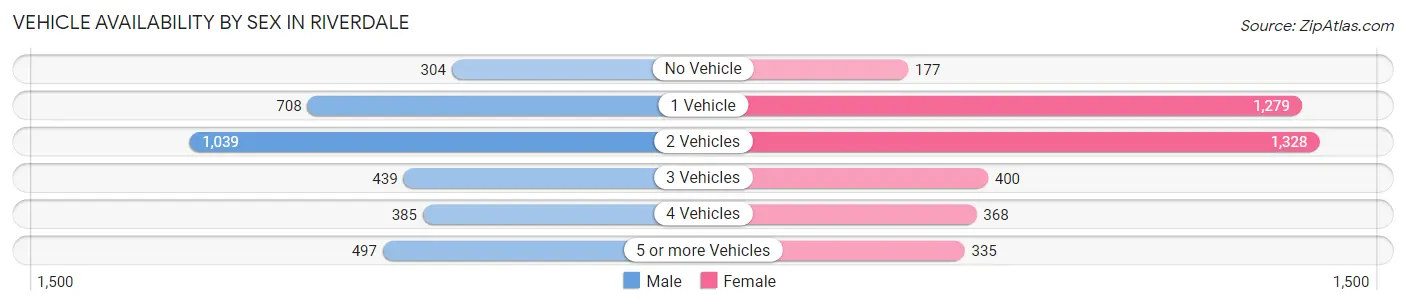
| Vehicles Available | Male | Female |
| No Vehicle | 304 (9.0%) | 177 (4.5%) |
| 1 Vehicle | 708 (21.0%) | 1,279 (32.9%) |
| 2 Vehicles | 1,039 (30.8%) | 1,328 (34.2%) |
| 3 Vehicles | 439 (13.0%) | 400 (10.3%) |
| 4 Vehicles | 385 (11.4%) | 368 (9.5%) |
| 5 or more Vehicles | 497 (14.7%) | 335 (8.6%) |
| Total | 3,372 (100.0%) | 3,887 (100.0%) |
Commute Time in Riverdale
The most frequently occuring commute durations in Riverdale are 15 to 19 minutes (1,378 commuters, 20.4%), 20 to 24 minutes (1,211 commuters, 17.9%), and 30 to 34 minutes (834 commuters, 12.3%).
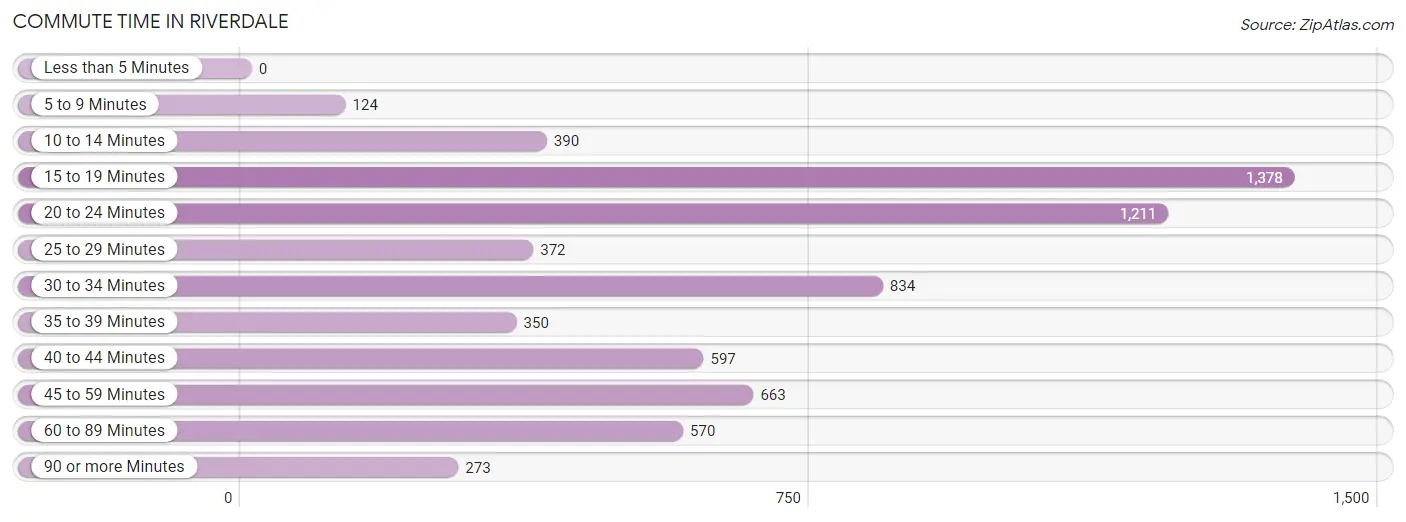
| Commute Time | # Commuters | % Commuters |
| Less than 5 Minutes | 0 | 0.0% |
| 5 to 9 Minutes | 124 | 1.8% |
| 10 to 14 Minutes | 390 | 5.8% |
| 15 to 19 Minutes | 1,378 | 20.4% |
| 20 to 24 Minutes | 1,211 | 17.9% |
| 25 to 29 Minutes | 372 | 5.5% |
| 30 to 34 Minutes | 834 | 12.3% |
| 35 to 39 Minutes | 350 | 5.2% |
| 40 to 44 Minutes | 597 | 8.8% |
| 45 to 59 Minutes | 663 | 9.8% |
| 60 to 89 Minutes | 570 | 8.4% |
| 90 or more Minutes | 273 | 4.0% |
Commute Time by Sex in Riverdale
The most common commute times in Riverdale are 15 to 19 minutes (558 commuters, 17.9%) for males and 15 to 19 minutes (820 commuters, 22.5%) for females.
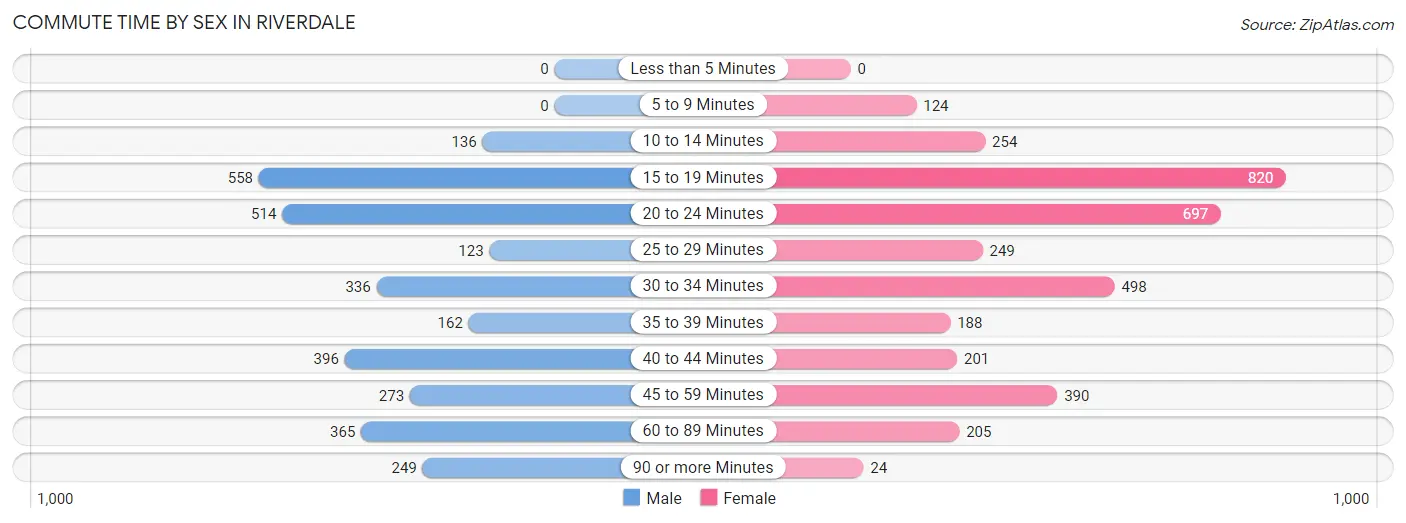
| Commute Time | Male | Female |
| Less than 5 Minutes | 0 (0.0%) | 0 (0.0%) |
| 5 to 9 Minutes | 0 (0.0%) | 124 (3.4%) |
| 10 to 14 Minutes | 136 (4.4%) | 254 (7.0%) |
| 15 to 19 Minutes | 558 (17.9%) | 820 (22.5%) |
| 20 to 24 Minutes | 514 (16.5%) | 697 (19.1%) |
| 25 to 29 Minutes | 123 (4.0%) | 249 (6.8%) |
| 30 to 34 Minutes | 336 (10.8%) | 498 (13.6%) |
| 35 to 39 Minutes | 162 (5.2%) | 188 (5.1%) |
| 40 to 44 Minutes | 396 (12.7%) | 201 (5.5%) |
| 45 to 59 Minutes | 273 (8.8%) | 390 (10.7%) |
| 60 to 89 Minutes | 365 (11.7%) | 205 (5.6%) |
| 90 or more Minutes | 249 (8.0%) | 24 (0.7%) |
Time of Departure to Work by Sex in Riverdale
The most frequent times of departure to work in Riverdale are 6:00 AM to 6:29 AM (657, 21.1%) for males and 10:00 AM to 10:59 AM (461, 12.6%) for females.
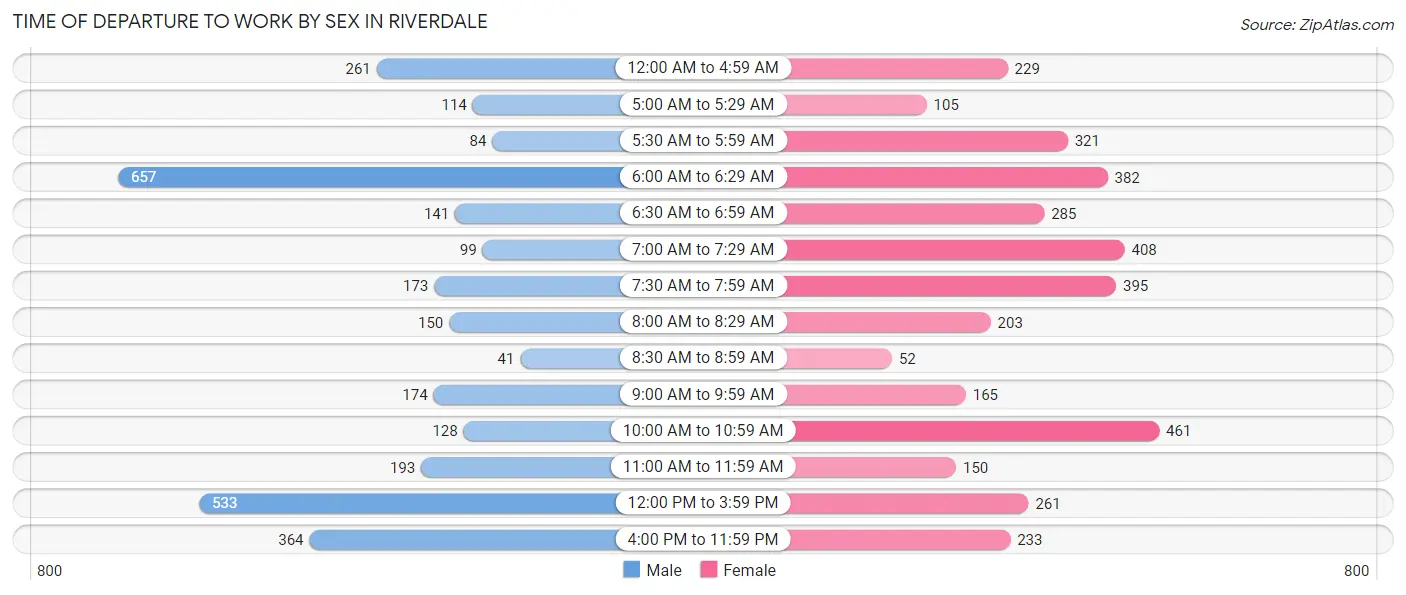
| Time of Departure | Male | Female |
| 12:00 AM to 4:59 AM | 261 (8.4%) | 229 (6.3%) |
| 5:00 AM to 5:29 AM | 114 (3.7%) | 105 (2.9%) |
| 5:30 AM to 5:59 AM | 84 (2.7%) | 321 (8.8%) |
| 6:00 AM to 6:29 AM | 657 (21.1%) | 382 (10.5%) |
| 6:30 AM to 6:59 AM | 141 (4.5%) | 285 (7.8%) |
| 7:00 AM to 7:29 AM | 99 (3.2%) | 408 (11.2%) |
| 7:30 AM to 7:59 AM | 173 (5.6%) | 395 (10.8%) |
| 8:00 AM to 8:29 AM | 150 (4.8%) | 203 (5.6%) |
| 8:30 AM to 8:59 AM | 41 (1.3%) | 52 (1.4%) |
| 9:00 AM to 9:59 AM | 174 (5.6%) | 165 (4.5%) |
| 10:00 AM to 10:59 AM | 128 (4.1%) | 461 (12.6%) |
| 11:00 AM to 11:59 AM | 193 (6.2%) | 150 (4.1%) |
| 12:00 PM to 3:59 PM | 533 (17.1%) | 261 (7.1%) |
| 4:00 PM to 11:59 PM | 364 (11.7%) | 233 (6.4%) |
| Total | 3,112 (100.0%) | 3,650 (100.0%) |
Housing Occupancy in Riverdale
Occupancy by Ownership in Riverdale
Of the total 5,715 dwellings in Riverdale, owner-occupied units account for 3,100 (54.2%), while renter-occupied units make up 2,615 (45.8%).
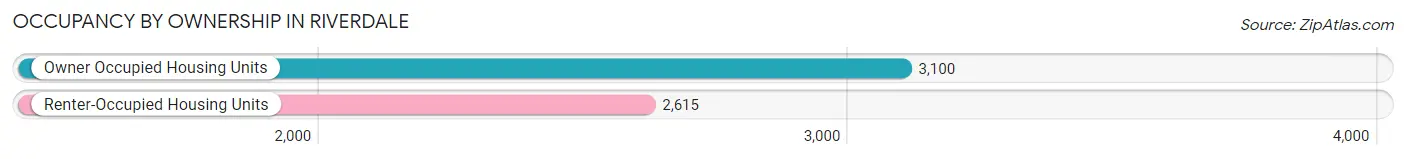
| Occupancy | # Housing Units | % Housing Units |
| Owner Occupied Housing Units | 3,100 | 54.2% |
| Renter-Occupied Housing Units | 2,615 | 45.8% |
| Total Occupied Housing Units | 5,715 | 100.0% |
Occupancy by Household Size in Riverdale
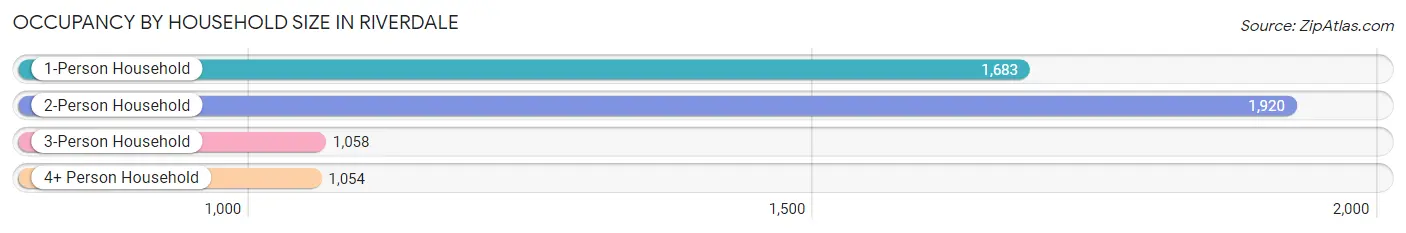
| Household Size | # Housing Units | % Housing Units |
| 1-Person Household | 1,683 | 29.4% |
| 2-Person Household | 1,920 | 33.6% |
| 3-Person Household | 1,058 | 18.5% |
| 4+ Person Household | 1,054 | 18.4% |
| Total Housing Units | 5,715 | 100.0% |
Occupancy by Ownership by Household Size in Riverdale
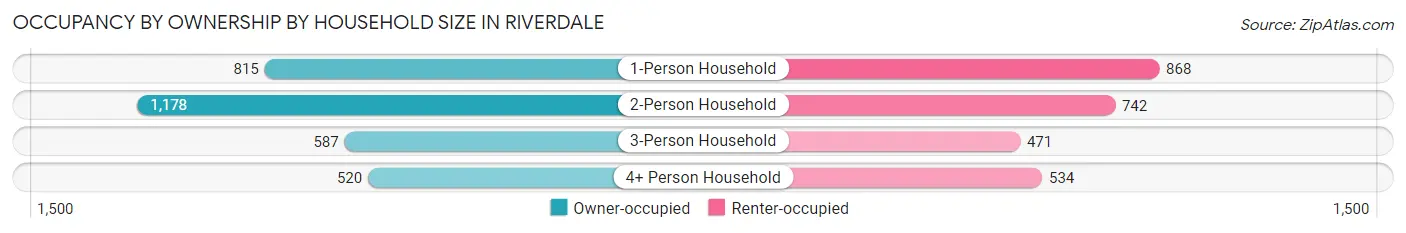
| Household Size | Owner-occupied | Renter-occupied |
| 1-Person Household | 815 (48.4%) | 868 (51.6%) |
| 2-Person Household | 1,178 (61.4%) | 742 (38.7%) |
| 3-Person Household | 587 (55.5%) | 471 (44.5%) |
| 4+ Person Household | 520 (49.3%) | 534 (50.7%) |
| Total Housing Units | 3,100 (54.2%) | 2,615 (45.8%) |
Occupancy by Educational Attainment in Riverdale
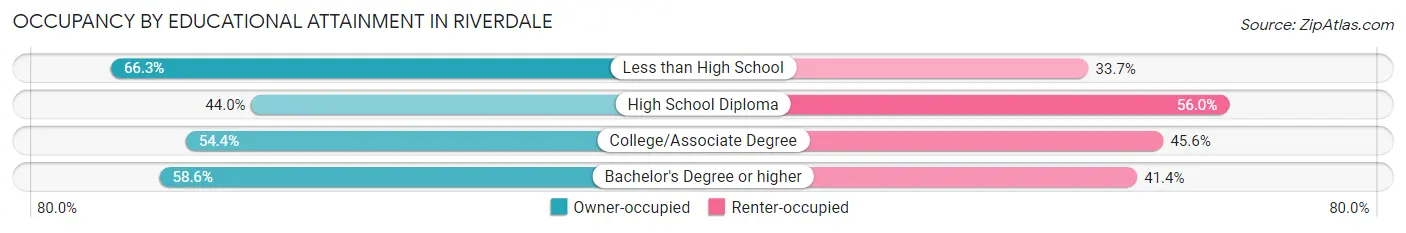
| Household Size | Owner-occupied | Renter-occupied |
| Less than High School | 484 (66.3%) | 246 (33.7%) |
| High School Diploma | 623 (44.0%) | 792 (56.0%) |
| College/Associate Degree | 1,290 (54.4%) | 1,080 (45.6%) |
| Bachelor's Degree or higher | 703 (58.6%) | 497 (41.4%) |
Occupancy by Age of Householder in Riverdale
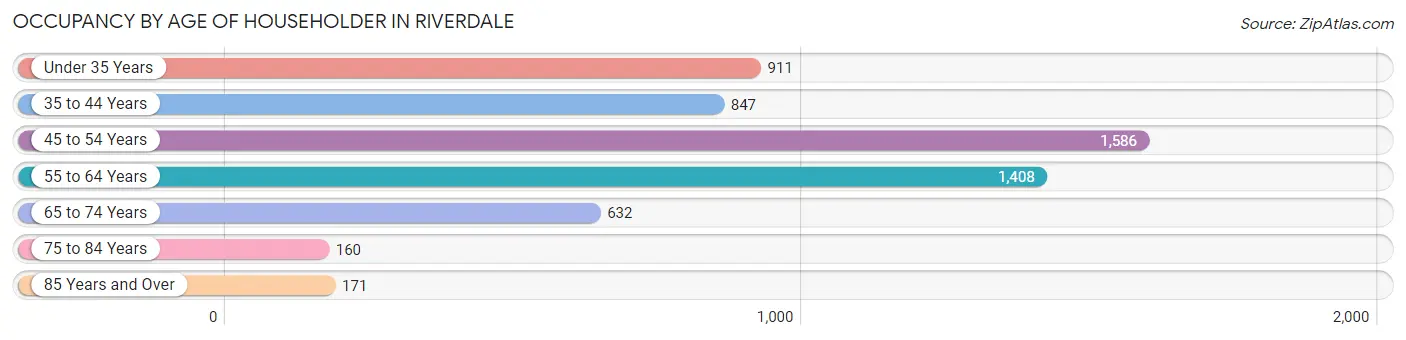
| Age Bracket | # Households | % Households |
| Under 35 Years | 911 | 15.9% |
| 35 to 44 Years | 847 | 14.8% |
| 45 to 54 Years | 1,586 | 27.8% |
| 55 to 64 Years | 1,408 | 24.6% |
| 65 to 74 Years | 632 | 11.1% |
| 75 to 84 Years | 160 | 2.8% |
| 85 Years and Over | 171 | 3.0% |
| Total | 5,715 | 100.0% |
Housing Finances in Riverdale
Median Income by Occupancy in Riverdale
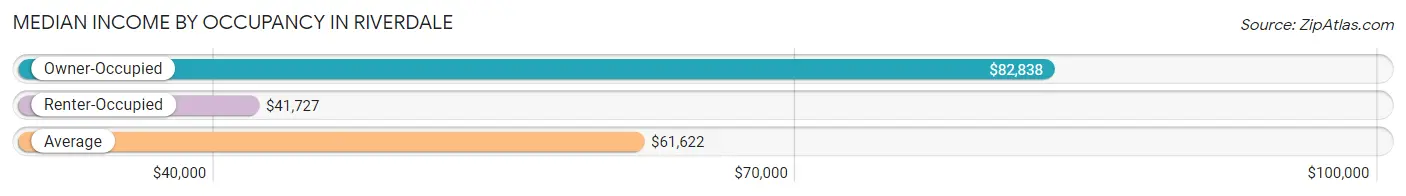
| Occupancy Type | # Households | Median Income |
| Owner-Occupied | 3,100 (54.2%) | $82,838 |
| Renter-Occupied | 2,615 (45.8%) | $41,727 |
| Average | 5,715 (100.0%) | $61,622 |
Occupancy by Householder Income Bracket in Riverdale
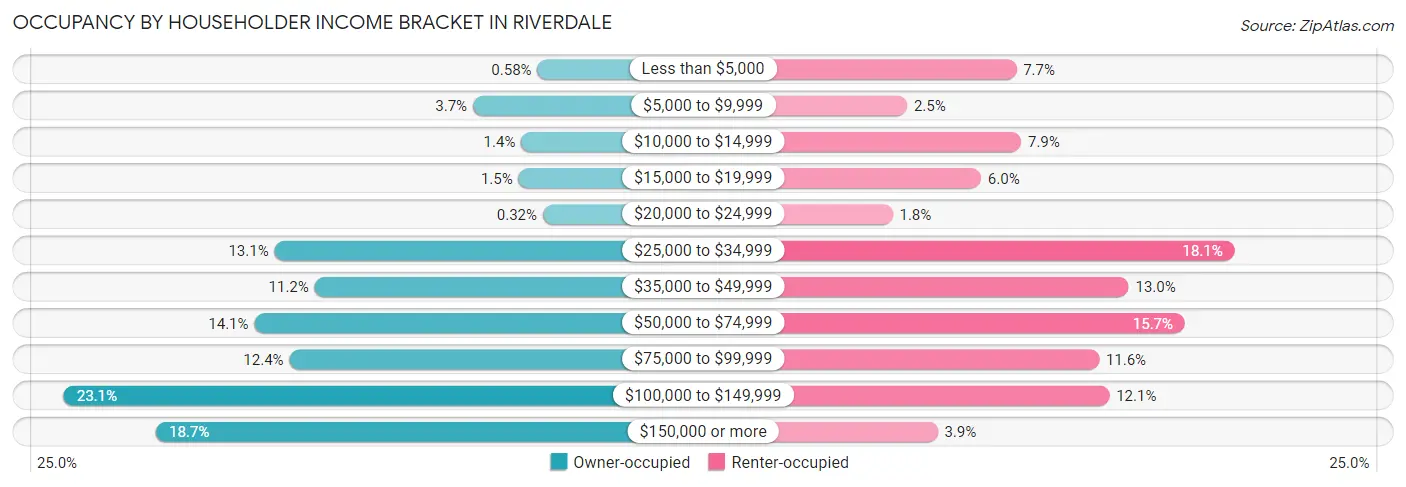
| Income Bracket | Owner-occupied | Renter-occupied |
| Less than $5,000 | 18 (0.6%) | 200 (7.6%) |
| $5,000 to $9,999 | 113 (3.6%) | 64 (2.5%) |
| $10,000 to $14,999 | 42 (1.3%) | 206 (7.9%) |
| $15,000 to $19,999 | 46 (1.5%) | 156 (6.0%) |
| $20,000 to $24,999 | 10 (0.3%) | 46 (1.8%) |
| $25,000 to $34,999 | 406 (13.1%) | 472 (18.0%) |
| $35,000 to $49,999 | 347 (11.2%) | 340 (13.0%) |
| $50,000 to $74,999 | 436 (14.1%) | 410 (15.7%) |
| $75,000 to $99,999 | 384 (12.4%) | 303 (11.6%) |
| $100,000 to $149,999 | 717 (23.1%) | 316 (12.1%) |
| $150,000 or more | 581 (18.7%) | 102 (3.9%) |
| Total | 3,100 (100.0%) | 2,615 (100.0%) |
Monthly Housing Cost Tiers in Riverdale
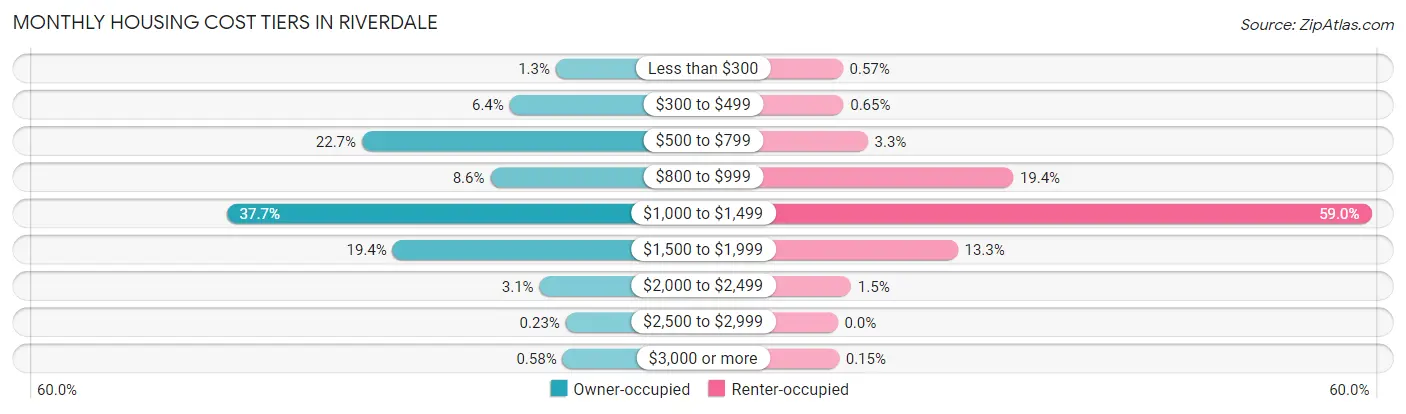
| Monthly Cost | Owner-occupied | Renter-occupied |
| Less than $300 | 41 (1.3%) | 15 (0.6%) |
| $300 to $499 | 199 (6.4%) | 17 (0.6%) |
| $500 to $799 | 705 (22.7%) | 87 (3.3%) |
| $800 to $999 | 265 (8.6%) | 507 (19.4%) |
| $1,000 to $1,499 | 1,168 (37.7%) | 1,542 (59.0%) |
| $1,500 to $1,999 | 600 (19.4%) | 347 (13.3%) |
| $2,000 to $2,499 | 97 (3.1%) | 39 (1.5%) |
| $2,500 to $2,999 | 7 (0.2%) | 0 (0.0%) |
| $3,000 or more | 18 (0.6%) | 4 (0.2%) |
| Total | 3,100 (100.0%) | 2,615 (100.0%) |
Physical Housing Characteristics in Riverdale
Housing Structures in Riverdale
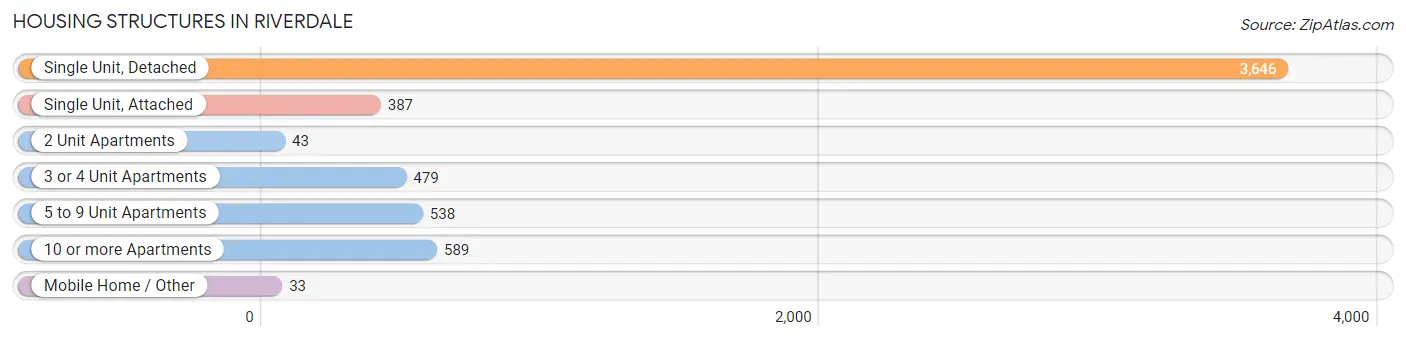
| Structure Type | # Housing Units | % Housing Units |
| Single Unit, Detached | 3,646 | 63.8% |
| Single Unit, Attached | 387 | 6.8% |
| 2 Unit Apartments | 43 | 0.7% |
| 3 or 4 Unit Apartments | 479 | 8.4% |
| 5 to 9 Unit Apartments | 538 | 9.4% |
| 10 or more Apartments | 589 | 10.3% |
| Mobile Home / Other | 33 | 0.6% |
| Total | 5,715 | 100.0% |
Housing Structures by Occupancy in Riverdale
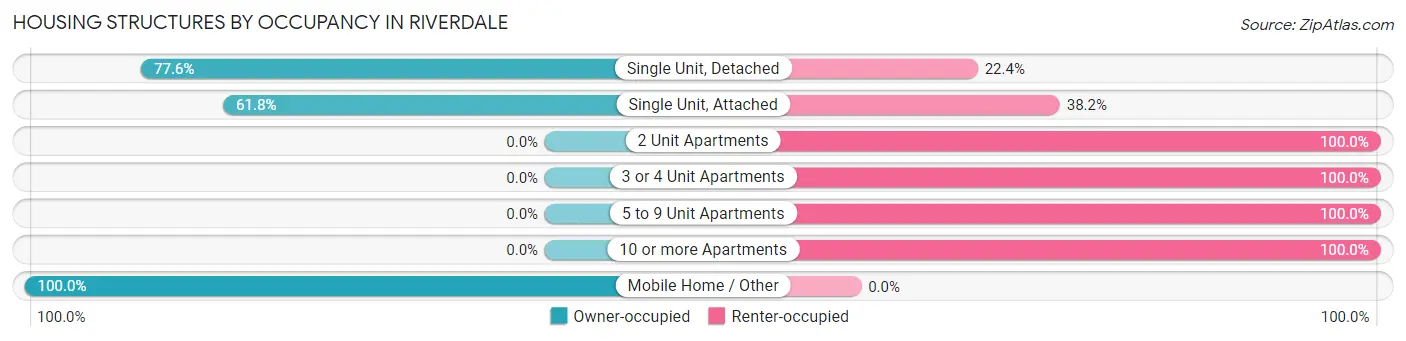
| Structure Type | Owner-occupied | Renter-occupied |
| Single Unit, Detached | 2,828 (77.6%) | 818 (22.4%) |
| Single Unit, Attached | 239 (61.8%) | 148 (38.2%) |
| 2 Unit Apartments | 0 (0.0%) | 43 (100.0%) |
| 3 or 4 Unit Apartments | 0 (0.0%) | 479 (100.0%) |
| 5 to 9 Unit Apartments | 0 (0.0%) | 538 (100.0%) |
| 10 or more Apartments | 0 (0.0%) | 589 (100.0%) |
| Mobile Home / Other | 33 (100.0%) | 0 (0.0%) |
| Total | 3,100 (54.2%) | 2,615 (45.8%) |
Housing Structures by Number of Rooms in Riverdale
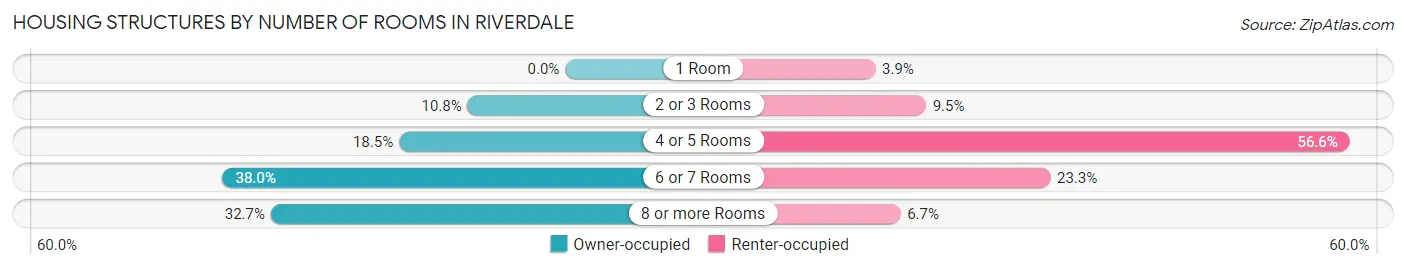
| Number of Rooms | Owner-occupied | Renter-occupied |
| 1 Room | 0 (0.0%) | 102 (3.9%) |
| 2 or 3 Rooms | 336 (10.8%) | 249 (9.5%) |
| 4 or 5 Rooms | 572 (18.4%) | 1,479 (56.6%) |
| 6 or 7 Rooms | 1,179 (38.0%) | 610 (23.3%) |
| 8 or more Rooms | 1,013 (32.7%) | 175 (6.7%) |
| Total | 3,100 (100.0%) | 2,615 (100.0%) |
Housing Structure by Heating Type in Riverdale
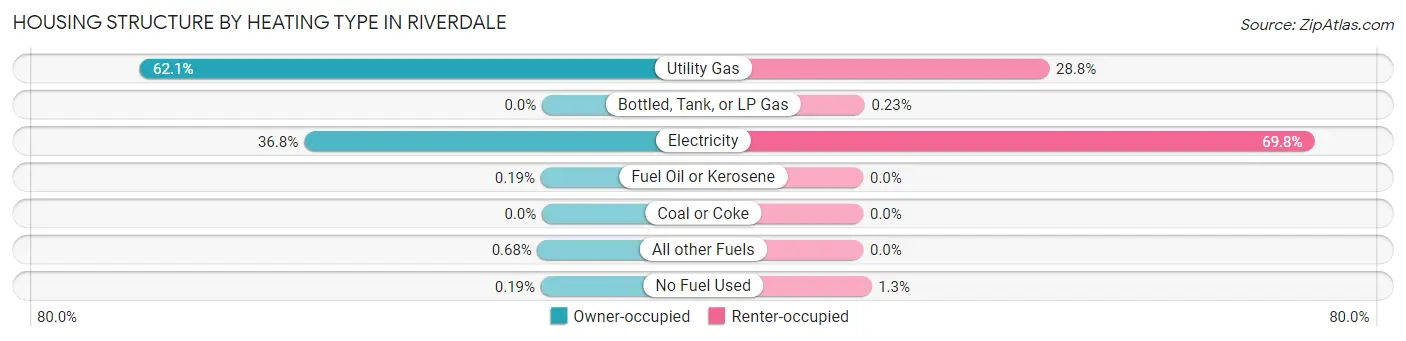
| Heating Type | Owner-occupied | Renter-occupied |
| Utility Gas | 1,926 (62.1%) | 752 (28.8%) |
| Bottled, Tank, or LP Gas | 0 (0.0%) | 6 (0.2%) |
| Electricity | 1,141 (36.8%) | 1,824 (69.8%) |
| Fuel Oil or Kerosene | 6 (0.2%) | 0 (0.0%) |
| Coal or Coke | 0 (0.0%) | 0 (0.0%) |
| All other Fuels | 21 (0.7%) | 0 (0.0%) |
| No Fuel Used | 6 (0.2%) | 33 (1.3%) |
| Total | 3,100 (100.0%) | 2,615 (100.0%) |
Household Vehicle Usage in Riverdale
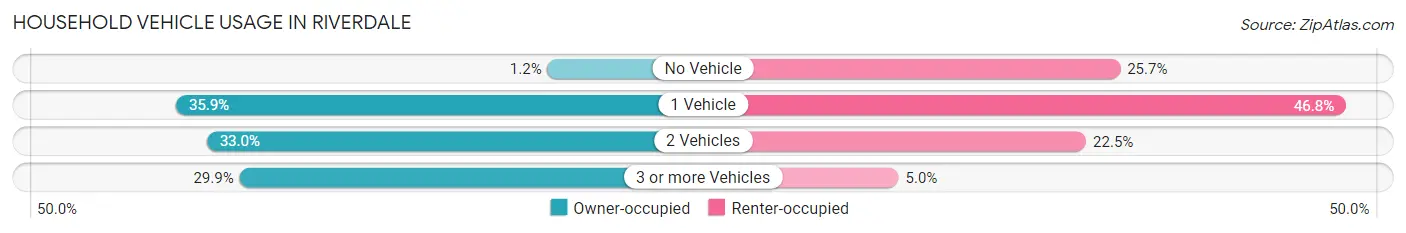
| Vehicles per Household | Owner-occupied | Renter-occupied |
| No Vehicle | 37 (1.2%) | 672 (25.7%) |
| 1 Vehicle | 1,112 (35.9%) | 1,223 (46.8%) |
| 2 Vehicles | 1,023 (33.0%) | 589 (22.5%) |
| 3 or more Vehicles | 928 (29.9%) | 131 (5.0%) |
| Total | 3,100 (100.0%) | 2,615 (100.0%) |
Real Estate & Mortgages in Riverdale
Real Estate and Mortgage Overview in Riverdale
| Characteristic | Without Mortgage | With Mortgage |
| Housing Units | 776 | 2,324 |
| Median Property Value | $113,300 | $156,200 |
| Median Household Income | $96,250 | $255 |
| Monthly Housing Costs | $539 | $0 |
| Real Estate Taxes | $2,044 | $56 |
Property Value by Mortgage Status in Riverdale
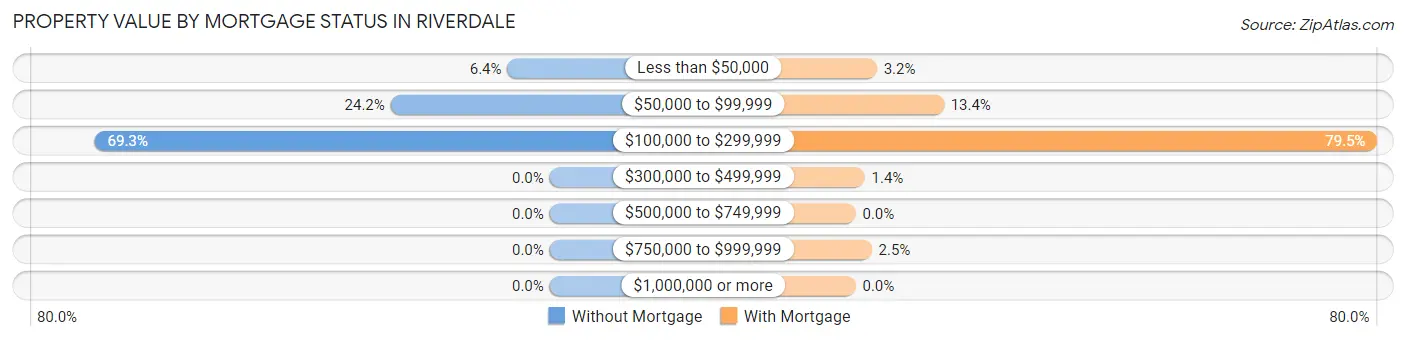
| Property Value | Without Mortgage | With Mortgage |
| Less than $50,000 | 50 (6.4%) | 75 (3.2%) |
| $50,000 to $99,999 | 188 (24.2%) | 312 (13.4%) |
| $100,000 to $299,999 | 538 (69.3%) | 1,848 (79.5%) |
| $300,000 to $499,999 | 0 (0.0%) | 32 (1.4%) |
| $500,000 to $749,999 | 0 (0.0%) | 0 (0.0%) |
| $750,000 to $999,999 | 0 (0.0%) | 57 (2.5%) |
| $1,000,000 or more | 0 (0.0%) | 0 (0.0%) |
| Total | 776 (100.0%) | 2,324 (100.0%) |
Household Income by Mortgage Status in Riverdale
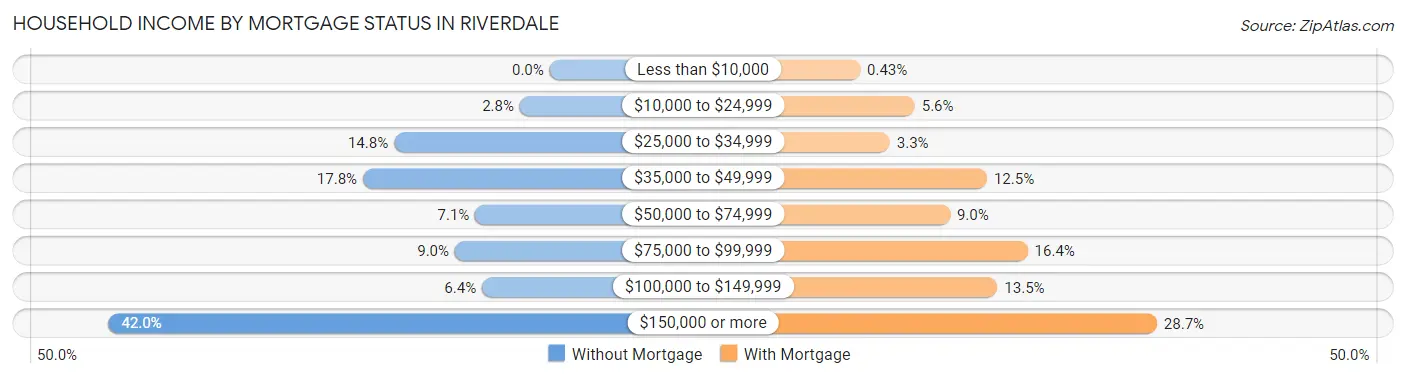
| Household Income | Without Mortgage | With Mortgage |
| Less than $10,000 | 0 (0.0%) | 10 (0.4%) |
| $10,000 to $24,999 | 22 (2.8%) | 131 (5.6%) |
| $25,000 to $34,999 | 115 (14.8%) | 76 (3.3%) |
| $35,000 to $49,999 | 138 (17.8%) | 291 (12.5%) |
| $50,000 to $74,999 | 55 (7.1%) | 209 (9.0%) |
| $75,000 to $99,999 | 70 (9.0%) | 381 (16.4%) |
| $100,000 to $149,999 | 50 (6.4%) | 314 (13.5%) |
| $150,000 or more | 326 (42.0%) | 667 (28.7%) |
| Total | 776 (100.0%) | 2,324 (100.0%) |
Property Value to Household Income Ratio in Riverdale
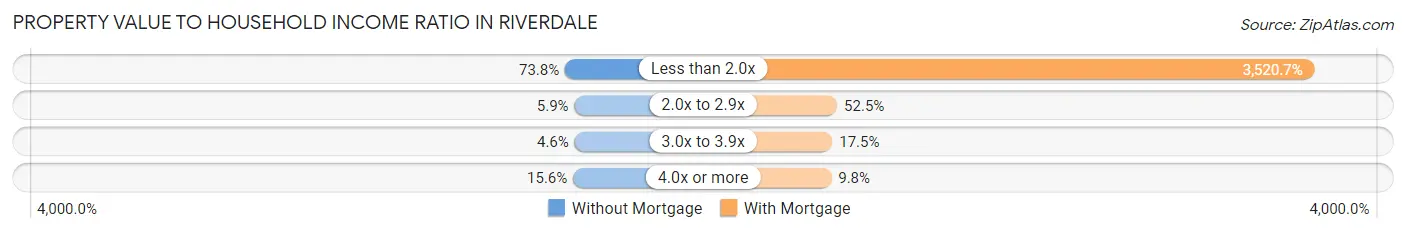
| Value-to-Income Ratio | Without Mortgage | With Mortgage |
| Less than 2.0x | 573 (73.8%) | 81,821 (3,520.7%) |
| 2.0x to 2.9x | 46 (5.9%) | 1,219 (52.4%) |
| 3.0x to 3.9x | 36 (4.6%) | 407 (17.5%) |
| 4.0x or more | 121 (15.6%) | 227 (9.8%) |
| Total | 776 (100.0%) | 2,324 (100.0%) |
Real Estate Taxes by Mortgage Status in Riverdale
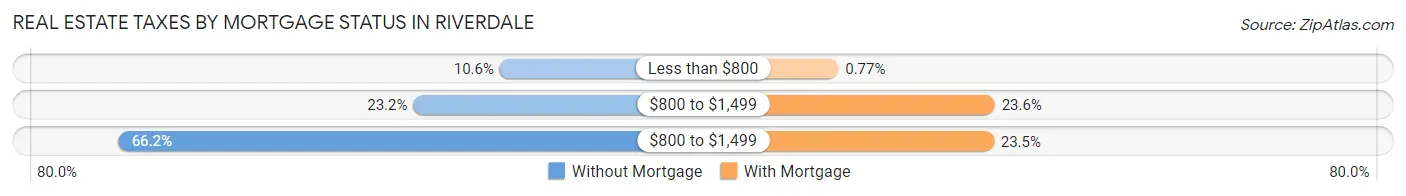
| Property Taxes | Without Mortgage | With Mortgage |
| Less than $800 | 82 (10.6%) | 18 (0.8%) |
| $800 to $1,499 | 180 (23.2%) | 549 (23.6%) |
| $800 to $1,499 | 514 (66.2%) | 546 (23.5%) |
| Total | 776 (100.0%) | 2,324 (100.0%) |
Health & Disability in Riverdale
Health Insurance Coverage by Age in Riverdale
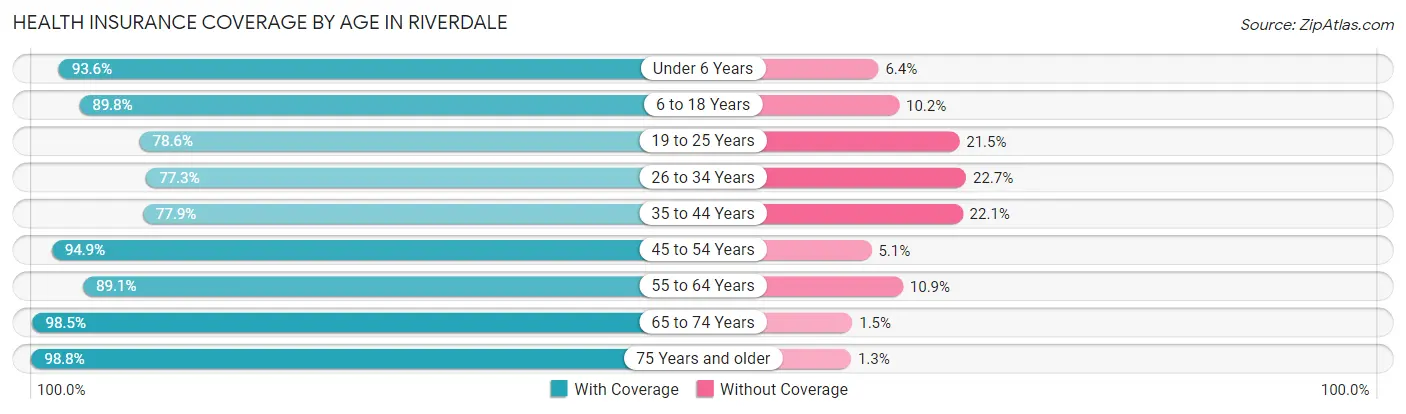
| Age Bracket | With Coverage | Without Coverage |
| Under 6 Years | 1,159 (93.6%) | 79 (6.4%) |
| 6 to 18 Years | 2,006 (89.8%) | 228 (10.2%) |
| 19 to 25 Years | 1,406 (78.5%) | 384 (21.4%) |
| 26 to 34 Years | 1,386 (77.3%) | 407 (22.7%) |
| 35 to 44 Years | 1,381 (77.9%) | 391 (22.1%) |
| 45 to 54 Years | 1,834 (94.9%) | 98 (5.1%) |
| 55 to 64 Years | 2,146 (89.1%) | 263 (10.9%) |
| 65 to 74 Years | 1,121 (98.5%) | 17 (1.5%) |
| 75 Years and older | 474 (98.8%) | 6 (1.3%) |
| Total | 12,913 (87.3%) | 1,873 (12.7%) |
Health Insurance Coverage by Citizenship Status in Riverdale
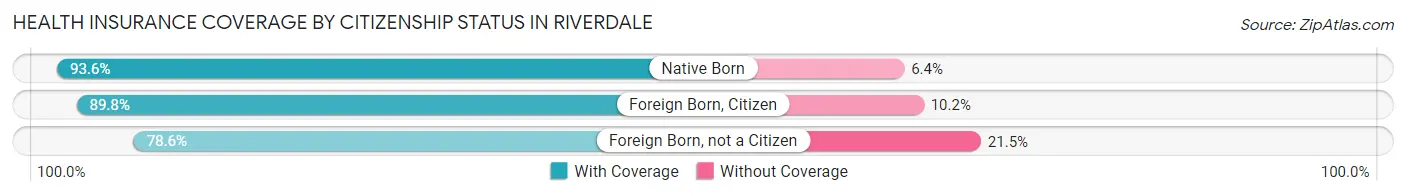
| Citizenship Status | With Coverage | Without Coverage |
| Native Born | 1,159 (93.6%) | 79 (6.4%) |
| Foreign Born, Citizen | 2,006 (89.8%) | 228 (10.2%) |
| Foreign Born, not a Citizen | 1,406 (78.5%) | 384 (21.4%) |
Health Insurance Coverage by Household Income in Riverdale
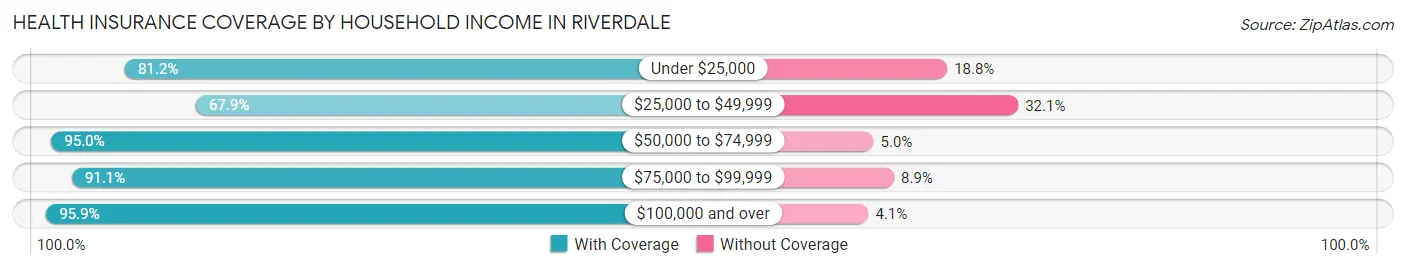
| Household Income | With Coverage | Without Coverage |
| Under $25,000 | 1,170 (81.2%) | 271 (18.8%) |
| $25,000 to $49,999 | 2,261 (67.9%) | 1,070 (32.1%) |
| $50,000 to $74,999 | 2,310 (95.0%) | 122 (5.0%) |
| $75,000 to $99,999 | 1,945 (91.1%) | 189 (8.9%) |
| $100,000 and over | 5,222 (95.9%) | 221 (4.1%) |
Public vs Private Health Insurance Coverage by Age in Riverdale
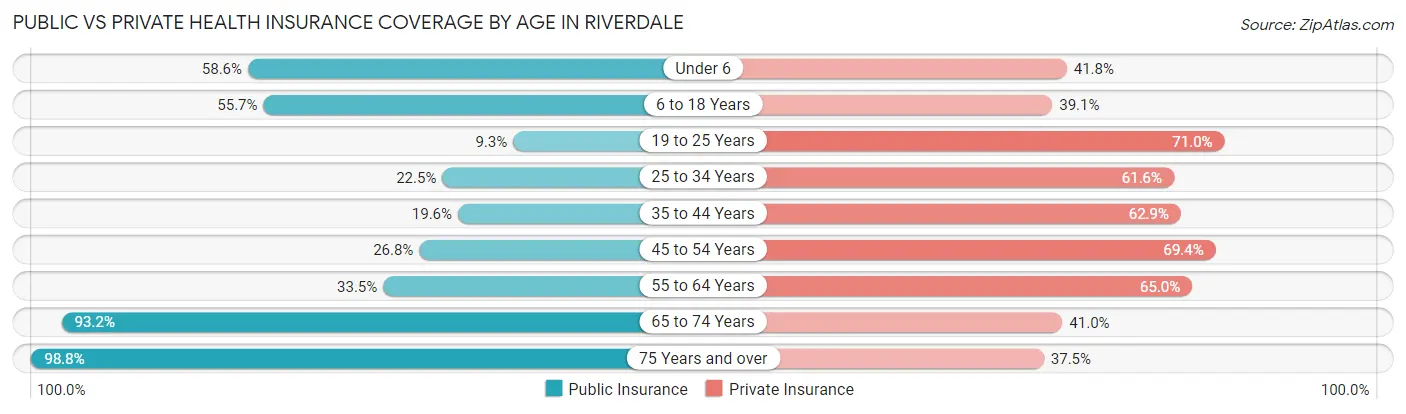
| Age Bracket | Public Insurance | Private Insurance |
| Under 6 | 725 (58.6%) | 517 (41.8%) |
| 6 to 18 Years | 1,244 (55.7%) | 873 (39.1%) |
| 19 to 25 Years | 167 (9.3%) | 1,271 (71.0%) |
| 25 to 34 Years | 403 (22.5%) | 1,105 (61.6%) |
| 35 to 44 Years | 347 (19.6%) | 1,115 (62.9%) |
| 45 to 54 Years | 517 (26.8%) | 1,340 (69.4%) |
| 55 to 64 Years | 806 (33.5%) | 1,566 (65.0%) |
| 65 to 74 Years | 1,060 (93.1%) | 466 (40.9%) |
| 75 Years and over | 474 (98.8%) | 180 (37.5%) |
| Total | 5,743 (38.8%) | 8,433 (57.0%) |
Disability Status by Sex by Age in Riverdale
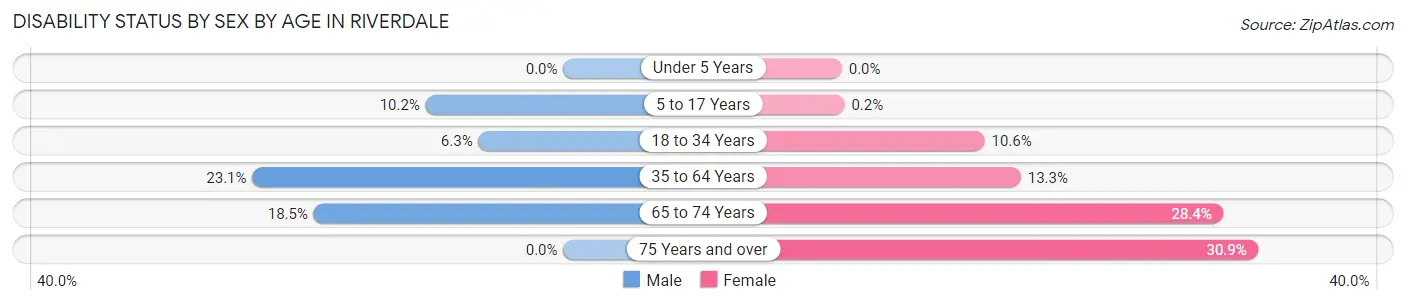
| Age Bracket | Male | Female |
| Under 5 Years | 0 (0.0%) | 0 (0.0%) |
| 5 to 17 Years | 147 (10.2%) | 2 (0.2%) |
| 18 to 34 Years | 109 (6.3%) | 201 (10.6%) |
| 35 to 64 Years | 600 (23.1%) | 467 (13.3%) |
| 65 to 74 Years | 103 (18.5%) | 165 (28.3%) |
| 75 Years and over | 0 (0.0%) | 112 (30.9%) |
Disability Class by Sex by Age in Riverdale
Disability Class: Hearing Difficulty
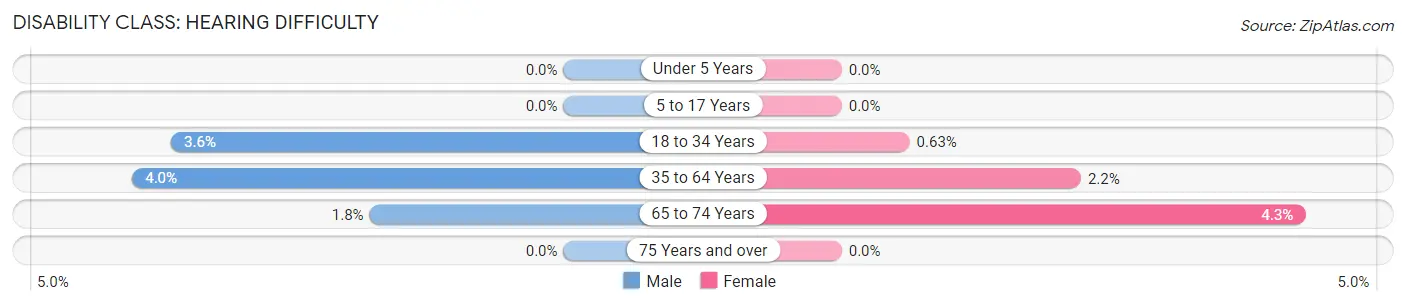
| Age Bracket | Male | Female |
| Under 5 Years | 0 (0.0%) | 0 (0.0%) |
| 5 to 17 Years | 0 (0.0%) | 0 (0.0%) |
| 18 to 34 Years | 63 (3.6%) | 12 (0.6%) |
| 35 to 64 Years | 104 (4.0%) | 78 (2.2%) |
| 65 to 74 Years | 10 (1.8%) | 25 (4.3%) |
| 75 Years and over | 0 (0.0%) | 0 (0.0%) |
Disability Class: Vision Difficulty
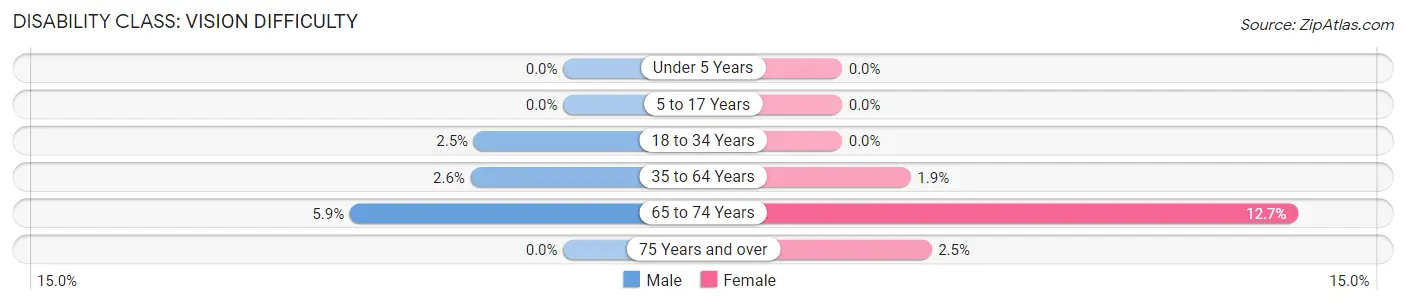
| Age Bracket | Male | Female |
| Under 5 Years | 0 (0.0%) | 0 (0.0%) |
| 5 to 17 Years | 0 (0.0%) | 0 (0.0%) |
| 18 to 34 Years | 43 (2.5%) | 0 (0.0%) |
| 35 to 64 Years | 67 (2.6%) | 67 (1.9%) |
| 65 to 74 Years | 33 (5.9%) | 74 (12.7%) |
| 75 Years and over | 0 (0.0%) | 9 (2.5%) |
Disability Class: Cognitive Difficulty
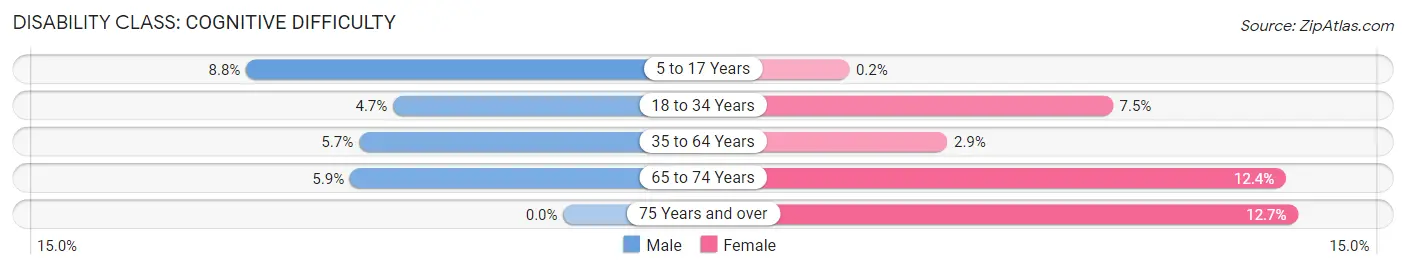
| Age Bracket | Male | Female |
| 5 to 17 Years | 127 (8.8%) | 2 (0.2%) |
| 18 to 34 Years | 82 (4.7%) | 143 (7.5%) |
| 35 to 64 Years | 148 (5.7%) | 103 (2.9%) |
| 65 to 74 Years | 33 (5.9%) | 72 (12.4%) |
| 75 Years and over | 0 (0.0%) | 46 (12.7%) |
Disability Class: Ambulatory Difficulty
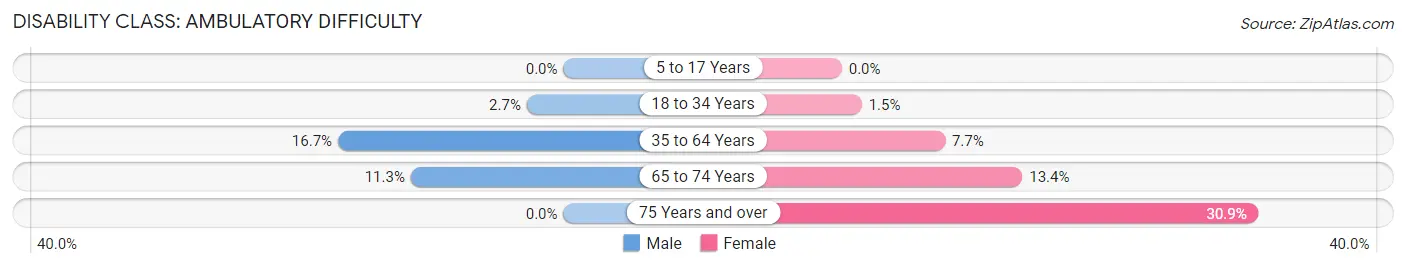
| Age Bracket | Male | Female |
| 5 to 17 Years | 0 (0.0%) | 0 (0.0%) |
| 18 to 34 Years | 47 (2.7%) | 28 (1.5%) |
| 35 to 64 Years | 435 (16.7%) | 269 (7.7%) |
| 65 to 74 Years | 63 (11.3%) | 78 (13.4%) |
| 75 Years and over | 0 (0.0%) | 112 (30.9%) |
Disability Class: Self-Care Difficulty
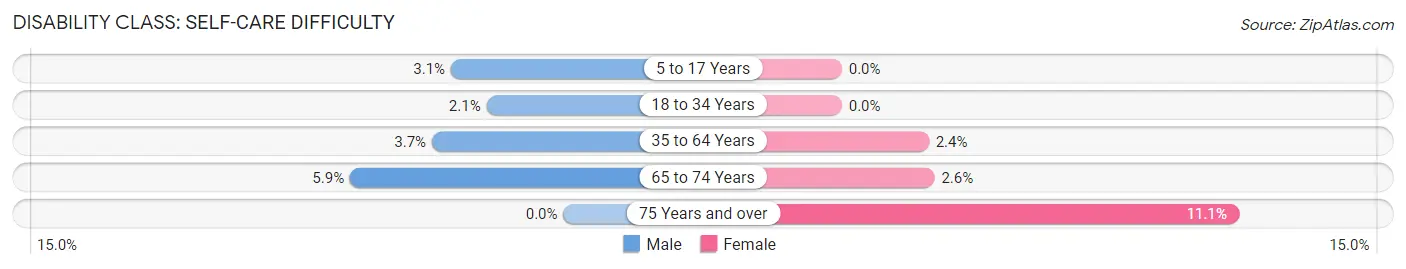
| Age Bracket | Male | Female |
| 5 to 17 Years | 45 (3.1%) | 0 (0.0%) |
| 18 to 34 Years | 37 (2.1%) | 0 (0.0%) |
| 35 to 64 Years | 95 (3.7%) | 85 (2.4%) |
| 65 to 74 Years | 33 (5.9%) | 15 (2.6%) |
| 75 Years and over | 0 (0.0%) | 40 (11.1%) |
Technology Access in Riverdale
Computing Device Access in Riverdale
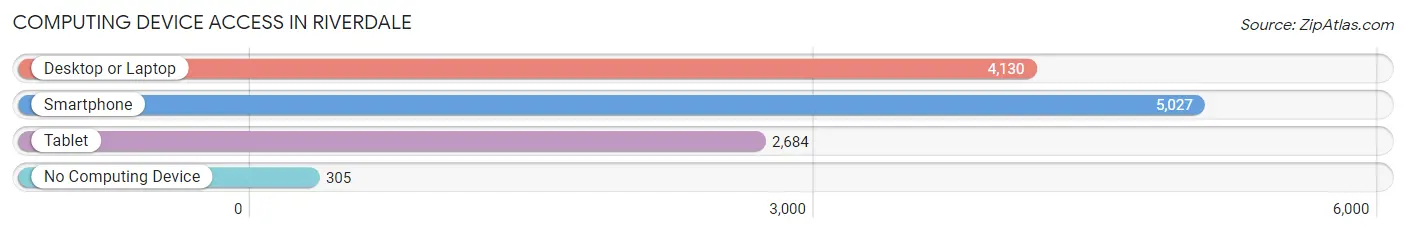
| Device Type | # Households | % Households |
| Desktop or Laptop | 4,130 | 72.3% |
| Smartphone | 5,027 | 88.0% |
| Tablet | 2,684 | 47.0% |
| No Computing Device | 305 | 5.3% |
| Total | 5,715 | 100.0% |
Internet Access in Riverdale
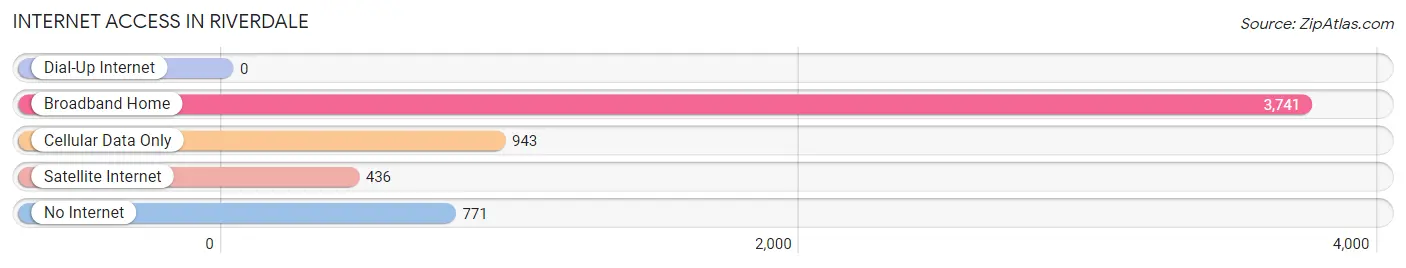
| Internet Type | # Households | % Households |
| Dial-Up Internet | 0 | 0.0% |
| Broadband Home | 3,741 | 65.5% |
| Cellular Data Only | 943 | 16.5% |
| Satellite Internet | 436 | 7.6% |
| No Internet | 771 | 13.5% |
| Total | 5,715 | 100.0% |
Riverdale Summary
Riverdale is a city located in Clayton County, Georgia, United States. It is part of the Atlanta metropolitan area. The population was 15,134 at the 2010 census, up from 12,478 in 2000.
Geography
Riverdale is located in the south-central part of Clayton County at 33°33′N 84°25′W (33.55, -84.41). It is bordered to the north by the city of College Park, to the east by the city of Morrow, to the south by the city of Forest Park, and to the west by the city of Lake City.
According to the United States Census Bureau, the city has a total area of 8.2 square miles (21.2 km2), of which 8.1 square miles (21.0 km2) is land and 0.1 square miles (0.2 km2) (1.17%) is water.
History
The area that is now Riverdale was first settled in the early 19th century. The town was originally known as "Morrow's Crossroads" after the family that owned the land. In 1882, the Georgia General Assembly granted a charter to the town, which was then renamed "Riverdale" after the nearby river.
The town grew slowly until the 1950s, when it began to experience rapid growth due to its proximity to Atlanta. In the 1960s, Riverdale was annexed by the city of College Park. In the 1970s, the city of Morrow annexed a portion of Riverdale.
Economy
Riverdale is home to a variety of businesses, including retail stores, restaurants, and professional services. The city is also home to several industrial parks, which provide employment opportunities for local residents.
The city is served by the Clayton County Public Schools system. The city is also home to several private schools, including the Riverdale Christian Academy and the Riverdale Montessori School.
Demographics
As of the 2010 census, there were 15,134 people, 5,845 households, and 3,845 families residing in the city. The population density was 1,859.3 people per square mile (717.7/km2). There were 6,541 housing units at an average density of 801.3 per square mile (309.3/km2). The racial makeup of the city was 44.2% African American, 37.3% White, 0.3% Native American, 8.2% Asian, 0.1% Pacific Islander, 6.7% from other races, and 3.4% from two or more races. Hispanic or Latino of any race were 13.2% of the population.
There were 5,845 households, out of which 33.2% had children under the age of 18 living with them, 39.2% were married couples living together, 20.2% had a female householder with no husband present, and 33.7% were non-families. 27.2% of all households were made up of individuals, and 8.2% had someone living alone who was 65 years of age or older. The average household size was 2.58 and the average family size was 3.14.
In the city, the population was spread out, with 27.2% under the age of 18, 10.2% from 18 to 24, 32.2% from 25 to 44, 19.7% from 45 to 64, and 10.7% who were 65 years of age or older. The median age was 32 years. For every 100 females, there were 91.2 males. For every 100 females age 18 and over, there were 87.2 males.
The median income for a household in the city was $37,845, and the median income for a family was $45,945. Males had a median income of $31,945 versus $27,845 for females. The per capita income for the city was $19,845. About 11.2% of families and 14.2% of the population were below the poverty line, including 19.2% of those under age 18 and 11.2% of those age 65 or over.
Common Questions
What is Per Capita Income in Riverdale?
Per Capita income in Riverdale is $29,406.
What is the Median Family Income in Riverdale?
Median Family Income in Riverdale is $78,099.
What is the Median Household income in Riverdale?
Median Household Income in Riverdale is $61,622.
What is Income or Wage Gap in Riverdale?
Income or Wage Gap in Riverdale is 5.3%.
Women in Riverdale earn 94.7 cents for every dollar earned by a man.
What is Inequality or Gini Index in Riverdale?
Inequality or Gini Index in Riverdale is 0.43.
What is the Total Population of Riverdale?
Total Population of Riverdale is 14,933.
What is the Total Male Population of Riverdale?
Total Male Population of Riverdale is 7,082.
What is the Total Female Population of Riverdale?
Total Female Population of Riverdale is 7,851.
What is the Ratio of Males per 100 Females in Riverdale?
There are 90.21 Males per 100 Females in Riverdale.
What is the Ratio of Females per 100 Males in Riverdale?
There are 110.86 Females per 100 Males in Riverdale.
What is the Median Population Age in Riverdale?
Median Population Age in Riverdale is 37.4 Years.
What is the Average Family Size in Riverdale
Average Family Size in Riverdale is 3.3 People.
What is the Average Household Size in Riverdale
Average Household Size in Riverdale is 2.6 People.
How Large is the Labor Force in Riverdale?
There are 8,263 People in the Labor Forcein in Riverdale.
What is the Percentage of People in the Labor Force in Riverdale?
69.0% of People are in the Labor Force in Riverdale.
What is the Unemployment Rate in Riverdale?
Unemployment Rate in Riverdale is 3.0%.