Warner Robins, GA Map & Demographics
Warner Robins Map
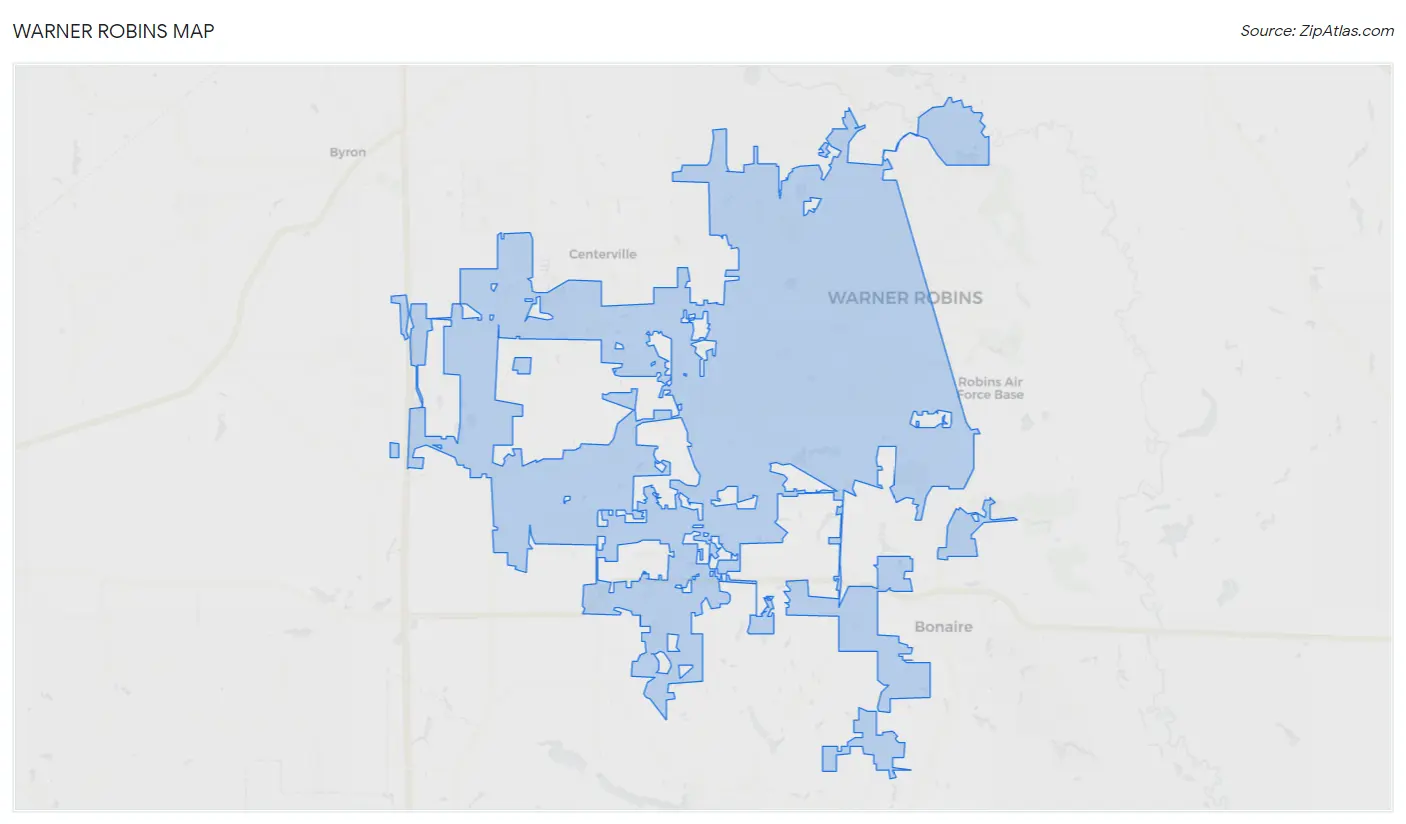
Warner Robins Overview
$32,325
PER CAPITA INCOME
$77,116
AVG FAMILY INCOME
$63,678
AVG HOUSEHOLD INCOME
28.7%
WAGE / INCOME GAP [ % ]
71.3¢/ $1
WAGE / INCOME GAP [ $ ]
$11,255
FAMILY INCOME DEFICIT
0.43
INEQUALITY / GINI INDEX
80,374
TOTAL POPULATION
38,152
MALE POPULATION
42,222
FEMALE POPULATION
90.36
MALES / 100 FEMALES
110.67
FEMALES / 100 MALES
32.4
MEDIAN AGE
3.3
AVG FAMILY SIZE
2.6
AVG HOUSEHOLD SIZE
41,609
LABOR FORCE [ PEOPLE ]
67.6%
PERCENT IN LABOR FORCE
6.5%
UNEMPLOYMENT RATE
Warner Robins Area Codes
Income in Warner Robins
Income Overview in Warner Robins
Per Capita Income in Warner Robins is $32,325, while median incomes of families and households are $77,116 and $63,678 respectively.
| Characteristic | Number | Measure |
| Per Capita Income | 80,374 | $32,325 |
| Median Family Income | 19,745 | $77,116 |
| Mean Family Income | 19,745 | $94,364 |
| Median Household Income | 30,619 | $63,678 |
| Mean Household Income | 30,619 | $82,235 |
| Income Deficit | 19,745 | $11,255 |
| Wage / Income Gap (%) | 80,374 | 28.69% |
| Wage / Income Gap ($) | 80,374 | 71.31¢ per $1 |
| Gini / Inequality Index | 80,374 | 0.43 |
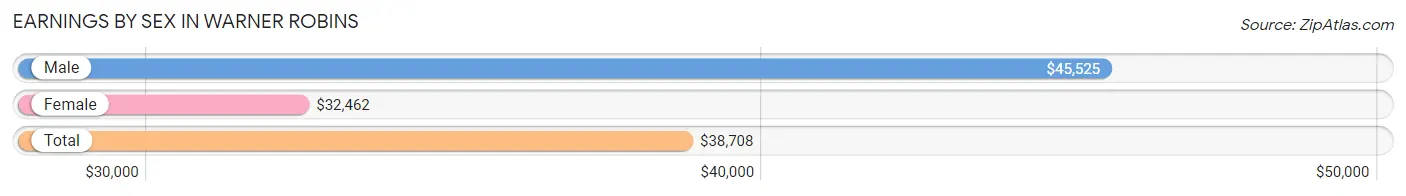
Earnings by Sex in Warner Robins
Average Earnings in Warner Robins are $38,708, $45,525 for men and $32,462 for women, a difference of 28.7%.
| Sex | Number | Average Earnings |
| Male | 21,374 (51.3%) | $45,525 |
| Female | 20,287 (48.7%) | $32,462 |
| Total | 41,661 (100.0%) | $38,708 |
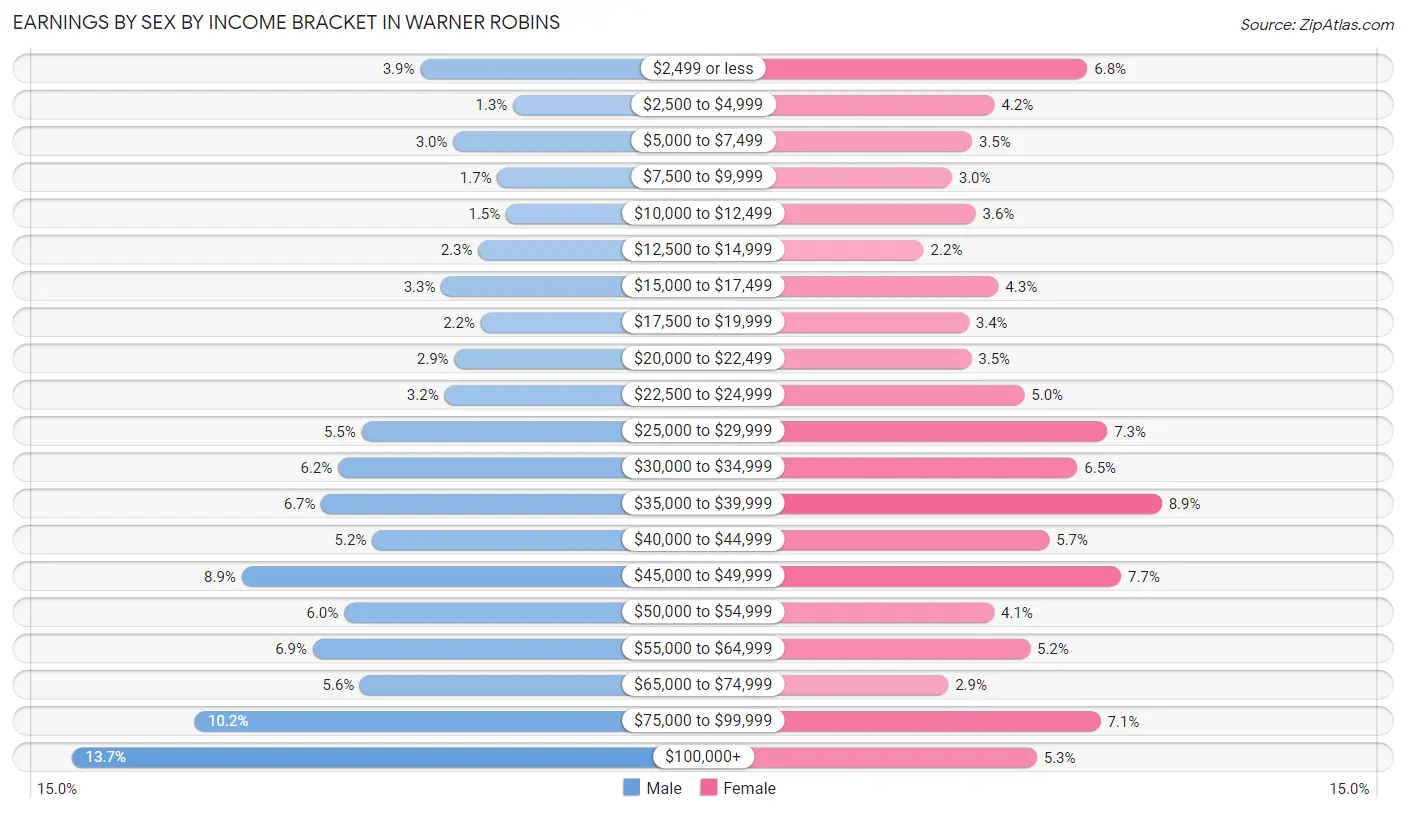
Earnings by Sex by Income Bracket in Warner Robins
The most common earnings brackets in Warner Robins are $100,000+ for men (2,917 | 13.7%) and $35,000 to $39,999 for women (1,795 | 8.8%).
| Income | Male | Female |
| $2,499 or less | 830 (3.9%) | 1,371 (6.8%) |
| $2,500 to $4,999 | 271 (1.3%) | 841 (4.2%) |
| $5,000 to $7,499 | 631 (2.9%) | 714 (3.5%) |
| $7,500 to $9,999 | 366 (1.7%) | 599 (2.9%) |
| $10,000 to $12,499 | 315 (1.5%) | 735 (3.6%) |
| $12,500 to $14,999 | 481 (2.2%) | 439 (2.2%) |
| $15,000 to $17,499 | 704 (3.3%) | 864 (4.3%) |
| $17,500 to $19,999 | 467 (2.2%) | 696 (3.4%) |
| $20,000 to $22,499 | 624 (2.9%) | 710 (3.5%) |
| $22,500 to $24,999 | 683 (3.2%) | 1,013 (5.0%) |
| $25,000 to $29,999 | 1,182 (5.5%) | 1,485 (7.3%) |
| $30,000 to $34,999 | 1,324 (6.2%) | 1,315 (6.5%) |
| $35,000 to $39,999 | 1,423 (6.7%) | 1,795 (8.8%) |
| $40,000 to $44,999 | 1,118 (5.2%) | 1,154 (5.7%) |
| $45,000 to $49,999 | 1,902 (8.9%) | 1,565 (7.7%) |
| $50,000 to $54,999 | 1,287 (6.0%) | 840 (4.1%) |
| $55,000 to $64,999 | 1,475 (6.9%) | 1,044 (5.1%) |
| $65,000 to $74,999 | 1,191 (5.6%) | 578 (2.9%) |
| $75,000 to $99,999 | 2,183 (10.2%) | 1,446 (7.1%) |
| $100,000+ | 2,917 (13.7%) | 1,083 (5.3%) |
| Total | 21,374 (100.0%) | 20,287 (100.0%) |
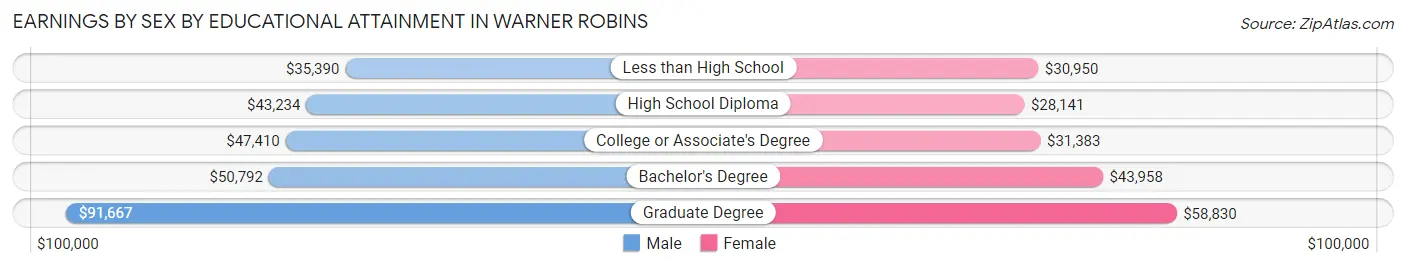
Earnings by Sex by Educational Attainment in Warner Robins
Average earnings in Warner Robins are $49,373 for men and $37,826 for women, a difference of 23.4%. Men with an educational attainment of graduate degree enjoy the highest average annual earnings of $91,667, while those with less than high school education earn the least with $35,390. Women with an educational attainment of graduate degree earn the most with the average annual earnings of $58,830, while those with high school diploma education have the smallest earnings of $28,141.
| Educational Attainment | Male Income | Female Income |
| Less than High School | $35,390 | $30,950 |
| High School Diploma | $43,234 | $28,141 |
| College or Associate's Degree | $47,410 | $31,383 |
| Bachelor's Degree | $50,792 | $43,958 |
| Graduate Degree | $91,667 | $58,830 |
| Total | $49,373 | $37,826 |
Family Income in Warner Robins
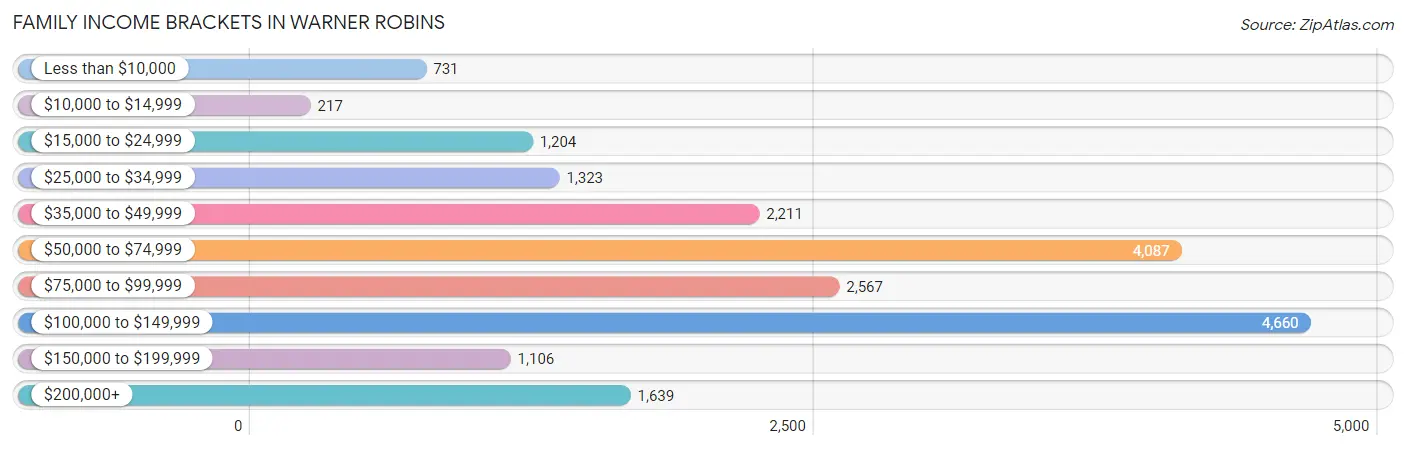
Family Income Brackets in Warner Robins
According to the Warner Robins family income data, there are 4,660 families falling into the $100,000 to $149,999 income range, which is the most common income bracket and makes up 23.6% of all families. Conversely, the $10,000 to $14,999 income bracket is the least frequent group with only 217 families (1.1%) belonging to this category.
| Income Bracket | # Families | % Families |
| Less than $10,000 | 731 | 3.7% |
| $10,000 to $14,999 | 217 | 1.1% |
| $15,000 to $24,999 | 1,204 | 6.1% |
| $25,000 to $34,999 | 1,323 | 6.7% |
| $35,000 to $49,999 | 2,211 | 11.2% |
| $50,000 to $74,999 | 4,087 | 20.7% |
| $75,000 to $99,999 | 2,567 | 13.0% |
| $100,000 to $149,999 | 4,660 | 23.6% |
| $150,000 to $199,999 | 1,106 | 5.6% |
| $200,000+ | 1,639 | 8.3% |
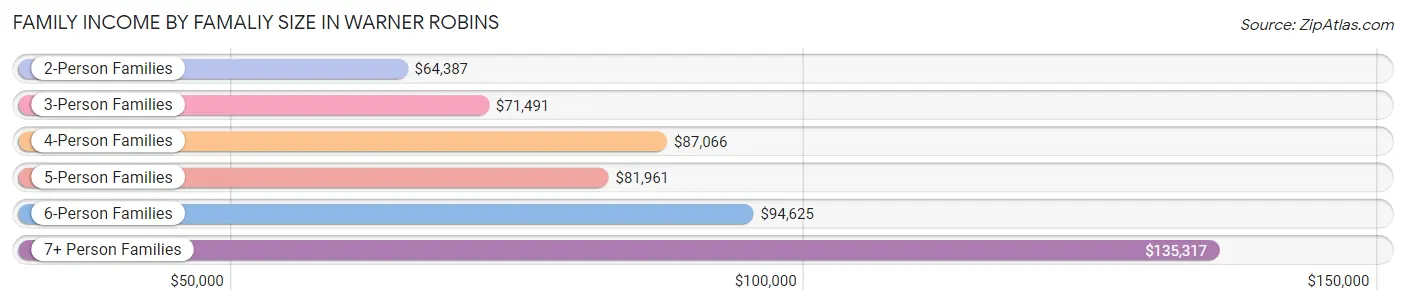
Family Income by Famaliy Size in Warner Robins
7+ person families (735 | 3.7%) account for the highest median family income in Warner Robins with $135,317 per family, while 2-person families (8,539 | 43.2%) have the highest median income of $32,194 per family member.
| Income Bracket | # Families | Median Income |
| 2-Person Families | 8,539 (43.2%) | $64,387 |
| 3-Person Families | 5,384 (27.3%) | $71,491 |
| 4-Person Families | 2,912 (14.7%) | $87,066 |
| 5-Person Families | 1,455 (7.4%) | $81,961 |
| 6-Person Families | 720 (3.6%) | $94,625 |
| 7+ Person Families | 735 (3.7%) | $135,317 |
| Total | 19,745 (100.0%) | $77,116 |
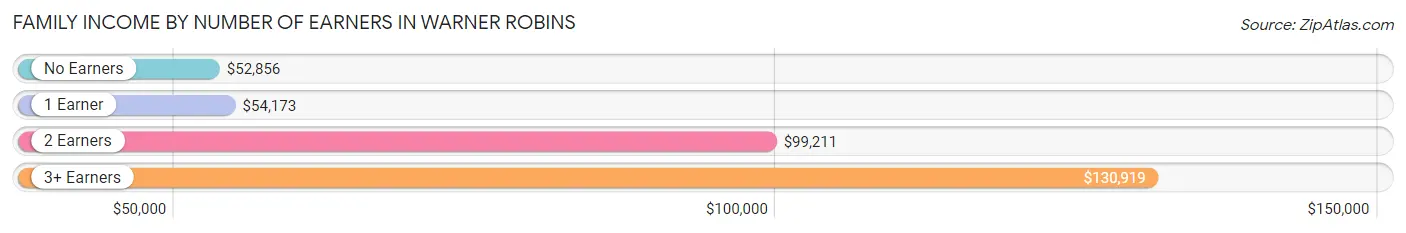
Family Income by Number of Earners in Warner Robins
The median family income in Warner Robins is $77,116, with families comprising 3+ earners (2,149) having the highest median family income of $130,919, while families with no earners (2,487) have the lowest median family income of $52,856, accounting for 10.9% and 12.6% of families, respectively.
| Number of Earners | # Families | Median Income |
| No Earners | 2,487 (12.6%) | $52,856 |
| 1 Earner | 7,864 (39.8%) | $54,173 |
| 2 Earners | 7,245 (36.7%) | $99,211 |
| 3+ Earners | 2,149 (10.9%) | $130,919 |
| Total | 19,745 (100.0%) | $77,116 |
Household Income in Warner Robins
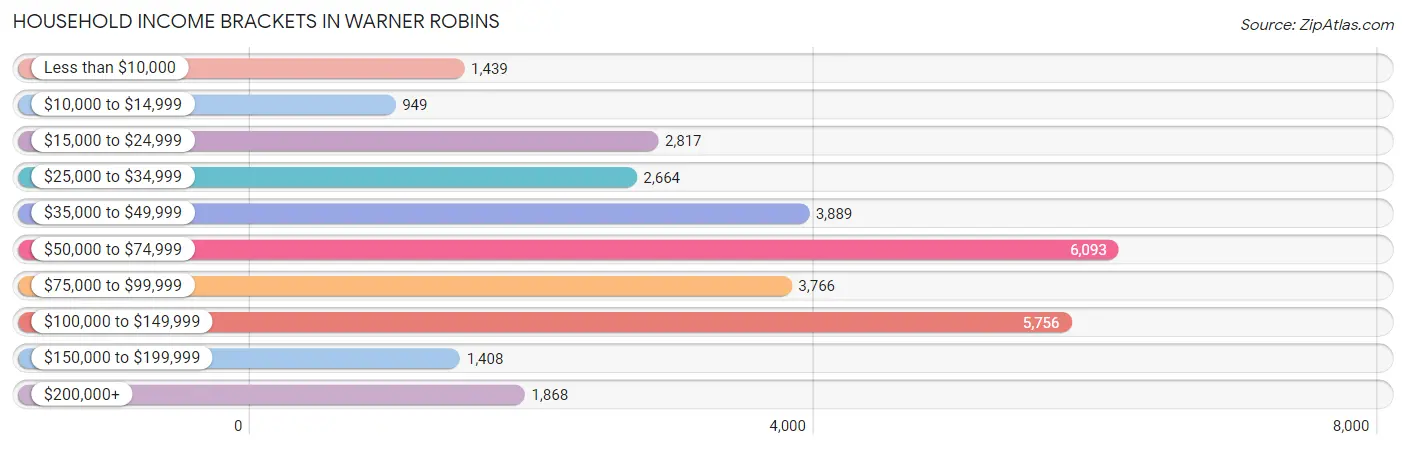
Household Income Brackets in Warner Robins
With 6,093 households falling in the category, the $50,000 to $74,999 income range is the most frequent in Warner Robins, accounting for 19.9% of all households. In contrast, only 949 households (3.1%) fall into the $10,000 to $14,999 income bracket, making it the least populous group.
| Income Bracket | # Households | % Households |
| Less than $10,000 | 1,439 | 4.7% |
| $10,000 to $14,999 | 949 | 3.1% |
| $15,000 to $24,999 | 2,817 | 9.2% |
| $25,000 to $34,999 | 2,664 | 8.7% |
| $35,000 to $49,999 | 3,889 | 12.7% |
| $50,000 to $74,999 | 6,093 | 19.9% |
| $75,000 to $99,999 | 3,766 | 12.3% |
| $100,000 to $149,999 | 5,756 | 18.8% |
| $150,000 to $199,999 | 1,408 | 4.6% |
| $200,000+ | 1,868 | 6.1% |
Household Income by Householder Age in Warner Robins
The median household income in Warner Robins is $63,678, with the highest median household income of $83,568 found in the 45 to 64 years age bracket for the primary householder. A total of 10,316 households (33.7%) fall into this category. Meanwhile, the 15 to 24 years age bracket for the primary householder has the lowest median household income of $45,141, with 1,678 households (5.5%) in this group.
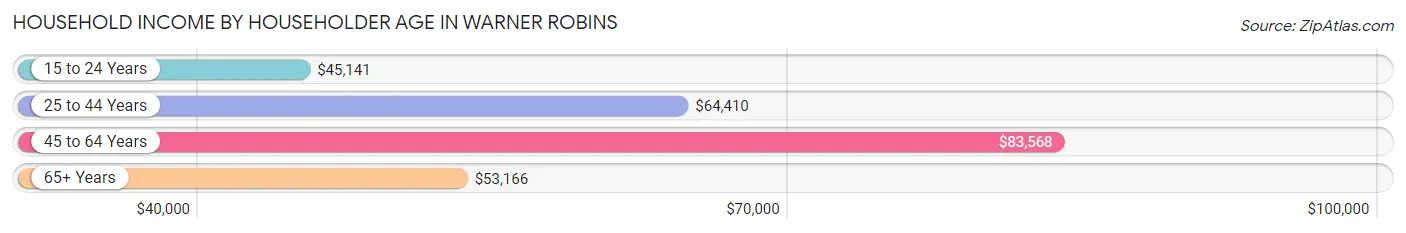
| Income Bracket | # Households | Median Income |
| 15 to 24 Years | 1,678 (5.5%) | $45,141 |
| 25 to 44 Years | 12,196 (39.8%) | $64,410 |
| 45 to 64 Years | 10,316 (33.7%) | $83,568 |
| 65+ Years | 6,429 (21.0%) | $53,166 |
| Total | 30,619 (100.0%) | $63,678 |
Poverty in Warner Robins
Income Below Poverty by Sex and Age in Warner Robins
With 11.0% poverty level for males and 11.6% for females among the residents of Warner Robins, 12 to 14 year old males and 6 to 11 year old females are the most vulnerable to poverty, with 336 males (23.6%) and 649 females (17.2%) in their respective age groups living below the poverty level.
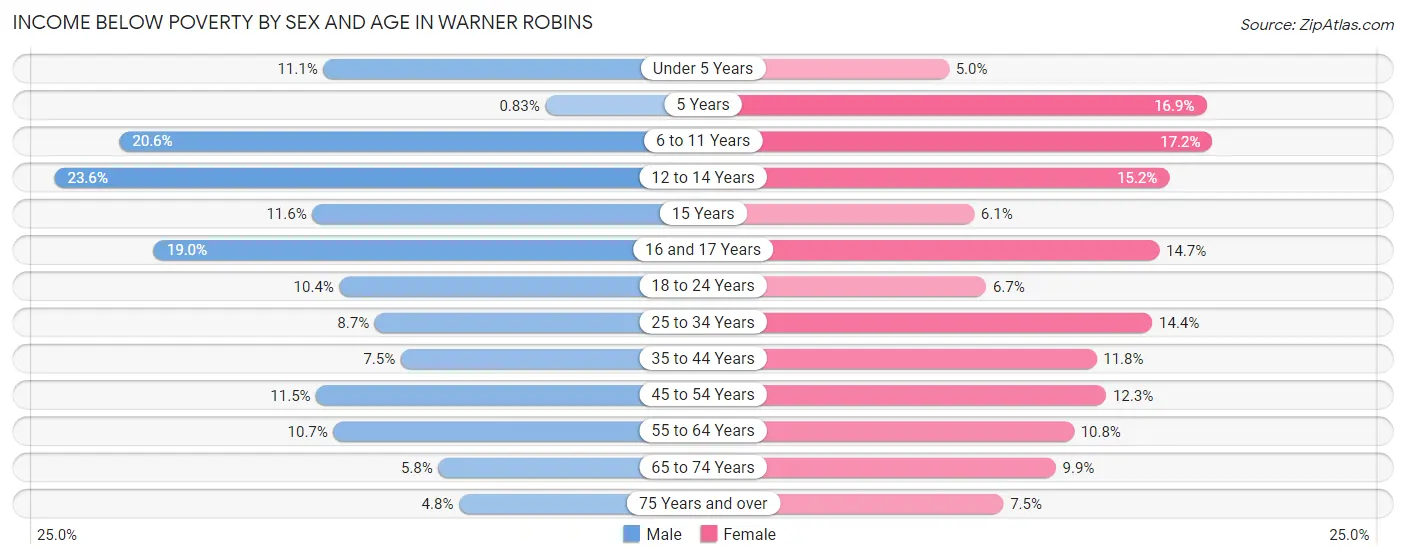
| Age Bracket | Male | Female |
| Under 5 Years | 331 (11.1%) | 156 (5.0%) |
| 5 Years | 5 (0.8%) | 80 (16.9%) |
| 6 to 11 Years | 738 (20.6%) | 649 (17.2%) |
| 12 to 14 Years | 336 (23.6%) | 252 (15.2%) |
| 15 Years | 56 (11.6%) | 33 (6.1%) |
| 16 and 17 Years | 225 (19.0%) | 195 (14.7%) |
| 18 to 24 Years | 424 (10.4%) | 234 (6.7%) |
| 25 to 34 Years | 577 (8.7%) | 1,122 (14.4%) |
| 35 to 44 Years | 375 (7.5%) | 612 (11.8%) |
| 45 to 54 Years | 507 (11.5%) | 586 (12.3%) |
| 55 to 64 Years | 420 (10.7%) | 475 (10.8%) |
| 65 to 74 Years | 141 (5.8%) | 289 (9.9%) |
| 75 Years and over | 66 (4.8%) | 180 (7.5%) |
| Total | 4,201 (11.0%) | 4,863 (11.6%) |
Income Above Poverty by Sex and Age in Warner Robins
According to the poverty statistics in Warner Robins, males aged 5 years and females aged under 5 years are the age groups that are most secure financially, with 99.2% of males and 95.0% of females in these age groups living above the poverty line.
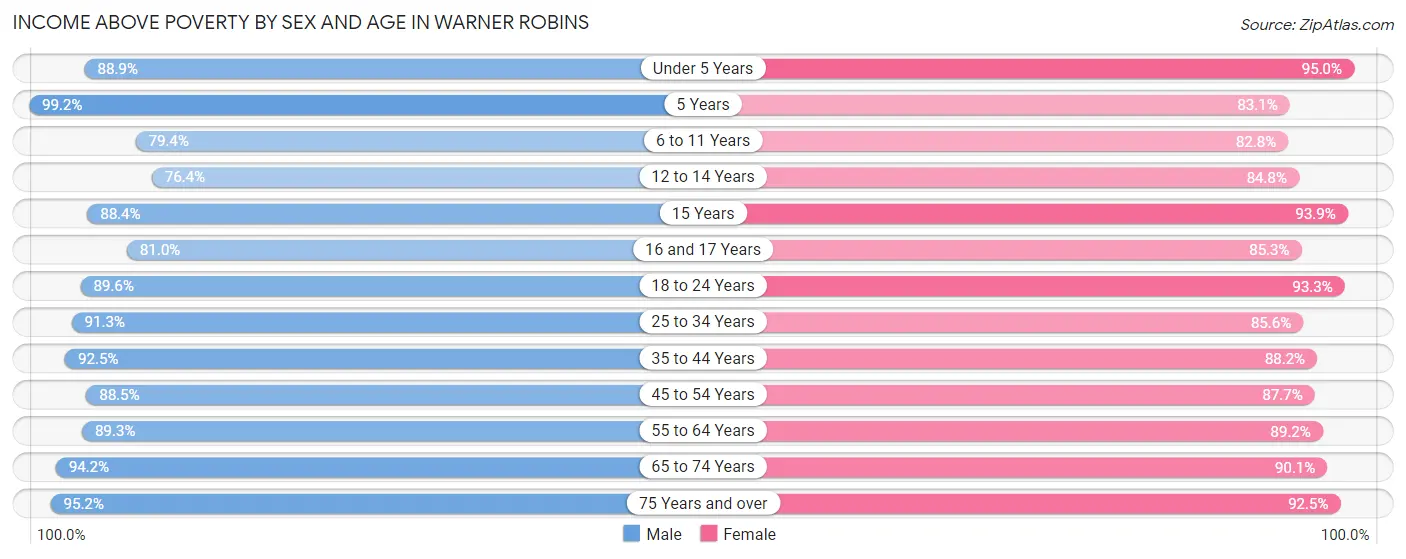
| Age Bracket | Male | Female |
| Under 5 Years | 2,644 (88.9%) | 2,992 (95.0%) |
| 5 Years | 594 (99.2%) | 393 (83.1%) |
| 6 to 11 Years | 2,844 (79.4%) | 3,127 (82.8%) |
| 12 to 14 Years | 1,087 (76.4%) | 1,407 (84.8%) |
| 15 Years | 425 (88.4%) | 505 (93.9%) |
| 16 and 17 Years | 959 (81.0%) | 1,130 (85.3%) |
| 18 to 24 Years | 3,659 (89.6%) | 3,265 (93.3%) |
| 25 to 34 Years | 6,026 (91.3%) | 6,672 (85.6%) |
| 35 to 44 Years | 4,602 (92.5%) | 4,569 (88.2%) |
| 45 to 54 Years | 3,919 (88.5%) | 4,194 (87.7%) |
| 55 to 64 Years | 3,519 (89.3%) | 3,938 (89.2%) |
| 65 to 74 Years | 2,295 (94.2%) | 2,624 (90.1%) |
| 75 Years and over | 1,301 (95.2%) | 2,223 (92.5%) |
| Total | 33,874 (89.0%) | 37,039 (88.4%) |
Income Below Poverty Among Married-Couple Families in Warner Robins
The poverty statistics for married-couple families in Warner Robins show that 3.5% or 437 of the total 12,374 families live below the poverty line. Families with 3 or 4 children have the highest poverty rate of 14.7%, comprising of 173 families. On the other hand, families with 5 or more children have the lowest poverty rate of 0.0%, which includes 0 families.
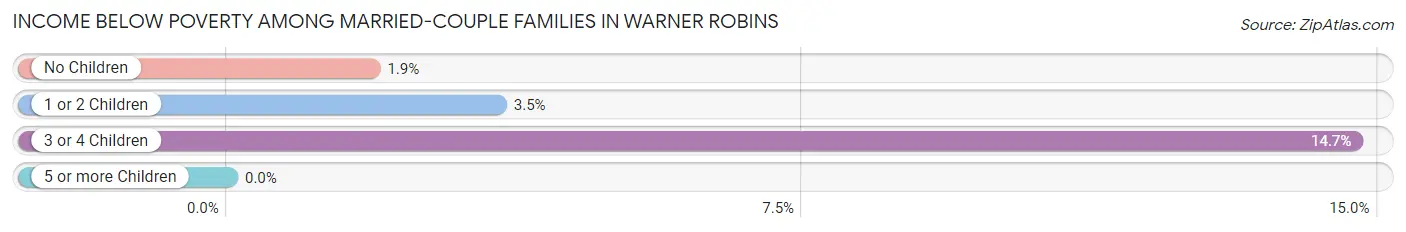
| Children | Above Poverty | Below Poverty |
| No Children | 6,485 (98.1%) | 123 (1.9%) |
| 1 or 2 Children | 3,872 (96.5%) | 141 (3.5%) |
| 3 or 4 Children | 1,005 (85.3%) | 173 (14.7%) |
| 5 or more Children | 575 (100.0%) | 0 (0.0%) |
| Total | 11,937 (96.5%) | 437 (3.5%) |
Income Below Poverty Among Single-Parent Households in Warner Robins
According to the poverty data in Warner Robins, 17.2% or 326 single-father households and 19.0% or 1,042 single-mother households are living below the poverty line. Among single-father households, those with no children have the highest poverty rate, with 155 households (31.4%) experiencing poverty. Likewise, among single-mother households, those with 5 or more children have the highest poverty rate, with 26 households (100.0%) falling below the poverty line.
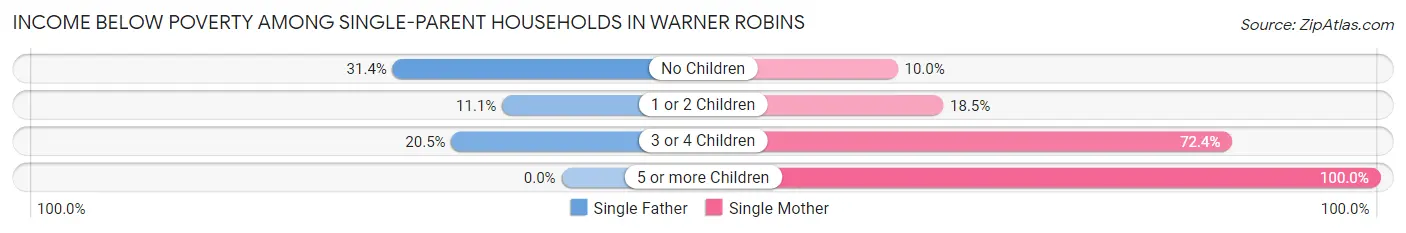
| Children | Single Father | Single Mother |
| No Children | 155 (31.4%) | 205 (10.0%) |
| 1 or 2 Children | 130 (11.1%) | 570 (18.5%) |
| 3 or 4 Children | 41 (20.5%) | 241 (72.4%) |
| 5 or more Children | 0 (0.0%) | 26 (100.0%) |
| Total | 326 (17.2%) | 1,042 (19.0%) |
Income Below Poverty Among Married-Couple vs Single-Parent Households in Warner Robins
The poverty data for Warner Robins shows that 437 of the married-couple family households (3.5%) and 1,368 of the single-parent households (18.6%) are living below the poverty level. Within the married-couple family households, those with 3 or 4 children have the highest poverty rate, with 173 households (14.7%) falling below the poverty line. Among the single-parent households, those with 5 or more children have the highest poverty rate, with 26 household (54.2%) living below poverty.
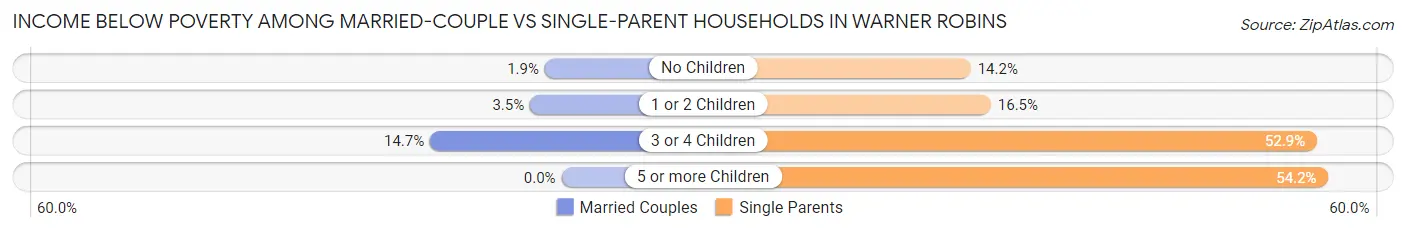
| Children | Married-Couple Families | Single-Parent Households |
| No Children | 123 (1.9%) | 360 (14.2%) |
| 1 or 2 Children | 141 (3.5%) | 700 (16.5%) |
| 3 or 4 Children | 173 (14.7%) | 282 (52.9%) |
| 5 or more Children | 0 (0.0%) | 26 (54.2%) |
| Total | 437 (3.5%) | 1,368 (18.6%) |
Race in Warner Robins
The most populous races in Warner Robins are White / Caucasian (38,087 | 47.4%), Black / African American (32,722 | 40.7%), and Two or more Races (5,659 | 7.0%).
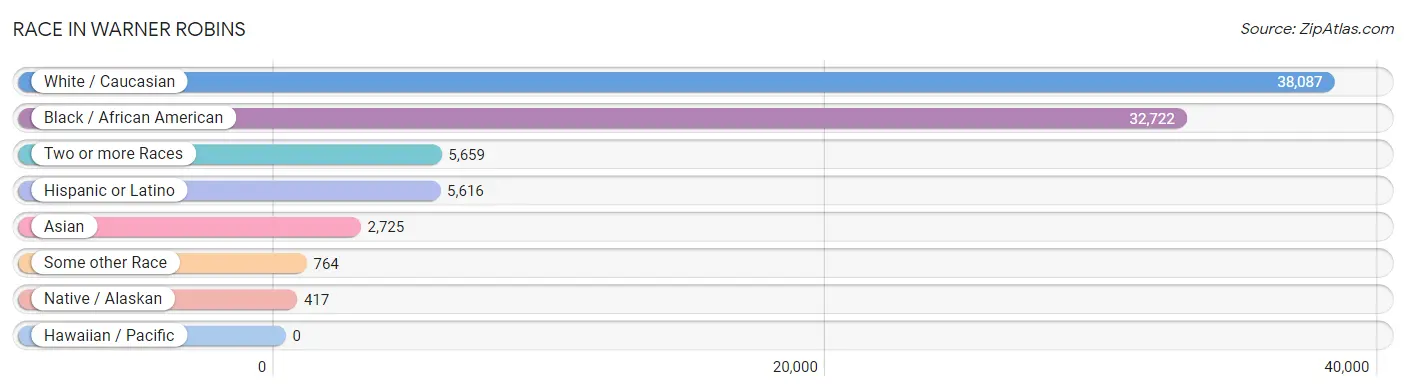
| Race | # Population | % Population |
| Asian | 2,725 | 3.4% |
| Black / African American | 32,722 | 40.7% |
| Hawaiian / Pacific | 0 | 0.0% |
| Hispanic or Latino | 5,616 | 7.0% |
| Native / Alaskan | 417 | 0.5% |
| White / Caucasian | 38,087 | 47.4% |
| Two or more Races | 5,659 | 7.0% |
| Some other Race | 764 | 0.9% |
| Total | 80,374 | 100.0% |
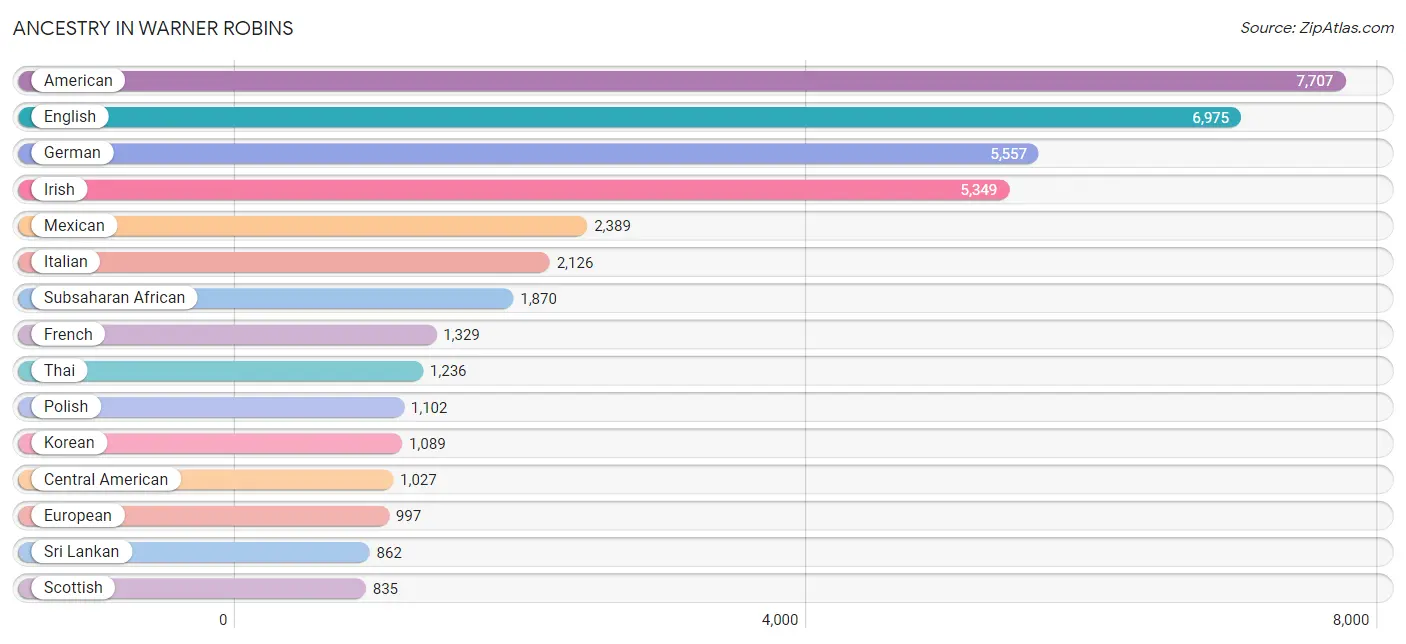
Ancestry in Warner Robins
The most populous ancestries reported in Warner Robins are American (7,707 | 9.6%), English (6,975 | 8.7%), German (5,557 | 6.9%), Irish (5,349 | 6.7%), and Mexican (2,389 | 3.0%), together accounting for 34.8% of all Warner Robins residents.
| Ancestry | # Population | % Population |
| African | 748 | 0.9% |
| Albanian | 33 | 0.0% |
| American | 7,707 | 9.6% |
| Apache | 1 | 0.0% |
| Arab | 54 | 0.1% |
| Argentinean | 206 | 0.3% |
| Armenian | 20 | 0.0% |
| Australian | 12 | 0.0% |
| Austrian | 90 | 0.1% |
| Belgian | 145 | 0.2% |
| Bhutanese | 253 | 0.3% |
| Blackfeet | 185 | 0.2% |
| Brazilian | 79 | 0.1% |
| British | 387 | 0.5% |
| British West Indian | 89 | 0.1% |
| Burmese | 361 | 0.4% |
| Cajun | 45 | 0.1% |
| Canadian | 59 | 0.1% |
| Celtic | 29 | 0.0% |
| Central American | 1,027 | 1.3% |
| Cherokee | 433 | 0.5% |
| Choctaw | 75 | 0.1% |
| Colombian | 443 | 0.5% |
| Cuban | 54 | 0.1% |
| Czech | 94 | 0.1% |
| Czechoslovakian | 14 | 0.0% |
| Dominican | 186 | 0.2% |
| Dutch | 540 | 0.7% |
| Eastern European | 207 | 0.3% |
| Ecuadorian | 5 | 0.0% |
| Egyptian | 5 | 0.0% |
| English | 6,975 | 8.7% |
| Ethiopian | 554 | 0.7% |
| European | 997 | 1.2% |
| Finnish | 35 | 0.0% |
| French | 1,329 | 1.7% |
| French Canadian | 206 | 0.3% |
| German | 5,557 | 6.9% |
| Ghanaian | 9 | 0.0% |
| Greek | 186 | 0.2% |
| Guatemalan | 415 | 0.5% |
| Haitian | 248 | 0.3% |
| Hungarian | 101 | 0.1% |
| Indian (Asian) | 166 | 0.2% |
| Indonesian | 254 | 0.3% |
| Iranian | 11 | 0.0% |
| Irish | 5,349 | 6.7% |
| Italian | 2,126 | 2.6% |
| Jamaican | 678 | 0.8% |
| Japanese | 78 | 0.1% |
| Korean | 1,089 | 1.3% |
| Lebanese | 18 | 0.0% |
| Lithuanian | 14 | 0.0% |
| Malaysian | 28 | 0.0% |
| Mexican | 2,389 | 3.0% |
| Mexican American Indian | 267 | 0.3% |
| Native Hawaiian | 47 | 0.1% |
| Navajo | 18 | 0.0% |
| Nicaraguan | 58 | 0.1% |
| Nigerian | 73 | 0.1% |
| Northern European | 102 | 0.1% |
| Norwegian | 319 | 0.4% |
| Pakistani | 36 | 0.0% |
| Panamanian | 116 | 0.1% |
| Peruvian | 54 | 0.1% |
| Polish | 1,102 | 1.4% |
| Portuguese | 89 | 0.1% |
| Puerto Rican | 790 | 1.0% |
| Romanian | 5 | 0.0% |
| Russian | 134 | 0.2% |
| Salvadoran | 438 | 0.5% |
| Samoan | 25 | 0.0% |
| Scandinavian | 49 | 0.1% |
| Scotch-Irish | 663 | 0.8% |
| Scottish | 835 | 1.0% |
| Seminole | 14 | 0.0% |
| Senegalese | 156 | 0.2% |
| Sioux | 36 | 0.0% |
| Slovak | 22 | 0.0% |
| South American | 739 | 0.9% |
| Spaniard | 236 | 0.3% |
| Spanish | 14 | 0.0% |
| Sri Lankan | 862 | 1.1% |
| Subsaharan African | 1,870 | 2.3% |
| Swedish | 436 | 0.5% |
| Swiss | 31 | 0.0% |
| Thai | 1,236 | 1.5% |
| Tongan | 101 | 0.1% |
| Trinidadian and Tobagonian | 13 | 0.0% |
| Ukrainian | 11 | 0.0% |
| Uruguayan | 31 | 0.0% |
| Welsh | 240 | 0.3% |
| West Indian | 233 | 0.3% | View All 93 Rows |
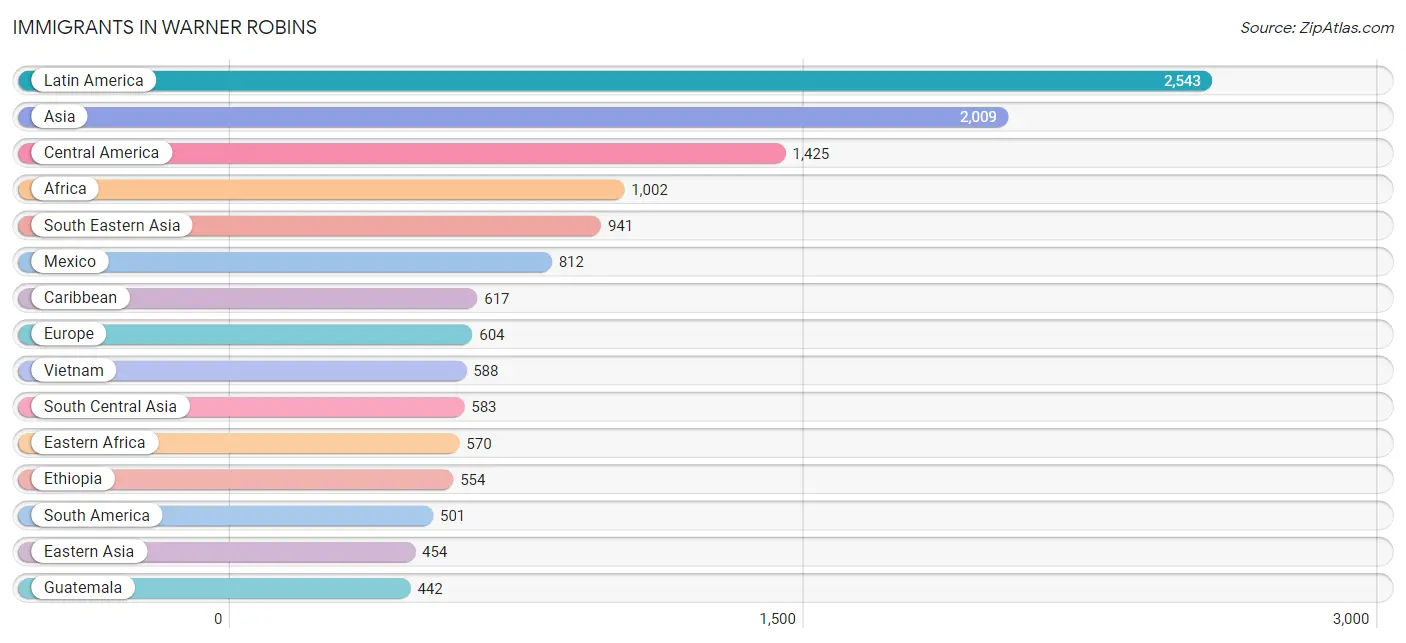
Immigrants in Warner Robins
The most numerous immigrant groups reported in Warner Robins came from Latin America (2,543 | 3.2%), Asia (2,009 | 2.5%), Central America (1,425 | 1.8%), Africa (1,002 | 1.3%), and South Eastern Asia (941 | 1.2%), together accounting for 9.9% of all Warner Robins residents.
| Immigration Origin | # Population | % Population |
| Africa | 1,002 | 1.3% |
| Albania | 33 | 0.0% |
| Asia | 2,009 | 2.5% |
| Australia | 24 | 0.0% |
| Brazil | 24 | 0.0% |
| Cameroon | 35 | 0.0% |
| Canada | 168 | 0.2% |
| Caribbean | 617 | 0.8% |
| Central America | 1,425 | 1.8% |
| China | 25 | 0.0% |
| Colombia | 403 | 0.5% |
| Congo | 30 | 0.0% |
| Cuba | 2 | 0.0% |
| Czechoslovakia | 15 | 0.0% |
| Dominican Republic | 26 | 0.0% |
| Eastern Africa | 570 | 0.7% |
| Eastern Asia | 454 | 0.6% |
| Eastern Europe | 211 | 0.3% |
| Egypt | 5 | 0.0% |
| El Salvador | 114 | 0.1% |
| England | 159 | 0.2% |
| Ethiopia | 554 | 0.7% |
| Europe | 604 | 0.7% |
| Germany | 77 | 0.1% |
| Ghana | 24 | 0.0% |
| Greece | 7 | 0.0% |
| Guatemala | 442 | 0.5% |
| Haiti | 7 | 0.0% |
| India | 333 | 0.4% |
| Iran | 11 | 0.0% |
| Jamaica | 430 | 0.5% |
| Japan | 93 | 0.1% |
| Jordan | 31 | 0.0% |
| Korea | 336 | 0.4% |
| Latin America | 2,543 | 3.2% |
| Liberia | 26 | 0.0% |
| Malaysia | 9 | 0.0% |
| Mexico | 812 | 1.0% |
| Middle Africa | 163 | 0.2% |
| Nicaragua | 7 | 0.0% |
| Northern Africa | 18 | 0.0% |
| Northern Europe | 234 | 0.3% |
| Oceania | 24 | 0.0% |
| Pakistan | 141 | 0.2% |
| Panama | 50 | 0.1% |
| Philippines | 192 | 0.2% |
| Russia | 163 | 0.2% |
| Scotland | 21 | 0.0% |
| Senegal | 50 | 0.1% |
| South Africa | 28 | 0.0% |
| South America | 501 | 0.6% |
| South Central Asia | 583 | 0.7% |
| South Eastern Asia | 941 | 1.2% |
| Southern Europe | 82 | 0.1% |
| Spain | 75 | 0.1% |
| Sri Lanka | 98 | 0.1% |
| Thailand | 78 | 0.1% |
| Trinidad and Tobago | 38 | 0.1% |
| Uruguay | 74 | 0.1% |
| Vietnam | 588 | 0.7% |
| Western Africa | 223 | 0.3% |
| Western Asia | 31 | 0.0% |
| Western Europe | 77 | 0.1% |
| Zaire | 98 | 0.1% | View All 64 Rows |
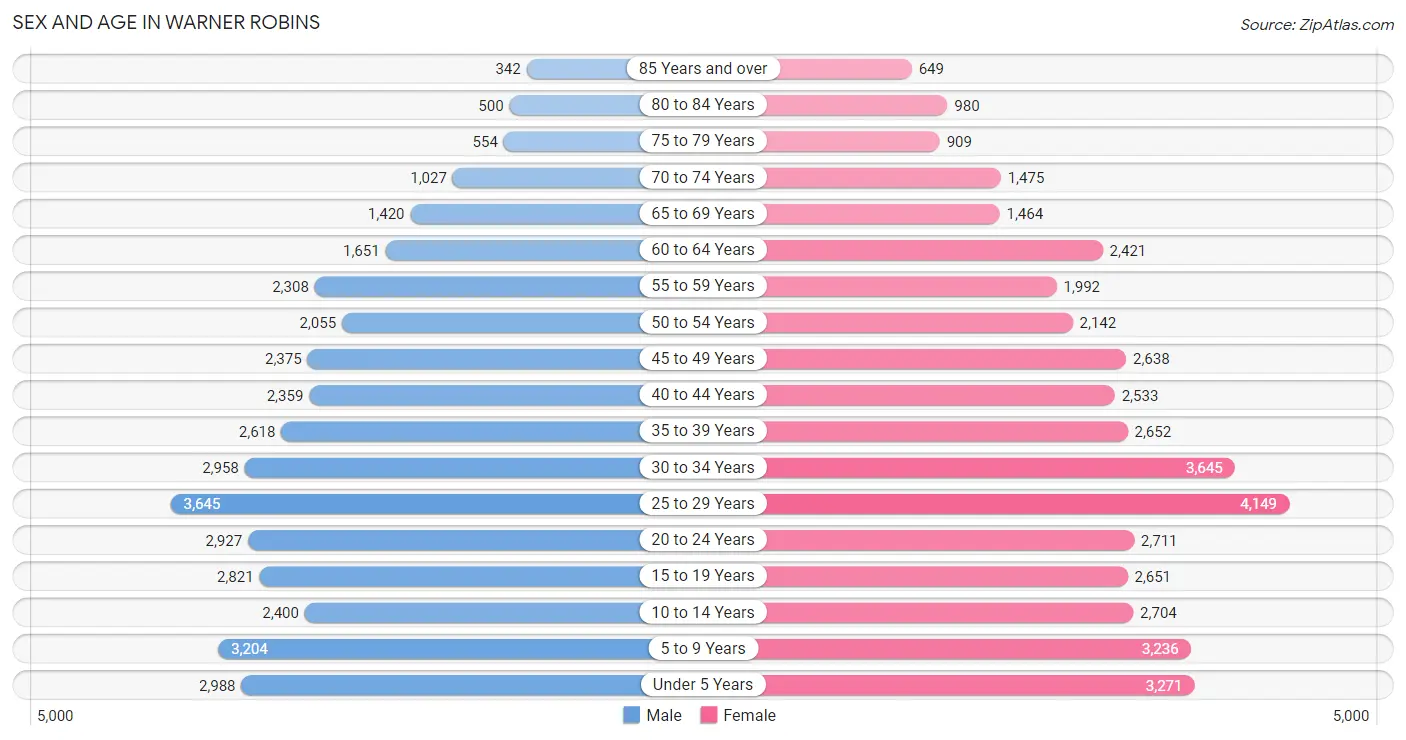
Sex and Age in Warner Robins
Sex and Age in Warner Robins
The most populous age groups in Warner Robins are 25 to 29 Years (3,645 | 9.6%) for men and 25 to 29 Years (4,149 | 9.8%) for women.
| Age Bracket | Male | Female |
| Under 5 Years | 2,988 (7.8%) | 3,271 (7.7%) |
| 5 to 9 Years | 3,204 (8.4%) | 3,236 (7.7%) |
| 10 to 14 Years | 2,400 (6.3%) | 2,704 (6.4%) |
| 15 to 19 Years | 2,821 (7.4%) | 2,651 (6.3%) |
| 20 to 24 Years | 2,927 (7.7%) | 2,711 (6.4%) |
| 25 to 29 Years | 3,645 (9.6%) | 4,149 (9.8%) |
| 30 to 34 Years | 2,958 (7.7%) | 3,645 (8.6%) |
| 35 to 39 Years | 2,618 (6.9%) | 2,652 (6.3%) |
| 40 to 44 Years | 2,359 (6.2%) | 2,533 (6.0%) |
| 45 to 49 Years | 2,375 (6.2%) | 2,638 (6.2%) |
| 50 to 54 Years | 2,055 (5.4%) | 2,142 (5.1%) |
| 55 to 59 Years | 2,308 (6.0%) | 1,992 (4.7%) |
| 60 to 64 Years | 1,651 (4.3%) | 2,421 (5.7%) |
| 65 to 69 Years | 1,420 (3.7%) | 1,464 (3.5%) |
| 70 to 74 Years | 1,027 (2.7%) | 1,475 (3.5%) |
| 75 to 79 Years | 554 (1.5%) | 909 (2.1%) |
| 80 to 84 Years | 500 (1.3%) | 980 (2.3%) |
| 85 Years and over | 342 (0.9%) | 649 (1.5%) |
| Total | 38,152 (100.0%) | 42,222 (100.0%) |
Families and Households in Warner Robins
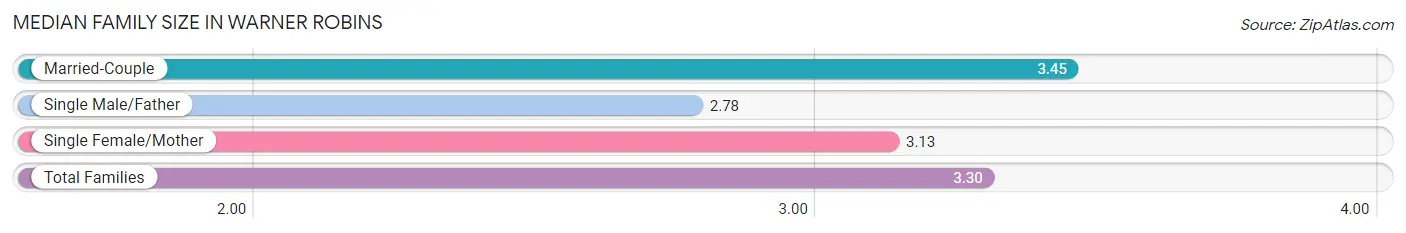
Median Family Size in Warner Robins
The median family size in Warner Robins is 3.30 persons per family, with married-couple families (12,374 | 62.7%) accounting for the largest median family size of 3.45 persons per family. On the other hand, single male/father families (1,892 | 9.6%) represent the smallest median family size with 2.78 persons per family.
| Family Type | # Families | Family Size |
| Married-Couple | 12,374 (62.7%) | 3.45 |
| Single Male/Father | 1,892 (9.6%) | 2.78 |
| Single Female/Mother | 5,479 (27.8%) | 3.13 |
| Total Families | 19,745 (100.0%) | 3.30 |
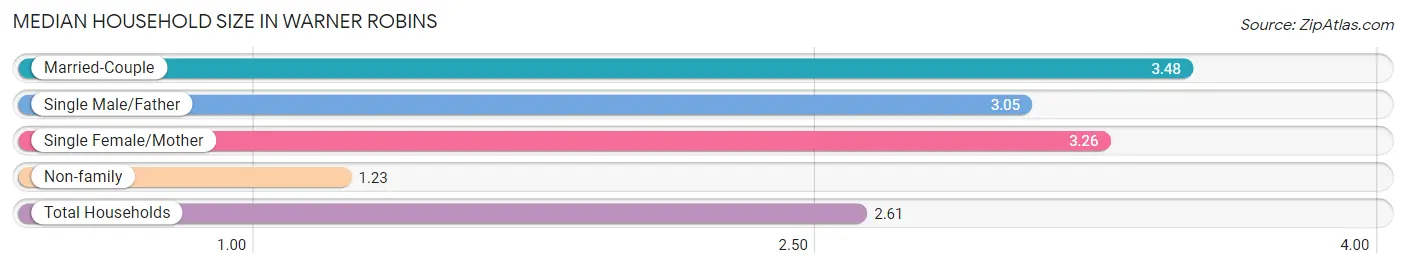
Median Household Size in Warner Robins
The median household size in Warner Robins is 2.61 persons per household, with married-couple households (12,374 | 40.4%) accounting for the largest median household size of 3.48 persons per household. non-family households (10,874 | 35.5%) represent the smallest median household size with 1.23 persons per household.
| Household Type | # Households | Household Size |
| Married-Couple | 12,374 (40.4%) | 3.48 |
| Single Male/Father | 1,892 (6.2%) | 3.05 |
| Single Female/Mother | 5,479 (17.9%) | 3.26 |
| Non-family | 10,874 (35.5%) | 1.23 |
| Total Households | 30,619 (100.0%) | 2.61 |
Household Size by Marriage Status in Warner Robins
Out of a total of 30,619 households in Warner Robins, 19,745 (64.5%) are family households, while 10,874 (35.5%) are nonfamily households. The most numerous type of family households are 2-person households, comprising 8,045, and the most common type of nonfamily households are 1-person households, comprising 9,149.
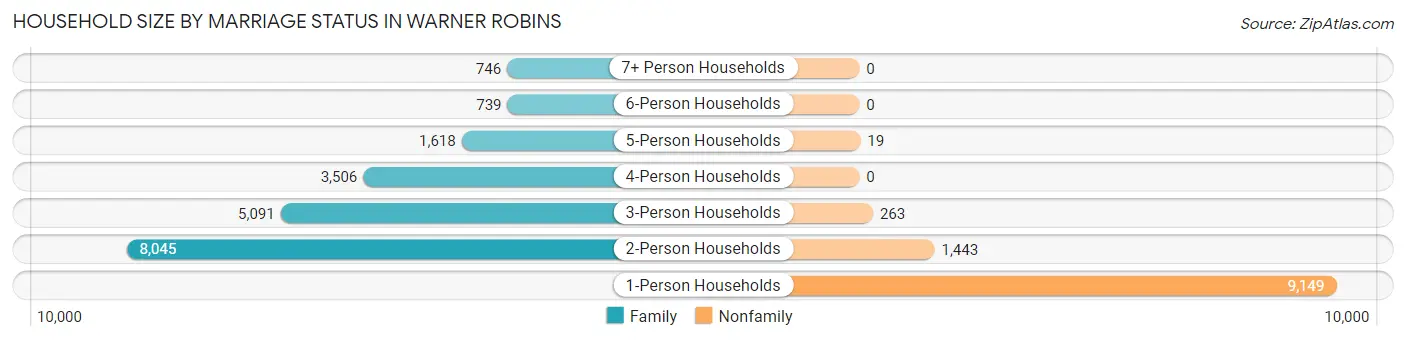
| Household Size | Family Households | Nonfamily Households |
| 1-Person Households | - | 9,149 (29.9%) |
| 2-Person Households | 8,045 (26.3%) | 1,443 (4.7%) |
| 3-Person Households | 5,091 (16.6%) | 263 (0.9%) |
| 4-Person Households | 3,506 (11.5%) | 0 (0.0%) |
| 5-Person Households | 1,618 (5.3%) | 19 (0.1%) |
| 6-Person Households | 739 (2.4%) | 0 (0.0%) |
| 7+ Person Households | 746 (2.4%) | 0 (0.0%) |
| Total | 19,745 (64.5%) | 10,874 (35.5%) |
Female Fertility in Warner Robins
Fertility by Age in Warner Robins
Average fertility rate in Warner Robins is 51.0 births per 1,000 women. Women in the age bracket of 20 to 34 years have the highest fertility rate with 93.0 births per 1,000 women. Women in the age bracket of 20 to 34 years acount for 89.9% of all women with births.
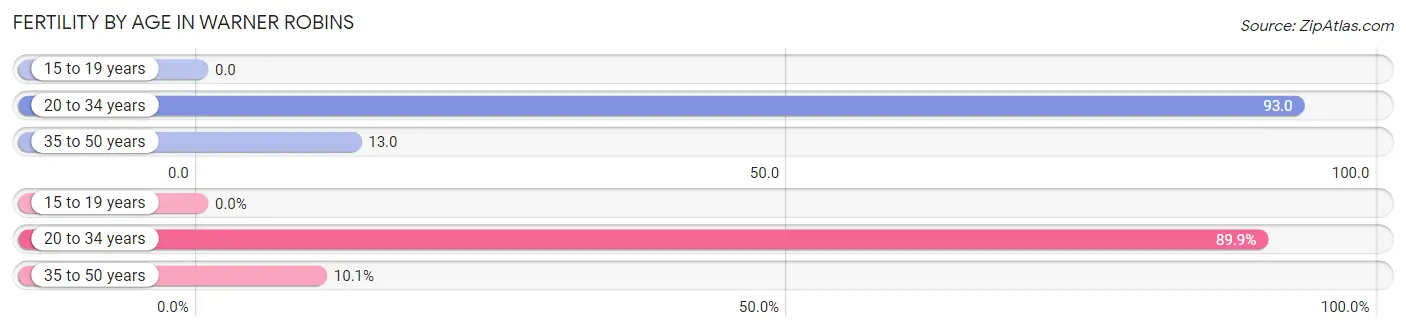
| Age Bracket | Women with Births | Births / 1,000 Women |
| 15 to 19 years | 0 (0.0%) | 0.0 |
| 20 to 34 years | 972 (89.9%) | 93.0 |
| 35 to 50 years | 109 (10.1%) | 13.0 |
| Total | 1,081 (100.0%) | 51.0 |
Fertility by Age by Marriage Status in Warner Robins
70.0% of women with births (1,081) in Warner Robins are married. The highest percentage of unmarried women with births falls into 20 to 34 years age bracket with 30.0% of them unmarried at the time of birth, while the lowest percentage of unmarried women with births belong to 35 to 50 years age bracket with 29.4% of them unmarried.
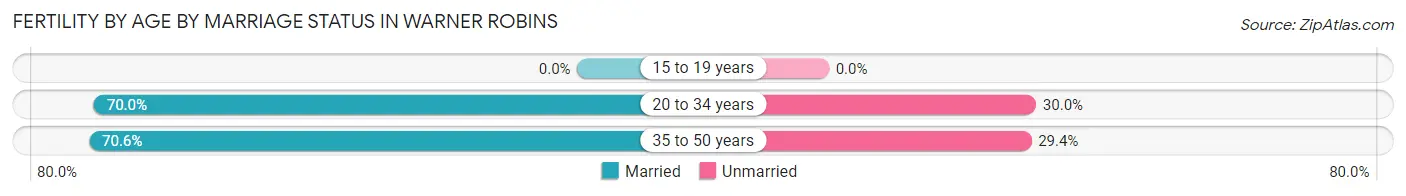
| Age Bracket | Married | Unmarried |
| 15 to 19 years | 0 (0.0%) | 0 (0.0%) |
| 20 to 34 years | 680 (70.0%) | 292 (30.0%) |
| 35 to 50 years | 77 (70.6%) | 32 (29.4%) |
| Total | 757 (70.0%) | 324 (30.0%) |
Fertility by Education in Warner Robins
Average fertility rate in Warner Robins is 51.0 births per 1,000 women. Women with the education attainment of graduate degree have the highest fertility rate of 78.0 births per 1,000 women, while women with the education attainment of bachelor's degree have the lowest fertility at 32.0 births per 1,000 women. Women with the education attainment of college or associate's degree represent 30.6% of all women with births.
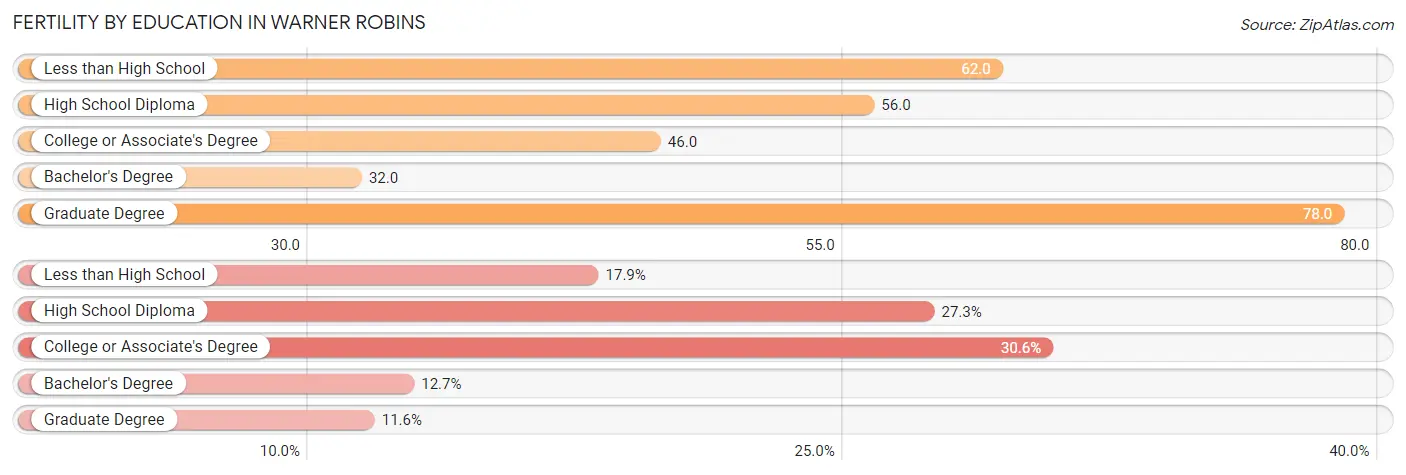
| Educational Attainment | Women with Births | Births / 1,000 Women |
| Less than High School | 193 (17.8%) | 62.0 |
| High School Diploma | 295 (27.3%) | 56.0 |
| College or Associate's Degree | 331 (30.6%) | 46.0 |
| Bachelor's Degree | 137 (12.7%) | 32.0 |
| Graduate Degree | 125 (11.6%) | 78.0 |
| Total | 1,081 (100.0%) | 51.0 |
Fertility by Education by Marriage Status in Warner Robins
30.0% of women with births in Warner Robins are unmarried. Women with the educational attainment of bachelor's degree are most likely to be married with 100.0% of them married at childbirth, while women with the educational attainment of less than high school are least likely to be married with 86.5% of them unmarried at childbirth.
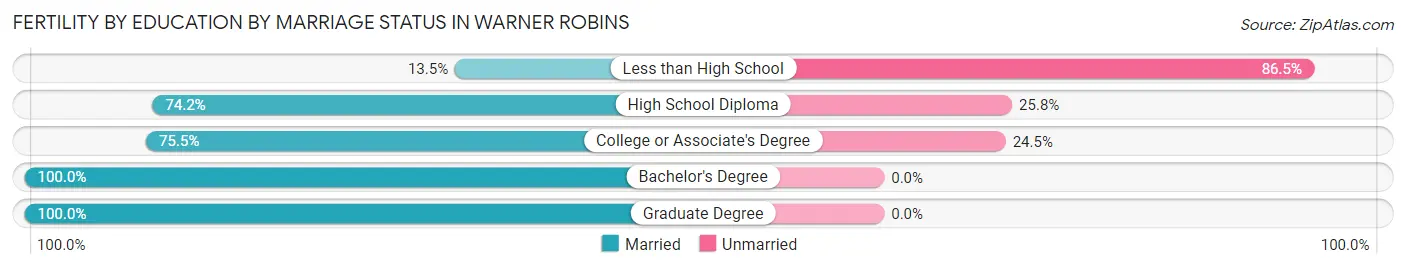
| Educational Attainment | Married | Unmarried |
| Less than High School | 26 (13.5%) | 167 (86.5%) |
| High School Diploma | 219 (74.2%) | 76 (25.8%) |
| College or Associate's Degree | 250 (75.5%) | 81 (24.5%) |
| Bachelor's Degree | 137 (100.0%) | 0 (0.0%) |
| Graduate Degree | 125 (100.0%) | 0 (0.0%) |
| Total | 757 (70.0%) | 324 (30.0%) |
Employment Characteristics in Warner Robins
Employment by Class of Employer in Warner Robins
Among the 38,339 employed individuals in Warner Robins, private company employees (22,957 | 59.9%), federal government employees (6,460 | 16.9%), and local government employees (2,868 | 7.5%) make up the most common classes of employment.
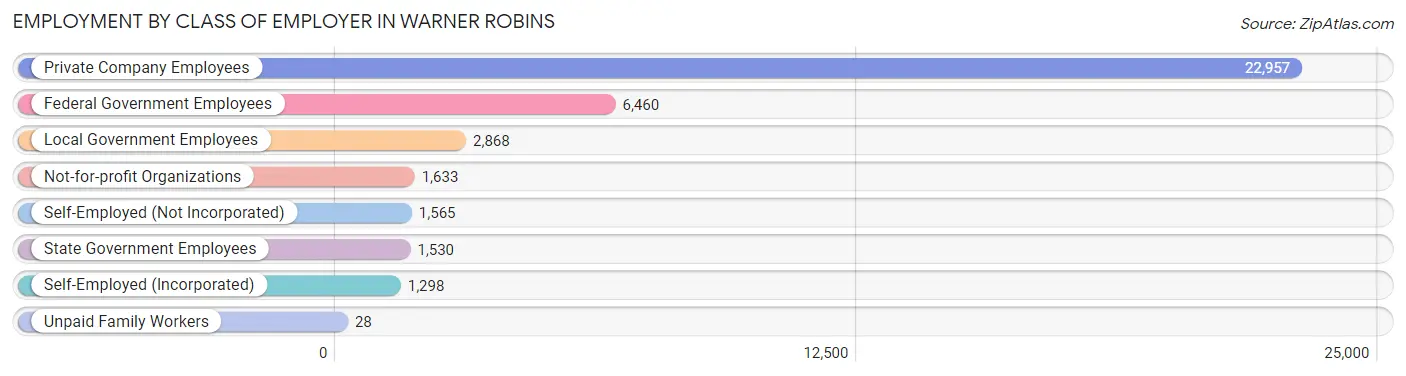
| Employer Class | # Employees | % Employees |
| Private Company Employees | 22,957 | 59.9% |
| Self-Employed (Incorporated) | 1,298 | 3.4% |
| Self-Employed (Not Incorporated) | 1,565 | 4.1% |
| Not-for-profit Organizations | 1,633 | 4.3% |
| Local Government Employees | 2,868 | 7.5% |
| State Government Employees | 1,530 | 4.0% |
| Federal Government Employees | 6,460 | 16.9% |
| Unpaid Family Workers | 28 | 0.1% |
| Total | 38,339 | 100.0% |
Employment Status by Age in Warner Robins
According to the labor force statistics for Warner Robins, out of the total population over 16 years of age (61,552), 67.6% or 41,609 individuals are in the labor force, with 6.5% or 2,705 of them unemployed. The age group with the highest labor force participation rate is 35 to 44 years, with 85.9% or 8,729 individuals in the labor force. Within the labor force, the 75 years and over age range has the highest percentage of unemployed individuals, with 46.2% or 60 of them being unemployed.
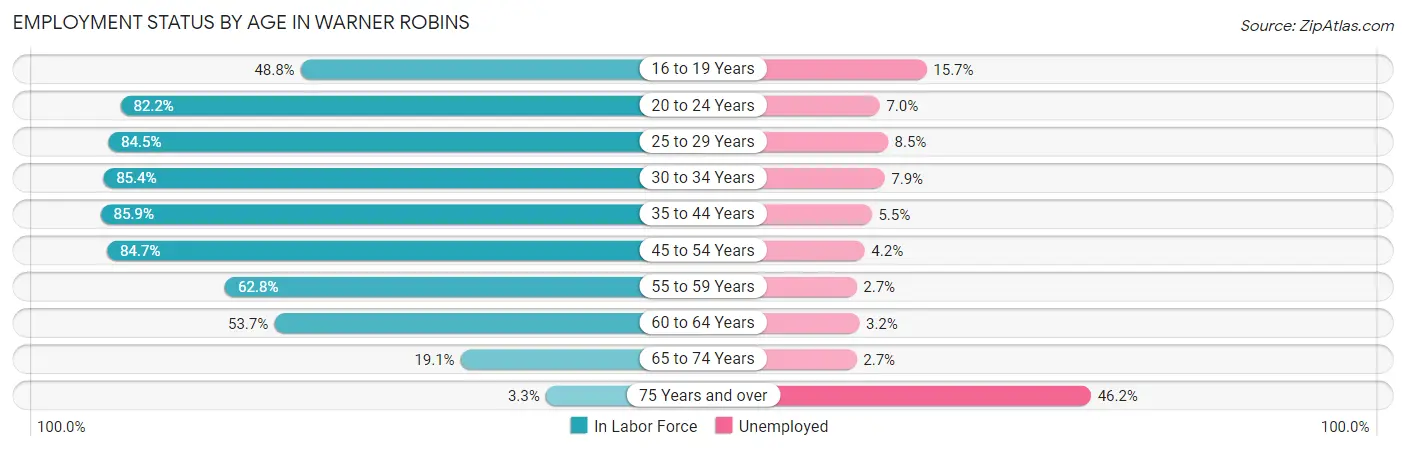
| Age Bracket | In Labor Force | Unemployed |
| 16 to 19 Years | 2,173 (48.8%) | 341 (15.7%) |
| 20 to 24 Years | 4,634 (82.2%) | 324 (7.0%) |
| 25 to 29 Years | 6,586 (84.5%) | 560 (8.5%) |
| 30 to 34 Years | 5,639 (85.4%) | 445 (7.9%) |
| 35 to 44 Years | 8,729 (85.9%) | 480 (5.5%) |
| 45 to 54 Years | 7,801 (84.7%) | 328 (4.2%) |
| 55 to 59 Years | 2,700 (62.8%) | 73 (2.7%) |
| 60 to 64 Years | 2,187 (53.7%) | 70 (3.2%) |
| 65 to 74 Years | 1,029 (19.1%) | 28 (2.7%) |
| 75 Years and over | 130 (3.3%) | 60 (46.2%) |
| Total | 41,609 (67.6%) | 2,705 (6.5%) |
Employment Status by Educational Attainment in Warner Robins
According to labor force statistics for Warner Robins, 79.8% of individuals (33,629) out of the total population between 25 and 64 years of age (42,141) are in the labor force, with 5.7% or 1,917 of them being unemployed. The group with the highest labor force participation rate are those with the educational attainment of bachelor's degree or higher, with 91.7% or 12,325 individuals in the labor force. Within the labor force, individuals with high school diploma education have the highest percentage of unemployment, with 10.6% or 835 of them being unemployed.
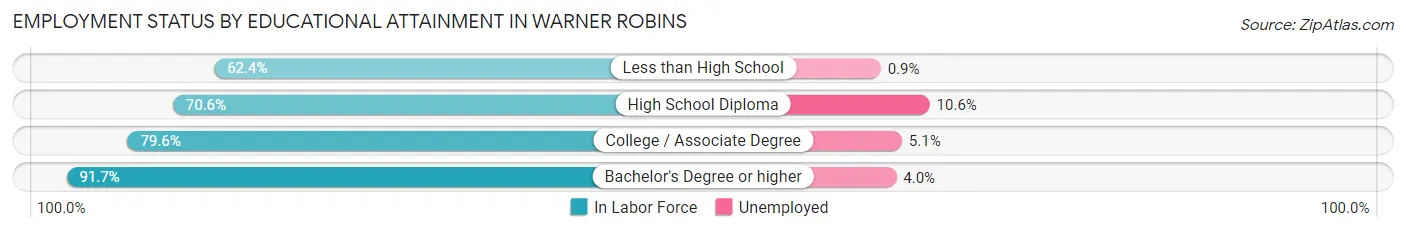
| Educational Attainment | In Labor Force | Unemployed |
| Less than High School | 1,893 (62.4%) | 27 (0.9%) |
| High School Diploma | 7,882 (70.6%) | 1,183 (10.6%) |
| College / Associate Degree | 11,544 (79.6%) | 740 (5.1%) |
| Bachelor's Degree or higher | 12,325 (91.7%) | 538 (4.0%) |
| Total | 33,629 (79.8%) | 2,402 (5.7%) |
Employment Occupations by Sex in Warner Robins
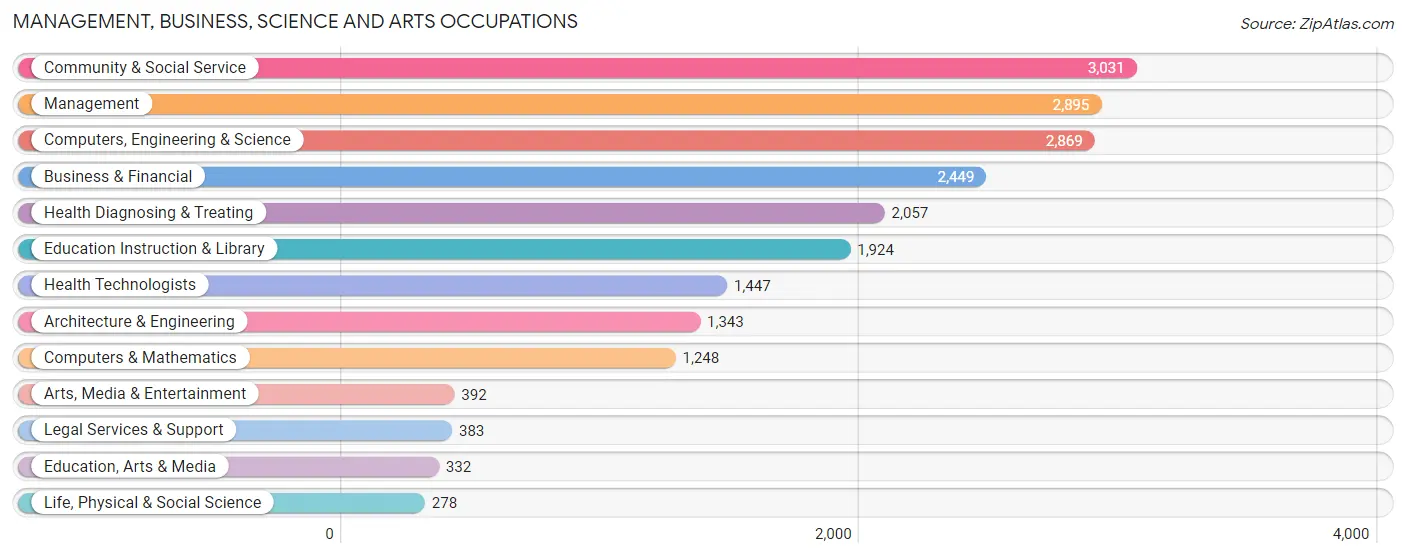
Management, Business, Science and Arts Occupations
The most common Management, Business, Science and Arts occupations in Warner Robins are Community & Social Service (3,031 | 8.2%), Management (2,895 | 7.8%), Computers, Engineering & Science (2,869 | 7.7%), Business & Financial (2,449 | 6.6%), and Health Diagnosing & Treating (2,057 | 5.6%).
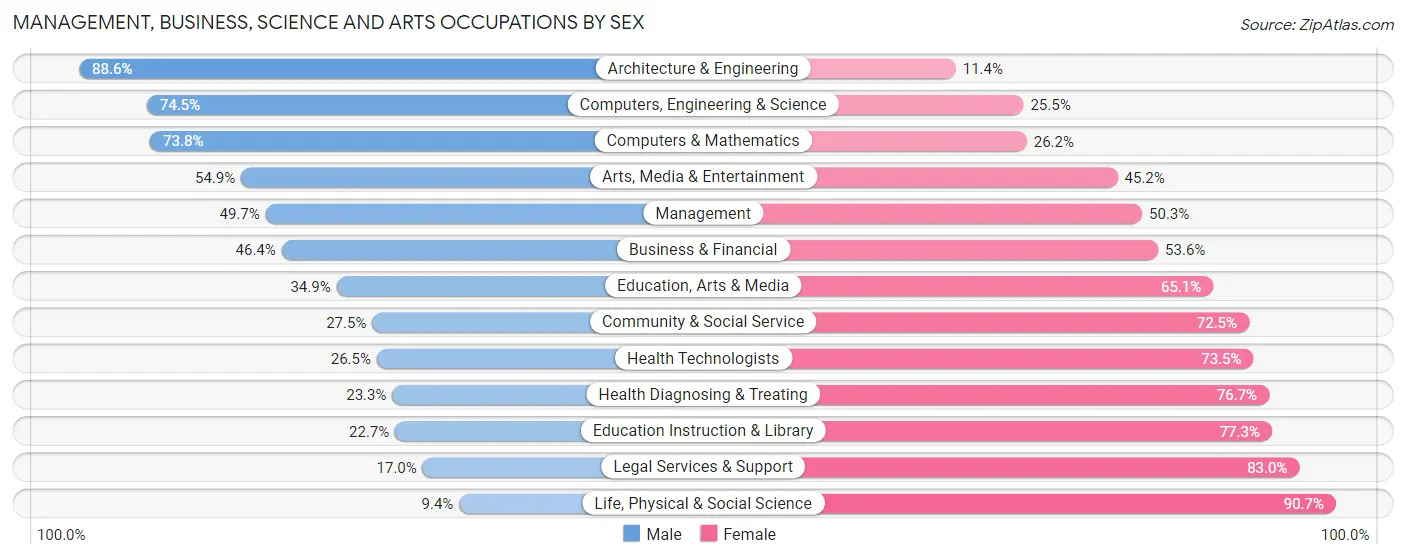
Management, Business, Science and Arts Occupations by Sex
Within the Management, Business, Science and Arts occupations in Warner Robins, the most male-oriented occupations are Architecture & Engineering (88.6%), Computers, Engineering & Science (74.5%), and Computers & Mathematics (73.8%), while the most female-oriented occupations are Life, Physical & Social Science (90.6%), Legal Services & Support (83.0%), and Education Instruction & Library (77.3%).
| Occupation | Male | Female |
| Management | 1,440 (49.7%) | 1,455 (50.3%) |
| Business & Financial | 1,136 (46.4%) | 1,313 (53.6%) |
| Computers, Engineering & Science | 2,137 (74.5%) | 732 (25.5%) |
| Computers & Mathematics | 921 (73.8%) | 327 (26.2%) |
| Architecture & Engineering | 1,190 (88.6%) | 153 (11.4%) |
| Life, Physical & Social Science | 26 (9.3%) | 252 (90.6%) |
| Community & Social Service | 833 (27.5%) | 2,198 (72.5%) |
| Education, Arts & Media | 116 (34.9%) | 216 (65.1%) |
| Legal Services & Support | 65 (17.0%) | 318 (83.0%) |
| Education Instruction & Library | 437 (22.7%) | 1,487 (77.3%) |
| Arts, Media & Entertainment | 215 (54.8%) | 177 (45.2%) |
| Health Diagnosing & Treating | 479 (23.3%) | 1,578 (76.7%) |
| Health Technologists | 384 (26.5%) | 1,063 (73.5%) |
| Total (Category) | 6,025 (45.3%) | 7,276 (54.7%) |
| Total (Overall) | 18,827 (50.8%) | 18,220 (49.2%) |
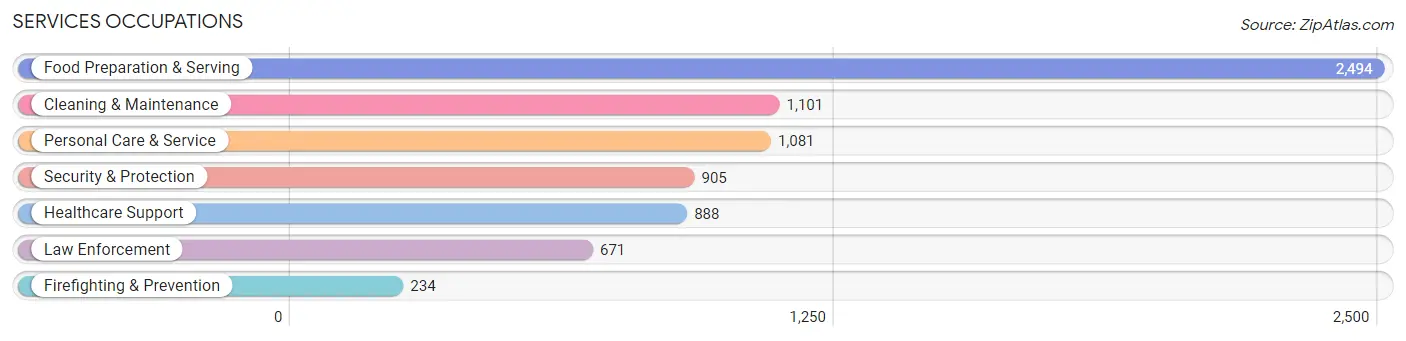
Services Occupations
The most common Services occupations in Warner Robins are Food Preparation & Serving (2,494 | 6.7%), Cleaning & Maintenance (1,101 | 3.0%), Personal Care & Service (1,081 | 2.9%), Security & Protection (905 | 2.4%), and Healthcare Support (888 | 2.4%).
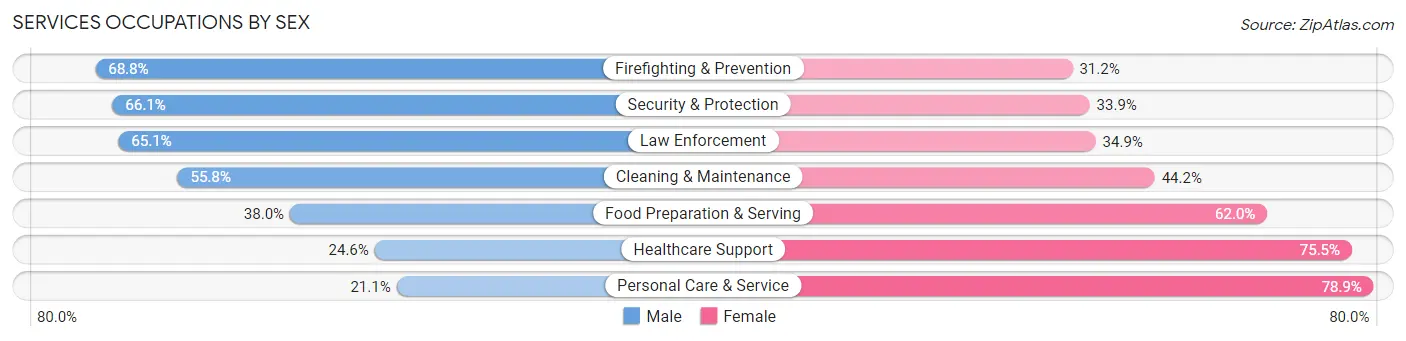
Services Occupations by Sex
Within the Services occupations in Warner Robins, the most male-oriented occupations are Firefighting & Prevention (68.8%), Security & Protection (66.1%), and Law Enforcement (65.1%), while the most female-oriented occupations are Personal Care & Service (78.9%), Healthcare Support (75.4%), and Food Preparation & Serving (62.0%).
| Occupation | Male | Female |
| Healthcare Support | 218 (24.5%) | 670 (75.4%) |
| Security & Protection | 598 (66.1%) | 307 (33.9%) |
| Firefighting & Prevention | 161 (68.8%) | 73 (31.2%) |
| Law Enforcement | 437 (65.1%) | 234 (34.9%) |
| Food Preparation & Serving | 947 (38.0%) | 1,547 (62.0%) |
| Cleaning & Maintenance | 614 (55.8%) | 487 (44.2%) |
| Personal Care & Service | 228 (21.1%) | 853 (78.9%) |
| Total (Category) | 2,605 (40.3%) | 3,864 (59.7%) |
| Total (Overall) | 18,827 (50.8%) | 18,220 (49.2%) |
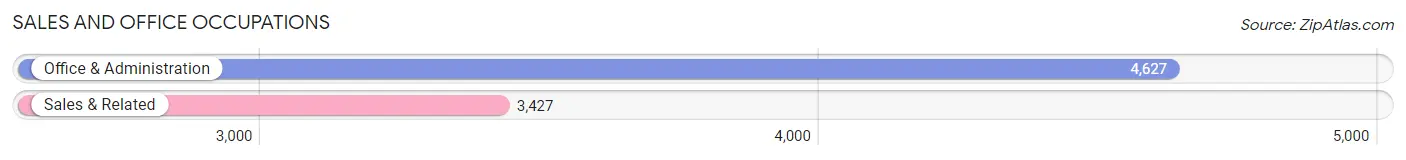
Sales and Office Occupations
The most common Sales and Office occupations in Warner Robins are Office & Administration (4,627 | 12.5%), and Sales & Related (3,427 | 9.2%).
Sales and Office Occupations by Sex
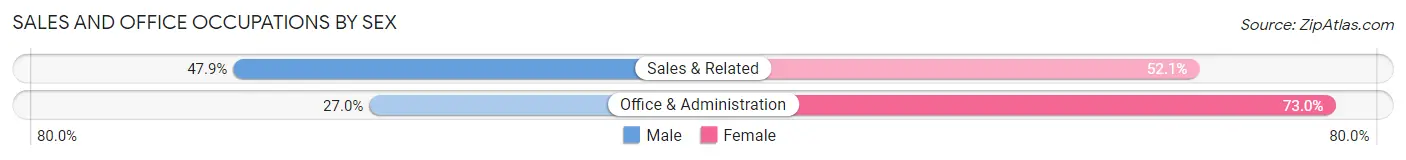
| Occupation | Male | Female |
| Sales & Related | 1,642 (47.9%) | 1,785 (52.1%) |
| Office & Administration | 1,249 (27.0%) | 3,378 (73.0%) |
| Total (Category) | 2,891 (35.9%) | 5,163 (64.1%) |
| Total (Overall) | 18,827 (50.8%) | 18,220 (49.2%) |
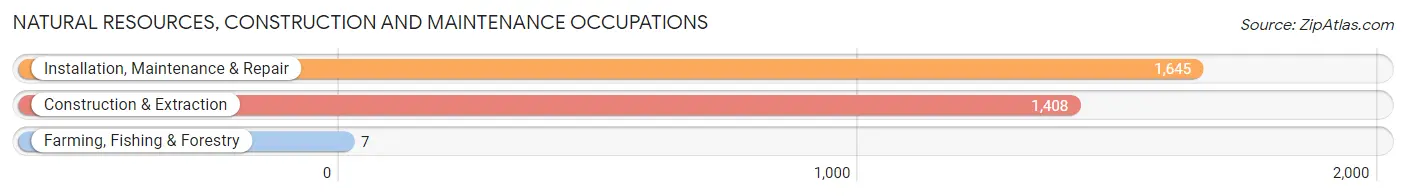
Natural Resources, Construction and Maintenance Occupations
The most common Natural Resources, Construction and Maintenance occupations in Warner Robins are Installation, Maintenance & Repair (1,645 | 4.4%), Construction & Extraction (1,408 | 3.8%), and Farming, Fishing & Forestry (7 | 0.0%).
Natural Resources, Construction and Maintenance Occupations by Sex
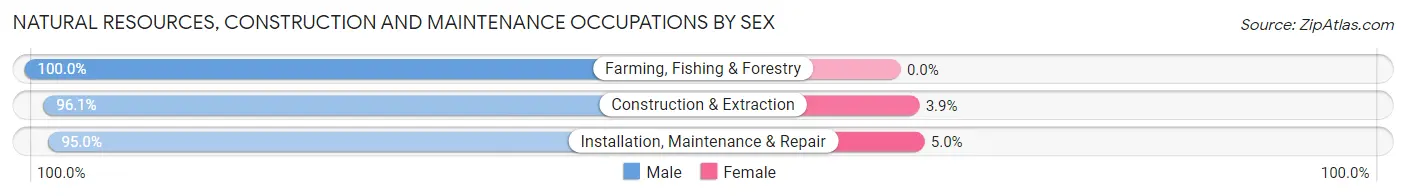
| Occupation | Male | Female |
| Farming, Fishing & Forestry | 7 (100.0%) | 0 (0.0%) |
| Construction & Extraction | 1,353 (96.1%) | 55 (3.9%) |
| Installation, Maintenance & Repair | 1,563 (95.0%) | 82 (5.0%) |
| Total (Category) | 2,923 (95.5%) | 137 (4.5%) |
| Total (Overall) | 18,827 (50.8%) | 18,220 (49.2%) |
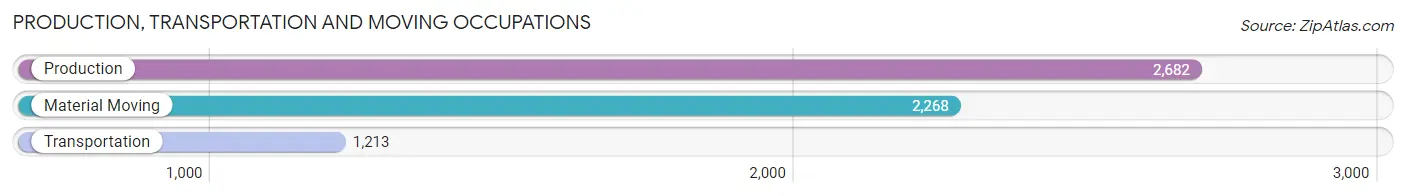
Production, Transportation and Moving Occupations
The most common Production, Transportation and Moving occupations in Warner Robins are Production (2,682 | 7.2%), Material Moving (2,268 | 6.1%), and Transportation (1,213 | 3.3%).
Production, Transportation and Moving Occupations by Sex
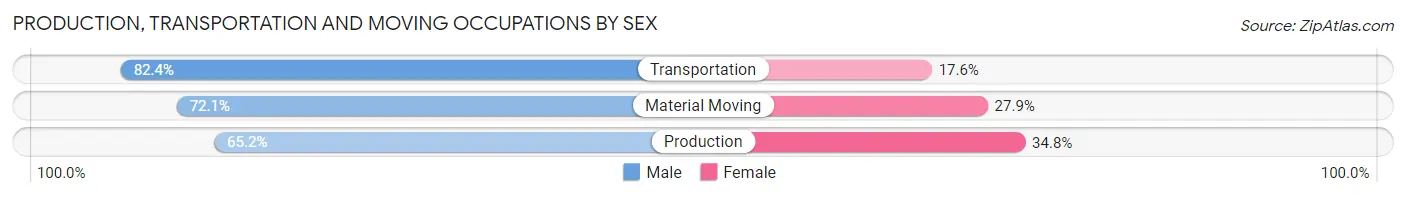
| Occupation | Male | Female |
| Production | 1,749 (65.2%) | 933 (34.8%) |
| Transportation | 999 (82.4%) | 214 (17.6%) |
| Material Moving | 1,635 (72.1%) | 633 (27.9%) |
| Total (Category) | 4,383 (71.1%) | 1,780 (28.9%) |
| Total (Overall) | 18,827 (50.8%) | 18,220 (49.2%) |
Employment Industries by Sex in Warner Robins
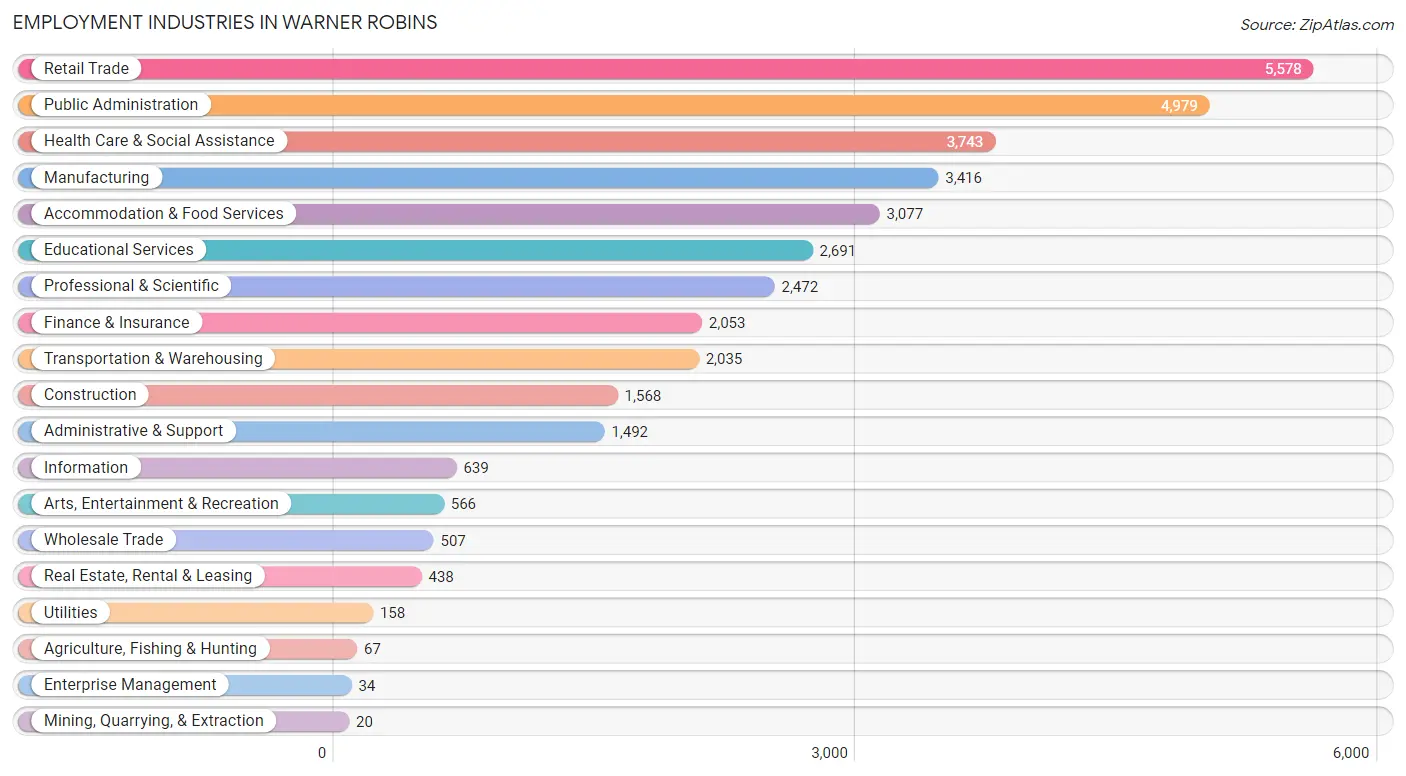
Employment Industries in Warner Robins
The major employment industries in Warner Robins include Retail Trade (5,578 | 15.1%), Public Administration (4,979 | 13.4%), Health Care & Social Assistance (3,743 | 10.1%), Manufacturing (3,416 | 9.2%), and Accommodation & Food Services (3,077 | 8.3%).
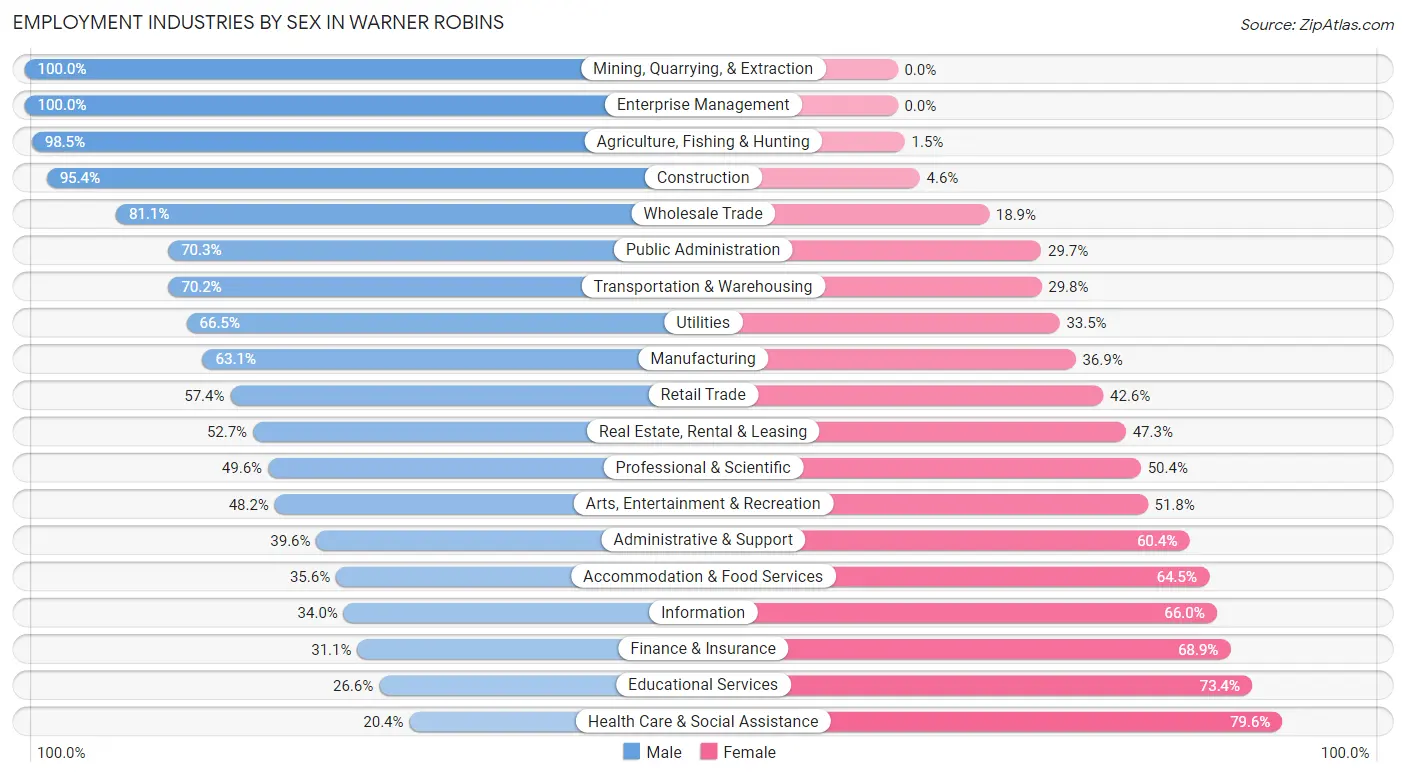
Employment Industries by Sex in Warner Robins
The Warner Robins industries that see more men than women are Mining, Quarrying, & Extraction (100.0%), Enterprise Management (100.0%), and Agriculture, Fishing & Hunting (98.5%), whereas the industries that tend to have a higher number of women are Health Care & Social Assistance (79.6%), Educational Services (73.4%), and Finance & Insurance (68.9%).
| Industry | Male | Female |
| Agriculture, Fishing & Hunting | 66 (98.5%) | 1 (1.5%) |
| Mining, Quarrying, & Extraction | 20 (100.0%) | 0 (0.0%) |
| Construction | 1,496 (95.4%) | 72 (4.6%) |
| Manufacturing | 2,157 (63.1%) | 1,259 (36.9%) |
| Wholesale Trade | 411 (81.1%) | 96 (18.9%) |
| Retail Trade | 3,203 (57.4%) | 2,375 (42.6%) |
| Transportation & Warehousing | 1,429 (70.2%) | 606 (29.8%) |
| Utilities | 105 (66.5%) | 53 (33.5%) |
| Information | 217 (34.0%) | 422 (66.0%) |
| Finance & Insurance | 639 (31.1%) | 1,414 (68.9%) |
| Real Estate, Rental & Leasing | 231 (52.7%) | 207 (47.3%) |
| Professional & Scientific | 1,227 (49.6%) | 1,245 (50.4%) |
| Enterprise Management | 34 (100.0%) | 0 (0.0%) |
| Administrative & Support | 591 (39.6%) | 901 (60.4%) |
| Educational Services | 717 (26.6%) | 1,974 (73.4%) |
| Health Care & Social Assistance | 762 (20.4%) | 2,981 (79.6%) |
| Arts, Entertainment & Recreation | 273 (48.2%) | 293 (51.8%) |
| Accommodation & Food Services | 1,094 (35.5%) | 1,983 (64.4%) |
| Public Administration | 3,498 (70.3%) | 1,481 (29.7%) |
| Total | 18,827 (50.8%) | 18,220 (49.2%) |
Education in Warner Robins
School Enrollment in Warner Robins
The most common levels of schooling among the 22,439 students in Warner Robins are college / undergraduate (4,903 | 21.8%), elementary school (4,612 | 20.5%), and middle school (4,386 | 19.6%).
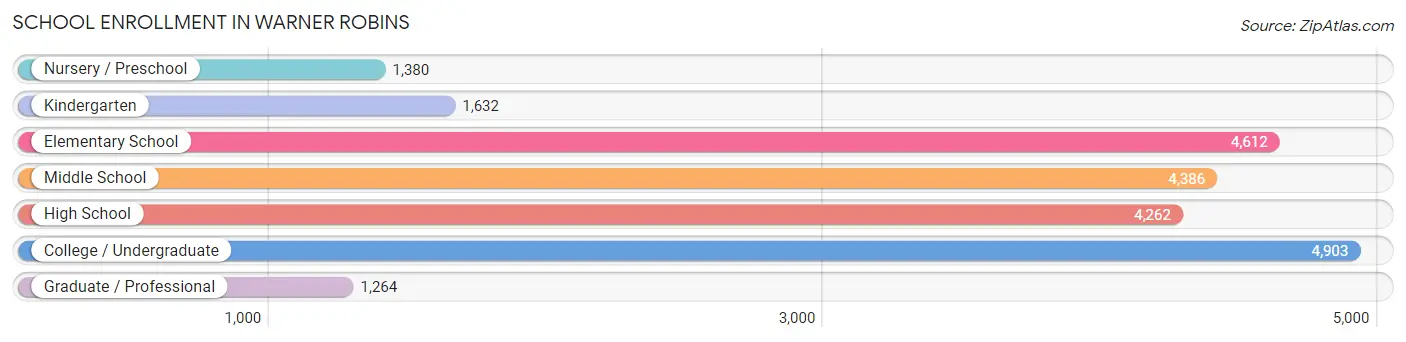
| School Level | # Students | % Students |
| Nursery / Preschool | 1,380 | 6.1% |
| Kindergarten | 1,632 | 7.3% |
| Elementary School | 4,612 | 20.5% |
| Middle School | 4,386 | 19.6% |
| High School | 4,262 | 19.0% |
| College / Undergraduate | 4,903 | 21.8% |
| Graduate / Professional | 1,264 | 5.6% |
| Total | 22,439 | 100.0% |
School Enrollment by Age by Funding Source in Warner Robins
Out of a total of 22,439 students who are enrolled in schools in Warner Robins, 2,221 (9.9%) attend a private institution, while the remaining 20,218 (90.1%) are enrolled in public schools. The age group of 25 to 34 year olds has the highest likelihood of being enrolled in private schools, with 510 (22.4% in the age bracket) enrolled. Conversely, the age group of 5 to 9 year old has the lowest likelihood of being enrolled in a private school, with 5,868 (96.4% in the age bracket) attending a public institution.
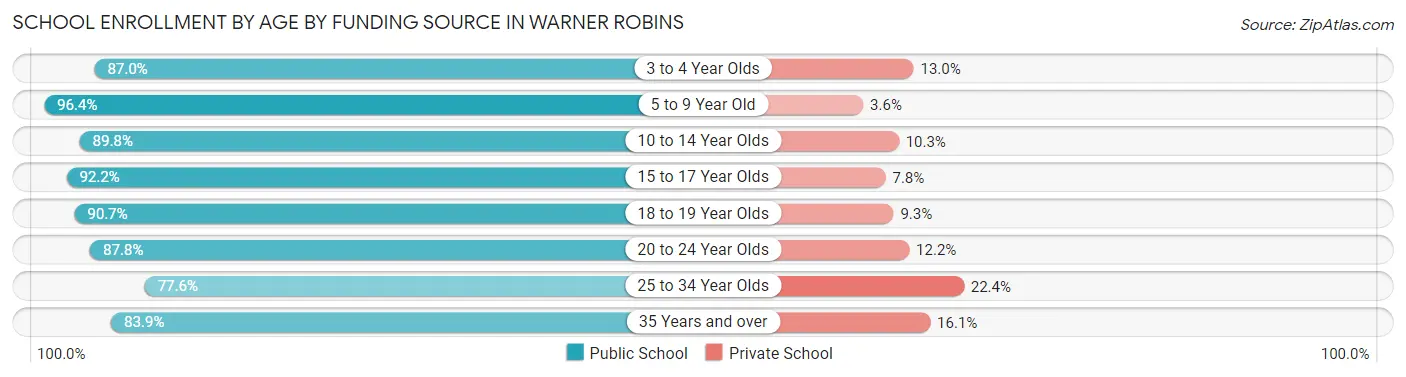
| Age Bracket | Public School | Private School |
| 3 to 4 Year Olds | 935 (87.0%) | 140 (13.0%) |
| 5 to 9 Year Old | 5,868 (96.4%) | 221 (3.6%) |
| 10 to 14 Year Olds | 4,555 (89.7%) | 520 (10.2%) |
| 15 to 17 Year Olds | 3,037 (92.2%) | 257 (7.8%) |
| 18 to 19 Year Olds | 1,302 (90.7%) | 133 (9.3%) |
| 20 to 24 Year Olds | 1,511 (87.8%) | 210 (12.2%) |
| 25 to 34 Year Olds | 1,769 (77.6%) | 510 (22.4%) |
| 35 Years and over | 1,234 (83.9%) | 237 (16.1%) |
| Total | 20,218 (90.1%) | 2,221 (9.9%) |
Educational Attainment by Field of Study in Warner Robins
Business (3,196 | 18.9%), education (2,192 | 12.9%), arts & humanities (1,543 | 9.1%), computers & mathematics (1,464 | 8.6%), and science & technology (1,397 | 8.3%) are the most common fields of study among 16,938 individuals in Warner Robins who have obtained a bachelor's degree or higher.
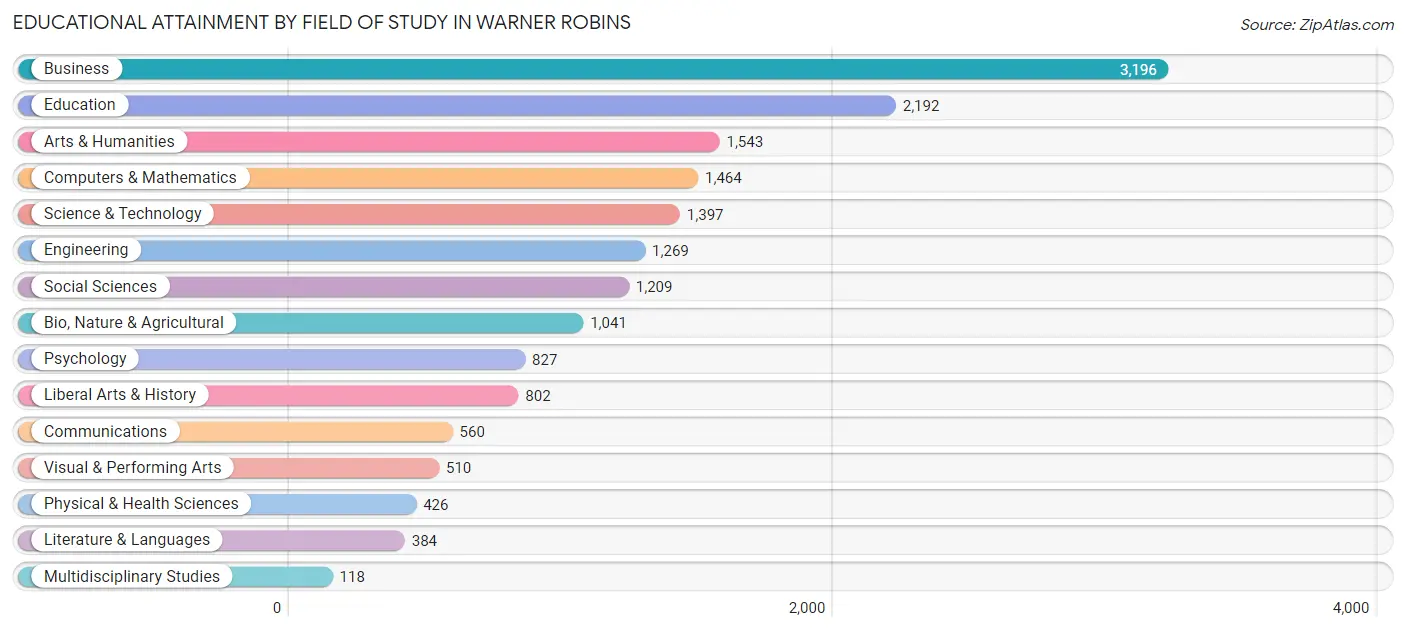
| Field of Study | # Graduates | % Graduates |
| Computers & Mathematics | 1,464 | 8.6% |
| Bio, Nature & Agricultural | 1,041 | 6.1% |
| Physical & Health Sciences | 426 | 2.5% |
| Psychology | 827 | 4.9% |
| Social Sciences | 1,209 | 7.1% |
| Engineering | 1,269 | 7.5% |
| Multidisciplinary Studies | 118 | 0.7% |
| Science & Technology | 1,397 | 8.3% |
| Business | 3,196 | 18.9% |
| Education | 2,192 | 12.9% |
| Literature & Languages | 384 | 2.3% |
| Liberal Arts & History | 802 | 4.7% |
| Visual & Performing Arts | 510 | 3.0% |
| Communications | 560 | 3.3% |
| Arts & Humanities | 1,543 | 9.1% |
| Total | 16,938 | 100.0% |
Transportation & Commute in Warner Robins
Vehicle Availability by Sex in Warner Robins
The most prevalent vehicle ownership categories in Warner Robins are males with 2 vehicles (8,273, accounting for 41.4%) and females with 2 vehicles (7,294, making up 45.2%).
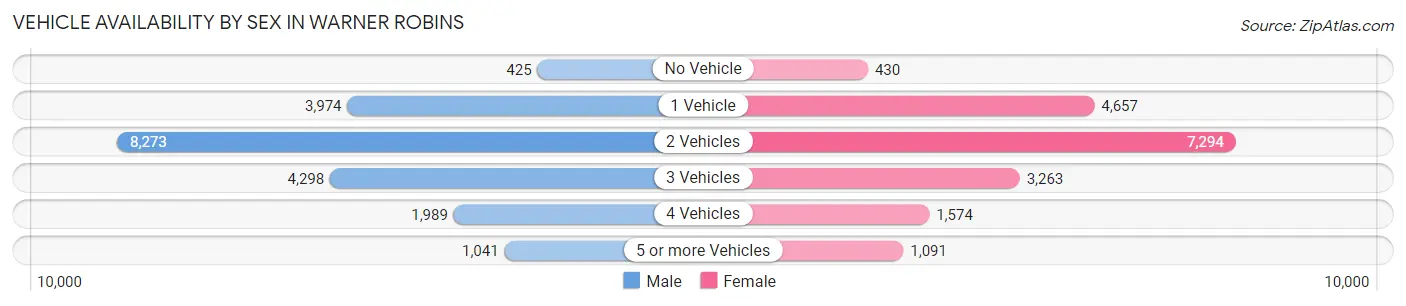
| Vehicles Available | Male | Female |
| No Vehicle | 425 (2.1%) | 430 (2.4%) |
| 1 Vehicle | 3,974 (19.9%) | 4,657 (25.4%) |
| 2 Vehicles | 8,273 (41.4%) | 7,294 (39.8%) |
| 3 Vehicles | 4,298 (21.5%) | 3,263 (17.8%) |
| 4 Vehicles | 1,989 (9.9%) | 1,574 (8.6%) |
| 5 or more Vehicles | 1,041 (5.2%) | 1,091 (6.0%) |
| Total | 20,000 (100.0%) | 18,309 (100.0%) |
Commute Time in Warner Robins
The most frequently occuring commute durations in Warner Robins are 15 to 19 minutes (8,494 commuters, 23.5%), 10 to 14 minutes (7,106 commuters, 19.7%), and 20 to 24 minutes (6,272 commuters, 17.3%).
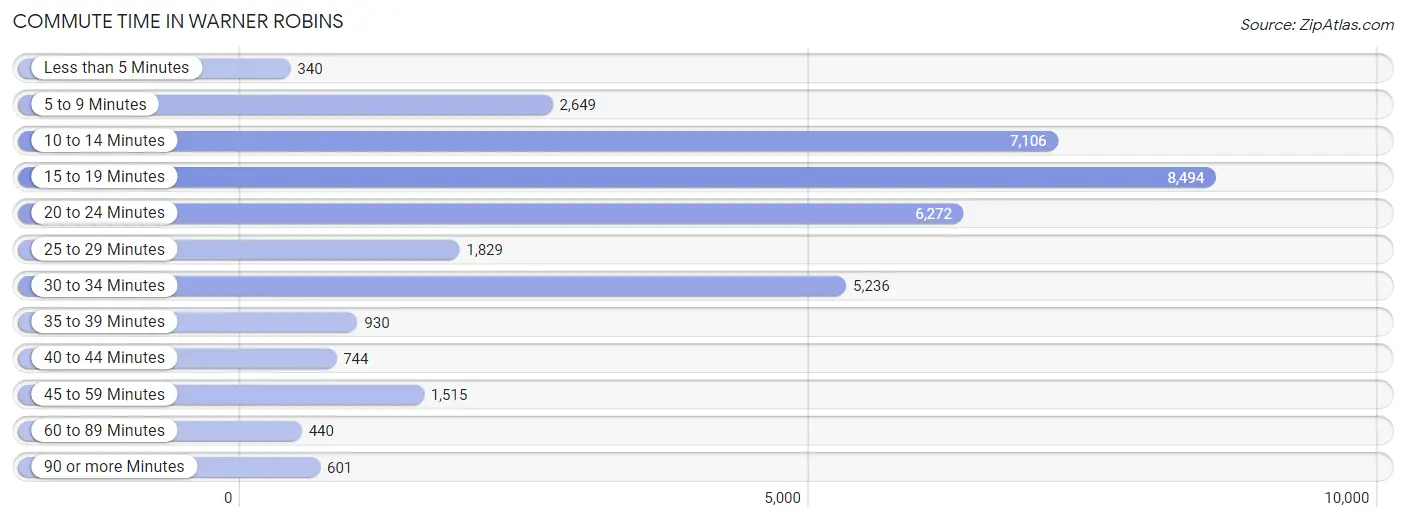
| Commute Time | # Commuters | % Commuters |
| Less than 5 Minutes | 340 | 0.9% |
| 5 to 9 Minutes | 2,649 | 7.3% |
| 10 to 14 Minutes | 7,106 | 19.7% |
| 15 to 19 Minutes | 8,494 | 23.5% |
| 20 to 24 Minutes | 6,272 | 17.3% |
| 25 to 29 Minutes | 1,829 | 5.1% |
| 30 to 34 Minutes | 5,236 | 14.5% |
| 35 to 39 Minutes | 930 | 2.6% |
| 40 to 44 Minutes | 744 | 2.1% |
| 45 to 59 Minutes | 1,515 | 4.2% |
| 60 to 89 Minutes | 440 | 1.2% |
| 90 or more Minutes | 601 | 1.7% |
Commute Time by Sex in Warner Robins
The most common commute times in Warner Robins are 15 to 19 minutes (4,292 commuters, 22.3%) for males and 15 to 19 minutes (4,202 commuters, 24.9%) for females.
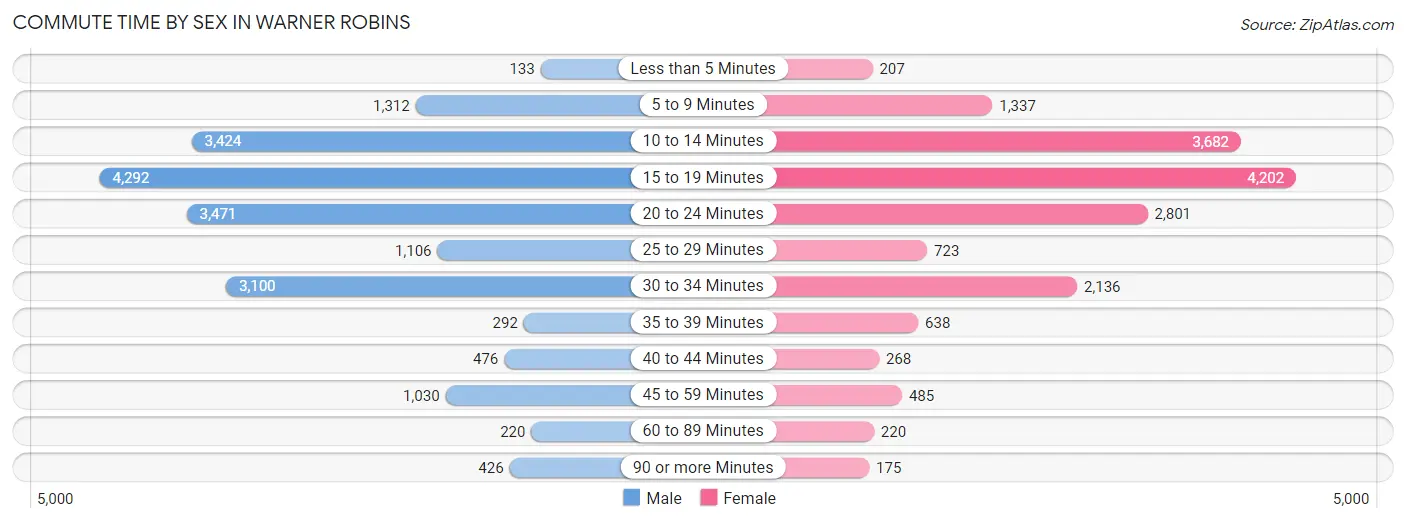
| Commute Time | Male | Female |
| Less than 5 Minutes | 133 (0.7%) | 207 (1.2%) |
| 5 to 9 Minutes | 1,312 (6.8%) | 1,337 (7.9%) |
| 10 to 14 Minutes | 3,424 (17.8%) | 3,682 (21.8%) |
| 15 to 19 Minutes | 4,292 (22.3%) | 4,202 (24.9%) |
| 20 to 24 Minutes | 3,471 (18.0%) | 2,801 (16.6%) |
| 25 to 29 Minutes | 1,106 (5.7%) | 723 (4.3%) |
| 30 to 34 Minutes | 3,100 (16.1%) | 2,136 (12.7%) |
| 35 to 39 Minutes | 292 (1.5%) | 638 (3.8%) |
| 40 to 44 Minutes | 476 (2.5%) | 268 (1.6%) |
| 45 to 59 Minutes | 1,030 (5.3%) | 485 (2.9%) |
| 60 to 89 Minutes | 220 (1.1%) | 220 (1.3%) |
| 90 or more Minutes | 426 (2.2%) | 175 (1.0%) |
Time of Departure to Work by Sex in Warner Robins
The most frequent times of departure to work in Warner Robins are 7:00 AM to 7:29 AM (3,057, 15.9%) for males and 7:00 AM to 7:29 AM (2,492, 14.8%) for females.
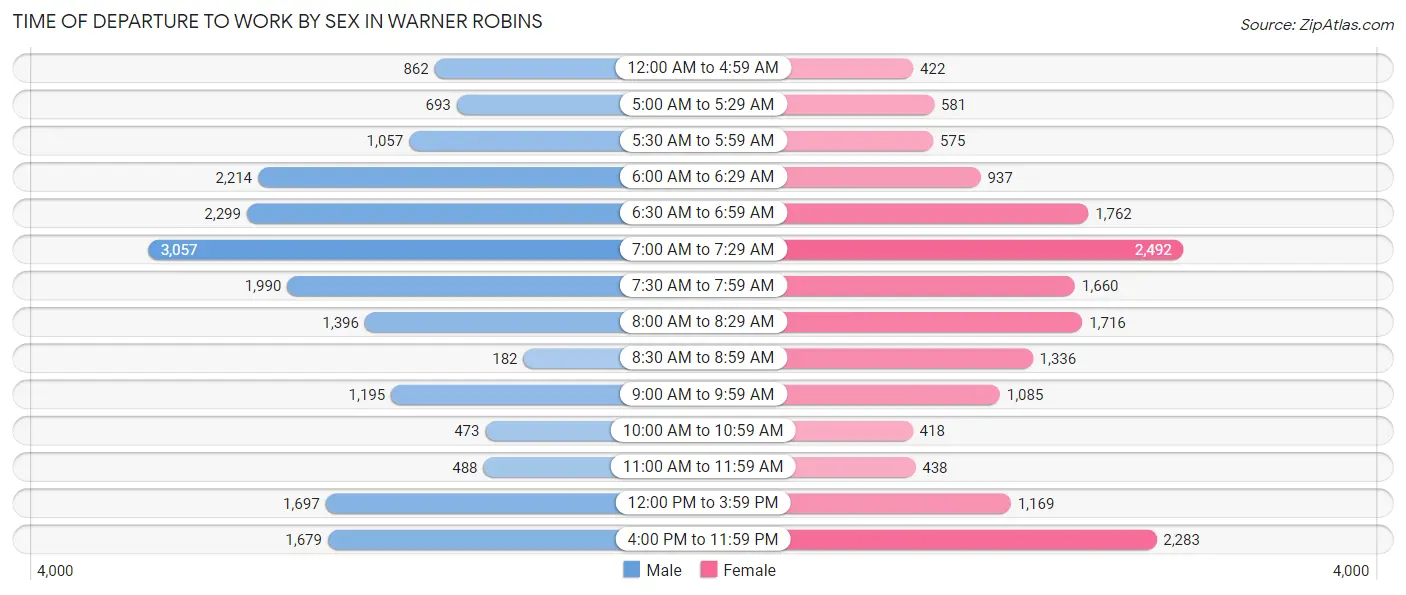
| Time of Departure | Male | Female |
| 12:00 AM to 4:59 AM | 862 (4.5%) | 422 (2.5%) |
| 5:00 AM to 5:29 AM | 693 (3.6%) | 581 (3.4%) |
| 5:30 AM to 5:59 AM | 1,057 (5.5%) | 575 (3.4%) |
| 6:00 AM to 6:29 AM | 2,214 (11.5%) | 937 (5.6%) |
| 6:30 AM to 6:59 AM | 2,299 (11.9%) | 1,762 (10.4%) |
| 7:00 AM to 7:29 AM | 3,057 (15.9%) | 2,492 (14.8%) |
| 7:30 AM to 7:59 AM | 1,990 (10.3%) | 1,660 (9.8%) |
| 8:00 AM to 8:29 AM | 1,396 (7.2%) | 1,716 (10.2%) |
| 8:30 AM to 8:59 AM | 182 (0.9%) | 1,336 (7.9%) |
| 9:00 AM to 9:59 AM | 1,195 (6.2%) | 1,085 (6.4%) |
| 10:00 AM to 10:59 AM | 473 (2.5%) | 418 (2.5%) |
| 11:00 AM to 11:59 AM | 488 (2.5%) | 438 (2.6%) |
| 12:00 PM to 3:59 PM | 1,697 (8.8%) | 1,169 (6.9%) |
| 4:00 PM to 11:59 PM | 1,679 (8.7%) | 2,283 (13.5%) |
| Total | 19,282 (100.0%) | 16,874 (100.0%) |
Housing Occupancy in Warner Robins
Occupancy by Ownership in Warner Robins
Of the total 30,619 dwellings in Warner Robins, owner-occupied units account for 16,170 (52.8%), while renter-occupied units make up 14,449 (47.2%).
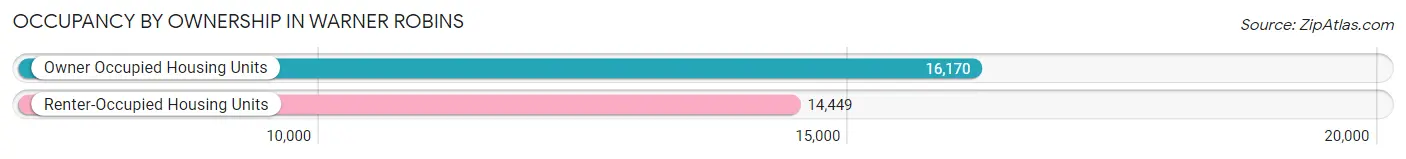
| Occupancy | # Housing Units | % Housing Units |
| Owner Occupied Housing Units | 16,170 | 52.8% |
| Renter-Occupied Housing Units | 14,449 | 47.2% |
| Total Occupied Housing Units | 30,619 | 100.0% |
Occupancy by Household Size in Warner Robins
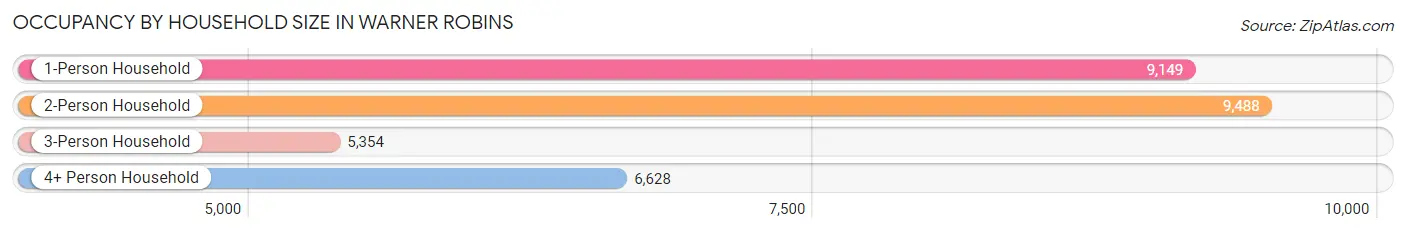
| Household Size | # Housing Units | % Housing Units |
| 1-Person Household | 9,149 | 29.9% |
| 2-Person Household | 9,488 | 31.0% |
| 3-Person Household | 5,354 | 17.5% |
| 4+ Person Household | 6,628 | 21.6% |
| Total Housing Units | 30,619 | 100.0% |
Occupancy by Ownership by Household Size in Warner Robins
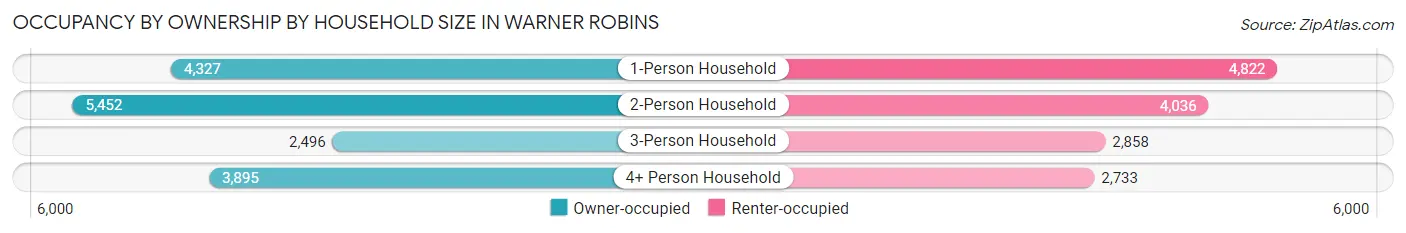
| Household Size | Owner-occupied | Renter-occupied |
| 1-Person Household | 4,327 (47.3%) | 4,822 (52.7%) |
| 2-Person Household | 5,452 (57.5%) | 4,036 (42.5%) |
| 3-Person Household | 2,496 (46.6%) | 2,858 (53.4%) |
| 4+ Person Household | 3,895 (58.8%) | 2,733 (41.2%) |
| Total Housing Units | 16,170 (52.8%) | 14,449 (47.2%) |
Occupancy by Educational Attainment in Warner Robins
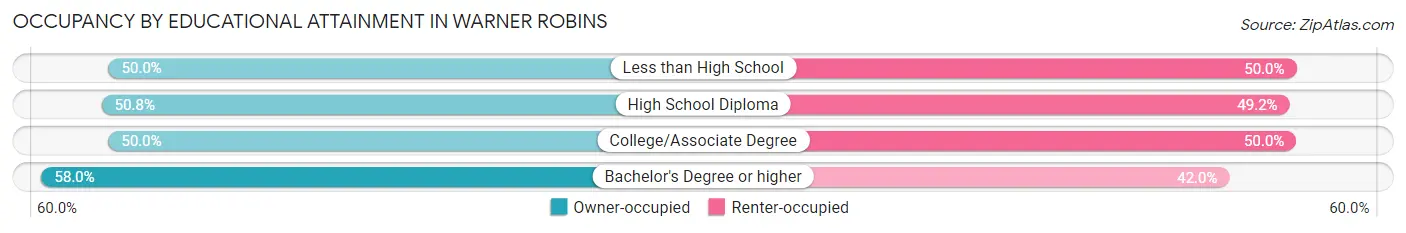
| Household Size | Owner-occupied | Renter-occupied |
| Less than High School | 1,076 (50.0%) | 1,075 (50.0%) |
| High School Diploma | 3,880 (50.8%) | 3,752 (49.2%) |
| College/Associate Degree | 5,473 (50.0%) | 5,464 (50.0%) |
| Bachelor's Degree or higher | 5,741 (58.0%) | 4,158 (42.0%) |
Occupancy by Age of Householder in Warner Robins
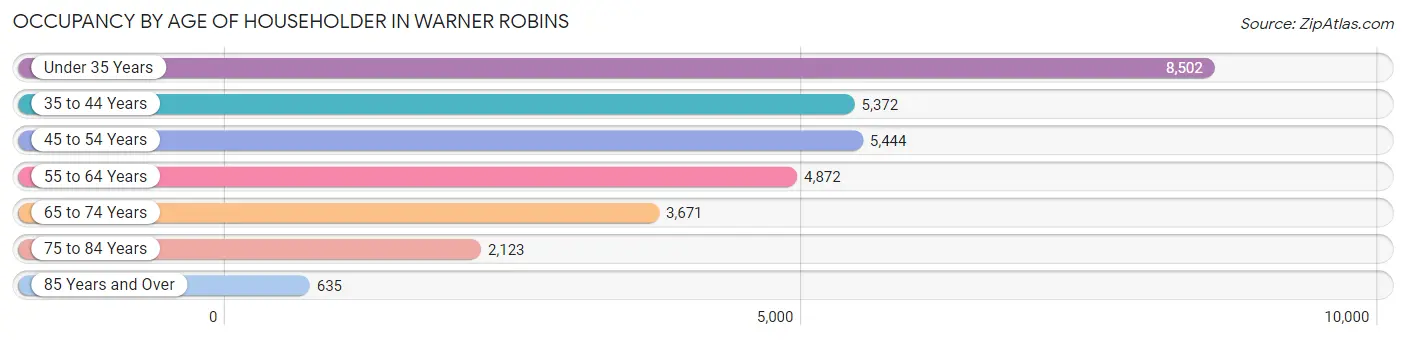
| Age Bracket | # Households | % Households |
| Under 35 Years | 8,502 | 27.8% |
| 35 to 44 Years | 5,372 | 17.5% |
| 45 to 54 Years | 5,444 | 17.8% |
| 55 to 64 Years | 4,872 | 15.9% |
| 65 to 74 Years | 3,671 | 12.0% |
| 75 to 84 Years | 2,123 | 6.9% |
| 85 Years and Over | 635 | 2.1% |
| Total | 30,619 | 100.0% |
Housing Finances in Warner Robins
Median Income by Occupancy in Warner Robins
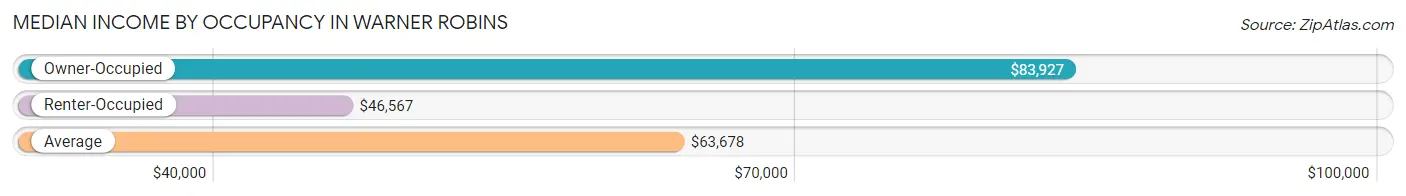
| Occupancy Type | # Households | Median Income |
| Owner-Occupied | 16,170 (52.8%) | $83,927 |
| Renter-Occupied | 14,449 (47.2%) | $46,567 |
| Average | 30,619 (100.0%) | $63,678 |
Occupancy by Householder Income Bracket in Warner Robins
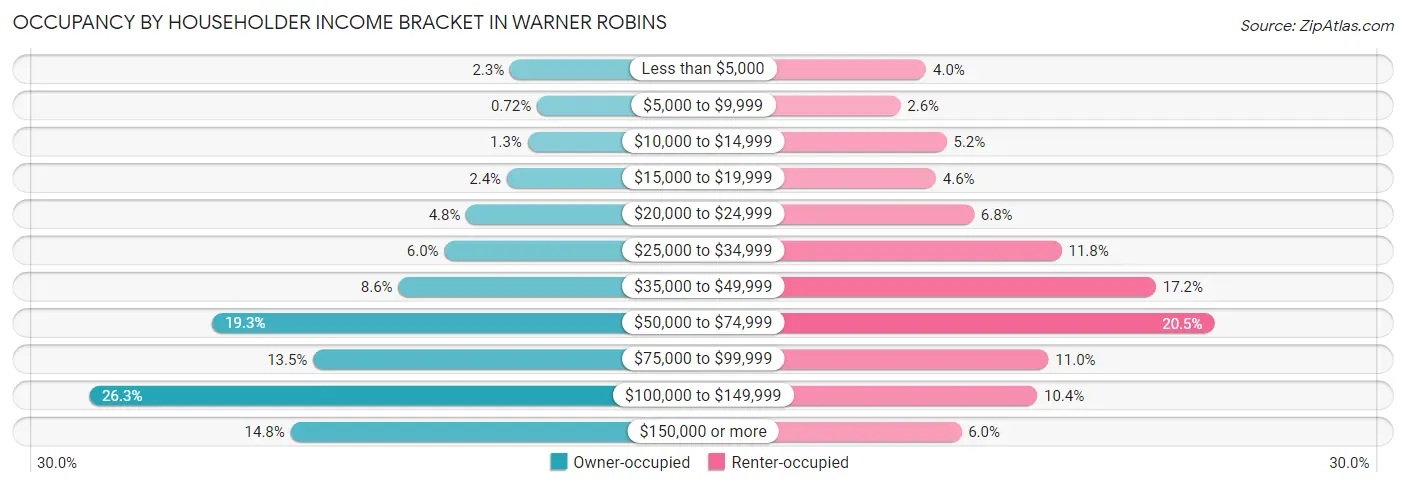
| Income Bracket | Owner-occupied | Renter-occupied |
| Less than $5,000 | 365 (2.3%) | 583 (4.0%) |
| $5,000 to $9,999 | 116 (0.7%) | 370 (2.6%) |
| $10,000 to $14,999 | 202 (1.3%) | 751 (5.2%) |
| $15,000 to $19,999 | 395 (2.4%) | 663 (4.6%) |
| $20,000 to $24,999 | 770 (4.8%) | 977 (6.8%) |
| $25,000 to $34,999 | 972 (6.0%) | 1,700 (11.8%) |
| $35,000 to $49,999 | 1,397 (8.6%) | 2,479 (17.2%) |
| $50,000 to $74,999 | 3,119 (19.3%) | 2,962 (20.5%) |
| $75,000 to $99,999 | 2,185 (13.5%) | 1,593 (11.0%) |
| $100,000 to $149,999 | 4,256 (26.3%) | 1,498 (10.4%) |
| $150,000 or more | 2,393 (14.8%) | 873 (6.0%) |
| Total | 16,170 (100.0%) | 14,449 (100.0%) |
Monthly Housing Cost Tiers in Warner Robins
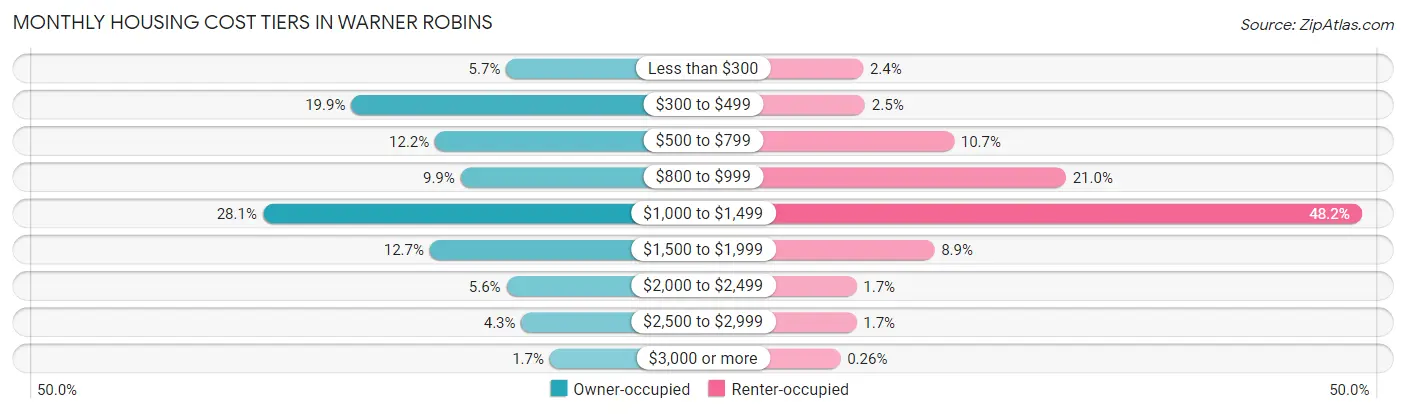
| Monthly Cost | Owner-occupied | Renter-occupied |
| Less than $300 | 916 (5.7%) | 340 (2.4%) |
| $300 to $499 | 3,222 (19.9%) | 365 (2.5%) |
| $500 to $799 | 1,974 (12.2%) | 1,548 (10.7%) |
| $800 to $999 | 1,595 (9.9%) | 3,037 (21.0%) |
| $1,000 to $1,499 | 4,540 (28.1%) | 6,970 (48.2%) |
| $1,500 to $1,999 | 2,054 (12.7%) | 1,288 (8.9%) |
| $2,000 to $2,499 | 912 (5.6%) | 251 (1.7%) |
| $2,500 to $2,999 | 691 (4.3%) | 252 (1.7%) |
| $3,000 or more | 266 (1.7%) | 37 (0.3%) |
| Total | 16,170 (100.0%) | 14,449 (100.0%) |
Physical Housing Characteristics in Warner Robins
Housing Structures in Warner Robins
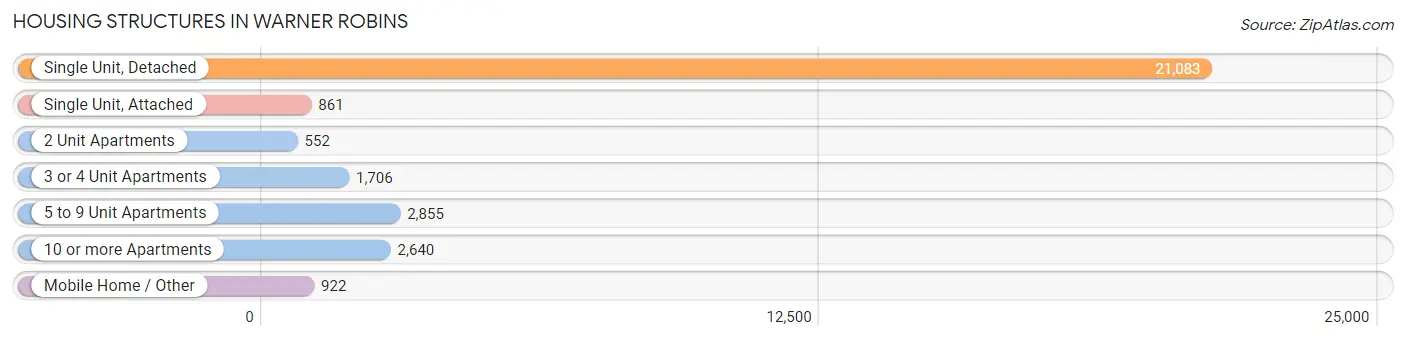
| Structure Type | # Housing Units | % Housing Units |
| Single Unit, Detached | 21,083 | 68.9% |
| Single Unit, Attached | 861 | 2.8% |
| 2 Unit Apartments | 552 | 1.8% |
| 3 or 4 Unit Apartments | 1,706 | 5.6% |
| 5 to 9 Unit Apartments | 2,855 | 9.3% |
| 10 or more Apartments | 2,640 | 8.6% |
| Mobile Home / Other | 922 | 3.0% |
| Total | 30,619 | 100.0% |
Housing Structures by Occupancy in Warner Robins
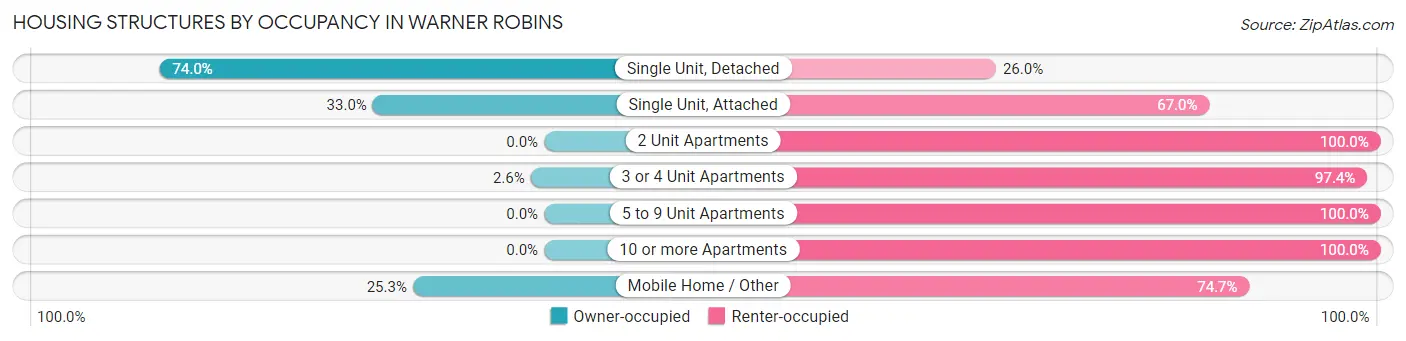
| Structure Type | Owner-occupied | Renter-occupied |
| Single Unit, Detached | 15,609 (74.0%) | 5,474 (26.0%) |
| Single Unit, Attached | 284 (33.0%) | 577 (67.0%) |
| 2 Unit Apartments | 0 (0.0%) | 552 (100.0%) |
| 3 or 4 Unit Apartments | 44 (2.6%) | 1,662 (97.4%) |
| 5 to 9 Unit Apartments | 0 (0.0%) | 2,855 (100.0%) |
| 10 or more Apartments | 0 (0.0%) | 2,640 (100.0%) |
| Mobile Home / Other | 233 (25.3%) | 689 (74.7%) |
| Total | 16,170 (52.8%) | 14,449 (47.2%) |
Housing Structures by Number of Rooms in Warner Robins
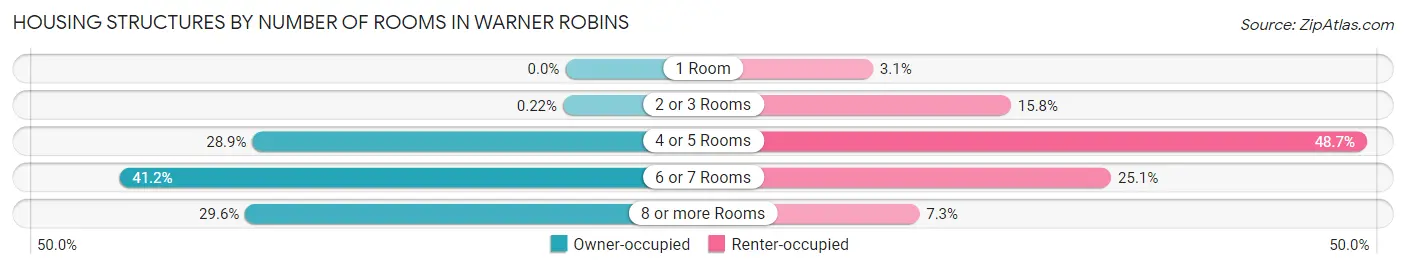
| Number of Rooms | Owner-occupied | Renter-occupied |
| 1 Room | 0 (0.0%) | 441 (3.0%) |
| 2 or 3 Rooms | 36 (0.2%) | 2,284 (15.8%) |
| 4 or 5 Rooms | 4,679 (28.9%) | 7,039 (48.7%) |
| 6 or 7 Rooms | 6,669 (41.2%) | 3,624 (25.1%) |
| 8 or more Rooms | 4,786 (29.6%) | 1,061 (7.3%) |
| Total | 16,170 (100.0%) | 14,449 (100.0%) |
Housing Structure by Heating Type in Warner Robins
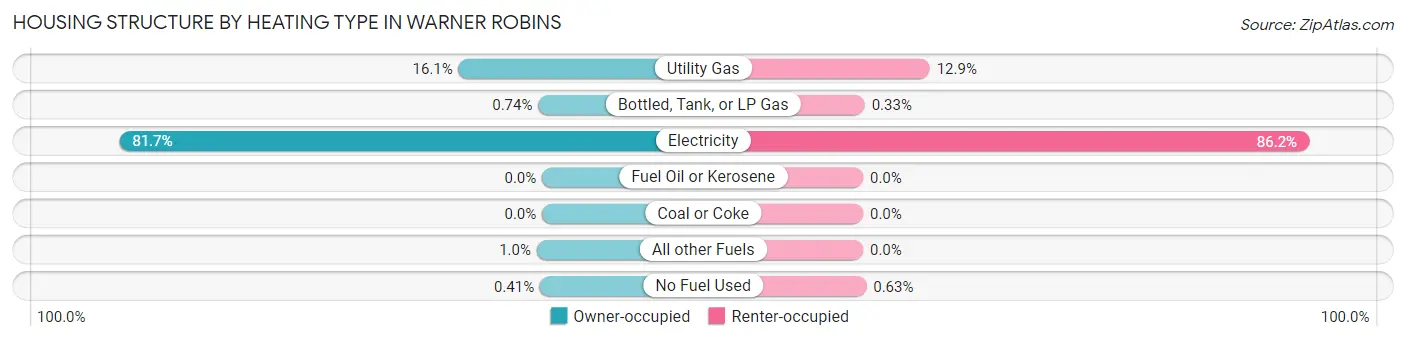
| Heating Type | Owner-occupied | Renter-occupied |
| Utility Gas | 2,609 (16.1%) | 1,863 (12.9%) |
| Bottled, Tank, or LP Gas | 120 (0.7%) | 47 (0.3%) |
| Electricity | 13,210 (81.7%) | 12,448 (86.2%) |
| Fuel Oil or Kerosene | 0 (0.0%) | 0 (0.0%) |
| Coal or Coke | 0 (0.0%) | 0 (0.0%) |
| All other Fuels | 165 (1.0%) | 0 (0.0%) |
| No Fuel Used | 66 (0.4%) | 91 (0.6%) |
| Total | 16,170 (100.0%) | 14,449 (100.0%) |
Household Vehicle Usage in Warner Robins
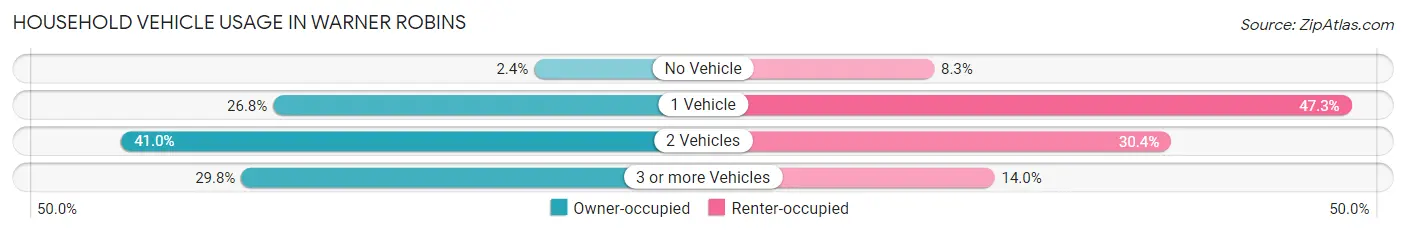
| Vehicles per Household | Owner-occupied | Renter-occupied |
| No Vehicle | 394 (2.4%) | 1,202 (8.3%) |
| 1 Vehicle | 4,333 (26.8%) | 6,831 (47.3%) |
| 2 Vehicles | 6,627 (41.0%) | 4,398 (30.4%) |
| 3 or more Vehicles | 4,816 (29.8%) | 2,018 (14.0%) |
| Total | 16,170 (100.0%) | 14,449 (100.0%) |
Real Estate & Mortgages in Warner Robins
Real Estate and Mortgage Overview in Warner Robins
| Characteristic | Without Mortgage | With Mortgage |
| Housing Units | 5,552 | 10,618 |
| Median Property Value | $119,200 | $176,100 |
| Median Household Income | $55,776 | $1,941 |
| Monthly Housing Costs | $403 | $246 |
| Real Estate Taxes | $1,137 | $578 |
Property Value by Mortgage Status in Warner Robins
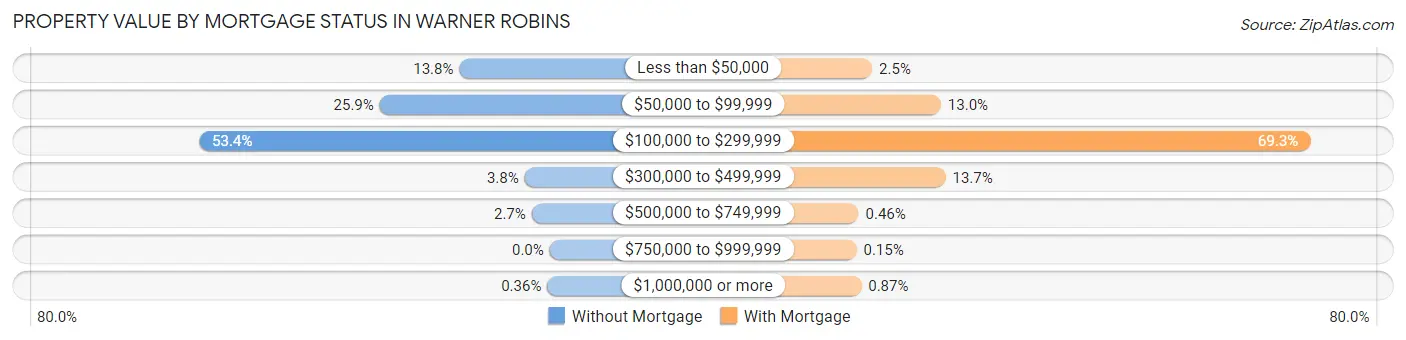
| Property Value | Without Mortgage | With Mortgage |
| Less than $50,000 | 764 (13.8%) | 269 (2.5%) |
| $50,000 to $99,999 | 1,438 (25.9%) | 1,381 (13.0%) |
| $100,000 to $299,999 | 2,966 (53.4%) | 7,355 (69.3%) |
| $300,000 to $499,999 | 212 (3.8%) | 1,456 (13.7%) |
| $500,000 to $749,999 | 152 (2.7%) | 49 (0.5%) |
| $750,000 to $999,999 | 0 (0.0%) | 16 (0.2%) |
| $1,000,000 or more | 20 (0.4%) | 92 (0.9%) |
| Total | 5,552 (100.0%) | 10,618 (100.0%) |
Household Income by Mortgage Status in Warner Robins
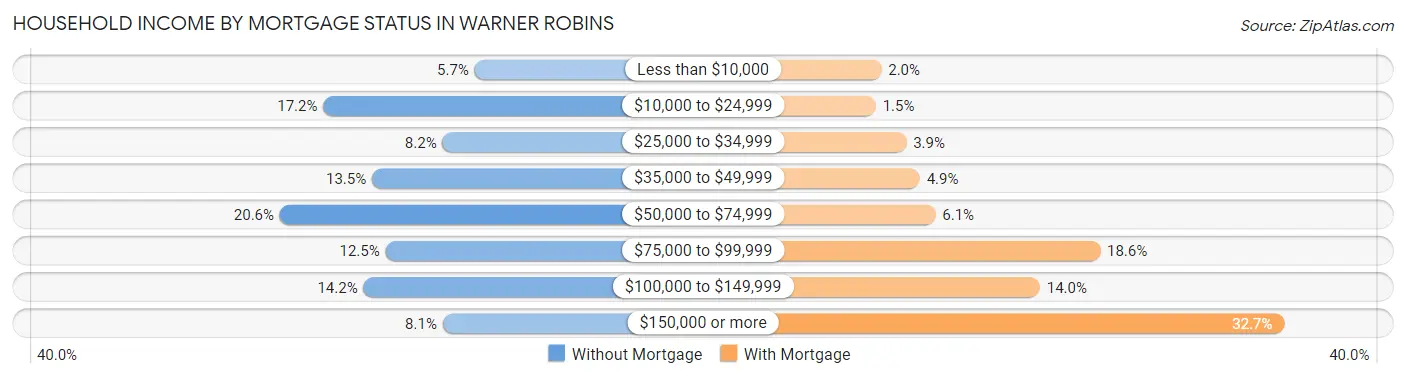
| Household Income | Without Mortgage | With Mortgage |
| Less than $10,000 | 317 (5.7%) | 208 (2.0%) |
| $10,000 to $24,999 | 957 (17.2%) | 164 (1.5%) |
| $25,000 to $34,999 | 453 (8.2%) | 410 (3.9%) |
| $35,000 to $49,999 | 751 (13.5%) | 519 (4.9%) |
| $50,000 to $74,999 | 1,141 (20.5%) | 646 (6.1%) |
| $75,000 to $99,999 | 694 (12.5%) | 1,978 (18.6%) |
| $100,000 to $149,999 | 787 (14.2%) | 1,491 (14.0%) |
| $150,000 or more | 452 (8.1%) | 3,469 (32.7%) |
| Total | 5,552 (100.0%) | 10,618 (100.0%) |
Property Value to Household Income Ratio in Warner Robins
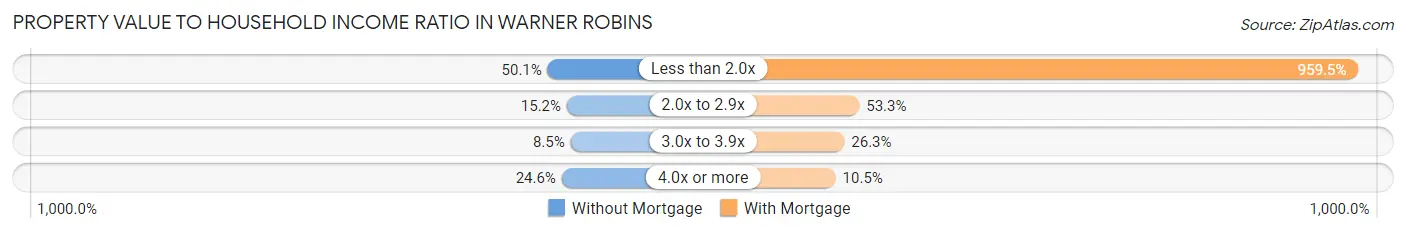
| Value-to-Income Ratio | Without Mortgage | With Mortgage |
| Less than 2.0x | 2,783 (50.1%) | 101,884 (959.5%) |
| 2.0x to 2.9x | 846 (15.2%) | 5,660 (53.3%) |
| 3.0x to 3.9x | 473 (8.5%) | 2,790 (26.3%) |
| 4.0x or more | 1,363 (24.5%) | 1,111 (10.5%) |
| Total | 5,552 (100.0%) | 10,618 (100.0%) |
Real Estate Taxes by Mortgage Status in Warner Robins
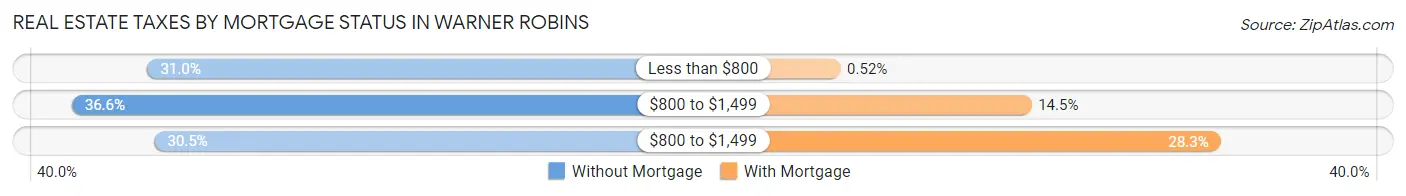
| Property Taxes | Without Mortgage | With Mortgage |
| Less than $800 | 1,722 (31.0%) | 55 (0.5%) |
| $800 to $1,499 | 2,029 (36.5%) | 1,537 (14.5%) |
| $800 to $1,499 | 1,694 (30.5%) | 3,006 (28.3%) |
| Total | 5,552 (100.0%) | 10,618 (100.0%) |
Health & Disability in Warner Robins
Health Insurance Coverage by Age in Warner Robins
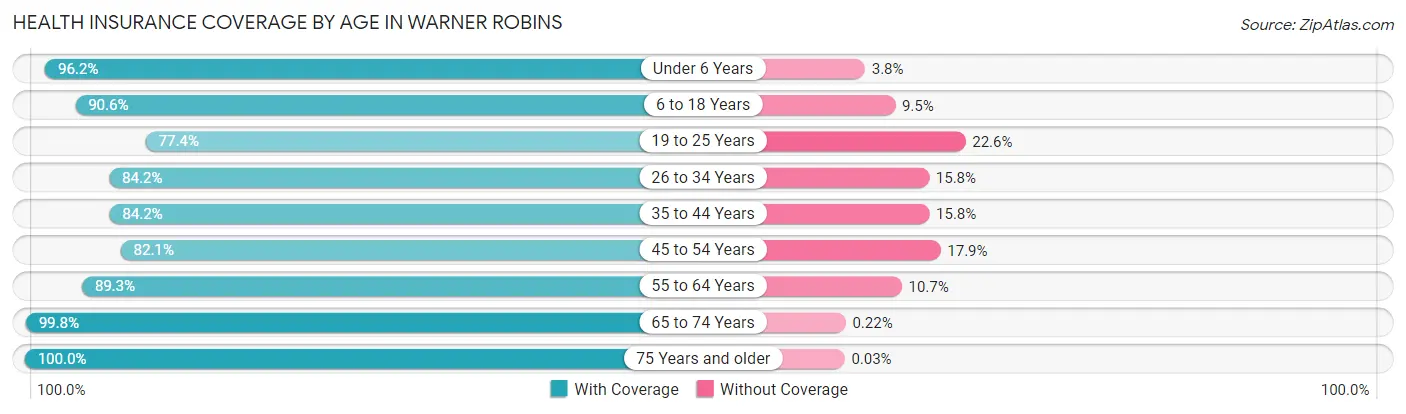
| Age Bracket | With Coverage | Without Coverage |
| Under 6 Years | 7,051 (96.2%) | 280 (3.8%) |
| 6 to 18 Years | 13,600 (90.5%) | 1,419 (9.5%) |
| 19 to 25 Years | 5,726 (77.4%) | 1,669 (22.6%) |
| 26 to 34 Years | 10,481 (84.2%) | 1,962 (15.8%) |
| 35 to 44 Years | 8,032 (84.2%) | 1,509 (15.8%) |
| 45 to 54 Years | 7,391 (82.1%) | 1,612 (17.9%) |
| 55 to 64 Years | 7,409 (89.3%) | 885 (10.7%) |
| 65 to 74 Years | 5,337 (99.8%) | 12 (0.2%) |
| 75 Years and older | 3,769 (100.0%) | 1 (0.0%) |
| Total | 68,796 (88.0%) | 9,349 (12.0%) |
Health Insurance Coverage by Citizenship Status in Warner Robins
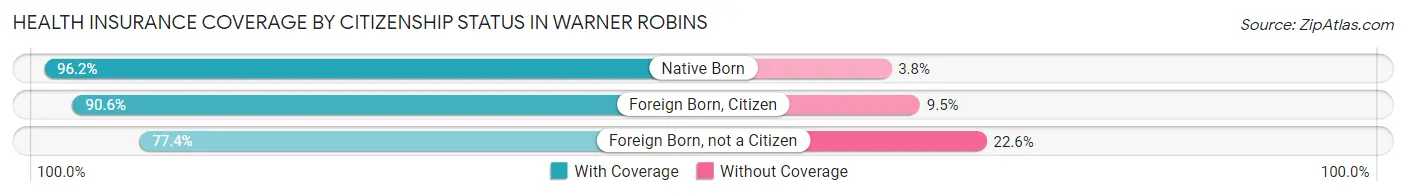
| Citizenship Status | With Coverage | Without Coverage |
| Native Born | 7,051 (96.2%) | 280 (3.8%) |
| Foreign Born, Citizen | 13,600 (90.5%) | 1,419 (9.5%) |
| Foreign Born, not a Citizen | 5,726 (77.4%) | 1,669 (22.6%) |
Health Insurance Coverage by Household Income in Warner Robins
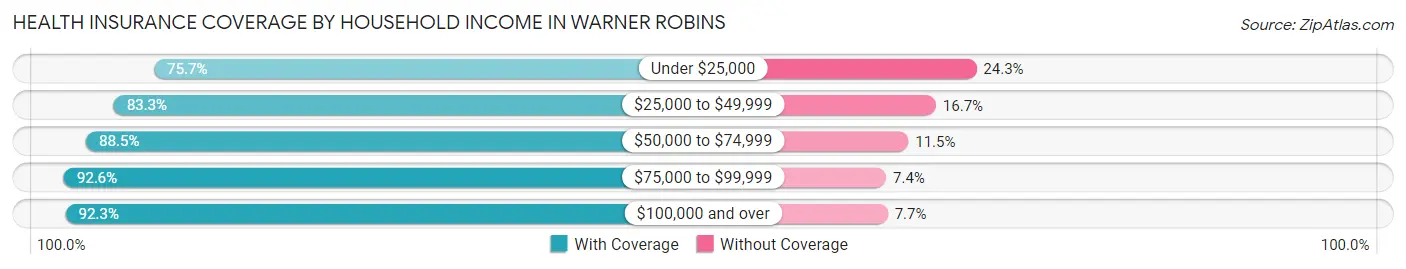
| Household Income | With Coverage | Without Coverage |
| Under $25,000 | 7,149 (75.7%) | 2,292 (24.3%) |
| $25,000 to $49,999 | 11,095 (83.3%) | 2,225 (16.7%) |
| $50,000 to $74,999 | 13,661 (88.5%) | 1,778 (11.5%) |
| $75,000 to $99,999 | 9,819 (92.6%) | 780 (7.4%) |
| $100,000 and over | 26,982 (92.3%) | 2,242 (7.7%) |
Public vs Private Health Insurance Coverage by Age in Warner Robins
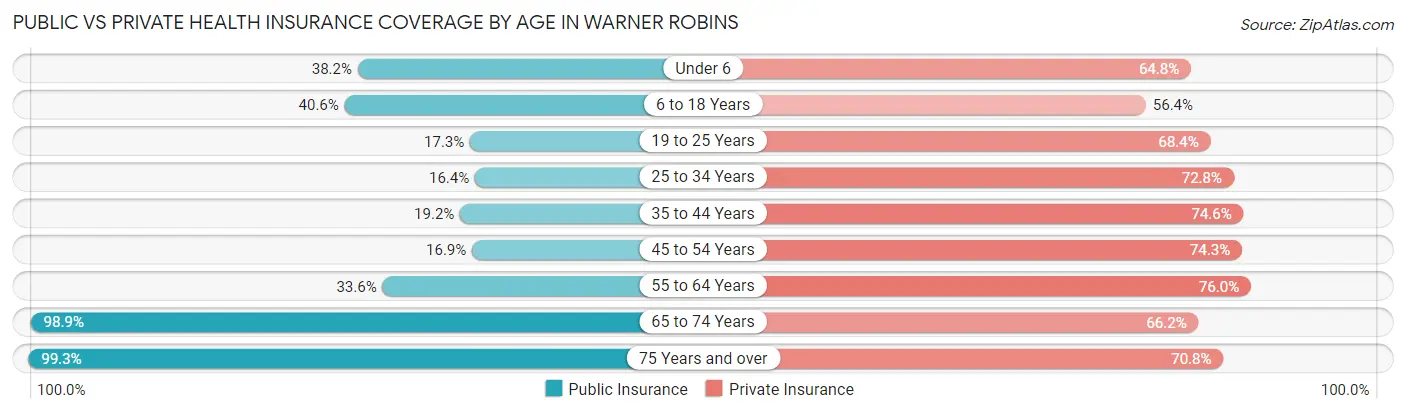
| Age Bracket | Public Insurance | Private Insurance |
| Under 6 | 2,797 (38.2%) | 4,752 (64.8%) |
| 6 to 18 Years | 6,098 (40.6%) | 8,477 (56.4%) |
| 19 to 25 Years | 1,280 (17.3%) | 5,061 (68.4%) |
| 25 to 34 Years | 2,039 (16.4%) | 9,054 (72.8%) |
| 35 to 44 Years | 1,827 (19.2%) | 7,115 (74.6%) |
| 45 to 54 Years | 1,525 (16.9%) | 6,689 (74.3%) |
| 55 to 64 Years | 2,784 (33.6%) | 6,300 (76.0%) |
| 65 to 74 Years | 5,289 (98.9%) | 3,541 (66.2%) |
| 75 Years and over | 3,744 (99.3%) | 2,670 (70.8%) |
| Total | 27,383 (35.0%) | 53,659 (68.7%) |
Disability Status by Sex by Age in Warner Robins
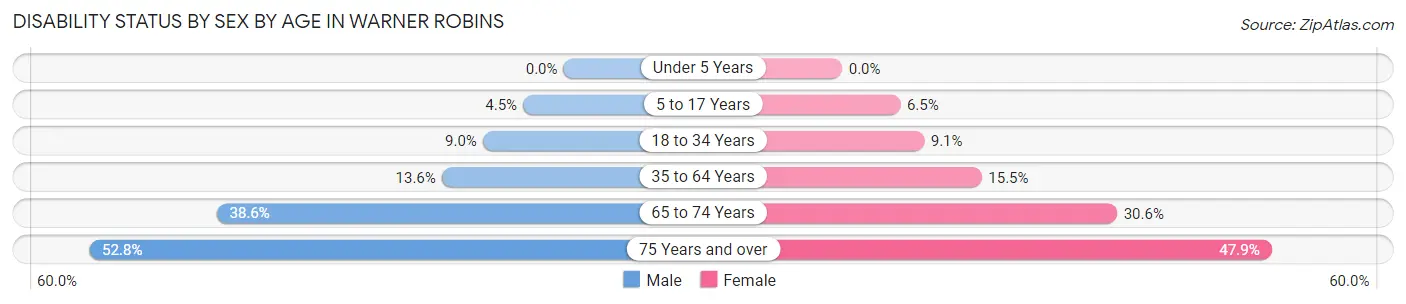
| Age Bracket | Male | Female |
| Under 5 Years | 0 (0.0%) | 0 (0.0%) |
| 5 to 17 Years | 327 (4.5%) | 506 (6.5%) |
| 18 to 34 Years | 880 (9.0%) | 1,010 (9.1%) |
| 35 to 64 Years | 1,707 (13.6%) | 2,214 (15.5%) |
| 65 to 74 Years | 941 (38.6%) | 892 (30.6%) |
| 75 Years and over | 722 (52.8%) | 1,150 (47.9%) |
Disability Class by Sex by Age in Warner Robins
Disability Class: Hearing Difficulty
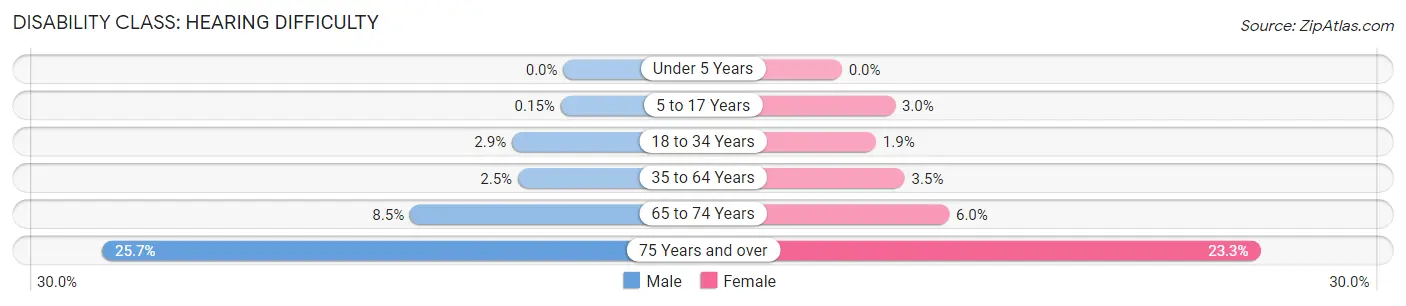
| Age Bracket | Male | Female |
| Under 5 Years | 0 (0.0%) | 0 (0.0%) |
| 5 to 17 Years | 11 (0.2%) | 231 (3.0%) |
| 18 to 34 Years | 280 (2.9%) | 210 (1.9%) |
| 35 to 64 Years | 318 (2.5%) | 499 (3.5%) |
| 65 to 74 Years | 208 (8.5%) | 174 (6.0%) |
| 75 Years and over | 351 (25.7%) | 560 (23.3%) |
Disability Class: Vision Difficulty
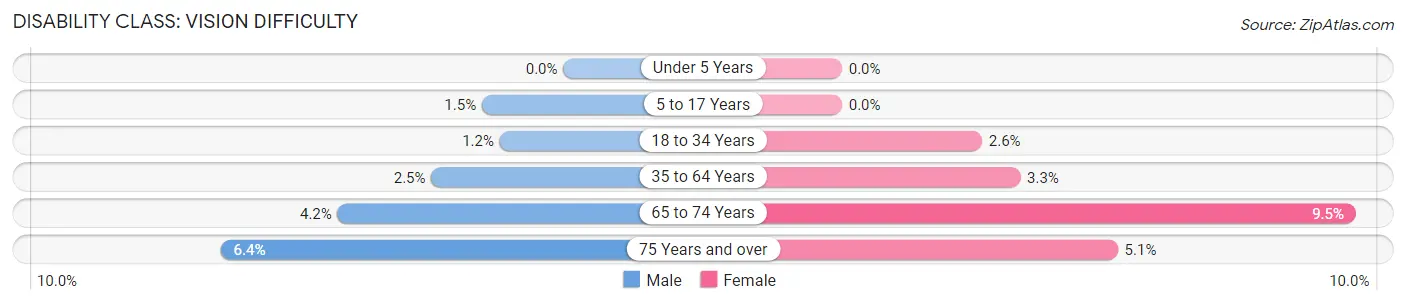
| Age Bracket | Male | Female |
| Under 5 Years | 0 (0.0%) | 0 (0.0%) |
| 5 to 17 Years | 110 (1.5%) | 0 (0.0%) |
| 18 to 34 Years | 116 (1.2%) | 287 (2.6%) |
| 35 to 64 Years | 309 (2.5%) | 471 (3.3%) |
| 65 to 74 Years | 102 (4.2%) | 278 (9.5%) |
| 75 Years and over | 87 (6.4%) | 123 (5.1%) |
Disability Class: Cognitive Difficulty
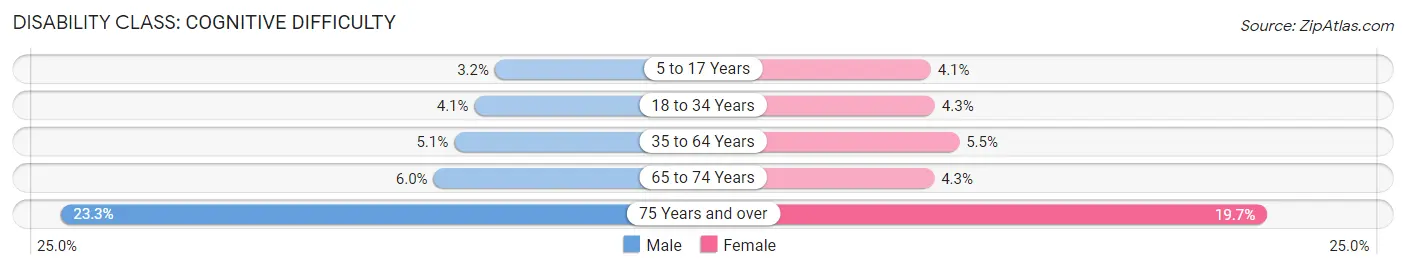
| Age Bracket | Male | Female |
| 5 to 17 Years | 231 (3.2%) | 322 (4.1%) |
| 18 to 34 Years | 405 (4.1%) | 478 (4.3%) |
| 35 to 64 Years | 638 (5.1%) | 777 (5.4%) |
| 65 to 74 Years | 147 (6.0%) | 125 (4.3%) |
| 75 Years and over | 319 (23.3%) | 474 (19.7%) |
Disability Class: Ambulatory Difficulty
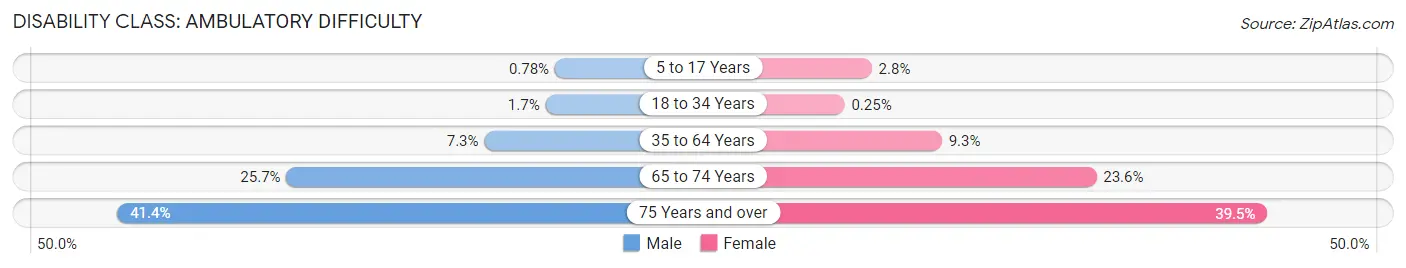
| Age Bracket | Male | Female |
| 5 to 17 Years | 57 (0.8%) | 216 (2.8%) |
| 18 to 34 Years | 163 (1.7%) | 28 (0.3%) |
| 35 to 64 Years | 923 (7.3%) | 1,321 (9.3%) |
| 65 to 74 Years | 626 (25.7%) | 688 (23.6%) |
| 75 Years and over | 566 (41.4%) | 949 (39.5%) |
Disability Class: Self-Care Difficulty
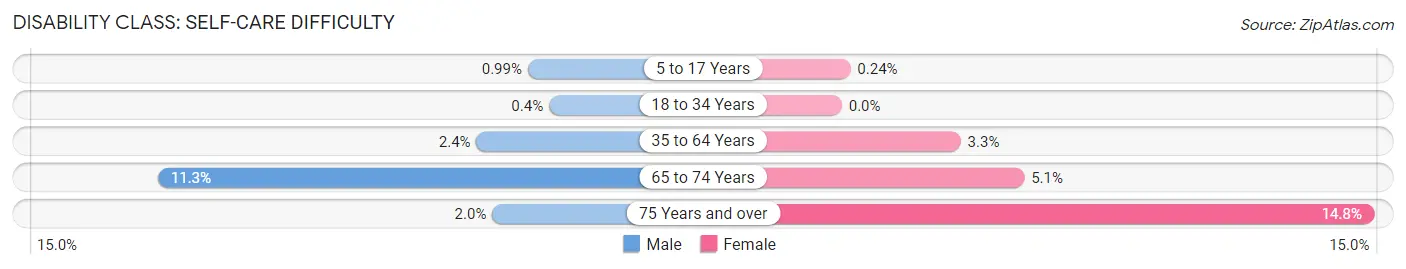
| Age Bracket | Male | Female |
| 5 to 17 Years | 72 (1.0%) | 19 (0.2%) |
| 18 to 34 Years | 39 (0.4%) | 0 (0.0%) |
| 35 to 64 Years | 305 (2.4%) | 471 (3.3%) |
| 65 to 74 Years | 275 (11.3%) | 148 (5.1%) |
| 75 Years and over | 27 (2.0%) | 356 (14.8%) |
Technology Access in Warner Robins
Computing Device Access in Warner Robins
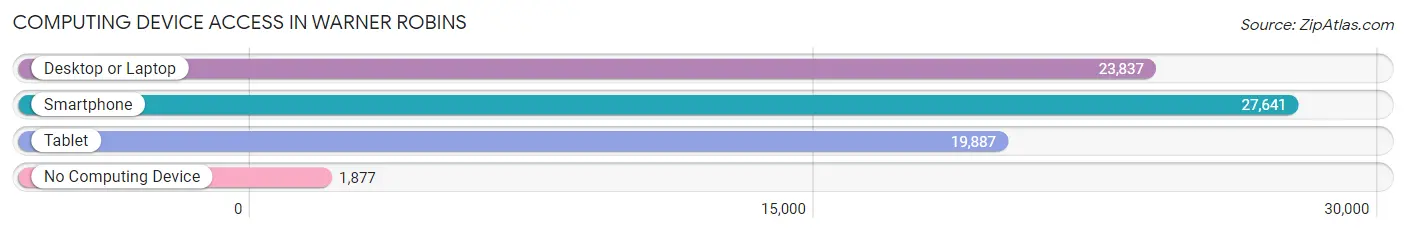
| Device Type | # Households | % Households |
| Desktop or Laptop | 23,837 | 77.8% |
| Smartphone | 27,641 | 90.3% |
| Tablet | 19,887 | 64.9% |
| No Computing Device | 1,877 | 6.1% |
| Total | 30,619 | 100.0% |
Internet Access in Warner Robins
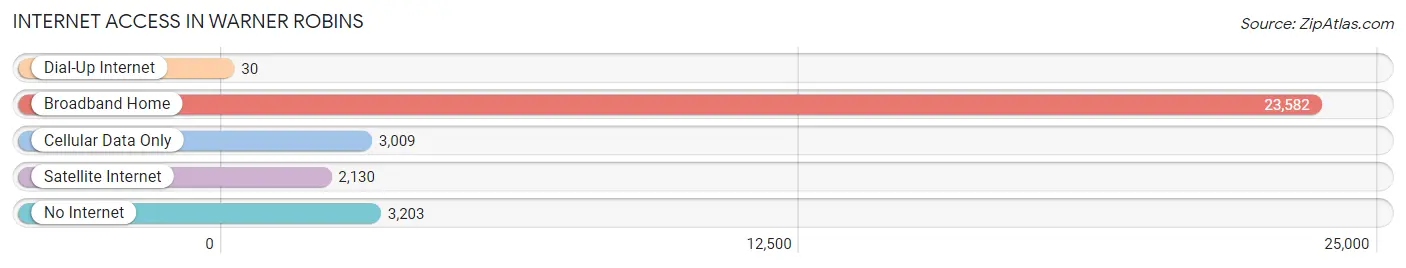
| Internet Type | # Households | % Households |
| Dial-Up Internet | 30 | 0.1% |
| Broadband Home | 23,582 | 77.0% |
| Cellular Data Only | 3,009 | 9.8% |
| Satellite Internet | 2,130 | 7.0% |
| No Internet | 3,203 | 10.5% |
| Total | 30,619 | 100.0% |
Warner Robins Summary
Warner Robins is a city located in the central part of the U.S. state of Georgia. It is part of the larger Macon-Warner Robins metropolitan area, and is located in Houston County. As of the 2010 census, the city had a population of 66,588.
History
The area now known as Warner Robins was first settled in the early 19th century by a small group of Creek Indians. The area was known as Wellston until the early 20th century, when it was renamed after General Augustine Warner Robins, a U.S. Air Force officer who was instrumental in the development of the Air Force's logistics system.
In 1942, the U.S. Army Air Corps opened Robins Field, a military airfield, in the area. The airfield was later renamed Robins Air Force Base, and it remains an important part of the local economy.
Geography
Warner Robins is located in central Georgia, about 20 miles south of Macon and about 100 miles south of Atlanta. The city is situated in the Piedmont region of the state, and is located at the intersection of Interstate 75 and U.S. Route 129.
The city covers an area of approximately 28 square miles, and is located at an elevation of about 350 feet above sea level. The city is located in the Ocmulgee River watershed, and is bordered by the cities of Centerville, Perry, and Byron.
Economy
Warner Robins is home to Robins Air Force Base, which is the largest industrial complex in Georgia. The base is the largest single employer in the city, and is responsible for a significant portion of the city's economy.
In addition to the base, the city is home to a number of other businesses, including retail stores, restaurants, and manufacturing plants. The city is also home to a number of educational institutions, including Middle Georgia State University and Central Georgia Technical College.
Demographics
As of the 2010 census, there were 66,588 people, 24,919 households, and 17,845 families residing in the city. The population density was 2,364.2 people per square mile. The racial makeup of the city was 63.2% White, 28.2% African American, 0.4% Native American, 2.2% Asian, 0.1% Pacific Islander, 3.7% from other races, and 2.2% from two or more races. Hispanic or Latino of any race were 8.2% of the population.
The median income for a household in the city was $41,945, and the median income for a family was $50,945. The per capita income for the city was $20,945. About 11.2% of families and 14.2% of the population were below the poverty line, including 19.2% of those under age 18 and 10.2% of those age 65 or over.
Common Questions
What is Per Capita Income in Warner Robins?
Per Capita income in Warner Robins is $32,325.
What is the Median Family Income in Warner Robins?
Median Family Income in Warner Robins is $77,116.
What is the Median Household income in Warner Robins?
Median Household Income in Warner Robins is $63,678.
What is Income or Wage Gap in Warner Robins?
Income or Wage Gap in Warner Robins is 28.7%.
Women in Warner Robins earn 71.3 cents for every dollar earned by a man.
What is Family Income Deficit in Warner Robins?
Family Income Deficit in Warner Robins is $11,255.
Families that are below poverty line in Warner Robins earn $11,255 less on average than the poverty threshold level.
What is Inequality or Gini Index in Warner Robins?
Inequality or Gini Index in Warner Robins is 0.43.
What is the Total Population of Warner Robins?
Total Population of Warner Robins is 80,374.
What is the Total Male Population of Warner Robins?
Total Male Population of Warner Robins is 38,152.
What is the Total Female Population of Warner Robins?
Total Female Population of Warner Robins is 42,222.
What is the Ratio of Males per 100 Females in Warner Robins?
There are 90.36 Males per 100 Females in Warner Robins.
What is the Ratio of Females per 100 Males in Warner Robins?
There are 110.67 Females per 100 Males in Warner Robins.
What is the Median Population Age in Warner Robins?
Median Population Age in Warner Robins is 32.4 Years.
What is the Average Family Size in Warner Robins
Average Family Size in Warner Robins is 3.3 People.
What is the Average Household Size in Warner Robins
Average Household Size in Warner Robins is 2.6 People.
How Large is the Labor Force in Warner Robins?
There are 41,609 People in the Labor Forcein in Warner Robins.
What is the Percentage of People in the Labor Force in Warner Robins?
67.6% of People are in the Labor Force in Warner Robins.
What is the Unemployment Rate in Warner Robins?
Unemployment Rate in Warner Robins is 6.5%.