West Pensacola, FL Map & Demographics
West Pensacola Map
West Pensacola Overview
$20,514
PER CAPITA INCOME
$46,968
AVG FAMILY INCOME
$38,263
AVG HOUSEHOLD INCOME
17.1%
WAGE / INCOME GAP [ % ]
82.9¢/ $1
WAGE / INCOME GAP [ $ ]
$10,846
FAMILY INCOME DEFICIT
0.42
INEQUALITY / GINI INDEX
21,246
TOTAL POPULATION
10,591
MALE POPULATION
10,655
FEMALE POPULATION
99.40
MALES / 100 FEMALES
100.60
FEMALES / 100 MALES
37.6
MEDIAN AGE
3.1
AVG FAMILY SIZE
2.4
AVG HOUSEHOLD SIZE
9,484
LABOR FORCE [ PEOPLE ]
55.9%
PERCENT IN LABOR FORCE
6.9%
UNEMPLOYMENT RATE
Income in West Pensacola
Income Overview in West Pensacola
Per Capita Income in West Pensacola is $20,514, while median incomes of families and households are $46,968 and $38,263 respectively.
| Characteristic | Number | Measure |
| Per Capita Income | 21,246 | $20,514 |
| Median Family Income | 5,058 | $46,968 |
| Mean Family Income | 5,058 | $58,462 |
| Median Household Income | 8,686 | $38,263 |
| Mean Household Income | 8,686 | $49,905 |
| Income Deficit | 5,058 | $10,846 |
| Wage / Income Gap (%) | 21,246 | 17.08% |
| Wage / Income Gap ($) | 21,246 | 82.92¢ per $1 |
| Gini / Inequality Index | 21,246 | 0.42 |
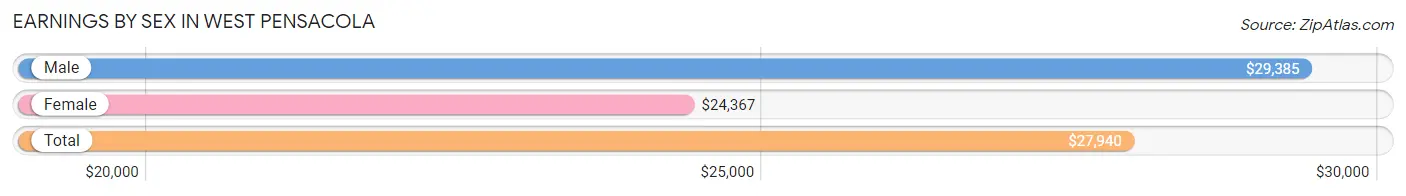
Earnings by Sex in West Pensacola
Average Earnings in West Pensacola are $27,940, $29,385 for men and $24,367 for women, a difference of 17.1%.
| Sex | Number | Average Earnings |
| Male | 4,942 (49.7%) | $29,385 |
| Female | 5,004 (50.3%) | $24,367 |
| Total | 9,946 (100.0%) | $27,940 |
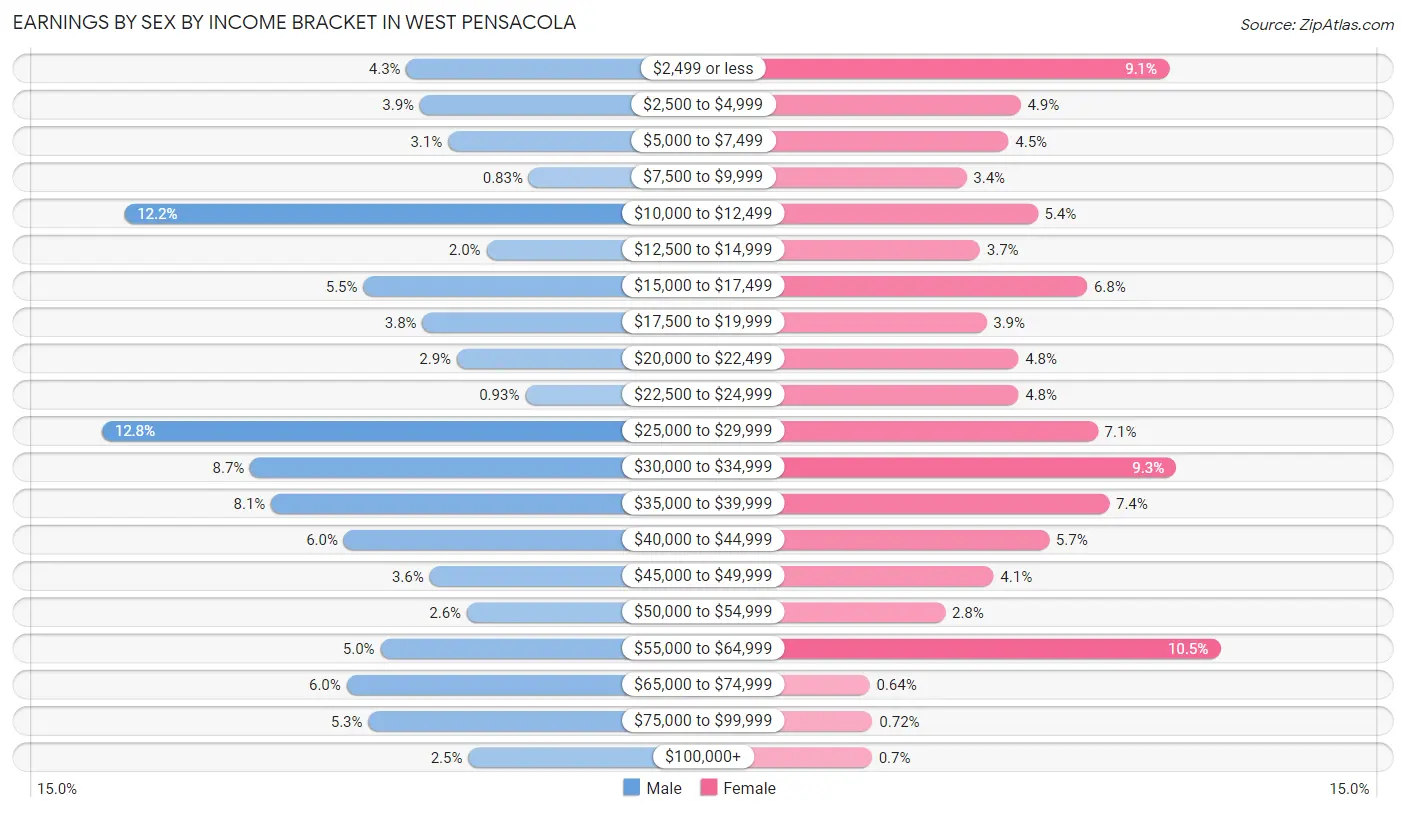
Earnings by Sex by Income Bracket in West Pensacola
The most common earnings brackets in West Pensacola are $25,000 to $29,999 for men (634 | 12.8%) and $55,000 to $64,999 for women (525 | 10.5%).
| Income | Male | Female |
| $2,499 or less | 211 (4.3%) | 453 (9.0%) |
| $2,500 to $4,999 | 192 (3.9%) | 244 (4.9%) |
| $5,000 to $7,499 | 153 (3.1%) | 227 (4.5%) |
| $7,500 to $9,999 | 41 (0.8%) | 168 (3.4%) |
| $10,000 to $12,499 | 603 (12.2%) | 268 (5.4%) |
| $12,500 to $14,999 | 100 (2.0%) | 187 (3.7%) |
| $15,000 to $17,499 | 271 (5.5%) | 338 (6.8%) |
| $17,500 to $19,999 | 189 (3.8%) | 196 (3.9%) |
| $20,000 to $22,499 | 141 (2.9%) | 241 (4.8%) |
| $22,500 to $24,999 | 46 (0.9%) | 241 (4.8%) |
| $25,000 to $29,999 | 634 (12.8%) | 353 (7.0%) |
| $30,000 to $34,999 | 428 (8.7%) | 463 (9.2%) |
| $35,000 to $39,999 | 399 (8.1%) | 369 (7.4%) |
| $40,000 to $44,999 | 298 (6.0%) | 284 (5.7%) |
| $45,000 to $49,999 | 179 (3.6%) | 206 (4.1%) |
| $50,000 to $54,999 | 127 (2.6%) | 138 (2.8%) |
| $55,000 to $64,999 | 247 (5.0%) | 525 (10.5%) |
| $65,000 to $74,999 | 294 (5.9%) | 32 (0.6%) |
| $75,000 to $99,999 | 264 (5.3%) | 36 (0.7%) |
| $100,000+ | 125 (2.5%) | 35 (0.7%) |
| Total | 4,942 (100.0%) | 5,004 (100.0%) |
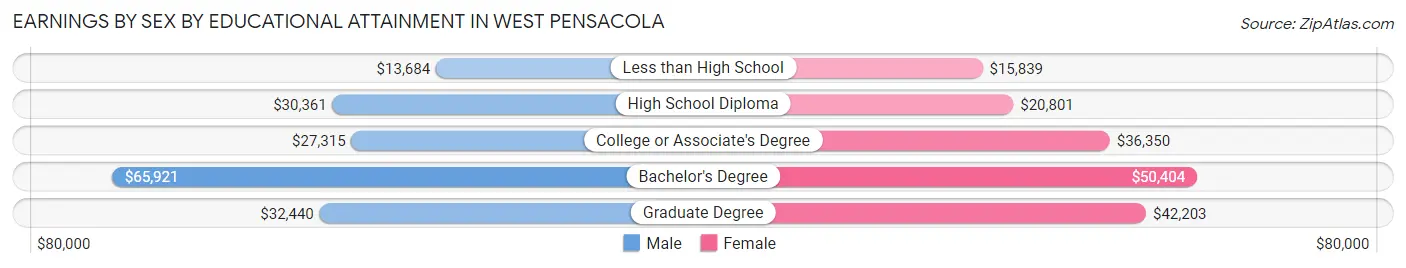
Earnings by Sex by Educational Attainment in West Pensacola
Average earnings in West Pensacola are $30,311 for men and $28,977 for women, a difference of 4.4%. Men with an educational attainment of bachelor's degree enjoy the highest average annual earnings of $65,921, while those with less than high school education earn the least with $13,684. Women with an educational attainment of bachelor's degree earn the most with the average annual earnings of $50,404, while those with less than high school education have the smallest earnings of $15,839.
| Educational Attainment | Male Income | Female Income |
| Less than High School | $13,684 | $15,839 |
| High School Diploma | $30,361 | $20,801 |
| College or Associate's Degree | $27,315 | $36,350 |
| Bachelor's Degree | $65,921 | $50,404 |
| Graduate Degree | $32,440 | $42,203 |
| Total | $30,311 | $28,977 |
Family Income in West Pensacola
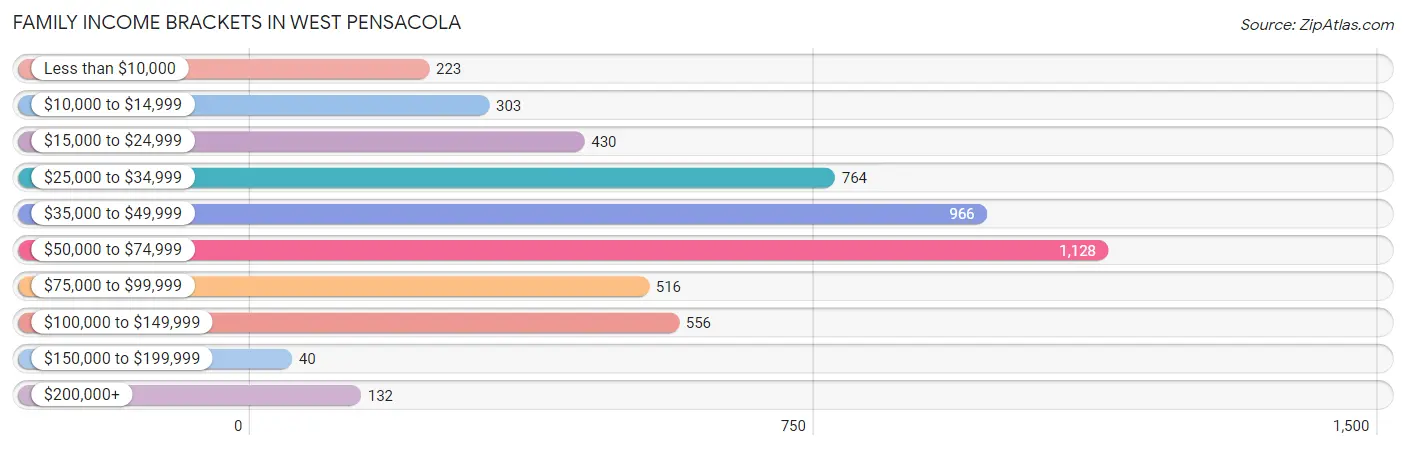
Family Income Brackets in West Pensacola
According to the West Pensacola family income data, there are 1,128 families falling into the $50,000 to $74,999 income range, which is the most common income bracket and makes up 22.3% of all families. Conversely, the $150,000 to $199,999 income bracket is the least frequent group with only 40 families (0.8%) belonging to this category.
| Income Bracket | # Families | % Families |
| Less than $10,000 | 223 | 4.4% |
| $10,000 to $14,999 | 303 | 6.0% |
| $15,000 to $24,999 | 430 | 8.5% |
| $25,000 to $34,999 | 764 | 15.1% |
| $35,000 to $49,999 | 966 | 19.1% |
| $50,000 to $74,999 | 1,128 | 22.3% |
| $75,000 to $99,999 | 516 | 10.2% |
| $100,000 to $149,999 | 556 | 11.0% |
| $150,000 to $199,999 | 40 | 0.8% |
| $200,000+ | 132 | 2.6% |
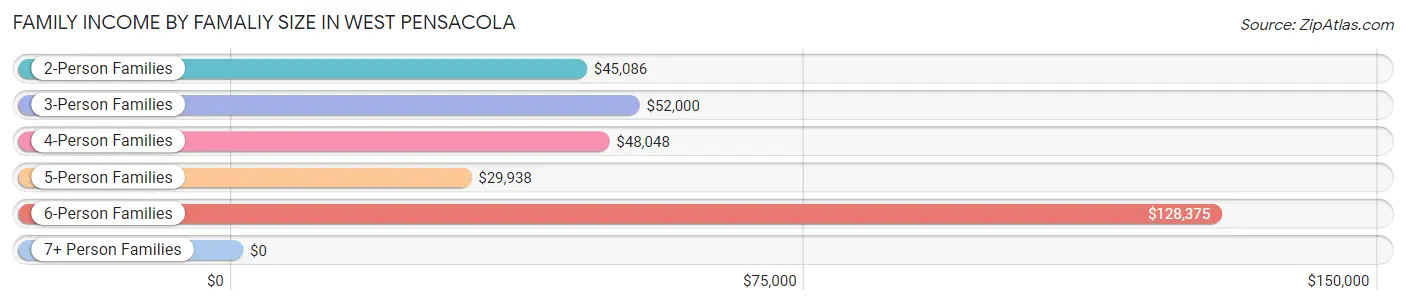
Family Income by Famaliy Size in West Pensacola
6-person families (161 | 3.2%) account for the highest median family income in West Pensacola with $128,375 per family, while 2-person families (2,352 | 46.5%) have the highest median income of $22,543 per family member.
| Income Bracket | # Families | Median Income |
| 2-Person Families | 2,352 (46.5%) | $45,086 |
| 3-Person Families | 1,430 (28.3%) | $52,000 |
| 4-Person Families | 698 (13.8%) | $48,048 |
| 5-Person Families | 417 (8.2%) | $29,938 |
| 6-Person Families | 161 (3.2%) | $128,375 |
| 7+ Person Families | 0 (0.0%) | $0 |
| Total | 5,058 (100.0%) | $46,968 |
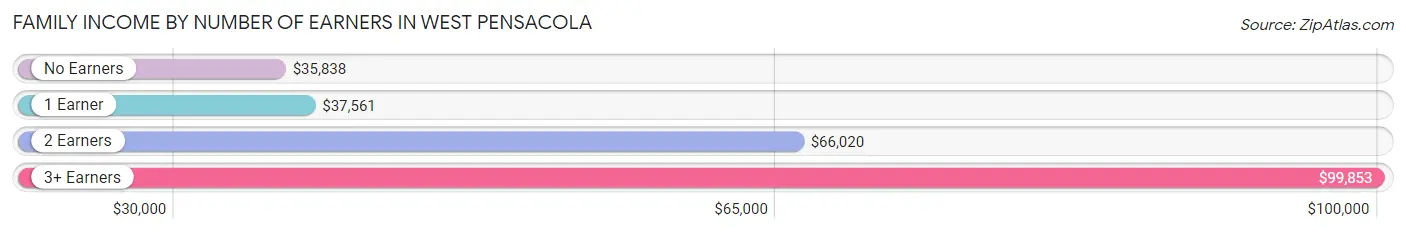
Family Income by Number of Earners in West Pensacola
The median family income in West Pensacola is $46,968, with families comprising 3+ earners (454) having the highest median family income of $99,853, while families with no earners (986) have the lowest median family income of $35,838, accounting for 9.0% and 19.5% of families, respectively.
| Number of Earners | # Families | Median Income |
| No Earners | 986 (19.5%) | $35,838 |
| 1 Earner | 2,030 (40.1%) | $37,561 |
| 2 Earners | 1,588 (31.4%) | $66,020 |
| 3+ Earners | 454 (9.0%) | $99,853 |
| Total | 5,058 (100.0%) | $46,968 |
Household Income in West Pensacola
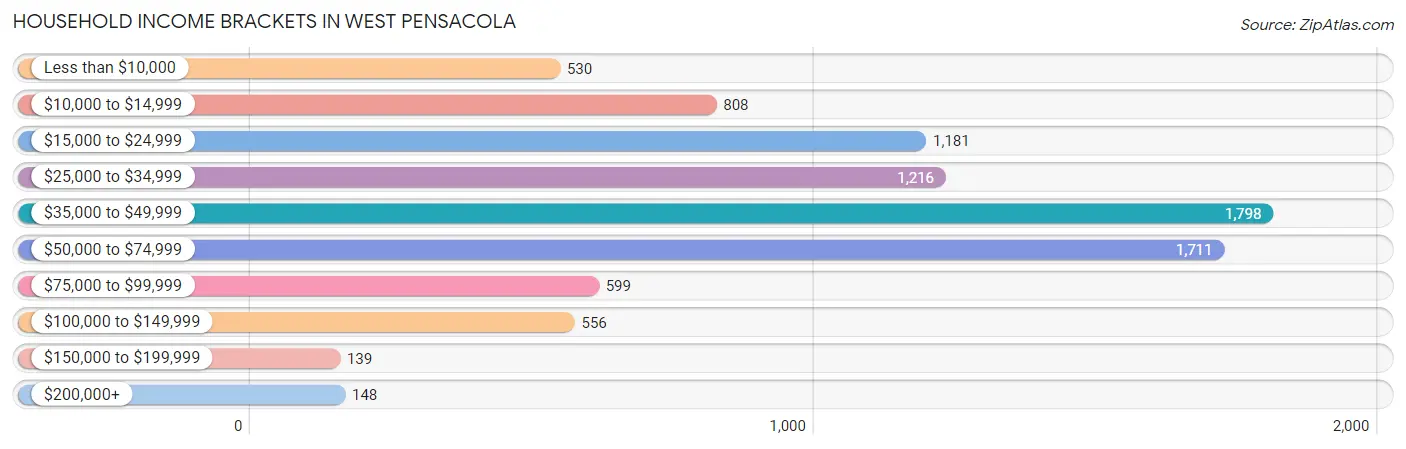
Household Income Brackets in West Pensacola
With 1,798 households falling in the category, the $35,000 to $49,999 income range is the most frequent in West Pensacola, accounting for 20.7% of all households. In contrast, only 139 households (1.6%) fall into the $150,000 to $199,999 income bracket, making it the least populous group.
| Income Bracket | # Households | % Households |
| Less than $10,000 | 530 | 6.1% |
| $10,000 to $14,999 | 808 | 9.3% |
| $15,000 to $24,999 | 1,181 | 13.6% |
| $25,000 to $34,999 | 1,216 | 14.0% |
| $35,000 to $49,999 | 1,798 | 20.7% |
| $50,000 to $74,999 | 1,711 | 19.7% |
| $75,000 to $99,999 | 599 | 6.9% |
| $100,000 to $149,999 | 556 | 6.4% |
| $150,000 to $199,999 | 139 | 1.6% |
| $200,000+ | 148 | 1.7% |
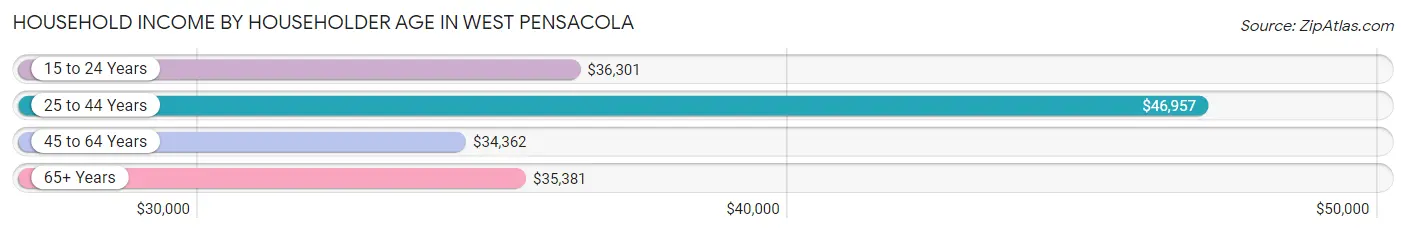
Household Income by Householder Age in West Pensacola
The median household income in West Pensacola is $38,263, with the highest median household income of $46,957 found in the 25 to 44 years age bracket for the primary householder. A total of 2,887 households (33.2%) fall into this category. Meanwhile, the 45 to 64 years age bracket for the primary householder has the lowest median household income of $34,362, with 2,873 households (33.1%) in this group.
| Income Bracket | # Households | Median Income |
| 15 to 24 Years | 555 (6.4%) | $36,301 |
| 25 to 44 Years | 2,887 (33.2%) | $46,957 |
| 45 to 64 Years | 2,873 (33.1%) | $34,362 |
| 65+ Years | 2,371 (27.3%) | $35,381 |
| Total | 8,686 (100.0%) | $38,263 |
Poverty in West Pensacola
Income Below Poverty by Sex and Age in West Pensacola
With 27.7% poverty level for males and 22.9% for females among the residents of West Pensacola, 12 to 14 year old males and 16 and 17 year old females are the most vulnerable to poverty, with 216 males (75.0%) and 123 females (66.8%) in their respective age groups living below the poverty level.
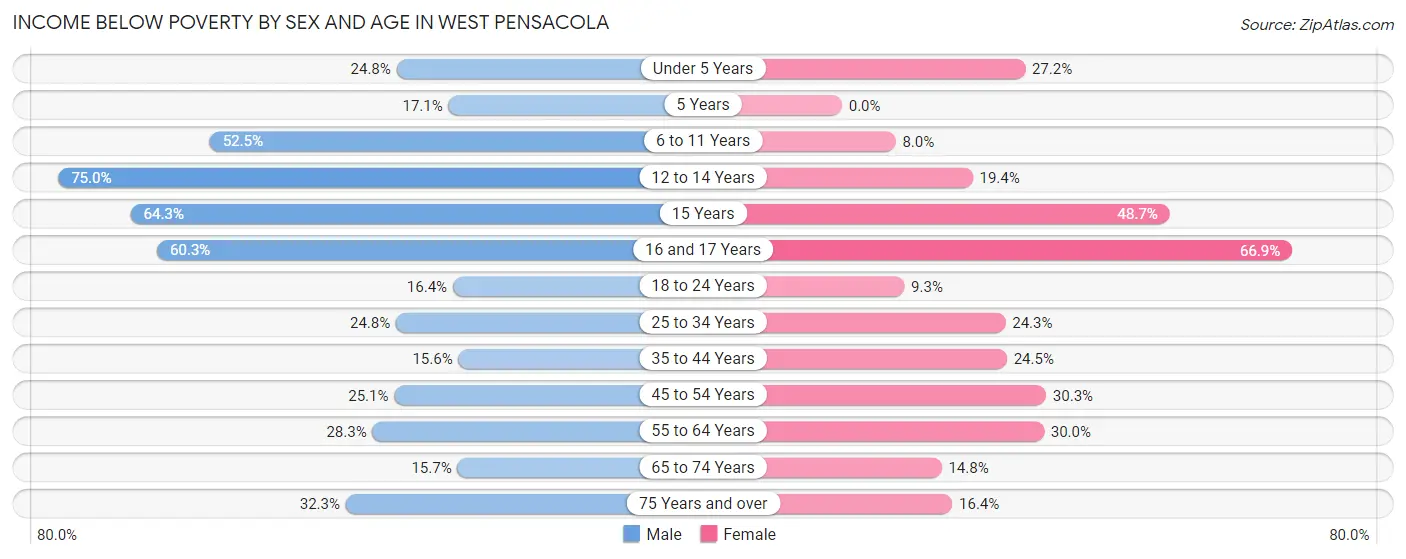
| Age Bracket | Male | Female |
| Under 5 Years | 179 (24.8%) | 253 (27.2%) |
| 5 Years | 30 (17.1%) | 0 (0.0%) |
| 6 to 11 Years | 462 (52.5%) | 51 (8.0%) |
| 12 to 14 Years | 216 (75.0%) | 33 (19.4%) |
| 15 Years | 124 (64.2%) | 37 (48.7%) |
| 16 and 17 Years | 143 (60.3%) | 123 (66.8%) |
| 18 to 24 Years | 165 (16.4%) | 79 (9.3%) |
| 25 to 34 Years | 431 (24.8%) | 420 (24.3%) |
| 35 to 44 Years | 189 (15.6%) | 314 (24.5%) |
| 45 to 54 Years | 336 (25.1%) | 384 (30.3%) |
| 55 to 64 Years | 312 (28.3%) | 428 (30.0%) |
| 65 to 74 Years | 192 (15.7%) | 199 (14.8%) |
| 75 Years and over | 137 (32.3%) | 86 (16.4%) |
| Total | 2,916 (27.7%) | 2,407 (22.9%) |
Income Above Poverty by Sex and Age in West Pensacola
According to the poverty statistics in West Pensacola, males aged 35 to 44 years and females aged 5 years are the age groups that are most secure financially, with 84.4% of males and 100.0% of females in these age groups living above the poverty line.
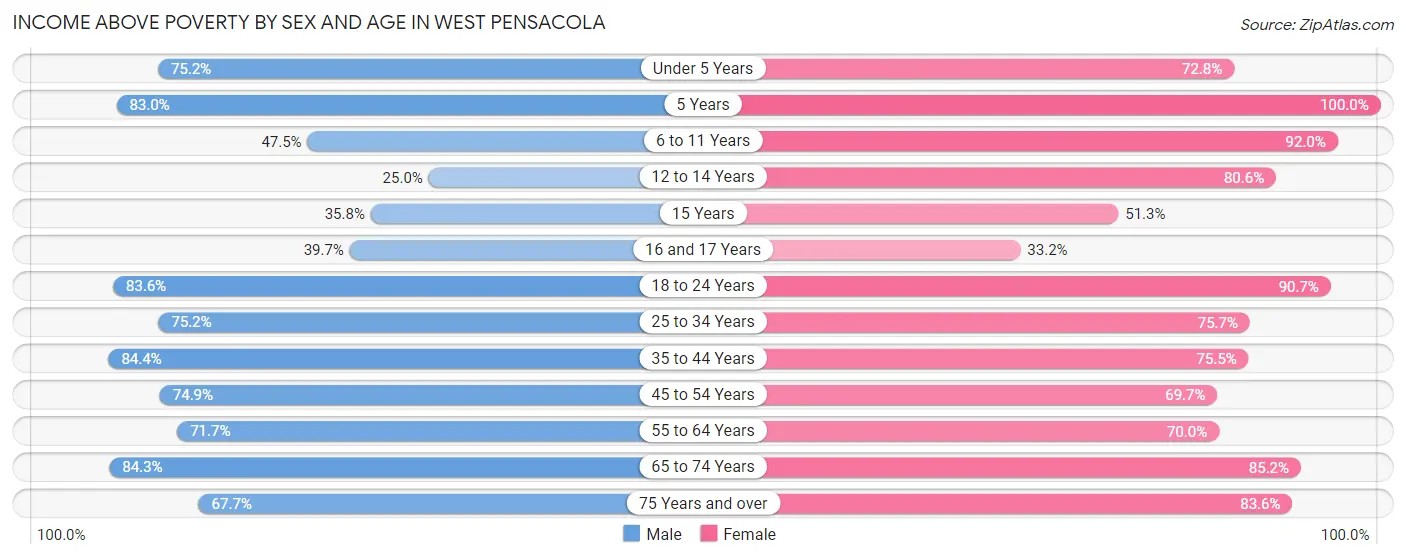
| Age Bracket | Male | Female |
| Under 5 Years | 544 (75.2%) | 677 (72.8%) |
| 5 Years | 146 (83.0%) | 92 (100.0%) |
| 6 to 11 Years | 418 (47.5%) | 589 (92.0%) |
| 12 to 14 Years | 72 (25.0%) | 137 (80.6%) |
| 15 Years | 69 (35.7%) | 39 (51.3%) |
| 16 and 17 Years | 94 (39.7%) | 61 (33.2%) |
| 18 to 24 Years | 841 (83.6%) | 774 (90.7%) |
| 25 to 34 Years | 1,304 (75.2%) | 1,310 (75.7%) |
| 35 to 44 Years | 1,025 (84.4%) | 968 (75.5%) |
| 45 to 54 Years | 1,002 (74.9%) | 883 (69.7%) |
| 55 to 64 Years | 789 (71.7%) | 999 (70.0%) |
| 65 to 74 Years | 1,029 (84.3%) | 1,146 (85.2%) |
| 75 Years and over | 287 (67.7%) | 439 (83.6%) |
| Total | 7,620 (72.3%) | 8,114 (77.1%) |
Income Below Poverty Among Married-Couple Families in West Pensacola
The poverty statistics for married-couple families in West Pensacola show that 14.8% or 400 of the total 2,710 families live below the poverty line. Families with 3 or 4 children have the highest poverty rate of 64.0%, comprising of 80 families. On the other hand, families with no children have the lowest poverty rate of 7.4%, which includes 124 families.
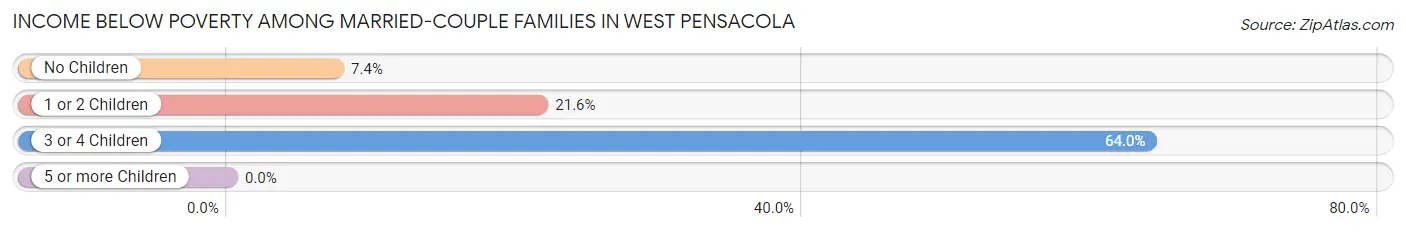
| Children | Above Poverty | Below Poverty |
| No Children | 1,554 (92.6%) | 124 (7.4%) |
| 1 or 2 Children | 711 (78.4%) | 196 (21.6%) |
| 3 or 4 Children | 45 (36.0%) | 80 (64.0%) |
| 5 or more Children | 0 (0.0%) | 0 (0.0%) |
| Total | 2,310 (85.2%) | 400 (14.8%) |
Income Below Poverty Among Single-Parent Households in West Pensacola
According to the poverty data in West Pensacola, 29.3% or 182 single-father households and 20.4% or 353 single-mother households are living below the poverty line. Among single-father households, those with 3 or 4 children have the highest poverty rate, with 53 households (100.0%) experiencing poverty. Likewise, among single-mother households, those with 1 or 2 children have the highest poverty rate, with 279 households (32.0%) falling below the poverty line.
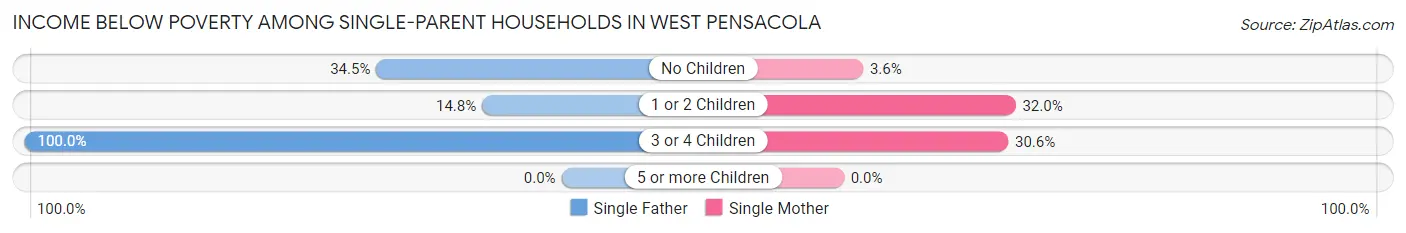
| Children | Single Father | Single Mother |
| No Children | 79 (34.5%) | 25 (3.6%) |
| 1 or 2 Children | 50 (14.8%) | 279 (32.0%) |
| 3 or 4 Children | 53 (100.0%) | 49 (30.6%) |
| 5 or more Children | 0 (0.0%) | 0 (0.0%) |
| Total | 182 (29.3%) | 353 (20.4%) |
Income Below Poverty Among Married-Couple vs Single-Parent Households in West Pensacola
The poverty data for West Pensacola shows that 400 of the married-couple family households (14.8%) and 535 of the single-parent households (22.8%) are living below the poverty level. Within the married-couple family households, those with 3 or 4 children have the highest poverty rate, with 80 households (64.0%) falling below the poverty line. Among the single-parent households, those with 3 or 4 children have the highest poverty rate, with 102 household (47.9%) living below poverty.
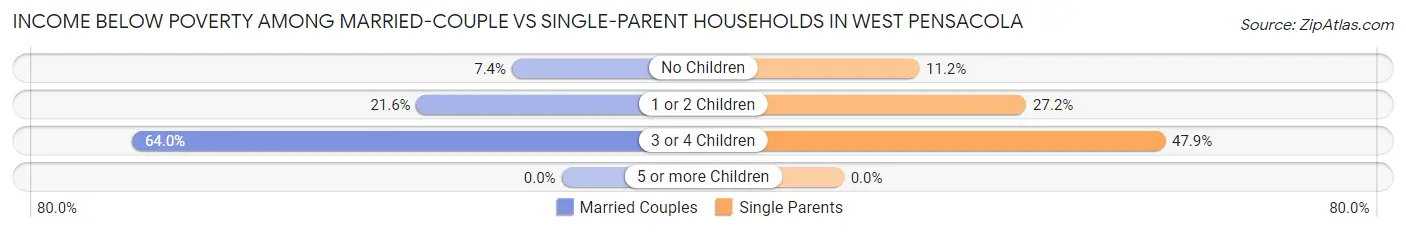
| Children | Married-Couple Families | Single-Parent Households |
| No Children | 124 (7.4%) | 104 (11.2%) |
| 1 or 2 Children | 196 (21.6%) | 329 (27.2%) |
| 3 or 4 Children | 80 (64.0%) | 102 (47.9%) |
| 5 or more Children | 0 (0.0%) | 0 (0.0%) |
| Total | 400 (14.8%) | 535 (22.8%) |
Race in West Pensacola
The most populous races in West Pensacola are White / Caucasian (10,164 | 47.8%), Black / African American (8,505 | 40.0%), and Two or more Races (1,393 | 6.6%).
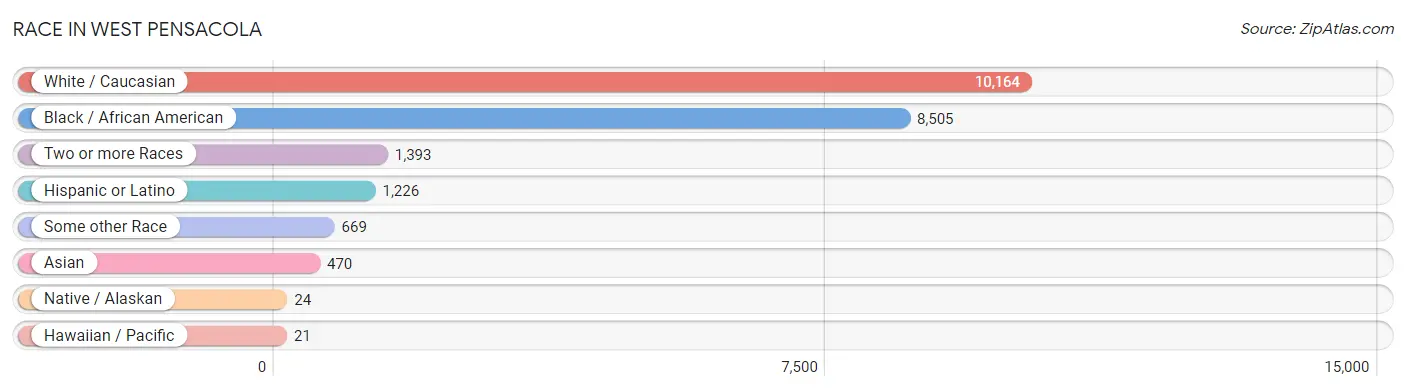
| Race | # Population | % Population |
| Asian | 470 | 2.2% |
| Black / African American | 8,505 | 40.0% |
| Hawaiian / Pacific | 21 | 0.1% |
| Hispanic or Latino | 1,226 | 5.8% |
| Native / Alaskan | 24 | 0.1% |
| White / Caucasian | 10,164 | 47.8% |
| Two or more Races | 1,393 | 6.6% |
| Some other Race | 669 | 3.2% |
| Total | 21,246 | 100.0% |
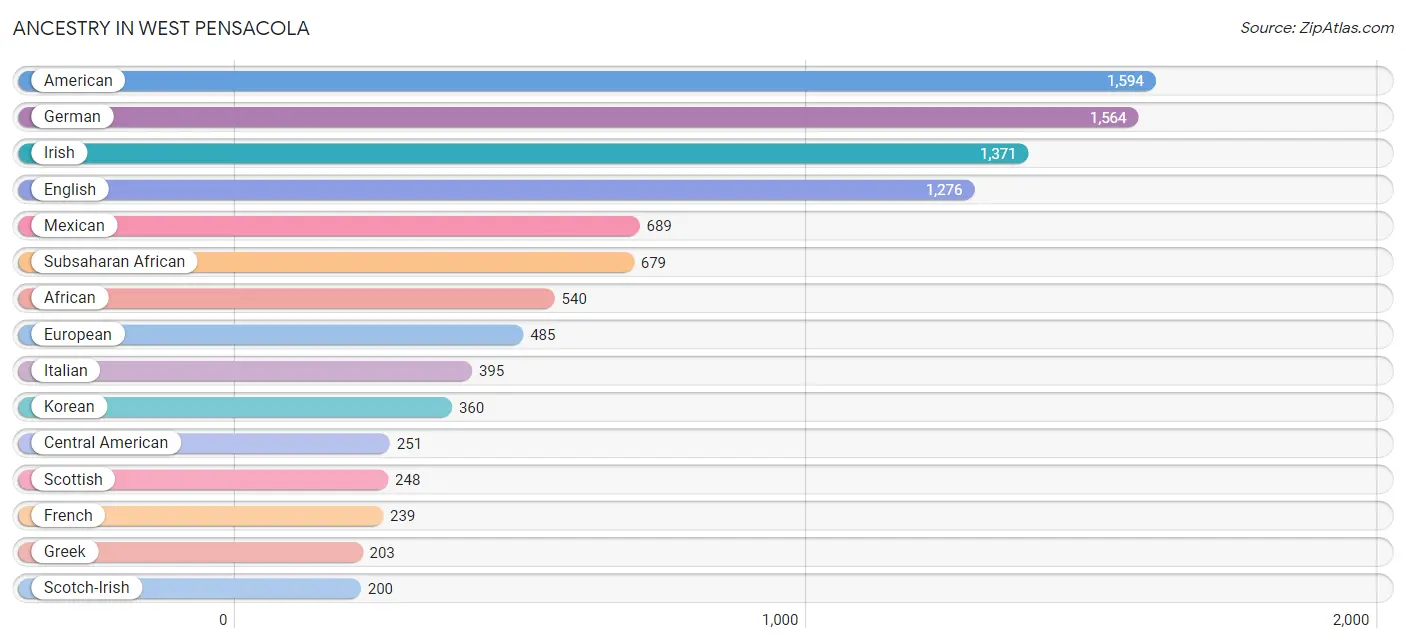
Ancestry in West Pensacola
The most populous ancestries reported in West Pensacola are American (1,594 | 7.5%), German (1,564 | 7.4%), Irish (1,371 | 6.5%), English (1,276 | 6.0%), and Mexican (689 | 3.2%), together accounting for 30.6% of all West Pensacola residents.
| Ancestry | # Population | % Population |
| African | 540 | 2.5% |
| American | 1,594 | 7.5% |
| Argentinean | 69 | 0.3% |
| Austrian | 9 | 0.0% |
| Bahamian | 15 | 0.1% |
| Bangladeshi | 34 | 0.2% |
| Bhutanese | 40 | 0.2% |
| Brazilian | 26 | 0.1% |
| British | 63 | 0.3% |
| Burmese | 37 | 0.2% |
| Cajun | 9 | 0.0% |
| Canadian | 51 | 0.2% |
| Central American | 251 | 1.2% |
| Cherokee | 15 | 0.1% |
| Colombian | 16 | 0.1% |
| Cree | 53 | 0.3% |
| Creek | 54 | 0.3% |
| Cuban | 30 | 0.1% |
| Dutch | 83 | 0.4% |
| English | 1,276 | 6.0% |
| European | 485 | 2.3% |
| Finnish | 7 | 0.0% |
| French | 239 | 1.1% |
| French Canadian | 56 | 0.3% |
| German | 1,564 | 7.4% |
| German Russian | 22 | 0.1% |
| Greek | 203 | 1.0% |
| Guamanian / Chamorro | 21 | 0.1% |
| Guatemalan | 133 | 0.6% |
| Haitian | 89 | 0.4% |
| Honduran | 64 | 0.3% |
| Hungarian | 33 | 0.2% |
| Indian (Asian) | 45 | 0.2% |
| Irish | 1,371 | 6.5% |
| Italian | 395 | 1.9% |
| Jamaican | 30 | 0.1% |
| Korean | 360 | 1.7% |
| Laotian | 22 | 0.1% |
| Mexican | 689 | 3.2% |
| Mongolian | 16 | 0.1% |
| Native Hawaiian | 23 | 0.1% |
| Nepalese | 10 | 0.1% |
| Nicaraguan | 2 | 0.0% |
| Nigerian | 29 | 0.1% |
| Northern European | 54 | 0.3% |
| Norwegian | 55 | 0.3% |
| Paiute | 74 | 0.4% |
| Pakistani | 20 | 0.1% |
| Panamanian | 52 | 0.2% |
| Pennsylvania German | 30 | 0.1% |
| Peruvian | 33 | 0.2% |
| Polish | 71 | 0.3% |
| Puerto Rican | 104 | 0.5% |
| Romanian | 66 | 0.3% |
| Russian | 37 | 0.2% |
| Scotch-Irish | 200 | 0.9% |
| Scottish | 248 | 1.2% |
| Seminole | 13 | 0.1% |
| Senegalese | 110 | 0.5% |
| Slovak | 11 | 0.1% |
| South American | 121 | 0.6% |
| Spaniard | 31 | 0.2% |
| Sri Lankan | 190 | 0.9% |
| Subsaharan African | 679 | 3.2% |
| Swedish | 77 | 0.4% |
| Swiss | 29 | 0.1% |
| Thai | 18 | 0.1% |
| Trinidadian and Tobagonian | 42 | 0.2% |
| Ukrainian | 31 | 0.2% |
| Venezuelan | 3 | 0.0% |
| Welsh | 75 | 0.4% | View All 71 Rows |
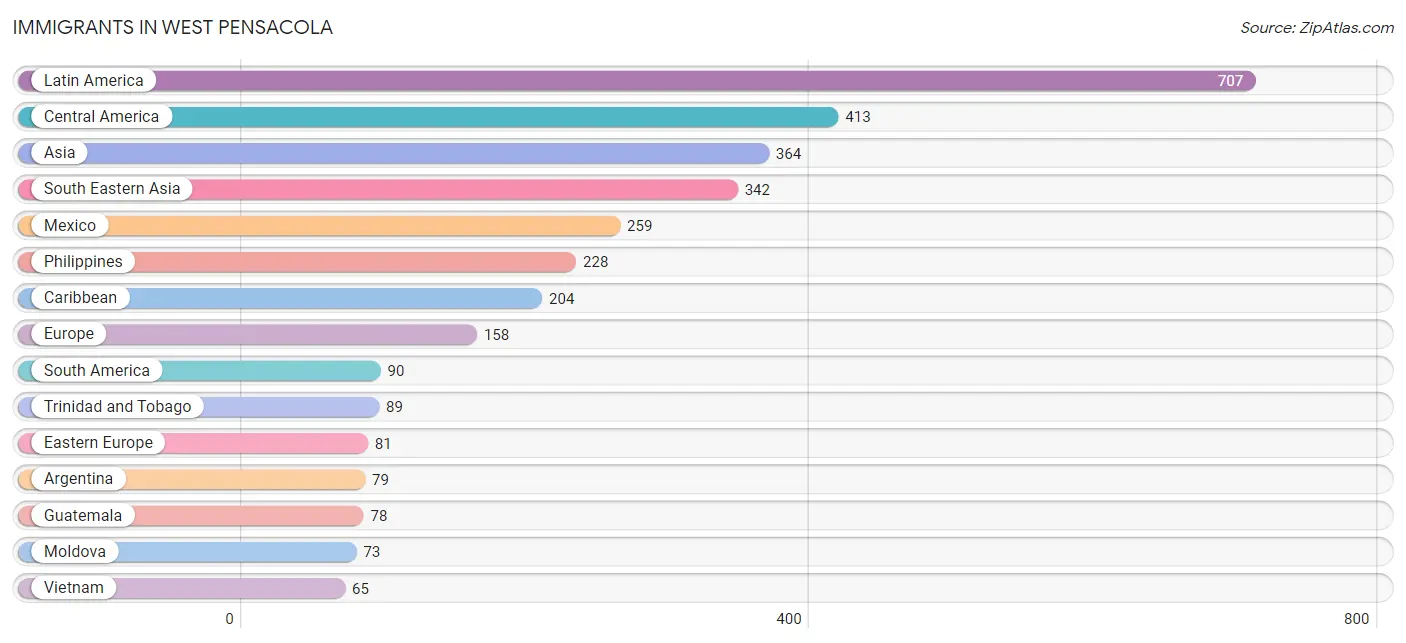
Immigrants in West Pensacola
The most numerous immigrant groups reported in West Pensacola came from Latin America (707 | 3.3%), Central America (413 | 1.9%), Asia (364 | 1.7%), South Eastern Asia (342 | 1.6%), and Mexico (259 | 1.2%), together accounting for 9.8% of all West Pensacola residents.
| Immigration Origin | # Population | % Population |
| Africa | 63 | 0.3% |
| Argentina | 79 | 0.4% |
| Asia | 364 | 1.7% |
| Bahamas | 15 | 0.1% |
| Brazil | 8 | 0.0% |
| Caribbean | 204 | 1.0% |
| Central America | 413 | 1.9% |
| Cuba | 10 | 0.1% |
| Eastern Asia | 22 | 0.1% |
| Eastern Europe | 81 | 0.4% |
| England | 35 | 0.2% |
| Europe | 158 | 0.7% |
| France | 5 | 0.0% |
| Germany | 19 | 0.1% |
| Guatemala | 78 | 0.4% |
| Haiti | 49 | 0.2% |
| Honduras | 64 | 0.3% |
| Indonesia | 13 | 0.1% |
| Jamaica | 41 | 0.2% |
| Japan | 22 | 0.1% |
| Latin America | 707 | 3.3% |
| Mexico | 259 | 1.2% |
| Moldova | 73 | 0.3% |
| Nicaragua | 2 | 0.0% |
| Nigeria | 3 | 0.0% |
| Northern Europe | 53 | 0.3% |
| Panama | 10 | 0.1% |
| Philippines | 228 | 1.1% |
| Romania | 8 | 0.0% |
| Senegal | 60 | 0.3% |
| Singapore | 16 | 0.1% |
| South America | 90 | 0.4% |
| South Eastern Asia | 342 | 1.6% |
| Thailand | 20 | 0.1% |
| Trinidad and Tobago | 89 | 0.4% |
| Venezuela | 3 | 0.0% |
| Vietnam | 65 | 0.3% |
| Western Africa | 63 | 0.3% |
| Western Europe | 24 | 0.1% | View All 39 Rows |
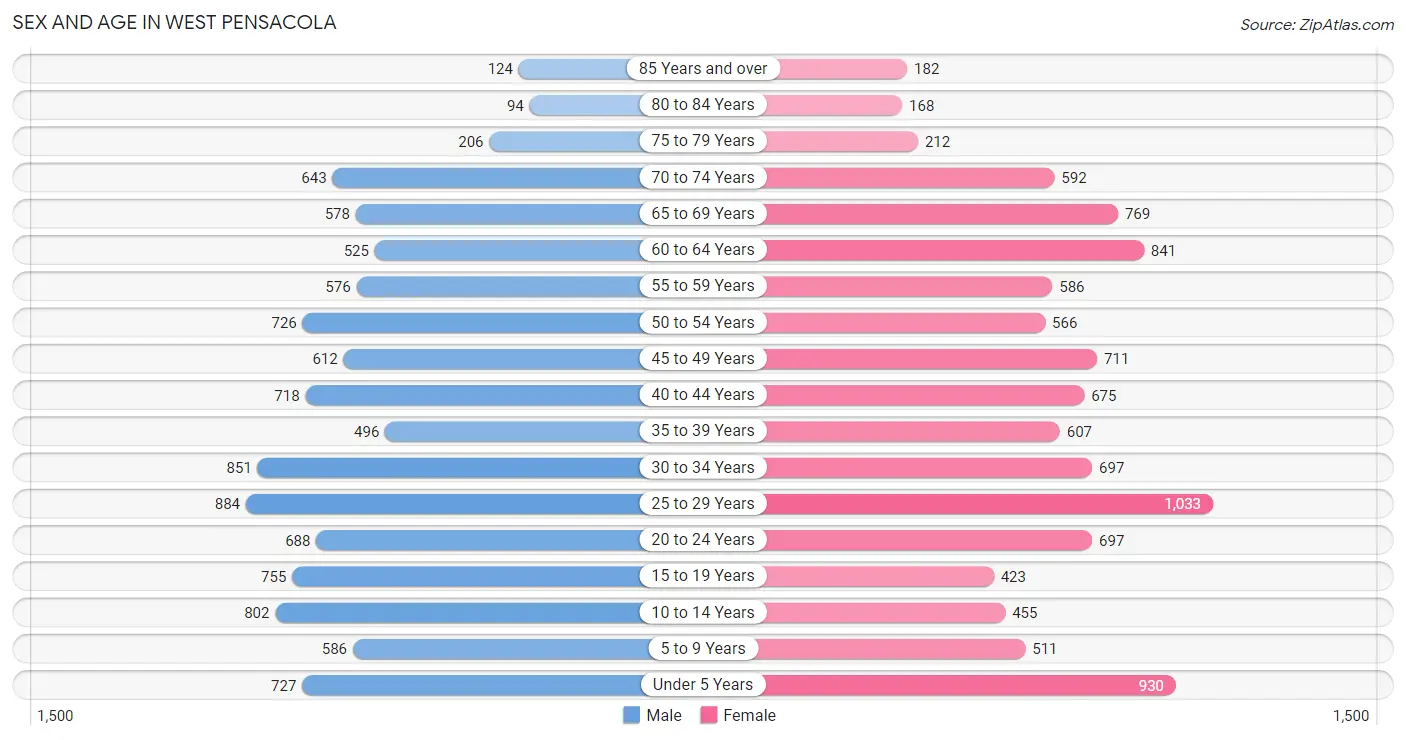
Sex and Age in West Pensacola
Sex and Age in West Pensacola
The most populous age groups in West Pensacola are 25 to 29 Years (884 | 8.4%) for men and 25 to 29 Years (1,033 | 9.7%) for women.
| Age Bracket | Male | Female |
| Under 5 Years | 727 (6.9%) | 930 (8.7%) |
| 5 to 9 Years | 586 (5.5%) | 511 (4.8%) |
| 10 to 14 Years | 802 (7.6%) | 455 (4.3%) |
| 15 to 19 Years | 755 (7.1%) | 423 (4.0%) |
| 20 to 24 Years | 688 (6.5%) | 697 (6.5%) |
| 25 to 29 Years | 884 (8.4%) | 1,033 (9.7%) |
| 30 to 34 Years | 851 (8.0%) | 697 (6.5%) |
| 35 to 39 Years | 496 (4.7%) | 607 (5.7%) |
| 40 to 44 Years | 718 (6.8%) | 675 (6.3%) |
| 45 to 49 Years | 612 (5.8%) | 711 (6.7%) |
| 50 to 54 Years | 726 (6.9%) | 566 (5.3%) |
| 55 to 59 Years | 576 (5.4%) | 586 (5.5%) |
| 60 to 64 Years | 525 (5.0%) | 841 (7.9%) |
| 65 to 69 Years | 578 (5.5%) | 769 (7.2%) |
| 70 to 74 Years | 643 (6.1%) | 592 (5.6%) |
| 75 to 79 Years | 206 (1.9%) | 212 (2.0%) |
| 80 to 84 Years | 94 (0.9%) | 168 (1.6%) |
| 85 Years and over | 124 (1.2%) | 182 (1.7%) |
| Total | 10,591 (100.0%) | 10,655 (100.0%) |
Families and Households in West Pensacola
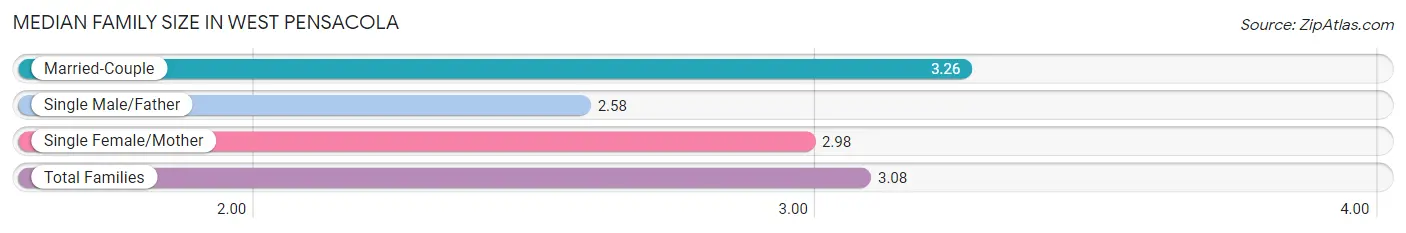
Median Family Size in West Pensacola
The median family size in West Pensacola is 3.08 persons per family, with married-couple families (2,710 | 53.6%) accounting for the largest median family size of 3.26 persons per family. On the other hand, single male/father families (620 | 12.3%) represent the smallest median family size with 2.58 persons per family.
| Family Type | # Families | Family Size |
| Married-Couple | 2,710 (53.6%) | 3.26 |
| Single Male/Father | 620 (12.3%) | 2.58 |
| Single Female/Mother | 1,728 (34.2%) | 2.98 |
| Total Families | 5,058 (100.0%) | 3.08 |
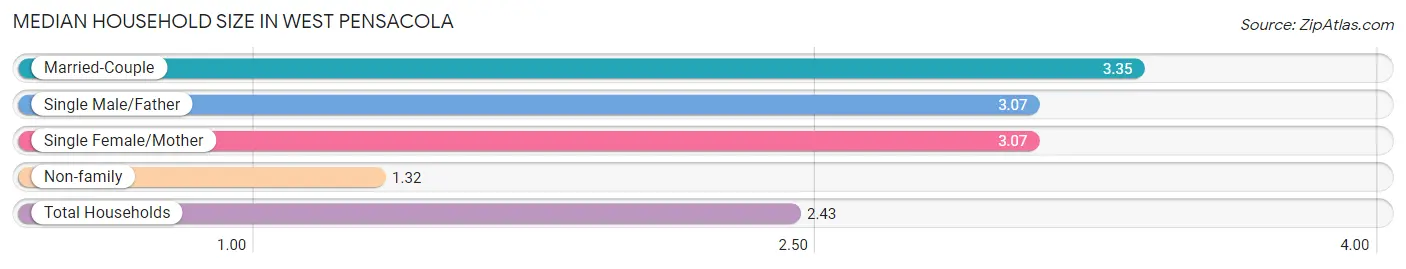
Median Household Size in West Pensacola
The median household size in West Pensacola is 2.43 persons per household, with married-couple households (2,710 | 31.2%) accounting for the largest median household size of 3.35 persons per household. non-family households (3,628 | 41.8%) represent the smallest median household size with 1.32 persons per household.
| Household Type | # Households | Household Size |
| Married-Couple | 2,710 (31.2%) | 3.35 |
| Single Male/Father | 620 (7.1%) | 3.07 |
| Single Female/Mother | 1,728 (19.9%) | 3.07 |
| Non-family | 3,628 (41.8%) | 1.32 |
| Total Households | 8,686 (100.0%) | 2.43 |
Household Size by Marriage Status in West Pensacola
Out of a total of 8,686 households in West Pensacola, 5,058 (58.2%) are family households, while 3,628 (41.8%) are nonfamily households. The most numerous type of family households are 2-person households, comprising 2,208, and the most common type of nonfamily households are 1-person households, comprising 2,794.
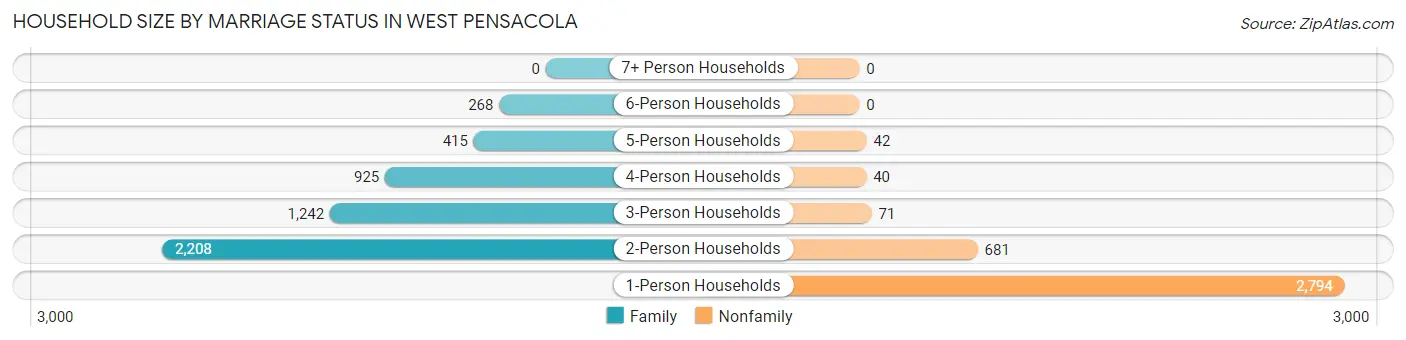
| Household Size | Family Households | Nonfamily Households |
| 1-Person Households | - | 2,794 (32.2%) |
| 2-Person Households | 2,208 (25.4%) | 681 (7.8%) |
| 3-Person Households | 1,242 (14.3%) | 71 (0.8%) |
| 4-Person Households | 925 (10.6%) | 40 (0.5%) |
| 5-Person Households | 415 (4.8%) | 42 (0.5%) |
| 6-Person Households | 268 (3.1%) | 0 (0.0%) |
| 7+ Person Households | 0 (0.0%) | 0 (0.0%) |
| Total | 5,058 (58.2%) | 3,628 (41.8%) |
Female Fertility in West Pensacola
Fertility by Age in West Pensacola
Average fertility rate in West Pensacola is 113.0 births per 1,000 women. Women in the age bracket of 15 to 19 years have the highest fertility rate with 324.0 births per 1,000 women. Women in the age bracket of 20 to 34 years acount for 72.6% of all women with births.
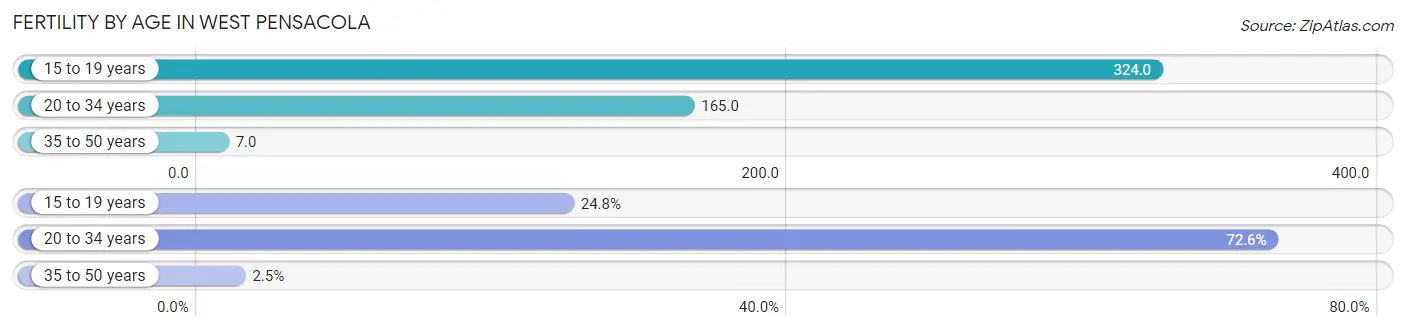
| Age Bracket | Women with Births | Births / 1,000 Women |
| 15 to 19 years | 137 (24.8%) | 324.0 |
| 20 to 34 years | 401 (72.6%) | 165.0 |
| 35 to 50 years | 14 (2.5%) | 7.0 |
| Total | 552 (100.0%) | 113.0 |
Fertility by Age by Marriage Status in West Pensacola
37.0% of women with births (552) in West Pensacola are married. The highest percentage of unmarried women with births falls into 15 to 19 years age bracket with 100.0% of them unmarried at the time of birth, while the lowest percentage of unmarried women with births belong to 35 to 50 years age bracket with 0.0% of them unmarried.
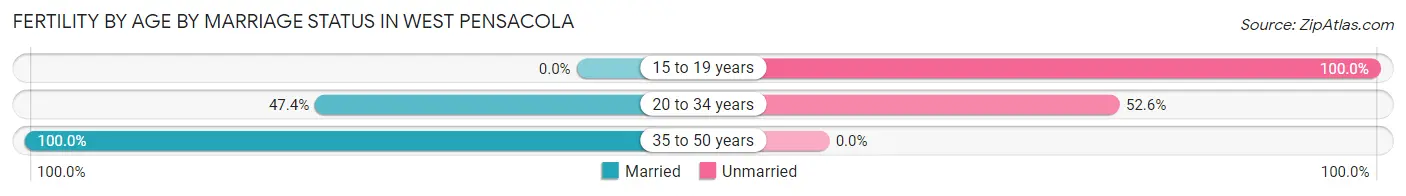
| Age Bracket | Married | Unmarried |
| 15 to 19 years | 0 (0.0%) | 137 (100.0%) |
| 20 to 34 years | 190 (47.4%) | 211 (52.6%) |
| 35 to 50 years | 14 (100.0%) | 0 (0.0%) |
| Total | 204 (37.0%) | 348 (63.0%) |
Fertility by Education in West Pensacola
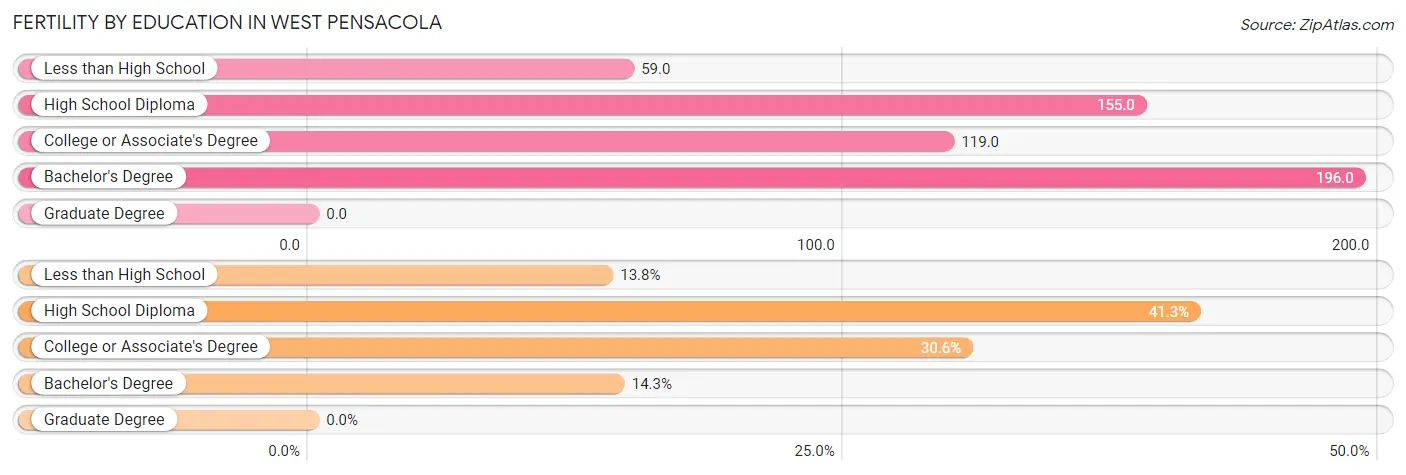
| Educational Attainment | Women with Births | Births / 1,000 Women |
| Less than High School | 76 (13.8%) | 59.0 |
| High School Diploma | 228 (41.3%) | 155.0 |
| College or Associate's Degree | 169 (30.6%) | 119.0 |
| Bachelor's Degree | 79 (14.3%) | 196.0 |
| Graduate Degree | 0 (0.0%) | 0.0 |
| Total | 552 (100.0%) | 113.0 |
Fertility by Education by Marriage Status in West Pensacola
63.0% of women with births in West Pensacola are unmarried. Women with the educational attainment of high school diploma are most likely to be married with 54.8% of them married at childbirth, while women with the educational attainment of less than high school are least likely to be married with 100.0% of them unmarried at childbirth.
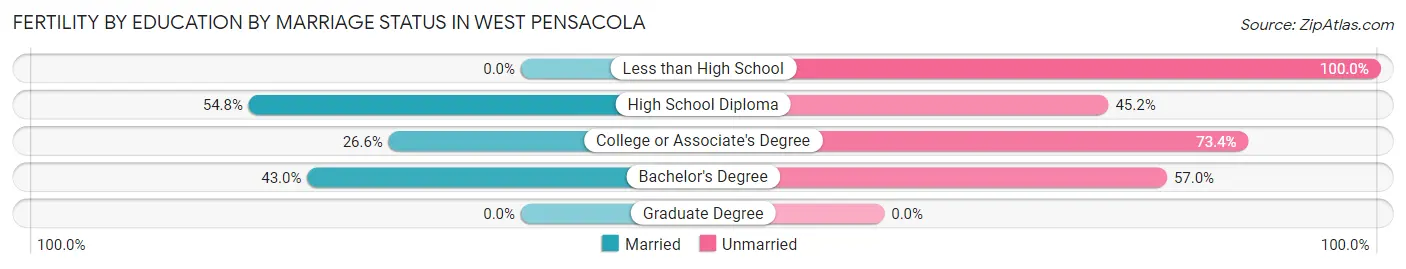
| Educational Attainment | Married | Unmarried |
| Less than High School | 0 (0.0%) | 76 (100.0%) |
| High School Diploma | 125 (54.8%) | 103 (45.2%) |
| College or Associate's Degree | 45 (26.6%) | 124 (73.4%) |
| Bachelor's Degree | 34 (43.0%) | 45 (57.0%) |
| Graduate Degree | 0 (0.0%) | 0 (0.0%) |
| Total | 204 (37.0%) | 348 (63.0%) |
Employment Characteristics in West Pensacola
Employment by Class of Employer in West Pensacola
Among the 8,544 employed individuals in West Pensacola, private company employees (5,999 | 70.2%), not-for-profit organizations (887 | 10.4%), and self-employed (not incorporated) (566 | 6.6%) make up the most common classes of employment.
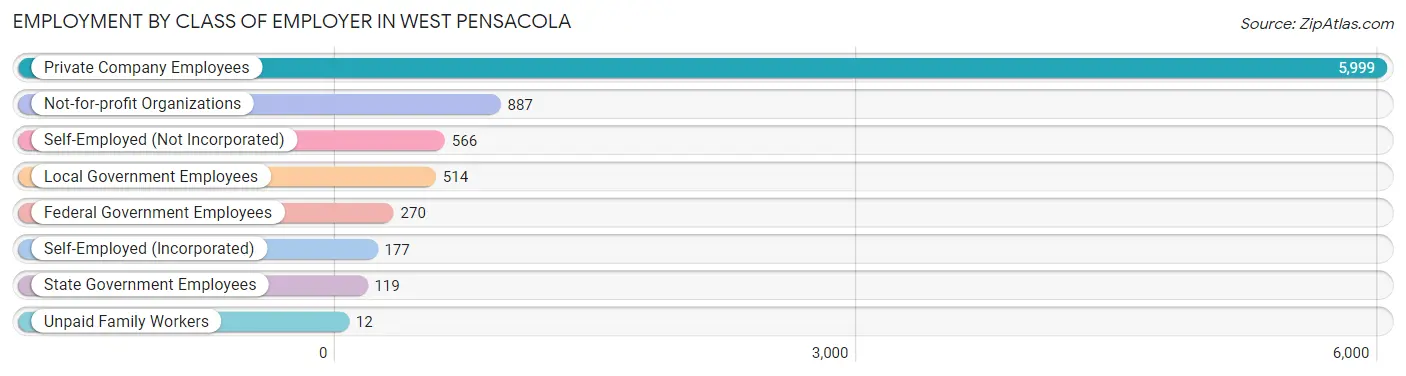
| Employer Class | # Employees | % Employees |
| Private Company Employees | 5,999 | 70.2% |
| Self-Employed (Incorporated) | 177 | 2.1% |
| Self-Employed (Not Incorporated) | 566 | 6.6% |
| Not-for-profit Organizations | 887 | 10.4% |
| Local Government Employees | 514 | 6.0% |
| State Government Employees | 119 | 1.4% |
| Federal Government Employees | 270 | 3.2% |
| Unpaid Family Workers | 12 | 0.1% |
| Total | 8,544 | 100.0% |
Employment Status by Age in West Pensacola
According to the labor force statistics for West Pensacola, out of the total population over 16 years of age (16,966), 55.9% or 9,484 individuals are in the labor force, with 6.9% or 654 of them unemployed. The age group with the highest labor force participation rate is 20 to 24 years, with 94.1% or 1,303 individuals in the labor force. Within the labor force, the 16 to 19 years age range has the highest percentage of unemployed individuals, with 19.0% or 63 of them being unemployed.
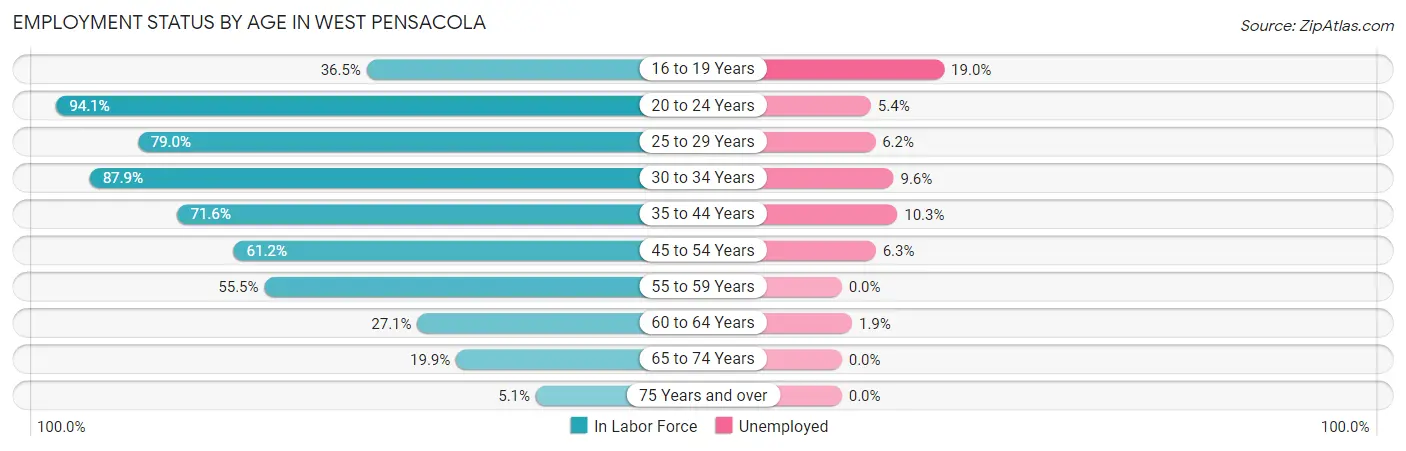
| Age Bracket | In Labor Force | Unemployed |
| 16 to 19 Years | 332 (36.5%) | 63 (19.0%) |
| 20 to 24 Years | 1,303 (94.1%) | 70 (5.4%) |
| 25 to 29 Years | 1,514 (79.0%) | 94 (6.2%) |
| 30 to 34 Years | 1,361 (87.9%) | 131 (9.6%) |
| 35 to 44 Years | 1,787 (71.6%) | 184 (10.3%) |
| 45 to 54 Years | 1,600 (61.2%) | 101 (6.3%) |
| 55 to 59 Years | 645 (55.5%) | 0 (0.0%) |
| 60 to 64 Years | 370 (27.1%) | 7 (1.9%) |
| 65 to 74 Years | 514 (19.9%) | 0 (0.0%) |
| 75 Years and over | 50 (5.1%) | 0 (0.0%) |
| Total | 9,484 (55.9%) | 654 (6.9%) |
Employment Status by Educational Attainment in West Pensacola
According to labor force statistics for West Pensacola, 65.5% of individuals (7,273) out of the total population between 25 and 64 years of age (11,104) are in the labor force, with 7.1% or 516 of them being unemployed. The group with the highest labor force participation rate are those with the educational attainment of bachelor's degree or higher, with 81.2% or 1,212 individuals in the labor force. Within the labor force, individuals with less than high school education have the highest percentage of unemployment, with 9.6% or 122 of them being unemployed.
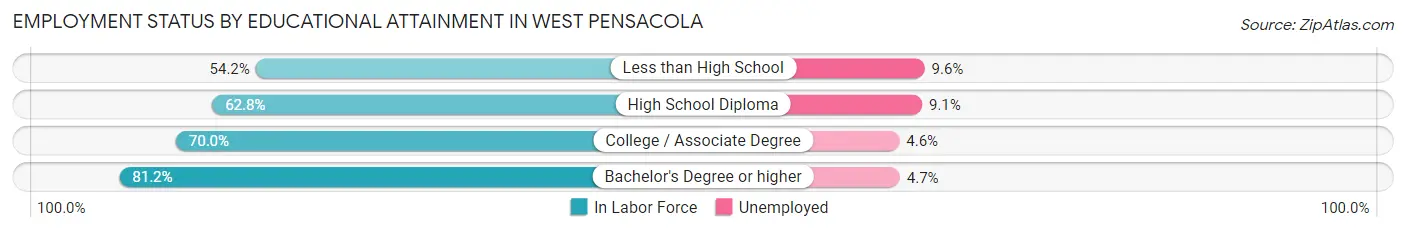
| Educational Attainment | In Labor Force | Unemployed |
| Less than High School | 1,273 (54.2%) | 226 (9.6%) |
| High School Diploma | 2,569 (62.8%) | 372 (9.1%) |
| College / Associate Degree | 2,220 (70.0%) | 146 (4.6%) |
| Bachelor's Degree or higher | 1,212 (81.2%) | 70 (4.7%) |
| Total | 7,273 (65.5%) | 788 (7.1%) |
Employment Occupations by Sex in West Pensacola
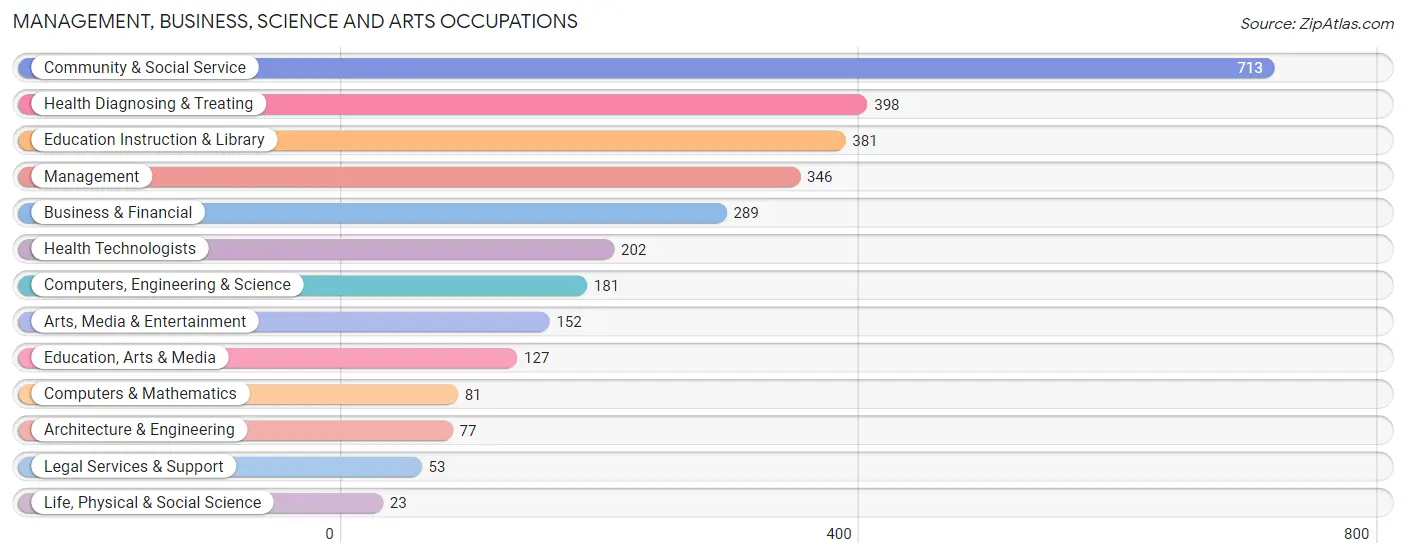
Management, Business, Science and Arts Occupations
The most common Management, Business, Science and Arts occupations in West Pensacola are Community & Social Service (713 | 8.1%), Health Diagnosing & Treating (398 | 4.5%), Education Instruction & Library (381 | 4.3%), Management (346 | 3.9%), and Business & Financial (289 | 3.3%).
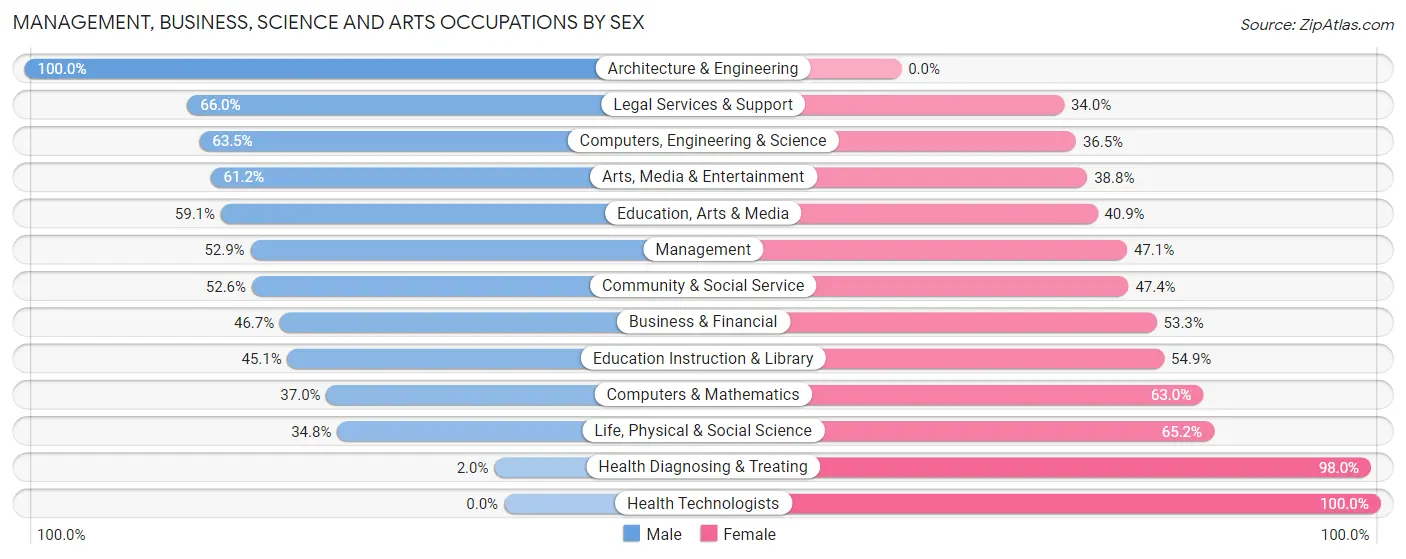
Management, Business, Science and Arts Occupations by Sex
Within the Management, Business, Science and Arts occupations in West Pensacola, the most male-oriented occupations are Architecture & Engineering (100.0%), Legal Services & Support (66.0%), and Computers, Engineering & Science (63.5%), while the most female-oriented occupations are Health Technologists (100.0%), Health Diagnosing & Treating (98.0%), and Life, Physical & Social Science (65.2%).
| Occupation | Male | Female |
| Management | 183 (52.9%) | 163 (47.1%) |
| Business & Financial | 135 (46.7%) | 154 (53.3%) |
| Computers, Engineering & Science | 115 (63.5%) | 66 (36.5%) |
| Computers & Mathematics | 30 (37.0%) | 51 (63.0%) |
| Architecture & Engineering | 77 (100.0%) | 0 (0.0%) |
| Life, Physical & Social Science | 8 (34.8%) | 15 (65.2%) |
| Community & Social Service | 375 (52.6%) | 338 (47.4%) |
| Education, Arts & Media | 75 (59.1%) | 52 (40.9%) |
| Legal Services & Support | 35 (66.0%) | 18 (34.0%) |
| Education Instruction & Library | 172 (45.1%) | 209 (54.9%) |
| Arts, Media & Entertainment | 93 (61.2%) | 59 (38.8%) |
| Health Diagnosing & Treating | 8 (2.0%) | 390 (98.0%) |
| Health Technologists | 0 (0.0%) | 202 (100.0%) |
| Total (Category) | 816 (42.3%) | 1,111 (57.7%) |
| Total (Overall) | 4,445 (50.6%) | 4,332 (49.4%) |
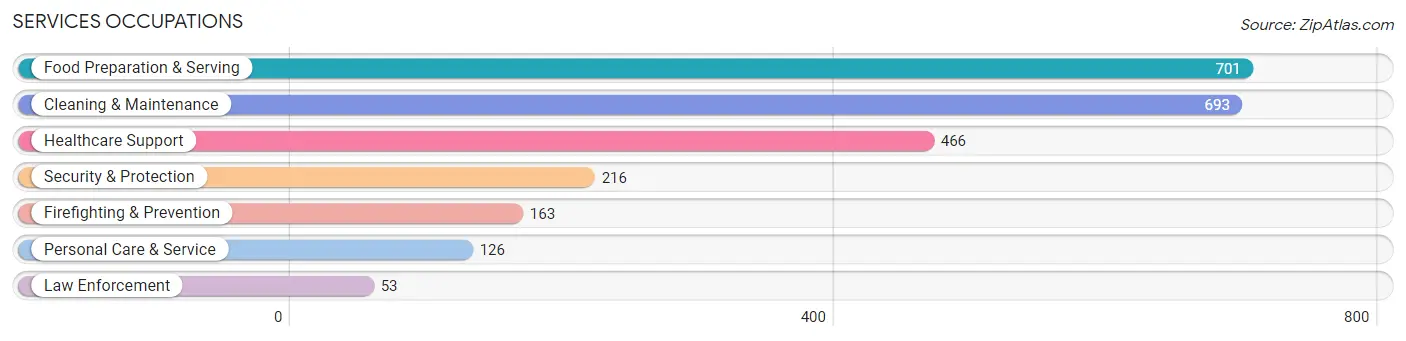
Services Occupations
The most common Services occupations in West Pensacola are Food Preparation & Serving (701 | 8.0%), Cleaning & Maintenance (693 | 7.9%), Healthcare Support (466 | 5.3%), Security & Protection (216 | 2.5%), and Firefighting & Prevention (163 | 1.9%).
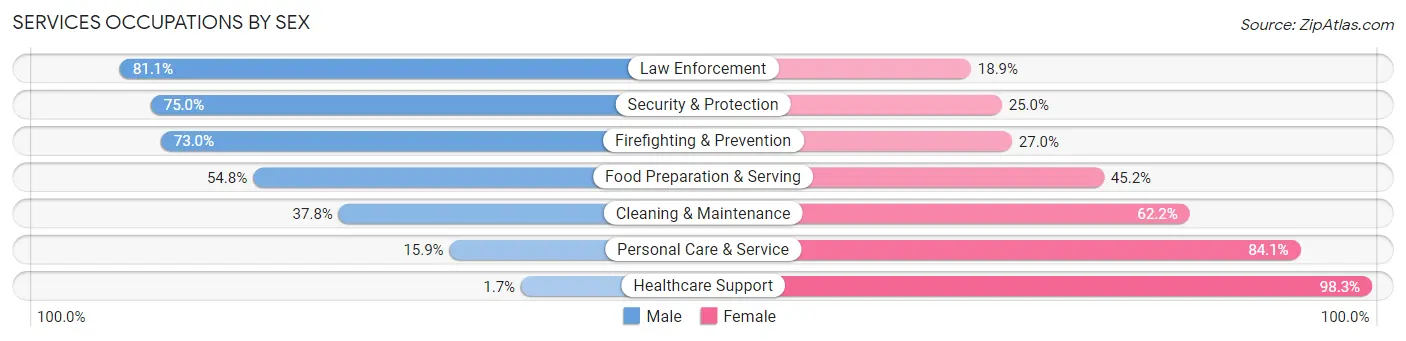
Services Occupations by Sex
Within the Services occupations in West Pensacola, the most male-oriented occupations are Law Enforcement (81.1%), Security & Protection (75.0%), and Firefighting & Prevention (73.0%), while the most female-oriented occupations are Healthcare Support (98.3%), Personal Care & Service (84.1%), and Cleaning & Maintenance (62.2%).
| Occupation | Male | Female |
| Healthcare Support | 8 (1.7%) | 458 (98.3%) |
| Security & Protection | 162 (75.0%) | 54 (25.0%) |
| Firefighting & Prevention | 119 (73.0%) | 44 (27.0%) |
| Law Enforcement | 43 (81.1%) | 10 (18.9%) |
| Food Preparation & Serving | 384 (54.8%) | 317 (45.2%) |
| Cleaning & Maintenance | 262 (37.8%) | 431 (62.2%) |
| Personal Care & Service | 20 (15.9%) | 106 (84.1%) |
| Total (Category) | 836 (38.0%) | 1,366 (62.0%) |
| Total (Overall) | 4,445 (50.6%) | 4,332 (49.4%) |
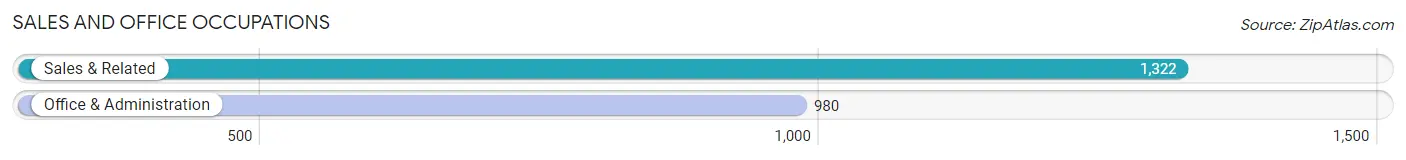
Sales and Office Occupations
The most common Sales and Office occupations in West Pensacola are Sales & Related (1,322 | 15.1%), and Office & Administration (980 | 11.2%).
Sales and Office Occupations by Sex
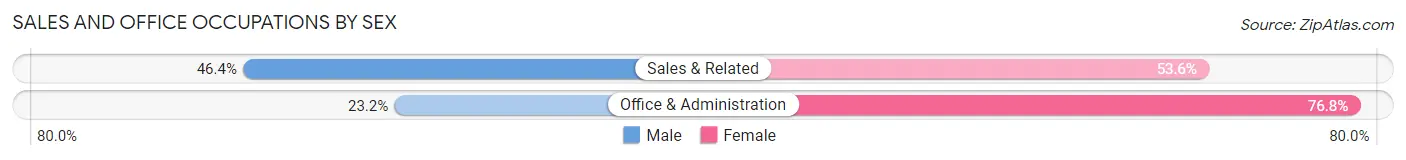
| Occupation | Male | Female |
| Sales & Related | 614 (46.4%) | 708 (53.6%) |
| Office & Administration | 227 (23.2%) | 753 (76.8%) |
| Total (Category) | 841 (36.5%) | 1,461 (63.5%) |
| Total (Overall) | 4,445 (50.6%) | 4,332 (49.4%) |
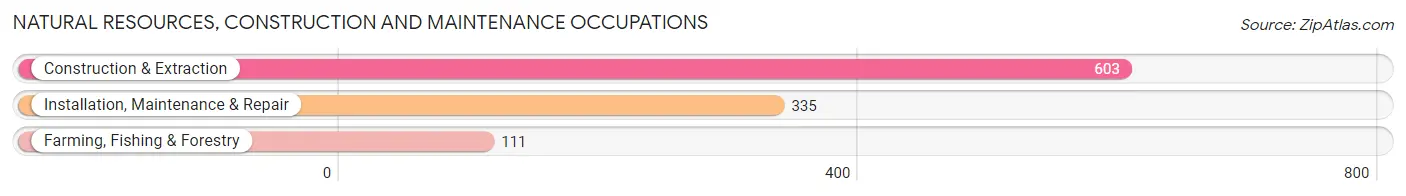
Natural Resources, Construction and Maintenance Occupations
The most common Natural Resources, Construction and Maintenance occupations in West Pensacola are Construction & Extraction (603 | 6.9%), Installation, Maintenance & Repair (335 | 3.8%), and Farming, Fishing & Forestry (111 | 1.3%).
Natural Resources, Construction and Maintenance Occupations by Sex
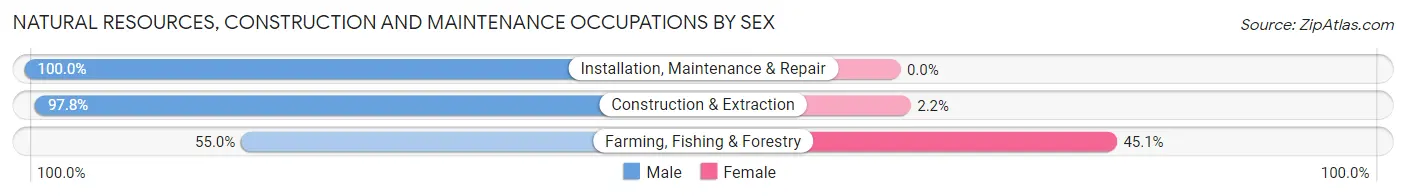
| Occupation | Male | Female |
| Farming, Fishing & Forestry | 61 (54.9%) | 50 (45.1%) |
| Construction & Extraction | 590 (97.8%) | 13 (2.2%) |
| Installation, Maintenance & Repair | 335 (100.0%) | 0 (0.0%) |
| Total (Category) | 986 (94.0%) | 63 (6.0%) |
| Total (Overall) | 4,445 (50.6%) | 4,332 (49.4%) |
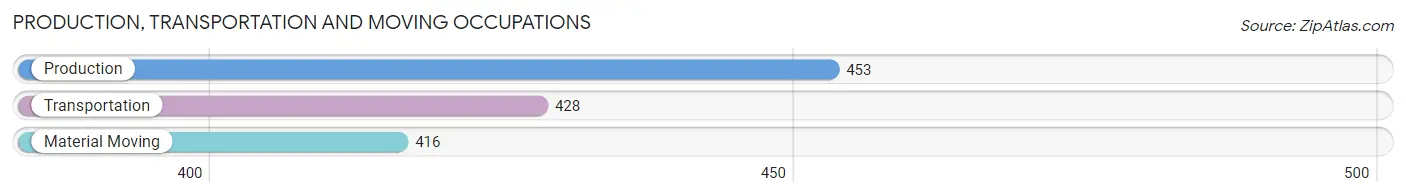
Production, Transportation and Moving Occupations
The most common Production, Transportation and Moving occupations in West Pensacola are Production (453 | 5.2%), Transportation (428 | 4.9%), and Material Moving (416 | 4.7%).
Production, Transportation and Moving Occupations by Sex
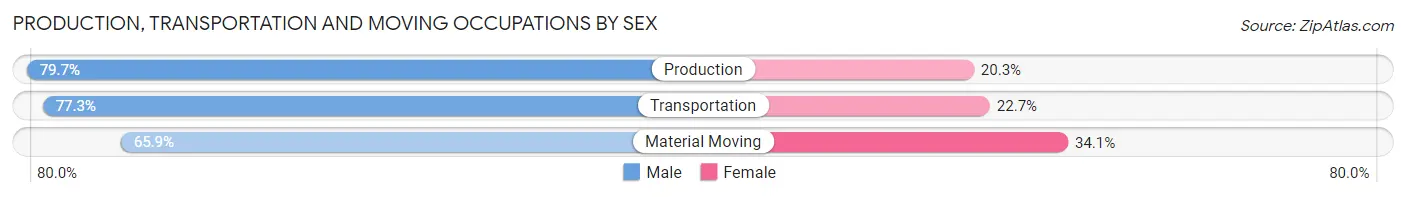
| Occupation | Male | Female |
| Production | 361 (79.7%) | 92 (20.3%) |
| Transportation | 331 (77.3%) | 97 (22.7%) |
| Material Moving | 274 (65.9%) | 142 (34.1%) |
| Total (Category) | 966 (74.5%) | 331 (25.5%) |
| Total (Overall) | 4,445 (50.6%) | 4,332 (49.4%) |
Employment Industries by Sex in West Pensacola
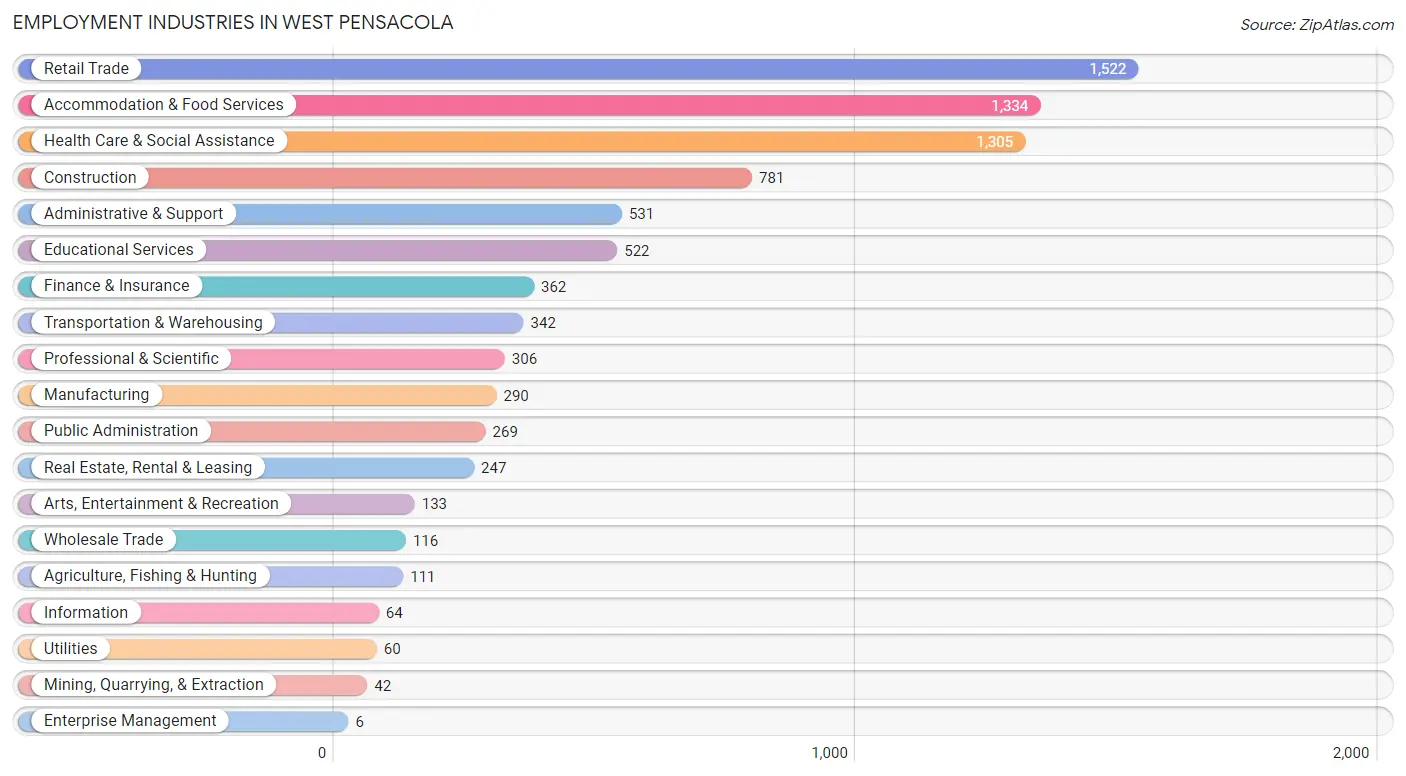
Employment Industries in West Pensacola
The major employment industries in West Pensacola include Retail Trade (1,522 | 17.3%), Accommodation & Food Services (1,334 | 15.2%), Health Care & Social Assistance (1,305 | 14.9%), Construction (781 | 8.9%), and Administrative & Support (531 | 6.0%).
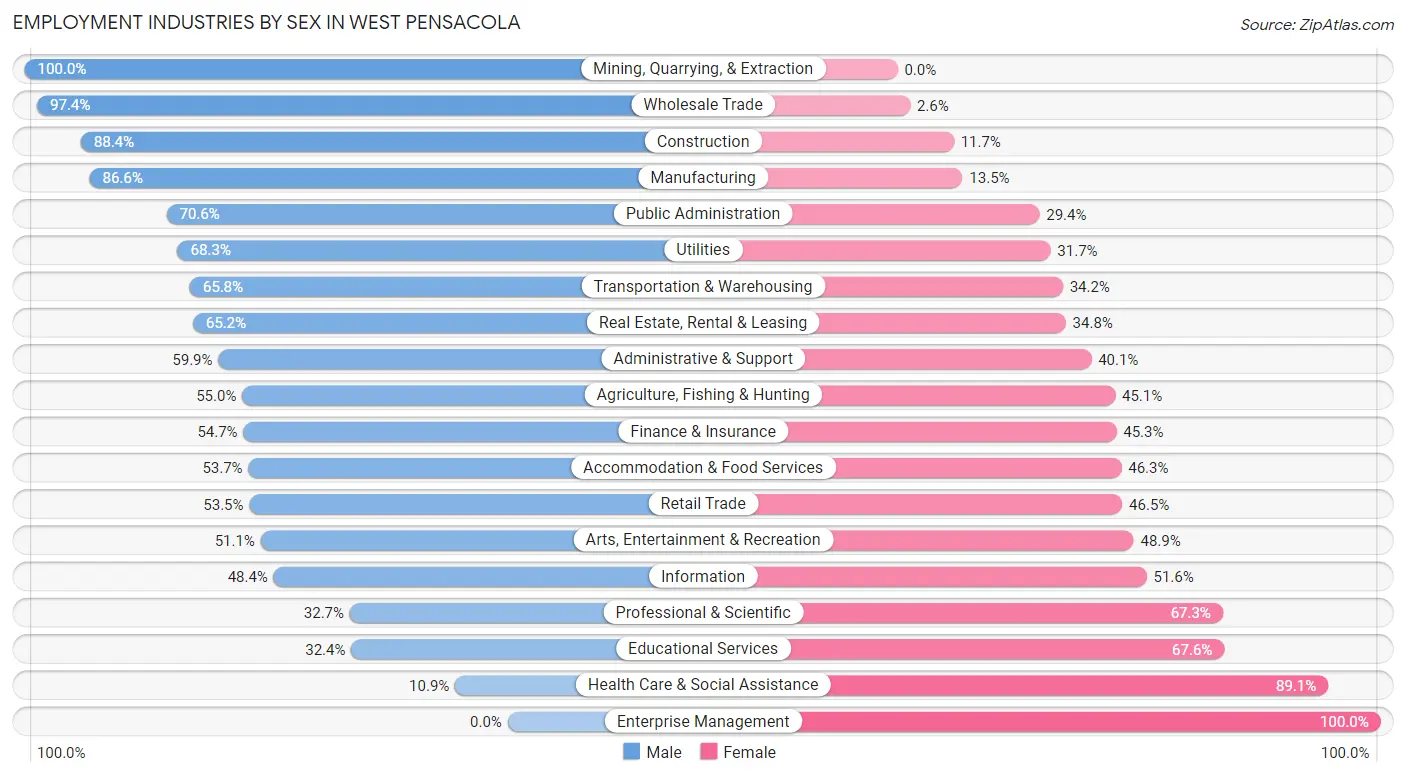
Employment Industries by Sex in West Pensacola
The West Pensacola industries that see more men than women are Mining, Quarrying, & Extraction (100.0%), Wholesale Trade (97.4%), and Construction (88.3%), whereas the industries that tend to have a higher number of women are Enterprise Management (100.0%), Health Care & Social Assistance (89.1%), and Educational Services (67.6%).
| Industry | Male | Female |
| Agriculture, Fishing & Hunting | 61 (54.9%) | 50 (45.1%) |
| Mining, Quarrying, & Extraction | 42 (100.0%) | 0 (0.0%) |
| Construction | 690 (88.3%) | 91 (11.7%) |
| Manufacturing | 251 (86.6%) | 39 (13.5%) |
| Wholesale Trade | 113 (97.4%) | 3 (2.6%) |
| Retail Trade | 814 (53.5%) | 708 (46.5%) |
| Transportation & Warehousing | 225 (65.8%) | 117 (34.2%) |
| Utilities | 41 (68.3%) | 19 (31.7%) |
| Information | 31 (48.4%) | 33 (51.6%) |
| Finance & Insurance | 198 (54.7%) | 164 (45.3%) |
| Real Estate, Rental & Leasing | 161 (65.2%) | 86 (34.8%) |
| Professional & Scientific | 100 (32.7%) | 206 (67.3%) |
| Enterprise Management | 0 (0.0%) | 6 (100.0%) |
| Administrative & Support | 318 (59.9%) | 213 (40.1%) |
| Educational Services | 169 (32.4%) | 353 (67.6%) |
| Health Care & Social Assistance | 142 (10.9%) | 1,163 (89.1%) |
| Arts, Entertainment & Recreation | 68 (51.1%) | 65 (48.9%) |
| Accommodation & Food Services | 716 (53.7%) | 618 (46.3%) |
| Public Administration | 190 (70.6%) | 79 (29.4%) |
| Total | 4,445 (50.6%) | 4,332 (49.4%) |
Education in West Pensacola
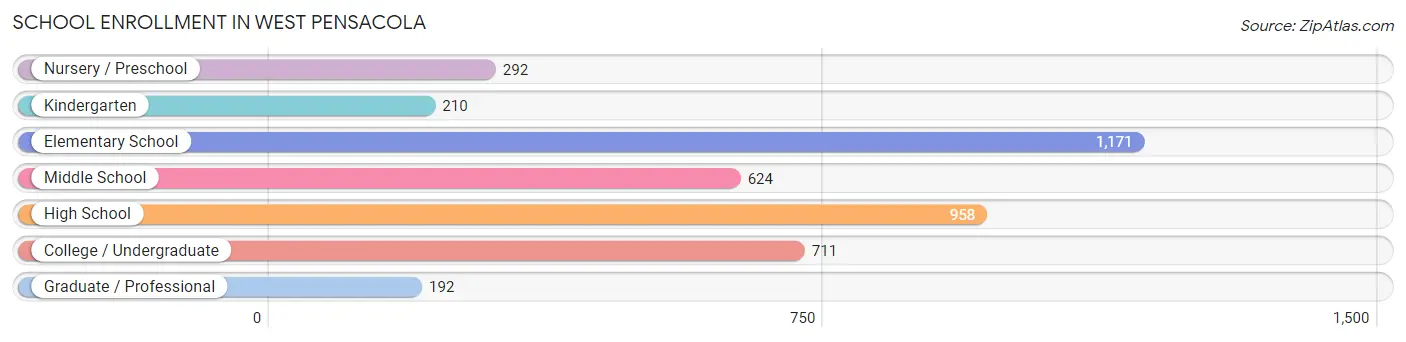
School Enrollment in West Pensacola
The most common levels of schooling among the 4,158 students in West Pensacola are elementary school (1,171 | 28.2%), high school (958 | 23.0%), and college / undergraduate (711 | 17.1%).
| School Level | # Students | % Students |
| Nursery / Preschool | 292 | 7.0% |
| Kindergarten | 210 | 5.1% |
| Elementary School | 1,171 | 28.2% |
| Middle School | 624 | 15.0% |
| High School | 958 | 23.0% |
| College / Undergraduate | 711 | 17.1% |
| Graduate / Professional | 192 | 4.6% |
| Total | 4,158 | 100.0% |
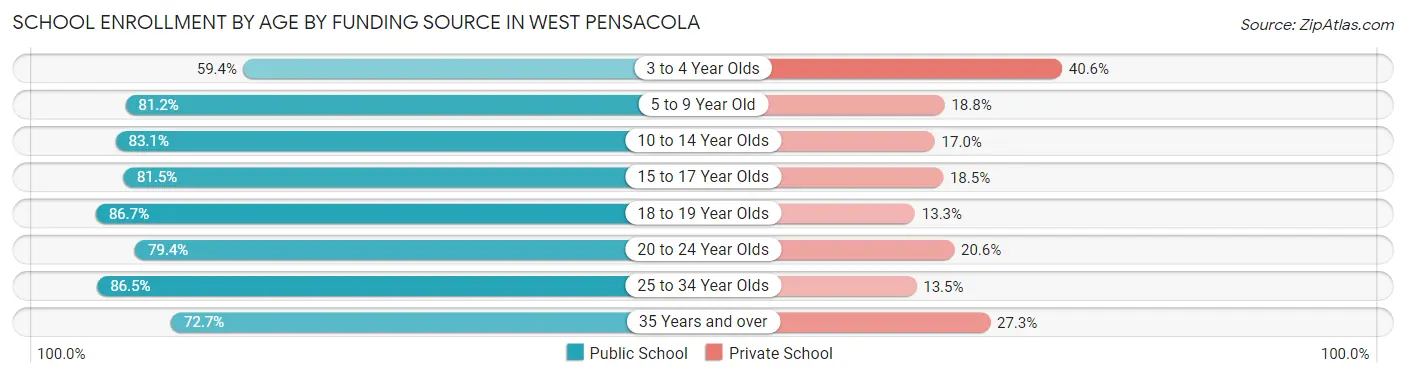
School Enrollment by Age by Funding Source in West Pensacola
Out of a total of 4,158 students who are enrolled in schools in West Pensacola, 782 (18.8%) attend a private institution, while the remaining 3,376 (81.2%) are enrolled in public schools. The age group of 3 to 4 year olds has the highest likelihood of being enrolled in private schools, with 89 (40.6% in the age bracket) enrolled. Conversely, the age group of 18 to 19 year olds has the lowest likelihood of being enrolled in a private school, with 386 (86.7% in the age bracket) attending a public institution.
| Age Bracket | Public School | Private School |
| 3 to 4 Year Olds | 130 (59.4%) | 89 (40.6%) |
| 5 to 9 Year Old | 770 (81.2%) | 178 (18.8%) |
| 10 to 14 Year Olds | 1,044 (83.1%) | 213 (17.0%) |
| 15 to 17 Year Olds | 533 (81.5%) | 121 (18.5%) |
| 18 to 19 Year Olds | 386 (86.7%) | 59 (13.3%) |
| 20 to 24 Year Olds | 197 (79.4%) | 51 (20.6%) |
| 25 to 34 Year Olds | 230 (86.5%) | 36 (13.5%) |
| 35 Years and over | 88 (72.7%) | 33 (27.3%) |
| Total | 3,376 (81.2%) | 782 (18.8%) |
Educational Attainment by Field of Study in West Pensacola
Business (579 | 27.5%), arts & humanities (268 | 12.7%), education (242 | 11.5%), engineering (167 | 7.9%), and social sciences (161 | 7.6%) are the most common fields of study among 2,107 individuals in West Pensacola who have obtained a bachelor's degree or higher.
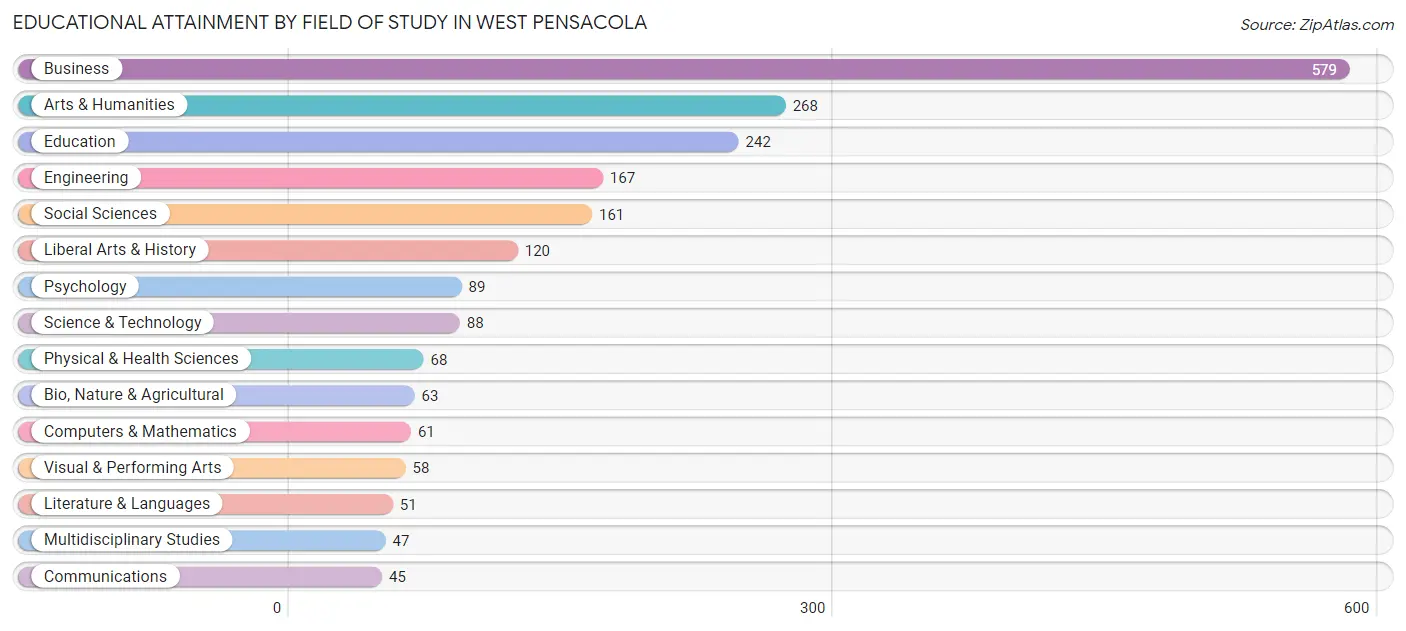
| Field of Study | # Graduates | % Graduates |
| Computers & Mathematics | 61 | 2.9% |
| Bio, Nature & Agricultural | 63 | 3.0% |
| Physical & Health Sciences | 68 | 3.2% |
| Psychology | 89 | 4.2% |
| Social Sciences | 161 | 7.6% |
| Engineering | 167 | 7.9% |
| Multidisciplinary Studies | 47 | 2.2% |
| Science & Technology | 88 | 4.2% |
| Business | 579 | 27.5% |
| Education | 242 | 11.5% |
| Literature & Languages | 51 | 2.4% |
| Liberal Arts & History | 120 | 5.7% |
| Visual & Performing Arts | 58 | 2.8% |
| Communications | 45 | 2.1% |
| Arts & Humanities | 268 | 12.7% |
| Total | 2,107 | 100.0% |
Transportation & Commute in West Pensacola
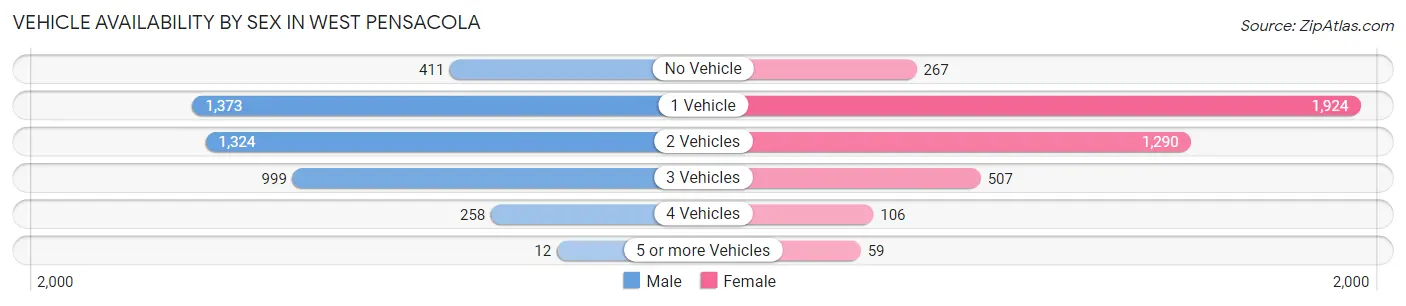
Vehicle Availability by Sex in West Pensacola
The most prevalent vehicle ownership categories in West Pensacola are males with 1 vehicle (1,373, accounting for 31.4%) and females with 1 vehicle (1,924, making up 33.1%).
| Vehicles Available | Male | Female |
| No Vehicle | 411 (9.4%) | 267 (6.4%) |
| 1 Vehicle | 1,373 (31.4%) | 1,924 (46.3%) |
| 2 Vehicles | 1,324 (30.2%) | 1,290 (31.1%) |
| 3 Vehicles | 999 (22.8%) | 507 (12.2%) |
| 4 Vehicles | 258 (5.9%) | 106 (2.5%) |
| 5 or more Vehicles | 12 (0.3%) | 59 (1.4%) |
| Total | 4,377 (100.0%) | 4,153 (100.0%) |
Commute Time in West Pensacola
The most frequently occuring commute durations in West Pensacola are 15 to 19 minutes (1,823 commuters, 23.0%), 20 to 24 minutes (1,625 commuters, 20.5%), and 10 to 14 minutes (1,219 commuters, 15.4%).
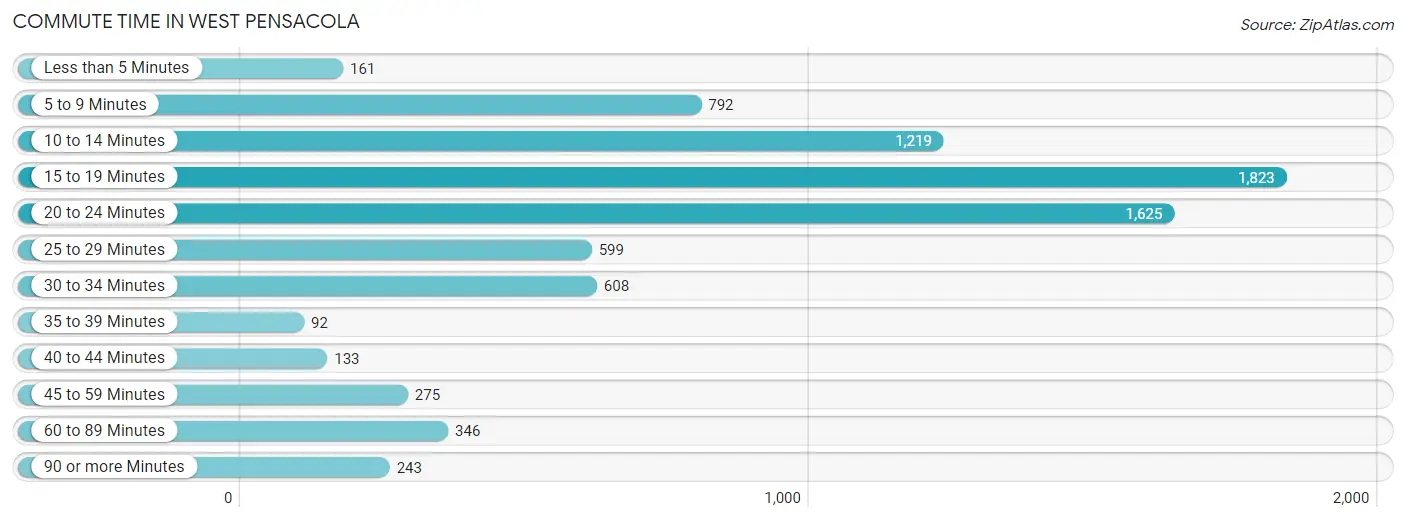
| Commute Time | # Commuters | % Commuters |
| Less than 5 Minutes | 161 | 2.0% |
| 5 to 9 Minutes | 792 | 10.0% |
| 10 to 14 Minutes | 1,219 | 15.4% |
| 15 to 19 Minutes | 1,823 | 23.0% |
| 20 to 24 Minutes | 1,625 | 20.5% |
| 25 to 29 Minutes | 599 | 7.6% |
| 30 to 34 Minutes | 608 | 7.7% |
| 35 to 39 Minutes | 92 | 1.2% |
| 40 to 44 Minutes | 133 | 1.7% |
| 45 to 59 Minutes | 275 | 3.5% |
| 60 to 89 Minutes | 346 | 4.4% |
| 90 or more Minutes | 243 | 3.1% |
Commute Time by Sex in West Pensacola
The most common commute times in West Pensacola are 15 to 19 minutes (932 commuters, 22.0%) for males and 15 to 19 minutes (891 commuters, 24.2%) for females.
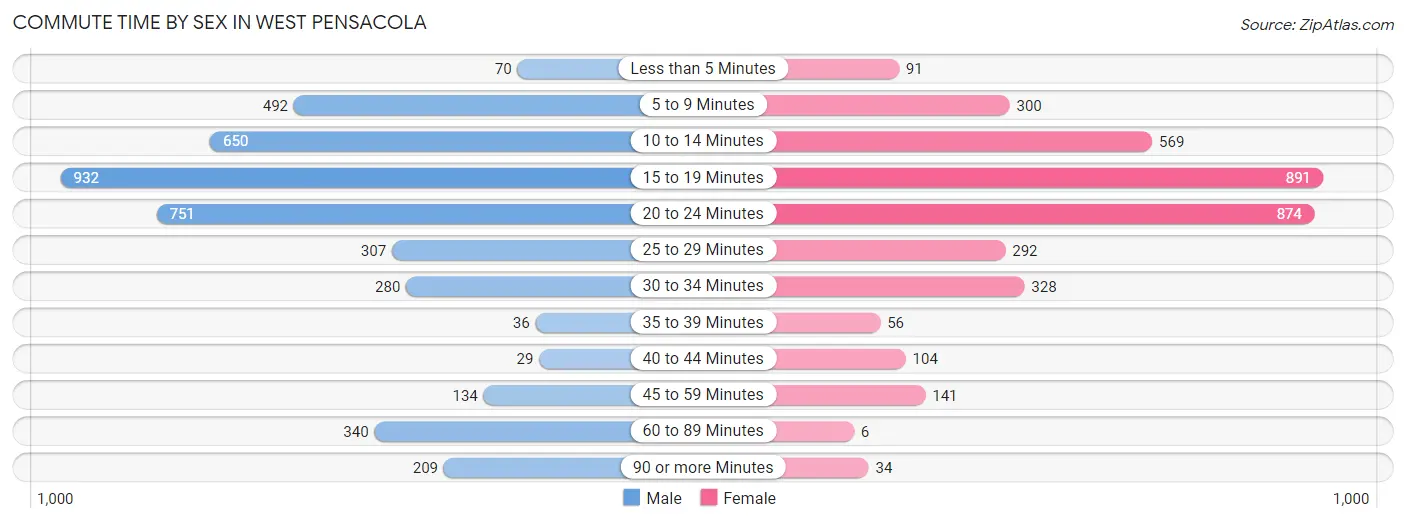
| Commute Time | Male | Female |
| Less than 5 Minutes | 70 (1.7%) | 91 (2.5%) |
| 5 to 9 Minutes | 492 (11.6%) | 300 (8.1%) |
| 10 to 14 Minutes | 650 (15.4%) | 569 (15.4%) |
| 15 to 19 Minutes | 932 (22.0%) | 891 (24.2%) |
| 20 to 24 Minutes | 751 (17.7%) | 874 (23.7%) |
| 25 to 29 Minutes | 307 (7.3%) | 292 (7.9%) |
| 30 to 34 Minutes | 280 (6.6%) | 328 (8.9%) |
| 35 to 39 Minutes | 36 (0.9%) | 56 (1.5%) |
| 40 to 44 Minutes | 29 (0.7%) | 104 (2.8%) |
| 45 to 59 Minutes | 134 (3.2%) | 141 (3.8%) |
| 60 to 89 Minutes | 340 (8.0%) | 6 (0.2%) |
| 90 or more Minutes | 209 (4.9%) | 34 (0.9%) |
Time of Departure to Work by Sex in West Pensacola
The most frequent times of departure to work in West Pensacola are 6:00 AM to 6:29 AM (784, 18.5%) for males and 7:00 AM to 7:29 AM (587, 15.9%) for females.
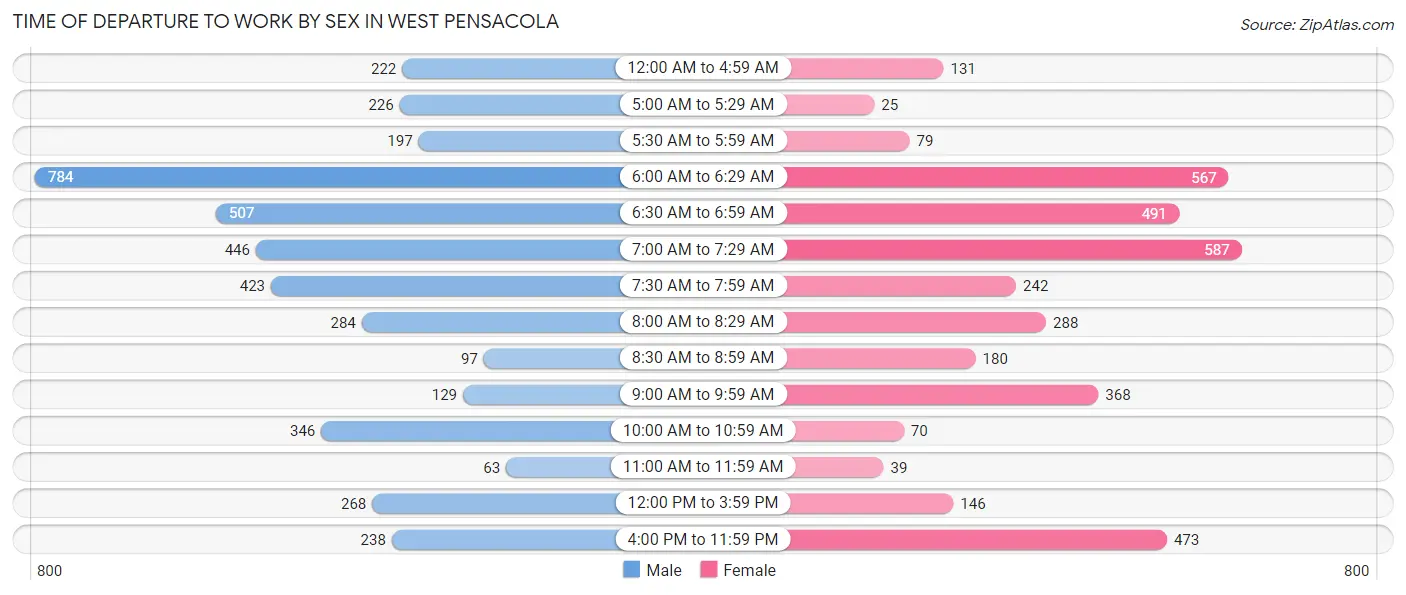
| Time of Departure | Male | Female |
| 12:00 AM to 4:59 AM | 222 (5.2%) | 131 (3.5%) |
| 5:00 AM to 5:29 AM | 226 (5.3%) | 25 (0.7%) |
| 5:30 AM to 5:59 AM | 197 (4.7%) | 79 (2.1%) |
| 6:00 AM to 6:29 AM | 784 (18.5%) | 567 (15.4%) |
| 6:30 AM to 6:59 AM | 507 (12.0%) | 491 (13.3%) |
| 7:00 AM to 7:29 AM | 446 (10.5%) | 587 (15.9%) |
| 7:30 AM to 7:59 AM | 423 (10.0%) | 242 (6.6%) |
| 8:00 AM to 8:29 AM | 284 (6.7%) | 288 (7.8%) |
| 8:30 AM to 8:59 AM | 97 (2.3%) | 180 (4.9%) |
| 9:00 AM to 9:59 AM | 129 (3.0%) | 368 (10.0%) |
| 10:00 AM to 10:59 AM | 346 (8.2%) | 70 (1.9%) |
| 11:00 AM to 11:59 AM | 63 (1.5%) | 39 (1.1%) |
| 12:00 PM to 3:59 PM | 268 (6.3%) | 146 (4.0%) |
| 4:00 PM to 11:59 PM | 238 (5.6%) | 473 (12.8%) |
| Total | 4,230 (100.0%) | 3,686 (100.0%) |
Housing Occupancy in West Pensacola
Occupancy by Ownership in West Pensacola
Of the total 8,686 dwellings in West Pensacola, owner-occupied units account for 4,226 (48.6%), while renter-occupied units make up 4,460 (51.3%).
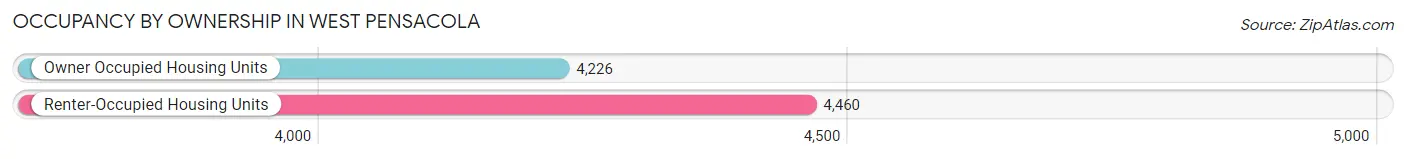
| Occupancy | # Housing Units | % Housing Units |
| Owner Occupied Housing Units | 4,226 | 48.6% |
| Renter-Occupied Housing Units | 4,460 | 51.3% |
| Total Occupied Housing Units | 8,686 | 100.0% |
Occupancy by Household Size in West Pensacola
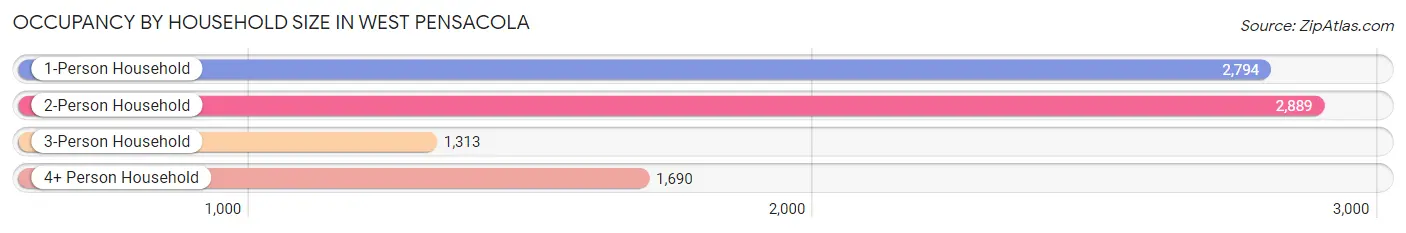
| Household Size | # Housing Units | % Housing Units |
| 1-Person Household | 2,794 | 32.2% |
| 2-Person Household | 2,889 | 33.3% |
| 3-Person Household | 1,313 | 15.1% |
| 4+ Person Household | 1,690 | 19.5% |
| Total Housing Units | 8,686 | 100.0% |
Occupancy by Ownership by Household Size in West Pensacola
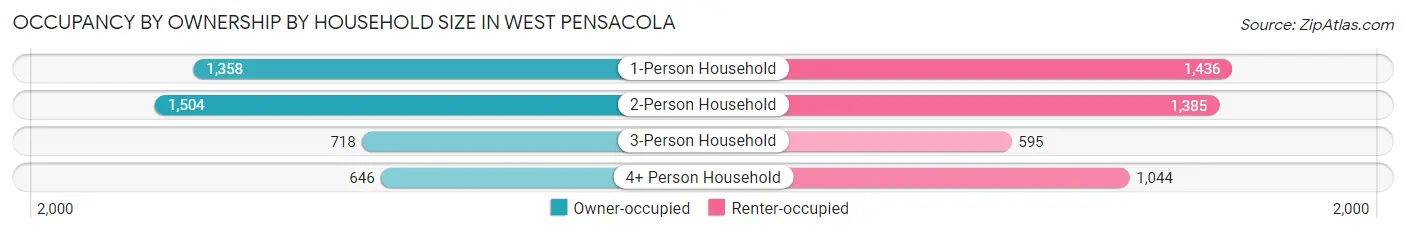
| Household Size | Owner-occupied | Renter-occupied |
| 1-Person Household | 1,358 (48.6%) | 1,436 (51.4%) |
| 2-Person Household | 1,504 (52.1%) | 1,385 (47.9%) |
| 3-Person Household | 718 (54.7%) | 595 (45.3%) |
| 4+ Person Household | 646 (38.2%) | 1,044 (61.8%) |
| Total Housing Units | 4,226 (48.6%) | 4,460 (51.3%) |
Occupancy by Educational Attainment in West Pensacola
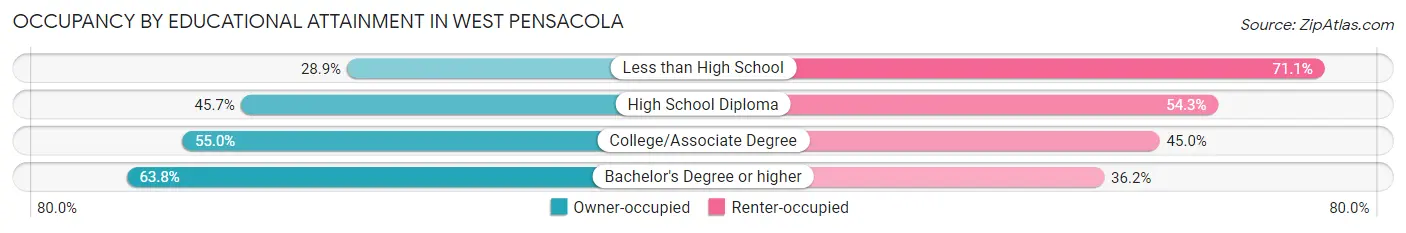
| Household Size | Owner-occupied | Renter-occupied |
| Less than High School | 429 (28.9%) | 1,057 (71.1%) |
| High School Diploma | 1,371 (45.7%) | 1,627 (54.3%) |
| College/Associate Degree | 1,605 (55.0%) | 1,311 (45.0%) |
| Bachelor's Degree or higher | 821 (63.8%) | 465 (36.2%) |
Occupancy by Age of Householder in West Pensacola
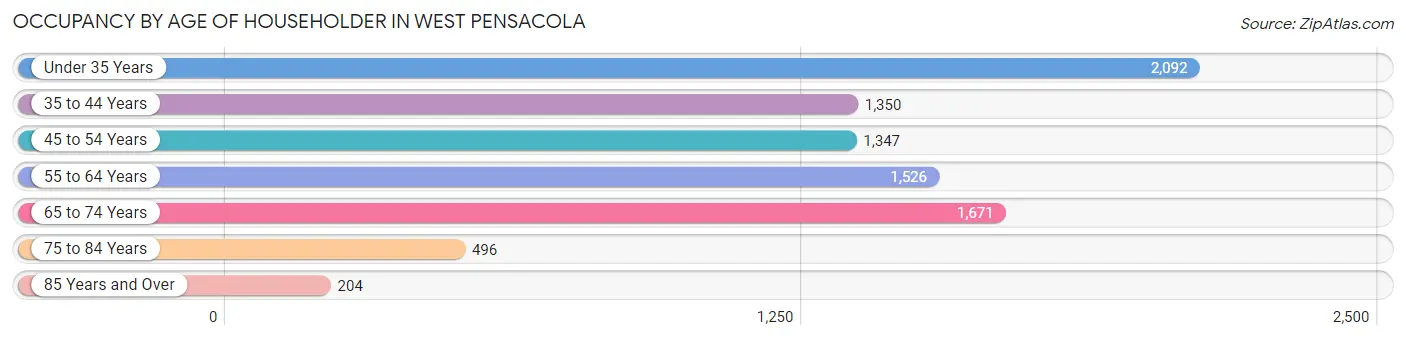
| Age Bracket | # Households | % Households |
| Under 35 Years | 2,092 | 24.1% |
| 35 to 44 Years | 1,350 | 15.5% |
| 45 to 54 Years | 1,347 | 15.5% |
| 55 to 64 Years | 1,526 | 17.6% |
| 65 to 74 Years | 1,671 | 19.2% |
| 75 to 84 Years | 496 | 5.7% |
| 85 Years and Over | 204 | 2.4% |
| Total | 8,686 | 100.0% |
Housing Finances in West Pensacola
Median Income by Occupancy in West Pensacola
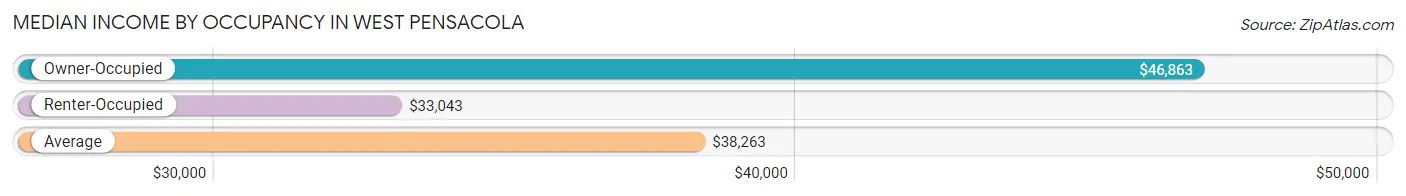
| Occupancy Type | # Households | Median Income |
| Owner-Occupied | 4,226 (48.6%) | $46,863 |
| Renter-Occupied | 4,460 (51.3%) | $33,043 |
| Average | 8,686 (100.0%) | $38,263 |
Occupancy by Householder Income Bracket in West Pensacola
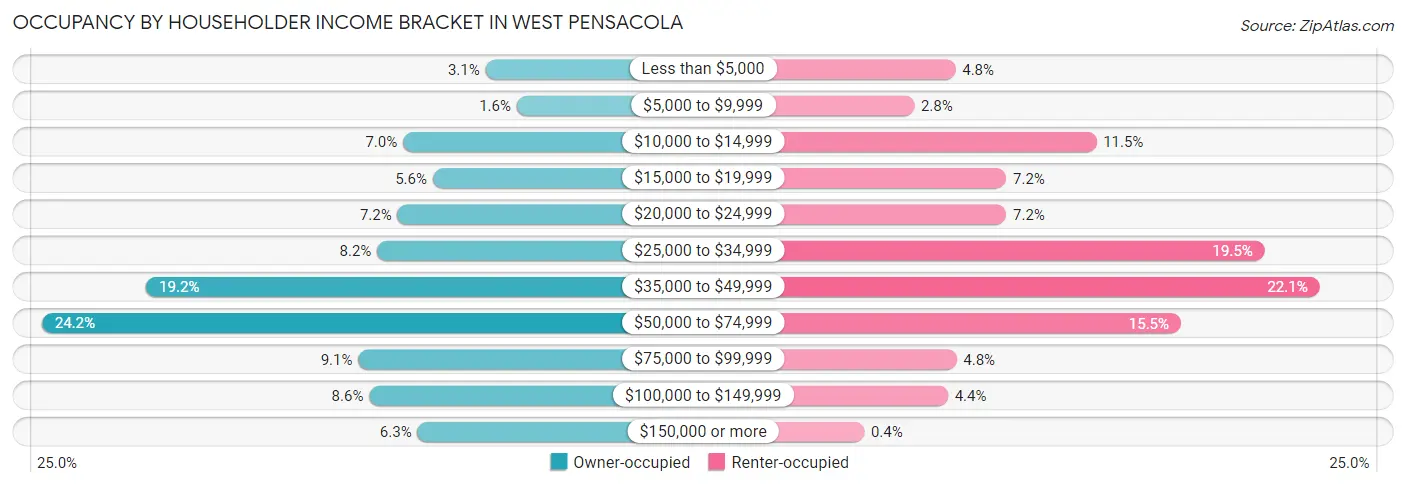
| Income Bracket | Owner-occupied | Renter-occupied |
| Less than $5,000 | 129 (3.0%) | 212 (4.8%) |
| $5,000 to $9,999 | 66 (1.6%) | 124 (2.8%) |
| $10,000 to $14,999 | 295 (7.0%) | 511 (11.5%) |
| $15,000 to $19,999 | 235 (5.6%) | 320 (7.2%) |
| $20,000 to $24,999 | 306 (7.2%) | 320 (7.2%) |
| $25,000 to $34,999 | 347 (8.2%) | 869 (19.5%) |
| $35,000 to $49,999 | 812 (19.2%) | 985 (22.1%) |
| $50,000 to $74,999 | 1,022 (24.2%) | 691 (15.5%) |
| $75,000 to $99,999 | 385 (9.1%) | 214 (4.8%) |
| $100,000 to $149,999 | 363 (8.6%) | 196 (4.4%) |
| $150,000 or more | 266 (6.3%) | 18 (0.4%) |
| Total | 4,226 (100.0%) | 4,460 (100.0%) |
Monthly Housing Cost Tiers in West Pensacola
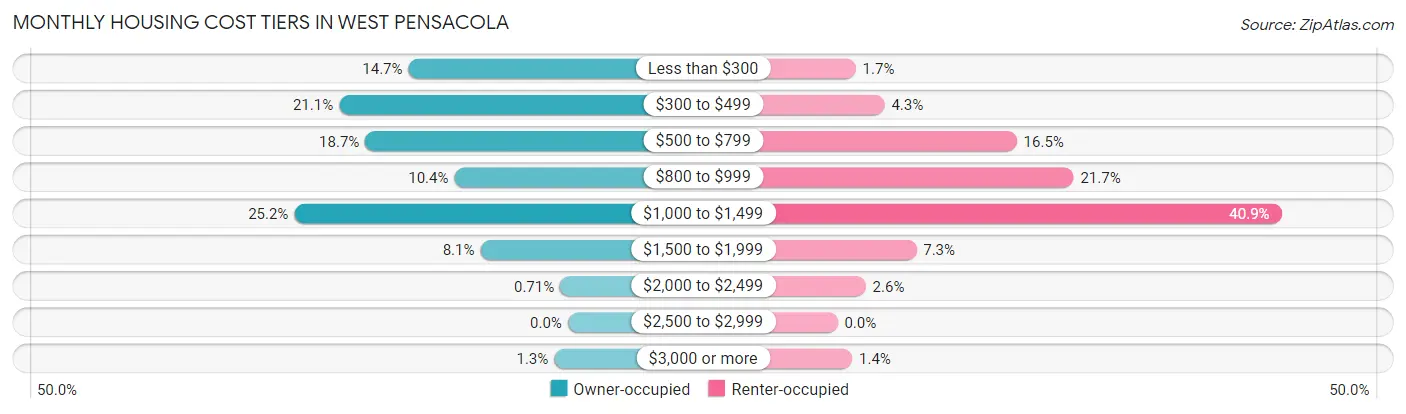
| Monthly Cost | Owner-occupied | Renter-occupied |
| Less than $300 | 620 (14.7%) | 75 (1.7%) |
| $300 to $499 | 890 (21.1%) | 193 (4.3%) |
| $500 to $799 | 788 (18.6%) | 736 (16.5%) |
| $800 to $999 | 441 (10.4%) | 969 (21.7%) |
| $1,000 to $1,499 | 1,064 (25.2%) | 1,823 (40.9%) |
| $1,500 to $1,999 | 340 (8.1%) | 324 (7.3%) |
| $2,000 to $2,499 | 30 (0.7%) | 116 (2.6%) |
| $2,500 to $2,999 | 0 (0.0%) | 0 (0.0%) |
| $3,000 or more | 53 (1.3%) | 60 (1.3%) |
| Total | 4,226 (100.0%) | 4,460 (100.0%) |
Physical Housing Characteristics in West Pensacola
Housing Structures in West Pensacola
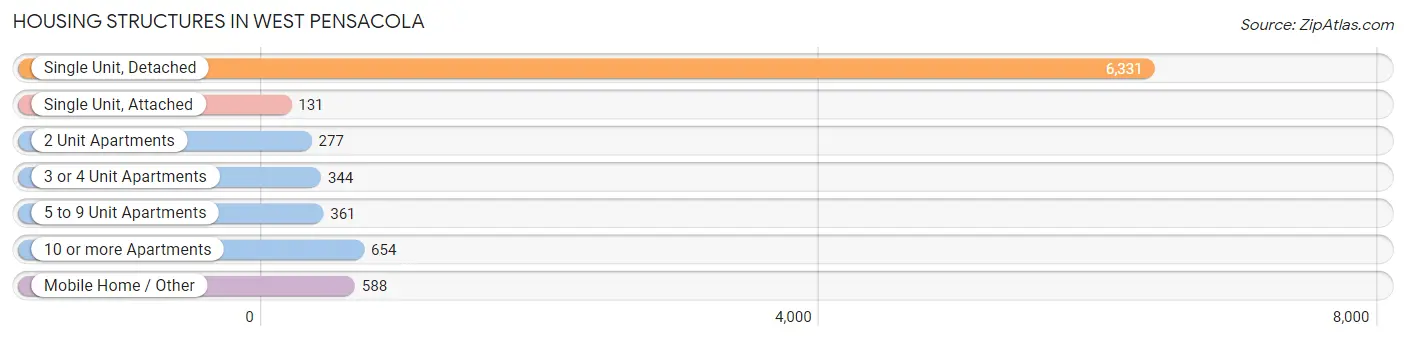
| Structure Type | # Housing Units | % Housing Units |
| Single Unit, Detached | 6,331 | 72.9% |
| Single Unit, Attached | 131 | 1.5% |
| 2 Unit Apartments | 277 | 3.2% |
| 3 or 4 Unit Apartments | 344 | 4.0% |
| 5 to 9 Unit Apartments | 361 | 4.2% |
| 10 or more Apartments | 654 | 7.5% |
| Mobile Home / Other | 588 | 6.8% |
| Total | 8,686 | 100.0% |
Housing Structures by Occupancy in West Pensacola
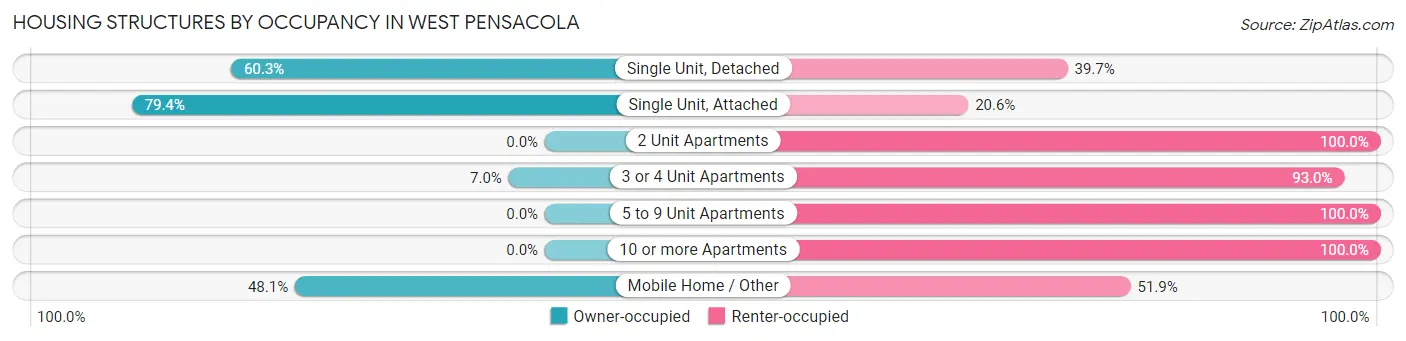
| Structure Type | Owner-occupied | Renter-occupied |
| Single Unit, Detached | 3,815 (60.3%) | 2,516 (39.7%) |
| Single Unit, Attached | 104 (79.4%) | 27 (20.6%) |
| 2 Unit Apartments | 0 (0.0%) | 277 (100.0%) |
| 3 or 4 Unit Apartments | 24 (7.0%) | 320 (93.0%) |
| 5 to 9 Unit Apartments | 0 (0.0%) | 361 (100.0%) |
| 10 or more Apartments | 0 (0.0%) | 654 (100.0%) |
| Mobile Home / Other | 283 (48.1%) | 305 (51.9%) |
| Total | 4,226 (48.6%) | 4,460 (51.3%) |
Housing Structures by Number of Rooms in West Pensacola
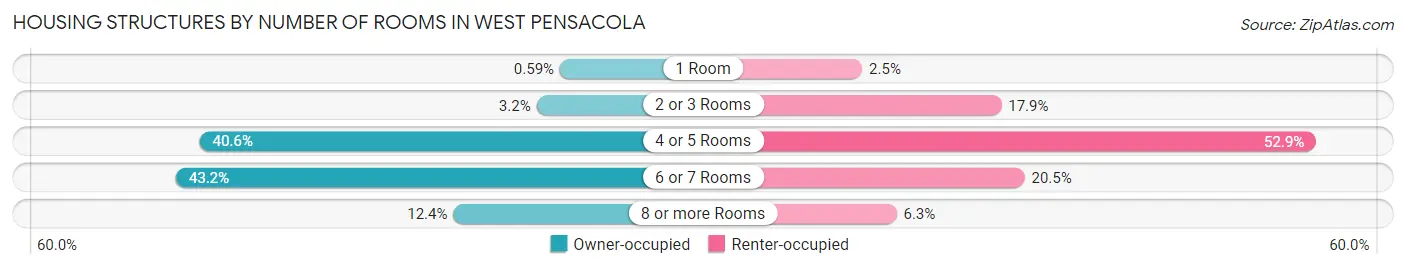
| Number of Rooms | Owner-occupied | Renter-occupied |
| 1 Room | 25 (0.6%) | 110 (2.5%) |
| 2 or 3 Rooms | 135 (3.2%) | 799 (17.9%) |
| 4 or 5 Rooms | 1,715 (40.6%) | 2,357 (52.8%) |
| 6 or 7 Rooms | 1,826 (43.2%) | 914 (20.5%) |
| 8 or more Rooms | 525 (12.4%) | 280 (6.3%) |
| Total | 4,226 (100.0%) | 4,460 (100.0%) |
Housing Structure by Heating Type in West Pensacola
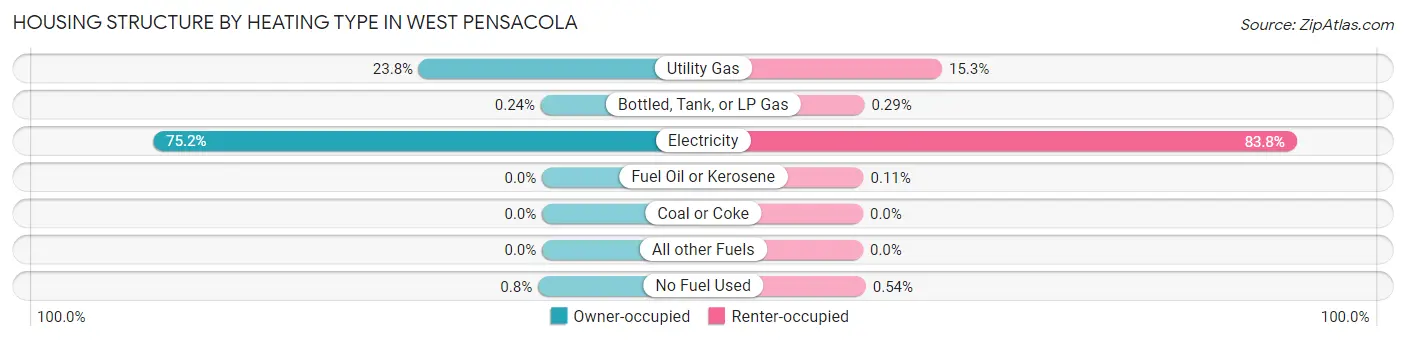
| Heating Type | Owner-occupied | Renter-occupied |
| Utility Gas | 1,006 (23.8%) | 681 (15.3%) |
| Bottled, Tank, or LP Gas | 10 (0.2%) | 13 (0.3%) |
| Electricity | 3,176 (75.1%) | 3,737 (83.8%) |
| Fuel Oil or Kerosene | 0 (0.0%) | 5 (0.1%) |
| Coal or Coke | 0 (0.0%) | 0 (0.0%) |
| All other Fuels | 0 (0.0%) | 0 (0.0%) |
| No Fuel Used | 34 (0.8%) | 24 (0.5%) |
| Total | 4,226 (100.0%) | 4,460 (100.0%) |
Household Vehicle Usage in West Pensacola
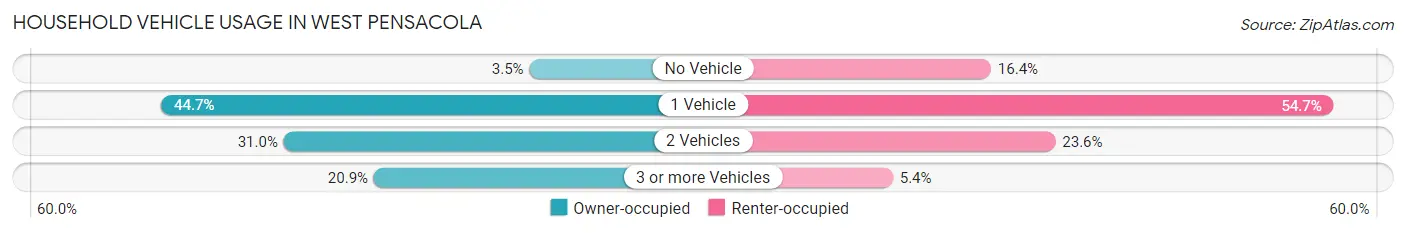
| Vehicles per Household | Owner-occupied | Renter-occupied |
| No Vehicle | 146 (3.5%) | 729 (16.4%) |
| 1 Vehicle | 1,889 (44.7%) | 2,441 (54.7%) |
| 2 Vehicles | 1,309 (31.0%) | 1,051 (23.6%) |
| 3 or more Vehicles | 882 (20.9%) | 239 (5.4%) |
| Total | 4,226 (100.0%) | 4,460 (100.0%) |
Real Estate & Mortgages in West Pensacola
Real Estate and Mortgage Overview in West Pensacola
| Characteristic | Without Mortgage | With Mortgage |
| Housing Units | 1,939 | 2,287 |
| Median Property Value | $79,100 | $110,500 |
| Median Household Income | $36,614 | $161 |
| Monthly Housing Costs | $374 | $53 |
| Real Estate Taxes | $515 | $86 |
Property Value by Mortgage Status in West Pensacola
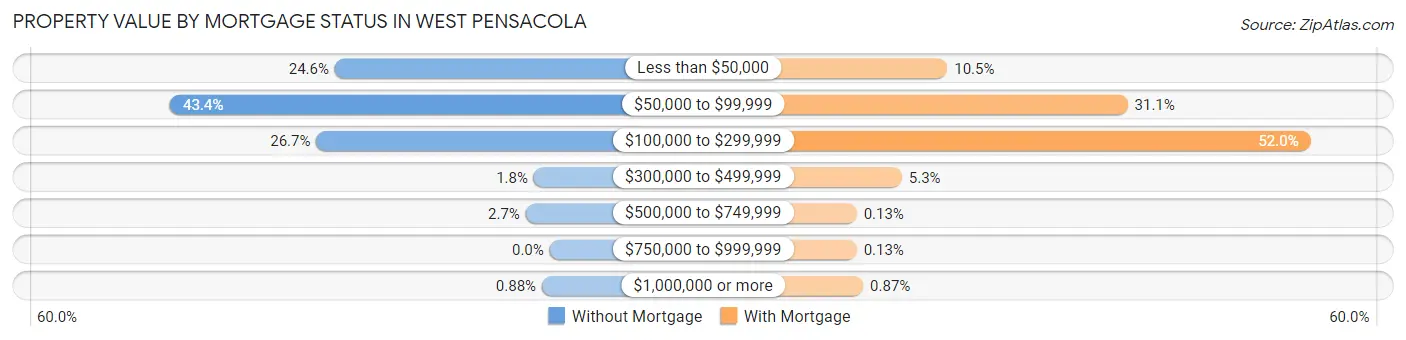
| Property Value | Without Mortgage | With Mortgage |
| Less than $50,000 | 476 (24.5%) | 240 (10.5%) |
| $50,000 to $99,999 | 841 (43.4%) | 711 (31.1%) |
| $100,000 to $299,999 | 517 (26.7%) | 1,189 (52.0%) |
| $300,000 to $499,999 | 35 (1.8%) | 121 (5.3%) |
| $500,000 to $749,999 | 53 (2.7%) | 3 (0.1%) |
| $750,000 to $999,999 | 0 (0.0%) | 3 (0.1%) |
| $1,000,000 or more | 17 (0.9%) | 20 (0.9%) |
| Total | 1,939 (100.0%) | 2,287 (100.0%) |
Household Income by Mortgage Status in West Pensacola
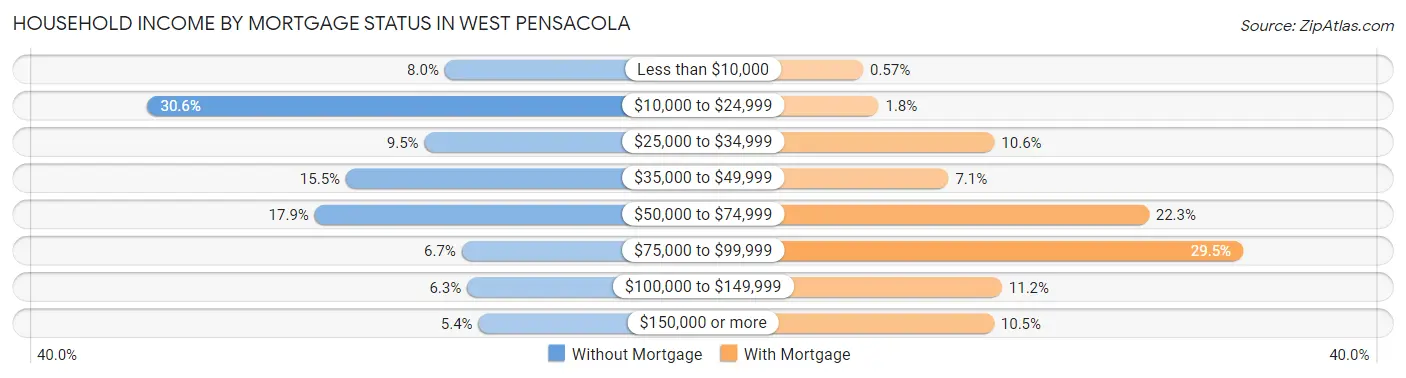
| Household Income | Without Mortgage | With Mortgage |
| Less than $10,000 | 155 (8.0%) | 13 (0.6%) |
| $10,000 to $24,999 | 594 (30.6%) | 40 (1.8%) |
| $25,000 to $34,999 | 185 (9.5%) | 242 (10.6%) |
| $35,000 to $49,999 | 301 (15.5%) | 162 (7.1%) |
| $50,000 to $74,999 | 347 (17.9%) | 511 (22.3%) |
| $75,000 to $99,999 | 130 (6.7%) | 675 (29.5%) |
| $100,000 to $149,999 | 122 (6.3%) | 255 (11.2%) |
| $150,000 or more | 105 (5.4%) | 241 (10.5%) |
| Total | 1,939 (100.0%) | 2,287 (100.0%) |
Property Value to Household Income Ratio in West Pensacola
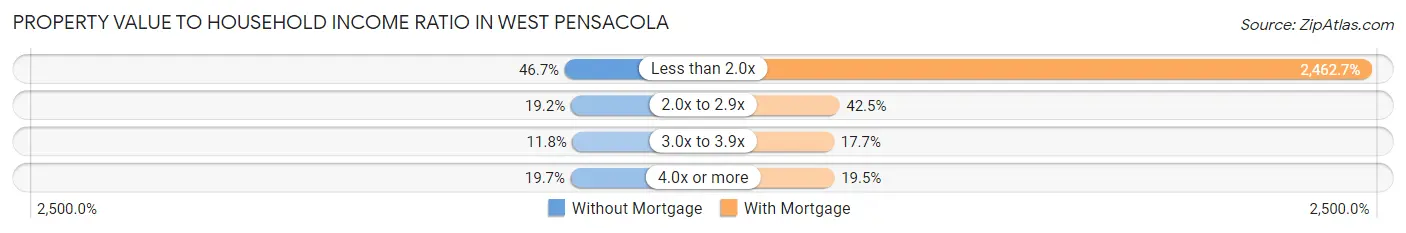
| Value-to-Income Ratio | Without Mortgage | With Mortgage |
| Less than 2.0x | 906 (46.7%) | 56,322 (2,462.7%) |
| 2.0x to 2.9x | 372 (19.2%) | 972 (42.5%) |
| 3.0x to 3.9x | 228 (11.8%) | 405 (17.7%) |
| 4.0x or more | 382 (19.7%) | 446 (19.5%) |
| Total | 1,939 (100.0%) | 2,287 (100.0%) |
Real Estate Taxes by Mortgage Status in West Pensacola
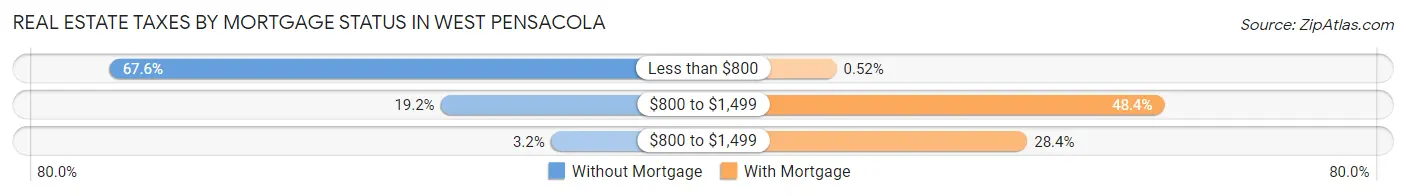
| Property Taxes | Without Mortgage | With Mortgage |
| Less than $800 | 1,310 (67.6%) | 12 (0.5%) |
| $800 to $1,499 | 373 (19.2%) | 1,107 (48.4%) |
| $800 to $1,499 | 61 (3.2%) | 649 (28.4%) |
| Total | 1,939 (100.0%) | 2,287 (100.0%) |
Health & Disability in West Pensacola
Health Insurance Coverage by Age in West Pensacola
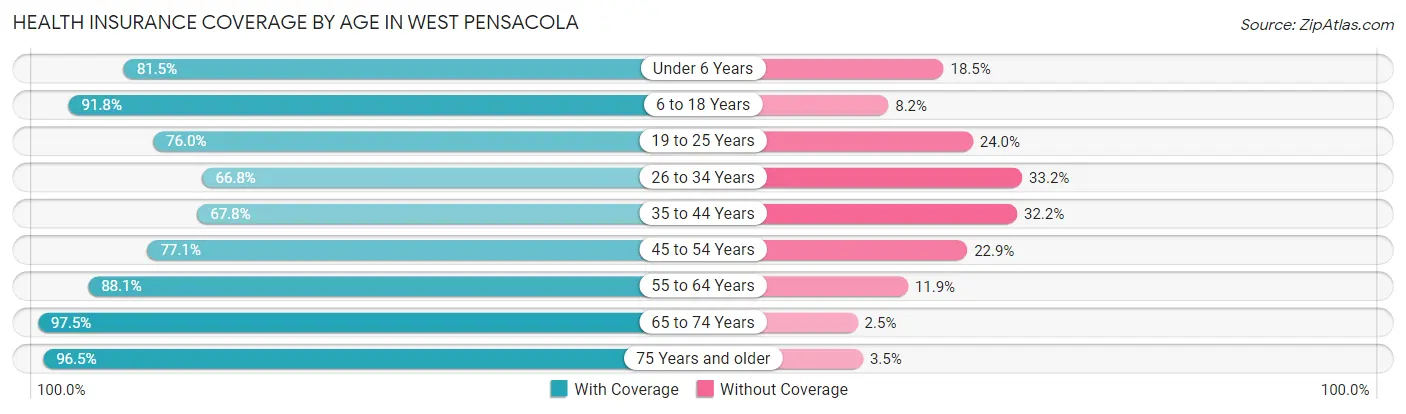
| Age Bracket | With Coverage | Without Coverage |
| Under 6 Years | 1,585 (81.5%) | 360 (18.5%) |
| 6 to 18 Years | 2,642 (91.8%) | 236 (8.2%) |
| 19 to 25 Years | 1,588 (76.0%) | 501 (24.0%) |
| 26 to 34 Years | 2,055 (66.8%) | 1,020 (33.2%) |
| 35 to 44 Years | 1,692 (67.8%) | 804 (32.2%) |
| 45 to 54 Years | 2,008 (77.1%) | 597 (22.9%) |
| 55 to 64 Years | 2,228 (88.1%) | 300 (11.9%) |
| 65 to 74 Years | 2,502 (97.5%) | 64 (2.5%) |
| 75 Years and older | 916 (96.5%) | 33 (3.5%) |
| Total | 17,216 (81.5%) | 3,915 (18.5%) |
Health Insurance Coverage by Citizenship Status in West Pensacola
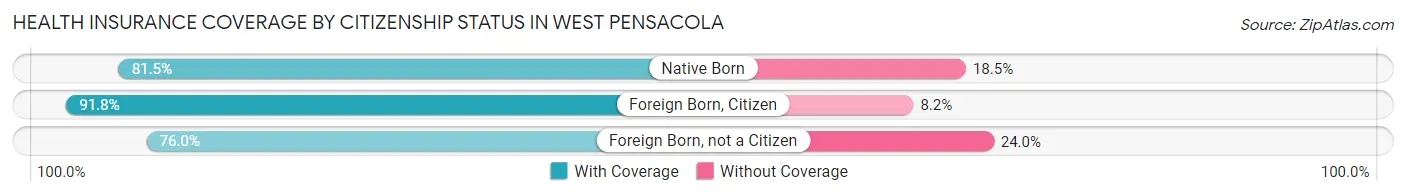
| Citizenship Status | With Coverage | Without Coverage |
| Native Born | 1,585 (81.5%) | 360 (18.5%) |
| Foreign Born, Citizen | 2,642 (91.8%) | 236 (8.2%) |
| Foreign Born, not a Citizen | 1,588 (76.0%) | 501 (24.0%) |
Health Insurance Coverage by Household Income in West Pensacola
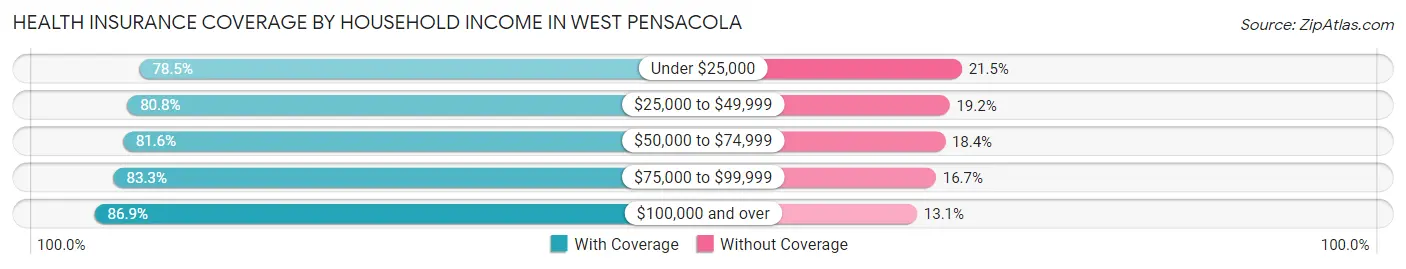
| Household Income | With Coverage | Without Coverage |
| Under $25,000 | 3,123 (78.5%) | 857 (21.5%) |
| $25,000 to $49,999 | 6,543 (80.8%) | 1,559 (19.2%) |
| $50,000 to $74,999 | 3,498 (81.6%) | 788 (18.4%) |
| $75,000 to $99,999 | 1,499 (83.3%) | 300 (16.7%) |
| $100,000 and over | 2,480 (86.9%) | 375 (13.1%) |
Public vs Private Health Insurance Coverage by Age in West Pensacola
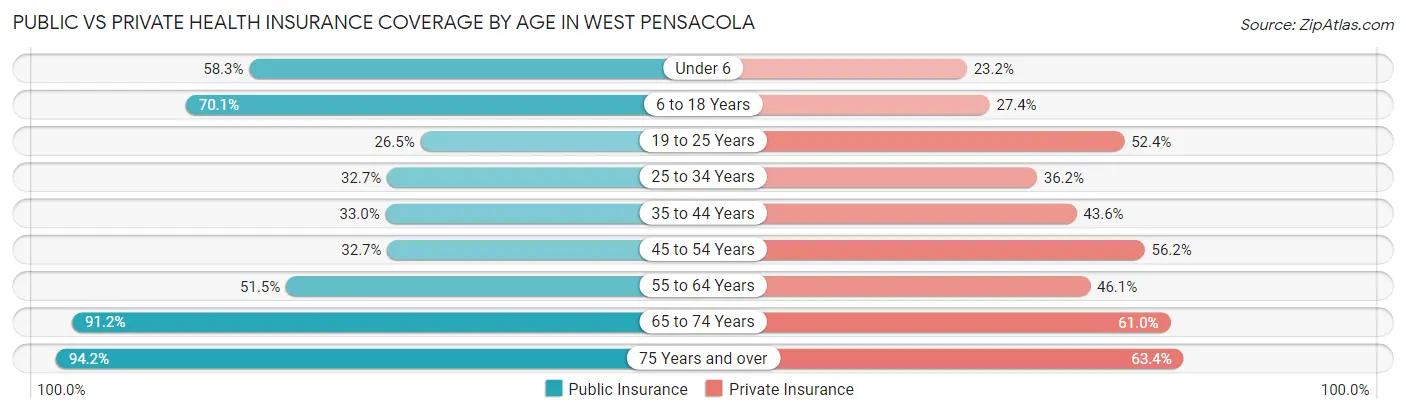
| Age Bracket | Public Insurance | Private Insurance |
| Under 6 | 1,134 (58.3%) | 451 (23.2%) |
| 6 to 18 Years | 2,017 (70.1%) | 789 (27.4%) |
| 19 to 25 Years | 554 (26.5%) | 1,095 (52.4%) |
| 25 to 34 Years | 1,006 (32.7%) | 1,113 (36.2%) |
| 35 to 44 Years | 824 (33.0%) | 1,087 (43.5%) |
| 45 to 54 Years | 851 (32.7%) | 1,464 (56.2%) |
| 55 to 64 Years | 1,301 (51.5%) | 1,165 (46.1%) |
| 65 to 74 Years | 2,340 (91.2%) | 1,565 (61.0%) |
| 75 Years and over | 894 (94.2%) | 602 (63.4%) |
| Total | 10,921 (51.7%) | 9,331 (44.2%) |
Disability Status by Sex by Age in West Pensacola
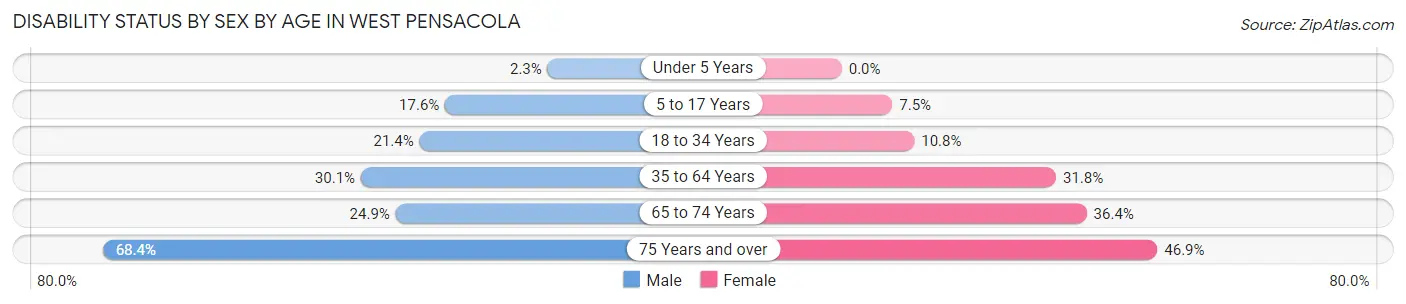
| Age Bracket | Male | Female |
| Under 5 Years | 17 (2.3%) | 0 (0.0%) |
| 5 to 17 Years | 319 (17.5%) | 92 (7.5%) |
| 18 to 34 Years | 576 (21.4%) | 279 (10.8%) |
| 35 to 64 Years | 1,098 (30.1%) | 1,265 (31.8%) |
| 65 to 74 Years | 304 (24.9%) | 489 (36.4%) |
| 75 Years and over | 290 (68.4%) | 246 (46.9%) |
Disability Class by Sex by Age in West Pensacola
Disability Class: Hearing Difficulty
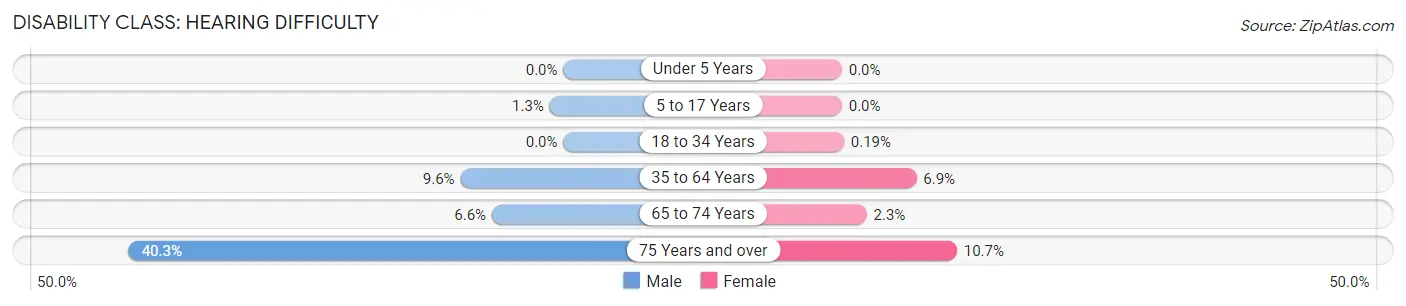
| Age Bracket | Male | Female |
| Under 5 Years | 0 (0.0%) | 0 (0.0%) |
| 5 to 17 Years | 23 (1.3%) | 0 (0.0%) |
| 18 to 34 Years | 0 (0.0%) | 5 (0.2%) |
| 35 to 64 Years | 349 (9.6%) | 275 (6.9%) |
| 65 to 74 Years | 81 (6.6%) | 31 (2.3%) |
| 75 Years and over | 171 (40.3%) | 56 (10.7%) |
Disability Class: Vision Difficulty
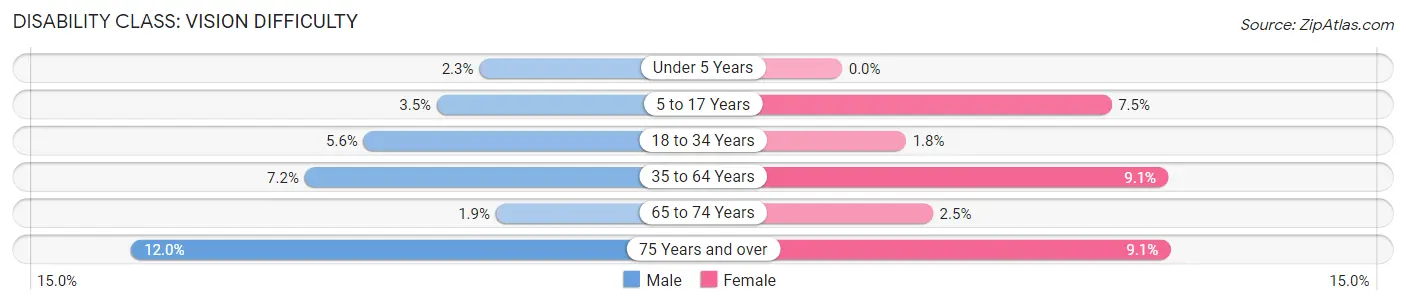
| Age Bracket | Male | Female |
| Under 5 Years | 17 (2.3%) | 0 (0.0%) |
| 5 to 17 Years | 64 (3.5%) | 92 (7.5%) |
| 18 to 34 Years | 150 (5.6%) | 46 (1.8%) |
| 35 to 64 Years | 263 (7.2%) | 361 (9.1%) |
| 65 to 74 Years | 23 (1.9%) | 34 (2.5%) |
| 75 Years and over | 51 (12.0%) | 48 (9.1%) |
Disability Class: Cognitive Difficulty
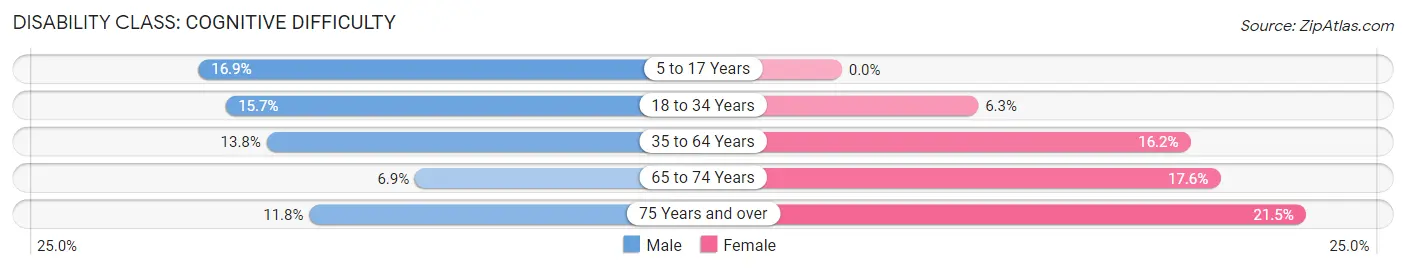
| Age Bracket | Male | Female |
| 5 to 17 Years | 308 (16.9%) | 0 (0.0%) |
| 18 to 34 Years | 423 (15.7%) | 164 (6.3%) |
| 35 to 64 Years | 503 (13.8%) | 643 (16.2%) |
| 65 to 74 Years | 84 (6.9%) | 236 (17.5%) |
| 75 Years and over | 50 (11.8%) | 113 (21.5%) |
Disability Class: Ambulatory Difficulty
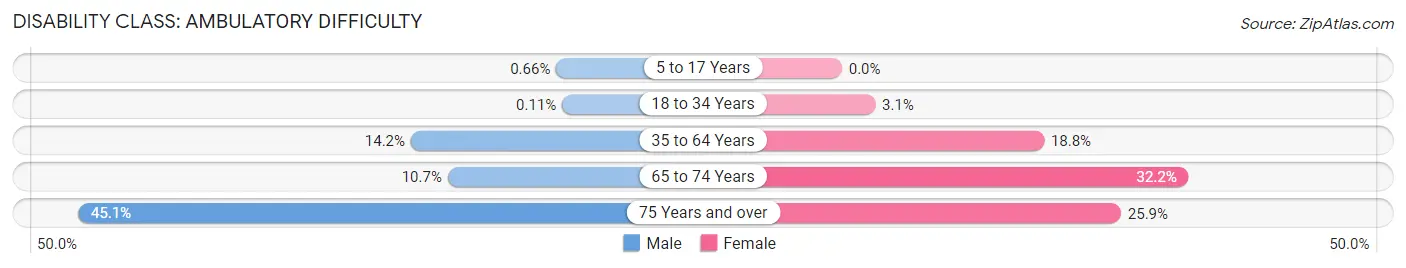
| Age Bracket | Male | Female |
| 5 to 17 Years | 12 (0.7%) | 0 (0.0%) |
| 18 to 34 Years | 3 (0.1%) | 80 (3.1%) |
| 35 to 64 Years | 517 (14.1%) | 746 (18.8%) |
| 65 to 74 Years | 131 (10.7%) | 433 (32.2%) |
| 75 Years and over | 191 (45.1%) | 136 (25.9%) |
Disability Class: Self-Care Difficulty
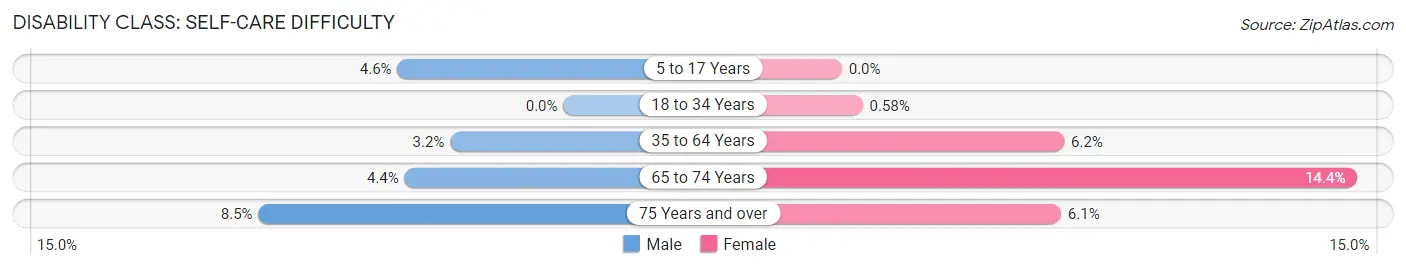
| Age Bracket | Male | Female |
| 5 to 17 Years | 84 (4.6%) | 0 (0.0%) |
| 18 to 34 Years | 0 (0.0%) | 15 (0.6%) |
| 35 to 64 Years | 115 (3.2%) | 246 (6.2%) |
| 65 to 74 Years | 54 (4.4%) | 193 (14.3%) |
| 75 Years and over | 36 (8.5%) | 32 (6.1%) |
Technology Access in West Pensacola
Computing Device Access in West Pensacola
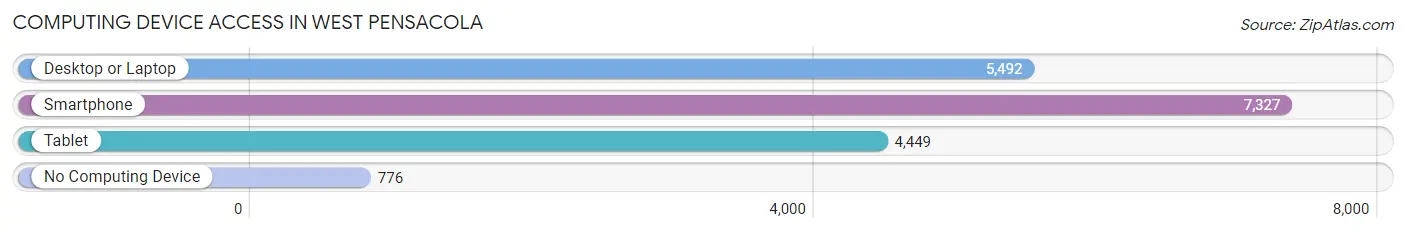
| Device Type | # Households | % Households |
| Desktop or Laptop | 5,492 | 63.2% |
| Smartphone | 7,327 | 84.4% |
| Tablet | 4,449 | 51.2% |
| No Computing Device | 776 | 8.9% |
| Total | 8,686 | 100.0% |
Internet Access in West Pensacola
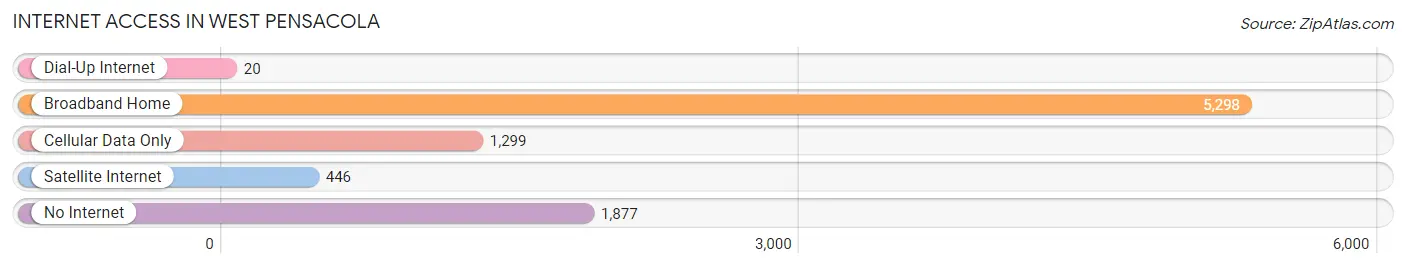
| Internet Type | # Households | % Households |
| Dial-Up Internet | 20 | 0.2% |
| Broadband Home | 5,298 | 61.0% |
| Cellular Data Only | 1,299 | 15.0% |
| Satellite Internet | 446 | 5.1% |
| No Internet | 1,877 | 21.6% |
| Total | 8,686 | 100.0% |
West Pensacola Summary
Pensacola, Florida is a city located in Escambia County in the northwestern part of the state. It is the county seat and the largest city in the county. The city is situated on the Gulf of Mexico and is part of the Pensacola-Ferry Pass-Brent Metropolitan Statistical Area. The city is home to the Naval Air Station Pensacola, the National Naval Aviation Museum, and the Pensacola Lighthouse. West Pensacola is a neighborhood located in the western part of the city. It is bordered by the Escambia Bay to the north, the Pensacola Bay to the east, and the Gulf of Mexico to the south.
History
The area that is now West Pensacola was originally inhabited by Native American tribes, including the Muscogee, Choctaw, and Creek. The first European settlers arrived in the area in the late 16th century, when Spanish explorers established a settlement in the area. The settlement was abandoned in the early 18th century, but the area was later re-settled by the British. The British established a trading post in the area in 1763, and the settlement was named Pensacola. The city was captured by the Spanish in 1781, and it remained under Spanish control until 1821, when it was ceded to the United States.
In the late 19th century, West Pensacola began to develop as a residential area. The area was annexed by the city of Pensacola in 1887, and the first public school in the area was established in 1891. The area continued to grow throughout the 20th century, and by the 2000s, it had become a popular residential area.
Geography
West Pensacola is located in the western part of the city of Pensacola. It is bordered by the Escambia Bay to the north, the Pensacola Bay to the east, and the Gulf of Mexico to the south. The neighborhood is located at an elevation of 10 feet (3 meters) above sea level. The area is mostly flat, with some low hills in the northern part of the neighborhood.
Economy
West Pensacola is primarily a residential area, but it is also home to several businesses. The area is home to a number of restaurants, bars, and retail stores. The neighborhood is also home to a number of medical facilities, including the West Florida Hospital and the West Florida Medical Center.
Demographics
As of the 2010 census, West Pensacola had a population of 8,945. The racial makeup of the neighborhood was 79.3% White, 15.2% African American, 0.7% Native American, 1.2% Asian, 0.1% Pacific Islander, 1.3% from other races, and 2.4% from two or more races. Hispanic or Latino of any race were 4.2% of the population.
The median household income in West Pensacola was $37,945, and the median family income was $45,945. The per capita income was $20,945. About 15.2% of the population was below the poverty line.
Common Questions
What is Per Capita Income in West Pensacola?
Per Capita income in West Pensacola is $20,514.
What is the Median Family Income in West Pensacola?
Median Family Income in West Pensacola is $46,968.
What is the Median Household income in West Pensacola?
Median Household Income in West Pensacola is $38,263.
What is Income or Wage Gap in West Pensacola?
Income or Wage Gap in West Pensacola is 17.1%.
Women in West Pensacola earn 82.9 cents for every dollar earned by a man.
What is Family Income Deficit in West Pensacola?
Family Income Deficit in West Pensacola is $10,846.
Families that are below poverty line in West Pensacola earn $10,846 less on average than the poverty threshold level.
What is Inequality or Gini Index in West Pensacola?
Inequality or Gini Index in West Pensacola is 0.42.
What is the Total Population of West Pensacola?
Total Population of West Pensacola is 21,246.
What is the Total Male Population of West Pensacola?
Total Male Population of West Pensacola is 10,591.
What is the Total Female Population of West Pensacola?
Total Female Population of West Pensacola is 10,655.
What is the Ratio of Males per 100 Females in West Pensacola?
There are 99.40 Males per 100 Females in West Pensacola.
What is the Ratio of Females per 100 Males in West Pensacola?
There are 100.60 Females per 100 Males in West Pensacola.
What is the Median Population Age in West Pensacola?
Median Population Age in West Pensacola is 37.6 Years.
What is the Average Family Size in West Pensacola
Average Family Size in West Pensacola is 3.1 People.
What is the Average Household Size in West Pensacola
Average Household Size in West Pensacola is 2.4 People.
How Large is the Labor Force in West Pensacola?
There are 9,484 People in the Labor Forcein in West Pensacola.
What is the Percentage of People in the Labor Force in West Pensacola?
55.9% of People are in the Labor Force in West Pensacola.
What is the Unemployment Rate in West Pensacola?
Unemployment Rate in West Pensacola is 6.9%.