Brookdale, SC Map & Demographics
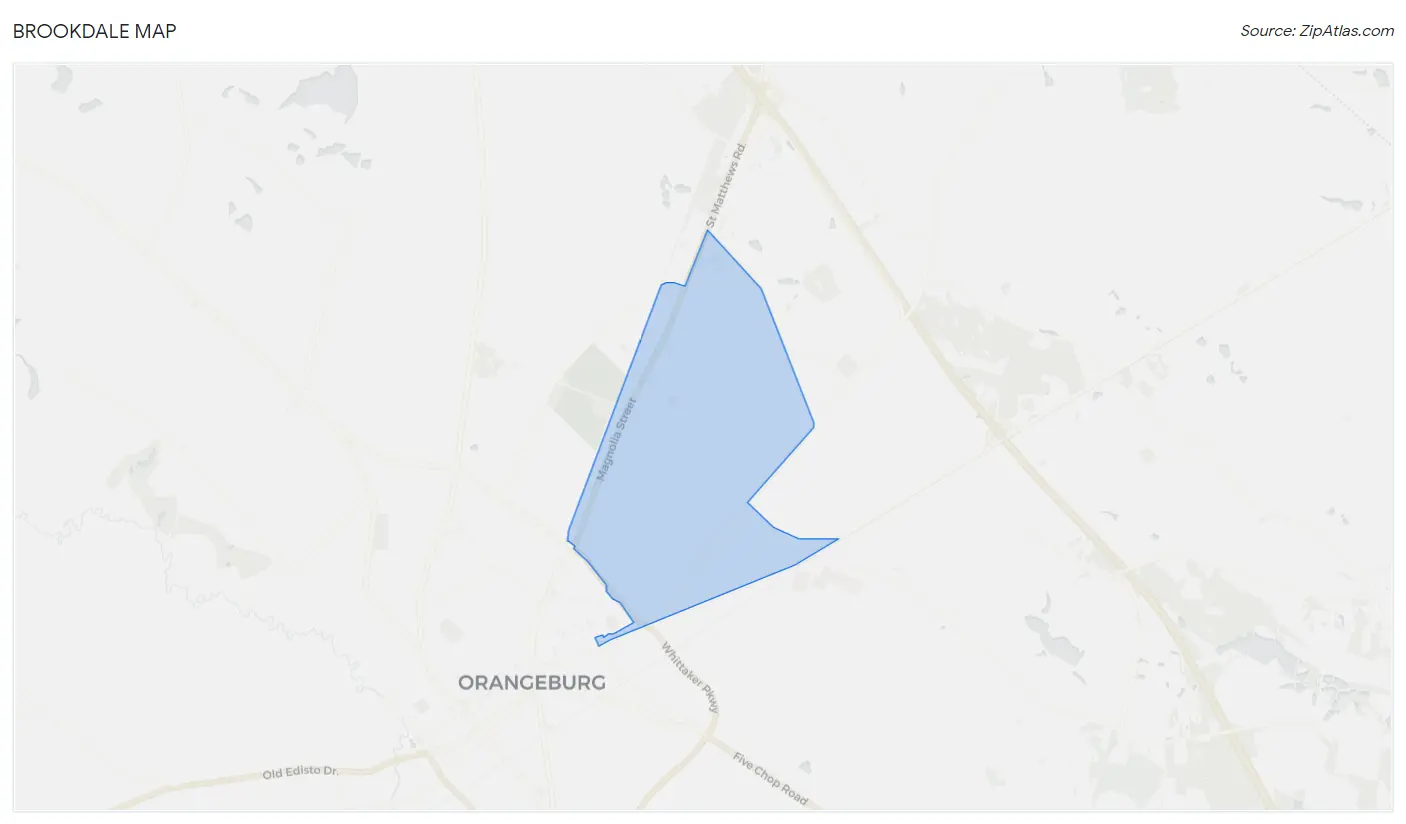
Brookdale Map
Brookdale Overview
$18,263
PER CAPITA INCOME
$42,386
AVG FAMILY INCOME
$33,406
AVG HOUSEHOLD INCOME
38.6%
WAGE / INCOME GAP [ % ]
61.4¢/ $1
WAGE / INCOME GAP [ $ ]
$11,123
FAMILY INCOME DEFICIT
0.45
INEQUALITY / GINI INDEX
4,069
TOTAL POPULATION
1,729
MALE POPULATION
2,340
FEMALE POPULATION
73.89
MALES / 100 FEMALES
135.34
FEMALES / 100 MALES
37.5
MEDIAN AGE
3.0
AVG FAMILY SIZE
2.4
AVG HOUSEHOLD SIZE
1,720
LABOR FORCE [ PEOPLE ]
48.9%
PERCENT IN LABOR FORCE
12.8%
UNEMPLOYMENT RATE
Income in Brookdale
Income Overview in Brookdale
Per Capita Income in Brookdale is $18,263, while median incomes of families and households are $42,386 and $33,406 respectively.
| Characteristic | Number | Measure |
| Per Capita Income | 4,069 | $18,263 |
| Median Family Income | 915 | $42,386 |
| Mean Family Income | 915 | $56,607 |
| Median Household Income | 1,601 | $33,406 |
| Mean Household Income | 1,601 | $43,675 |
| Income Deficit | 915 | $11,123 |
| Wage / Income Gap (%) | 4,069 | 38.61% |
| Wage / Income Gap ($) | 4,069 | 61.39¢ per $1 |
| Gini / Inequality Index | 4,069 | 0.45 |
Earnings by Sex in Brookdale
Average Earnings in Brookdale are $17,245, $16,206 for men and $26,400 for women, a difference of 38.6%.
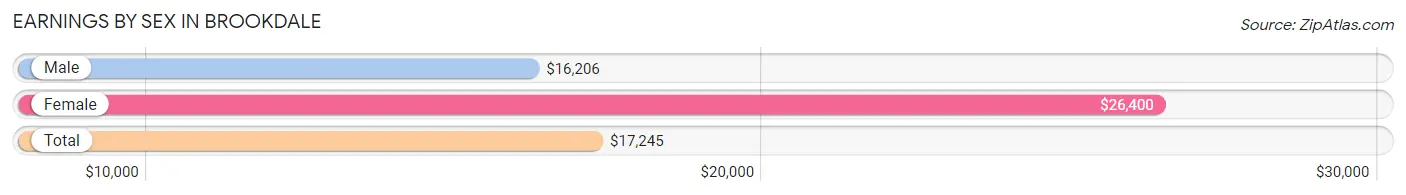
| Sex | Number | Average Earnings |
| Male | 984 (51.7%) | $16,206 |
| Female | 920 (48.3%) | $26,400 |
| Total | 1,904 (100.0%) | $17,245 |
Earnings by Sex by Income Bracket in Brookdale
The most common earnings brackets in Brookdale are $15,000 to $17,499 for men (253 | 25.7%) and $35,000 to $39,999 for women (177 | 19.2%).
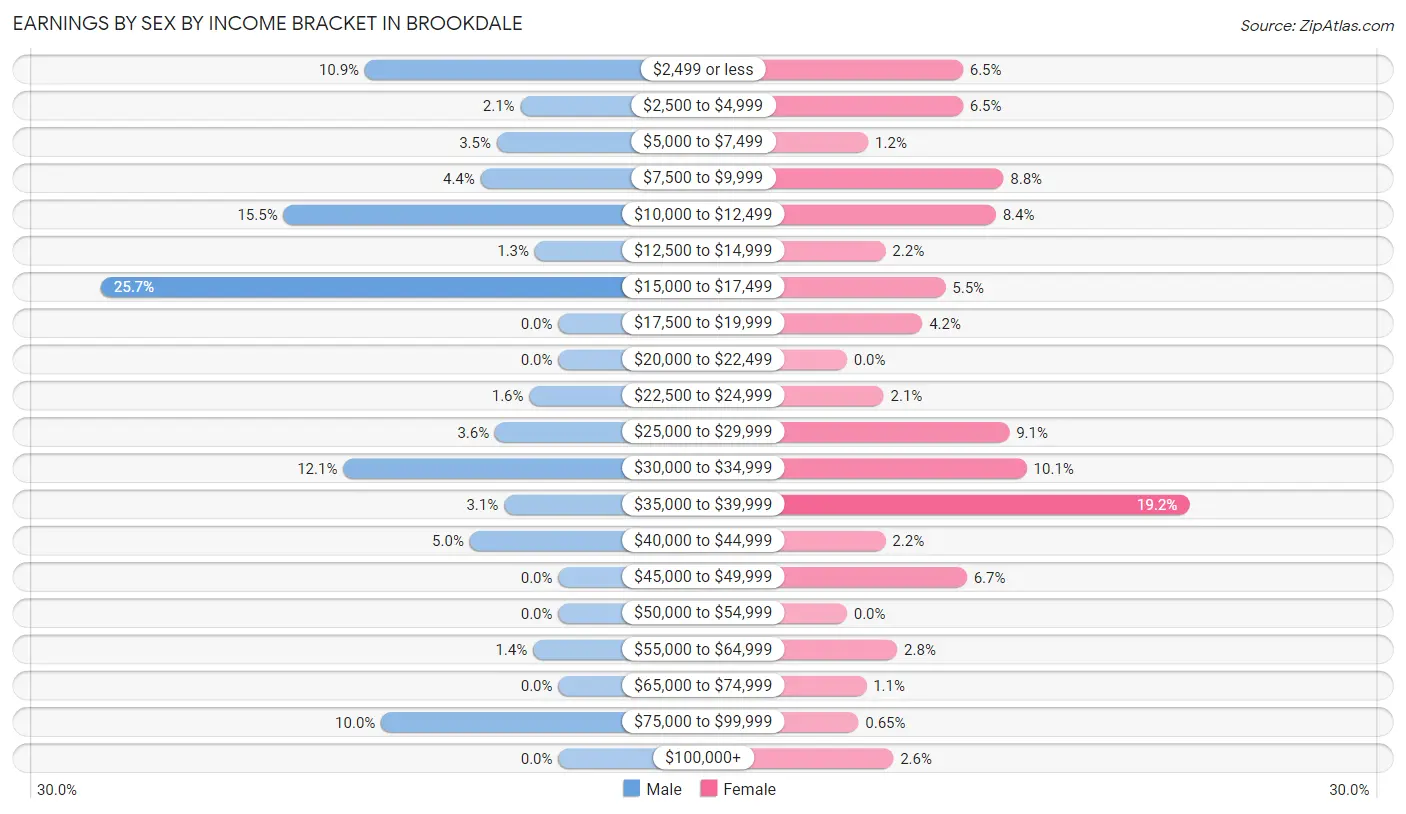
| Income | Male | Female |
| $2,499 or less | 107 (10.9%) | 60 (6.5%) |
| $2,500 to $4,999 | 21 (2.1%) | 60 (6.5%) |
| $5,000 to $7,499 | 34 (3.5%) | 11 (1.2%) |
| $7,500 to $9,999 | 43 (4.4%) | 81 (8.8%) |
| $10,000 to $12,499 | 152 (15.4%) | 77 (8.4%) |
| $12,500 to $14,999 | 13 (1.3%) | 20 (2.2%) |
| $15,000 to $17,499 | 253 (25.7%) | 51 (5.5%) |
| $17,500 to $19,999 | 0 (0.0%) | 39 (4.2%) |
| $20,000 to $22,499 | 0 (0.0%) | 0 (0.0%) |
| $22,500 to $24,999 | 16 (1.6%) | 19 (2.1%) |
| $25,000 to $29,999 | 35 (3.6%) | 84 (9.1%) |
| $30,000 to $34,999 | 119 (12.1%) | 93 (10.1%) |
| $35,000 to $39,999 | 30 (3.0%) | 177 (19.2%) |
| $40,000 to $44,999 | 49 (5.0%) | 20 (2.2%) |
| $45,000 to $49,999 | 0 (0.0%) | 62 (6.7%) |
| $50,000 to $54,999 | 0 (0.0%) | 0 (0.0%) |
| $55,000 to $64,999 | 14 (1.4%) | 26 (2.8%) |
| $65,000 to $74,999 | 0 (0.0%) | 10 (1.1%) |
| $75,000 to $99,999 | 98 (10.0%) | 6 (0.6%) |
| $100,000+ | 0 (0.0%) | 24 (2.6%) |
| Total | 984 (100.0%) | 920 (100.0%) |
Earnings by Sex by Educational Attainment in Brookdale
Average earnings in Brookdale are $16,650 for men and $33,817 for women, a difference of 50.8%. Men with an educational attainment of college or associate's degree enjoy the highest average annual earnings of $35,400, while those with less than high school education earn the least with $10,721. Women with an educational attainment of bachelor's degree earn the most with the average annual earnings of $39,594, while those with high school diploma education have the smallest earnings of $16,324.
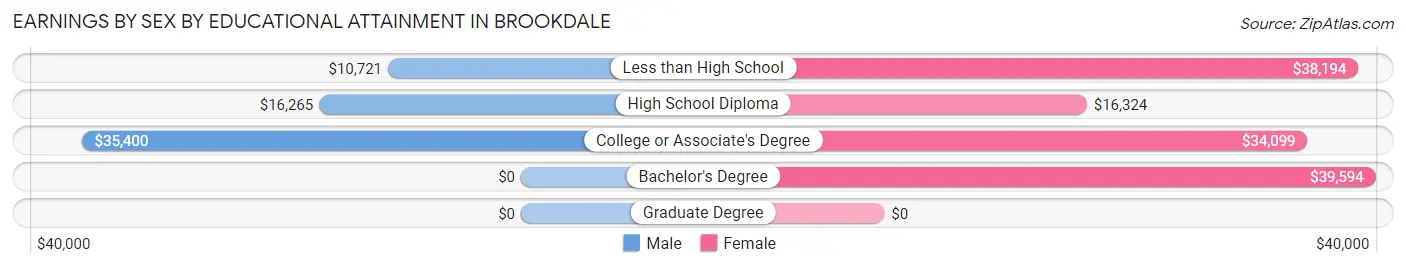
| Educational Attainment | Male Income | Female Income |
| Less than High School | $10,721 | $38,194 |
| High School Diploma | $16,265 | $16,324 |
| College or Associate's Degree | $35,400 | $34,099 |
| Bachelor's Degree | - | - |
| Graduate Degree | - | - |
| Total | $16,650 | $33,817 |
Family Income in Brookdale
Family Income Brackets in Brookdale
According to the Brookdale family income data, there are 183 families falling into the $75,000 to $99,999 income range, which is the most common income bracket and makes up 20.0% of all families. Conversely, the $150,000 to $199,999 income bracket is the least frequent group with only 7 families (0.8%) belonging to this category.
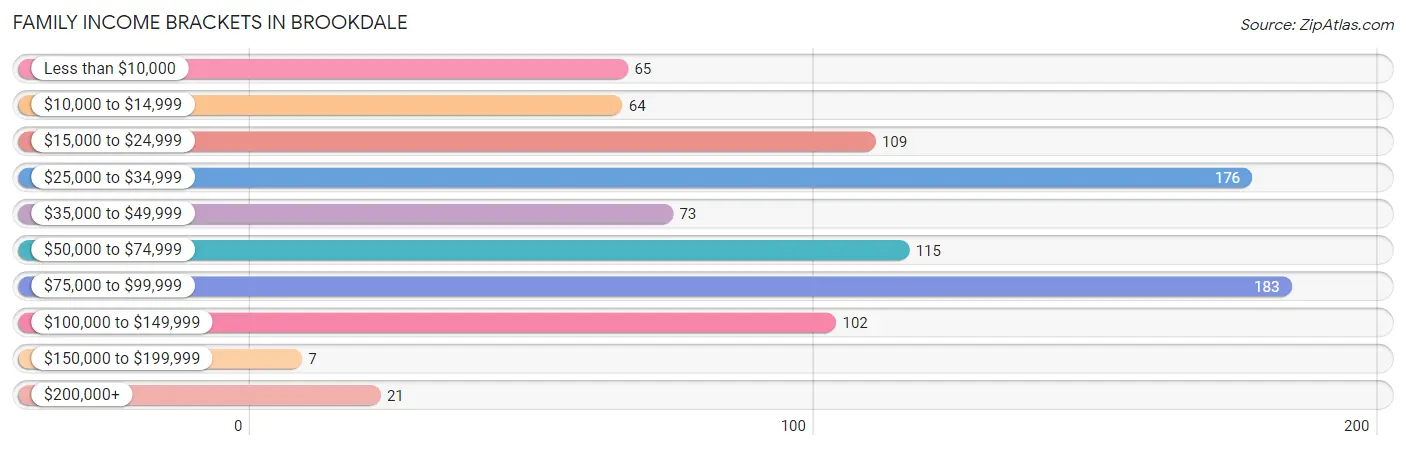
| Income Bracket | # Families | % Families |
| Less than $10,000 | 65 | 7.1% |
| $10,000 to $14,999 | 64 | 7.0% |
| $15,000 to $24,999 | 109 | 11.9% |
| $25,000 to $34,999 | 176 | 19.2% |
| $35,000 to $49,999 | 73 | 8.0% |
| $50,000 to $74,999 | 115 | 12.6% |
| $75,000 to $99,999 | 183 | 20.0% |
| $100,000 to $149,999 | 102 | 11.1% |
| $150,000 to $199,999 | 7 | 0.8% |
| $200,000+ | 21 | 2.3% |
Family Income by Famaliy Size in Brookdale
3-person families (426 | 46.6%) account for the highest median family income in Brookdale with $57,803 per family, while 3-person families (426 | 46.6%) have the highest median income of $19,268 per family member.
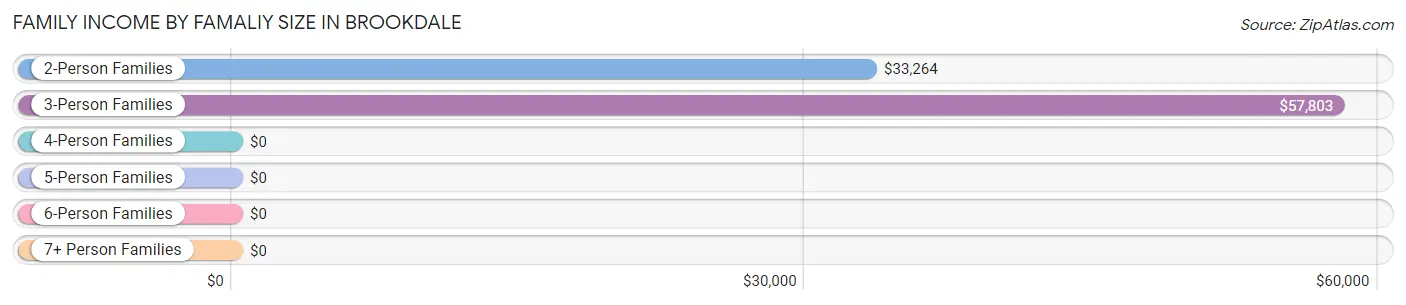
| Income Bracket | # Families | Median Income |
| 2-Person Families | 435 (47.5%) | $33,264 |
| 3-Person Families | 426 (46.6%) | $57,803 |
| 4-Person Families | 33 (3.6%) | $0 |
| 5-Person Families | 0 (0.0%) | $0 |
| 6-Person Families | 0 (0.0%) | $0 |
| 7+ Person Families | 21 (2.3%) | $0 |
| Total | 915 (100.0%) | $42,386 |
Family Income by Number of Earners in Brookdale
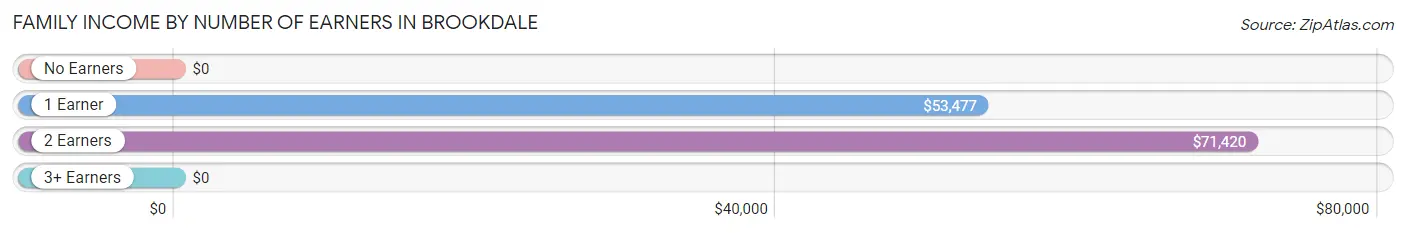
| Number of Earners | # Families | Median Income |
| No Earners | 228 (24.9%) | $0 |
| 1 Earner | 453 (49.5%) | $53,477 |
| 2 Earners | 193 (21.1%) | $71,420 |
| 3+ Earners | 41 (4.5%) | $0 |
| Total | 915 (100.0%) | $42,386 |
Household Income in Brookdale
Household Income Brackets in Brookdale
With 263 households falling in the category, the $25,000 to $34,999 income range is the most frequent in Brookdale, accounting for 16.4% of all households. In contrast, only 6 households (0.4%) fall into the $150,000 to $199,999 income bracket, making it the least populous group.
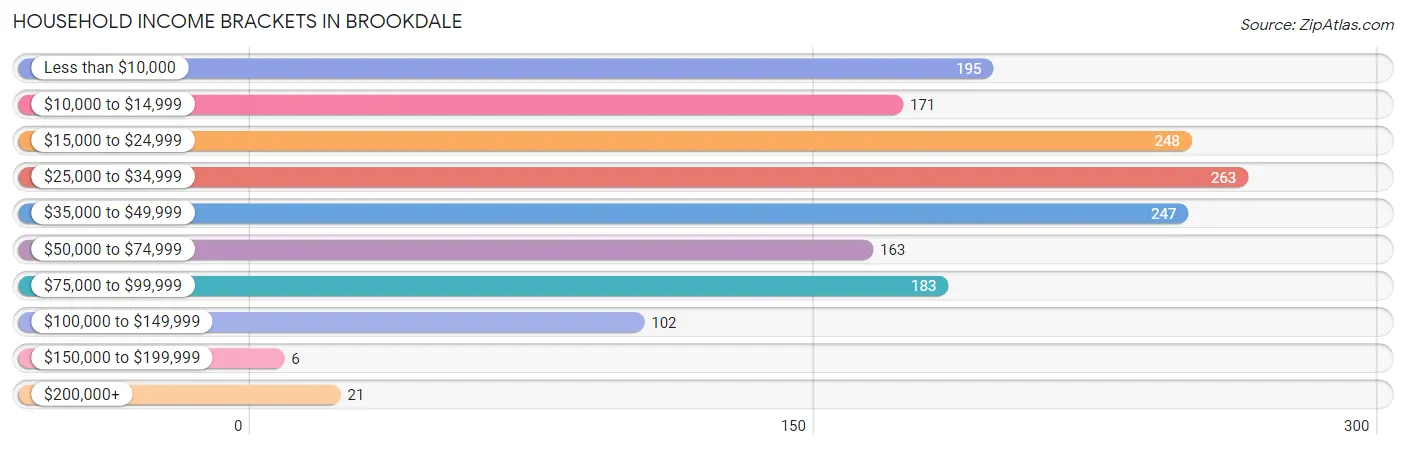
| Income Bracket | # Households | % Households |
| Less than $10,000 | 195 | 12.2% |
| $10,000 to $14,999 | 171 | 10.7% |
| $15,000 to $24,999 | 248 | 15.5% |
| $25,000 to $34,999 | 263 | 16.4% |
| $35,000 to $49,999 | 247 | 15.4% |
| $50,000 to $74,999 | 163 | 10.2% |
| $75,000 to $99,999 | 183 | 11.4% |
| $100,000 to $149,999 | 102 | 6.4% |
| $150,000 to $199,999 | 6 | 0.4% |
| $200,000+ | 21 | 1.3% |
Household Income by Householder Age in Brookdale
The median household income in Brookdale is $33,406, with the highest median household income of $37,532 found in the 45 to 64 years age bracket for the primary householder. A total of 478 households (29.9%) fall into this category. Meanwhile, the 15 to 24 years age bracket for the primary householder has the lowest median household income of $0, with 53 households (3.3%) in this group.
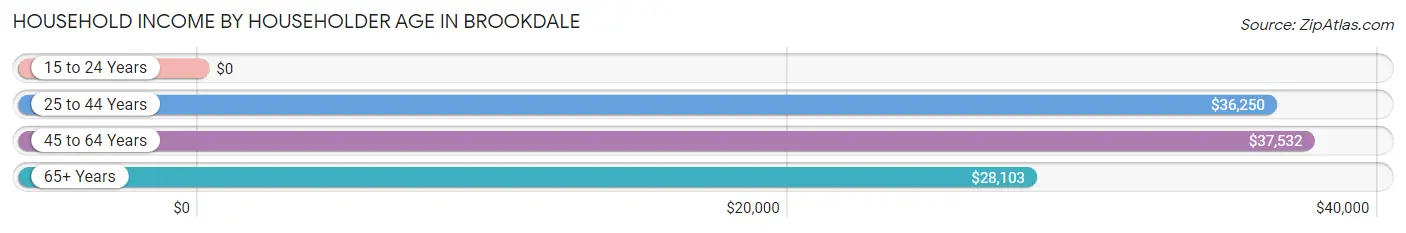
| Income Bracket | # Households | Median Income |
| 15 to 24 Years | 53 (3.3%) | $0 |
| 25 to 44 Years | 526 (32.9%) | $36,250 |
| 45 to 64 Years | 478 (29.9%) | $37,532 |
| 65+ Years | 544 (34.0%) | $28,103 |
| Total | 1,601 (100.0%) | $33,406 |
Poverty in Brookdale
Income Below Poverty by Sex and Age in Brookdale
With 35.9% poverty level for males and 31.4% for females among the residents of Brookdale, under 5 year old males and 6 to 11 year old females are the most vulnerable to poverty, with 53 males (100.0%) and 30 females (100.0%) in their respective age groups living below the poverty level.
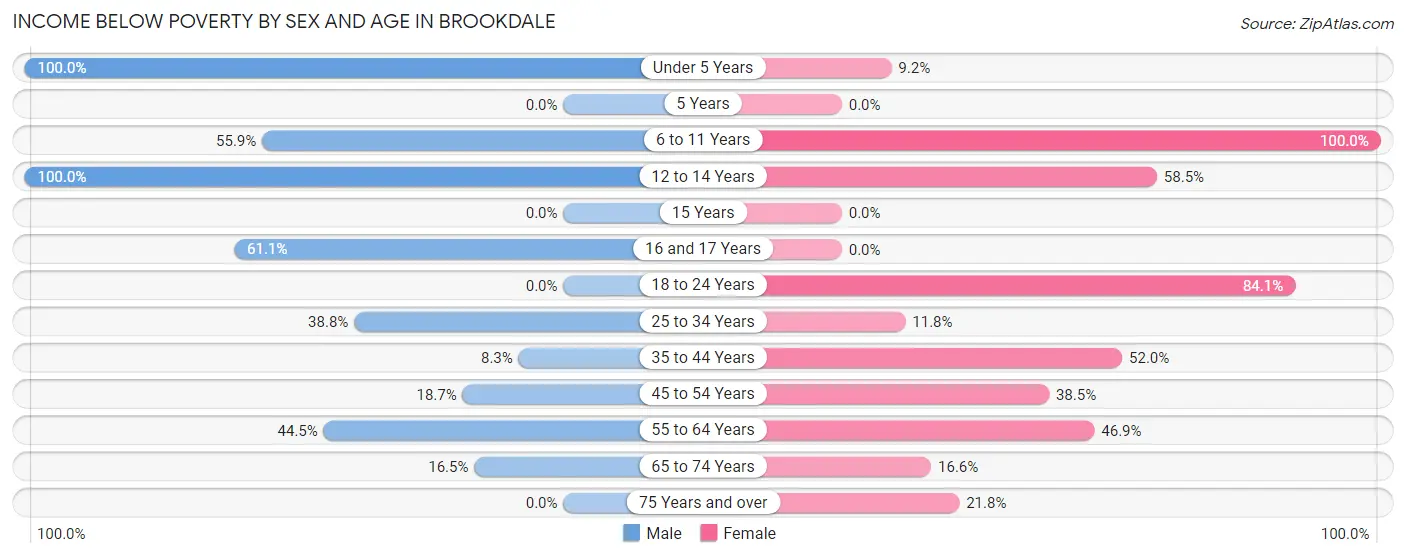
| Age Bracket | Male | Female |
| Under 5 Years | 53 (100.0%) | 22 (9.2%) |
| 5 Years | 0 (0.0%) | 0 (0.0%) |
| 6 to 11 Years | 85 (55.9%) | 30 (100.0%) |
| 12 to 14 Years | 24 (100.0%) | 31 (58.5%) |
| 15 Years | 0 (0.0%) | 0 (0.0%) |
| 16 and 17 Years | 66 (61.1%) | 0 (0.0%) |
| 18 to 24 Years | 0 (0.0%) | 90 (84.1%) |
| 25 to 34 Years | 212 (38.8%) | 36 (11.8%) |
| 35 to 44 Years | 19 (8.3%) | 128 (52.0%) |
| 45 to 54 Years | 29 (18.7%) | 40 (38.5%) |
| 55 to 64 Years | 85 (44.5%) | 188 (46.9%) |
| 65 to 74 Years | 20 (16.5%) | 64 (16.6%) |
| 75 Years and over | 0 (0.0%) | 58 (21.8%) |
| Total | 593 (35.9%) | 687 (31.4%) |
Income Above Poverty by Sex and Age in Brookdale
According to the poverty statistics in Brookdale, males aged 18 to 24 years and females aged 16 and 17 years are the age groups that are most secure financially, with 100.0% of males and 100.0% of females in these age groups living above the poverty line.
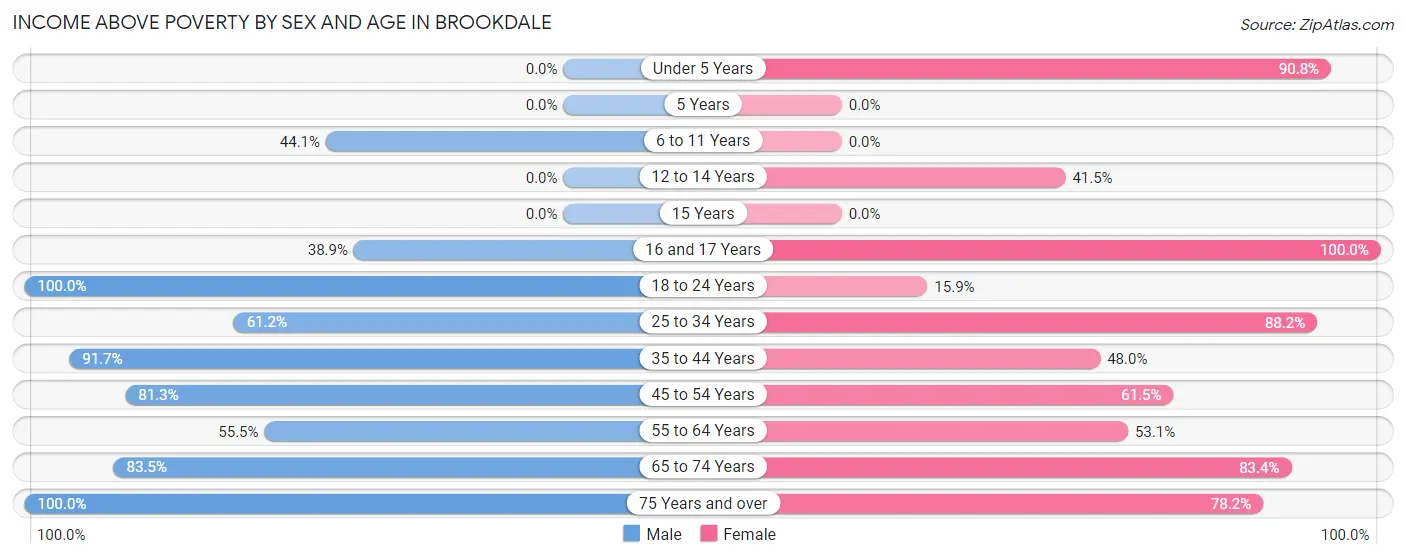
| Age Bracket | Male | Female |
| Under 5 Years | 0 (0.0%) | 217 (90.8%) |
| 5 Years | 0 (0.0%) | 0 (0.0%) |
| 6 to 11 Years | 67 (44.1%) | 0 (0.0%) |
| 12 to 14 Years | 0 (0.0%) | 22 (41.5%) |
| 15 Years | 0 (0.0%) | 0 (0.0%) |
| 16 and 17 Years | 42 (38.9%) | 48 (100.0%) |
| 18 to 24 Years | 12 (100.0%) | 17 (15.9%) |
| 25 to 34 Years | 334 (61.2%) | 269 (88.2%) |
| 35 to 44 Years | 210 (91.7%) | 118 (48.0%) |
| 45 to 54 Years | 126 (81.3%) | 64 (61.5%) |
| 55 to 64 Years | 106 (55.5%) | 213 (53.1%) |
| 65 to 74 Years | 101 (83.5%) | 322 (83.4%) |
| 75 Years and over | 62 (100.0%) | 208 (78.2%) |
| Total | 1,060 (64.1%) | 1,498 (68.6%) |
Income Below Poverty Among Married-Couple Families in Brookdale
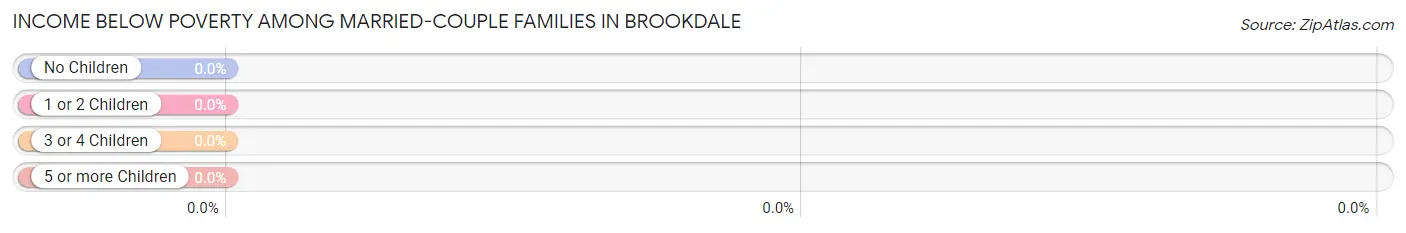
| Children | Above Poverty | Below Poverty |
| No Children | 300 (100.0%) | 0 (0.0%) |
| 1 or 2 Children | 17 (100.0%) | 0 (0.0%) |
| 3 or 4 Children | 21 (100.0%) | 0 (0.0%) |
| 5 or more Children | 0 (0.0%) | 0 (0.0%) |
| Total | 338 (100.0%) | 0 (0.0%) |
Income Below Poverty Among Single-Parent Households in Brookdale
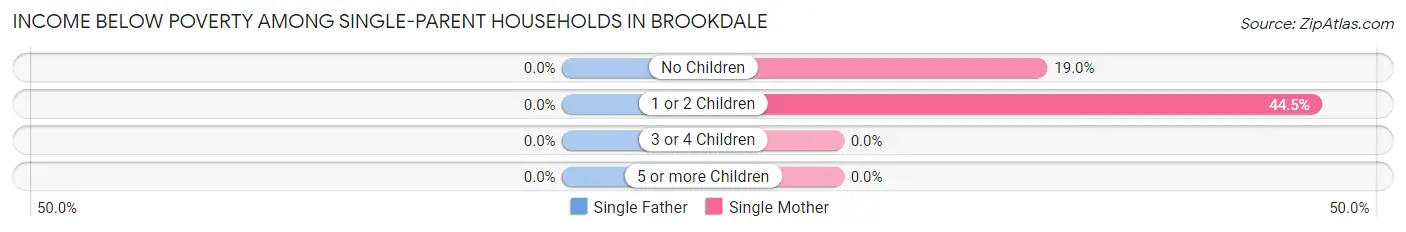
| Children | Single Father | Single Mother |
| No Children | 0 (0.0%) | 37 (19.0%) |
| 1 or 2 Children | 0 (0.0%) | 170 (44.5%) |
| 3 or 4 Children | 0 (0.0%) | 0 (0.0%) |
| 5 or more Children | 0 (0.0%) | 0 (0.0%) |
| Total | 0 (0.0%) | 207 (35.9%) |
Income Below Poverty Among Married-Couple vs Single-Parent Households in Brookdale
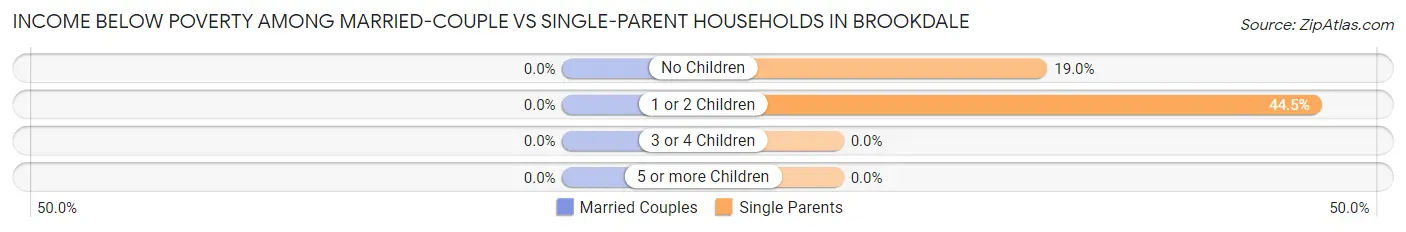
| Children | Married-Couple Families | Single-Parent Households |
| No Children | 0 (0.0%) | 37 (19.0%) |
| 1 or 2 Children | 0 (0.0%) | 170 (44.5%) |
| 3 or 4 Children | 0 (0.0%) | 0 (0.0%) |
| 5 or more Children | 0 (0.0%) | 0 (0.0%) |
| Total | 0 (0.0%) | 207 (35.9%) |
Race in Brookdale
The most populous races in Brookdale are Black / African American (4,001 | 98.3%), Two or more Races (39 | 1.0%), and White / Caucasian (29 | 0.7%).
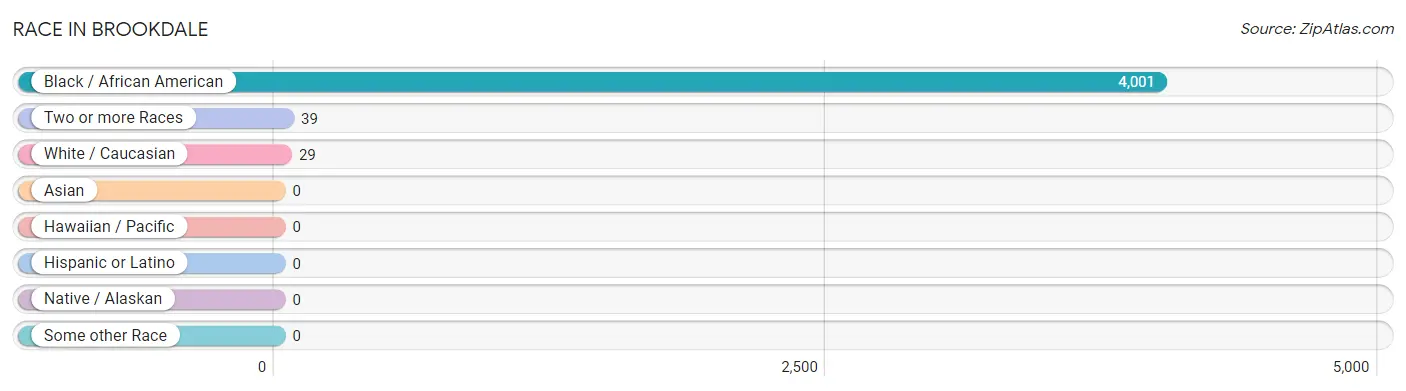
| Race | # Population | % Population |
| Asian | 0 | 0.0% |
| Black / African American | 4,001 | 98.3% |
| Hawaiian / Pacific | 0 | 0.0% |
| Hispanic or Latino | 0 | 0.0% |
| Native / Alaskan | 0 | 0.0% |
| White / Caucasian | 29 | 0.7% |
| Two or more Races | 39 | 1.0% |
| Some other Race | 0 | 0.0% |
| Total | 4,069 | 100.0% |
Ancestry in Brookdale
The most populous ancestries reported in Brookdale are Subsaharan African (51 | 1.3%), Sri Lankan (39 | 1.0%), American (34 | 0.8%), Senegalese (31 | 0.8%), and German (17 | 0.4%), together accounting for 4.2% of all Brookdale residents.
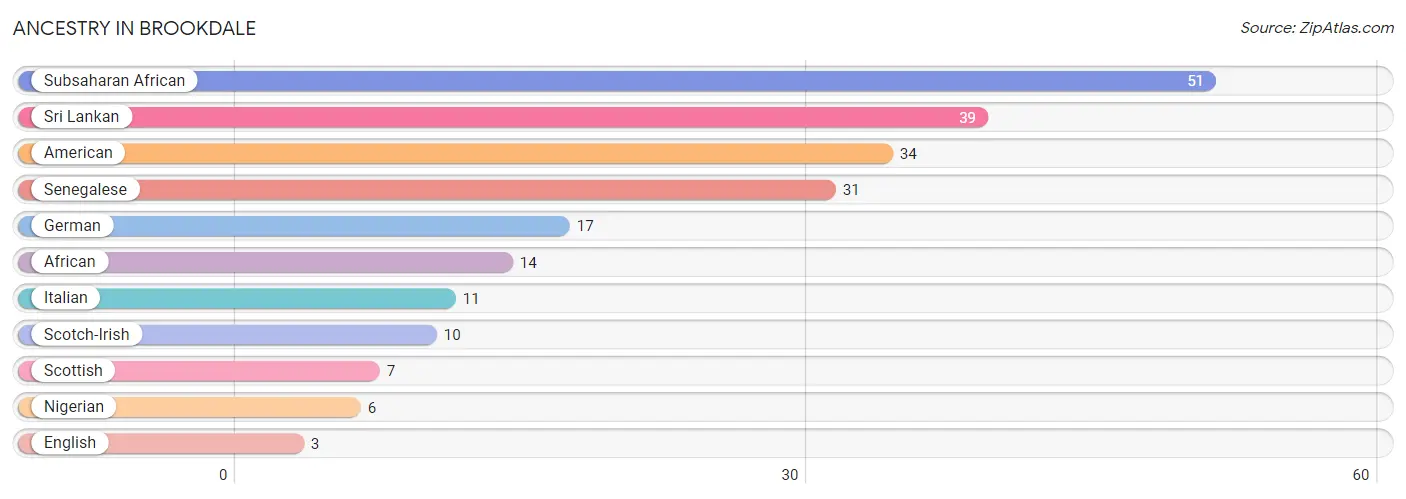
| Ancestry | # Population | % Population |
| African | 14 | 0.3% |
| American | 34 | 0.8% |
| English | 3 | 0.1% |
| German | 17 | 0.4% |
| Italian | 11 | 0.3% |
| Nigerian | 6 | 0.2% |
| Scotch-Irish | 10 | 0.3% |
| Scottish | 7 | 0.2% |
| Senegalese | 31 | 0.8% |
| Sri Lankan | 39 | 1.0% |
| Subsaharan African | 51 | 1.3% | View All 11 Rows |
Immigrants in Brookdale
The most numerous immigrant groups reported in Brookdale came from Africa (37 | 0.9%), Western Africa (37 | 0.9%), Senegal (31 | 0.8%), Asia (21 | 0.5%), and South Eastern Asia (21 | 0.5%), together accounting for 3.6% of all Brookdale residents.
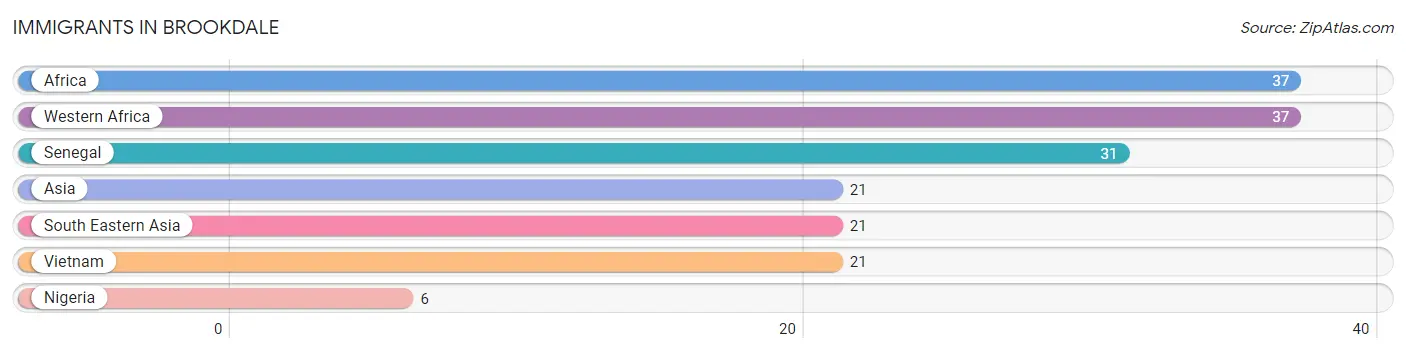
| Immigration Origin | # Population | % Population |
| Africa | 37 | 0.9% |
| Asia | 21 | 0.5% |
| Nigeria | 6 | 0.2% |
| Senegal | 31 | 0.8% |
| South Eastern Asia | 21 | 0.5% |
| Vietnam | 21 | 0.5% |
| Western Africa | 37 | 0.9% | View All 7 Rows |
Sex and Age in Brookdale
Sex and Age in Brookdale
The most populous age groups in Brookdale are 25 to 29 Years (349 | 20.2%) for men and Under 5 Years (239 | 10.2%) for women.
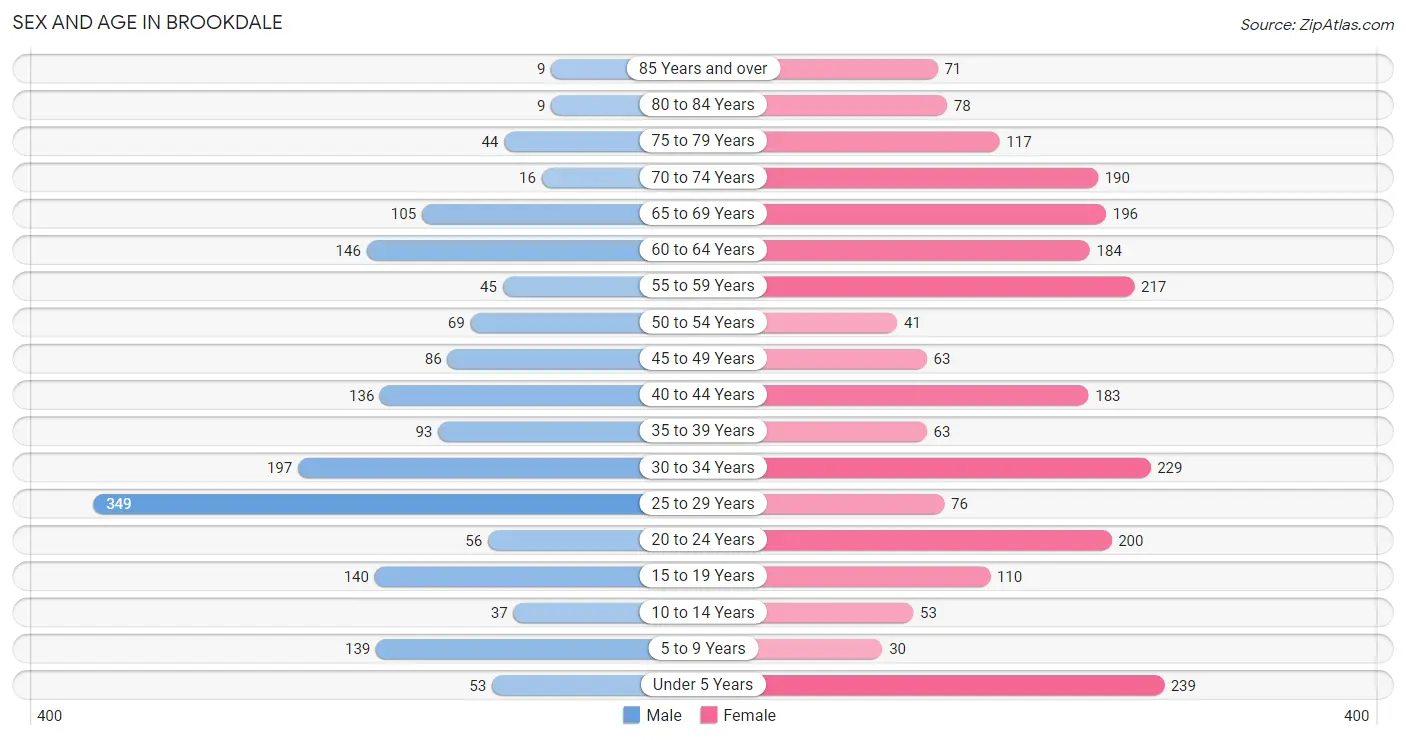
| Age Bracket | Male | Female |
| Under 5 Years | 53 (3.1%) | 239 (10.2%) |
| 5 to 9 Years | 139 (8.0%) | 30 (1.3%) |
| 10 to 14 Years | 37 (2.1%) | 53 (2.3%) |
| 15 to 19 Years | 140 (8.1%) | 110 (4.7%) |
| 20 to 24 Years | 56 (3.2%) | 200 (8.6%) |
| 25 to 29 Years | 349 (20.2%) | 76 (3.3%) |
| 30 to 34 Years | 197 (11.4%) | 229 (9.8%) |
| 35 to 39 Years | 93 (5.4%) | 63 (2.7%) |
| 40 to 44 Years | 136 (7.9%) | 183 (7.8%) |
| 45 to 49 Years | 86 (5.0%) | 63 (2.7%) |
| 50 to 54 Years | 69 (4.0%) | 41 (1.8%) |
| 55 to 59 Years | 45 (2.6%) | 217 (9.3%) |
| 60 to 64 Years | 146 (8.4%) | 184 (7.9%) |
| 65 to 69 Years | 105 (6.1%) | 196 (8.4%) |
| 70 to 74 Years | 16 (0.9%) | 190 (8.1%) |
| 75 to 79 Years | 44 (2.5%) | 117 (5.0%) |
| 80 to 84 Years | 9 (0.5%) | 78 (3.3%) |
| 85 Years and over | 9 (0.5%) | 71 (3.0%) |
| Total | 1,729 (100.0%) | 2,340 (100.0%) |
Families and Households in Brookdale
Median Family Size in Brookdale
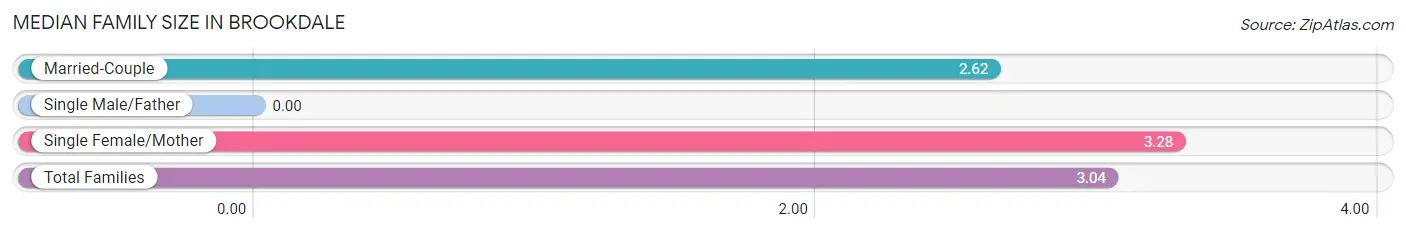
| Family Type | # Families | Family Size |
| Married-Couple | 338 (36.9%) | 2.62 |
| Single Male/Father | 0 (0.0%) | - |
| Single Female/Mother | 577 (63.1%) | 3.28 |
| Total Families | 915 (100.0%) | 3.04 |
Median Household Size in Brookdale
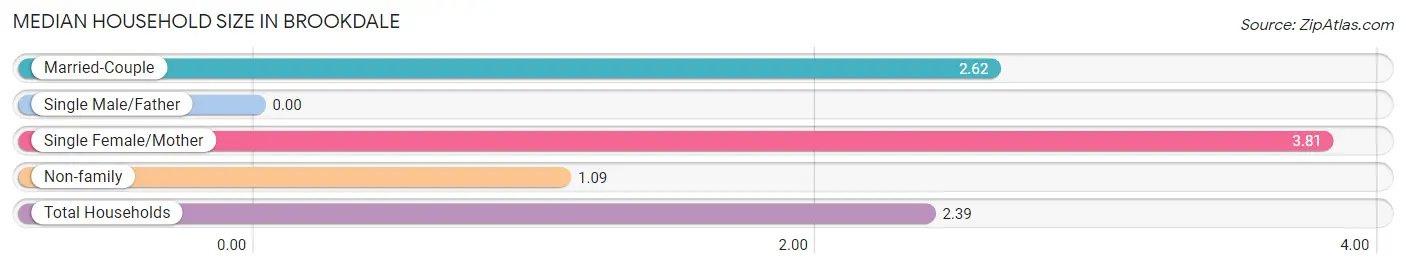
| Household Type | # Households | Household Size |
| Married-Couple | 338 (21.1%) | 2.62 |
| Single Male/Father | 0 (0.0%) | - |
| Single Female/Mother | 577 (36.0%) | 3.81 |
| Non-family | 686 (42.8%) | 1.09 |
| Total Households | 1,601 (100.0%) | 2.39 |
Household Size by Marriage Status in Brookdale
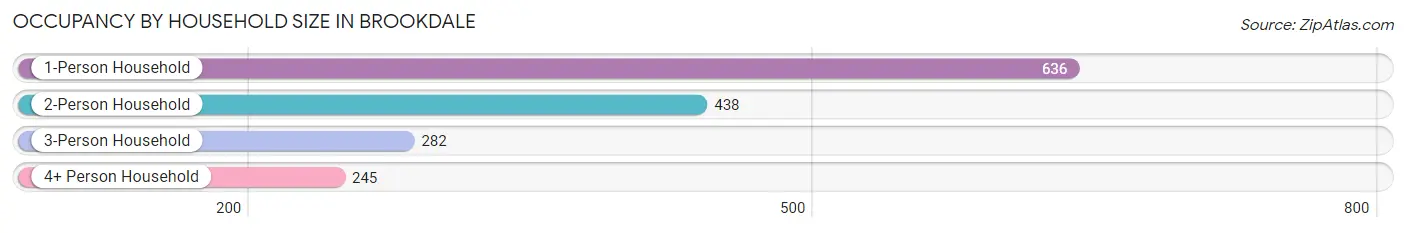
Out of a total of 1,601 households in Brookdale, 915 (57.2%) are family households, while 686 (42.8%) are nonfamily households. The most numerous type of family households are 2-person households, comprising 388, and the most common type of nonfamily households are 1-person households, comprising 636.
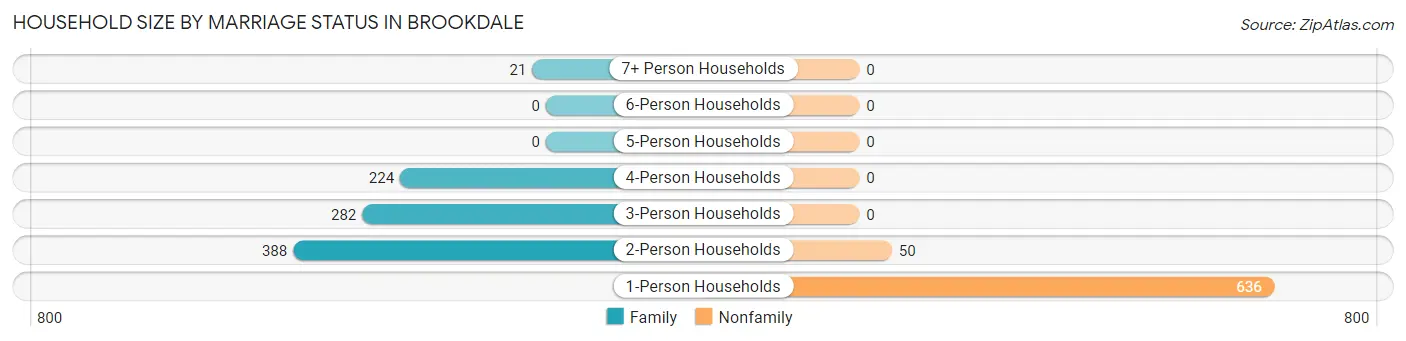
| Household Size | Family Households | Nonfamily Households |
| 1-Person Households | - | 636 (39.7%) |
| 2-Person Households | 388 (24.2%) | 50 (3.1%) |
| 3-Person Households | 282 (17.6%) | 0 (0.0%) |
| 4-Person Households | 224 (14.0%) | 0 (0.0%) |
| 5-Person Households | 0 (0.0%) | 0 (0.0%) |
| 6-Person Households | 0 (0.0%) | 0 (0.0%) |
| 7+ Person Households | 21 (1.3%) | 0 (0.0%) |
| Total | 915 (57.2%) | 686 (42.8%) |
Female Fertility in Brookdale
Fertility by Age in Brookdale
Average fertility rate in Brookdale is 42.0 births per 1,000 women. Women in the age bracket of 20 to 34 years have the highest fertility rate with 77.0 births per 1,000 women. Women in the age bracket of 20 to 34 years acount for 100.0% of all women with births.
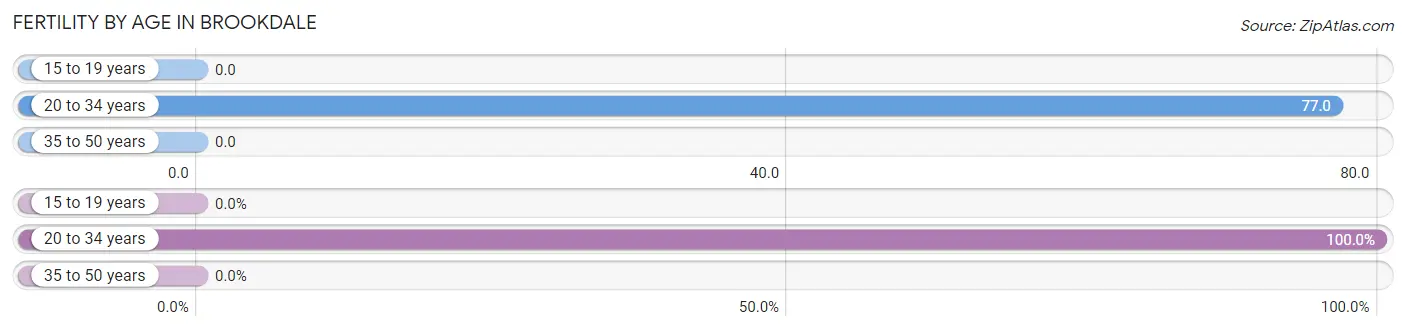
| Age Bracket | Women with Births | Births / 1,000 Women |
| 15 to 19 years | 0 (0.0%) | 0.0 |
| 20 to 34 years | 39 (100.0%) | 77.0 |
| 35 to 50 years | 0 (0.0%) | 0.0 |
| Total | 39 (100.0%) | 42.0 |
Fertility by Age by Marriage Status in Brookdale
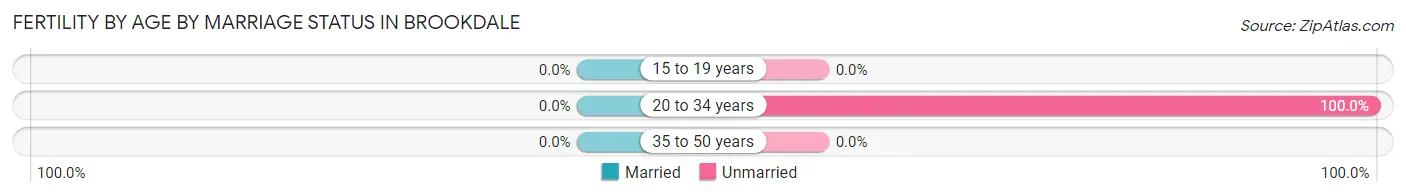
| Age Bracket | Married | Unmarried |
| 15 to 19 years | 0 (0.0%) | 0 (0.0%) |
| 20 to 34 years | 0 (0.0%) | 39 (100.0%) |
| 35 to 50 years | 0 (0.0%) | 0 (0.0%) |
| Total | 0 (0.0%) | 39 (100.0%) |
Fertility by Education in Brookdale
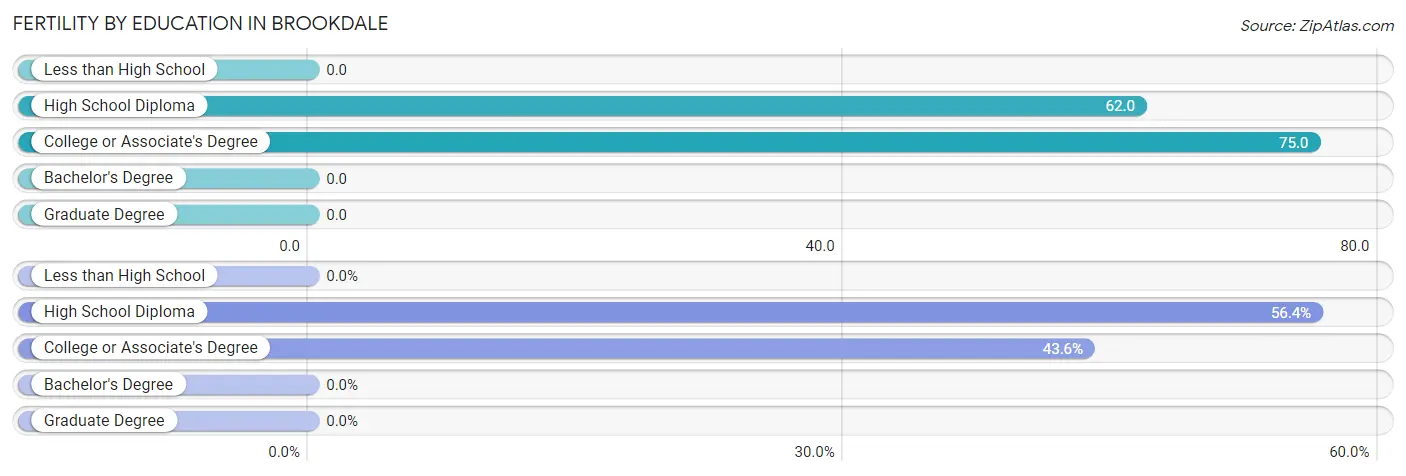
| Educational Attainment | Women with Births | Births / 1,000 Women |
| Less than High School | 0 (0.0%) | 0.0 |
| High School Diploma | 22 (56.4%) | 62.0 |
| College or Associate's Degree | 17 (43.6%) | 75.0 |
| Bachelor's Degree | 0 (0.0%) | 0.0 |
| Graduate Degree | 0 (0.0%) | 0.0 |
| Total | 39 (100.0%) | 42.0 |
Fertility by Education by Marriage Status in Brookdale
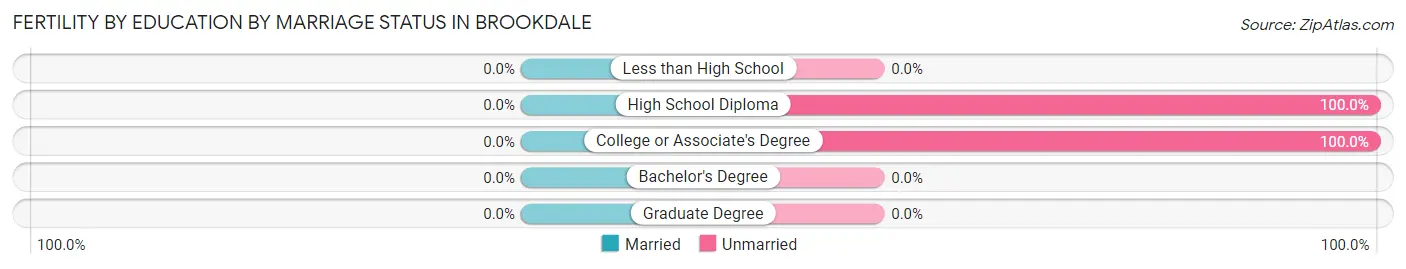
| Educational Attainment | Married | Unmarried |
| Less than High School | 0 (0.0%) | 0 (0.0%) |
| High School Diploma | 0 (0.0%) | 22 (100.0%) |
| College or Associate's Degree | 0 (0.0%) | 17 (100.0%) |
| Bachelor's Degree | 0 (0.0%) | 0 (0.0%) |
| Graduate Degree | 0 (0.0%) | 0 (0.0%) |
| Total | 0 (0.0%) | 39 (100.0%) |
Employment Characteristics in Brookdale
Employment by Class of Employer in Brookdale
Among the 1,459 employed individuals in Brookdale, private company employees (1,194 | 81.8%), self-employed (not incorporated) (96 | 6.6%), and state government employees (70 | 4.8%) make up the most common classes of employment.
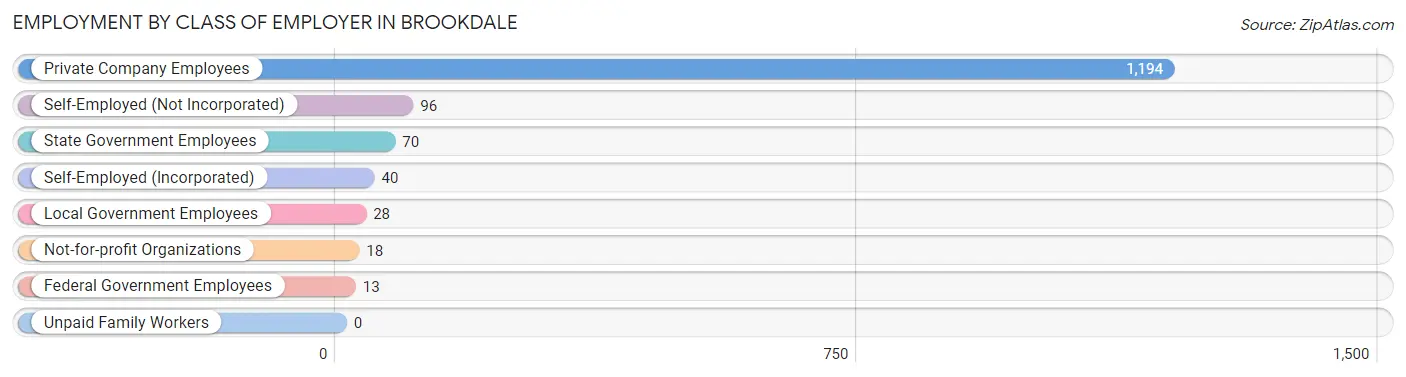
| Employer Class | # Employees | % Employees |
| Private Company Employees | 1,194 | 81.8% |
| Self-Employed (Incorporated) | 40 | 2.7% |
| Self-Employed (Not Incorporated) | 96 | 6.6% |
| Not-for-profit Organizations | 18 | 1.2% |
| Local Government Employees | 28 | 1.9% |
| State Government Employees | 70 | 4.8% |
| Federal Government Employees | 13 | 0.9% |
| Unpaid Family Workers | 0 | 0.0% |
| Total | 1,459 | 100.0% |
Employment Status by Age in Brookdale
According to the labor force statistics for Brookdale, out of the total population over 16 years of age (3,518), 48.9% or 1,720 individuals are in the labor force, with 12.8% or 220 of them unemployed. The age group with the highest labor force participation rate is 25 to 29 years, with 80.7% or 343 individuals in the labor force. Within the labor force, the 30 to 34 years age range has the highest percentage of unemployed individuals, with 40.0% or 126 of them being unemployed.
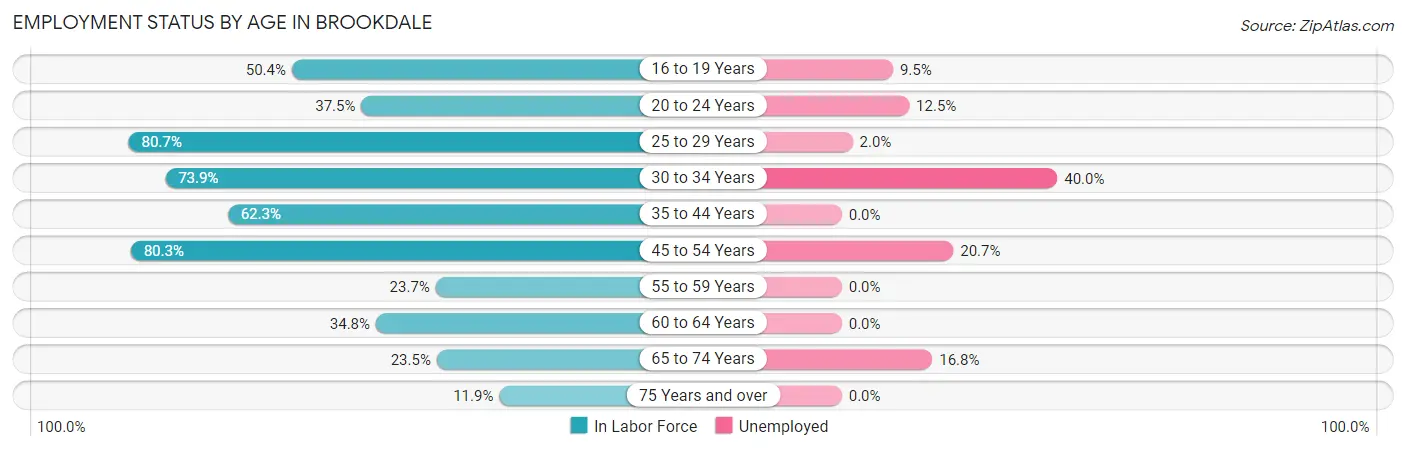
| Age Bracket | In Labor Force | Unemployed |
| 16 to 19 Years | 126 (50.4%) | 12 (9.5%) |
| 20 to 24 Years | 96 (37.5%) | 12 (12.5%) |
| 25 to 29 Years | 343 (80.7%) | 7 (2.0%) |
| 30 to 34 Years | 315 (73.9%) | 126 (40.0%) |
| 35 to 44 Years | 296 (62.3%) | 0 (0.0%) |
| 45 to 54 Years | 208 (80.3%) | 43 (20.7%) |
| 55 to 59 Years | 62 (23.7%) | 0 (0.0%) |
| 60 to 64 Years | 115 (34.8%) | 0 (0.0%) |
| 65 to 74 Years | 119 (23.5%) | 20 (16.8%) |
| 75 Years and over | 39 (11.9%) | 0 (0.0%) |
| Total | 1,720 (48.9%) | 220 (12.8%) |
Employment Status by Educational Attainment in Brookdale
According to labor force statistics for Brookdale, 61.5% of individuals (1,339) out of the total population between 25 and 64 years of age (2,177) are in the labor force, with 13.1% or 175 of them being unemployed. The group with the highest labor force participation rate are those with the educational attainment of college / associate degree, with 77.7% or 412 individuals in the labor force. Within the labor force, individuals with less than high school education have the highest percentage of unemployment, with 60.6% or 126 of them being unemployed.
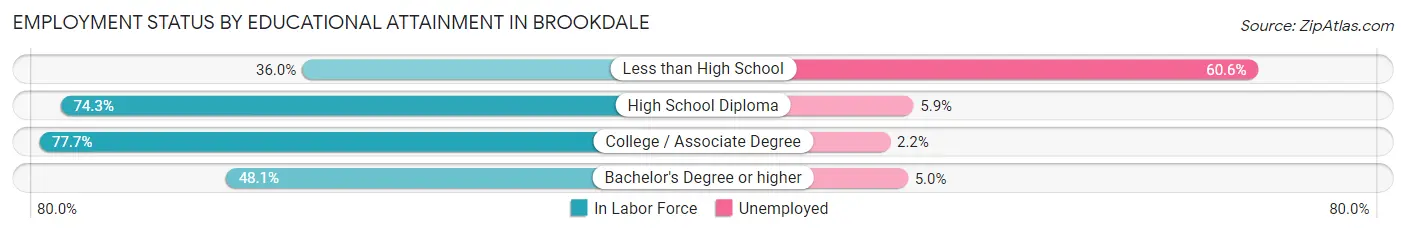
| Educational Attainment | In Labor Force | Unemployed |
| Less than High School | 208 (36.0%) | 350 (60.6%) |
| High School Diploma | 580 (74.3%) | 46 (5.9%) |
| College / Associate Degree | 412 (77.7%) | 12 (2.2%) |
| Bachelor's Degree or higher | 139 (48.1%) | 14 (5.0%) |
| Total | 1,339 (61.5%) | 285 (13.1%) |
Employment Occupations by Sex in Brookdale
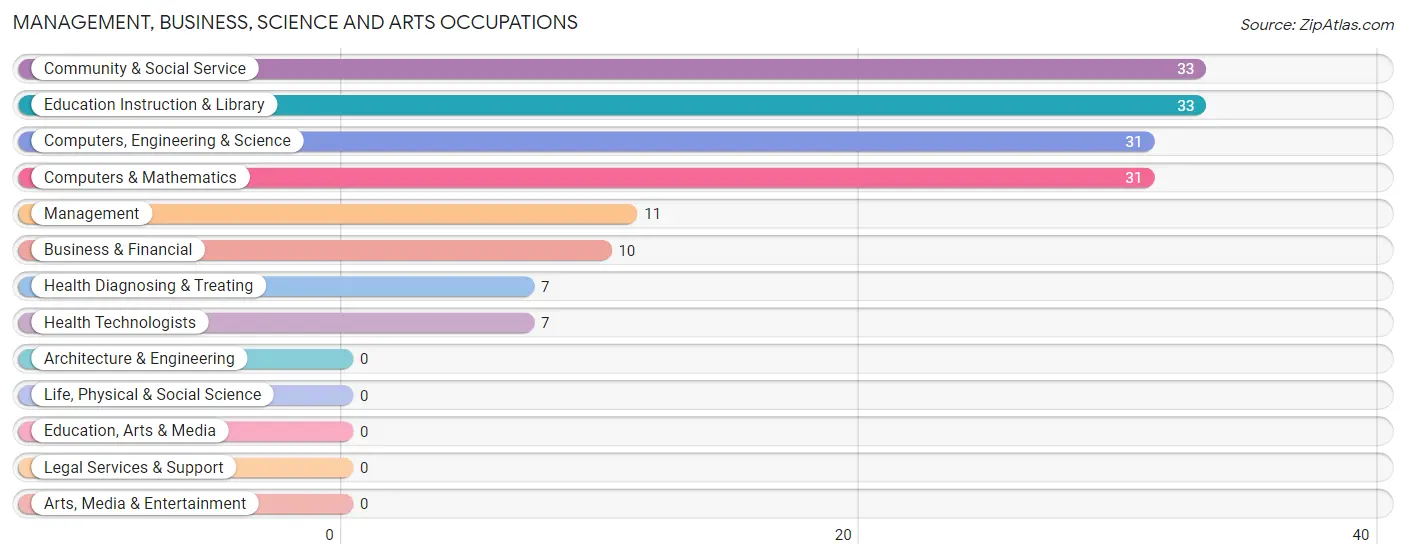
Management, Business, Science and Arts Occupations
The most common Management, Business, Science and Arts occupations in Brookdale are Community & Social Service (33 | 2.2%), Education Instruction & Library (33 | 2.2%), Computers, Engineering & Science (31 | 2.1%), Computers & Mathematics (31 | 2.1%), and Management (11 | 0.7%).
Management, Business, Science and Arts Occupations by Sex
Within the Management, Business, Science and Arts occupations in Brookdale, the most male-oriented occupations are Computers, Engineering & Science (100.0%), Computers & Mathematics (100.0%), and Management (27.3%), while the most female-oriented occupations are Business & Financial (100.0%), Health Diagnosing & Treating (100.0%), and Health Technologists (100.0%).
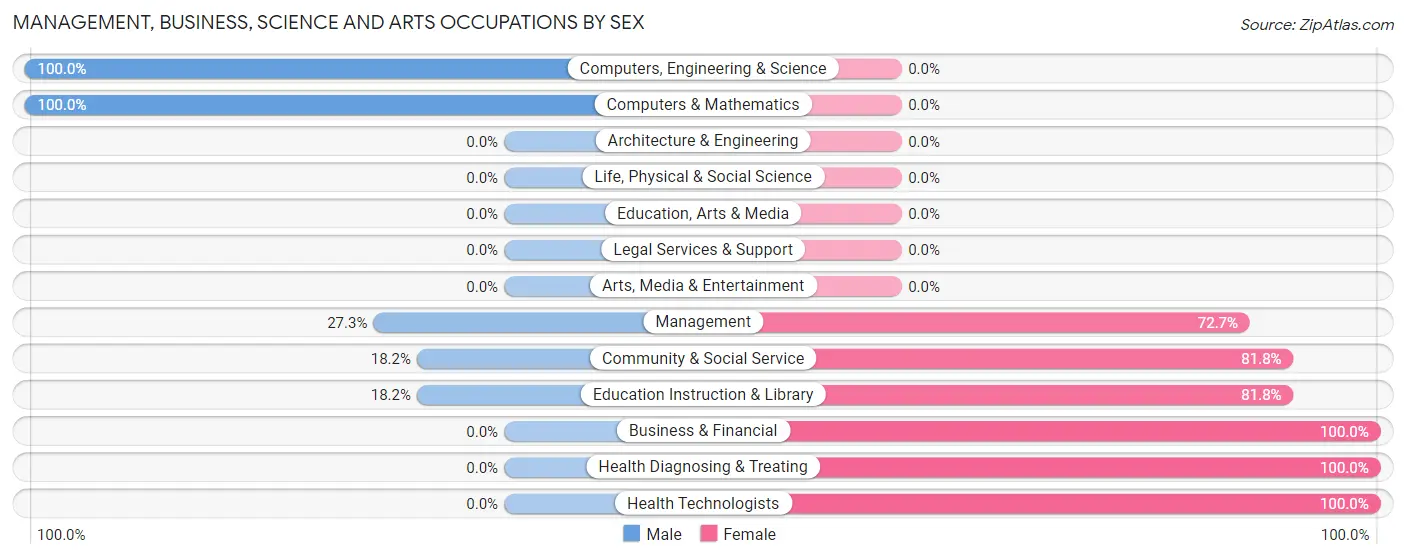
| Occupation | Male | Female |
| Management | 3 (27.3%) | 8 (72.7%) |
| Business & Financial | 0 (0.0%) | 10 (100.0%) |
| Computers, Engineering & Science | 31 (100.0%) | 0 (0.0%) |
| Computers & Mathematics | 31 (100.0%) | 0 (0.0%) |
| Architecture & Engineering | 0 (0.0%) | 0 (0.0%) |
| Life, Physical & Social Science | 0 (0.0%) | 0 (0.0%) |
| Community & Social Service | 6 (18.2%) | 27 (81.8%) |
| Education, Arts & Media | 0 (0.0%) | 0 (0.0%) |
| Legal Services & Support | 0 (0.0%) | 0 (0.0%) |
| Education Instruction & Library | 6 (18.2%) | 27 (81.8%) |
| Arts, Media & Entertainment | 0 (0.0%) | 0 (0.0%) |
| Health Diagnosing & Treating | 0 (0.0%) | 7 (100.0%) |
| Health Technologists | 0 (0.0%) | 7 (100.0%) |
| Total (Category) | 40 (43.5%) | 52 (56.5%) |
| Total (Overall) | 838 (55.9%) | 661 (44.1%) |
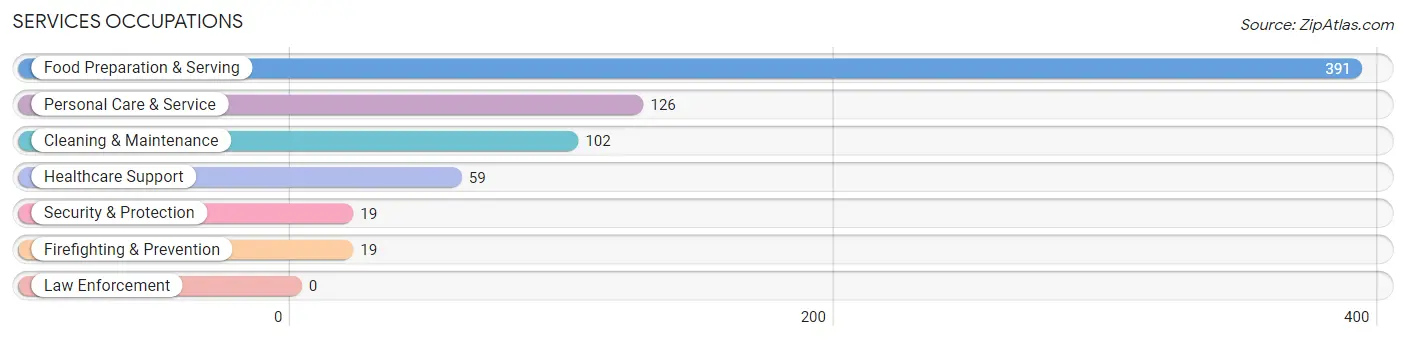
Services Occupations
The most common Services occupations in Brookdale are Food Preparation & Serving (391 | 26.1%), Personal Care & Service (126 | 8.4%), Cleaning & Maintenance (102 | 6.8%), Healthcare Support (59 | 3.9%), and Security & Protection (19 | 1.3%).
Services Occupations by Sex
Within the Services occupations in Brookdale, the most male-oriented occupations are Food Preparation & Serving (78.5%), Cleaning & Maintenance (66.7%), and Personal Care & Service (11.9%), while the most female-oriented occupations are Healthcare Support (100.0%), Security & Protection (100.0%), and Firefighting & Prevention (100.0%).
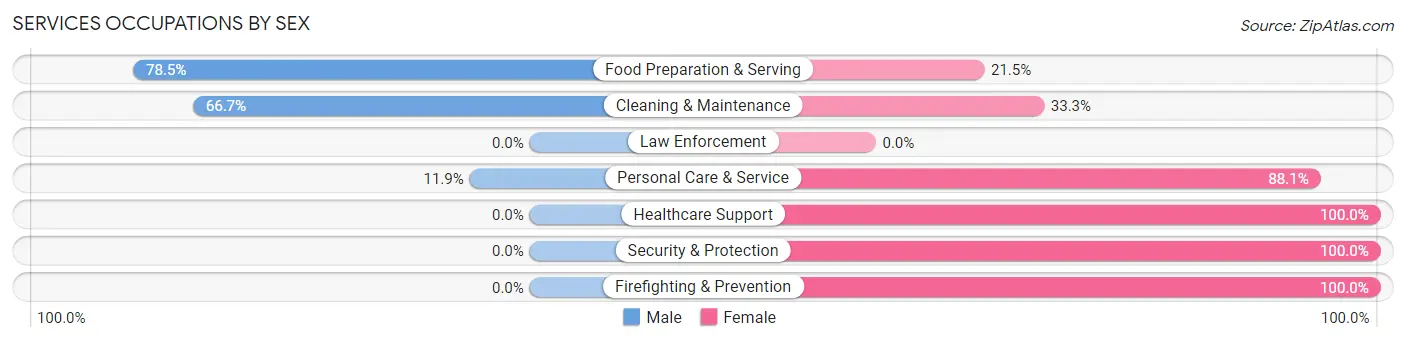
| Occupation | Male | Female |
| Healthcare Support | 0 (0.0%) | 59 (100.0%) |
| Security & Protection | 0 (0.0%) | 19 (100.0%) |
| Firefighting & Prevention | 0 (0.0%) | 19 (100.0%) |
| Law Enforcement | 0 (0.0%) | 0 (0.0%) |
| Food Preparation & Serving | 307 (78.5%) | 84 (21.5%) |
| Cleaning & Maintenance | 68 (66.7%) | 34 (33.3%) |
| Personal Care & Service | 15 (11.9%) | 111 (88.1%) |
| Total (Category) | 390 (55.9%) | 307 (44.1%) |
| Total (Overall) | 838 (55.9%) | 661 (44.1%) |
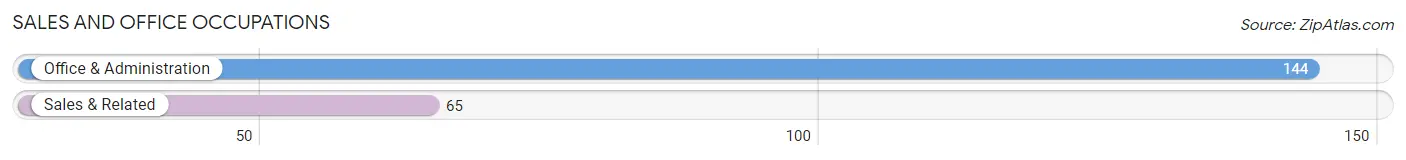
Sales and Office Occupations
The most common Sales and Office occupations in Brookdale are Office & Administration (144 | 9.6%), and Sales & Related (65 | 4.3%).
Sales and Office Occupations by Sex
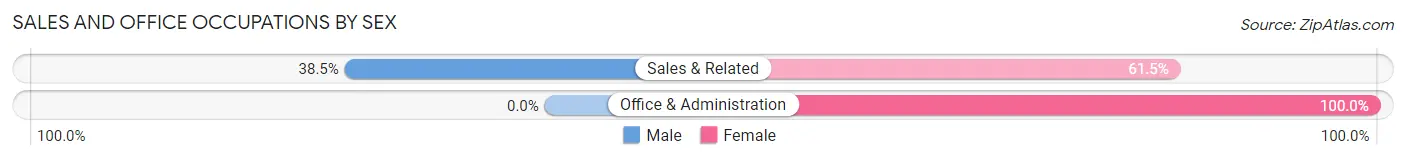
| Occupation | Male | Female |
| Sales & Related | 25 (38.5%) | 40 (61.5%) |
| Office & Administration | 0 (0.0%) | 144 (100.0%) |
| Total (Category) | 25 (12.0%) | 184 (88.0%) |
| Total (Overall) | 838 (55.9%) | 661 (44.1%) |
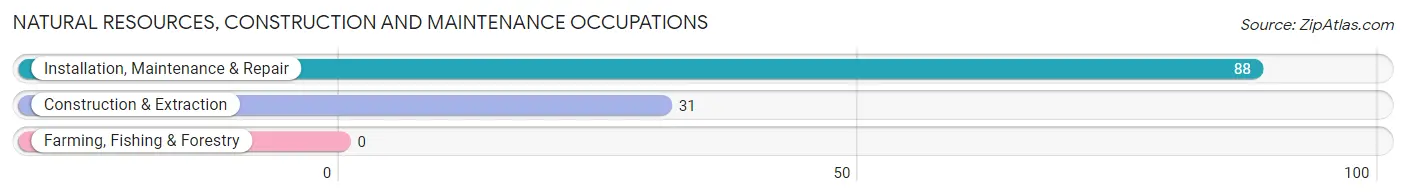
Natural Resources, Construction and Maintenance Occupations
The most common Natural Resources, Construction and Maintenance occupations in Brookdale are Installation, Maintenance & Repair (88 | 5.9%), and Construction & Extraction (31 | 2.1%).
Natural Resources, Construction and Maintenance Occupations by Sex
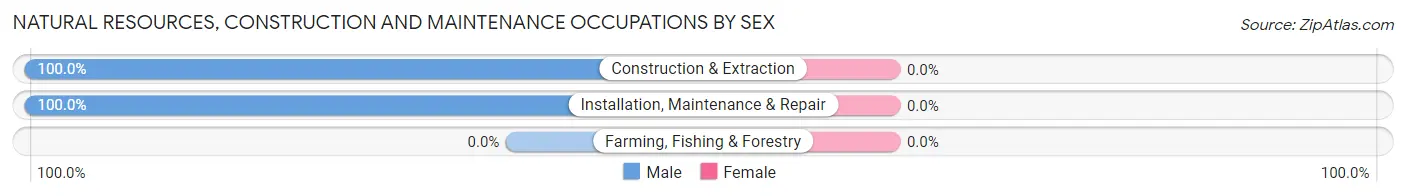
| Occupation | Male | Female |
| Farming, Fishing & Forestry | 0 (0.0%) | 0 (0.0%) |
| Construction & Extraction | 31 (100.0%) | 0 (0.0%) |
| Installation, Maintenance & Repair | 88 (100.0%) | 0 (0.0%) |
| Total (Category) | 119 (100.0%) | 0 (0.0%) |
| Total (Overall) | 838 (55.9%) | 661 (44.1%) |
Production, Transportation and Moving Occupations
The most common Production, Transportation and Moving occupations in Brookdale are Production (226 | 15.1%), Transportation (85 | 5.7%), and Material Moving (71 | 4.7%).
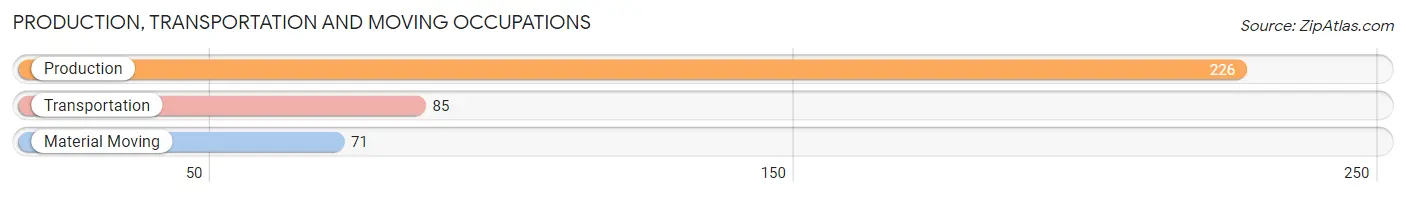
Production, Transportation and Moving Occupations by Sex
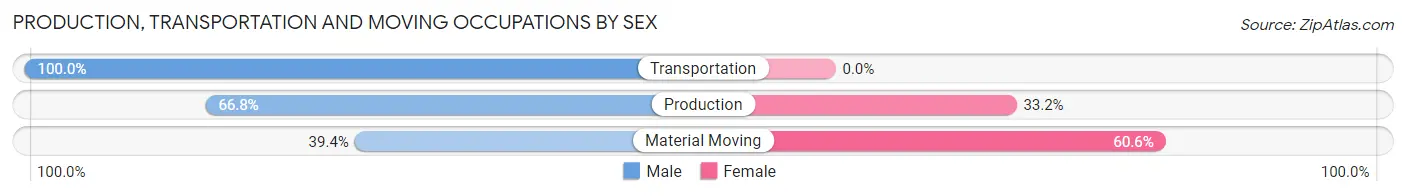
| Occupation | Male | Female |
| Production | 151 (66.8%) | 75 (33.2%) |
| Transportation | 85 (100.0%) | 0 (0.0%) |
| Material Moving | 28 (39.4%) | 43 (60.6%) |
| Total (Category) | 264 (69.1%) | 118 (30.9%) |
| Total (Overall) | 838 (55.9%) | 661 (44.1%) |
Employment Industries by Sex in Brookdale
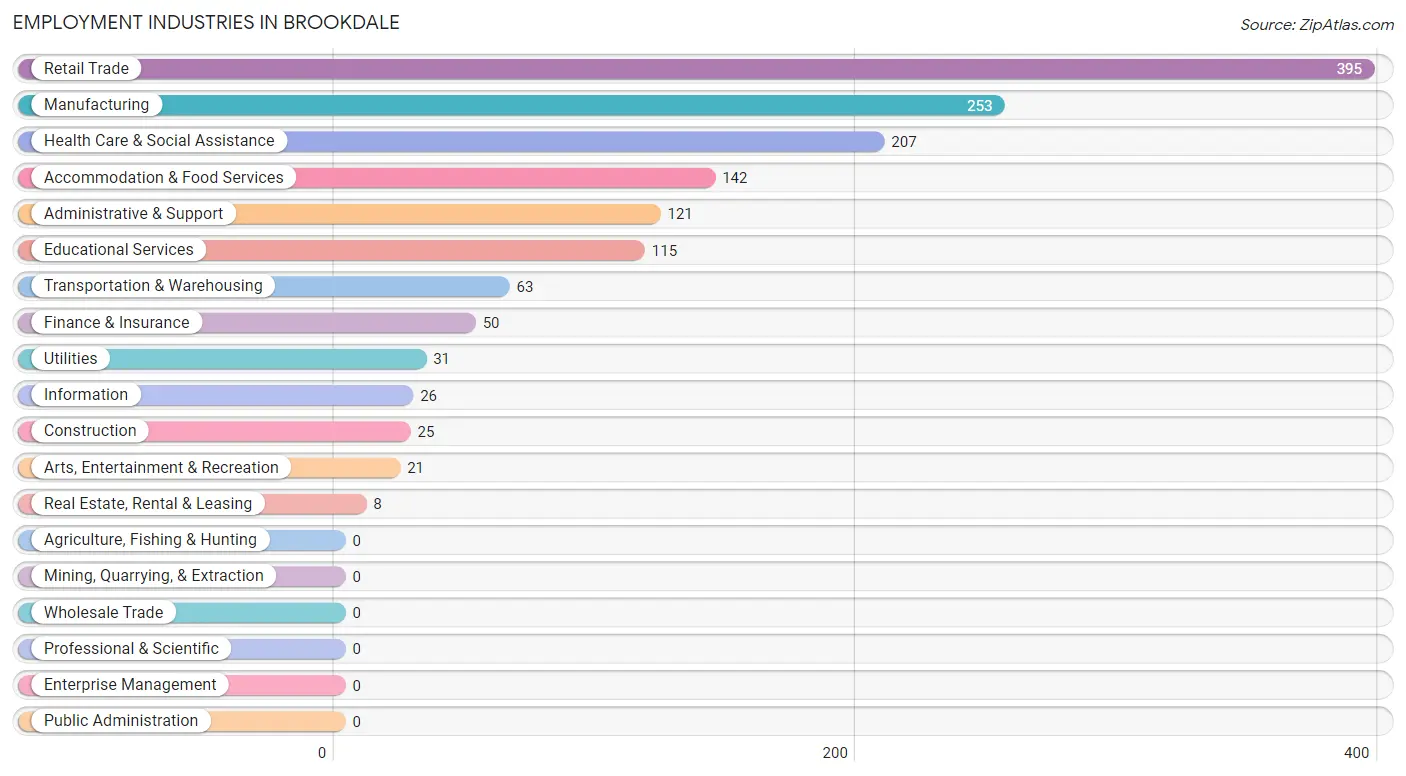
Employment Industries in Brookdale
The major employment industries in Brookdale include Retail Trade (395 | 26.4%), Manufacturing (253 | 16.9%), Health Care & Social Assistance (207 | 13.8%), Accommodation & Food Services (142 | 9.5%), and Administrative & Support (121 | 8.1%).
Employment Industries by Sex in Brookdale
The Brookdale industries that see more men than women are Construction (100.0%), Utilities (100.0%), and Information (100.0%), whereas the industries that tend to have a higher number of women are Real Estate, Rental & Leasing (100.0%), Health Care & Social Assistance (100.0%), and Educational Services (87.8%).
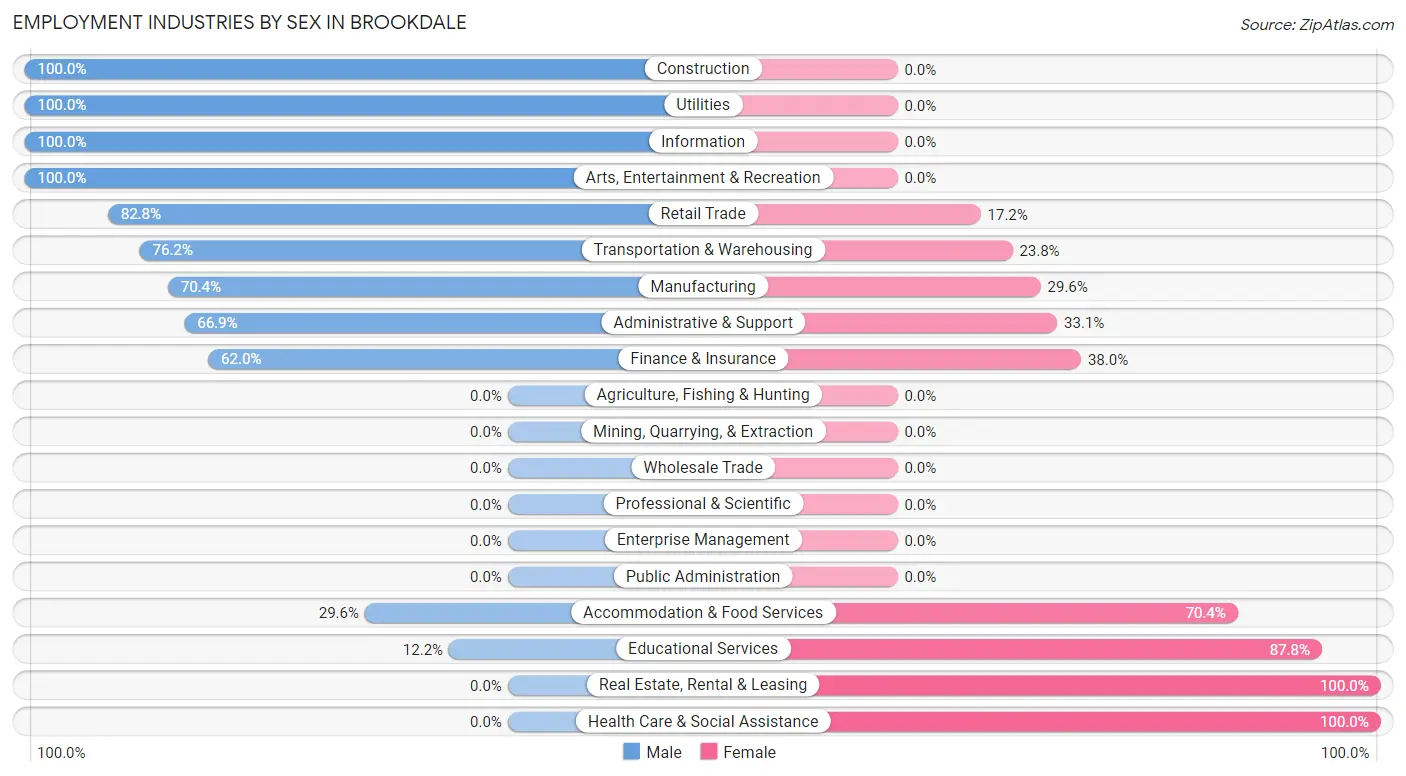
| Industry | Male | Female |
| Agriculture, Fishing & Hunting | 0 (0.0%) | 0 (0.0%) |
| Mining, Quarrying, & Extraction | 0 (0.0%) | 0 (0.0%) |
| Construction | 25 (100.0%) | 0 (0.0%) |
| Manufacturing | 178 (70.4%) | 75 (29.6%) |
| Wholesale Trade | 0 (0.0%) | 0 (0.0%) |
| Retail Trade | 327 (82.8%) | 68 (17.2%) |
| Transportation & Warehousing | 48 (76.2%) | 15 (23.8%) |
| Utilities | 31 (100.0%) | 0 (0.0%) |
| Information | 26 (100.0%) | 0 (0.0%) |
| Finance & Insurance | 31 (62.0%) | 19 (38.0%) |
| Real Estate, Rental & Leasing | 0 (0.0%) | 8 (100.0%) |
| Professional & Scientific | 0 (0.0%) | 0 (0.0%) |
| Enterprise Management | 0 (0.0%) | 0 (0.0%) |
| Administrative & Support | 81 (66.9%) | 40 (33.1%) |
| Educational Services | 14 (12.2%) | 101 (87.8%) |
| Health Care & Social Assistance | 0 (0.0%) | 207 (100.0%) |
| Arts, Entertainment & Recreation | 21 (100.0%) | 0 (0.0%) |
| Accommodation & Food Services | 42 (29.6%) | 100 (70.4%) |
| Public Administration | 0 (0.0%) | 0 (0.0%) |
| Total | 838 (55.9%) | 661 (44.1%) |
Education in Brookdale
School Enrollment in Brookdale
The most common levels of schooling among the 879 students in Brookdale are high school (278 | 31.6%), college / undergraduate (272 | 30.9%), and elementary school (169 | 19.2%).
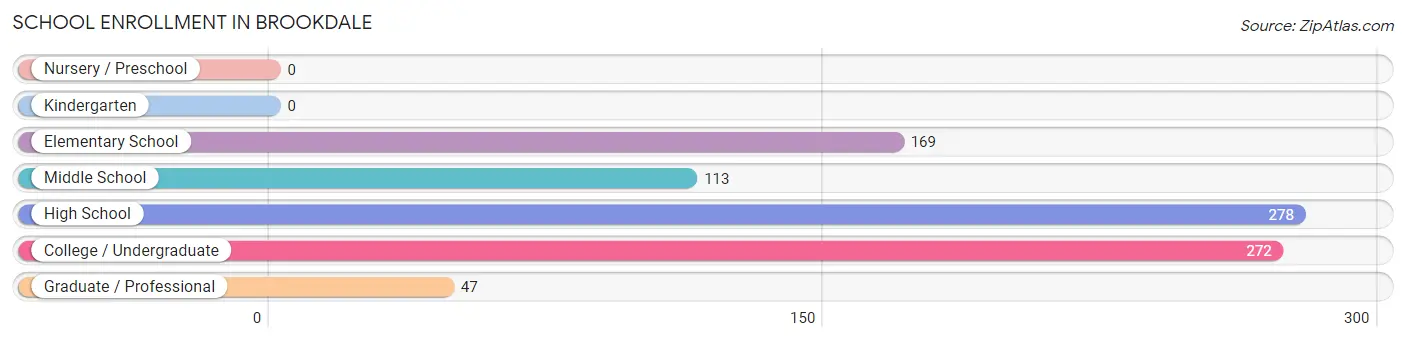
| School Level | # Students | % Students |
| Nursery / Preschool | 0 | 0.0% |
| Kindergarten | 0 | 0.0% |
| Elementary School | 169 | 19.2% |
| Middle School | 113 | 12.9% |
| High School | 278 | 31.6% |
| College / Undergraduate | 272 | 30.9% |
| Graduate / Professional | 47 | 5.3% |
| Total | 879 | 100.0% |
School Enrollment by Age by Funding Source in Brookdale
Out of a total of 879 students who are enrolled in schools in Brookdale, 163 (18.5%) attend a private institution, while the remaining 716 (81.5%) are enrolled in public schools. The age group of 20 to 24 year olds has the highest likelihood of being enrolled in private schools, with 57 (41.6% in the age bracket) enrolled. Conversely, the age group of 10 to 14 year olds has the lowest likelihood of being enrolled in a private school, with 90 (100.0% in the age bracket) attending a public institution.
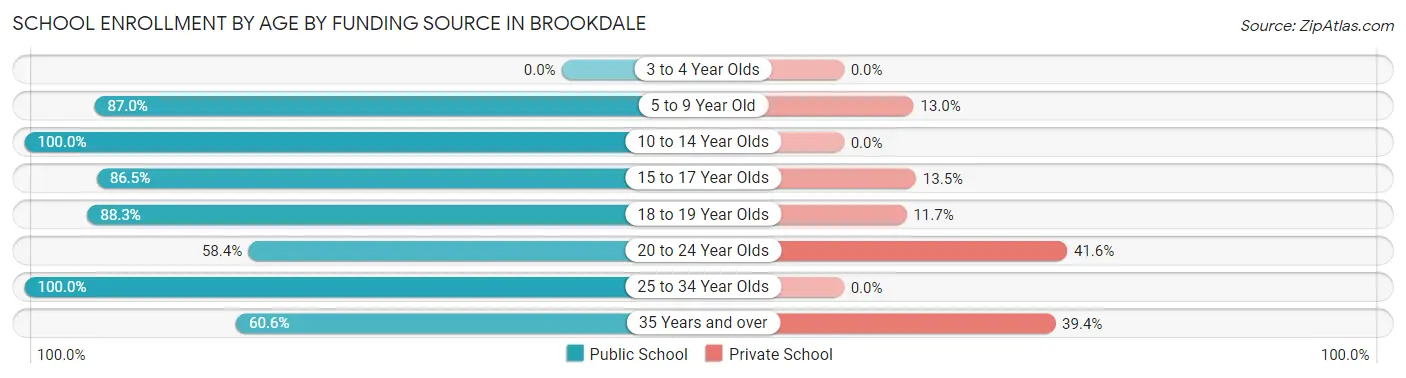
| Age Bracket | Public School | Private School |
| 3 to 4 Year Olds | 0 (0.0%) | 0 (0.0%) |
| 5 to 9 Year Old | 147 (87.0%) | 22 (13.0%) |
| 10 to 14 Year Olds | 90 (100.0%) | 0 (0.0%) |
| 15 to 17 Year Olds | 135 (86.5%) | 21 (13.5%) |
| 18 to 19 Year Olds | 83 (88.3%) | 11 (11.7%) |
| 20 to 24 Year Olds | 80 (58.4%) | 57 (41.6%) |
| 25 to 34 Year Olds | 101 (100.0%) | 0 (0.0%) |
| 35 Years and over | 80 (60.6%) | 52 (39.4%) |
| Total | 716 (81.5%) | 163 (18.5%) |
Educational Attainment by Field of Study in Brookdale
Business (87 | 19.6%), arts & humanities (76 | 17.2%), science & technology (65 | 14.7%), education (51 | 11.5%), and communications (38 | 8.6%) are the most common fields of study among 443 individuals in Brookdale who have obtained a bachelor's degree or higher.
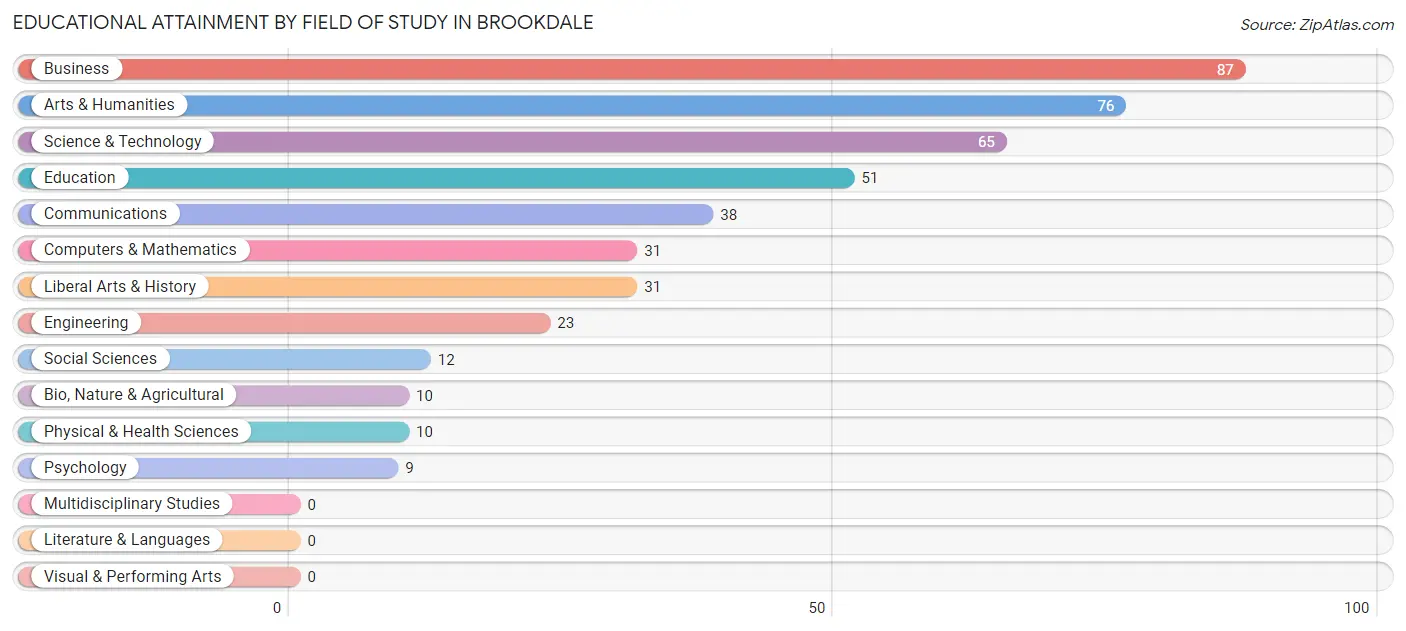
| Field of Study | # Graduates | % Graduates |
| Computers & Mathematics | 31 | 7.0% |
| Bio, Nature & Agricultural | 10 | 2.3% |
| Physical & Health Sciences | 10 | 2.3% |
| Psychology | 9 | 2.0% |
| Social Sciences | 12 | 2.7% |
| Engineering | 23 | 5.2% |
| Multidisciplinary Studies | 0 | 0.0% |
| Science & Technology | 65 | 14.7% |
| Business | 87 | 19.6% |
| Education | 51 | 11.5% |
| Literature & Languages | 0 | 0.0% |
| Liberal Arts & History | 31 | 7.0% |
| Visual & Performing Arts | 0 | 0.0% |
| Communications | 38 | 8.6% |
| Arts & Humanities | 76 | 17.2% |
| Total | 443 | 100.0% |
Transportation & Commute in Brookdale
Vehicle Availability by Sex in Brookdale
The most prevalent vehicle ownership categories in Brookdale are males with 2 vehicles (463, accounting for 57.4%) and females with 2 vehicles (159, making up 75.5%).
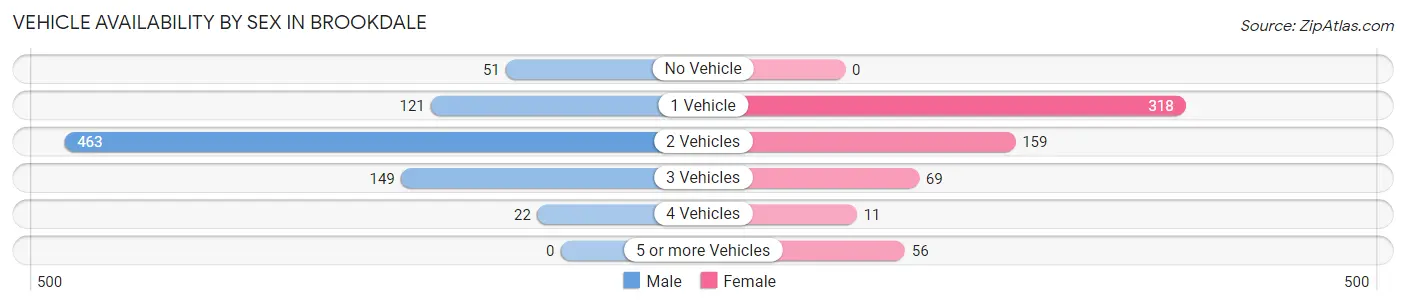
| Vehicles Available | Male | Female |
| No Vehicle | 51 (6.3%) | 0 (0.0%) |
| 1 Vehicle | 121 (15.0%) | 318 (51.9%) |
| 2 Vehicles | 463 (57.4%) | 159 (25.9%) |
| 3 Vehicles | 149 (18.5%) | 69 (11.3%) |
| 4 Vehicles | 22 (2.7%) | 11 (1.8%) |
| 5 or more Vehicles | 0 (0.0%) | 56 (9.1%) |
| Total | 806 (100.0%) | 613 (100.0%) |
Commute Time in Brookdale
The most frequently occuring commute durations in Brookdale are 10 to 14 minutes (296 commuters, 22.1%), 25 to 29 minutes (266 commuters, 19.9%), and 5 to 9 minutes (200 commuters, 14.9%).
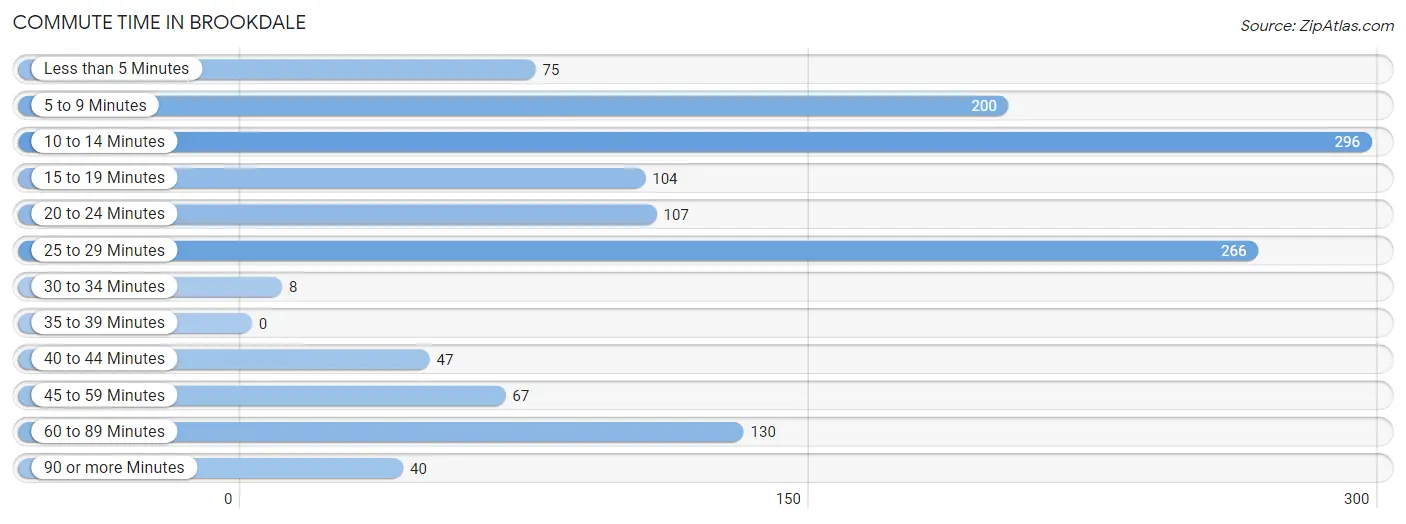
| Commute Time | # Commuters | % Commuters |
| Less than 5 Minutes | 75 | 5.6% |
| 5 to 9 Minutes | 200 | 14.9% |
| 10 to 14 Minutes | 296 | 22.1% |
| 15 to 19 Minutes | 104 | 7.8% |
| 20 to 24 Minutes | 107 | 8.0% |
| 25 to 29 Minutes | 266 | 19.9% |
| 30 to 34 Minutes | 8 | 0.6% |
| 35 to 39 Minutes | 0 | 0.0% |
| 40 to 44 Minutes | 47 | 3.5% |
| 45 to 59 Minutes | 67 | 5.0% |
| 60 to 89 Minutes | 130 | 9.7% |
| 90 or more Minutes | 40 | 3.0% |
Commute Time by Sex in Brookdale
The most common commute times in Brookdale are 25 to 29 minutes (266 commuters, 33.7%) for males and 10 to 14 minutes (197 commuters, 35.7%) for females.
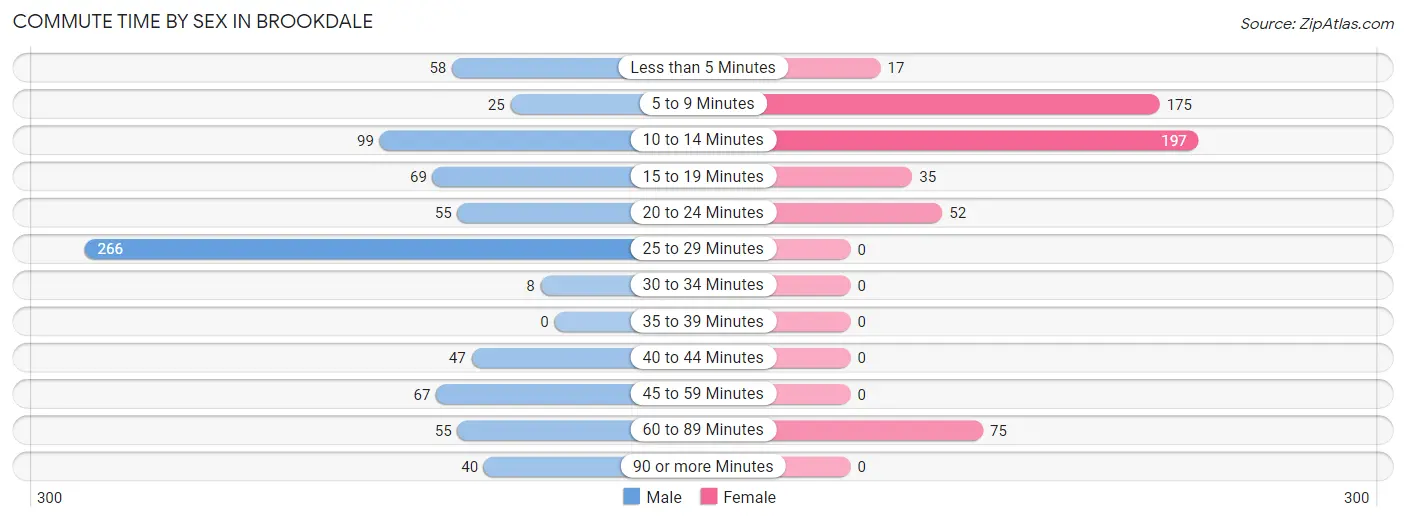
| Commute Time | Male | Female |
| Less than 5 Minutes | 58 (7.3%) | 17 (3.1%) |
| 5 to 9 Minutes | 25 (3.2%) | 175 (31.8%) |
| 10 to 14 Minutes | 99 (12.6%) | 197 (35.7%) |
| 15 to 19 Minutes | 69 (8.7%) | 35 (6.4%) |
| 20 to 24 Minutes | 55 (7.0%) | 52 (9.4%) |
| 25 to 29 Minutes | 266 (33.7%) | 0 (0.0%) |
| 30 to 34 Minutes | 8 (1.0%) | 0 (0.0%) |
| 35 to 39 Minutes | 0 (0.0%) | 0 (0.0%) |
| 40 to 44 Minutes | 47 (6.0%) | 0 (0.0%) |
| 45 to 59 Minutes | 67 (8.5%) | 0 (0.0%) |
| 60 to 89 Minutes | 55 (7.0%) | 75 (13.6%) |
| 90 or more Minutes | 40 (5.1%) | 0 (0.0%) |
Time of Departure to Work by Sex in Brookdale
The most frequent times of departure to work in Brookdale are 12:00 PM to 3:59 PM (278, 35.2%) for males and 12:00 PM to 3:59 PM (119, 21.6%) for females.
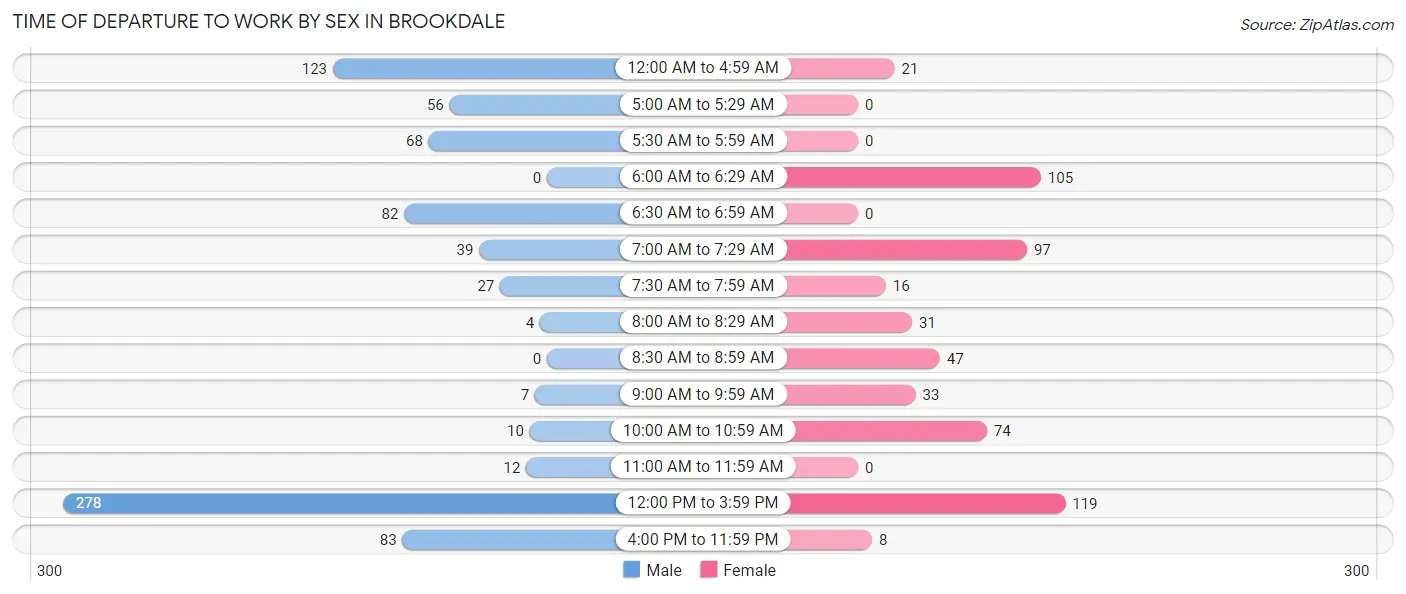
| Time of Departure | Male | Female |
| 12:00 AM to 4:59 AM | 123 (15.6%) | 21 (3.8%) |
| 5:00 AM to 5:29 AM | 56 (7.1%) | 0 (0.0%) |
| 5:30 AM to 5:59 AM | 68 (8.6%) | 0 (0.0%) |
| 6:00 AM to 6:29 AM | 0 (0.0%) | 105 (19.1%) |
| 6:30 AM to 6:59 AM | 82 (10.4%) | 0 (0.0%) |
| 7:00 AM to 7:29 AM | 39 (4.9%) | 97 (17.6%) |
| 7:30 AM to 7:59 AM | 27 (3.4%) | 16 (2.9%) |
| 8:00 AM to 8:29 AM | 4 (0.5%) | 31 (5.6%) |
| 8:30 AM to 8:59 AM | 0 (0.0%) | 47 (8.5%) |
| 9:00 AM to 9:59 AM | 7 (0.9%) | 33 (6.0%) |
| 10:00 AM to 10:59 AM | 10 (1.3%) | 74 (13.4%) |
| 11:00 AM to 11:59 AM | 12 (1.5%) | 0 (0.0%) |
| 12:00 PM to 3:59 PM | 278 (35.2%) | 119 (21.6%) |
| 4:00 PM to 11:59 PM | 83 (10.5%) | 8 (1.5%) |
| Total | 789 (100.0%) | 551 (100.0%) |
Housing Occupancy in Brookdale
Occupancy by Ownership in Brookdale
Of the total 1,601 dwellings in Brookdale, owner-occupied units account for 759 (47.4%), while renter-occupied units make up 842 (52.6%).
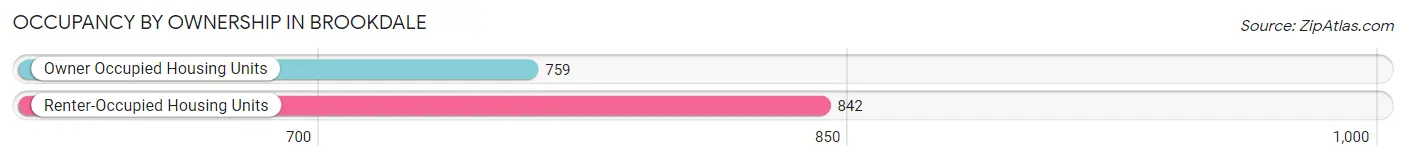
| Occupancy | # Housing Units | % Housing Units |
| Owner Occupied Housing Units | 759 | 47.4% |
| Renter-Occupied Housing Units | 842 | 52.6% |
| Total Occupied Housing Units | 1,601 | 100.0% |
Occupancy by Household Size in Brookdale
| Household Size | # Housing Units | % Housing Units |
| 1-Person Household | 636 | 39.7% |
| 2-Person Household | 438 | 27.4% |
| 3-Person Household | 282 | 17.6% |
| 4+ Person Household | 245 | 15.3% |
| Total Housing Units | 1,601 | 100.0% |
Occupancy by Ownership by Household Size in Brookdale
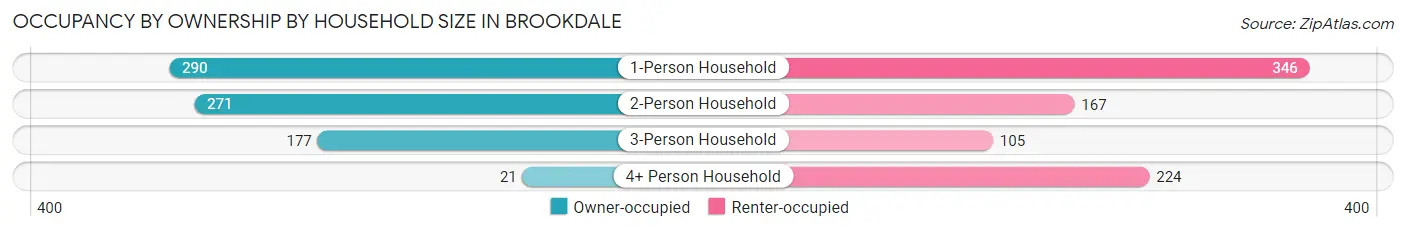
| Household Size | Owner-occupied | Renter-occupied |
| 1-Person Household | 290 (45.6%) | 346 (54.4%) |
| 2-Person Household | 271 (61.9%) | 167 (38.1%) |
| 3-Person Household | 177 (62.8%) | 105 (37.2%) |
| 4+ Person Household | 21 (8.6%) | 224 (91.4%) |
| Total Housing Units | 759 (47.4%) | 842 (52.6%) |
Occupancy by Educational Attainment in Brookdale
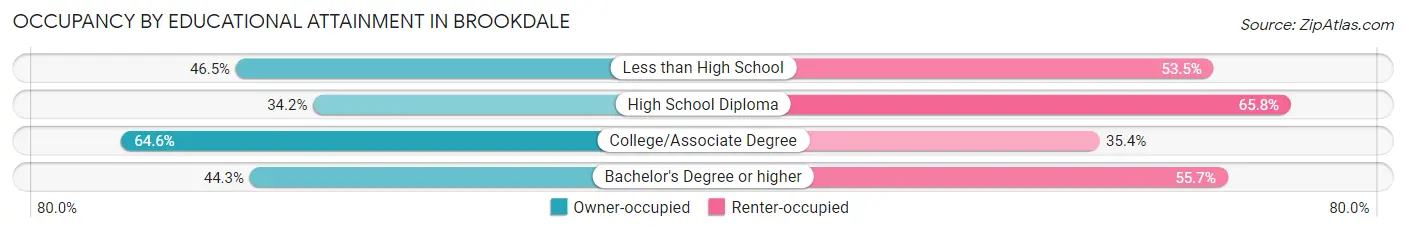
| Household Size | Owner-occupied | Renter-occupied |
| Less than High School | 185 (46.5%) | 213 (53.5%) |
| High School Diploma | 167 (34.2%) | 321 (65.8%) |
| College/Associate Degree | 287 (64.6%) | 157 (35.4%) |
| Bachelor's Degree or higher | 120 (44.3%) | 151 (55.7%) |
Occupancy by Age of Householder in Brookdale
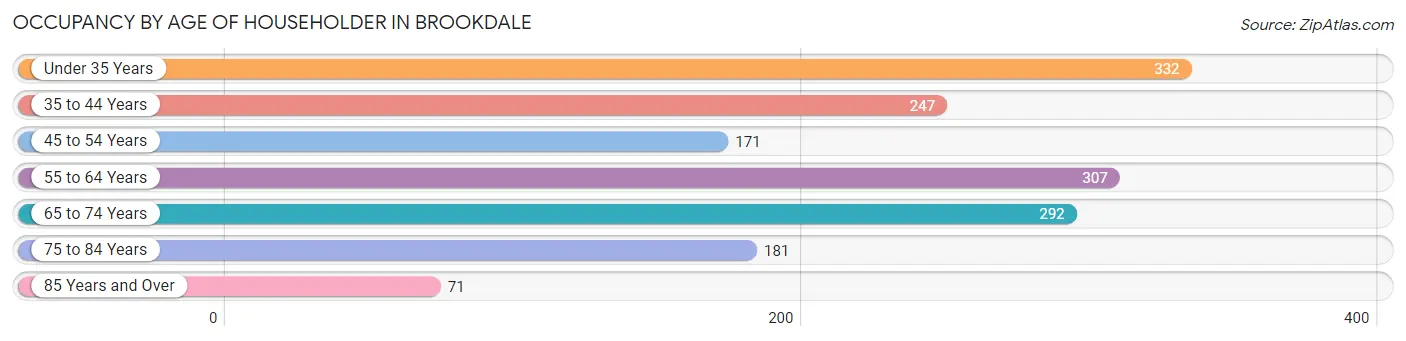
| Age Bracket | # Households | % Households |
| Under 35 Years | 332 | 20.7% |
| 35 to 44 Years | 247 | 15.4% |
| 45 to 54 Years | 171 | 10.7% |
| 55 to 64 Years | 307 | 19.2% |
| 65 to 74 Years | 292 | 18.2% |
| 75 to 84 Years | 181 | 11.3% |
| 85 Years and Over | 71 | 4.4% |
| Total | 1,601 | 100.0% |
Housing Finances in Brookdale
Median Income by Occupancy in Brookdale
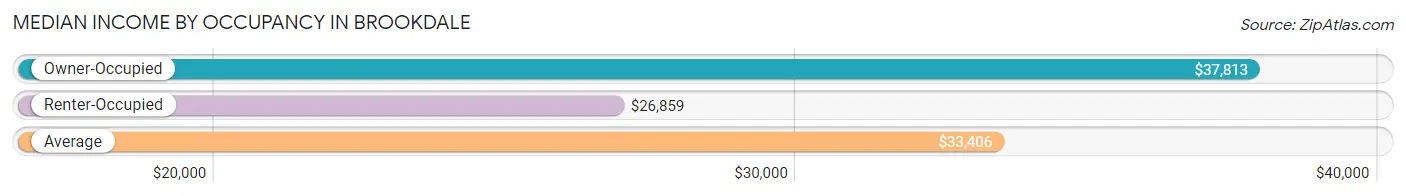
| Occupancy Type | # Households | Median Income |
| Owner-Occupied | 759 (47.4%) | $37,813 |
| Renter-Occupied | 842 (52.6%) | $26,859 |
| Average | 1,601 (100.0%) | $33,406 |
Occupancy by Householder Income Bracket in Brookdale
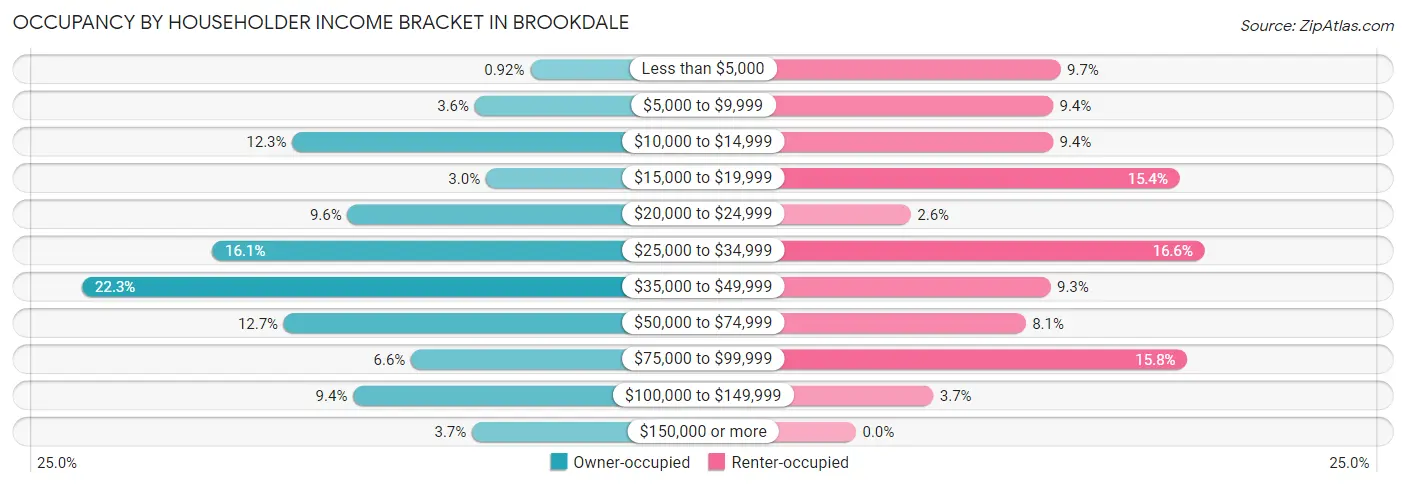
| Income Bracket | Owner-occupied | Renter-occupied |
| Less than $5,000 | 7 (0.9%) | 82 (9.7%) |
| $5,000 to $9,999 | 27 (3.6%) | 79 (9.4%) |
| $10,000 to $14,999 | 93 (12.2%) | 79 (9.4%) |
| $15,000 to $19,999 | 23 (3.0%) | 130 (15.4%) |
| $20,000 to $24,999 | 73 (9.6%) | 22 (2.6%) |
| $25,000 to $34,999 | 122 (16.1%) | 140 (16.6%) |
| $35,000 to $49,999 | 169 (22.3%) | 78 (9.3%) |
| $50,000 to $74,999 | 96 (12.7%) | 68 (8.1%) |
| $75,000 to $99,999 | 50 (6.6%) | 133 (15.8%) |
| $100,000 to $149,999 | 71 (9.3%) | 31 (3.7%) |
| $150,000 or more | 28 (3.7%) | 0 (0.0%) |
| Total | 759 (100.0%) | 842 (100.0%) |
Monthly Housing Cost Tiers in Brookdale
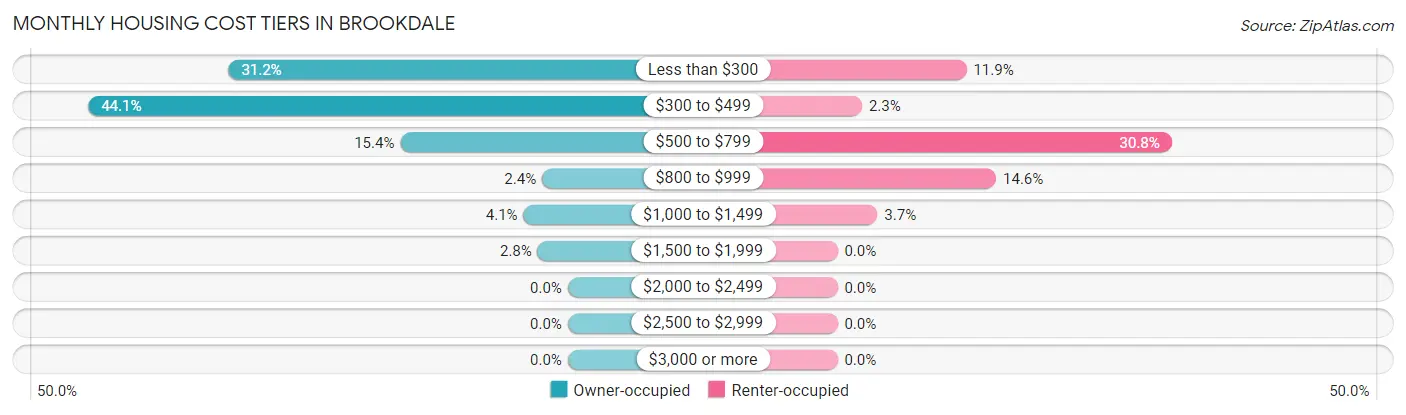
| Monthly Cost | Owner-occupied | Renter-occupied |
| Less than $300 | 237 (31.2%) | 100 (11.9%) |
| $300 to $499 | 335 (44.1%) | 19 (2.3%) |
| $500 to $799 | 117 (15.4%) | 259 (30.8%) |
| $800 to $999 | 18 (2.4%) | 123 (14.6%) |
| $1,000 to $1,499 | 31 (4.1%) | 31 (3.7%) |
| $1,500 to $1,999 | 21 (2.8%) | 0 (0.0%) |
| $2,000 to $2,499 | 0 (0.0%) | 0 (0.0%) |
| $2,500 to $2,999 | 0 (0.0%) | 0 (0.0%) |
| $3,000 or more | 0 (0.0%) | 0 (0.0%) |
| Total | 759 (100.0%) | 842 (100.0%) |
Physical Housing Characteristics in Brookdale
Housing Structures in Brookdale
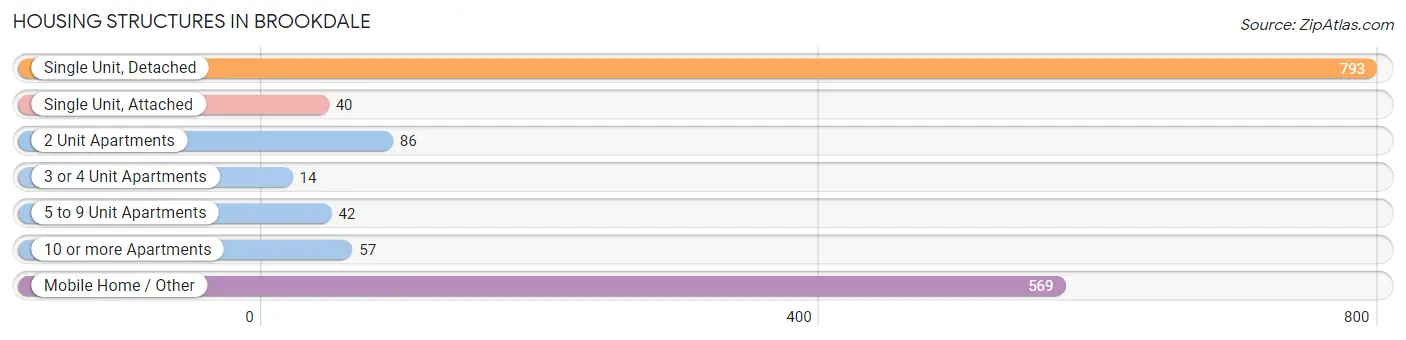
| Structure Type | # Housing Units | % Housing Units |
| Single Unit, Detached | 793 | 49.5% |
| Single Unit, Attached | 40 | 2.5% |
| 2 Unit Apartments | 86 | 5.4% |
| 3 or 4 Unit Apartments | 14 | 0.9% |
| 5 to 9 Unit Apartments | 42 | 2.6% |
| 10 or more Apartments | 57 | 3.6% |
| Mobile Home / Other | 569 | 35.5% |
| Total | 1,601 | 100.0% |
Housing Structures by Occupancy in Brookdale
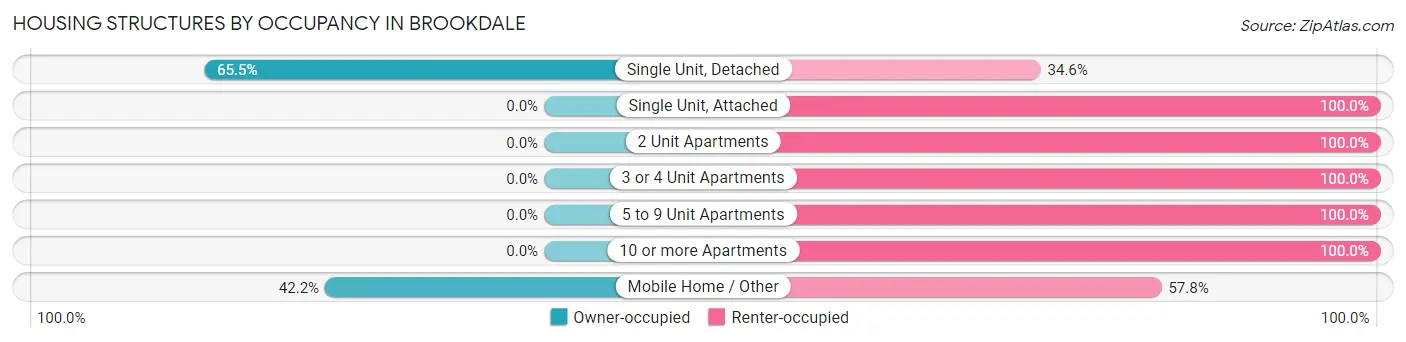
| Structure Type | Owner-occupied | Renter-occupied |
| Single Unit, Detached | 519 (65.4%) | 274 (34.5%) |
| Single Unit, Attached | 0 (0.0%) | 40 (100.0%) |
| 2 Unit Apartments | 0 (0.0%) | 86 (100.0%) |
| 3 or 4 Unit Apartments | 0 (0.0%) | 14 (100.0%) |
| 5 to 9 Unit Apartments | 0 (0.0%) | 42 (100.0%) |
| 10 or more Apartments | 0 (0.0%) | 57 (100.0%) |
| Mobile Home / Other | 240 (42.2%) | 329 (57.8%) |
| Total | 759 (47.4%) | 842 (52.6%) |
Housing Structures by Number of Rooms in Brookdale
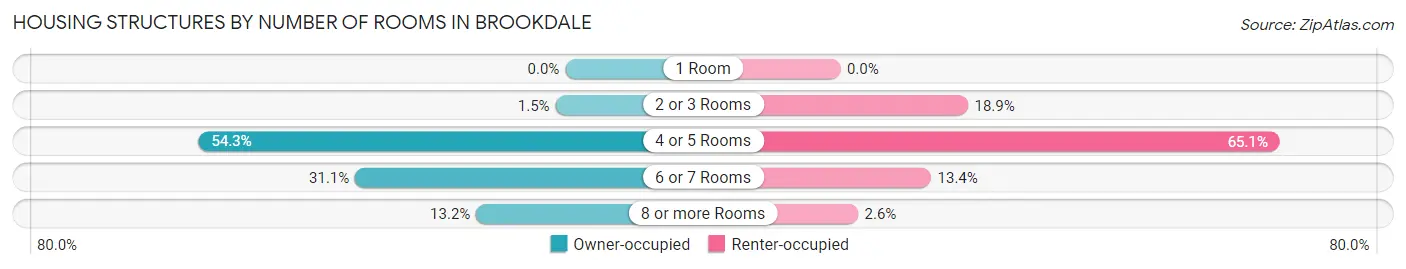
| Number of Rooms | Owner-occupied | Renter-occupied |
| 1 Room | 0 (0.0%) | 0 (0.0%) |
| 2 or 3 Rooms | 11 (1.5%) | 159 (18.9%) |
| 4 or 5 Rooms | 412 (54.3%) | 548 (65.1%) |
| 6 or 7 Rooms | 236 (31.1%) | 113 (13.4%) |
| 8 or more Rooms | 100 (13.2%) | 22 (2.6%) |
| Total | 759 (100.0%) | 842 (100.0%) |
Housing Structure by Heating Type in Brookdale
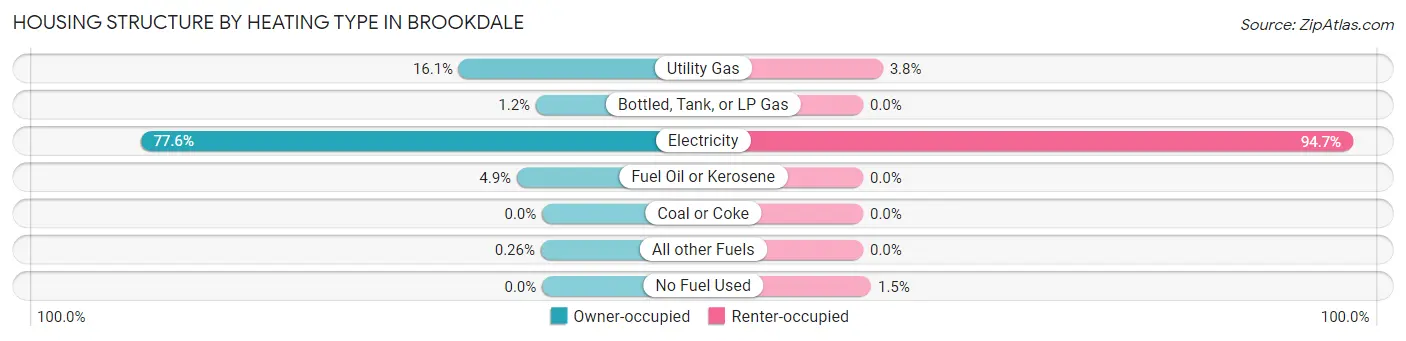
| Heating Type | Owner-occupied | Renter-occupied |
| Utility Gas | 122 (16.1%) | 32 (3.8%) |
| Bottled, Tank, or LP Gas | 9 (1.2%) | 0 (0.0%) |
| Electricity | 589 (77.6%) | 797 (94.7%) |
| Fuel Oil or Kerosene | 37 (4.9%) | 0 (0.0%) |
| Coal or Coke | 0 (0.0%) | 0 (0.0%) |
| All other Fuels | 2 (0.3%) | 0 (0.0%) |
| No Fuel Used | 0 (0.0%) | 13 (1.5%) |
| Total | 759 (100.0%) | 842 (100.0%) |
Household Vehicle Usage in Brookdale
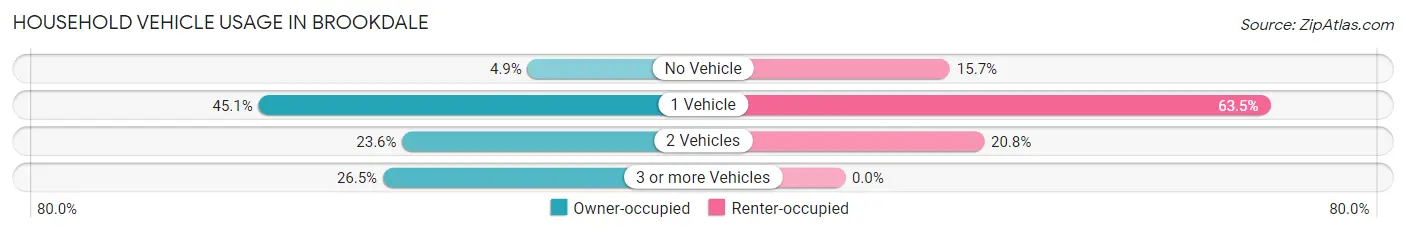
| Vehicles per Household | Owner-occupied | Renter-occupied |
| No Vehicle | 37 (4.9%) | 132 (15.7%) |
| 1 Vehicle | 342 (45.1%) | 535 (63.5%) |
| 2 Vehicles | 179 (23.6%) | 175 (20.8%) |
| 3 or more Vehicles | 201 (26.5%) | 0 (0.0%) |
| Total | 759 (100.0%) | 842 (100.0%) |
Real Estate & Mortgages in Brookdale
Real Estate and Mortgage Overview in Brookdale
| Characteristic | Without Mortgage | With Mortgage |
| Housing Units | 661 | 98 |
| Median Property Value | $79,300 | $88,700 |
| Median Household Income | $37,344 | $21 |
| Monthly Housing Costs | $333 | $0 |
| Real Estate Taxes | $399 | $46 |
Property Value by Mortgage Status in Brookdale
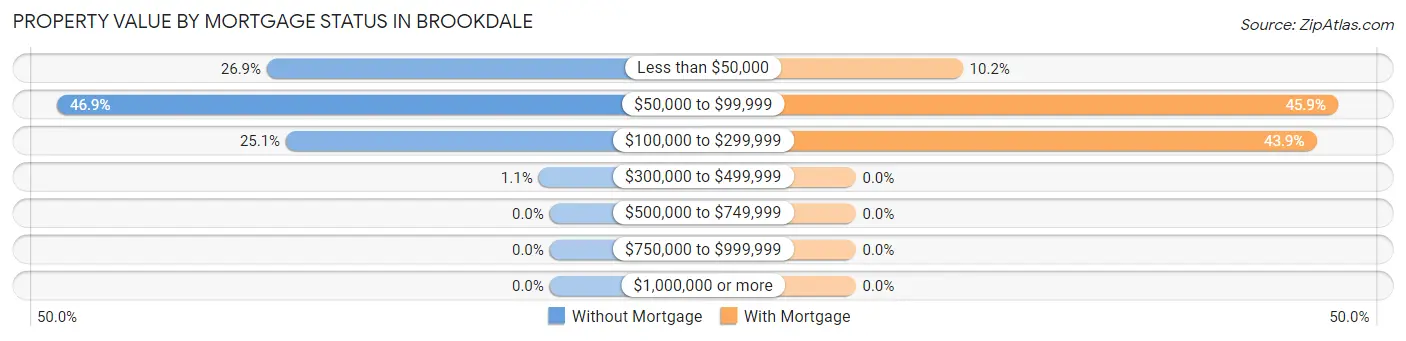
| Property Value | Without Mortgage | With Mortgage |
| Less than $50,000 | 178 (26.9%) | 10 (10.2%) |
| $50,000 to $99,999 | 310 (46.9%) | 45 (45.9%) |
| $100,000 to $299,999 | 166 (25.1%) | 43 (43.9%) |
| $300,000 to $499,999 | 7 (1.1%) | 0 (0.0%) |
| $500,000 to $749,999 | 0 (0.0%) | 0 (0.0%) |
| $750,000 to $999,999 | 0 (0.0%) | 0 (0.0%) |
| $1,000,000 or more | 0 (0.0%) | 0 (0.0%) |
| Total | 661 (100.0%) | 98 (100.0%) |
Household Income by Mortgage Status in Brookdale
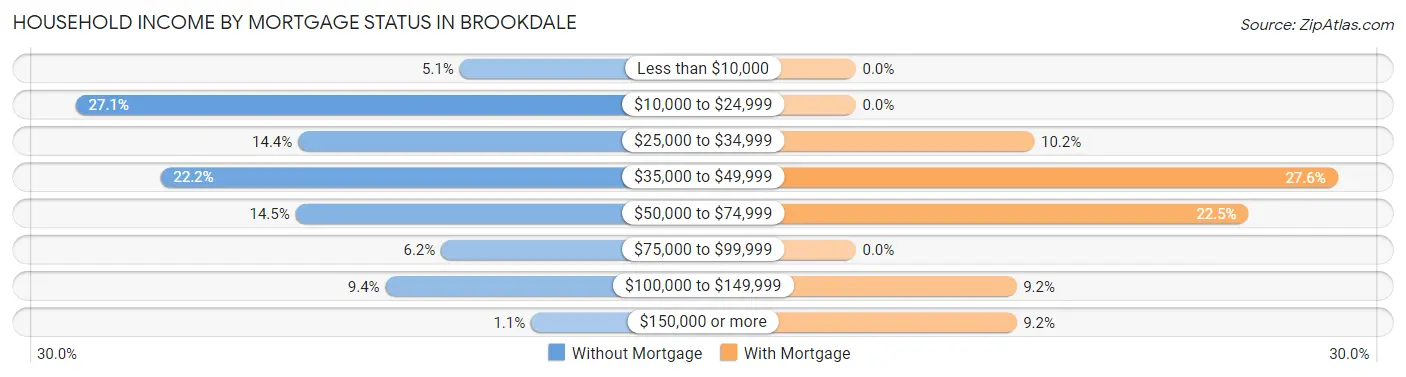
| Household Income | Without Mortgage | With Mortgage |
| Less than $10,000 | 34 (5.1%) | 0 (0.0%) |
| $10,000 to $24,999 | 179 (27.1%) | 0 (0.0%) |
| $25,000 to $34,999 | 95 (14.4%) | 10 (10.2%) |
| $35,000 to $49,999 | 147 (22.2%) | 27 (27.6%) |
| $50,000 to $74,999 | 96 (14.5%) | 22 (22.5%) |
| $75,000 to $99,999 | 41 (6.2%) | 0 (0.0%) |
| $100,000 to $149,999 | 62 (9.4%) | 9 (9.2%) |
| $150,000 or more | 7 (1.1%) | 9 (9.2%) |
| Total | 661 (100.0%) | 98 (100.0%) |
Property Value to Household Income Ratio in Brookdale
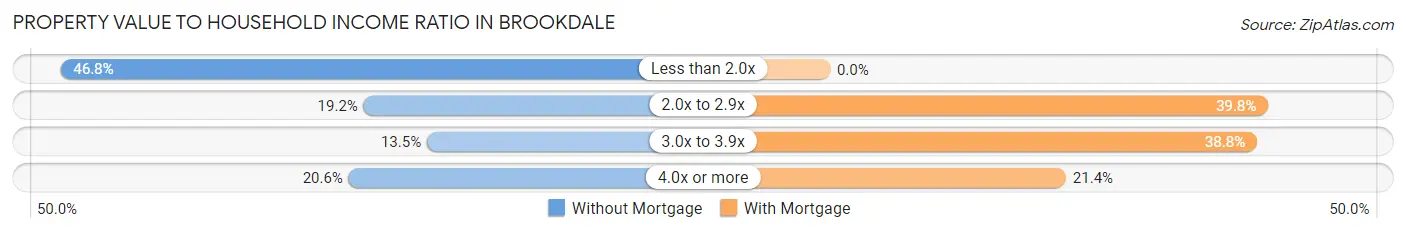
| Value-to-Income Ratio | Without Mortgage | With Mortgage |
| Less than 2.0x | 309 (46.8%) | 0 (0.0%) |
| 2.0x to 2.9x | 127 (19.2%) | 39 (39.8%) |
| 3.0x to 3.9x | 89 (13.5%) | 38 (38.8%) |
| 4.0x or more | 136 (20.6%) | 21 (21.4%) |
| Total | 661 (100.0%) | 98 (100.0%) |
Real Estate Taxes by Mortgage Status in Brookdale
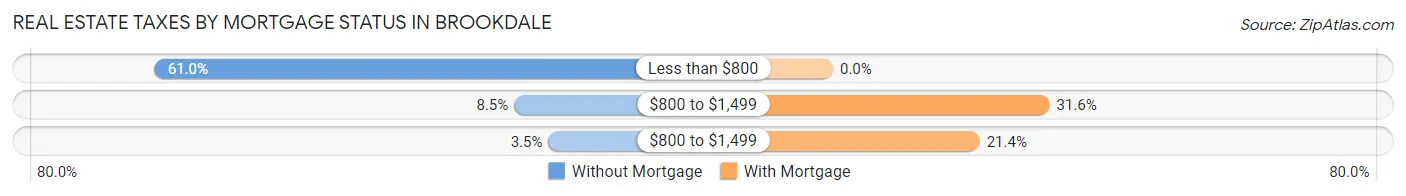
| Property Taxes | Without Mortgage | With Mortgage |
| Less than $800 | 403 (61.0%) | 0 (0.0%) |
| $800 to $1,499 | 56 (8.5%) | 31 (31.6%) |
| $800 to $1,499 | 23 (3.5%) | 21 (21.4%) |
| Total | 661 (100.0%) | 98 (100.0%) |
Health & Disability in Brookdale
Health Insurance Coverage by Age in Brookdale
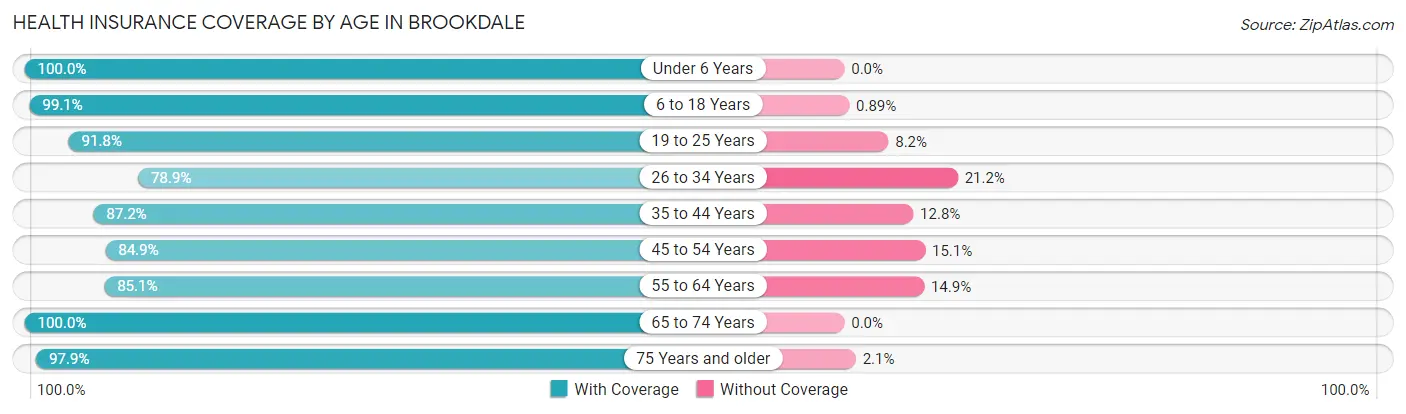
| Age Bracket | With Coverage | Without Coverage |
| Under 6 Years | 292 (100.0%) | 0 (0.0%) |
| 6 to 18 Years | 444 (99.1%) | 4 (0.9%) |
| 19 to 25 Years | 291 (91.8%) | 26 (8.2%) |
| 26 to 34 Years | 671 (78.8%) | 180 (21.1%) |
| 35 to 44 Years | 414 (87.2%) | 61 (12.8%) |
| 45 to 54 Years | 220 (84.9%) | 39 (15.1%) |
| 55 to 64 Years | 504 (85.1%) | 88 (14.9%) |
| 65 to 74 Years | 507 (100.0%) | 0 (0.0%) |
| 75 Years and older | 321 (97.9%) | 7 (2.1%) |
| Total | 3,664 (90.0%) | 405 (10.0%) |
Health Insurance Coverage by Citizenship Status in Brookdale
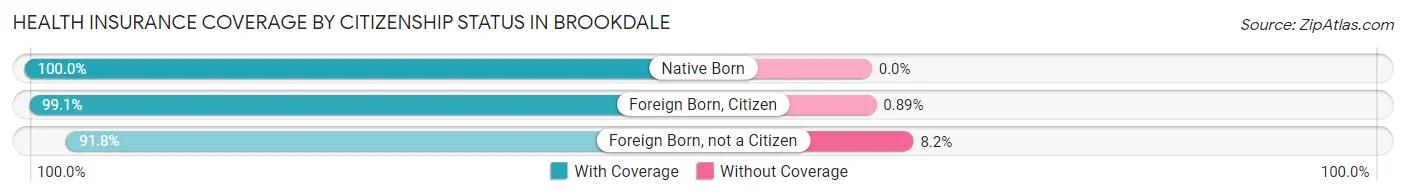
| Citizenship Status | With Coverage | Without Coverage |
| Native Born | 292 (100.0%) | 0 (0.0%) |
| Foreign Born, Citizen | 444 (99.1%) | 4 (0.9%) |
| Foreign Born, not a Citizen | 291 (91.8%) | 26 (8.2%) |
Health Insurance Coverage by Household Income in Brookdale
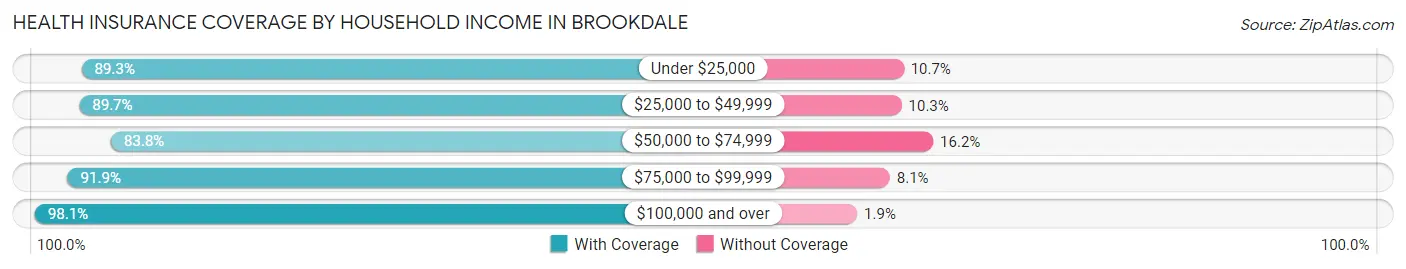
| Household Income | With Coverage | Without Coverage |
| Under $25,000 | 897 (89.3%) | 107 (10.7%) |
| $25,000 to $49,999 | 1,285 (89.7%) | 147 (10.3%) |
| $50,000 to $74,999 | 316 (83.8%) | 61 (16.2%) |
| $75,000 to $99,999 | 604 (91.9%) | 53 (8.1%) |
| $100,000 and over | 354 (98.1%) | 7 (1.9%) |
Public vs Private Health Insurance Coverage by Age in Brookdale
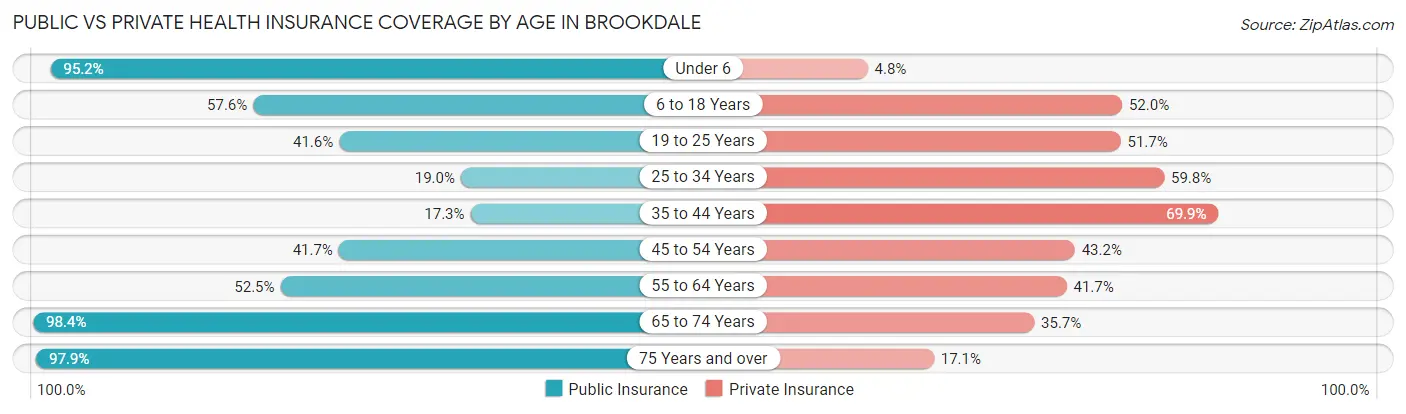
| Age Bracket | Public Insurance | Private Insurance |
| Under 6 | 278 (95.2%) | 14 (4.8%) |
| 6 to 18 Years | 258 (57.6%) | 233 (52.0%) |
| 19 to 25 Years | 132 (41.6%) | 164 (51.7%) |
| 25 to 34 Years | 162 (19.0%) | 509 (59.8%) |
| 35 to 44 Years | 82 (17.3%) | 332 (69.9%) |
| 45 to 54 Years | 108 (41.7%) | 112 (43.2%) |
| 55 to 64 Years | 311 (52.5%) | 247 (41.7%) |
| 65 to 74 Years | 499 (98.4%) | 181 (35.7%) |
| 75 Years and over | 321 (97.9%) | 56 (17.1%) |
| Total | 2,151 (52.9%) | 1,848 (45.4%) |
Disability Status by Sex by Age in Brookdale
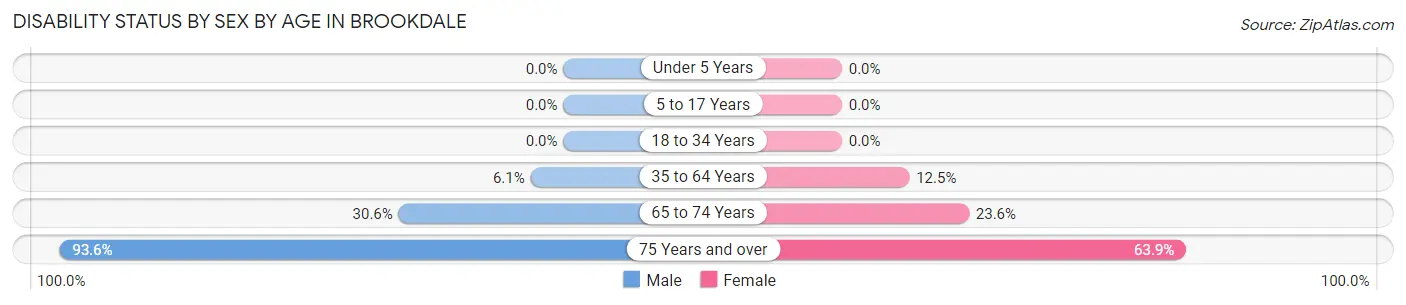
| Age Bracket | Male | Female |
| Under 5 Years | 0 (0.0%) | 0 (0.0%) |
| 5 to 17 Years | 0 (0.0%) | 0 (0.0%) |
| 18 to 34 Years | 0 (0.0%) | 0 (0.0%) |
| 35 to 64 Years | 35 (6.1%) | 94 (12.5%) |
| 65 to 74 Years | 37 (30.6%) | 91 (23.6%) |
| 75 Years and over | 58 (93.5%) | 170 (63.9%) |
Disability Class by Sex by Age in Brookdale
Disability Class: Hearing Difficulty
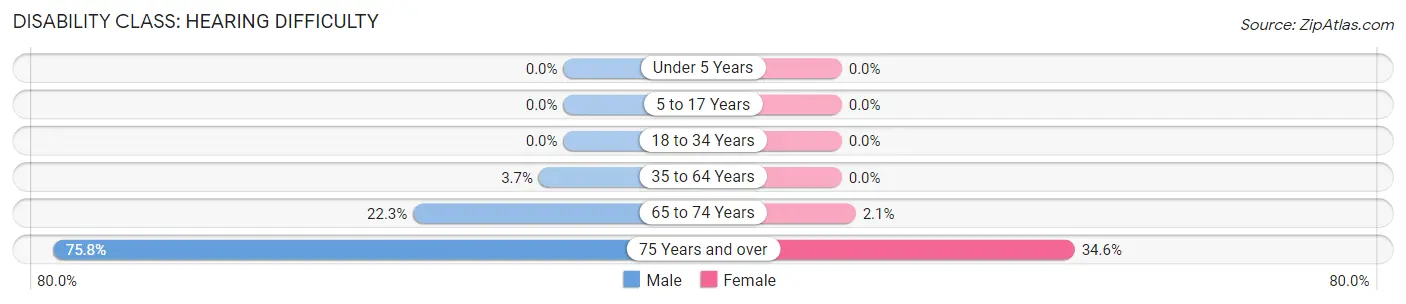
| Age Bracket | Male | Female |
| Under 5 Years | 0 (0.0%) | 0 (0.0%) |
| 5 to 17 Years | 0 (0.0%) | 0 (0.0%) |
| 18 to 34 Years | 0 (0.0%) | 0 (0.0%) |
| 35 to 64 Years | 21 (3.6%) | 0 (0.0%) |
| 65 to 74 Years | 27 (22.3%) | 8 (2.1%) |
| 75 Years and over | 47 (75.8%) | 92 (34.6%) |
Disability Class: Vision Difficulty
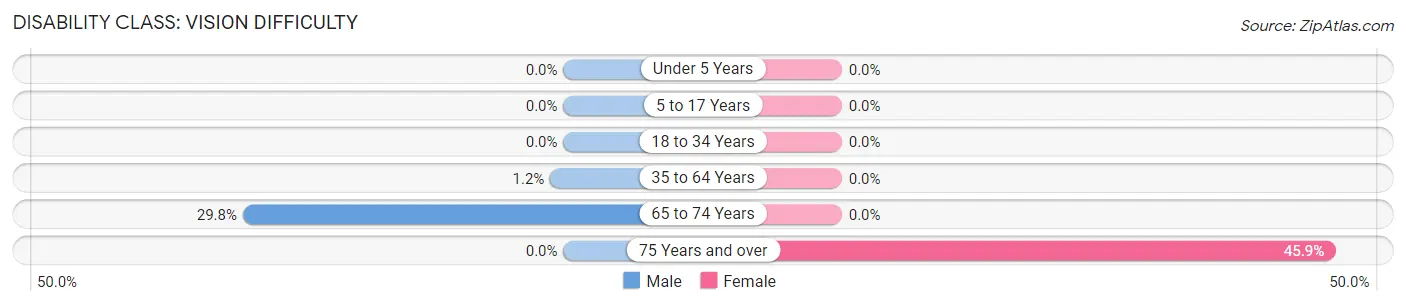
| Age Bracket | Male | Female |
| Under 5 Years | 0 (0.0%) | 0 (0.0%) |
| 5 to 17 Years | 0 (0.0%) | 0 (0.0%) |
| 18 to 34 Years | 0 (0.0%) | 0 (0.0%) |
| 35 to 64 Years | 7 (1.2%) | 0 (0.0%) |
| 65 to 74 Years | 36 (29.7%) | 0 (0.0%) |
| 75 Years and over | 0 (0.0%) | 122 (45.9%) |
Disability Class: Cognitive Difficulty
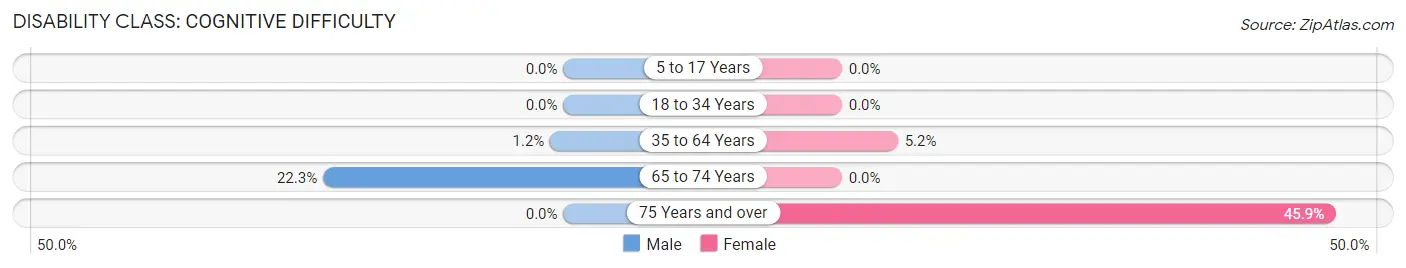
| Age Bracket | Male | Female |
| 5 to 17 Years | 0 (0.0%) | 0 (0.0%) |
| 18 to 34 Years | 0 (0.0%) | 0 (0.0%) |
| 35 to 64 Years | 7 (1.2%) | 39 (5.2%) |
| 65 to 74 Years | 27 (22.3%) | 0 (0.0%) |
| 75 Years and over | 0 (0.0%) | 122 (45.9%) |
Disability Class: Ambulatory Difficulty
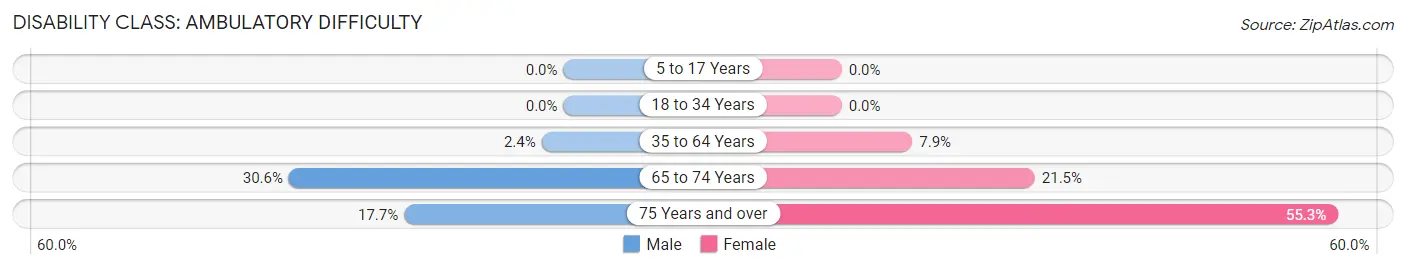
| Age Bracket | Male | Female |
| 5 to 17 Years | 0 (0.0%) | 0 (0.0%) |
| 18 to 34 Years | 0 (0.0%) | 0 (0.0%) |
| 35 to 64 Years | 14 (2.4%) | 59 (7.9%) |
| 65 to 74 Years | 37 (30.6%) | 83 (21.5%) |
| 75 Years and over | 11 (17.7%) | 147 (55.3%) |
Disability Class: Self-Care Difficulty
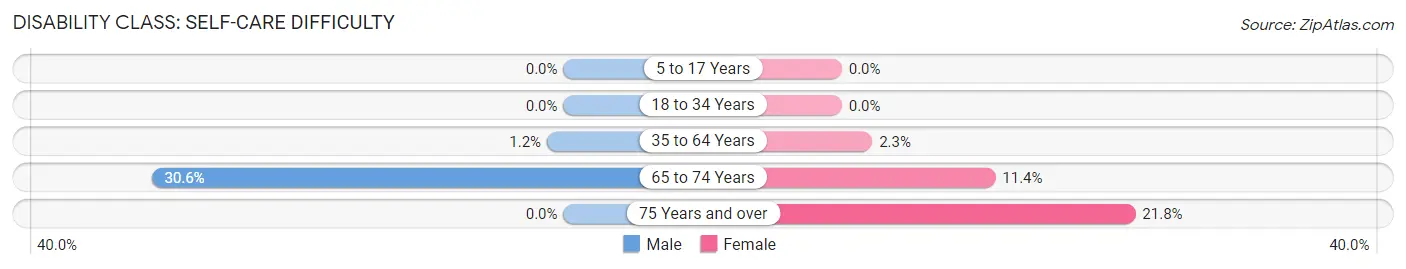
| Age Bracket | Male | Female |
| 5 to 17 Years | 0 (0.0%) | 0 (0.0%) |
| 18 to 34 Years | 0 (0.0%) | 0 (0.0%) |
| 35 to 64 Years | 7 (1.2%) | 17 (2.3%) |
| 65 to 74 Years | 37 (30.6%) | 44 (11.4%) |
| 75 Years and over | 0 (0.0%) | 58 (21.8%) |
Technology Access in Brookdale
Computing Device Access in Brookdale
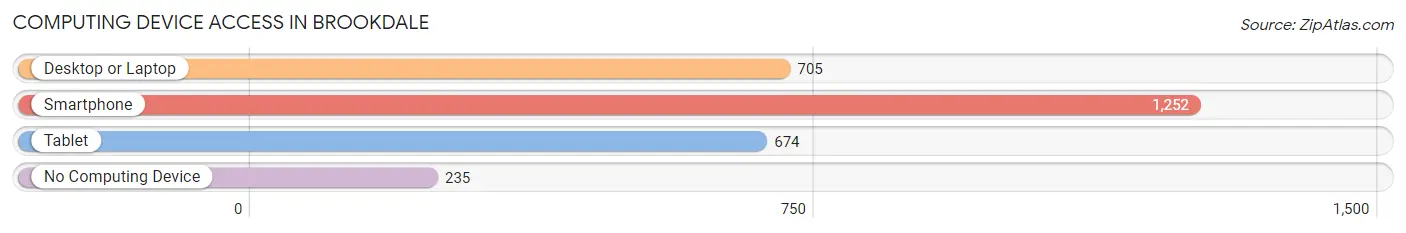
| Device Type | # Households | % Households |
| Desktop or Laptop | 705 | 44.0% |
| Smartphone | 1,252 | 78.2% |
| Tablet | 674 | 42.1% |
| No Computing Device | 235 | 14.7% |
| Total | 1,601 | 100.0% |
Internet Access in Brookdale
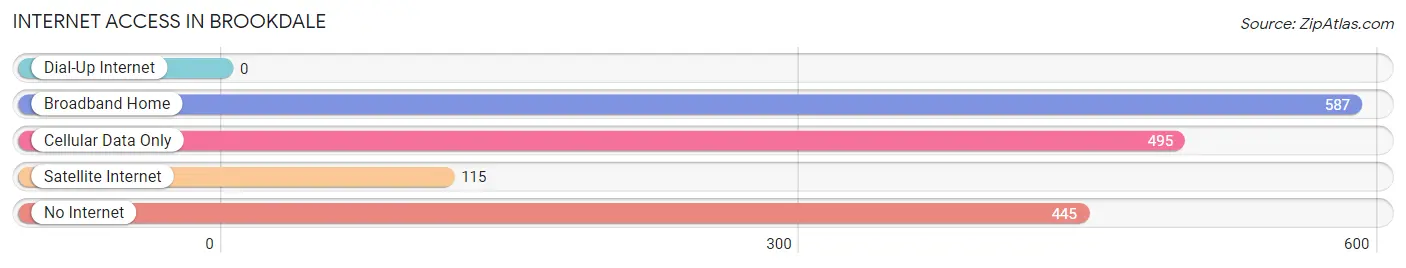
| Internet Type | # Households | % Households |
| Dial-Up Internet | 0 | 0.0% |
| Broadband Home | 587 | 36.7% |
| Cellular Data Only | 495 | 30.9% |
| Satellite Internet | 115 | 7.2% |
| No Internet | 445 | 27.8% |
| Total | 1,601 | 100.0% |
Brookdale Summary
Brookdale is a small unincorporated community located in Spartanburg County, South Carolina. It is situated in the foothills of the Blue Ridge Mountains, approximately 20 miles northwest of Spartanburg. The community is home to a population of approximately 1,000 people, and is known for its rural charm and close-knit community.
History
The area that is now Brookdale was first settled in the late 1700s by a group of settlers from North Carolina. The settlers were attracted to the area due to its fertile soil and abundant natural resources. The community was originally known as “Brookdale” due to the numerous streams and creeks that ran through the area.
In the early 1800s, the community began to grow and develop. A post office was established in 1820, and a school was built in 1825. The community continued to grow throughout the 19th century, and by the early 1900s, it had become a thriving agricultural community.
Geography
Brookdale is located in the foothills of the Blue Ridge Mountains, approximately 20 miles northwest of Spartanburg. The community is situated in a rural area, and is surrounded by rolling hills and lush forests. The area is known for its scenic beauty, and is home to numerous parks and outdoor recreation areas.
The climate in Brookdale is mild and temperate, with warm summers and cool winters. The average annual temperature is around 60 degrees Fahrenheit, and the average annual precipitation is around 45 inches.
Economy
The economy of Brookdale is largely based on agriculture. The area is home to numerous farms and ranches, and the community is known for its production of dairy products, beef, and poultry. In addition, the area is home to several small businesses, including restaurants, retail stores, and service providers.
Demographics
As of the 2010 census, the population of Brookdale was 1,000 people. The racial makeup of the community was 97.2% White, 0.7% African American, 0.3% Native American, 0.2% Asian, and 1.6% from other races. The median household income was $37,500, and the median home value was $125,000.
Conclusion
Brookdale is a small unincorporated community located in Spartanburg County, South Carolina. It is situated in the foothills of the Blue Ridge Mountains, and is known for its rural charm and close-knit community. The economy of Brookdale is largely based on agriculture, and the area is home to numerous farms and ranches. The population of Brookdale is approximately 1,000 people, and the racial makeup of the community is predominantly White.
Common Questions
What is Per Capita Income in Brookdale?
Per Capita income in Brookdale is $18,263.
What is the Median Family Income in Brookdale?
Median Family Income in Brookdale is $42,386.
What is the Median Household income in Brookdale?
Median Household Income in Brookdale is $33,406.
What is Income or Wage Gap in Brookdale?
Income or Wage Gap in Brookdale is 38.6%.
Women in Brookdale earn 61.4 cents for every dollar earned by a man.
What is Family Income Deficit in Brookdale?
Family Income Deficit in Brookdale is $11,123.
Families that are below poverty line in Brookdale earn $11,123 less on average than the poverty threshold level.
What is Inequality or Gini Index in Brookdale?
Inequality or Gini Index in Brookdale is 0.45.
What is the Total Population of Brookdale?
Total Population of Brookdale is 4,069.
What is the Total Male Population of Brookdale?
Total Male Population of Brookdale is 1,729.
What is the Total Female Population of Brookdale?
Total Female Population of Brookdale is 2,340.
What is the Ratio of Males per 100 Females in Brookdale?
There are 73.89 Males per 100 Females in Brookdale.
What is the Ratio of Females per 100 Males in Brookdale?
There are 135.34 Females per 100 Males in Brookdale.
What is the Median Population Age in Brookdale?
Median Population Age in Brookdale is 37.5 Years.
What is the Average Family Size in Brookdale
Average Family Size in Brookdale is 3.0 People.
What is the Average Household Size in Brookdale
Average Household Size in Brookdale is 2.4 People.
How Large is the Labor Force in Brookdale?
There are 1,720 People in the Labor Forcein in Brookdale.
What is the Percentage of People in the Labor Force in Brookdale?
48.9% of People are in the Labor Force in Brookdale.
What is the Unemployment Rate in Brookdale?
Unemployment Rate in Brookdale is 12.8%.