Van Buren, AR Map & Demographics
Van Buren Map
Van Buren Overview
$29,609
PER CAPITA INCOME
$64,716
AVG FAMILY INCOME
$56,493
AVG HOUSEHOLD INCOME
36.2%
WAGE / INCOME GAP [ % ]
63.8¢/ $1
WAGE / INCOME GAP [ $ ]
$13,279
FAMILY INCOME DEFICIT
0.46
INEQUALITY / GINI INDEX
23,398
TOTAL POPULATION
11,075
MALE POPULATION
12,323
FEMALE POPULATION
89.87
MALES / 100 FEMALES
111.27
FEMALES / 100 MALES
36.8
MEDIAN AGE
3.0
AVG FAMILY SIZE
2.6
AVG HOUSEHOLD SIZE
10,800
LABOR FORCE [ PEOPLE ]
58.4%
PERCENT IN LABOR FORCE
7.9%
UNEMPLOYMENT RATE
Van Buren Zip Codes
Van Buren Area Codes
Income in Van Buren
Income Overview in Van Buren
Per Capita Income in Van Buren is $29,609, while median incomes of families and households are $64,716 and $56,493 respectively.
| Characteristic | Number | Measure |
| Per Capita Income | 23,398 | $29,609 |
| Median Family Income | 6,293 | $64,716 |
| Mean Family Income | 6,293 | $76,677 |
| Median Household Income | 8,923 | $56,493 |
| Mean Household Income | 8,923 | $73,814 |
| Income Deficit | 6,293 | $13,279 |
| Wage / Income Gap (%) | 23,398 | 36.16% |
| Wage / Income Gap ($) | 23,398 | 63.84¢ per $1 |
| Gini / Inequality Index | 23,398 | 0.46 |
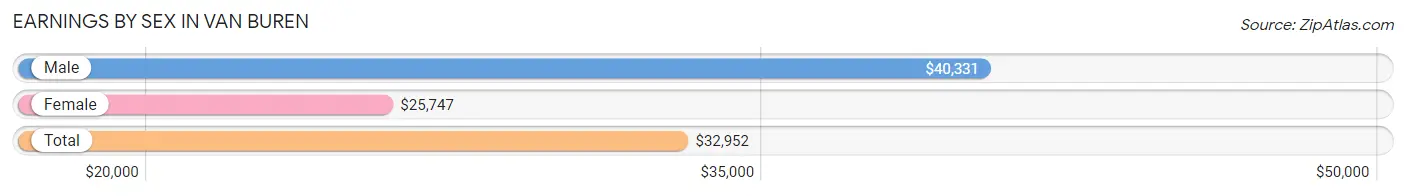
Earnings by Sex in Van Buren
Average Earnings in Van Buren are $32,952, $40,331 for men and $25,747 for women, a difference of 36.2%.
| Sex | Number | Average Earnings |
| Male | 6,096 (53.6%) | $40,331 |
| Female | 5,271 (46.4%) | $25,747 |
| Total | 11,367 (100.0%) | $32,952 |
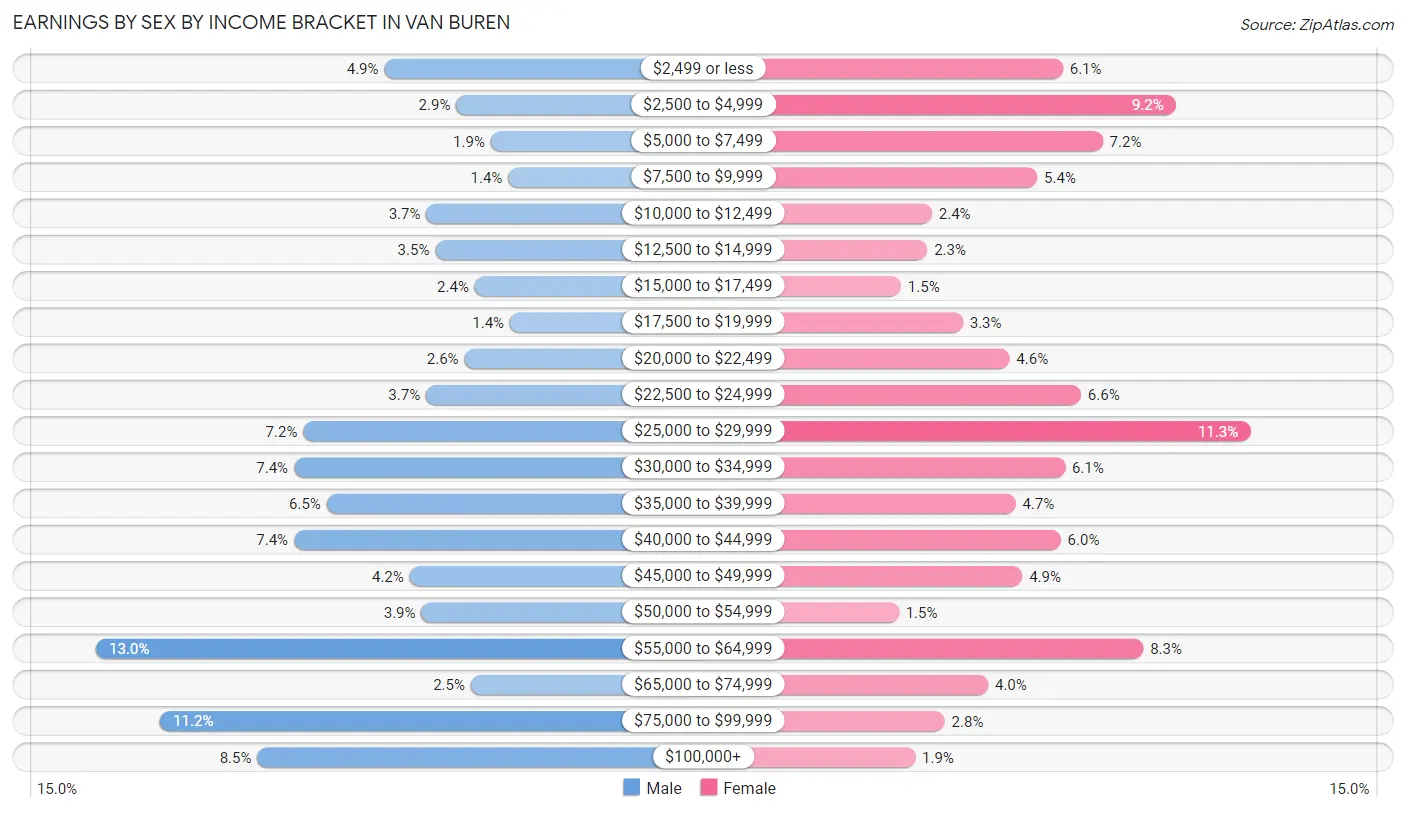
Earnings by Sex by Income Bracket in Van Buren
The most common earnings brackets in Van Buren are $55,000 to $64,999 for men (792 | 13.0%) and $25,000 to $29,999 for women (597 | 11.3%).
| Income | Male | Female |
| $2,499 or less | 298 (4.9%) | 320 (6.1%) |
| $2,500 to $4,999 | 175 (2.9%) | 487 (9.2%) |
| $5,000 to $7,499 | 116 (1.9%) | 379 (7.2%) |
| $7,500 to $9,999 | 86 (1.4%) | 282 (5.3%) |
| $10,000 to $12,499 | 226 (3.7%) | 126 (2.4%) |
| $12,500 to $14,999 | 211 (3.5%) | 119 (2.3%) |
| $15,000 to $17,499 | 143 (2.4%) | 80 (1.5%) |
| $17,500 to $19,999 | 83 (1.4%) | 172 (3.3%) |
| $20,000 to $22,499 | 161 (2.6%) | 241 (4.6%) |
| $22,500 to $24,999 | 227 (3.7%) | 347 (6.6%) |
| $25,000 to $29,999 | 437 (7.2%) | 597 (11.3%) |
| $30,000 to $34,999 | 453 (7.4%) | 323 (6.1%) |
| $35,000 to $39,999 | 397 (6.5%) | 250 (4.7%) |
| $40,000 to $44,999 | 453 (7.4%) | 317 (6.0%) |
| $45,000 to $49,999 | 255 (4.2%) | 260 (4.9%) |
| $50,000 to $54,999 | 235 (3.8%) | 77 (1.5%) |
| $55,000 to $64,999 | 792 (13.0%) | 439 (8.3%) |
| $65,000 to $74,999 | 150 (2.5%) | 209 (4.0%) |
| $75,000 to $99,999 | 682 (11.2%) | 145 (2.8%) |
| $100,000+ | 516 (8.5%) | 101 (1.9%) |
| Total | 6,096 (100.0%) | 5,271 (100.0%) |
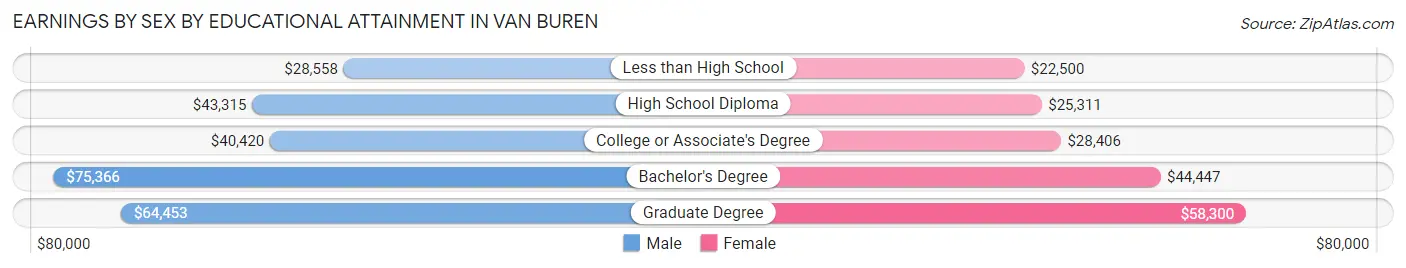
Earnings by Sex by Educational Attainment in Van Buren
Average earnings in Van Buren are $42,938 for men and $28,372 for women, a difference of 33.9%. Men with an educational attainment of bachelor's degree enjoy the highest average annual earnings of $75,366, while those with less than high school education earn the least with $28,558. Women with an educational attainment of graduate degree earn the most with the average annual earnings of $58,300, while those with less than high school education have the smallest earnings of $22,500.
| Educational Attainment | Male Income | Female Income |
| Less than High School | $28,558 | $22,500 |
| High School Diploma | $43,315 | $25,311 |
| College or Associate's Degree | $40,420 | $28,406 |
| Bachelor's Degree | $75,366 | $44,447 |
| Graduate Degree | $64,453 | $58,300 |
| Total | $42,938 | $28,372 |
Family Income in Van Buren
Family Income Brackets in Van Buren
According to the Van Buren family income data, there are 1,202 families falling into the $50,000 to $74,999 income range, which is the most common income bracket and makes up 19.1% of all families. Conversely, the $10,000 to $14,999 income bracket is the least frequent group with only 195 families (3.1%) belonging to this category.
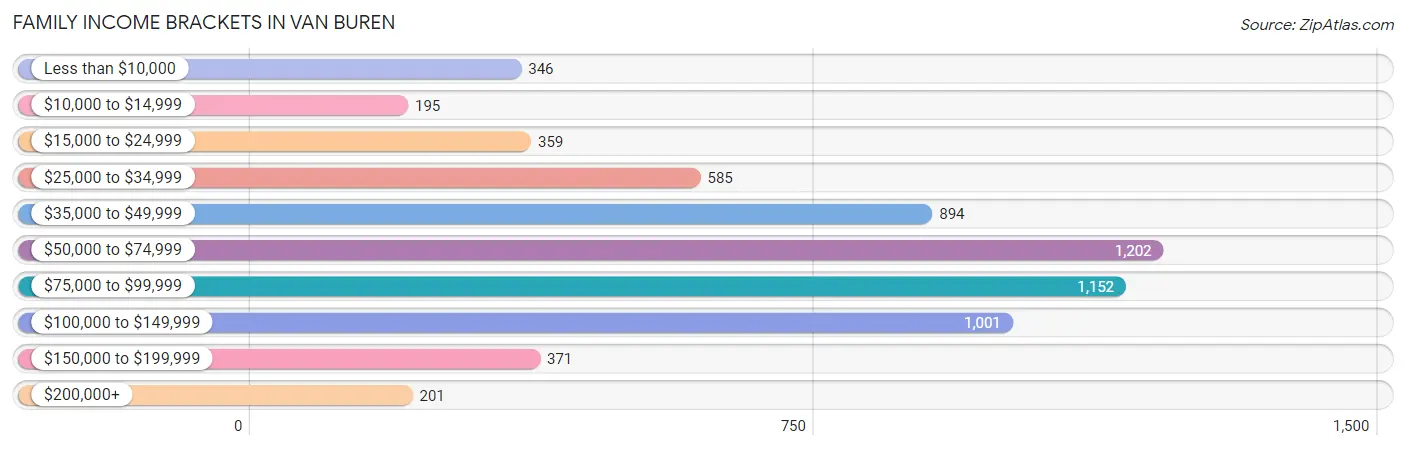
| Income Bracket | # Families | % Families |
| Less than $10,000 | 346 | 5.5% |
| $10,000 to $14,999 | 195 | 3.1% |
| $15,000 to $24,999 | 359 | 5.7% |
| $25,000 to $34,999 | 585 | 9.3% |
| $35,000 to $49,999 | 894 | 14.2% |
| $50,000 to $74,999 | 1,202 | 19.1% |
| $75,000 to $99,999 | 1,152 | 18.3% |
| $100,000 to $149,999 | 1,001 | 15.9% |
| $150,000 to $199,999 | 371 | 5.9% |
| $200,000+ | 201 | 3.2% |
Family Income by Famaliy Size in Van Buren
4-person families (963 | 15.3%) account for the highest median family income in Van Buren with $102,660 per family, while 2-person families (3,186 | 50.6%) have the highest median income of $30,644 per family member.
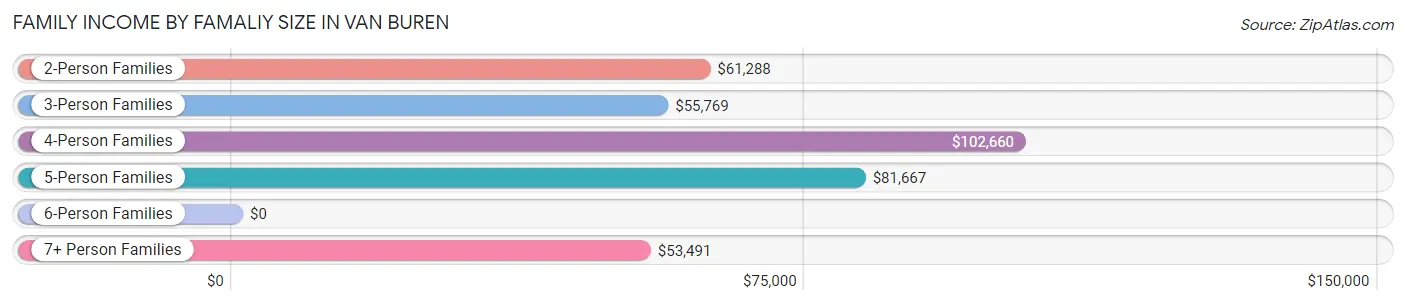
| Income Bracket | # Families | Median Income |
| 2-Person Families | 3,186 (50.6%) | $61,288 |
| 3-Person Families | 1,321 (21.0%) | $55,769 |
| 4-Person Families | 963 (15.3%) | $102,660 |
| 5-Person Families | 520 (8.3%) | $81,667 |
| 6-Person Families | 198 (3.2%) | $0 |
| 7+ Person Families | 105 (1.7%) | $53,491 |
| Total | 6,293 (100.0%) | $64,716 |
Family Income by Number of Earners in Van Buren
The median family income in Van Buren is $64,716, with families comprising 3+ earners (482) having the highest median family income of $94,063, while families with no earners (1,143) have the lowest median family income of $41,985, accounting for 7.7% and 18.2% of families, respectively.
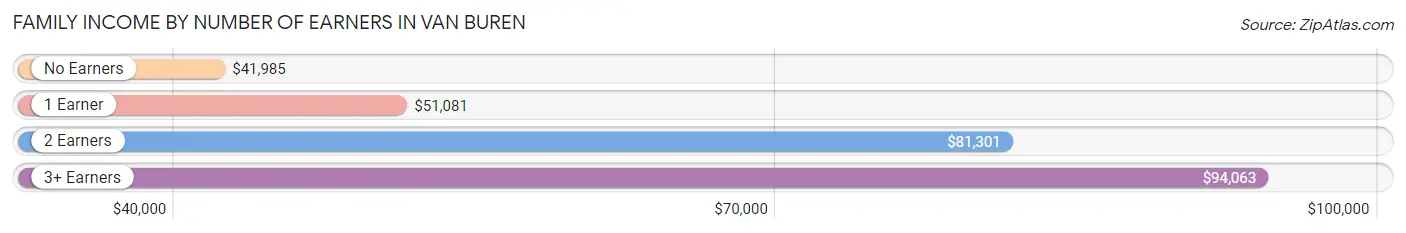
| Number of Earners | # Families | Median Income |
| No Earners | 1,143 (18.2%) | $41,985 |
| 1 Earner | 2,348 (37.3%) | $51,081 |
| 2 Earners | 2,320 (36.9%) | $81,301 |
| 3+ Earners | 482 (7.7%) | $94,063 |
| Total | 6,293 (100.0%) | $64,716 |
Household Income in Van Buren
Household Income Brackets in Van Buren
With 1,847 households falling in the category, the $50,000 to $74,999 income range is the most frequent in Van Buren, accounting for 20.7% of all households. In contrast, only 259 households (2.9%) fall into the $200,000+ income bracket, making it the least populous group.
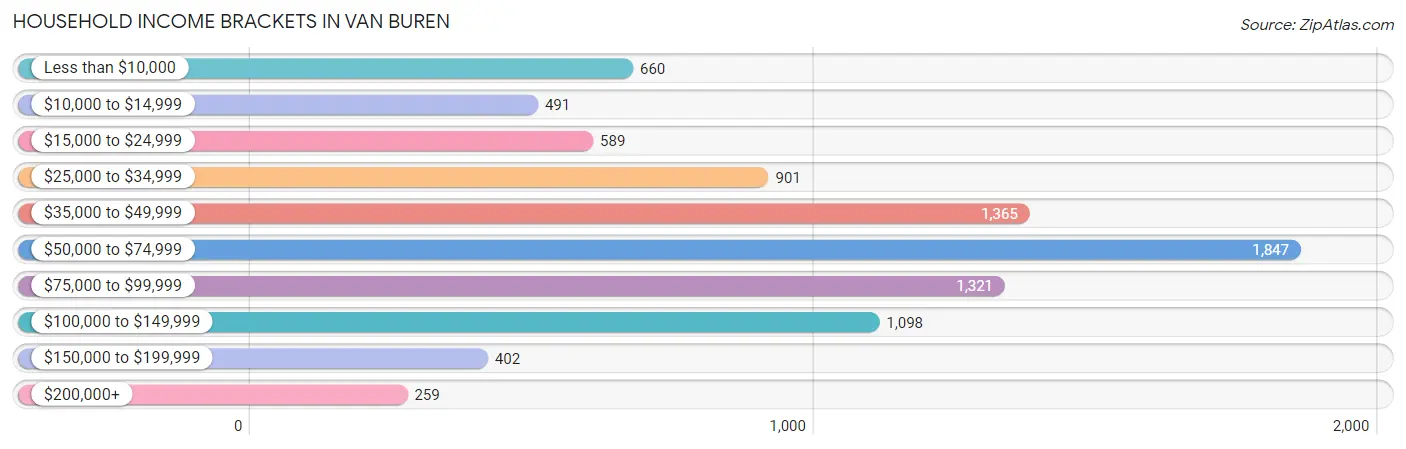
| Income Bracket | # Households | % Households |
| Less than $10,000 | 660 | 7.4% |
| $10,000 to $14,999 | 491 | 5.5% |
| $15,000 to $24,999 | 589 | 6.6% |
| $25,000 to $34,999 | 901 | 10.1% |
| $35,000 to $49,999 | 1,365 | 15.3% |
| $50,000 to $74,999 | 1,847 | 20.7% |
| $75,000 to $99,999 | 1,321 | 14.8% |
| $100,000 to $149,999 | 1,098 | 12.3% |
| $150,000 to $199,999 | 402 | 4.5% |
| $200,000+ | 259 | 2.9% |
Household Income by Householder Age in Van Buren
The median household income in Van Buren is $56,493, with the highest median household income of $60,127 found in the 45 to 64 years age bracket for the primary householder. A total of 3,156 households (35.4%) fall into this category. Meanwhile, the 65+ years age bracket for the primary householder has the lowest median household income of $55,138, with 2,294 households (25.7%) in this group.
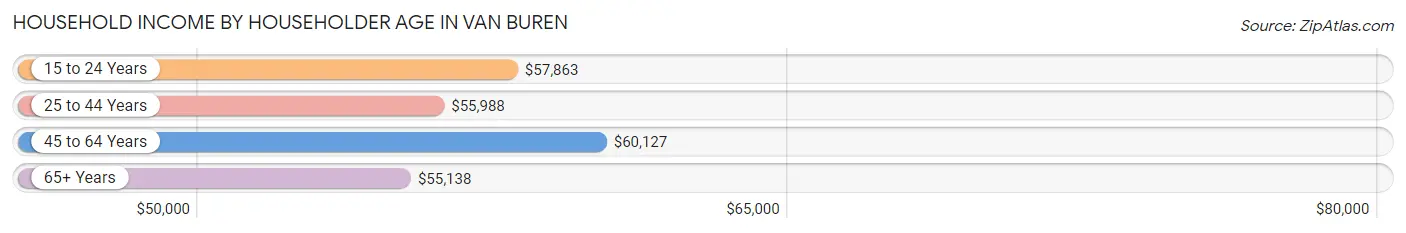
| Income Bracket | # Households | Median Income |
| 15 to 24 Years | 445 (5.0%) | $57,863 |
| 25 to 44 Years | 3,028 (33.9%) | $55,988 |
| 45 to 64 Years | 3,156 (35.4%) | $60,127 |
| 65+ Years | 2,294 (25.7%) | $55,138 |
| Total | 8,923 (100.0%) | $56,493 |
Poverty in Van Buren
Income Below Poverty by Sex and Age in Van Buren
With 15.8% poverty level for males and 21.8% for females among the residents of Van Buren, 16 and 17 year old males and 5 year old females are the most vulnerable to poverty, with 91 males (36.7%) and 60 females (50.4%) in their respective age groups living below the poverty level.
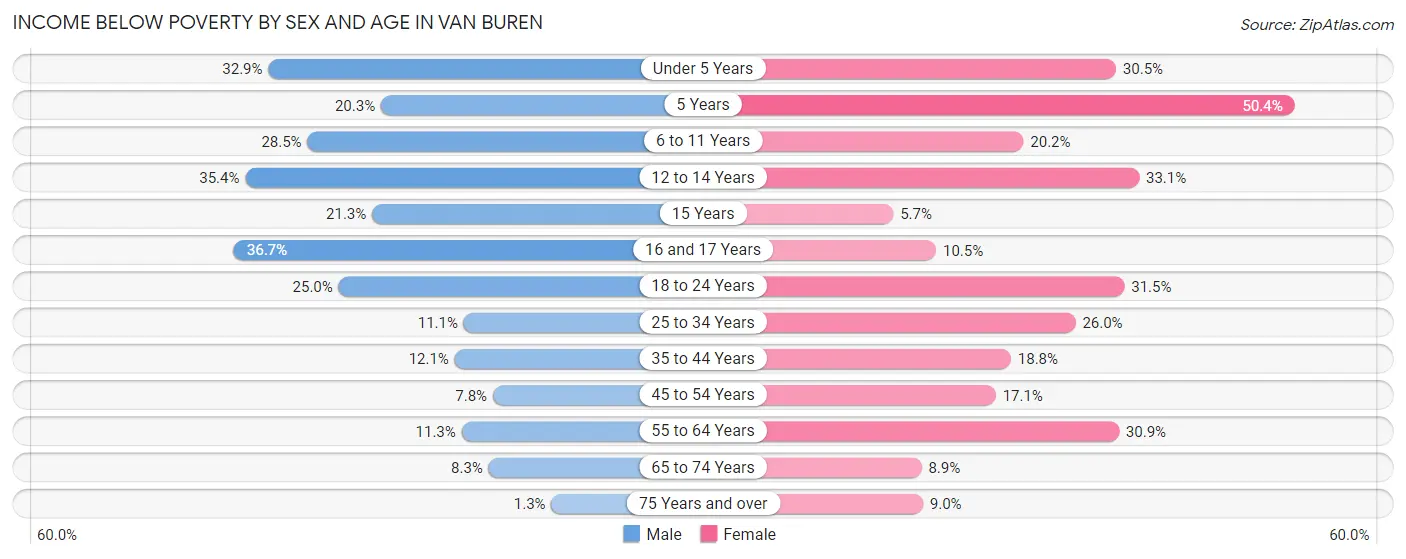
| Age Bracket | Male | Female |
| Under 5 Years | 203 (32.9%) | 258 (30.5%) |
| 5 Years | 26 (20.3%) | 60 (50.4%) |
| 6 to 11 Years | 181 (28.5%) | 198 (20.2%) |
| 12 to 14 Years | 249 (35.4%) | 142 (33.1%) |
| 15 Years | 36 (21.3%) | 9 (5.7%) |
| 16 and 17 Years | 91 (36.7%) | 19 (10.5%) |
| 18 to 24 Years | 181 (25.0%) | 369 (31.5%) |
| 25 to 34 Years | 236 (11.1%) | 492 (26.0%) |
| 35 to 44 Years | 171 (12.1%) | 242 (18.8%) |
| 45 to 54 Years | 103 (7.8%) | 269 (17.1%) |
| 55 to 64 Years | 143 (11.3%) | 378 (30.9%) |
| 65 to 74 Years | 81 (8.3%) | 113 (8.9%) |
| 75 Years and over | 7 (1.3%) | 84 (9.0%) |
| Total | 1,708 (15.8%) | 2,633 (21.8%) |
Income Above Poverty by Sex and Age in Van Buren
According to the poverty statistics in Van Buren, males aged 75 years and over and females aged 15 years are the age groups that are most secure financially, with 98.7% of males and 94.3% of females in these age groups living above the poverty line.
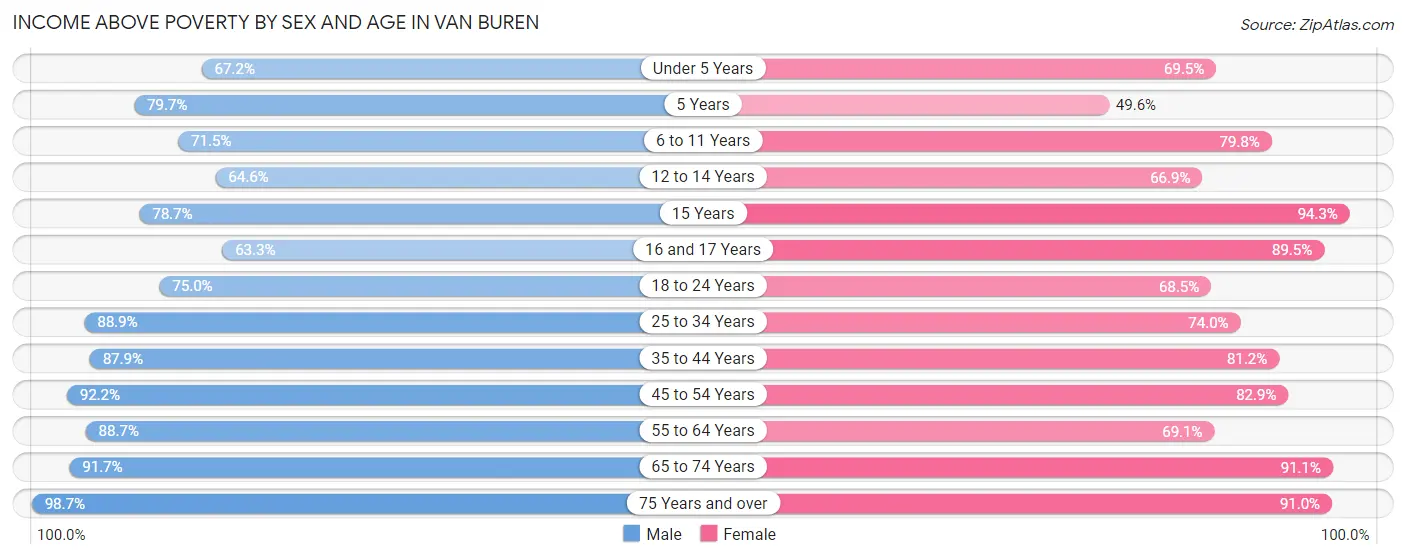
| Age Bracket | Male | Female |
| Under 5 Years | 415 (67.1%) | 587 (69.5%) |
| 5 Years | 102 (79.7%) | 59 (49.6%) |
| 6 to 11 Years | 454 (71.5%) | 781 (79.8%) |
| 12 to 14 Years | 454 (64.6%) | 287 (66.9%) |
| 15 Years | 133 (78.7%) | 148 (94.3%) |
| 16 and 17 Years | 157 (63.3%) | 162 (89.5%) |
| 18 to 24 Years | 542 (75.0%) | 804 (68.5%) |
| 25 to 34 Years | 1,892 (88.9%) | 1,399 (74.0%) |
| 35 to 44 Years | 1,242 (87.9%) | 1,043 (81.2%) |
| 45 to 54 Years | 1,211 (92.2%) | 1,300 (82.9%) |
| 55 to 64 Years | 1,119 (88.7%) | 847 (69.1%) |
| 65 to 74 Years | 893 (91.7%) | 1,161 (91.1%) |
| 75 Years and over | 520 (98.7%) | 846 (91.0%) |
| Total | 9,134 (84.3%) | 9,424 (78.2%) |
Income Below Poverty Among Married-Couple Families in Van Buren
The poverty statistics for married-couple families in Van Buren show that 5.0% or 214 of the total 4,298 families live below the poverty line. Families with 5 or more children have the highest poverty rate of 60.0%, comprising of 30 families. On the other hand, families with no children have the lowest poverty rate of 2.5%, which includes 65 families.
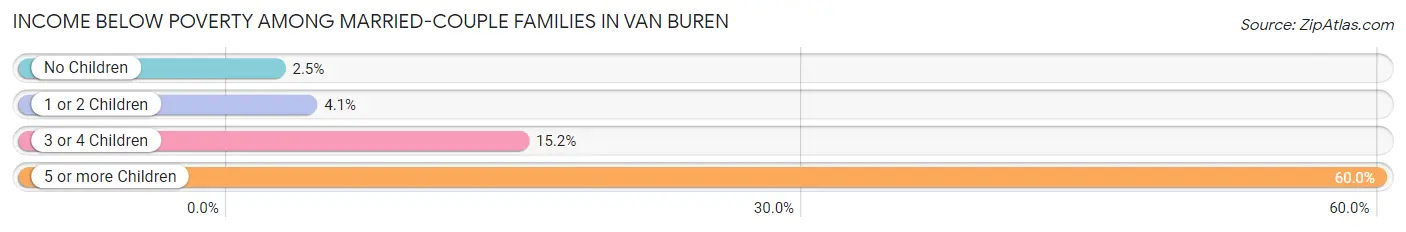
| Children | Above Poverty | Below Poverty |
| No Children | 2,557 (97.5%) | 65 (2.5%) |
| 1 or 2 Children | 1,111 (95.9%) | 48 (4.1%) |
| 3 or 4 Children | 396 (84.8%) | 71 (15.2%) |
| 5 or more Children | 20 (40.0%) | 30 (60.0%) |
| Total | 4,084 (95.0%) | 214 (5.0%) |
Income Below Poverty Among Single-Parent Households in Van Buren
According to the poverty data in Van Buren, 13.0% or 82 single-father households and 34.0% or 463 single-mother households are living below the poverty line. Among single-father households, those with 3 or 4 children have the highest poverty rate, with 26 households (68.4%) experiencing poverty. Likewise, among single-mother households, those with 3 or 4 children have the highest poverty rate, with 75 households (83.3%) falling below the poverty line.
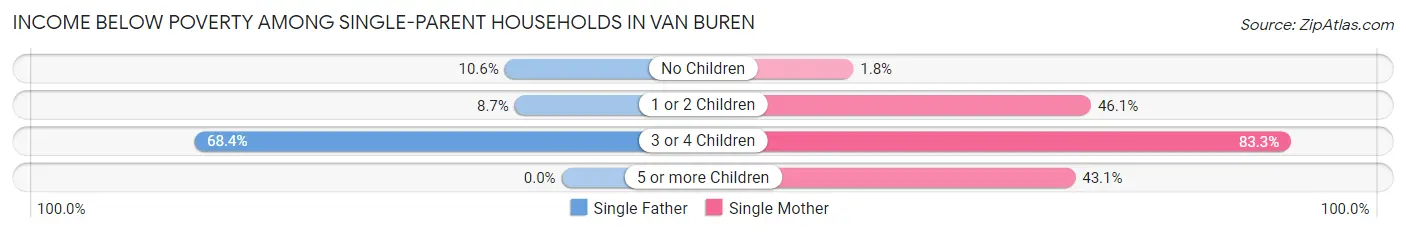
| Children | Single Father | Single Mother |
| No Children | 23 (10.6%) | 8 (1.8%) |
| 1 or 2 Children | 33 (8.7%) | 358 (46.1%) |
| 3 or 4 Children | 26 (68.4%) | 75 (83.3%) |
| 5 or more Children | 0 (0.0%) | 22 (43.1%) |
| Total | 82 (13.0%) | 463 (34.0%) |
Income Below Poverty Among Married-Couple vs Single-Parent Households in Van Buren
The poverty data for Van Buren shows that 214 of the married-couple family households (5.0%) and 545 of the single-parent households (27.3%) are living below the poverty level. Within the married-couple family households, those with 5 or more children have the highest poverty rate, with 30 households (60.0%) falling below the poverty line. Among the single-parent households, those with 3 or 4 children have the highest poverty rate, with 101 household (78.9%) living below poverty.
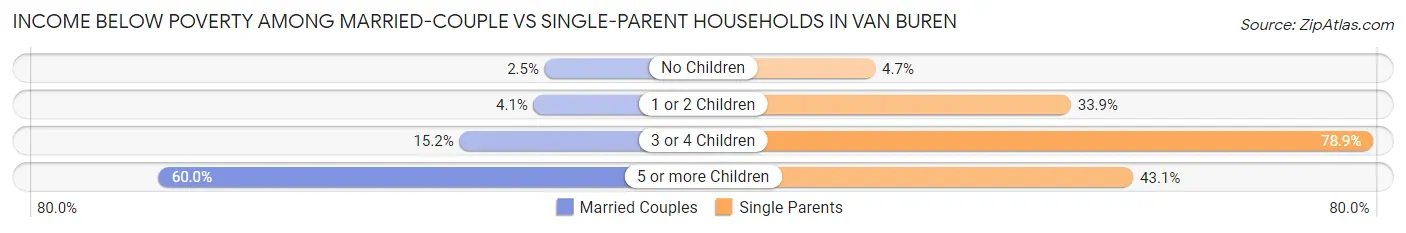
| Children | Married-Couple Families | Single-Parent Households |
| No Children | 65 (2.5%) | 31 (4.7%) |
| 1 or 2 Children | 48 (4.1%) | 391 (33.9%) |
| 3 or 4 Children | 71 (15.2%) | 101 (78.9%) |
| 5 or more Children | 30 (60.0%) | 22 (43.1%) |
| Total | 214 (5.0%) | 545 (27.3%) |
Race in Van Buren
The most populous races in Van Buren are White / Caucasian (18,693 | 79.9%), Hispanic or Latino (3,637 | 15.5%), and Two or more Races (2,441 | 10.4%).
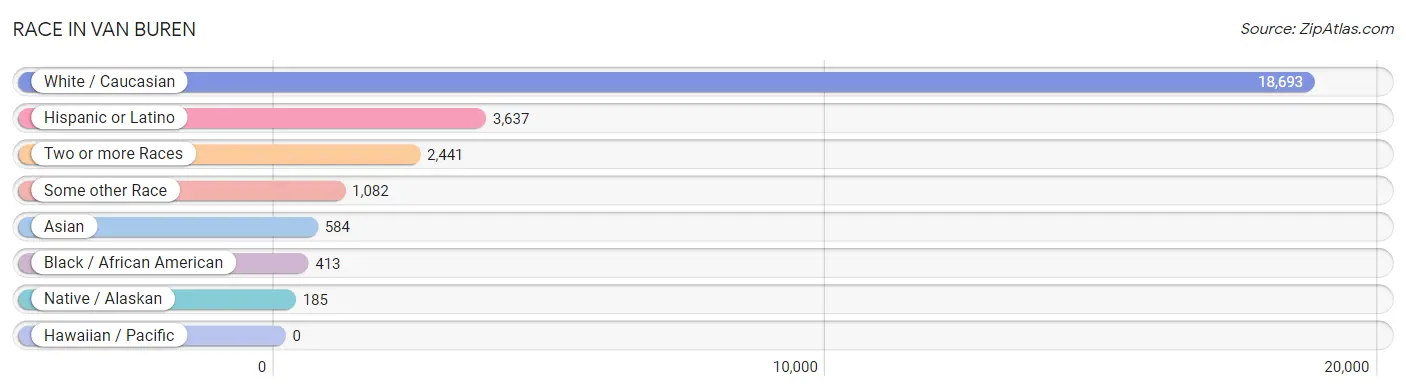
| Race | # Population | % Population |
| Asian | 584 | 2.5% |
| Black / African American | 413 | 1.8% |
| Hawaiian / Pacific | 0 | 0.0% |
| Hispanic or Latino | 3,637 | 15.5% |
| Native / Alaskan | 185 | 0.8% |
| White / Caucasian | 18,693 | 79.9% |
| Two or more Races | 2,441 | 10.4% |
| Some other Race | 1,082 | 4.6% |
| Total | 23,398 | 100.0% |
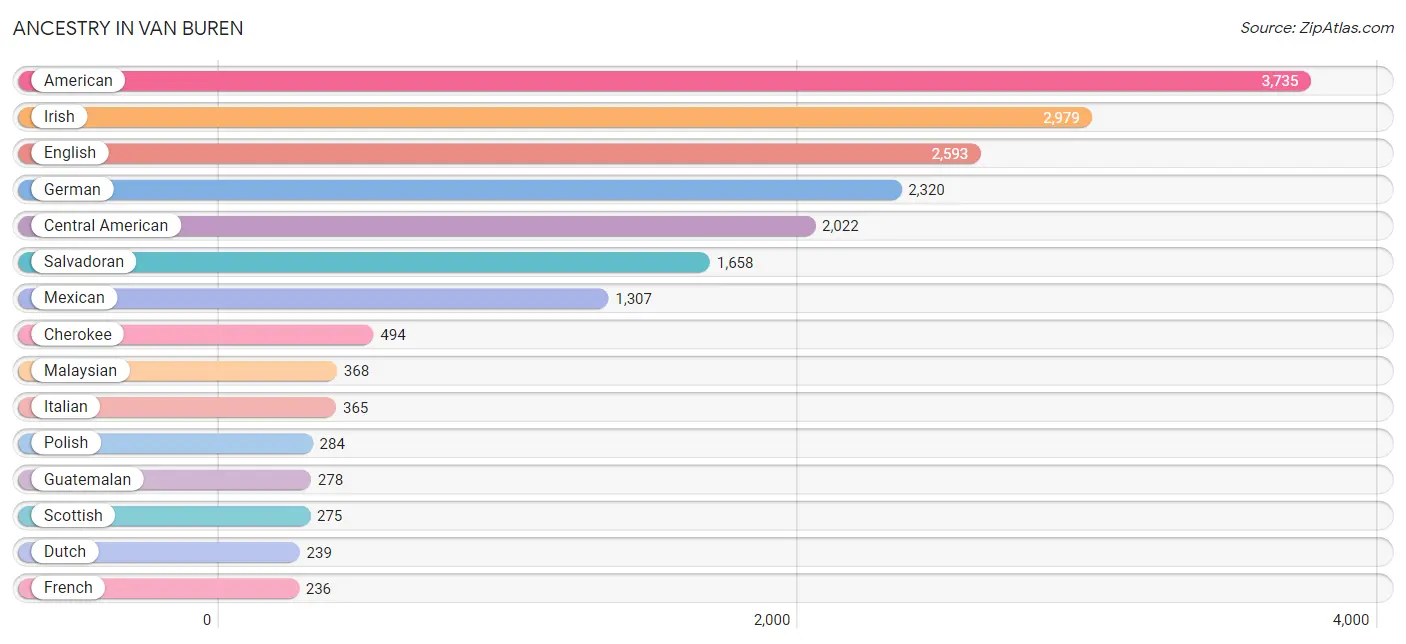
Ancestry in Van Buren
The most populous ancestries reported in Van Buren are American (3,735 | 16.0%), Irish (2,979 | 12.7%), English (2,593 | 11.1%), German (2,320 | 9.9%), and Central American (2,022 | 8.6%), together accounting for 58.3% of all Van Buren residents.
| Ancestry | # Population | % Population |
| Albanian | 8 | 0.0% |
| American | 3,735 | 16.0% |
| Arab | 164 | 0.7% |
| Armenian | 182 | 0.8% |
| Austrian | 21 | 0.1% |
| Belgian | 25 | 0.1% |
| Blackfeet | 19 | 0.1% |
| British | 178 | 0.8% |
| Burmese | 15 | 0.1% |
| Central American | 2,022 | 8.6% |
| Cherokee | 494 | 2.1% |
| Chickasaw | 10 | 0.0% |
| Choctaw | 90 | 0.4% |
| Creek | 10 | 0.0% |
| Cuban | 59 | 0.3% |
| Czech | 59 | 0.3% |
| Dutch | 239 | 1.0% |
| Eastern European | 20 | 0.1% |
| Egyptian | 132 | 0.6% |
| English | 2,593 | 11.1% |
| European | 173 | 0.7% |
| French | 236 | 1.0% |
| French Canadian | 120 | 0.5% |
| German | 2,320 | 9.9% |
| Greek | 87 | 0.4% |
| Guatemalan | 278 | 1.2% |
| Honduran | 66 | 0.3% |
| Indian (Asian) | 10 | 0.0% |
| Inupiat | 17 | 0.1% |
| Irish | 2,979 | 12.7% |
| Italian | 365 | 1.6% |
| Jordanian | 9 | 0.0% |
| Korean | 60 | 0.3% |
| Lebanese | 12 | 0.1% |
| Lithuanian | 8 | 0.0% |
| Malaysian | 368 | 1.6% |
| Mexican | 1,307 | 5.6% |
| Navajo | 20 | 0.1% |
| Nicaraguan | 20 | 0.1% |
| Northern European | 8 | 0.0% |
| Norwegian | 99 | 0.4% |
| Pakistani | 95 | 0.4% |
| Polish | 284 | 1.2% |
| Portuguese | 20 | 0.1% |
| Potawatomi | 7 | 0.0% |
| Pueblo | 1 | 0.0% |
| Puerto Rican | 89 | 0.4% |
| Russian | 25 | 0.1% |
| Salvadoran | 1,658 | 7.1% |
| Scandinavian | 24 | 0.1% |
| Scotch-Irish | 169 | 0.7% |
| Scottish | 275 | 1.2% |
| Senegalese | 132 | 0.6% |
| Sioux | 21 | 0.1% |
| Spaniard | 63 | 0.3% |
| Spanish | 46 | 0.2% |
| Sri Lankan | 58 | 0.3% |
| Subsaharan African | 132 | 0.6% |
| Swedish | 97 | 0.4% |
| Swiss | 58 | 0.3% |
| Ukrainian | 3 | 0.0% |
| Welsh | 111 | 0.5% | View All 62 Rows |
Immigrants in Van Buren
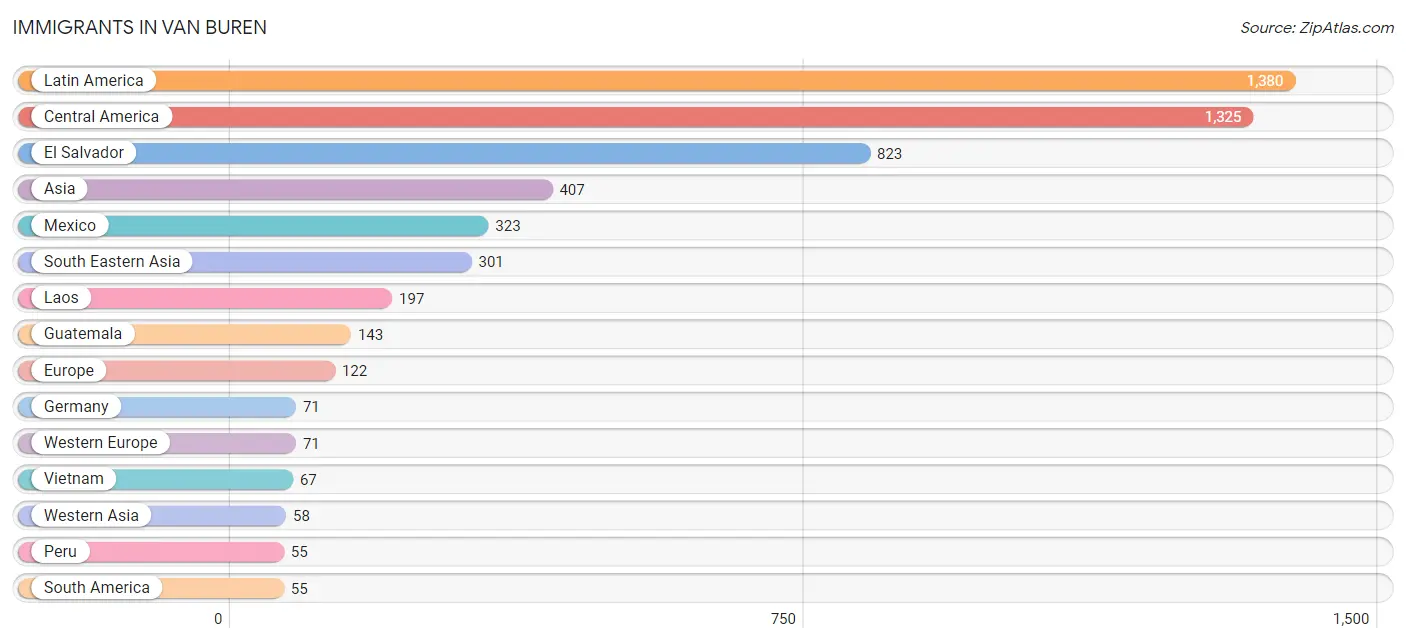
The most numerous immigrant groups reported in Van Buren came from Latin America (1,380 | 5.9%), Central America (1,325 | 5.7%), El Salvador (823 | 3.5%), Asia (407 | 1.7%), and Mexico (323 | 1.4%), together accounting for 18.2% of all Van Buren residents.
| Immigration Origin | # Population | % Population |
| Asia | 407 | 1.7% |
| Central America | 1,325 | 5.7% |
| China | 9 | 0.0% |
| Eastern Asia | 17 | 0.1% |
| Eastern Europe | 8 | 0.0% |
| El Salvador | 823 | 3.5% |
| Europe | 122 | 0.5% |
| Germany | 71 | 0.3% |
| Guatemala | 143 | 0.6% |
| Honduras | 36 | 0.2% |
| Jordan | 9 | 0.0% |
| Korea | 8 | 0.0% |
| Kuwait | 49 | 0.2% |
| Laos | 197 | 0.8% |
| Latin America | 1,380 | 5.9% |
| Mexico | 323 | 1.4% |
| Northern Europe | 43 | 0.2% |
| Pakistan | 31 | 0.1% |
| Peru | 55 | 0.2% |
| Philippines | 37 | 0.2% |
| South America | 55 | 0.2% |
| South Central Asia | 31 | 0.1% |
| South Eastern Asia | 301 | 1.3% |
| Taiwan | 5 | 0.0% |
| Vietnam | 67 | 0.3% |
| Western Asia | 58 | 0.3% |
| Western Europe | 71 | 0.3% | View All 27 Rows |
Sex and Age in Van Buren
Sex and Age in Van Buren
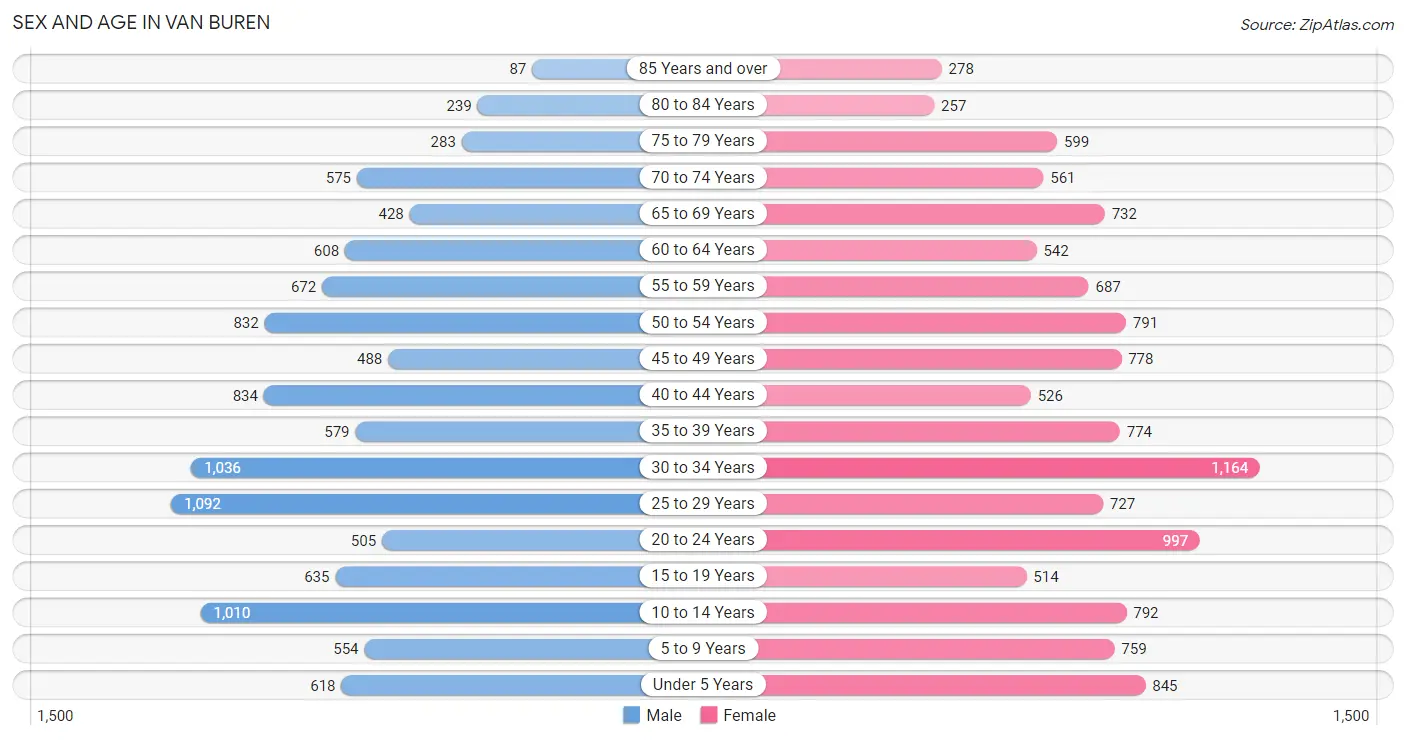
The most populous age groups in Van Buren are 25 to 29 Years (1,092 | 9.9%) for men and 30 to 34 Years (1,164 | 9.5%) for women.
| Age Bracket | Male | Female |
| Under 5 Years | 618 (5.6%) | 845 (6.9%) |
| 5 to 9 Years | 554 (5.0%) | 759 (6.2%) |
| 10 to 14 Years | 1,010 (9.1%) | 792 (6.4%) |
| 15 to 19 Years | 635 (5.7%) | 514 (4.2%) |
| 20 to 24 Years | 505 (4.6%) | 997 (8.1%) |
| 25 to 29 Years | 1,092 (9.9%) | 727 (5.9%) |
| 30 to 34 Years | 1,036 (9.3%) | 1,164 (9.5%) |
| 35 to 39 Years | 579 (5.2%) | 774 (6.3%) |
| 40 to 44 Years | 834 (7.5%) | 526 (4.3%) |
| 45 to 49 Years | 488 (4.4%) | 778 (6.3%) |
| 50 to 54 Years | 832 (7.5%) | 791 (6.4%) |
| 55 to 59 Years | 672 (6.1%) | 687 (5.6%) |
| 60 to 64 Years | 608 (5.5%) | 542 (4.4%) |
| 65 to 69 Years | 428 (3.9%) | 732 (5.9%) |
| 70 to 74 Years | 575 (5.2%) | 561 (4.5%) |
| 75 to 79 Years | 283 (2.6%) | 599 (4.9%) |
| 80 to 84 Years | 239 (2.2%) | 257 (2.1%) |
| 85 Years and over | 87 (0.8%) | 278 (2.3%) |
| Total | 11,075 (100.0%) | 12,323 (100.0%) |
Families and Households in Van Buren
Median Family Size in Van Buren
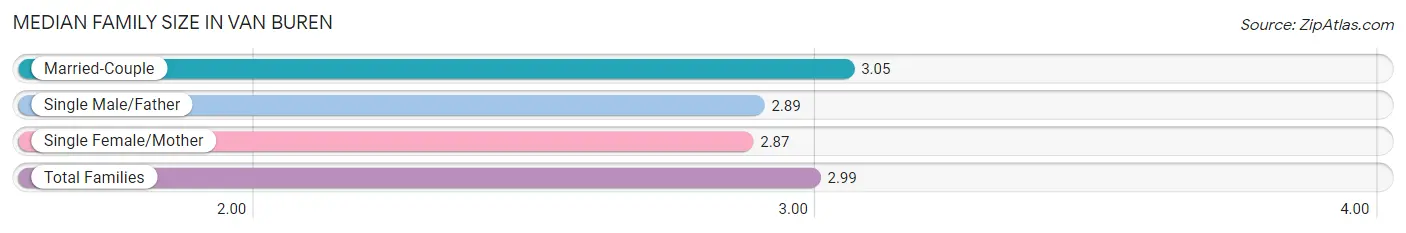
The median family size in Van Buren is 2.99 persons per family, with married-couple families (4,298 | 68.3%) accounting for the largest median family size of 3.05 persons per family. On the other hand, single female/mother families (1,362 | 21.6%) represent the smallest median family size with 2.87 persons per family.
| Family Type | # Families | Family Size |
| Married-Couple | 4,298 (68.3%) | 3.05 |
| Single Male/Father | 633 (10.1%) | 2.89 |
| Single Female/Mother | 1,362 (21.6%) | 2.87 |
| Total Families | 6,293 (100.0%) | 2.99 |
Median Household Size in Van Buren
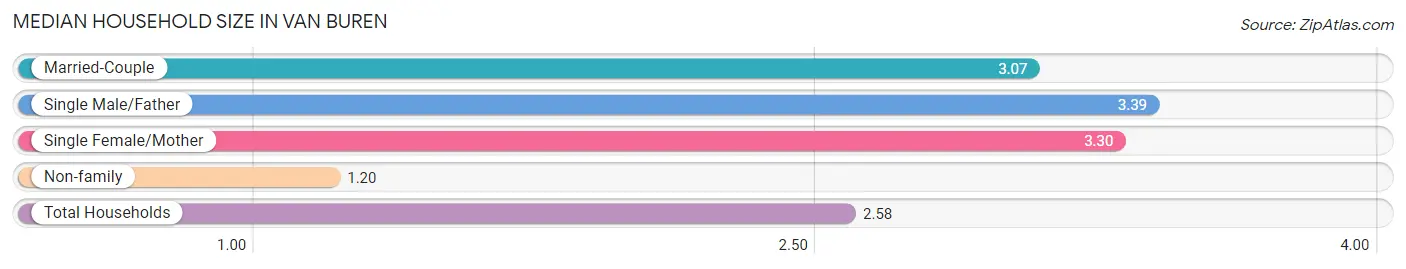
The median household size in Van Buren is 2.58 persons per household, with single male/father households (633 | 7.1%) accounting for the largest median household size of 3.39 persons per household. non-family households (2,630 | 29.5%) represent the smallest median household size with 1.20 persons per household.
| Household Type | # Households | Household Size |
| Married-Couple | 4,298 (48.2%) | 3.07 |
| Single Male/Father | 633 (7.1%) | 3.39 |
| Single Female/Mother | 1,362 (15.3%) | 3.30 |
| Non-family | 2,630 (29.5%) | 1.20 |
| Total Households | 8,923 (100.0%) | 2.58 |
Household Size by Marriage Status in Van Buren
Out of a total of 8,923 households in Van Buren, 6,293 (70.5%) are family households, while 2,630 (29.5%) are nonfamily households. The most numerous type of family households are 2-person households, comprising 2,791, and the most common type of nonfamily households are 1-person households, comprising 2,207.
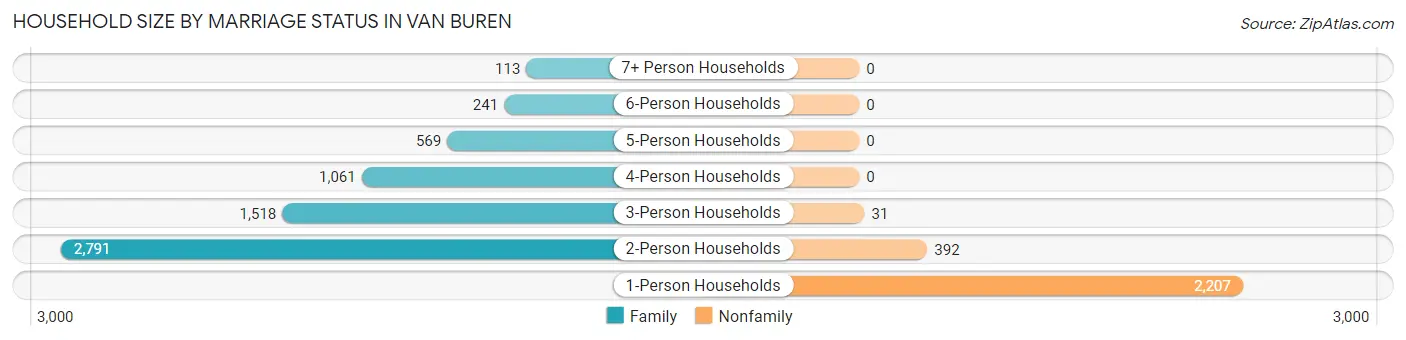
| Household Size | Family Households | Nonfamily Households |
| 1-Person Households | - | 2,207 (24.7%) |
| 2-Person Households | 2,791 (31.3%) | 392 (4.4%) |
| 3-Person Households | 1,518 (17.0%) | 31 (0.4%) |
| 4-Person Households | 1,061 (11.9%) | 0 (0.0%) |
| 5-Person Households | 569 (6.4%) | 0 (0.0%) |
| 6-Person Households | 241 (2.7%) | 0 (0.0%) |
| 7+ Person Households | 113 (1.3%) | 0 (0.0%) |
| Total | 6,293 (70.5%) | 2,630 (29.5%) |
Female Fertility in Van Buren
Fertility by Age in Van Buren
Average fertility rate in Van Buren is 91.0 births per 1,000 women. Women in the age bracket of 20 to 34 years have the highest fertility rate with 163.0 births per 1,000 women. Women in the age bracket of 20 to 34 years acount for 93.1% of all women with births.
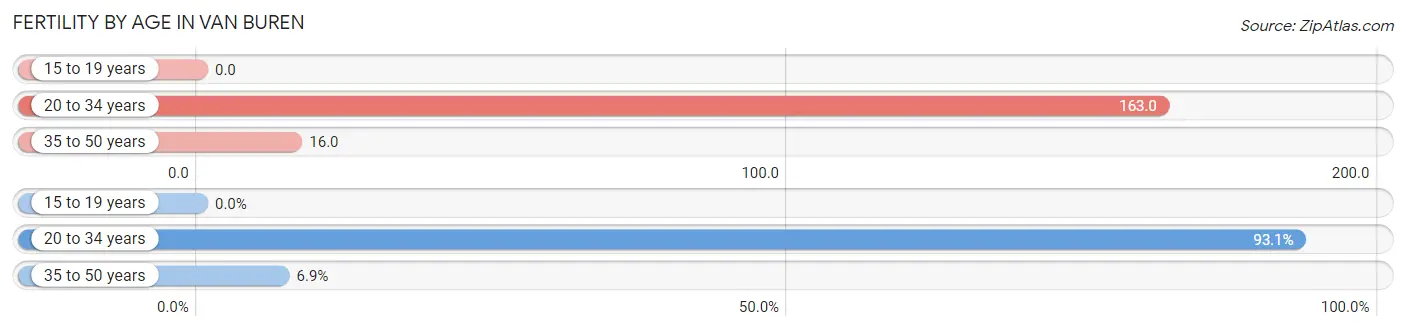
| Age Bracket | Women with Births | Births / 1,000 Women |
| 15 to 19 years | 0 (0.0%) | 0.0 |
| 20 to 34 years | 471 (93.1%) | 163.0 |
| 35 to 50 years | 35 (6.9%) | 16.0 |
| Total | 506 (100.0%) | 91.0 |
Fertility by Age by Marriage Status in Van Buren
43.1% of women with births (506) in Van Buren are married. The highest percentage of unmarried women with births falls into 20 to 34 years age bracket with 61.2% of them unmarried at the time of birth, while the lowest percentage of unmarried women with births belong to 35 to 50 years age bracket with 0.0% of them unmarried.
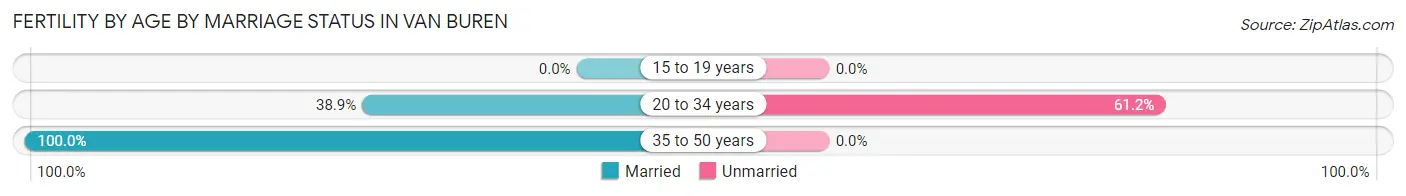
| Age Bracket | Married | Unmarried |
| 15 to 19 years | 0 (0.0%) | 0 (0.0%) |
| 20 to 34 years | 183 (38.9%) | 288 (61.2%) |
| 35 to 50 years | 35 (100.0%) | 0 (0.0%) |
| Total | 218 (43.1%) | 288 (56.9%) |
Fertility by Education in Van Buren
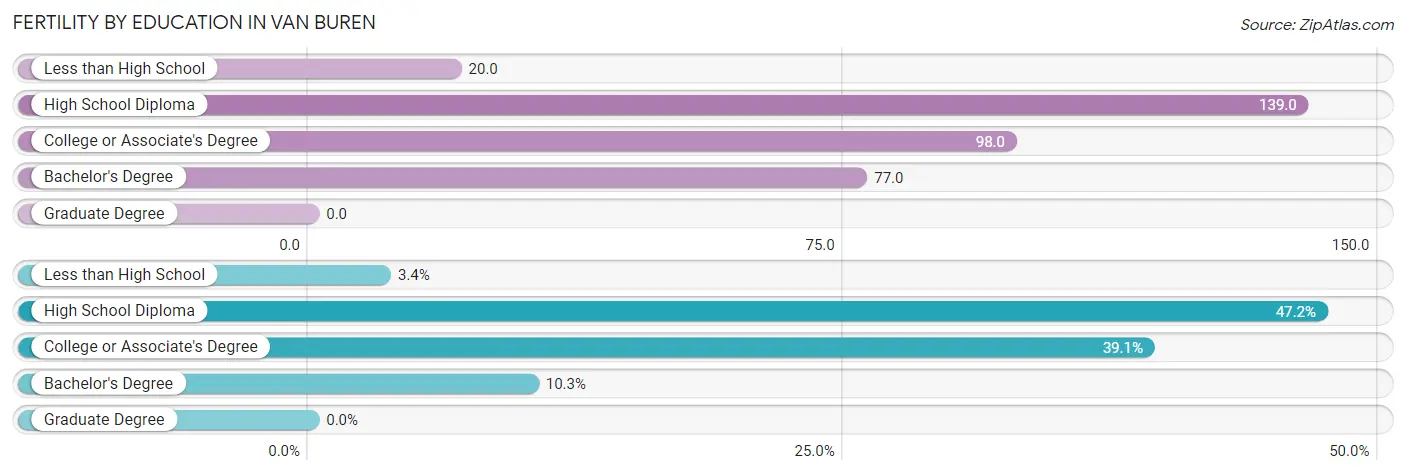
| Educational Attainment | Women with Births | Births / 1,000 Women |
| Less than High School | 17 (3.4%) | 20.0 |
| High School Diploma | 239 (47.2%) | 139.0 |
| College or Associate's Degree | 198 (39.1%) | 98.0 |
| Bachelor's Degree | 52 (10.3%) | 77.0 |
| Graduate Degree | 0 (0.0%) | 0.0 |
| Total | 506 (100.0%) | 91.0 |
Fertility by Education by Marriage Status in Van Buren
56.9% of women with births in Van Buren are unmarried. Women with the educational attainment of bachelor's degree are most likely to be married with 100.0% of them married at childbirth, while women with the educational attainment of less than high school are least likely to be married with 70.6% of them unmarried at childbirth.
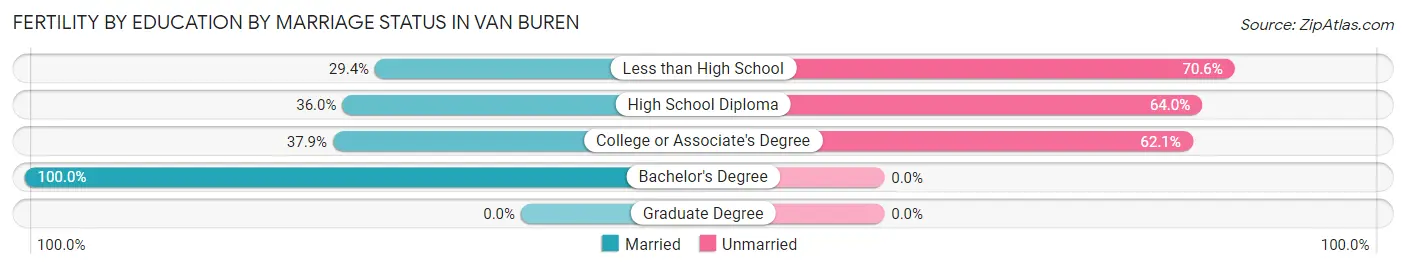
| Educational Attainment | Married | Unmarried |
| Less than High School | 5 (29.4%) | 12 (70.6%) |
| High School Diploma | 86 (36.0%) | 153 (64.0%) |
| College or Associate's Degree | 75 (37.9%) | 123 (62.1%) |
| Bachelor's Degree | 52 (100.0%) | 0 (0.0%) |
| Graduate Degree | 0 (0.0%) | 0 (0.0%) |
| Total | 218 (43.1%) | 288 (56.9%) |
Employment Characteristics in Van Buren
Employment by Class of Employer in Van Buren
Among the 9,578 employed individuals in Van Buren, private company employees (7,002 | 73.1%), not-for-profit organizations (698 | 7.3%), and local government employees (488 | 5.1%) make up the most common classes of employment.
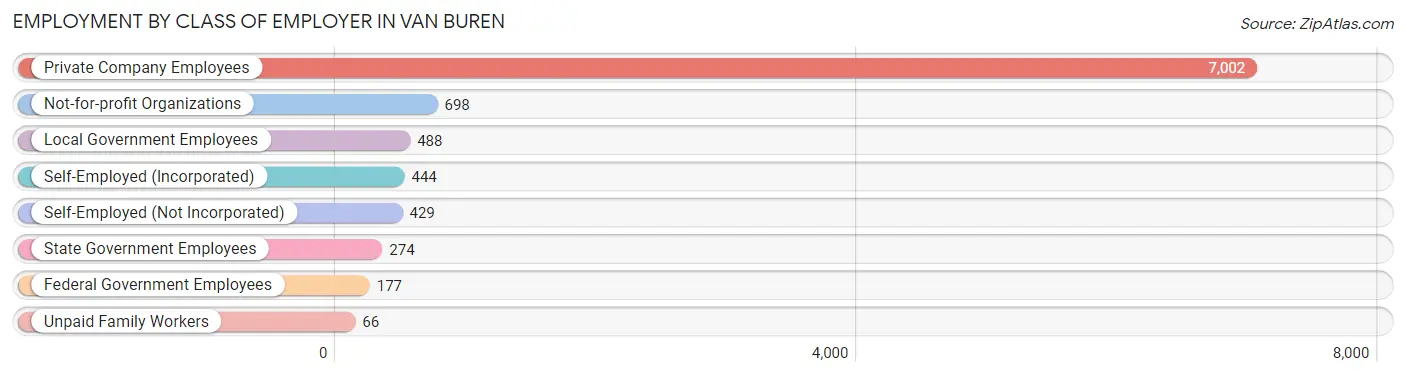
| Employer Class | # Employees | % Employees |
| Private Company Employees | 7,002 | 73.1% |
| Self-Employed (Incorporated) | 444 | 4.6% |
| Self-Employed (Not Incorporated) | 429 | 4.5% |
| Not-for-profit Organizations | 698 | 7.3% |
| Local Government Employees | 488 | 5.1% |
| State Government Employees | 274 | 2.9% |
| Federal Government Employees | 177 | 1.8% |
| Unpaid Family Workers | 66 | 0.7% |
| Total | 9,578 | 100.0% |
Employment Status by Age in Van Buren
According to the labor force statistics for Van Buren, out of the total population over 16 years of age (18,494), 58.4% or 10,800 individuals are in the labor force, with 7.9% or 853 of them unemployed. The age group with the highest labor force participation rate is 35 to 44 years, with 83.5% or 2,265 individuals in the labor force. Within the labor force, the 16 to 19 years age range has the highest percentage of unemployed individuals, with 17.0% or 61 of them being unemployed.
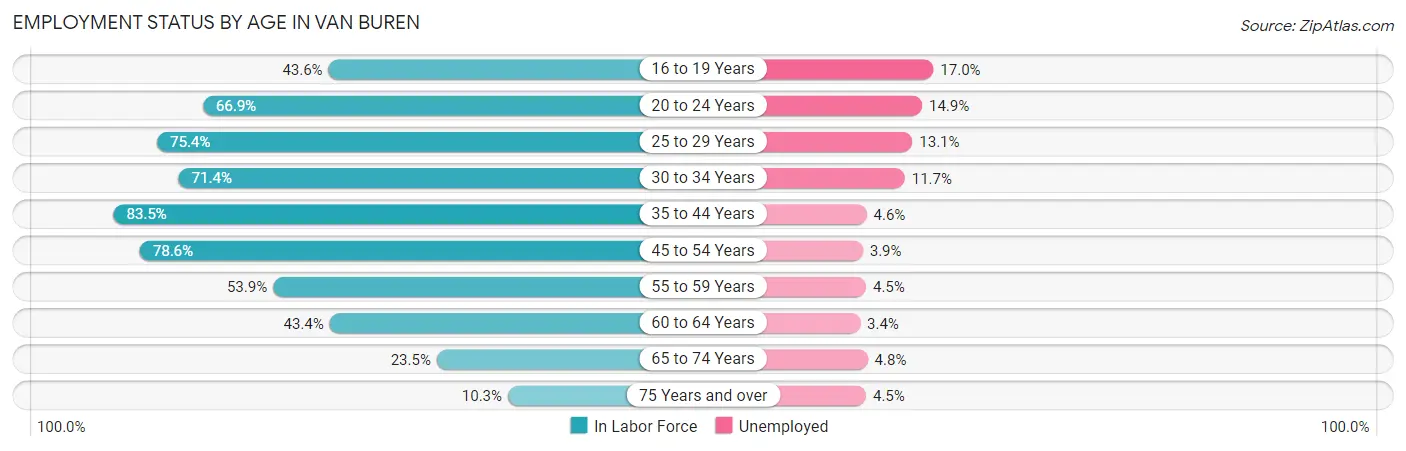
| Age Bracket | In Labor Force | Unemployed |
| 16 to 19 Years | 359 (43.6%) | 61 (17.0%) |
| 20 to 24 Years | 1,005 (66.9%) | 150 (14.9%) |
| 25 to 29 Years | 1,372 (75.4%) | 180 (13.1%) |
| 30 to 34 Years | 1,571 (71.4%) | 184 (11.7%) |
| 35 to 44 Years | 2,265 (83.5%) | 104 (4.6%) |
| 45 to 54 Years | 2,271 (78.6%) | 89 (3.9%) |
| 55 to 59 Years | 733 (53.9%) | 33 (4.5%) |
| 60 to 64 Years | 499 (43.4%) | 17 (3.4%) |
| 65 to 74 Years | 540 (23.5%) | 26 (4.8%) |
| 75 Years and over | 180 (10.3%) | 8 (4.5%) |
| Total | 10,800 (58.4%) | 853 (7.9%) |
Employment Status by Educational Attainment in Van Buren
According to labor force statistics for Van Buren, 71.8% of individuals (8,709) out of the total population between 25 and 64 years of age (12,130) are in the labor force, with 6.9% or 601 of them being unemployed. The group with the highest labor force participation rate are those with the educational attainment of bachelor's degree or higher, with 87.2% or 1,987 individuals in the labor force. Within the labor force, individuals with less than high school education have the highest percentage of unemployment, with 13.8% or 159 of them being unemployed.
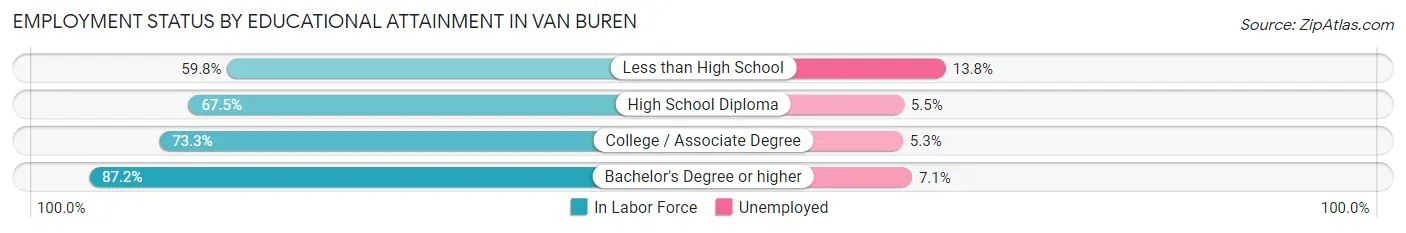
| Educational Attainment | In Labor Force | Unemployed |
| Less than High School | 1,149 (59.8%) | 265 (13.8%) |
| High School Diploma | 2,764 (67.5%) | 225 (5.5%) |
| College / Associate Degree | 2,811 (73.3%) | 203 (5.3%) |
| Bachelor's Degree or higher | 1,987 (87.2%) | 162 (7.1%) |
| Total | 8,709 (71.8%) | 837 (6.9%) |
Employment Occupations by Sex in Van Buren
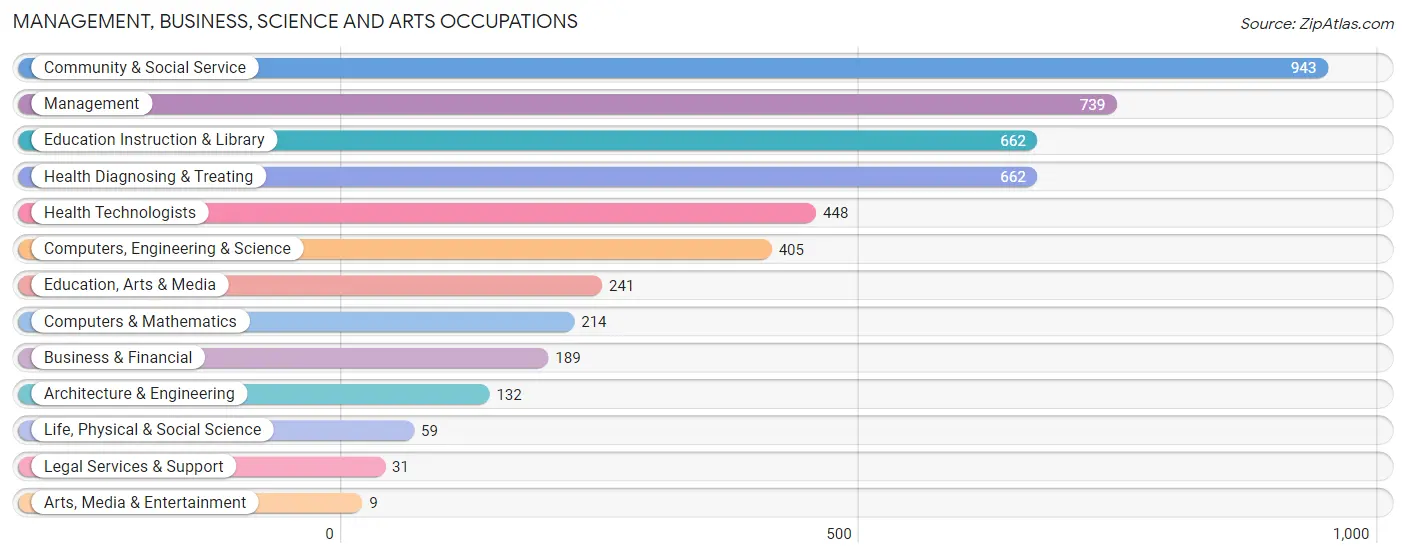
Management, Business, Science and Arts Occupations
The most common Management, Business, Science and Arts occupations in Van Buren are Community & Social Service (943 | 9.5%), Management (739 | 7.4%), Education Instruction & Library (662 | 6.7%), Health Diagnosing & Treating (662 | 6.7%), and Health Technologists (448 | 4.5%).
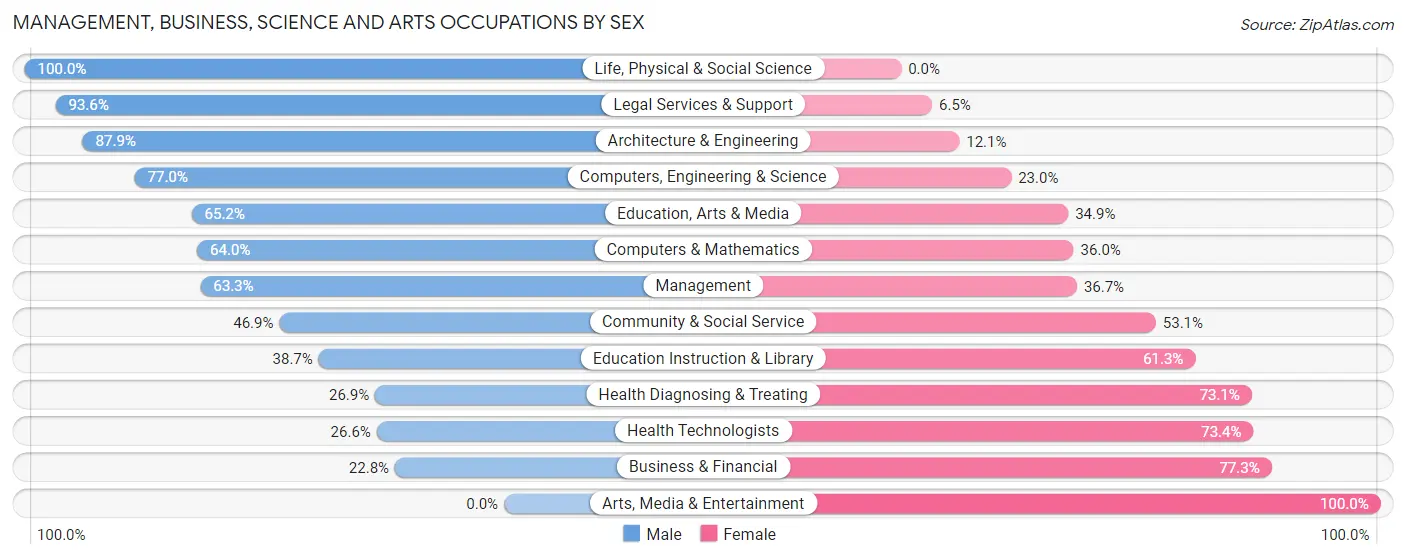
Management, Business, Science and Arts Occupations by Sex
Within the Management, Business, Science and Arts occupations in Van Buren, the most male-oriented occupations are Life, Physical & Social Science (100.0%), Legal Services & Support (93.5%), and Architecture & Engineering (87.9%), while the most female-oriented occupations are Arts, Media & Entertainment (100.0%), Business & Financial (77.2%), and Health Technologists (73.4%).
| Occupation | Male | Female |
| Management | 468 (63.3%) | 271 (36.7%) |
| Business & Financial | 43 (22.8%) | 146 (77.2%) |
| Computers, Engineering & Science | 312 (77.0%) | 93 (23.0%) |
| Computers & Mathematics | 137 (64.0%) | 77 (36.0%) |
| Architecture & Engineering | 116 (87.9%) | 16 (12.1%) |
| Life, Physical & Social Science | 59 (100.0%) | 0 (0.0%) |
| Community & Social Service | 442 (46.9%) | 501 (53.1%) |
| Education, Arts & Media | 157 (65.1%) | 84 (34.8%) |
| Legal Services & Support | 29 (93.5%) | 2 (6.5%) |
| Education Instruction & Library | 256 (38.7%) | 406 (61.3%) |
| Arts, Media & Entertainment | 0 (0.0%) | 9 (100.0%) |
| Health Diagnosing & Treating | 178 (26.9%) | 484 (73.1%) |
| Health Technologists | 119 (26.6%) | 329 (73.4%) |
| Total (Category) | 1,443 (49.1%) | 1,495 (50.9%) |
| Total (Overall) | 5,436 (54.8%) | 4,490 (45.2%) |
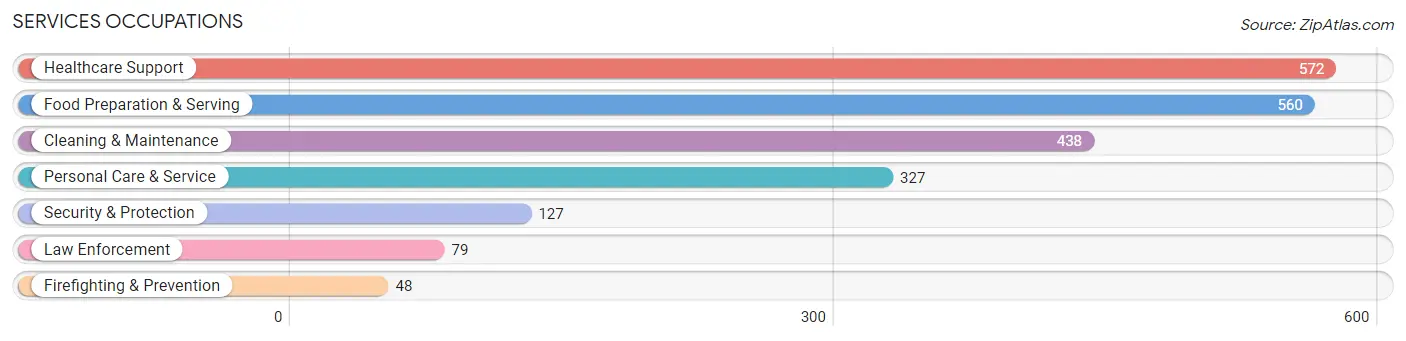
Services Occupations
The most common Services occupations in Van Buren are Healthcare Support (572 | 5.8%), Food Preparation & Serving (560 | 5.6%), Cleaning & Maintenance (438 | 4.4%), Personal Care & Service (327 | 3.3%), and Security & Protection (127 | 1.3%).
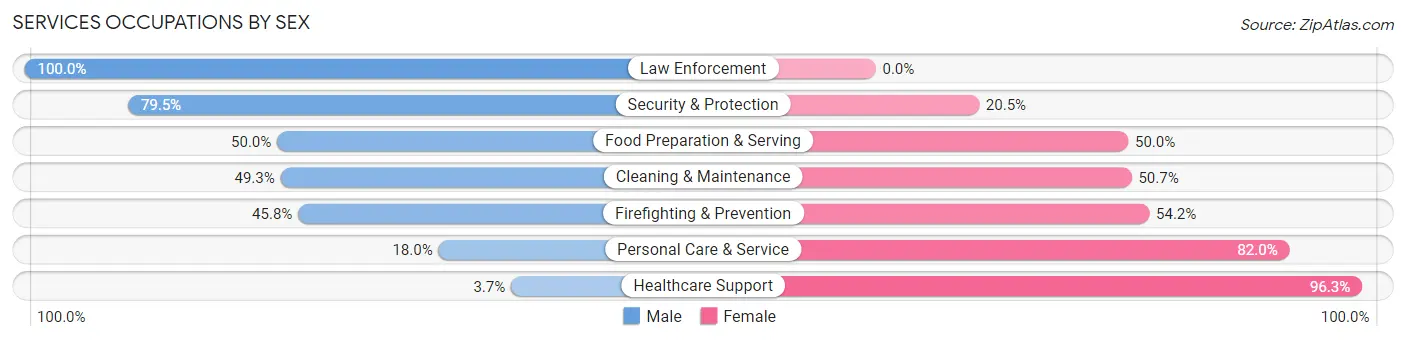
Services Occupations by Sex
Within the Services occupations in Van Buren, the most male-oriented occupations are Law Enforcement (100.0%), Security & Protection (79.5%), and Food Preparation & Serving (50.0%), while the most female-oriented occupations are Healthcare Support (96.3%), Personal Care & Service (82.0%), and Firefighting & Prevention (54.2%).
| Occupation | Male | Female |
| Healthcare Support | 21 (3.7%) | 551 (96.3%) |
| Security & Protection | 101 (79.5%) | 26 (20.5%) |
| Firefighting & Prevention | 22 (45.8%) | 26 (54.2%) |
| Law Enforcement | 79 (100.0%) | 0 (0.0%) |
| Food Preparation & Serving | 280 (50.0%) | 280 (50.0%) |
| Cleaning & Maintenance | 216 (49.3%) | 222 (50.7%) |
| Personal Care & Service | 59 (18.0%) | 268 (82.0%) |
| Total (Category) | 677 (33.5%) | 1,347 (66.5%) |
| Total (Overall) | 5,436 (54.8%) | 4,490 (45.2%) |
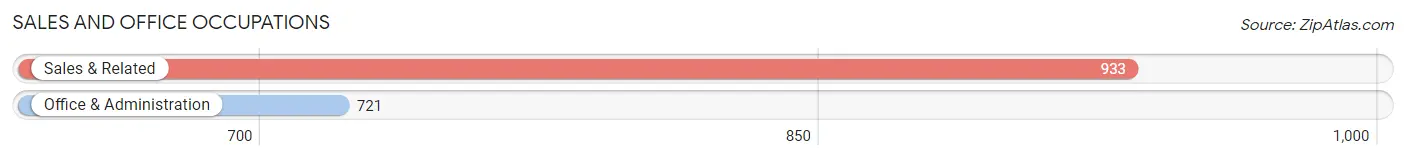
Sales and Office Occupations
The most common Sales and Office occupations in Van Buren are Sales & Related (933 | 9.4%), and Office & Administration (721 | 7.3%).
Sales and Office Occupations by Sex
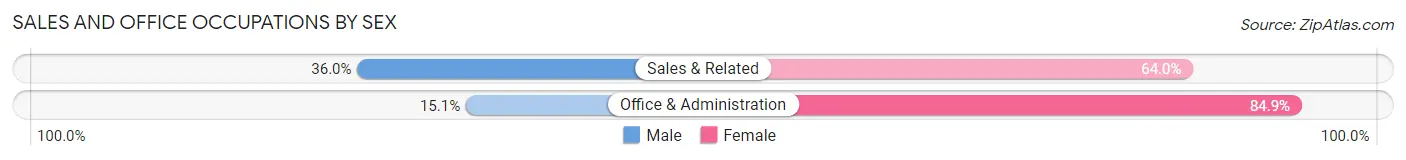
| Occupation | Male | Female |
| Sales & Related | 336 (36.0%) | 597 (64.0%) |
| Office & Administration | 109 (15.1%) | 612 (84.9%) |
| Total (Category) | 445 (26.9%) | 1,209 (73.1%) |
| Total (Overall) | 5,436 (54.8%) | 4,490 (45.2%) |
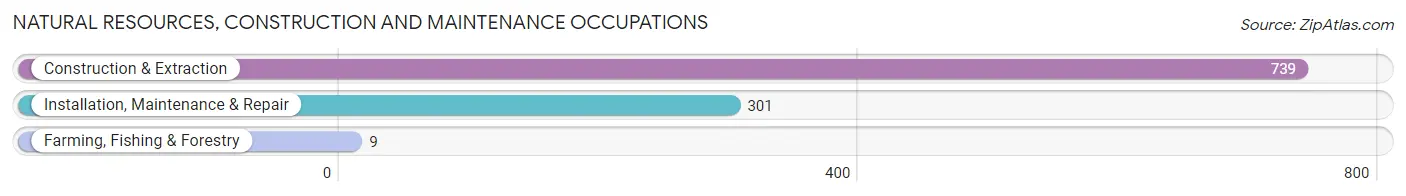
Natural Resources, Construction and Maintenance Occupations
The most common Natural Resources, Construction and Maintenance occupations in Van Buren are Construction & Extraction (739 | 7.4%), Installation, Maintenance & Repair (301 | 3.0%), and Farming, Fishing & Forestry (9 | 0.1%).
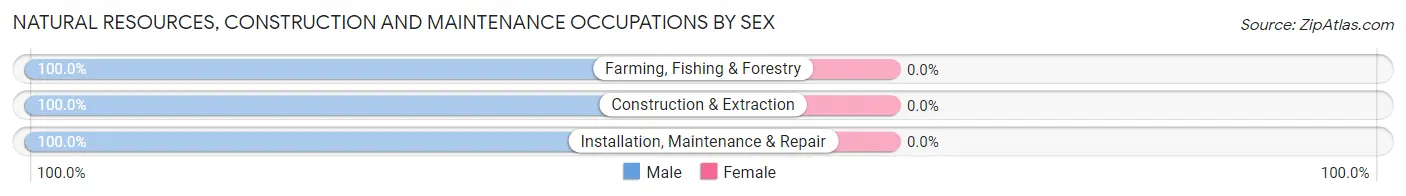
Natural Resources, Construction and Maintenance Occupations by Sex
| Occupation | Male | Female |
| Farming, Fishing & Forestry | 9 (100.0%) | 0 (0.0%) |
| Construction & Extraction | 739 (100.0%) | 0 (0.0%) |
| Installation, Maintenance & Repair | 301 (100.0%) | 0 (0.0%) |
| Total (Category) | 1,049 (100.0%) | 0 (0.0%) |
| Total (Overall) | 5,436 (54.8%) | 4,490 (45.2%) |
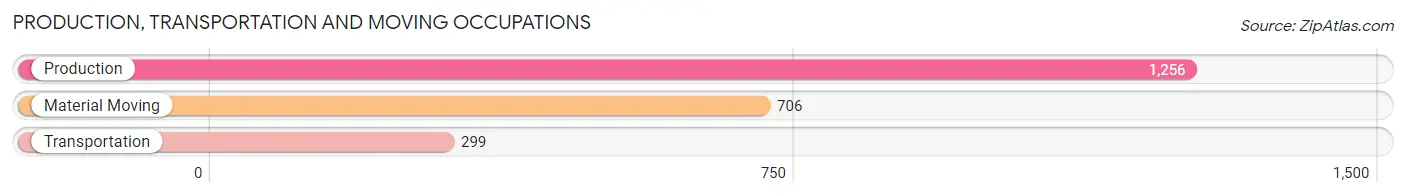
Production, Transportation and Moving Occupations
The most common Production, Transportation and Moving occupations in Van Buren are Production (1,256 | 12.7%), Material Moving (706 | 7.1%), and Transportation (299 | 3.0%).
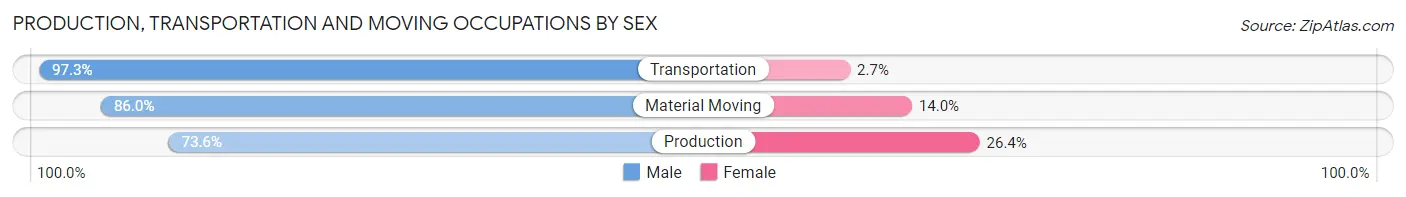
Production, Transportation and Moving Occupations by Sex
| Occupation | Male | Female |
| Production | 924 (73.6%) | 332 (26.4%) |
| Transportation | 291 (97.3%) | 8 (2.7%) |
| Material Moving | 607 (86.0%) | 99 (14.0%) |
| Total (Category) | 1,822 (80.6%) | 439 (19.4%) |
| Total (Overall) | 5,436 (54.8%) | 4,490 (45.2%) |
Employment Industries by Sex in Van Buren
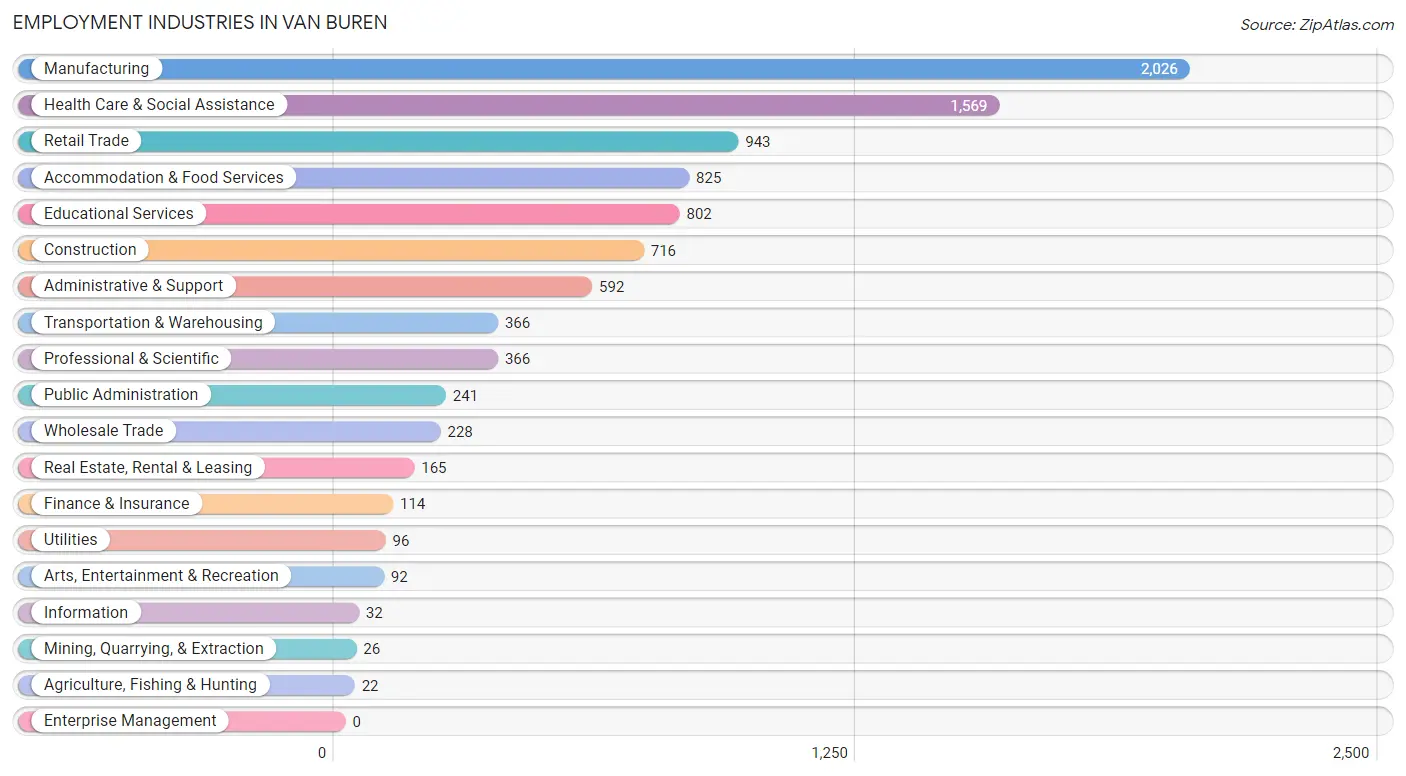
Employment Industries in Van Buren
The major employment industries in Van Buren include Manufacturing (2,026 | 20.4%), Health Care & Social Assistance (1,569 | 15.8%), Retail Trade (943 | 9.5%), Accommodation & Food Services (825 | 8.3%), and Educational Services (802 | 8.1%).
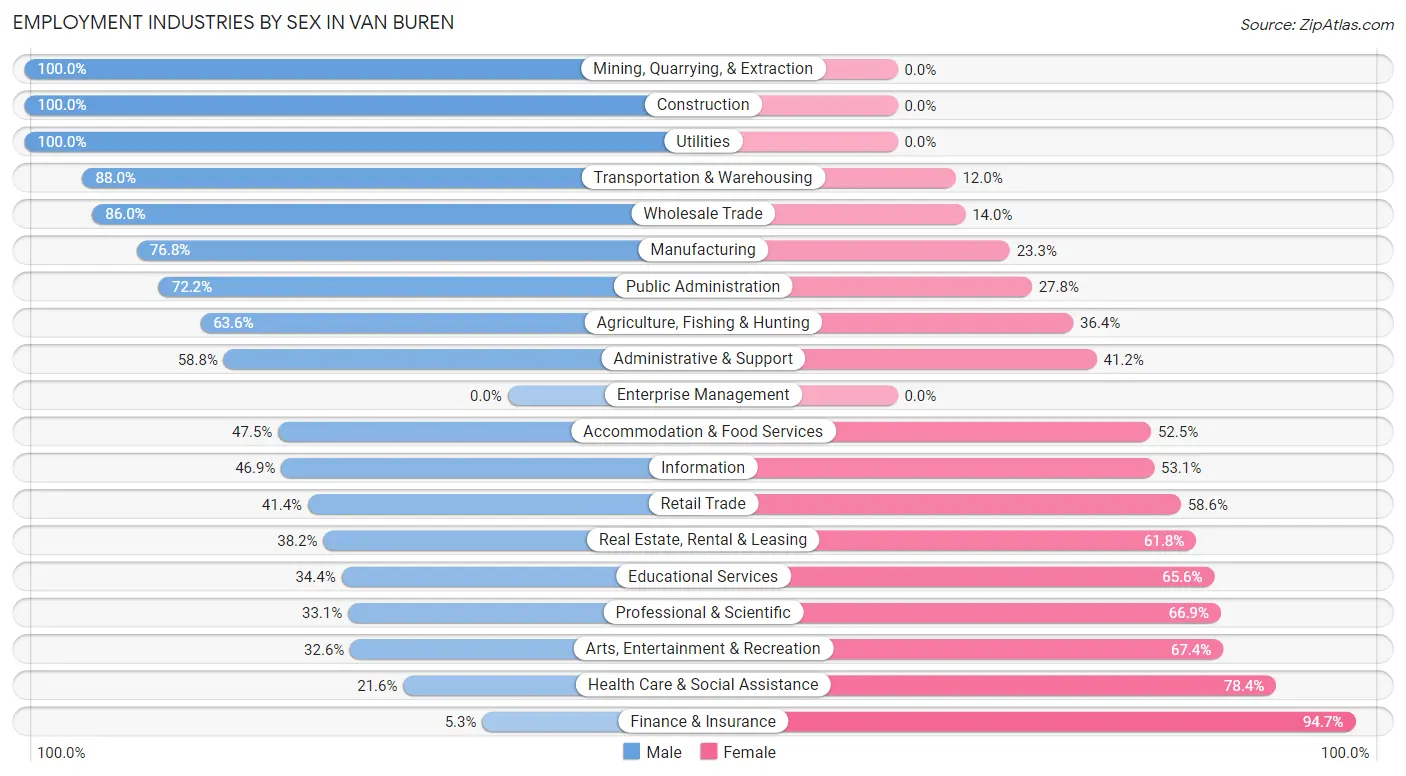
Employment Industries by Sex in Van Buren
The Van Buren industries that see more men than women are Mining, Quarrying, & Extraction (100.0%), Construction (100.0%), and Utilities (100.0%), whereas the industries that tend to have a higher number of women are Finance & Insurance (94.7%), Health Care & Social Assistance (78.4%), and Arts, Entertainment & Recreation (67.4%).
| Industry | Male | Female |
| Agriculture, Fishing & Hunting | 14 (63.6%) | 8 (36.4%) |
| Mining, Quarrying, & Extraction | 26 (100.0%) | 0 (0.0%) |
| Construction | 716 (100.0%) | 0 (0.0%) |
| Manufacturing | 1,555 (76.7%) | 471 (23.3%) |
| Wholesale Trade | 196 (86.0%) | 32 (14.0%) |
| Retail Trade | 390 (41.4%) | 553 (58.6%) |
| Transportation & Warehousing | 322 (88.0%) | 44 (12.0%) |
| Utilities | 96 (100.0%) | 0 (0.0%) |
| Information | 15 (46.9%) | 17 (53.1%) |
| Finance & Insurance | 6 (5.3%) | 108 (94.7%) |
| Real Estate, Rental & Leasing | 63 (38.2%) | 102 (61.8%) |
| Professional & Scientific | 121 (33.1%) | 245 (66.9%) |
| Enterprise Management | 0 (0.0%) | 0 (0.0%) |
| Administrative & Support | 348 (58.8%) | 244 (41.2%) |
| Educational Services | 276 (34.4%) | 526 (65.6%) |
| Health Care & Social Assistance | 339 (21.6%) | 1,230 (78.4%) |
| Arts, Entertainment & Recreation | 30 (32.6%) | 62 (67.4%) |
| Accommodation & Food Services | 392 (47.5%) | 433 (52.5%) |
| Public Administration | 174 (72.2%) | 67 (27.8%) |
| Total | 5,436 (54.8%) | 4,490 (45.2%) |
Education in Van Buren
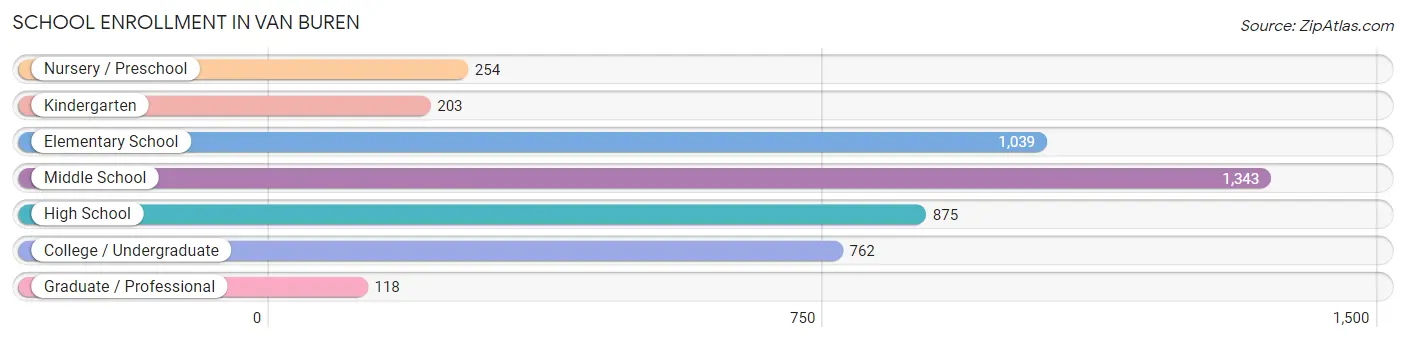
School Enrollment in Van Buren
The most common levels of schooling among the 4,594 students in Van Buren are middle school (1,343 | 29.2%), elementary school (1,039 | 22.6%), and high school (875 | 19.1%).
| School Level | # Students | % Students |
| Nursery / Preschool | 254 | 5.5% |
| Kindergarten | 203 | 4.4% |
| Elementary School | 1,039 | 22.6% |
| Middle School | 1,343 | 29.2% |
| High School | 875 | 19.1% |
| College / Undergraduate | 762 | 16.6% |
| Graduate / Professional | 118 | 2.6% |
| Total | 4,594 | 100.0% |
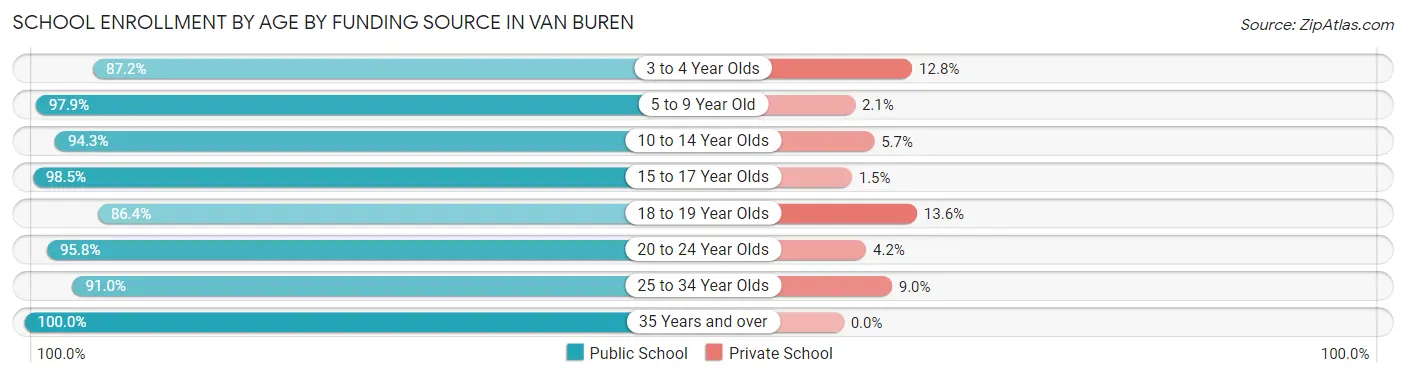
School Enrollment by Age by Funding Source in Van Buren
Out of a total of 4,594 students who are enrolled in schools in Van Buren, 225 (4.9%) attend a private institution, while the remaining 4,369 (95.1%) are enrolled in public schools. The age group of 18 to 19 year olds has the highest likelihood of being enrolled in private schools, with 33 (13.6% in the age bracket) enrolled. Conversely, the age group of 35 years and over has the lowest likelihood of being enrolled in a private school, with 109 (100.0% in the age bracket) attending a public institution.
| Age Bracket | Public School | Private School |
| 3 to 4 Year Olds | 171 (87.2%) | 25 (12.8%) |
| 5 to 9 Year Old | 1,158 (97.9%) | 25 (2.1%) |
| 10 to 14 Year Olds | 1,458 (94.3%) | 88 (5.7%) |
| 15 to 17 Year Olds | 651 (98.5%) | 10 (1.5%) |
| 18 to 19 Year Olds | 209 (86.4%) | 33 (13.6%) |
| 20 to 24 Year Olds | 298 (95.8%) | 13 (4.2%) |
| 25 to 34 Year Olds | 315 (91.0%) | 31 (9.0%) |
| 35 Years and over | 109 (100.0%) | 0 (0.0%) |
| Total | 4,369 (95.1%) | 225 (4.9%) |
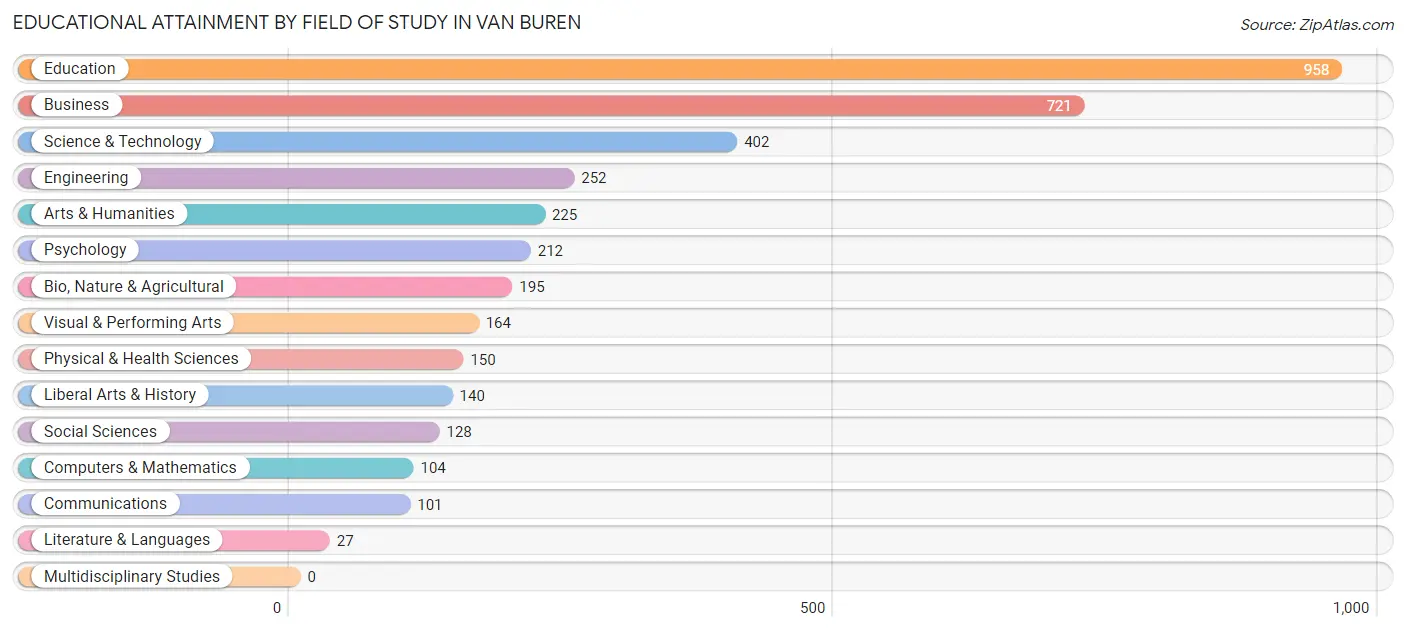
Educational Attainment by Field of Study in Van Buren
Education (958 | 25.4%), business (721 | 19.1%), science & technology (402 | 10.6%), engineering (252 | 6.7%), and arts & humanities (225 | 5.9%) are the most common fields of study among 3,779 individuals in Van Buren who have obtained a bachelor's degree or higher.
| Field of Study | # Graduates | % Graduates |
| Computers & Mathematics | 104 | 2.8% |
| Bio, Nature & Agricultural | 195 | 5.2% |
| Physical & Health Sciences | 150 | 4.0% |
| Psychology | 212 | 5.6% |
| Social Sciences | 128 | 3.4% |
| Engineering | 252 | 6.7% |
| Multidisciplinary Studies | 0 | 0.0% |
| Science & Technology | 402 | 10.6% |
| Business | 721 | 19.1% |
| Education | 958 | 25.4% |
| Literature & Languages | 27 | 0.7% |
| Liberal Arts & History | 140 | 3.7% |
| Visual & Performing Arts | 164 | 4.3% |
| Communications | 101 | 2.7% |
| Arts & Humanities | 225 | 5.9% |
| Total | 3,779 | 100.0% |
Transportation & Commute in Van Buren
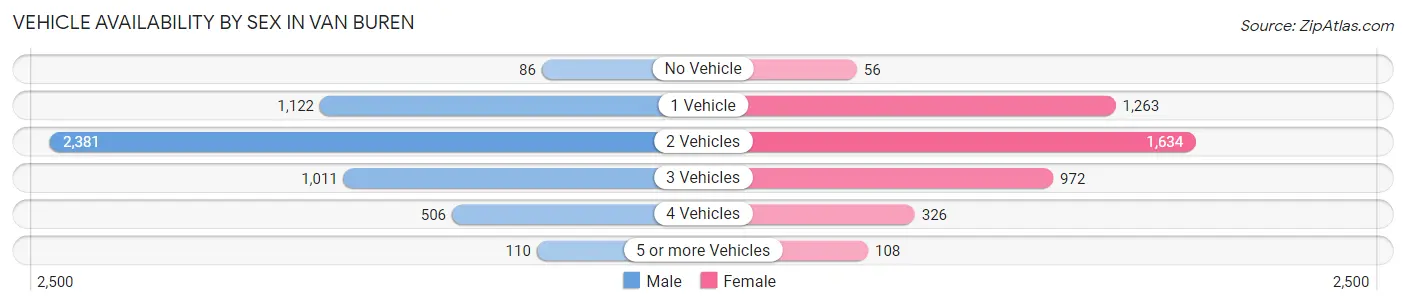
Vehicle Availability by Sex in Van Buren
The most prevalent vehicle ownership categories in Van Buren are males with 2 vehicles (2,381, accounting for 45.7%) and females with 2 vehicles (1,634, making up 54.6%).
| Vehicles Available | Male | Female |
| No Vehicle | 86 (1.7%) | 56 (1.3%) |
| 1 Vehicle | 1,122 (21.5%) | 1,263 (29.0%) |
| 2 Vehicles | 2,381 (45.7%) | 1,634 (37.5%) |
| 3 Vehicles | 1,011 (19.4%) | 972 (22.3%) |
| 4 Vehicles | 506 (9.7%) | 326 (7.5%) |
| 5 or more Vehicles | 110 (2.1%) | 108 (2.5%) |
| Total | 5,216 (100.0%) | 4,359 (100.0%) |
Commute Time in Van Buren
The most frequently occuring commute durations in Van Buren are 20 to 24 minutes (1,942 commuters, 21.0%), 10 to 14 minutes (1,708 commuters, 18.4%), and 15 to 19 minutes (1,648 commuters, 17.8%).
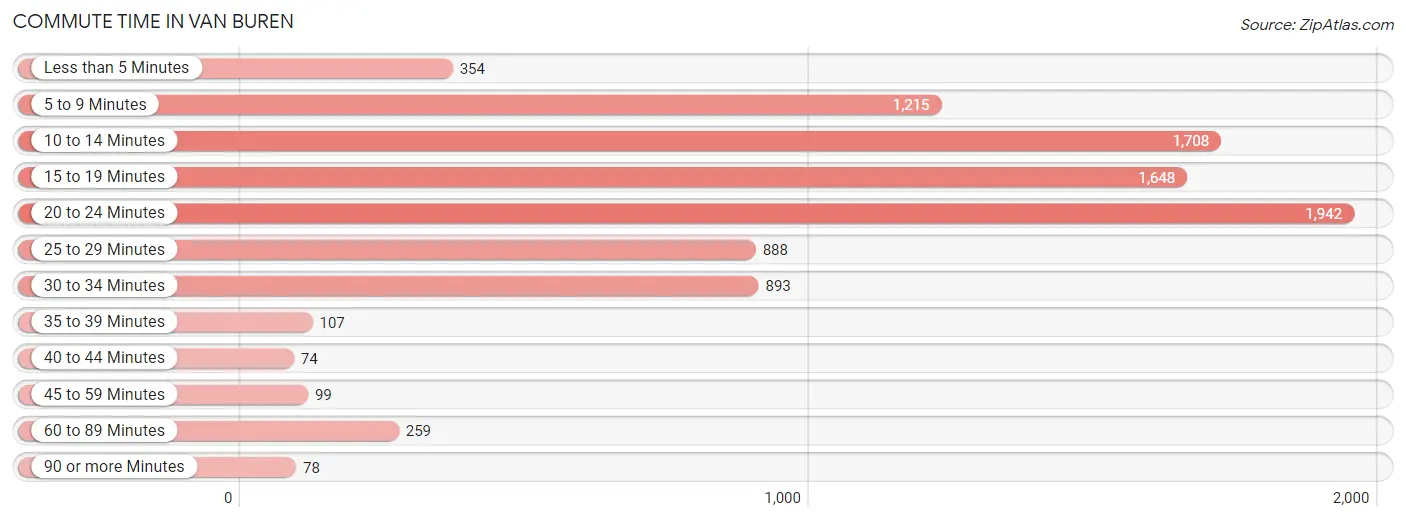
| Commute Time | # Commuters | % Commuters |
| Less than 5 Minutes | 354 | 3.8% |
| 5 to 9 Minutes | 1,215 | 13.1% |
| 10 to 14 Minutes | 1,708 | 18.4% |
| 15 to 19 Minutes | 1,648 | 17.8% |
| 20 to 24 Minutes | 1,942 | 21.0% |
| 25 to 29 Minutes | 888 | 9.6% |
| 30 to 34 Minutes | 893 | 9.6% |
| 35 to 39 Minutes | 107 | 1.1% |
| 40 to 44 Minutes | 74 | 0.8% |
| 45 to 59 Minutes | 99 | 1.1% |
| 60 to 89 Minutes | 259 | 2.8% |
| 90 or more Minutes | 78 | 0.8% |
Commute Time by Sex in Van Buren
The most common commute times in Van Buren are 20 to 24 minutes (968 commuters, 18.9%) for males and 20 to 24 minutes (974 commuters, 23.5%) for females.
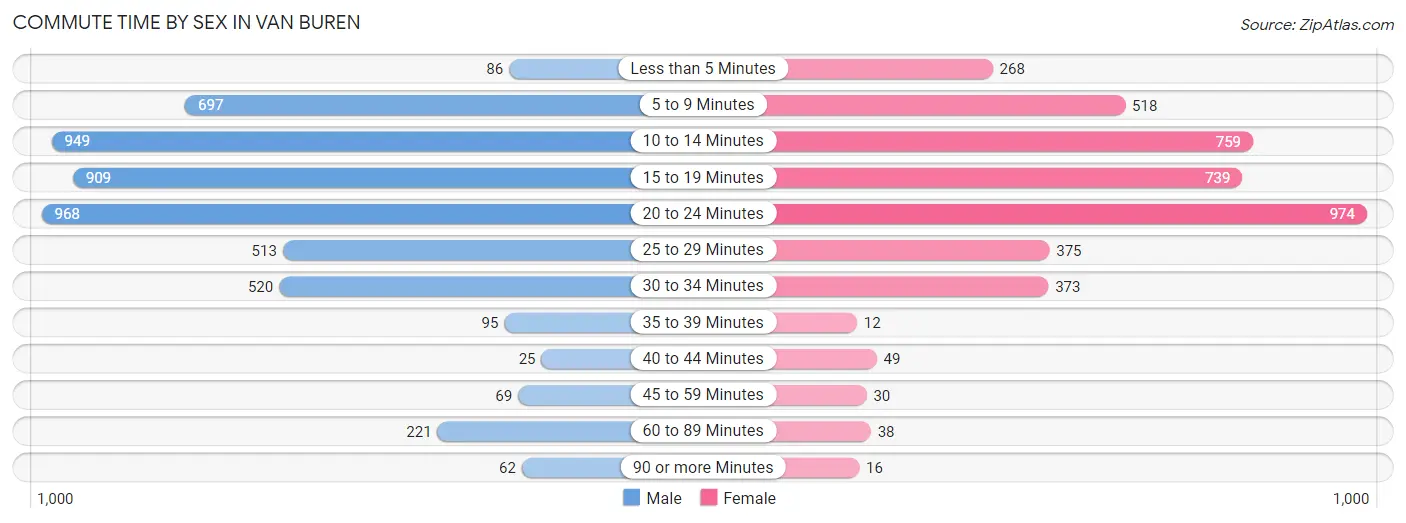
| Commute Time | Male | Female |
| Less than 5 Minutes | 86 (1.7%) | 268 (6.5%) |
| 5 to 9 Minutes | 697 (13.6%) | 518 (12.5%) |
| 10 to 14 Minutes | 949 (18.6%) | 759 (18.3%) |
| 15 to 19 Minutes | 909 (17.8%) | 739 (17.8%) |
| 20 to 24 Minutes | 968 (18.9%) | 974 (23.5%) |
| 25 to 29 Minutes | 513 (10.0%) | 375 (9.0%) |
| 30 to 34 Minutes | 520 (10.2%) | 373 (9.0%) |
| 35 to 39 Minutes | 95 (1.9%) | 12 (0.3%) |
| 40 to 44 Minutes | 25 (0.5%) | 49 (1.2%) |
| 45 to 59 Minutes | 69 (1.3%) | 30 (0.7%) |
| 60 to 89 Minutes | 221 (4.3%) | 38 (0.9%) |
| 90 or more Minutes | 62 (1.2%) | 16 (0.4%) |
Time of Departure to Work by Sex in Van Buren
The most frequent times of departure to work in Van Buren are 7:00 AM to 7:29 AM (936, 18.3%) for males and 7:30 AM to 7:59 AM (758, 18.3%) for females.
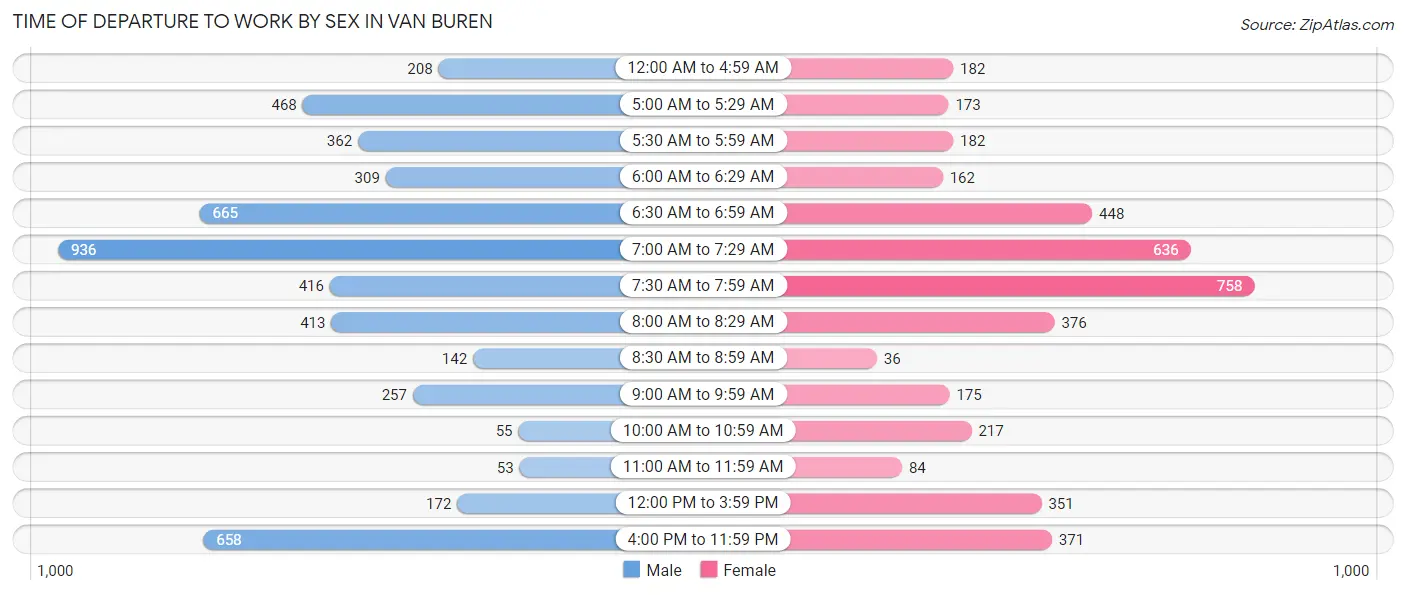
| Time of Departure | Male | Female |
| 12:00 AM to 4:59 AM | 208 (4.1%) | 182 (4.4%) |
| 5:00 AM to 5:29 AM | 468 (9.1%) | 173 (4.2%) |
| 5:30 AM to 5:59 AM | 362 (7.1%) | 182 (4.4%) |
| 6:00 AM to 6:29 AM | 309 (6.0%) | 162 (3.9%) |
| 6:30 AM to 6:59 AM | 665 (13.0%) | 448 (10.8%) |
| 7:00 AM to 7:29 AM | 936 (18.3%) | 636 (15.3%) |
| 7:30 AM to 7:59 AM | 416 (8.1%) | 758 (18.3%) |
| 8:00 AM to 8:29 AM | 413 (8.1%) | 376 (9.1%) |
| 8:30 AM to 8:59 AM | 142 (2.8%) | 36 (0.9%) |
| 9:00 AM to 9:59 AM | 257 (5.0%) | 175 (4.2%) |
| 10:00 AM to 10:59 AM | 55 (1.1%) | 217 (5.2%) |
| 11:00 AM to 11:59 AM | 53 (1.0%) | 84 (2.0%) |
| 12:00 PM to 3:59 PM | 172 (3.4%) | 351 (8.5%) |
| 4:00 PM to 11:59 PM | 658 (12.9%) | 371 (8.9%) |
| Total | 5,114 (100.0%) | 4,151 (100.0%) |
Housing Occupancy in Van Buren
Occupancy by Ownership in Van Buren
Of the total 8,923 dwellings in Van Buren, owner-occupied units account for 5,741 (64.3%), while renter-occupied units make up 3,182 (35.7%).
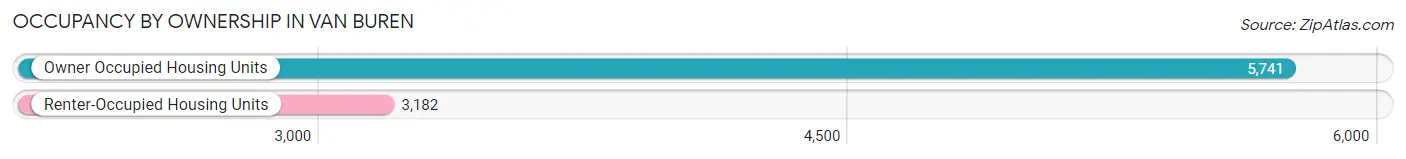
| Occupancy | # Housing Units | % Housing Units |
| Owner Occupied Housing Units | 5,741 | 64.3% |
| Renter-Occupied Housing Units | 3,182 | 35.7% |
| Total Occupied Housing Units | 8,923 | 100.0% |
Occupancy by Household Size in Van Buren
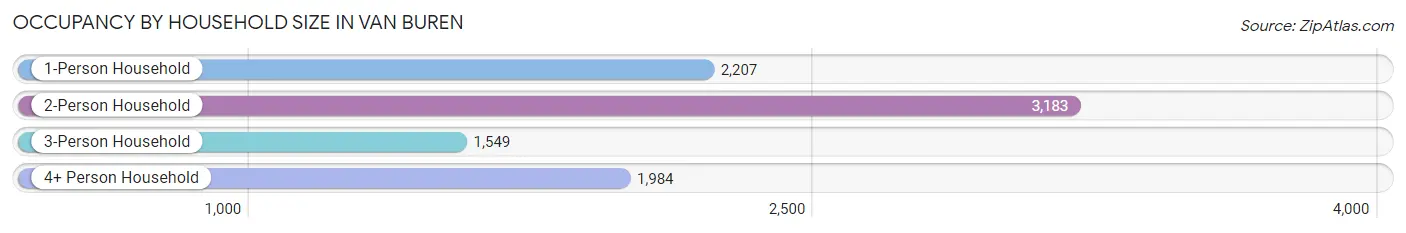
| Household Size | # Housing Units | % Housing Units |
| 1-Person Household | 2,207 | 24.7% |
| 2-Person Household | 3,183 | 35.7% |
| 3-Person Household | 1,549 | 17.4% |
| 4+ Person Household | 1,984 | 22.2% |
| Total Housing Units | 8,923 | 100.0% |
Occupancy by Ownership by Household Size in Van Buren
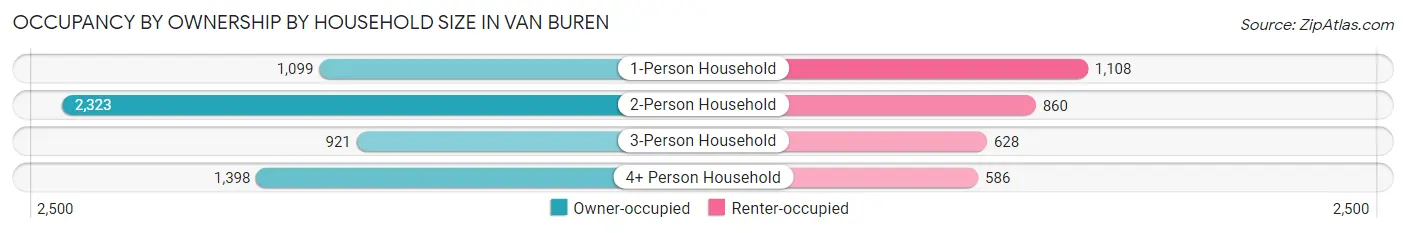
| Household Size | Owner-occupied | Renter-occupied |
| 1-Person Household | 1,099 (49.8%) | 1,108 (50.2%) |
| 2-Person Household | 2,323 (73.0%) | 860 (27.0%) |
| 3-Person Household | 921 (59.5%) | 628 (40.5%) |
| 4+ Person Household | 1,398 (70.5%) | 586 (29.5%) |
| Total Housing Units | 5,741 (64.3%) | 3,182 (35.7%) |
Occupancy by Educational Attainment in Van Buren
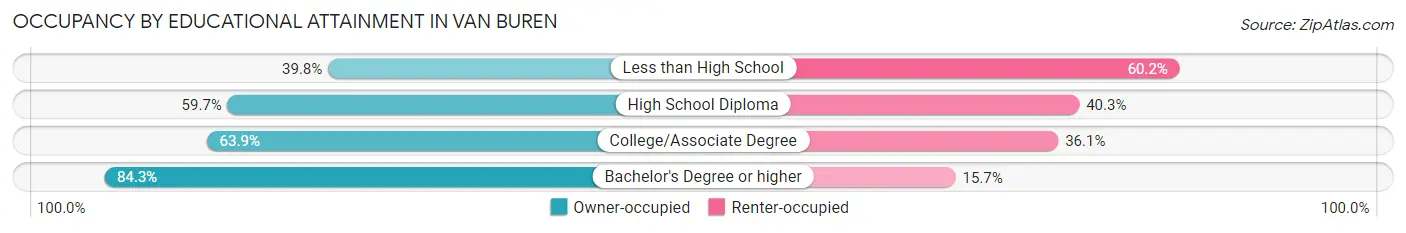
| Household Size | Owner-occupied | Renter-occupied |
| Less than High School | 472 (39.8%) | 713 (60.2%) |
| High School Diploma | 1,767 (59.7%) | 1,191 (40.3%) |
| College/Associate Degree | 1,650 (63.9%) | 932 (36.1%) |
| Bachelor's Degree or higher | 1,852 (84.3%) | 346 (15.7%) |
Occupancy by Age of Householder in Van Buren
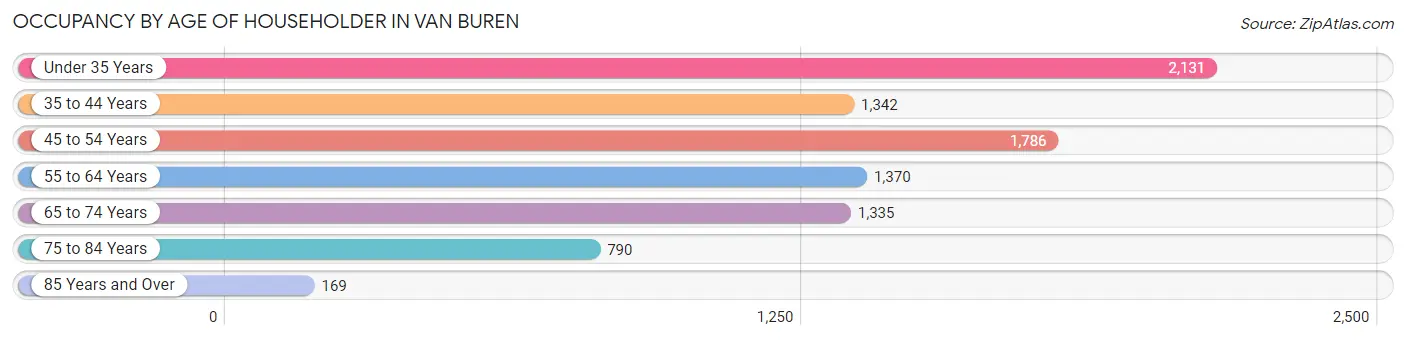
| Age Bracket | # Households | % Households |
| Under 35 Years | 2,131 | 23.9% |
| 35 to 44 Years | 1,342 | 15.0% |
| 45 to 54 Years | 1,786 | 20.0% |
| 55 to 64 Years | 1,370 | 15.3% |
| 65 to 74 Years | 1,335 | 15.0% |
| 75 to 84 Years | 790 | 8.8% |
| 85 Years and Over | 169 | 1.9% |
| Total | 8,923 | 100.0% |
Housing Finances in Van Buren
Median Income by Occupancy in Van Buren
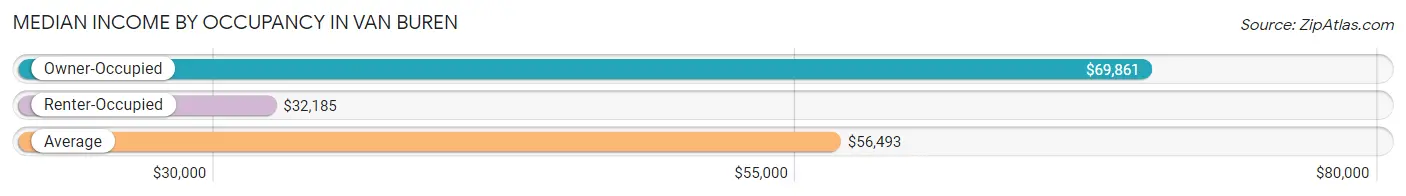
| Occupancy Type | # Households | Median Income |
| Owner-Occupied | 5,741 (64.3%) | $69,861 |
| Renter-Occupied | 3,182 (35.7%) | $32,185 |
| Average | 8,923 (100.0%) | $56,493 |
Occupancy by Householder Income Bracket in Van Buren
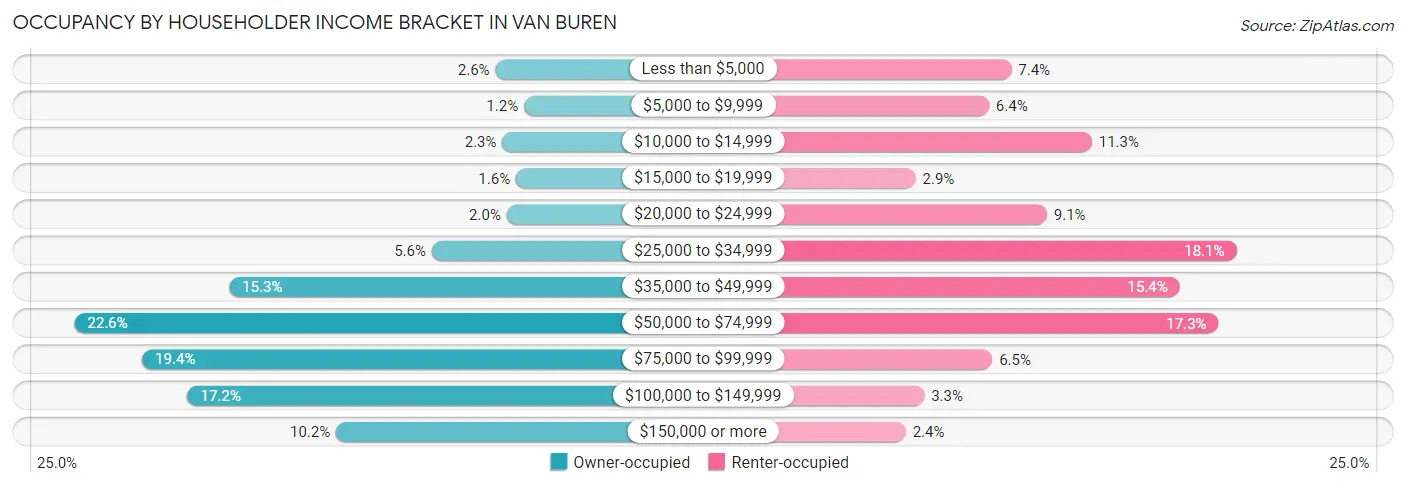
| Income Bracket | Owner-occupied | Renter-occupied |
| Less than $5,000 | 148 (2.6%) | 236 (7.4%) |
| $5,000 to $9,999 | 70 (1.2%) | 202 (6.4%) |
| $10,000 to $14,999 | 129 (2.2%) | 358 (11.3%) |
| $15,000 to $19,999 | 92 (1.6%) | 91 (2.9%) |
| $20,000 to $24,999 | 117 (2.0%) | 290 (9.1%) |
| $25,000 to $34,999 | 322 (5.6%) | 577 (18.1%) |
| $35,000 to $49,999 | 876 (15.3%) | 491 (15.4%) |
| $50,000 to $74,999 | 1,299 (22.6%) | 550 (17.3%) |
| $75,000 to $99,999 | 1,114 (19.4%) | 207 (6.5%) |
| $100,000 to $149,999 | 990 (17.2%) | 104 (3.3%) |
| $150,000 or more | 584 (10.2%) | 76 (2.4%) |
| Total | 5,741 (100.0%) | 3,182 (100.0%) |
Monthly Housing Cost Tiers in Van Buren
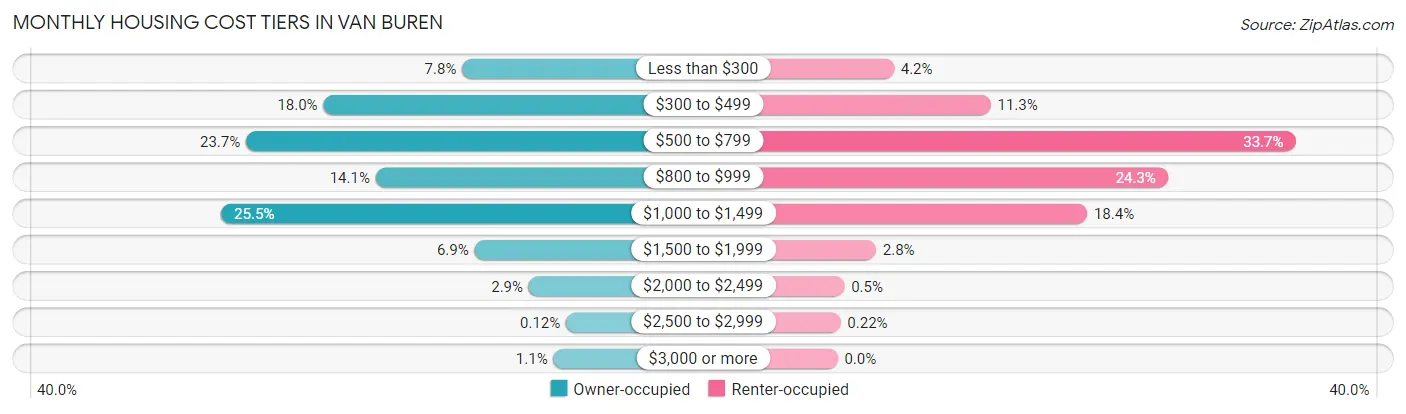
| Monthly Cost | Owner-occupied | Renter-occupied |
| Less than $300 | 446 (7.8%) | 132 (4.2%) |
| $300 to $499 | 1,033 (18.0%) | 359 (11.3%) |
| $500 to $799 | 1,360 (23.7%) | 1,073 (33.7%) |
| $800 to $999 | 812 (14.1%) | 774 (24.3%) |
| $1,000 to $1,499 | 1,465 (25.5%) | 585 (18.4%) |
| $1,500 to $1,999 | 394 (6.9%) | 90 (2.8%) |
| $2,000 to $2,499 | 164 (2.9%) | 16 (0.5%) |
| $2,500 to $2,999 | 7 (0.1%) | 7 (0.2%) |
| $3,000 or more | 60 (1.1%) | 0 (0.0%) |
| Total | 5,741 (100.0%) | 3,182 (100.0%) |
Physical Housing Characteristics in Van Buren
Housing Structures in Van Buren
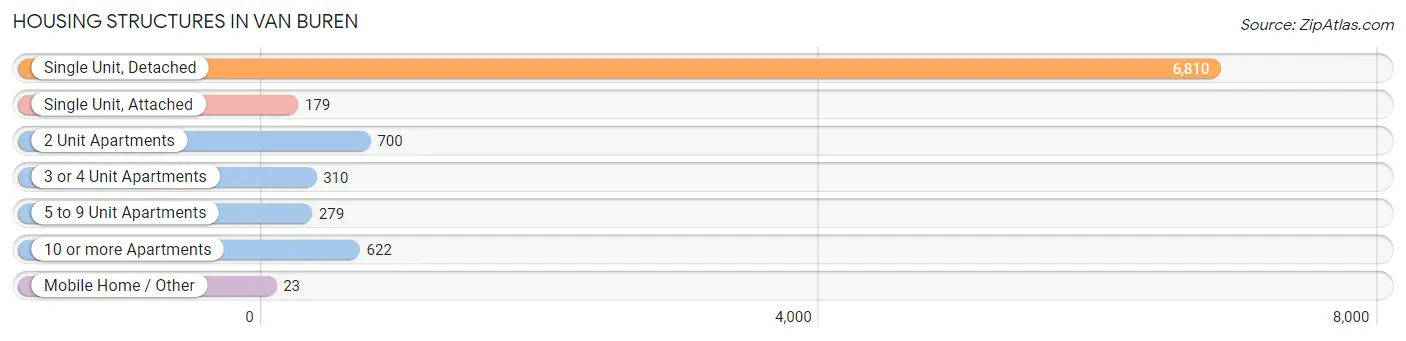
| Structure Type | # Housing Units | % Housing Units |
| Single Unit, Detached | 6,810 | 76.3% |
| Single Unit, Attached | 179 | 2.0% |
| 2 Unit Apartments | 700 | 7.8% |
| 3 or 4 Unit Apartments | 310 | 3.5% |
| 5 to 9 Unit Apartments | 279 | 3.1% |
| 10 or more Apartments | 622 | 7.0% |
| Mobile Home / Other | 23 | 0.3% |
| Total | 8,923 | 100.0% |
Housing Structures by Occupancy in Van Buren
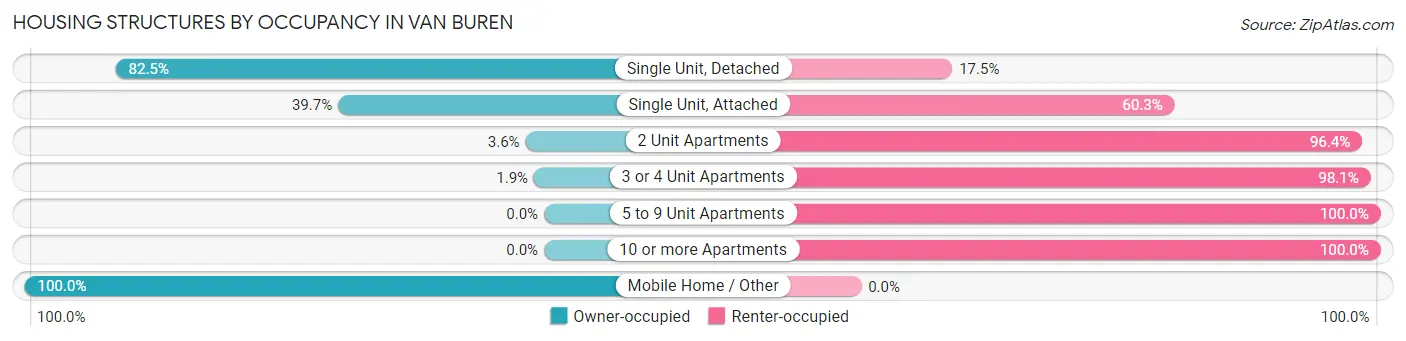
| Structure Type | Owner-occupied | Renter-occupied |
| Single Unit, Detached | 5,616 (82.5%) | 1,194 (17.5%) |
| Single Unit, Attached | 71 (39.7%) | 108 (60.3%) |
| 2 Unit Apartments | 25 (3.6%) | 675 (96.4%) |
| 3 or 4 Unit Apartments | 6 (1.9%) | 304 (98.1%) |
| 5 to 9 Unit Apartments | 0 (0.0%) | 279 (100.0%) |
| 10 or more Apartments | 0 (0.0%) | 622 (100.0%) |
| Mobile Home / Other | 23 (100.0%) | 0 (0.0%) |
| Total | 5,741 (64.3%) | 3,182 (35.7%) |
Housing Structures by Number of Rooms in Van Buren
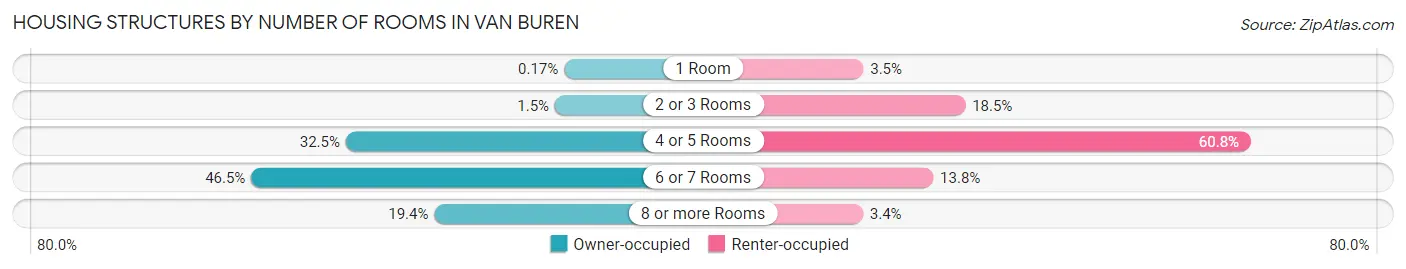
| Number of Rooms | Owner-occupied | Renter-occupied |
| 1 Room | 10 (0.2%) | 110 (3.5%) |
| 2 or 3 Rooms | 87 (1.5%) | 590 (18.5%) |
| 4 or 5 Rooms | 1,864 (32.5%) | 1,935 (60.8%) |
| 6 or 7 Rooms | 2,668 (46.5%) | 439 (13.8%) |
| 8 or more Rooms | 1,112 (19.4%) | 108 (3.4%) |
| Total | 5,741 (100.0%) | 3,182 (100.0%) |
Housing Structure by Heating Type in Van Buren
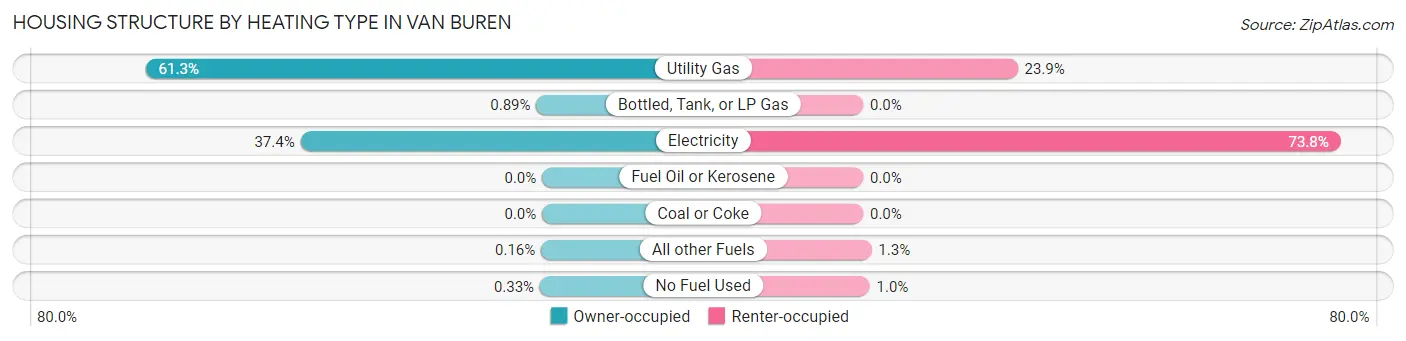
| Heating Type | Owner-occupied | Renter-occupied |
| Utility Gas | 3,518 (61.3%) | 760 (23.9%) |
| Bottled, Tank, or LP Gas | 51 (0.9%) | 0 (0.0%) |
| Electricity | 2,144 (37.3%) | 2,349 (73.8%) |
| Fuel Oil or Kerosene | 0 (0.0%) | 0 (0.0%) |
| Coal or Coke | 0 (0.0%) | 0 (0.0%) |
| All other Fuels | 9 (0.2%) | 41 (1.3%) |
| No Fuel Used | 19 (0.3%) | 32 (1.0%) |
| Total | 5,741 (100.0%) | 3,182 (100.0%) |
Household Vehicle Usage in Van Buren
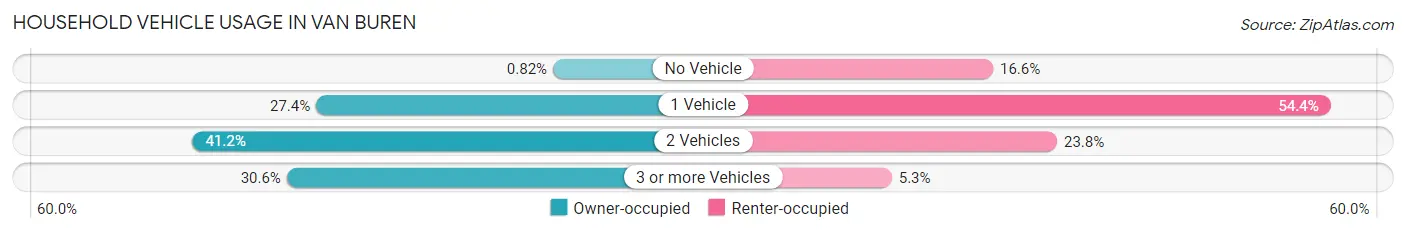
| Vehicles per Household | Owner-occupied | Renter-occupied |
| No Vehicle | 47 (0.8%) | 528 (16.6%) |
| 1 Vehicle | 1,570 (27.4%) | 1,731 (54.4%) |
| 2 Vehicles | 2,365 (41.2%) | 756 (23.8%) |
| 3 or more Vehicles | 1,759 (30.6%) | 167 (5.2%) |
| Total | 5,741 (100.0%) | 3,182 (100.0%) |
Real Estate & Mortgages in Van Buren
Real Estate and Mortgage Overview in Van Buren
| Characteristic | Without Mortgage | With Mortgage |
| Housing Units | 2,420 | 3,321 |
| Median Property Value | $157,100 | $155,000 |
| Median Household Income | $60,902 | $411 |
| Monthly Housing Costs | $454 | $44 |
| Real Estate Taxes | $1,136 | $122 |
Property Value by Mortgage Status in Van Buren
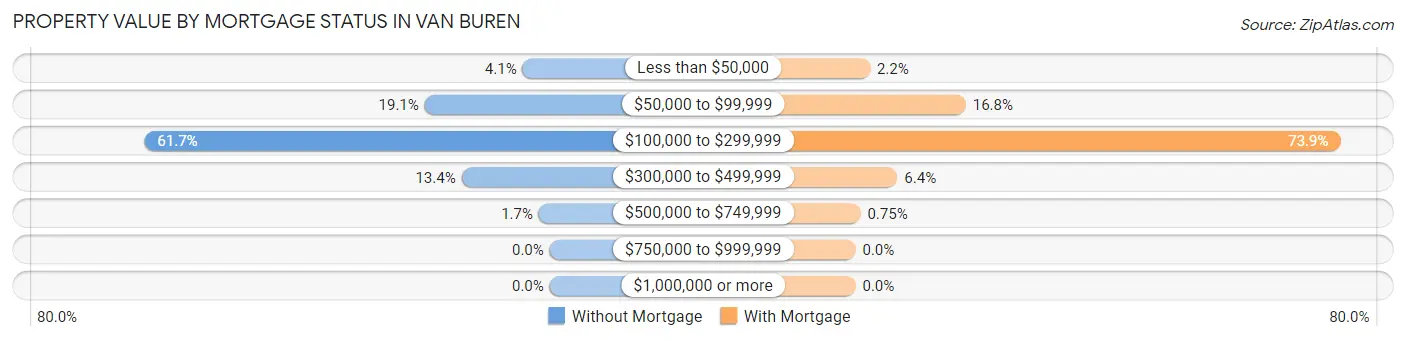
| Property Value | Without Mortgage | With Mortgage |
| Less than $50,000 | 100 (4.1%) | 73 (2.2%) |
| $50,000 to $99,999 | 461 (19.1%) | 558 (16.8%) |
| $100,000 to $299,999 | 1,494 (61.7%) | 2,453 (73.9%) |
| $300,000 to $499,999 | 325 (13.4%) | 212 (6.4%) |
| $500,000 to $749,999 | 40 (1.7%) | 25 (0.7%) |
| $750,000 to $999,999 | 0 (0.0%) | 0 (0.0%) |
| $1,000,000 or more | 0 (0.0%) | 0 (0.0%) |
| Total | 2,420 (100.0%) | 3,321 (100.0%) |
Household Income by Mortgage Status in Van Buren
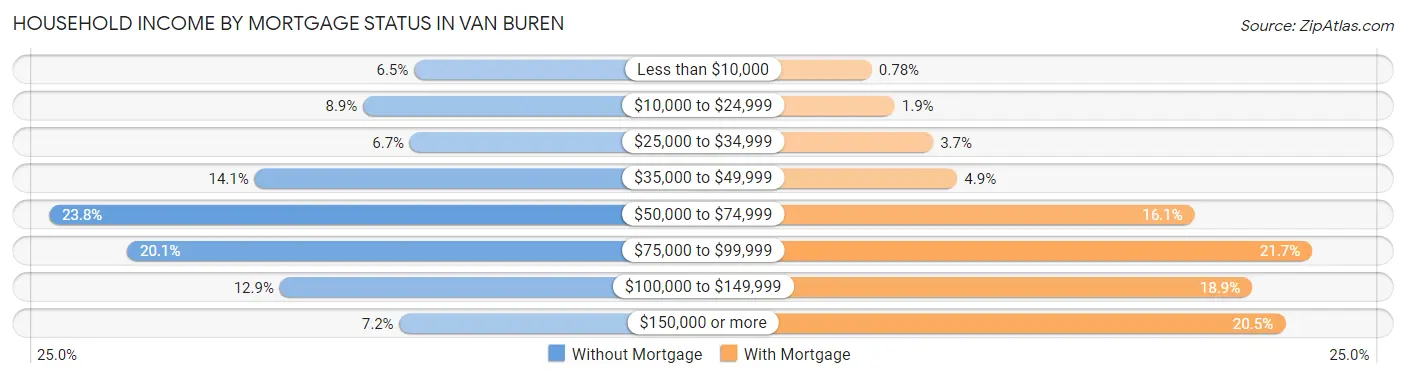
| Household Income | Without Mortgage | With Mortgage |
| Less than $10,000 | 156 (6.5%) | 26 (0.8%) |
| $10,000 to $24,999 | 215 (8.9%) | 62 (1.9%) |
| $25,000 to $34,999 | 161 (6.7%) | 123 (3.7%) |
| $35,000 to $49,999 | 340 (14.1%) | 161 (4.9%) |
| $50,000 to $74,999 | 577 (23.8%) | 536 (16.1%) |
| $75,000 to $99,999 | 487 (20.1%) | 722 (21.7%) |
| $100,000 to $149,999 | 311 (12.9%) | 627 (18.9%) |
| $150,000 or more | 173 (7.1%) | 679 (20.4%) |
| Total | 2,420 (100.0%) | 3,321 (100.0%) |
Property Value to Household Income Ratio in Van Buren
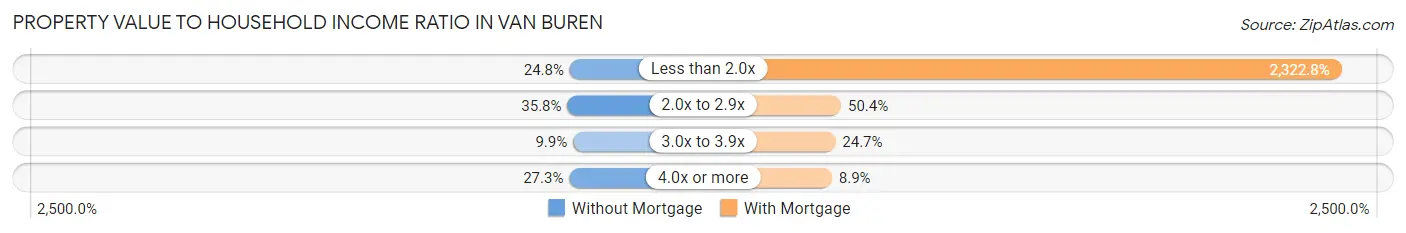
| Value-to-Income Ratio | Without Mortgage | With Mortgage |
| Less than 2.0x | 600 (24.8%) | 77,140 (2,322.8%) |
| 2.0x to 2.9x | 866 (35.8%) | 1,675 (50.4%) |
| 3.0x to 3.9x | 240 (9.9%) | 820 (24.7%) |
| 4.0x or more | 660 (27.3%) | 297 (8.9%) |
| Total | 2,420 (100.0%) | 3,321 (100.0%) |
Real Estate Taxes by Mortgage Status in Van Buren
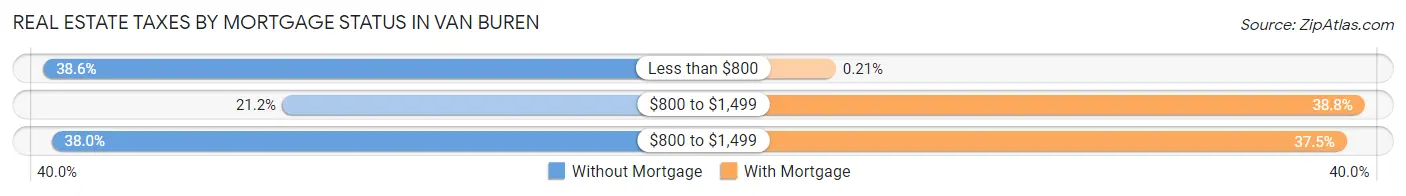
| Property Taxes | Without Mortgage | With Mortgage |
| Less than $800 | 935 (38.6%) | 7 (0.2%) |
| $800 to $1,499 | 513 (21.2%) | 1,290 (38.8%) |
| $800 to $1,499 | 920 (38.0%) | 1,246 (37.5%) |
| Total | 2,420 (100.0%) | 3,321 (100.0%) |
Health & Disability in Van Buren
Health Insurance Coverage by Age in Van Buren
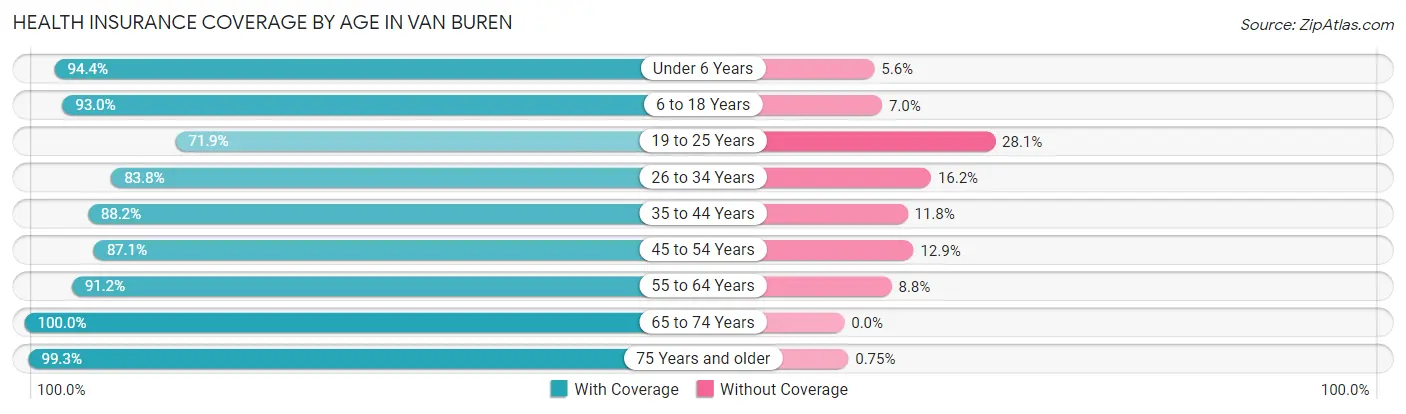
| Age Bracket | With Coverage | Without Coverage |
| Under 6 Years | 1,614 (94.4%) | 96 (5.6%) |
| 6 to 18 Years | 3,586 (93.0%) | 271 (7.0%) |
| 19 to 25 Years | 1,559 (71.9%) | 610 (28.1%) |
| 26 to 34 Years | 2,937 (83.8%) | 566 (16.2%) |
| 35 to 44 Years | 2,370 (88.2%) | 317 (11.8%) |
| 45 to 54 Years | 2,511 (87.1%) | 372 (12.9%) |
| 55 to 64 Years | 2,268 (91.2%) | 219 (8.8%) |
| 65 to 74 Years | 2,248 (100.0%) | 0 (0.0%) |
| 75 Years and older | 1,446 (99.3%) | 11 (0.7%) |
| Total | 20,539 (89.3%) | 2,462 (10.7%) |
Health Insurance Coverage by Citizenship Status in Van Buren
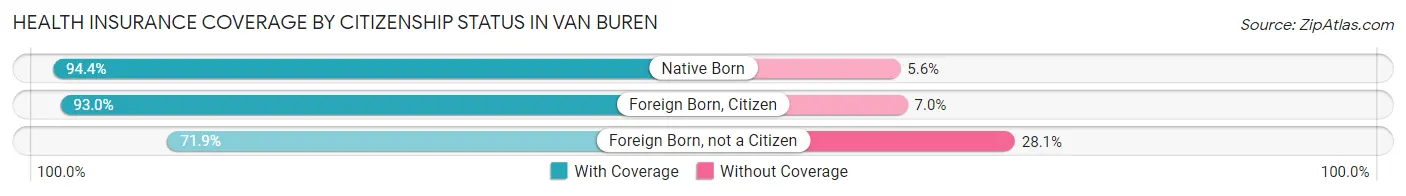
| Citizenship Status | With Coverage | Without Coverage |
| Native Born | 1,614 (94.4%) | 96 (5.6%) |
| Foreign Born, Citizen | 3,586 (93.0%) | 271 (7.0%) |
| Foreign Born, not a Citizen | 1,559 (71.9%) | 610 (28.1%) |
Health Insurance Coverage by Household Income in Van Buren
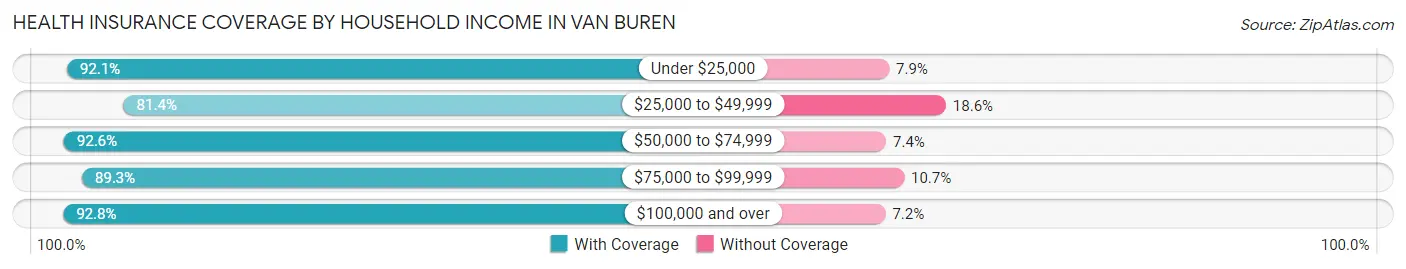
| Household Income | With Coverage | Without Coverage |
| Under $25,000 | 3,183 (92.1%) | 274 (7.9%) |
| $25,000 to $49,999 | 4,539 (81.4%) | 1,035 (18.6%) |
| $50,000 to $74,999 | 4,404 (92.6%) | 350 (7.4%) |
| $75,000 to $99,999 | 3,520 (89.3%) | 423 (10.7%) |
| $100,000 and over | 4,872 (92.8%) | 380 (7.2%) |
Public vs Private Health Insurance Coverage by Age in Van Buren
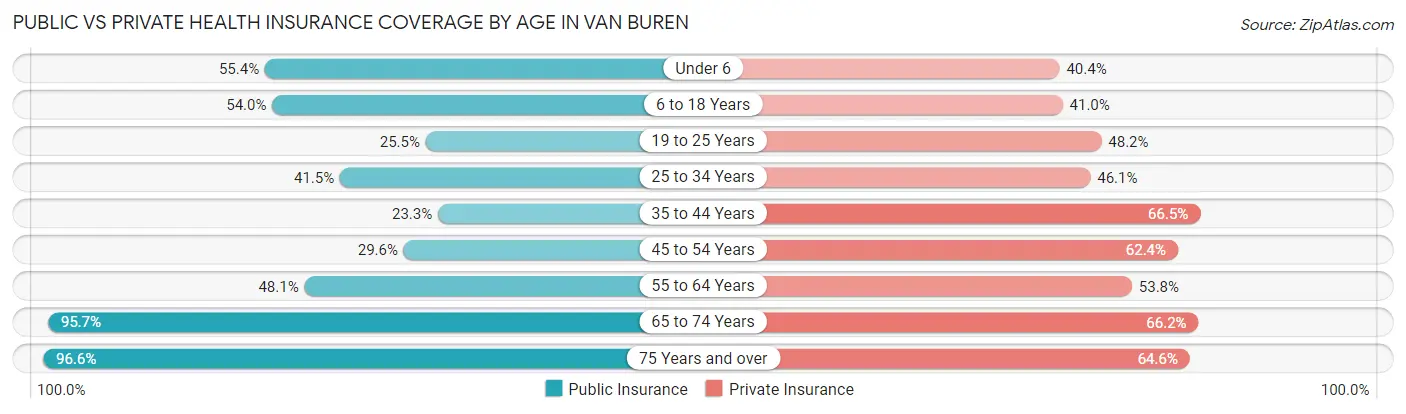
| Age Bracket | Public Insurance | Private Insurance |
| Under 6 | 947 (55.4%) | 691 (40.4%) |
| 6 to 18 Years | 2,084 (54.0%) | 1,581 (41.0%) |
| 19 to 25 Years | 554 (25.5%) | 1,045 (48.2%) |
| 25 to 34 Years | 1,452 (41.4%) | 1,616 (46.1%) |
| 35 to 44 Years | 625 (23.3%) | 1,787 (66.5%) |
| 45 to 54 Years | 854 (29.6%) | 1,798 (62.4%) |
| 55 to 64 Years | 1,195 (48.0%) | 1,339 (53.8%) |
| 65 to 74 Years | 2,151 (95.7%) | 1,488 (66.2%) |
| 75 Years and over | 1,407 (96.6%) | 941 (64.6%) |
| Total | 11,269 (49.0%) | 12,286 (53.4%) |
Disability Status by Sex by Age in Van Buren
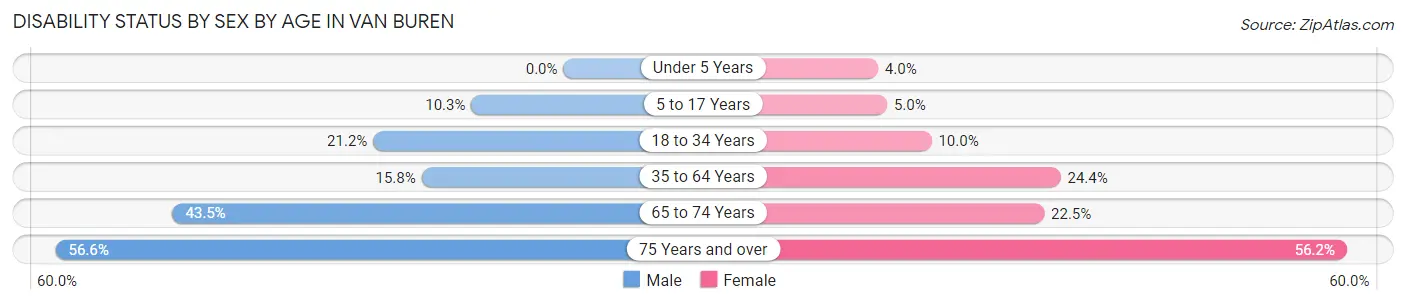
| Age Bracket | Male | Female |
| Under 5 Years | 0 (0.0%) | 34 (4.0%) |
| 5 to 17 Years | 203 (10.2%) | 95 (5.0%) |
| 18 to 34 Years | 602 (21.2%) | 306 (10.0%) |
| 35 to 64 Years | 630 (15.8%) | 991 (24.4%) |
| 65 to 74 Years | 424 (43.5%) | 287 (22.5%) |
| 75 Years and over | 298 (56.6%) | 523 (56.2%) |
Disability Class by Sex by Age in Van Buren
Disability Class: Hearing Difficulty
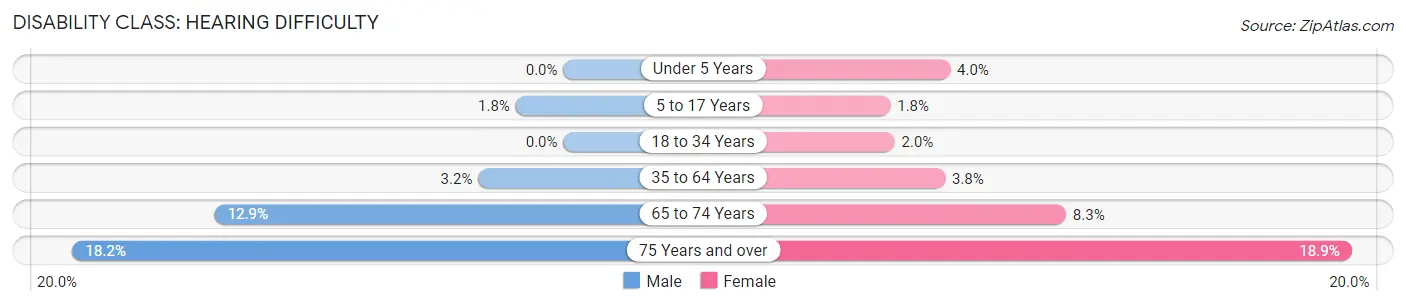
| Age Bracket | Male | Female |
| Under 5 Years | 0 (0.0%) | 34 (4.0%) |
| 5 to 17 Years | 35 (1.8%) | 34 (1.8%) |
| 18 to 34 Years | 0 (0.0%) | 60 (2.0%) |
| 35 to 64 Years | 126 (3.2%) | 156 (3.8%) |
| 65 to 74 Years | 126 (12.9%) | 106 (8.3%) |
| 75 Years and over | 96 (18.2%) | 176 (18.9%) |
Disability Class: Vision Difficulty
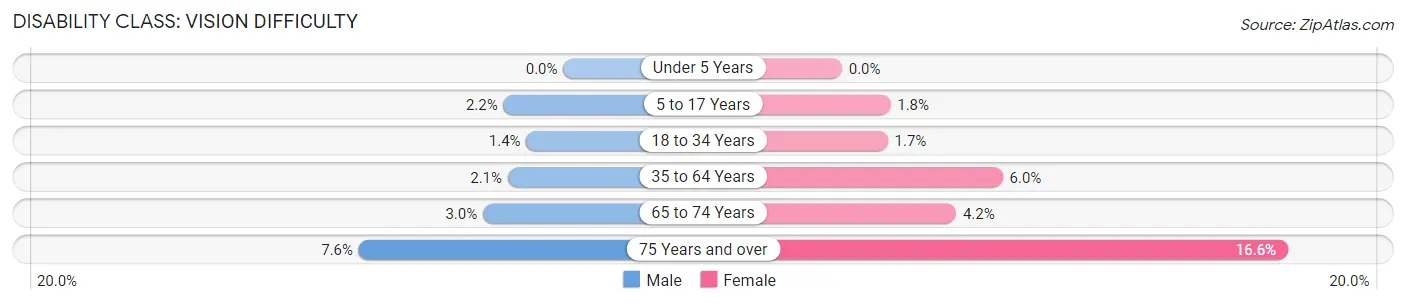
| Age Bracket | Male | Female |
| Under 5 Years | 0 (0.0%) | 0 (0.0%) |
| 5 to 17 Years | 44 (2.2%) | 34 (1.8%) |
| 18 to 34 Years | 39 (1.4%) | 52 (1.7%) |
| 35 to 64 Years | 82 (2.1%) | 243 (6.0%) |
| 65 to 74 Years | 29 (3.0%) | 54 (4.2%) |
| 75 Years and over | 40 (7.6%) | 154 (16.6%) |
Disability Class: Cognitive Difficulty
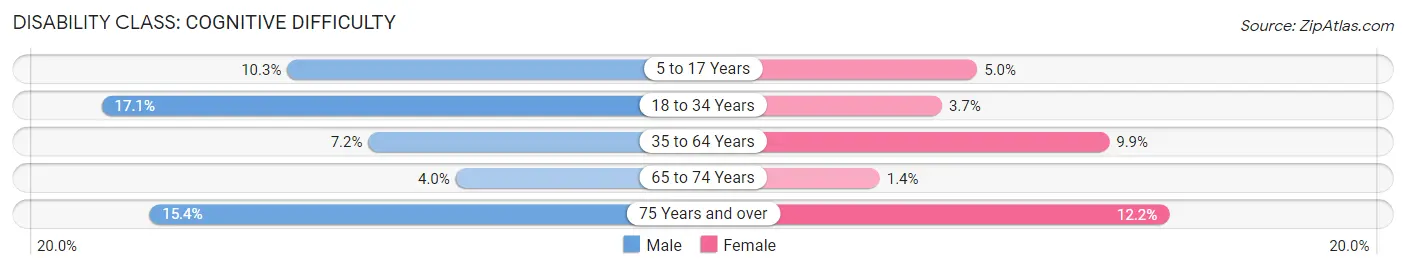
| Age Bracket | Male | Female |
| 5 to 17 Years | 203 (10.2%) | 95 (5.0%) |
| 18 to 34 Years | 487 (17.1%) | 114 (3.7%) |
| 35 to 64 Years | 289 (7.2%) | 404 (9.9%) |
| 65 to 74 Years | 39 (4.0%) | 18 (1.4%) |
| 75 Years and over | 81 (15.4%) | 113 (12.1%) |
Disability Class: Ambulatory Difficulty
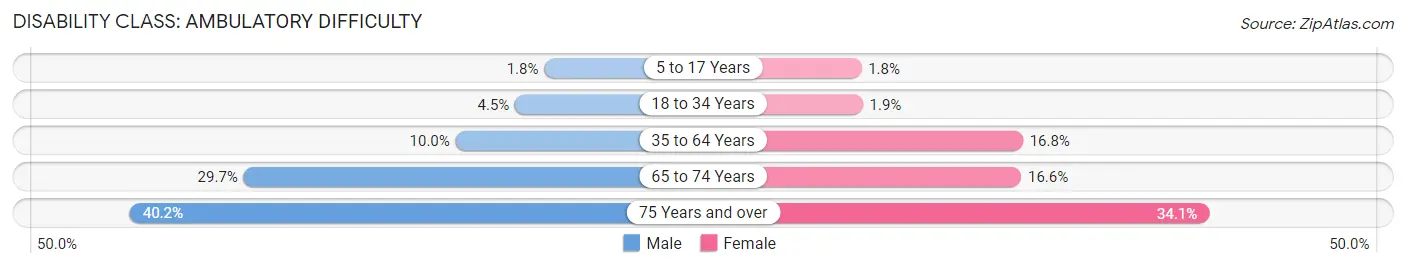
| Age Bracket | Male | Female |
| 5 to 17 Years | 35 (1.8%) | 34 (1.8%) |
| 18 to 34 Years | 127 (4.5%) | 59 (1.9%) |
| 35 to 64 Years | 399 (10.0%) | 683 (16.8%) |
| 65 to 74 Years | 289 (29.7%) | 212 (16.6%) |
| 75 Years and over | 212 (40.2%) | 317 (34.1%) |
Disability Class: Self-Care Difficulty
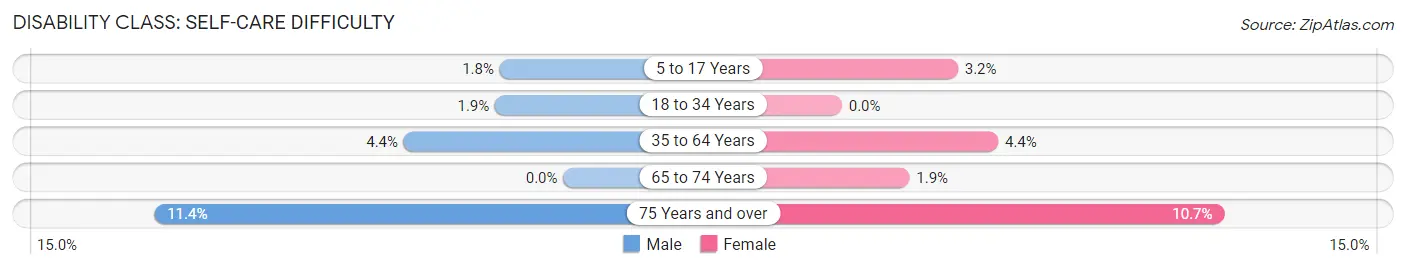
| Age Bracket | Male | Female |
| 5 to 17 Years | 35 (1.8%) | 61 (3.2%) |
| 18 to 34 Years | 54 (1.9%) | 0 (0.0%) |
| 35 to 64 Years | 177 (4.4%) | 177 (4.3%) |
| 65 to 74 Years | 0 (0.0%) | 24 (1.9%) |
| 75 Years and over | 60 (11.4%) | 99 (10.6%) |
Technology Access in Van Buren
Computing Device Access in Van Buren
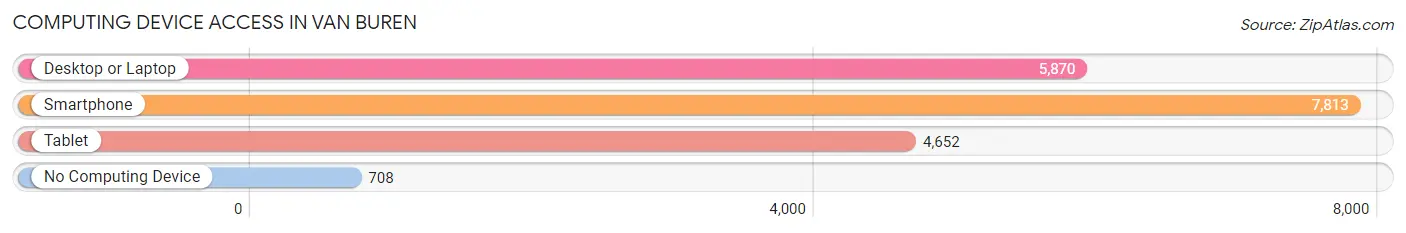
| Device Type | # Households | % Households |
| Desktop or Laptop | 5,870 | 65.8% |
| Smartphone | 7,813 | 87.6% |
| Tablet | 4,652 | 52.1% |
| No Computing Device | 708 | 7.9% |
| Total | 8,923 | 100.0% |
Internet Access in Van Buren
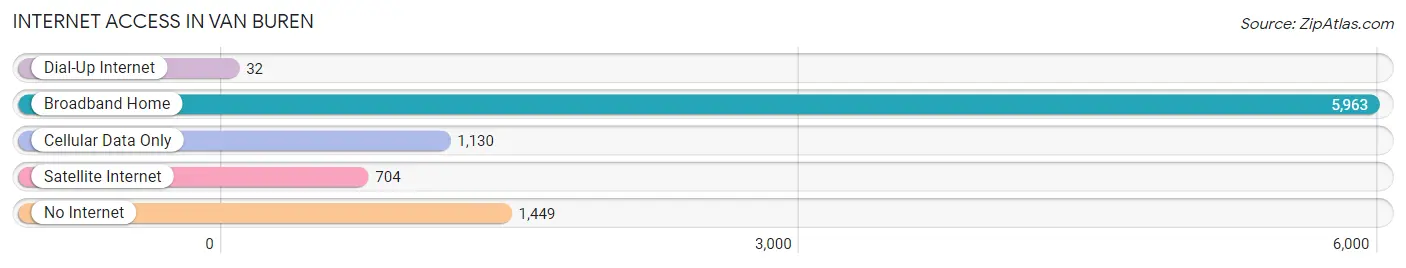
| Internet Type | # Households | % Households |
| Dial-Up Internet | 32 | 0.4% |
| Broadband Home | 5,963 | 66.8% |
| Cellular Data Only | 1,130 | 12.7% |
| Satellite Internet | 704 | 7.9% |
| No Internet | 1,449 | 16.2% |
| Total | 8,923 | 100.0% |
Van Buren Summary
Van Buren, Arkansas is a city located in Crawford County in the northwest corner of the state. It is the county seat and the largest city in the county. The city is situated on the Arkansas River and is part of the Fort Smith metropolitan area. The city was founded in 1818 and was named after President Martin Van Buren.
History
Van Buren was founded in 1818 by William Henry Harrison Clayton, a prominent lawyer and politician. The city was named after President Martin Van Buren, who was in office at the time. The city was originally a trading post and ferry crossing on the Arkansas River. In 1829, the city was incorporated and became the county seat of Crawford County.
In the late 19th century, Van Buren was a major stop on the Butterfield Overland Mail route. The city was also a major stop on the St. Louis-San Francisco Railway, which ran through the city until the 1950s.
During the Civil War, Van Buren was a major supply center for the Confederate Army. The city was also the site of a major battle in 1863, when Union forces attempted to capture the city. The Union forces were unsuccessful and the city remained in Confederate hands until the end of the war.
In the late 19th century, Van Buren was a major center for the timber industry. The city was also home to several cotton mills and other manufacturing businesses.
Geography
Van Buren is located in the northwest corner of Arkansas, in Crawford County. The city is situated on the Arkansas River and is part of the Fort Smith metropolitan area. The city is located about 30 miles south of the Oklahoma border and about 60 miles north of Little Rock.
The city has a total area of 16.2 square miles, of which 16.1 square miles is land and 0.1 square miles is water. The city is located in a hilly region of the Ozark Mountains.
Economy
Van Buren’s economy is largely based on manufacturing and services. The city is home to several manufacturing companies, including a paper mill, a steel mill, and a plastics plant. The city is also home to several retail stores and restaurants.
The city is also home to several educational institutions, including the University of Arkansas at Fort Smith and the Arkansas College of Osteopathic Medicine.
Demographics
As of the 2010 census, Van Buren had a population of 22,791. The racial makeup of the city was 79.2% White, 15.3% African American, 0.7% Native American, 0.7% Asian, 0.1% Pacific Islander, 1.7% from other races, and 2.1% from two or more races. Hispanic or Latino of any race were 4.2% of the population.
The median household income in Van Buren was $35,945, and the median family income was $43,945. The per capita income for the city was $19,945. About 16.2% of families and 19.7% of the population were below the poverty line, including 28.2% of those under age 18 and 11.2% of those age 65 or over.
Van Buren is served by the Van Buren School District, which includes five elementary schools, two middle schools, and one high school. The city is also home to several private schools, including a Catholic school and a Christian school.
Common Questions
What is Per Capita Income in Van Buren?
Per Capita income in Van Buren is $29,609.
What is the Median Family Income in Van Buren?
Median Family Income in Van Buren is $64,716.
What is the Median Household income in Van Buren?
Median Household Income in Van Buren is $56,493.
What is Income or Wage Gap in Van Buren?
Income or Wage Gap in Van Buren is 36.2%.
Women in Van Buren earn 63.8 cents for every dollar earned by a man.
What is Family Income Deficit in Van Buren?
Family Income Deficit in Van Buren is $13,279.
Families that are below poverty line in Van Buren earn $13,279 less on average than the poverty threshold level.
What is Inequality or Gini Index in Van Buren?
Inequality or Gini Index in Van Buren is 0.46.
What is the Total Population of Van Buren?
Total Population of Van Buren is 23,398.
What is the Total Male Population of Van Buren?
Total Male Population of Van Buren is 11,075.
What is the Total Female Population of Van Buren?
Total Female Population of Van Buren is 12,323.
What is the Ratio of Males per 100 Females in Van Buren?
There are 89.87 Males per 100 Females in Van Buren.
What is the Ratio of Females per 100 Males in Van Buren?
There are 111.27 Females per 100 Males in Van Buren.
What is the Median Population Age in Van Buren?
Median Population Age in Van Buren is 36.8 Years.
What is the Average Family Size in Van Buren
Average Family Size in Van Buren is 3.0 People.
What is the Average Household Size in Van Buren
Average Household Size in Van Buren is 2.6 People.
How Large is the Labor Force in Van Buren?
There are 10,800 People in the Labor Forcein in Van Buren.
What is the Percentage of People in the Labor Force in Van Buren?
58.4% of People are in the Labor Force in Van Buren.
What is the Unemployment Rate in Van Buren?
Unemployment Rate in Van Buren is 7.9%.