Essex Junction, VT Map & Demographics
Essex Junction Map
Essex Junction Overview
$46,853
PER CAPITA INCOME
$113,776
AVG FAMILY INCOME
$92,589
AVG HOUSEHOLD INCOME
14.4%
WAGE / INCOME GAP [ % ]
85.6¢/ $1
WAGE / INCOME GAP [ $ ]
0.44
INEQUALITY / GINI INDEX
10,646
TOTAL POPULATION
5,289
MALE POPULATION
5,357
FEMALE POPULATION
98.73
MALES / 100 FEMALES
101.29
FEMALES / 100 MALES
39.9
MEDIAN AGE
3.0
AVG FAMILY SIZE
2.3
AVG HOUSEHOLD SIZE
6,329
LABOR FORCE [ PEOPLE ]
71.9%
PERCENT IN LABOR FORCE
2.5%
UNEMPLOYMENT RATE
Essex Junction Zip Codes
Essex Junction Area Codes
Income in Essex Junction
Income Overview in Essex Junction
Per Capita Income in Essex Junction is $46,853, while median incomes of families and households are $113,776 and $92,589 respectively.
| Characteristic | Number | Measure |
| Per Capita Income | 10,646 | $46,853 |
| Median Family Income | 2,836 | $113,776 |
| Mean Family Income | 2,836 | $134,547 |
| Median Household Income | 4,604 | $92,589 |
| Mean Household Income | 4,604 | $110,058 |
| Income Deficit | 2,836 | $0 |
| Wage / Income Gap (%) | 10,646 | 14.36% |
| Wage / Income Gap ($) | 10,646 | 85.64¢ per $1 |
| Gini / Inequality Index | 10,646 | 0.44 |
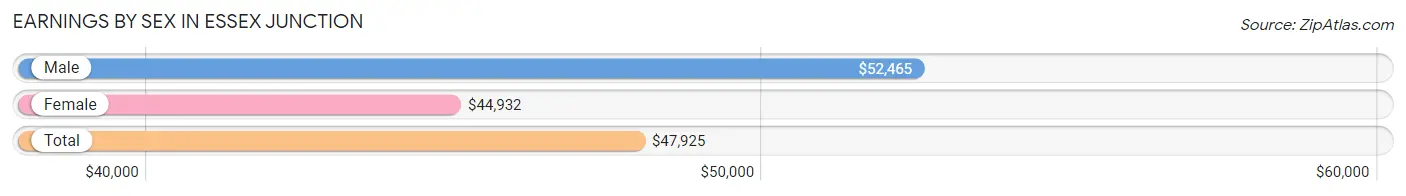
Earnings by Sex in Essex Junction
Average Earnings in Essex Junction are $47,925, $52,465 for men and $44,932 for women, a difference of 14.4%.
| Sex | Number | Average Earnings |
| Male | 3,421 (51.4%) | $52,465 |
| Female | 3,231 (48.6%) | $44,932 |
| Total | 6,652 (100.0%) | $47,925 |
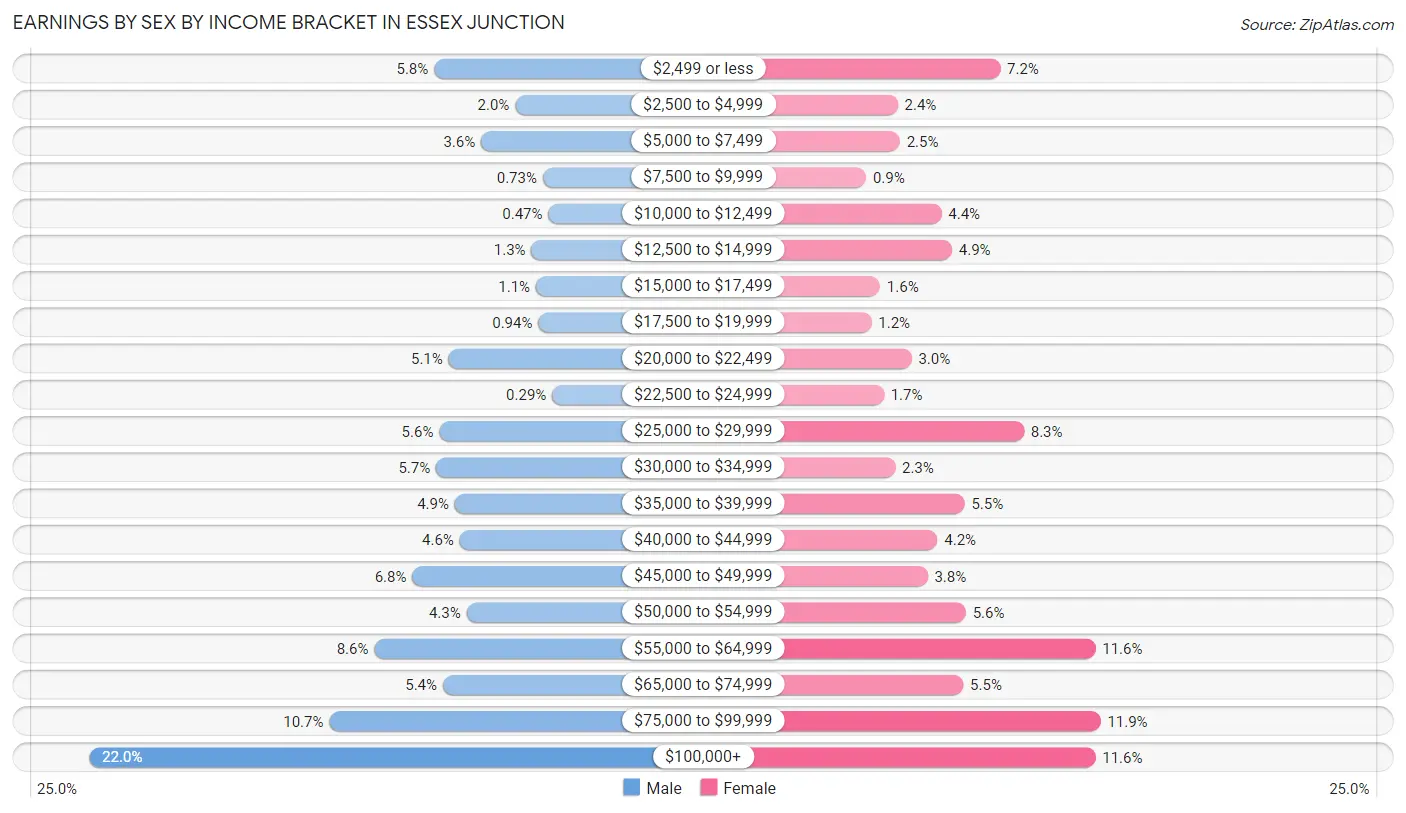
Earnings by Sex by Income Bracket in Essex Junction
The most common earnings brackets in Essex Junction are $100,000+ for men (752 | 22.0%) and $75,000 to $99,999 for women (384 | 11.9%).
| Income | Male | Female |
| $2,499 or less | 199 (5.8%) | 232 (7.2%) |
| $2,500 to $4,999 | 69 (2.0%) | 77 (2.4%) |
| $5,000 to $7,499 | 124 (3.6%) | 80 (2.5%) |
| $7,500 to $9,999 | 25 (0.7%) | 29 (0.9%) |
| $10,000 to $12,499 | 16 (0.5%) | 143 (4.4%) |
| $12,500 to $14,999 | 43 (1.3%) | 159 (4.9%) |
| $15,000 to $17,499 | 36 (1.1%) | 50 (1.5%) |
| $17,500 to $19,999 | 32 (0.9%) | 37 (1.1%) |
| $20,000 to $22,499 | 176 (5.1%) | 98 (3.0%) |
| $22,500 to $24,999 | 10 (0.3%) | 56 (1.7%) |
| $25,000 to $29,999 | 191 (5.6%) | 268 (8.3%) |
| $30,000 to $34,999 | 196 (5.7%) | 73 (2.3%) |
| $35,000 to $39,999 | 166 (4.9%) | 178 (5.5%) |
| $40,000 to $44,999 | 158 (4.6%) | 137 (4.2%) |
| $45,000 to $49,999 | 234 (6.8%) | 122 (3.8%) |
| $50,000 to $54,999 | 147 (4.3%) | 180 (5.6%) |
| $55,000 to $64,999 | 295 (8.6%) | 376 (11.6%) |
| $65,000 to $74,999 | 185 (5.4%) | 176 (5.4%) |
| $75,000 to $99,999 | 367 (10.7%) | 384 (11.9%) |
| $100,000+ | 752 (22.0%) | 376 (11.6%) |
| Total | 3,421 (100.0%) | 3,231 (100.0%) |
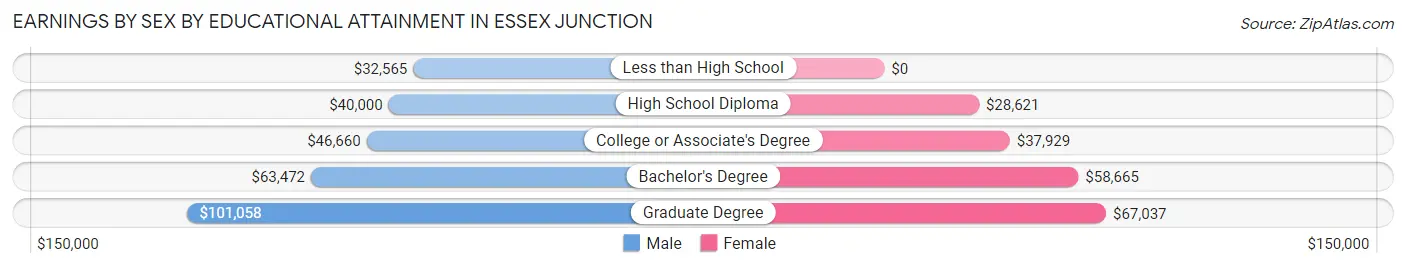
Earnings by Sex by Educational Attainment in Essex Junction
Average earnings in Essex Junction are $58,339 for men and $50,210 for women, a difference of 13.9%. Men with an educational attainment of graduate degree enjoy the highest average annual earnings of $101,058, while those with less than high school education earn the least with $32,565. Women with an educational attainment of graduate degree earn the most with the average annual earnings of $67,037, while those with high school diploma education have the smallest earnings of $28,621.
| Educational Attainment | Male Income | Female Income |
| Less than High School | $32,565 | $0 |
| High School Diploma | $40,000 | $28,621 |
| College or Associate's Degree | $46,660 | $37,929 |
| Bachelor's Degree | $63,472 | $58,665 |
| Graduate Degree | $101,058 | $67,037 |
| Total | $58,339 | $50,210 |
Family Income in Essex Junction
Family Income Brackets in Essex Junction
According to the Essex Junction family income data, there are 740 families falling into the $100,000 to $149,999 income range, which is the most common income bracket and makes up 26.1% of all families.
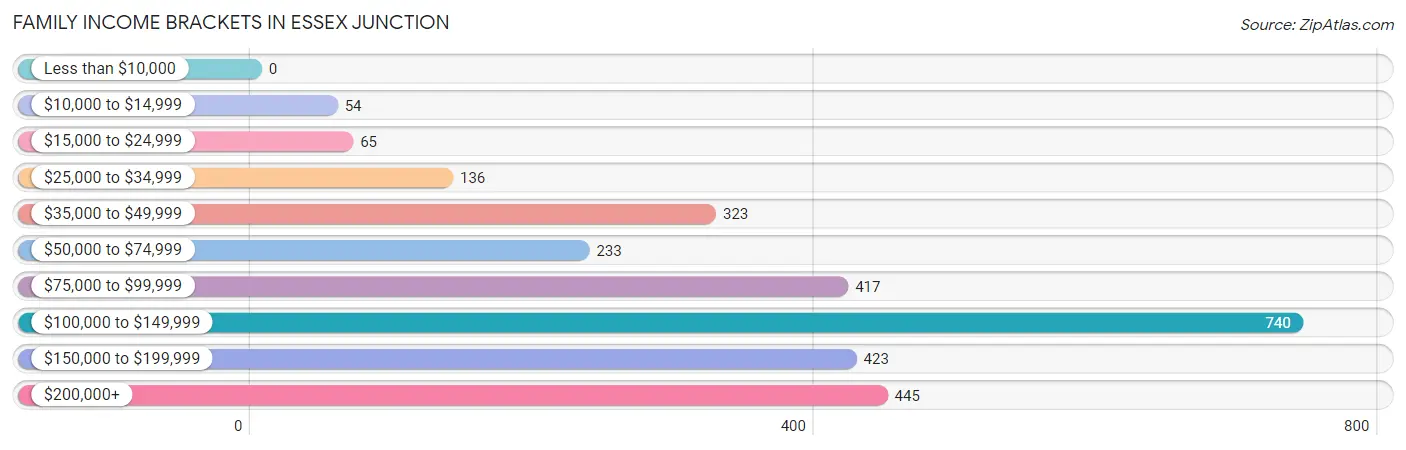
| Income Bracket | # Families | % Families |
| Less than $10,000 | 0 | 0.0% |
| $10,000 to $14,999 | 54 | 1.9% |
| $15,000 to $24,999 | 65 | 2.3% |
| $25,000 to $34,999 | 136 | 4.8% |
| $35,000 to $49,999 | 323 | 11.4% |
| $50,000 to $74,999 | 233 | 8.2% |
| $75,000 to $99,999 | 417 | 14.7% |
| $100,000 to $149,999 | 740 | 26.1% |
| $150,000 to $199,999 | 423 | 14.9% |
| $200,000+ | 445 | 15.7% |
Family Income by Famaliy Size in Essex Junction
5-person families (198 | 7.0%) account for the highest median family income in Essex Junction with $217,857 per family, while 2-person families (1,229 | 43.3%) have the highest median income of $55,294 per family member.
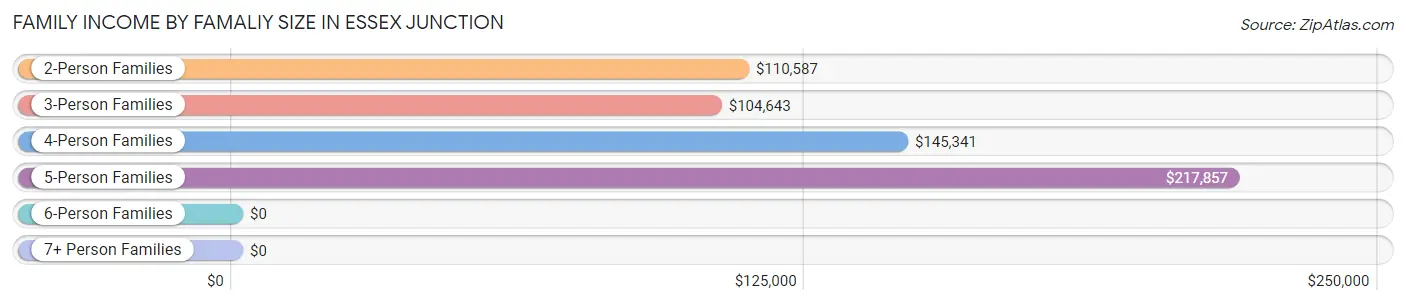
| Income Bracket | # Families | Median Income |
| 2-Person Families | 1,229 (43.3%) | $110,587 |
| 3-Person Families | 886 (31.2%) | $104,643 |
| 4-Person Families | 363 (12.8%) | $145,341 |
| 5-Person Families | 198 (7.0%) | $217,857 |
| 6-Person Families | 27 (0.9%) | $0 |
| 7+ Person Families | 133 (4.7%) | $0 |
| Total | 2,836 (100.0%) | $113,776 |
Family Income by Number of Earners in Essex Junction
The median family income in Essex Junction is $113,776, with families comprising 3+ earners (459) having the highest median family income of $173,542, while families with no earners (266) have the lowest median family income of $50,385, accounting for 16.2% and 9.4% of families, respectively.
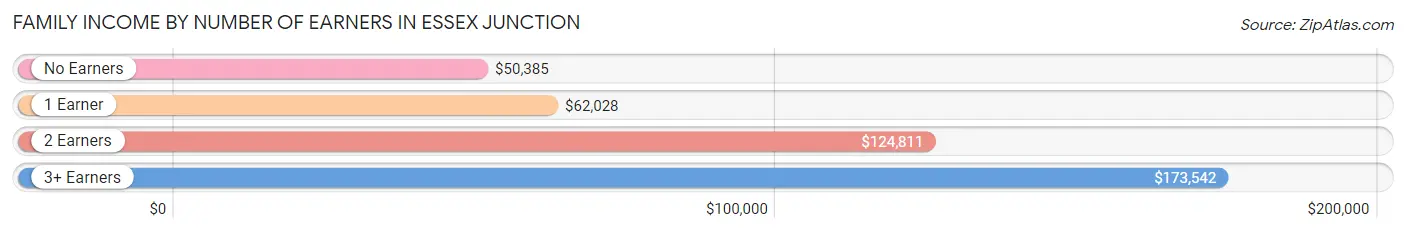
| Number of Earners | # Families | Median Income |
| No Earners | 266 (9.4%) | $50,385 |
| 1 Earner | 725 (25.6%) | $62,028 |
| 2 Earners | 1,386 (48.9%) | $124,811 |
| 3+ Earners | 459 (16.2%) | $173,542 |
| Total | 2,836 (100.0%) | $113,776 |
Household Income in Essex Junction
Household Income Brackets in Essex Junction
With 1,050 households falling in the category, the $100,000 to $149,999 income range is the most frequent in Essex Junction, accounting for 22.8% of all households. In contrast, only 138 households (3.0%) fall into the $15,000 to $24,999 income bracket, making it the least populous group.
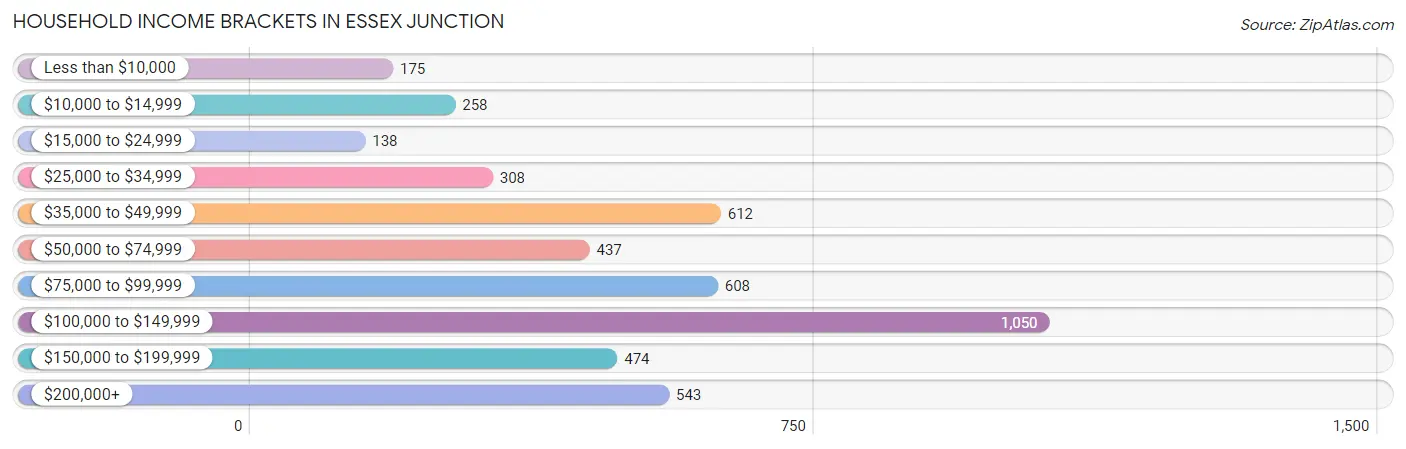
| Income Bracket | # Households | % Households |
| Less than $10,000 | 175 | 3.8% |
| $10,000 to $14,999 | 258 | 5.6% |
| $15,000 to $24,999 | 138 | 3.0% |
| $25,000 to $34,999 | 308 | 6.7% |
| $35,000 to $49,999 | 612 | 13.3% |
| $50,000 to $74,999 | 437 | 9.5% |
| $75,000 to $99,999 | 608 | 13.2% |
| $100,000 to $149,999 | 1,050 | 22.8% |
| $150,000 to $199,999 | 474 | 10.3% |
| $200,000+ | 543 | 11.8% |
Household Income by Householder Age in Essex Junction
The median household income in Essex Junction is $92,589, with the highest median household income of $107,226 found in the 45 to 64 years age bracket for the primary householder. A total of 1,701 households (36.9%) fall into this category. Meanwhile, the 15 to 24 years age bracket for the primary householder has the lowest median household income of $0, with 188 households (4.1%) in this group.
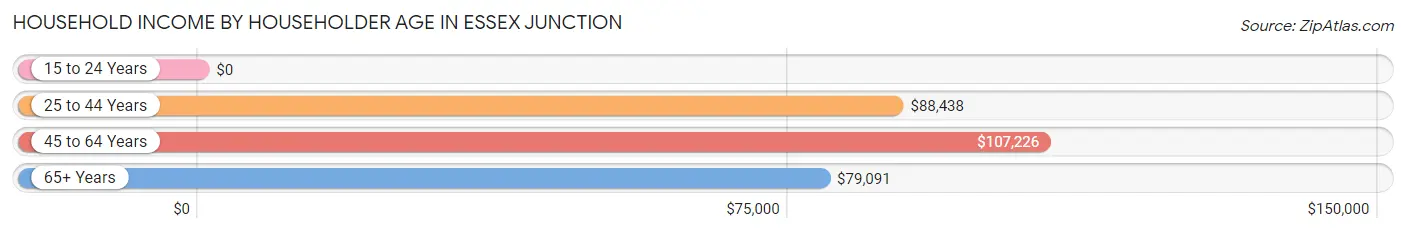
| Income Bracket | # Households | Median Income |
| 15 to 24 Years | 188 (4.1%) | $0 |
| 25 to 44 Years | 1,741 (37.8%) | $88,438 |
| 45 to 64 Years | 1,701 (36.9%) | $107,226 |
| 65+ Years | 974 (21.2%) | $79,091 |
| Total | 4,604 (100.0%) | $92,589 |
Poverty in Essex Junction
Income Below Poverty by Sex and Age in Essex Junction
With 7.3% poverty level for males and 13.3% for females among the residents of Essex Junction, 75 year old and over males and 12 to 14 year old females are the most vulnerable to poverty, with 111 males (39.6%) and 63 females (28.8%) in their respective age groups living below the poverty level.
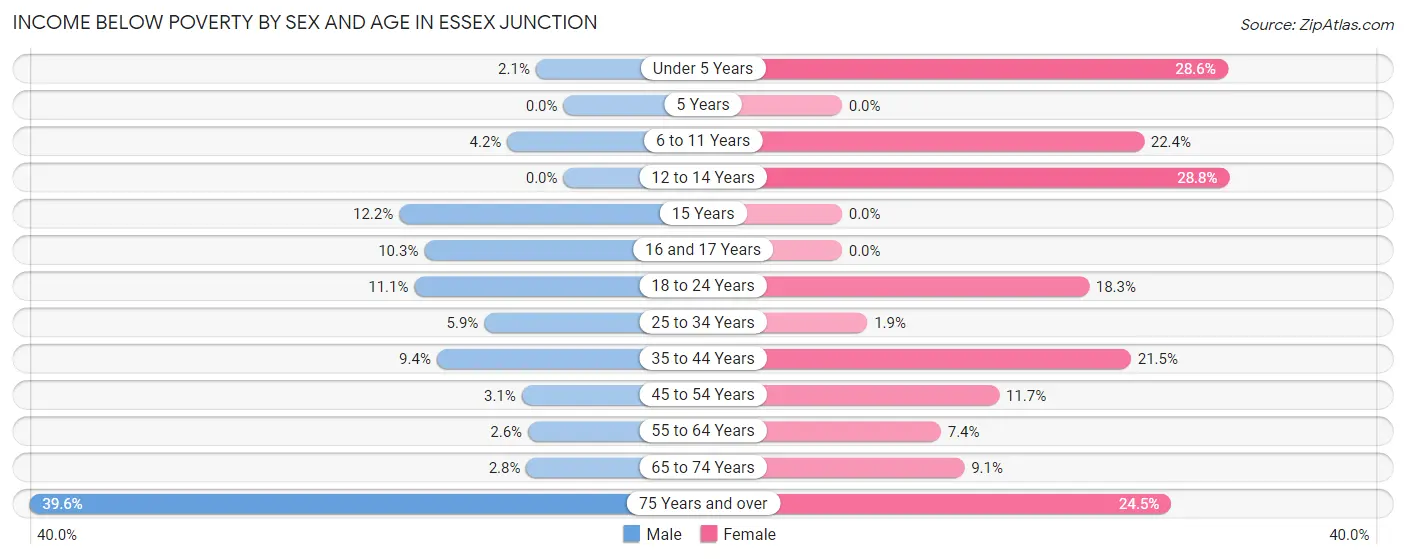
| Age Bracket | Male | Female |
| Under 5 Years | 9 (2.1%) | 59 (28.6%) |
| 5 Years | 0 (0.0%) | 0 (0.0%) |
| 6 to 11 Years | 11 (4.2%) | 63 (22.4%) |
| 12 to 14 Years | 0 (0.0%) | 63 (28.8%) |
| 15 Years | 5 (12.2%) | 0 (0.0%) |
| 16 and 17 Years | 19 (10.3%) | 0 (0.0%) |
| 18 to 24 Years | 62 (11.1%) | 53 (18.3%) |
| 25 to 34 Years | 52 (5.9%) | 15 (1.9%) |
| 35 to 44 Years | 67 (9.4%) | 144 (21.5%) |
| 45 to 54 Years | 22 (3.1%) | 102 (11.7%) |
| 55 to 64 Years | 14 (2.6%) | 55 (7.3%) |
| 65 to 74 Years | 12 (2.8%) | 55 (9.1%) |
| 75 Years and over | 111 (39.6%) | 100 (24.4%) |
| Total | 384 (7.3%) | 709 (13.3%) |
Income Above Poverty by Sex and Age in Essex Junction
According to the poverty statistics in Essex Junction, males aged 5 years and females aged 5 years are the age groups that are most secure financially, with 100.0% of males and 100.0% of females in these age groups living above the poverty line.
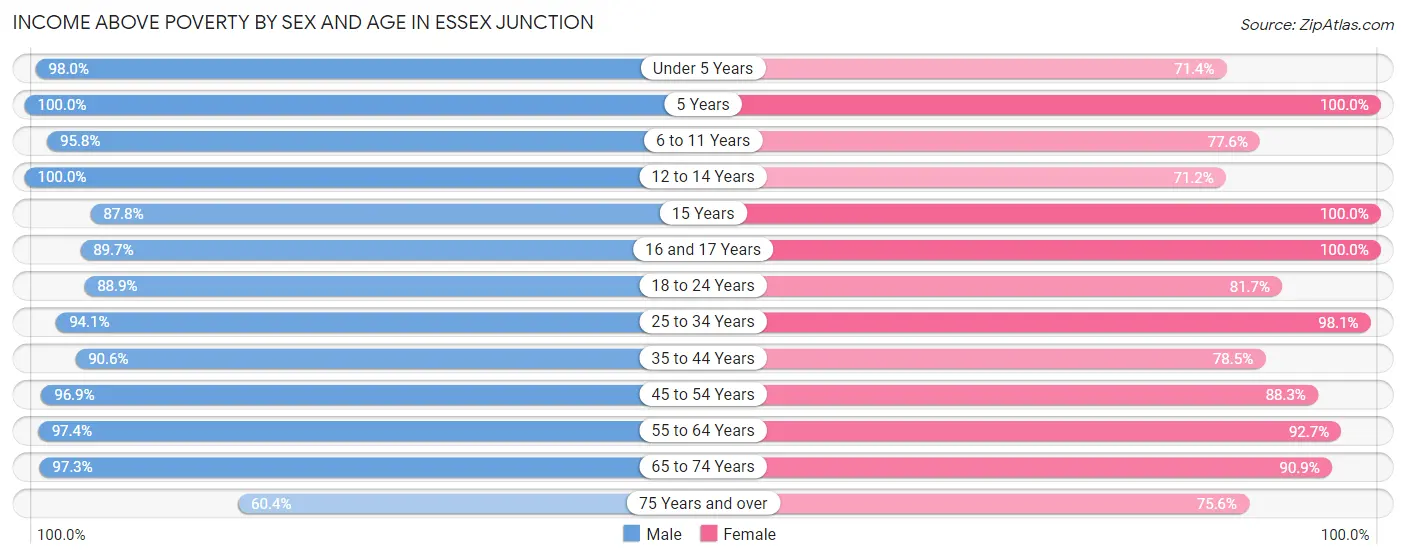
| Age Bracket | Male | Female |
| Under 5 Years | 430 (98.0%) | 147 (71.4%) |
| 5 Years | 30 (100.0%) | 99 (100.0%) |
| 6 to 11 Years | 253 (95.8%) | 218 (77.6%) |
| 12 to 14 Years | 196 (100.0%) | 156 (71.2%) |
| 15 Years | 36 (87.8%) | 69 (100.0%) |
| 16 and 17 Years | 165 (89.7%) | 82 (100.0%) |
| 18 to 24 Years | 498 (88.9%) | 236 (81.7%) |
| 25 to 34 Years | 833 (94.1%) | 779 (98.1%) |
| 35 to 44 Years | 646 (90.6%) | 527 (78.5%) |
| 45 to 54 Years | 688 (96.9%) | 772 (88.3%) |
| 55 to 64 Years | 519 (97.4%) | 693 (92.6%) |
| 65 to 74 Years | 425 (97.3%) | 550 (90.9%) |
| 75 Years and over | 169 (60.4%) | 309 (75.5%) |
| Total | 4,888 (92.7%) | 4,637 (86.7%) |
Income Below Poverty Among Married-Couple Families in Essex Junction
The poverty statistics for married-couple families in Essex Junction show that 6.7% or 156 of the total 2,313 families live below the poverty line. Families with 3 or 4 children have the highest poverty rate of 35.4%, comprising of 56 families. On the other hand, families with 1 or 2 children have the lowest poverty rate of 3.0%, which includes 26 families.
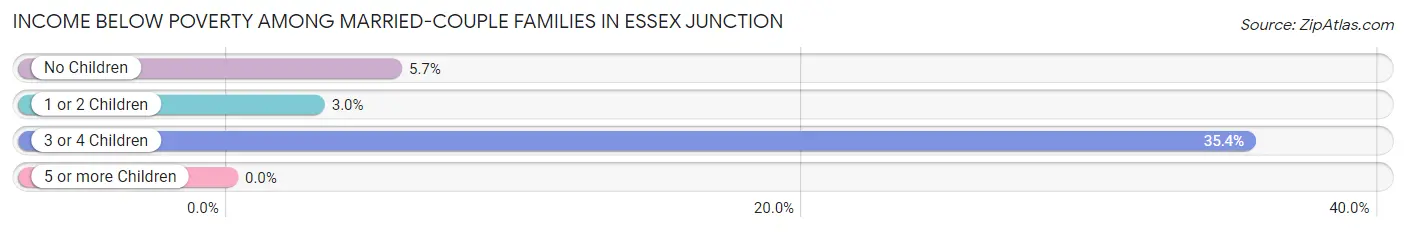
| Children | Above Poverty | Below Poverty |
| No Children | 1,221 (94.3%) | 74 (5.7%) |
| 1 or 2 Children | 834 (97.0%) | 26 (3.0%) |
| 3 or 4 Children | 102 (64.6%) | 56 (35.4%) |
| 5 or more Children | 0 (0.0%) | 0 (0.0%) |
| Total | 2,157 (93.3%) | 156 (6.7%) |
Income Below Poverty Among Single-Parent Households in Essex Junction
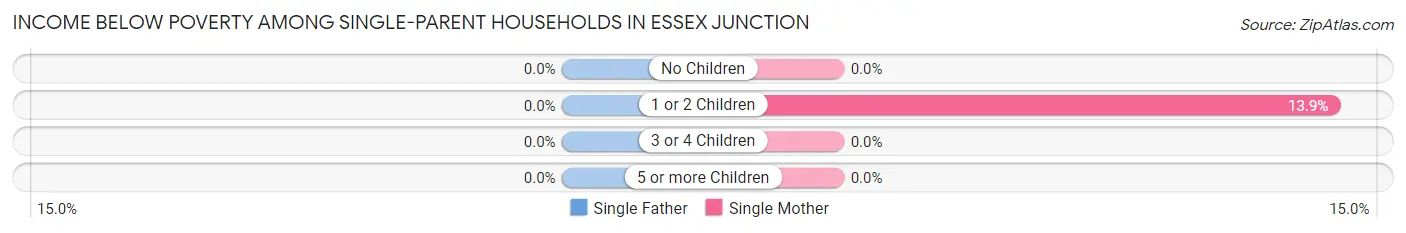
| Children | Single Father | Single Mother |
| No Children | 0 (0.0%) | 0 (0.0%) |
| 1 or 2 Children | 0 (0.0%) | 19 (13.9%) |
| 3 or 4 Children | 0 (0.0%) | 0 (0.0%) |
| 5 or more Children | 0 (0.0%) | 0 (0.0%) |
| Total | 0 (0.0%) | 19 (5.1%) |
Income Below Poverty Among Married-Couple vs Single-Parent Households in Essex Junction
The poverty data for Essex Junction shows that 156 of the married-couple family households (6.7%) and 19 of the single-parent households (3.6%) are living below the poverty level. Within the married-couple family households, those with 3 or 4 children have the highest poverty rate, with 56 households (35.4%) falling below the poverty line. Among the single-parent households, those with 1 or 2 children have the highest poverty rate, with 19 household (7.4%) living below poverty.
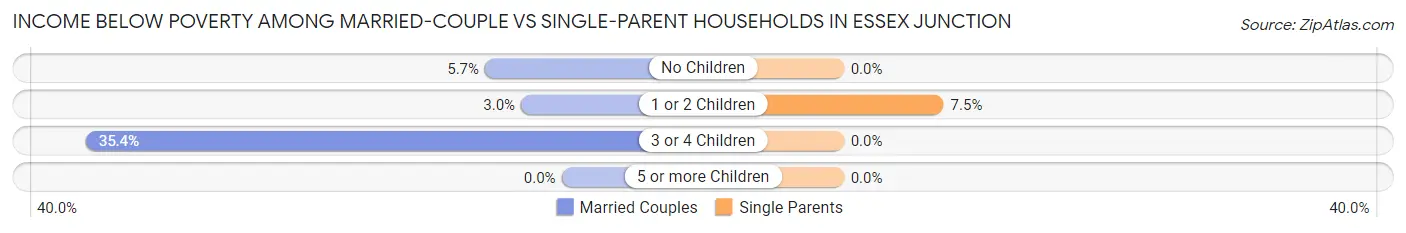
| Children | Married-Couple Families | Single-Parent Households |
| No Children | 74 (5.7%) | 0 (0.0%) |
| 1 or 2 Children | 26 (3.0%) | 19 (7.4%) |
| 3 or 4 Children | 56 (35.4%) | 0 (0.0%) |
| 5 or more Children | 0 (0.0%) | 0 (0.0%) |
| Total | 156 (6.7%) | 19 (3.6%) |
Race in Essex Junction
The most populous races in Essex Junction are White / Caucasian (8,581 | 80.6%), Asian (828 | 7.8%), and Two or more Races (821 | 7.7%).
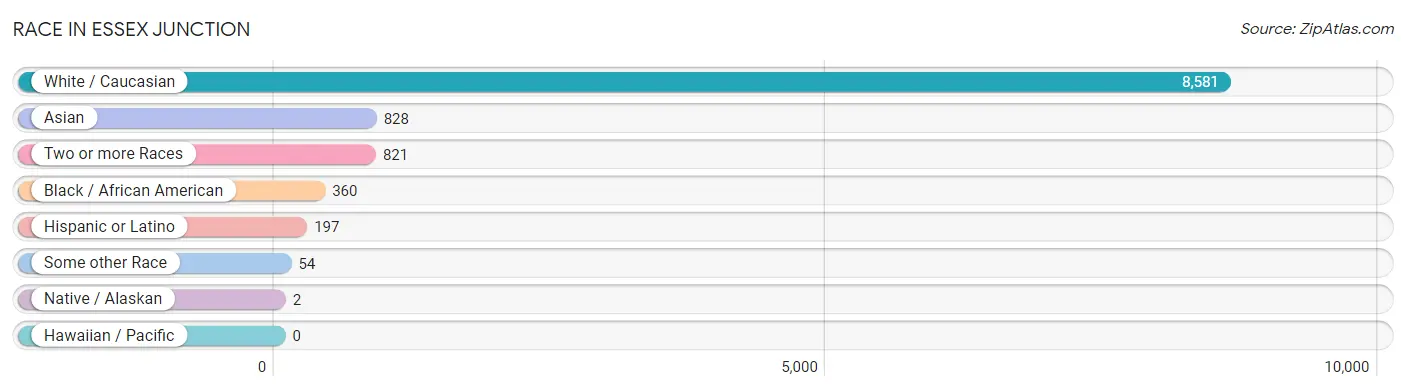
| Race | # Population | % Population |
| Asian | 828 | 7.8% |
| Black / African American | 360 | 3.4% |
| Hawaiian / Pacific | 0 | 0.0% |
| Hispanic or Latino | 197 | 1.8% |
| Native / Alaskan | 2 | 0.0% |
| White / Caucasian | 8,581 | 80.6% |
| Two or more Races | 821 | 7.7% |
| Some other Race | 54 | 0.5% |
| Total | 10,646 | 100.0% |
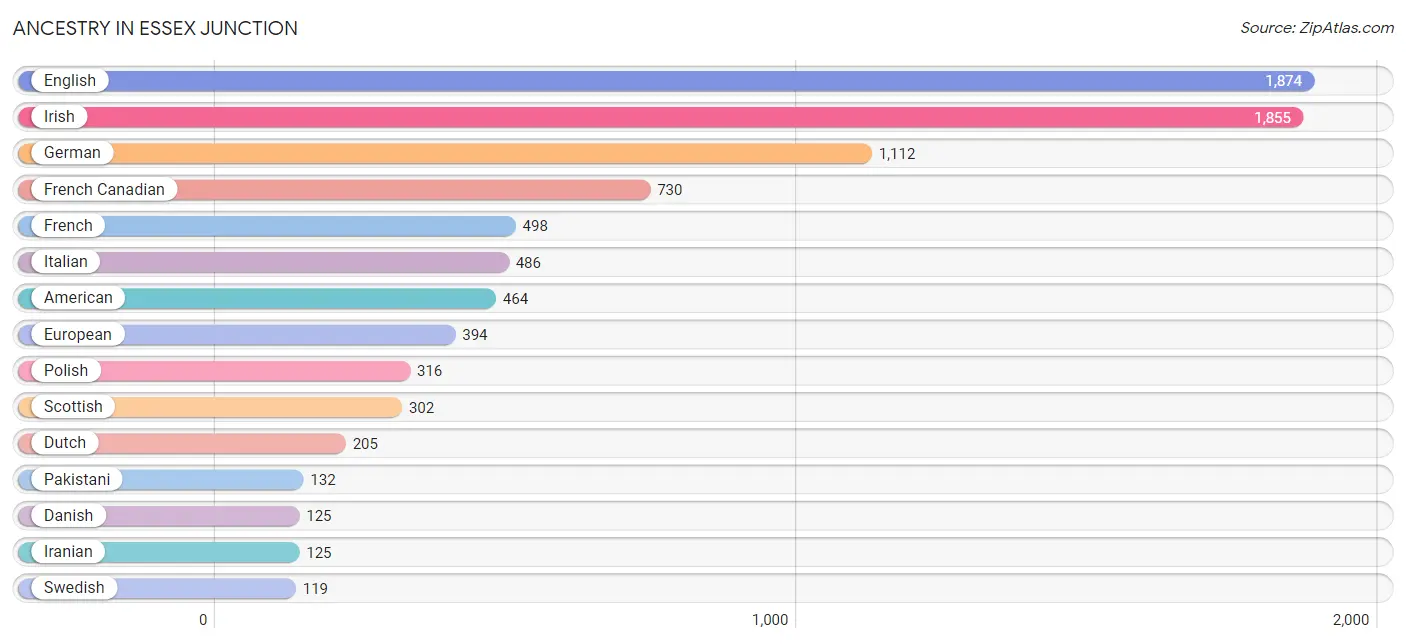
Ancestry in Essex Junction
The most populous ancestries reported in Essex Junction are English (1,874 | 17.6%), Irish (1,855 | 17.4%), German (1,112 | 10.4%), French Canadian (730 | 6.9%), and French (498 | 4.7%), together accounting for 57.0% of all Essex Junction residents.
| Ancestry | # Population | % Population |
| African | 36 | 0.3% |
| American | 464 | 4.4% |
| Arab | 98 | 0.9% |
| Argentinean | 82 | 0.8% |
| Armenian | 9 | 0.1% |
| Austrian | 66 | 0.6% |
| Bhutanese | 23 | 0.2% |
| Brazilian | 48 | 0.4% |
| British | 107 | 1.0% |
| Burmese | 15 | 0.1% |
| Canadian | 35 | 0.3% |
| Celtic | 26 | 0.2% |
| Central American | 2 | 0.0% |
| Croatian | 42 | 0.4% |
| Cuban | 15 | 0.1% |
| Danish | 125 | 1.2% |
| Dutch | 205 | 1.9% |
| Eastern European | 25 | 0.2% |
| English | 1,874 | 17.6% |
| European | 394 | 3.7% |
| Finnish | 22 | 0.2% |
| French | 498 | 4.7% |
| French American Indian | 2 | 0.0% |
| French Canadian | 730 | 6.9% |
| German | 1,112 | 10.4% |
| Greek | 58 | 0.5% |
| Hungarian | 36 | 0.3% |
| Indian (Asian) | 89 | 0.8% |
| Iranian | 125 | 1.2% |
| Irish | 1,855 | 17.4% |
| Italian | 486 | 4.6% |
| Korean | 25 | 0.2% |
| Lebanese | 95 | 0.9% |
| Lithuanian | 43 | 0.4% |
| Mexican | 39 | 0.4% |
| Mexican American Indian | 2 | 0.0% |
| Mongolian | 8 | 0.1% |
| New Zealander | 13 | 0.1% |
| Norwegian | 60 | 0.6% |
| Pakistani | 132 | 1.2% |
| Polish | 316 | 3.0% |
| Portuguese | 65 | 0.6% |
| Puerto Rican | 16 | 0.2% |
| Romanian | 41 | 0.4% |
| Russian | 90 | 0.9% |
| Salvadoran | 2 | 0.0% |
| Scandinavian | 49 | 0.5% |
| Scotch-Irish | 91 | 0.9% |
| Scottish | 302 | 2.8% |
| Senegalese | 19 | 0.2% |
| Slovak | 14 | 0.1% |
| Slovene | 11 | 0.1% |
| South American | 99 | 0.9% |
| Spaniard | 5 | 0.1% |
| Spanish | 21 | 0.2% |
| Sri Lankan | 38 | 0.4% |
| Subsaharan African | 55 | 0.5% |
| Swedish | 119 | 1.1% |
| Syrian | 59 | 0.5% |
| Thai | 59 | 0.5% |
| Ukrainian | 64 | 0.6% |
| Venezuelan | 17 | 0.2% |
| Welsh | 92 | 0.9% |
| Yugoslavian | 63 | 0.6% | View All 64 Rows |
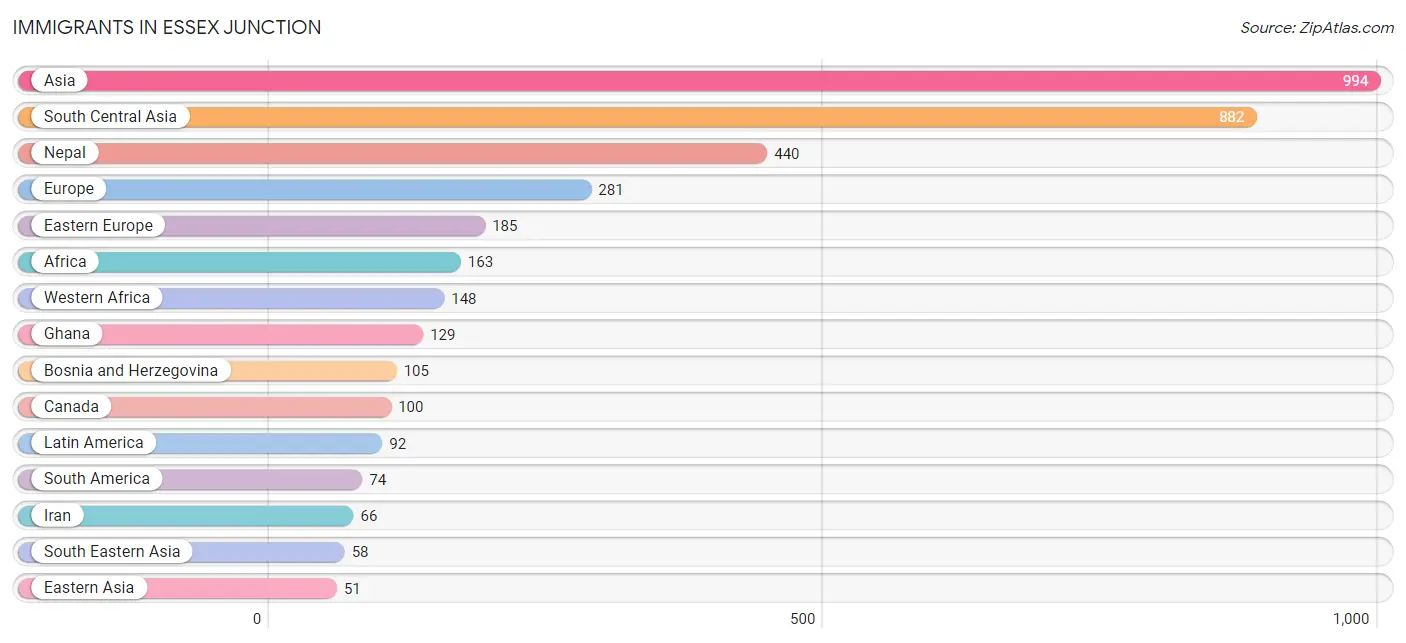
Immigrants in Essex Junction
The most numerous immigrant groups reported in Essex Junction came from Asia (994 | 9.3%), South Central Asia (882 | 8.3%), Nepal (440 | 4.1%), Europe (281 | 2.6%), and Eastern Europe (185 | 1.7%), together accounting for 26.1% of all Essex Junction residents.
| Immigration Origin | # Population | % Population |
| Africa | 163 | 1.5% |
| Argentina | 19 | 0.2% |
| Asia | 994 | 9.3% |
| Bosnia and Herzegovina | 105 | 1.0% |
| Brazil | 48 | 0.4% |
| Canada | 100 | 0.9% |
| Caribbean | 15 | 0.1% |
| Central America | 3 | 0.0% |
| China | 36 | 0.3% |
| Cuba | 15 | 0.1% |
| Czechoslovakia | 14 | 0.1% |
| Eastern Africa | 15 | 0.1% |
| Eastern Asia | 51 | 0.5% |
| Eastern Europe | 185 | 1.7% |
| England | 11 | 0.1% |
| Europe | 281 | 2.6% |
| Germany | 35 | 0.3% |
| Ghana | 129 | 1.2% |
| India | 26 | 0.2% |
| Iran | 66 | 0.6% |
| Iraq | 3 | 0.0% |
| Ireland | 20 | 0.2% |
| Italy | 13 | 0.1% |
| Korea | 15 | 0.1% |
| Latin America | 92 | 0.9% |
| Lithuania | 21 | 0.2% |
| Mexico | 3 | 0.0% |
| Moldova | 20 | 0.2% |
| Nepal | 440 | 4.1% |
| Netherlands | 12 | 0.1% |
| Northern Europe | 31 | 0.3% |
| Philippines | 20 | 0.2% |
| Poland | 1 | 0.0% |
| Senegal | 19 | 0.2% |
| South America | 74 | 0.7% |
| South Central Asia | 882 | 8.3% |
| South Eastern Asia | 58 | 0.5% |
| Southern Europe | 18 | 0.2% |
| Spain | 5 | 0.1% |
| Venezuela | 7 | 0.1% |
| Vietnam | 38 | 0.4% |
| Western Africa | 148 | 1.4% |
| Western Asia | 3 | 0.0% |
| Western Europe | 47 | 0.4% | View All 44 Rows |
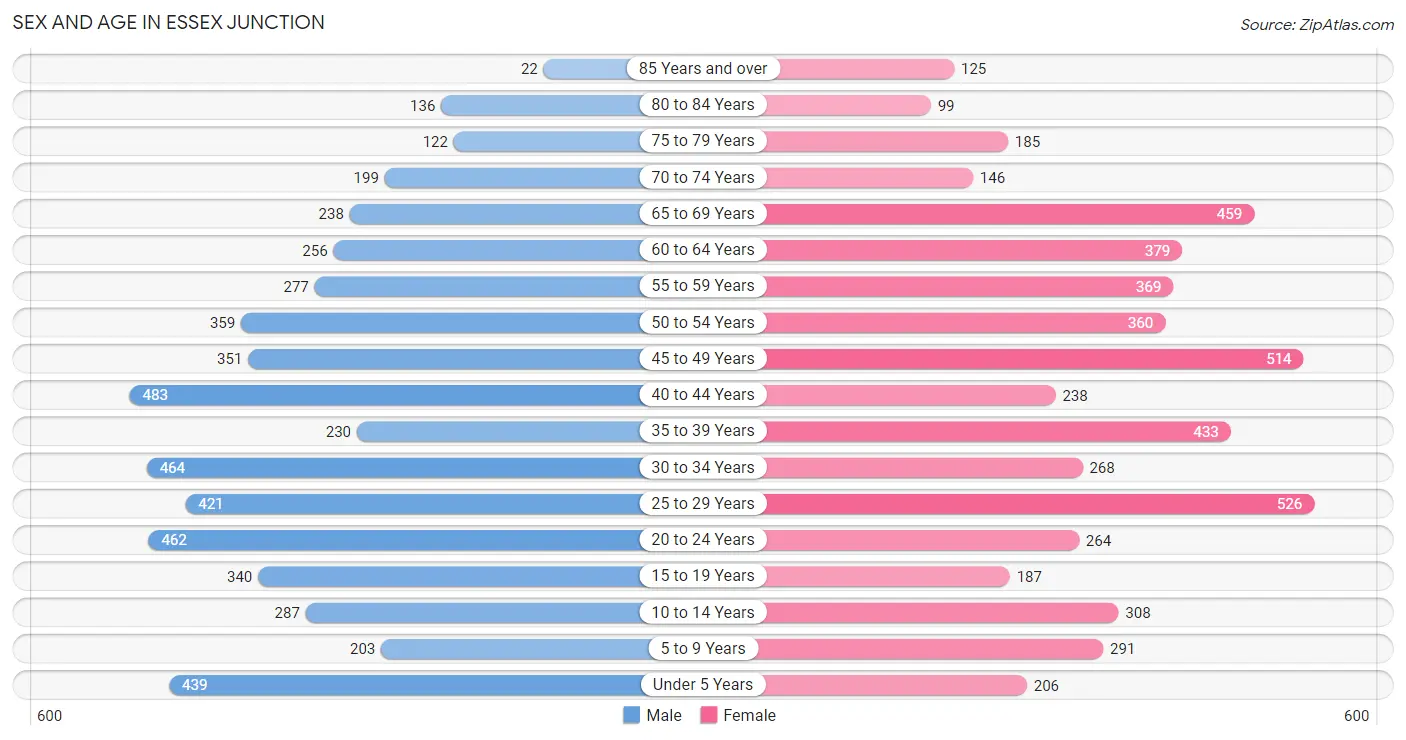
Sex and Age in Essex Junction
Sex and Age in Essex Junction
The most populous age groups in Essex Junction are 40 to 44 Years (483 | 9.1%) for men and 25 to 29 Years (526 | 9.8%) for women.
| Age Bracket | Male | Female |
| Under 5 Years | 439 (8.3%) | 206 (3.8%) |
| 5 to 9 Years | 203 (3.8%) | 291 (5.4%) |
| 10 to 14 Years | 287 (5.4%) | 308 (5.8%) |
| 15 to 19 Years | 340 (6.4%) | 187 (3.5%) |
| 20 to 24 Years | 462 (8.7%) | 264 (4.9%) |
| 25 to 29 Years | 421 (8.0%) | 526 (9.8%) |
| 30 to 34 Years | 464 (8.8%) | 268 (5.0%) |
| 35 to 39 Years | 230 (4.3%) | 433 (8.1%) |
| 40 to 44 Years | 483 (9.1%) | 238 (4.4%) |
| 45 to 49 Years | 351 (6.6%) | 514 (9.6%) |
| 50 to 54 Years | 359 (6.8%) | 360 (6.7%) |
| 55 to 59 Years | 277 (5.2%) | 369 (6.9%) |
| 60 to 64 Years | 256 (4.8%) | 379 (7.1%) |
| 65 to 69 Years | 238 (4.5%) | 459 (8.6%) |
| 70 to 74 Years | 199 (3.8%) | 146 (2.7%) |
| 75 to 79 Years | 122 (2.3%) | 185 (3.5%) |
| 80 to 84 Years | 136 (2.6%) | 99 (1.8%) |
| 85 Years and over | 22 (0.4%) | 125 (2.3%) |
| Total | 5,289 (100.0%) | 5,357 (100.0%) |
Families and Households in Essex Junction
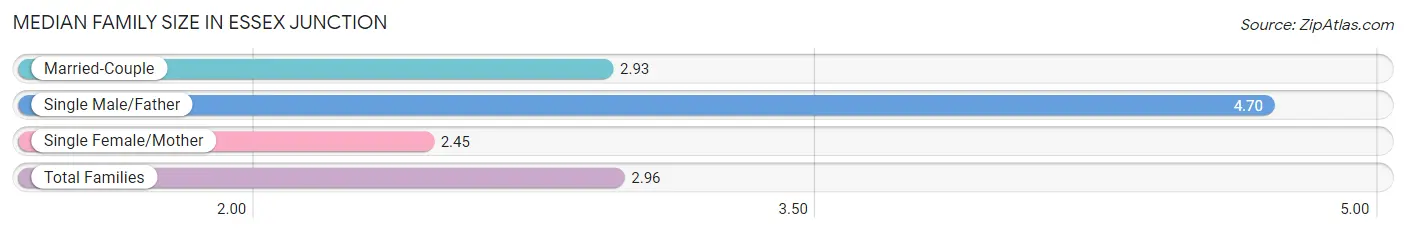
Median Family Size in Essex Junction
The median family size in Essex Junction is 2.96 persons per family, with single male/father families (149 | 5.2%) accounting for the largest median family size of 4.7 persons per family. On the other hand, single female/mother families (374 | 13.2%) represent the smallest median family size with 2.45 persons per family.
| Family Type | # Families | Family Size |
| Married-Couple | 2,313 (81.6%) | 2.93 |
| Single Male/Father | 149 (5.2%) | 4.70 |
| Single Female/Mother | 374 (13.2%) | 2.45 |
| Total Families | 2,836 (100.0%) | 2.96 |
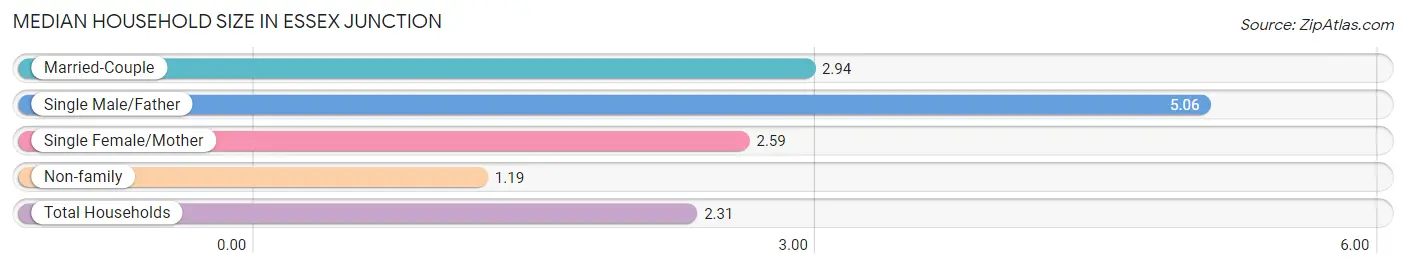
Median Household Size in Essex Junction
The median household size in Essex Junction is 2.31 persons per household, with single male/father households (149 | 3.2%) accounting for the largest median household size of 5.06 persons per household. non-family households (1,768 | 38.4%) represent the smallest median household size with 1.19 persons per household.
| Household Type | # Households | Household Size |
| Married-Couple | 2,313 (50.2%) | 2.94 |
| Single Male/Father | 149 (3.2%) | 5.06 |
| Single Female/Mother | 374 (8.1%) | 2.59 |
| Non-family | 1,768 (38.4%) | 1.19 |
| Total Households | 4,604 (100.0%) | 2.31 |
Household Size by Marriage Status in Essex Junction
Out of a total of 4,604 households in Essex Junction, 2,836 (61.6%) are family households, while 1,768 (38.4%) are nonfamily households. The most numerous type of family households are 2-person households, comprising 1,176, and the most common type of nonfamily households are 1-person households, comprising 1,422.
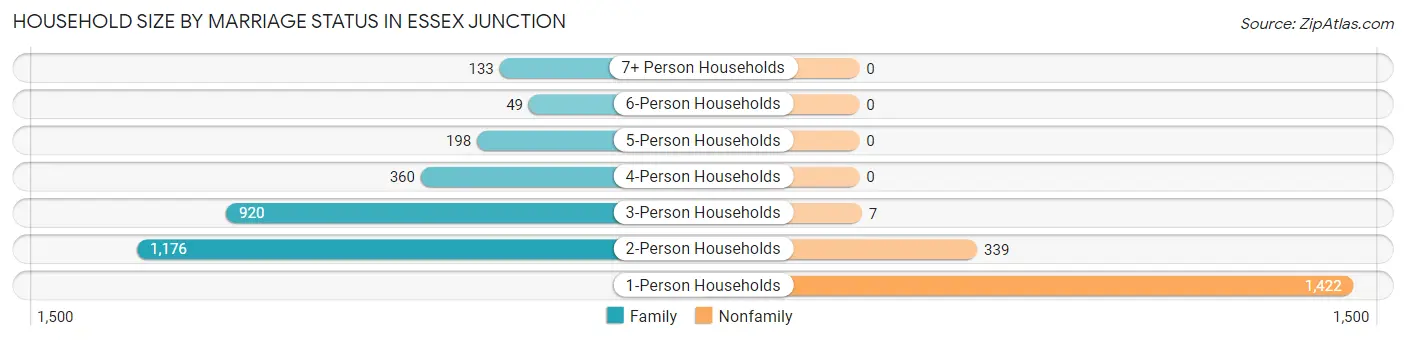
| Household Size | Family Households | Nonfamily Households |
| 1-Person Households | - | 1,422 (30.9%) |
| 2-Person Households | 1,176 (25.5%) | 339 (7.4%) |
| 3-Person Households | 920 (20.0%) | 7 (0.2%) |
| 4-Person Households | 360 (7.8%) | 0 (0.0%) |
| 5-Person Households | 198 (4.3%) | 0 (0.0%) |
| 6-Person Households | 49 (1.1%) | 0 (0.0%) |
| 7+ Person Households | 133 (2.9%) | 0 (0.0%) |
| Total | 2,836 (61.6%) | 1,768 (38.4%) |
Female Fertility in Essex Junction
Fertility by Age in Essex Junction
Average fertility rate in Essex Junction is 78.0 births per 1,000 women. Women in the age bracket of 20 to 34 years have the highest fertility rate with 96.0 births per 1,000 women. Women in the age bracket of 20 to 34 years acount for 53.1% of all women with births.
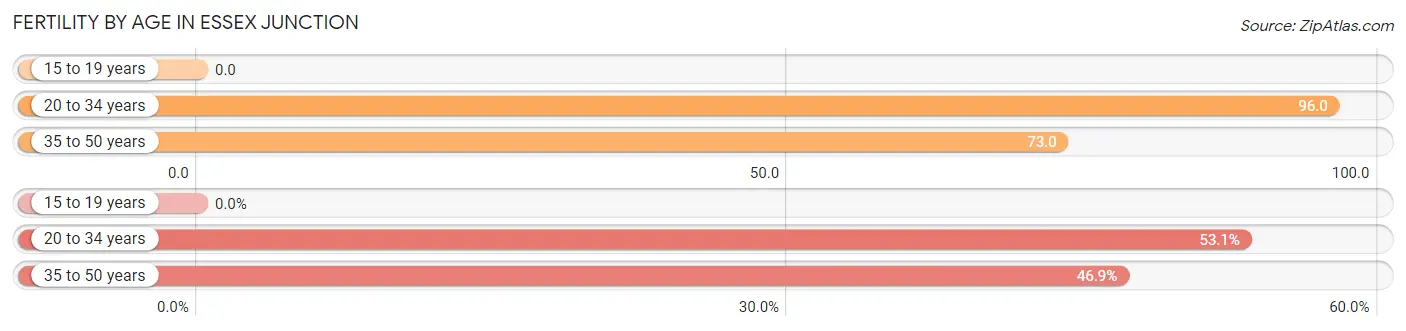
| Age Bracket | Women with Births | Births / 1,000 Women |
| 15 to 19 years | 0 (0.0%) | 0.0 |
| 20 to 34 years | 102 (53.1%) | 96.0 |
| 35 to 50 years | 90 (46.9%) | 73.0 |
| Total | 192 (100.0%) | 78.0 |
Fertility by Age by Marriage Status in Essex Junction
91.1% of women with births (192) in Essex Junction are married. The highest percentage of unmarried women with births falls into 20 to 34 years age bracket with 16.7% of them unmarried at the time of birth, while the lowest percentage of unmarried women with births belong to 35 to 50 years age bracket with 0.0% of them unmarried.
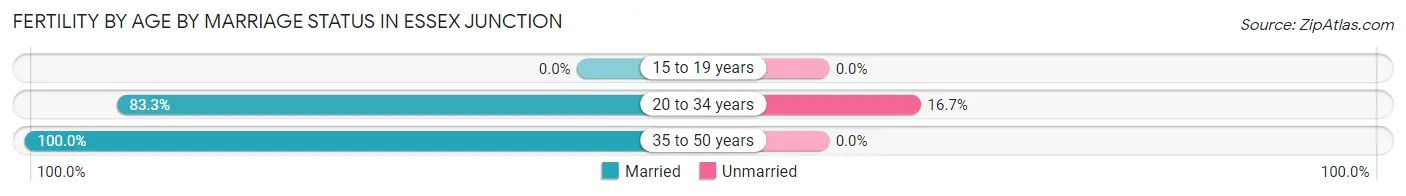
| Age Bracket | Married | Unmarried |
| 15 to 19 years | 0 (0.0%) | 0 (0.0%) |
| 20 to 34 years | 85 (83.3%) | 17 (16.7%) |
| 35 to 50 years | 90 (100.0%) | 0 (0.0%) |
| Total | 175 (91.1%) | 17 (8.8%) |
Fertility by Education in Essex Junction
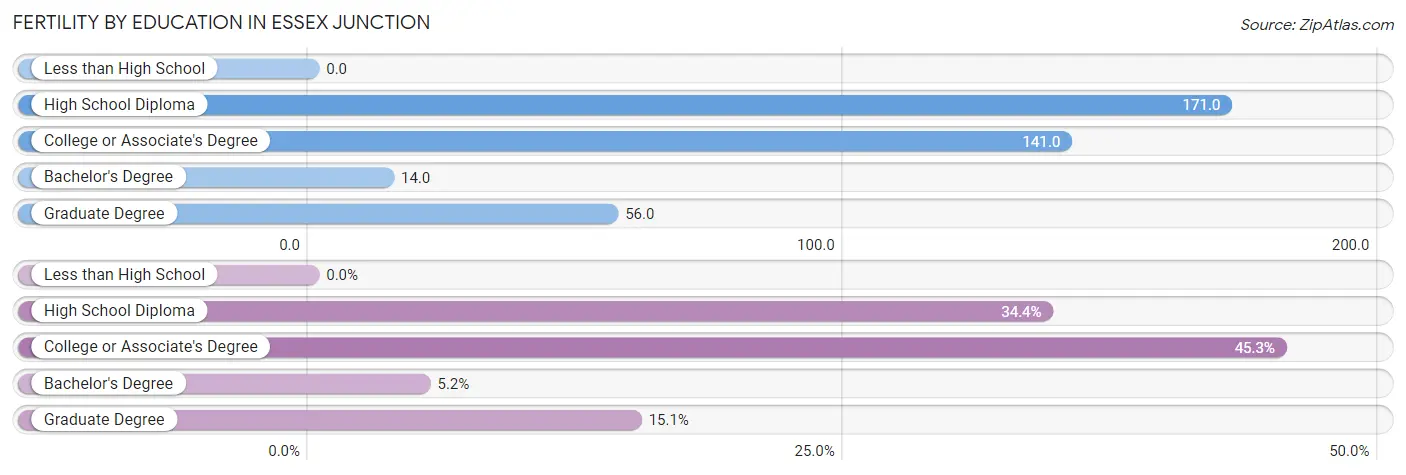
| Educational Attainment | Women with Births | Births / 1,000 Women |
| Less than High School | 0 (0.0%) | 0.0 |
| High School Diploma | 66 (34.4%) | 171.0 |
| College or Associate's Degree | 87 (45.3%) | 141.0 |
| Bachelor's Degree | 10 (5.2%) | 14.0 |
| Graduate Degree | 29 (15.1%) | 56.0 |
| Total | 192 (100.0%) | 78.0 |
Fertility by Education by Marriage Status in Essex Junction
8.8% of women with births in Essex Junction are unmarried. Women with the educational attainment of high school diploma are most likely to be married with 100.0% of them married at childbirth, while women with the educational attainment of college or associate's degree are least likely to be married with 19.5% of them unmarried at childbirth.
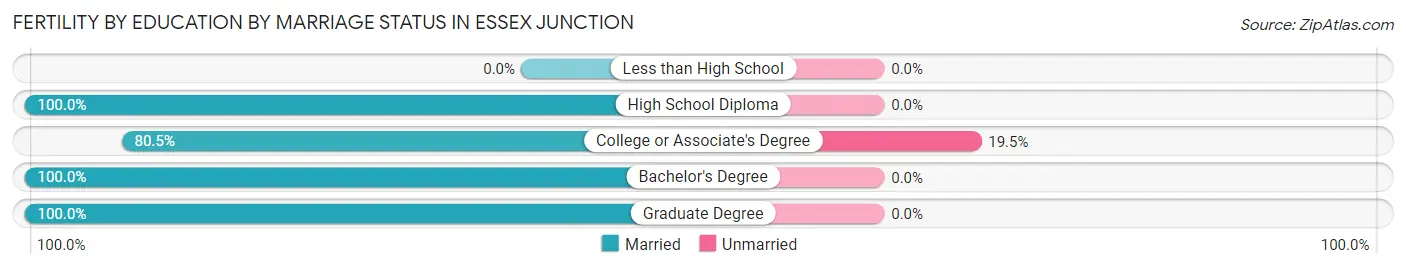
| Educational Attainment | Married | Unmarried |
| Less than High School | 0 (0.0%) | 0 (0.0%) |
| High School Diploma | 66 (100.0%) | 0 (0.0%) |
| College or Associate's Degree | 70 (80.5%) | 17 (19.5%) |
| Bachelor's Degree | 10 (100.0%) | 0 (0.0%) |
| Graduate Degree | 29 (100.0%) | 0 (0.0%) |
| Total | 175 (91.1%) | 17 (8.8%) |
Employment Characteristics in Essex Junction
Employment by Class of Employer in Essex Junction
Among the 6,131 employed individuals in Essex Junction, private company employees (3,655 | 59.6%), not-for-profit organizations (816 | 13.3%), and local government employees (353 | 5.8%) make up the most common classes of employment.
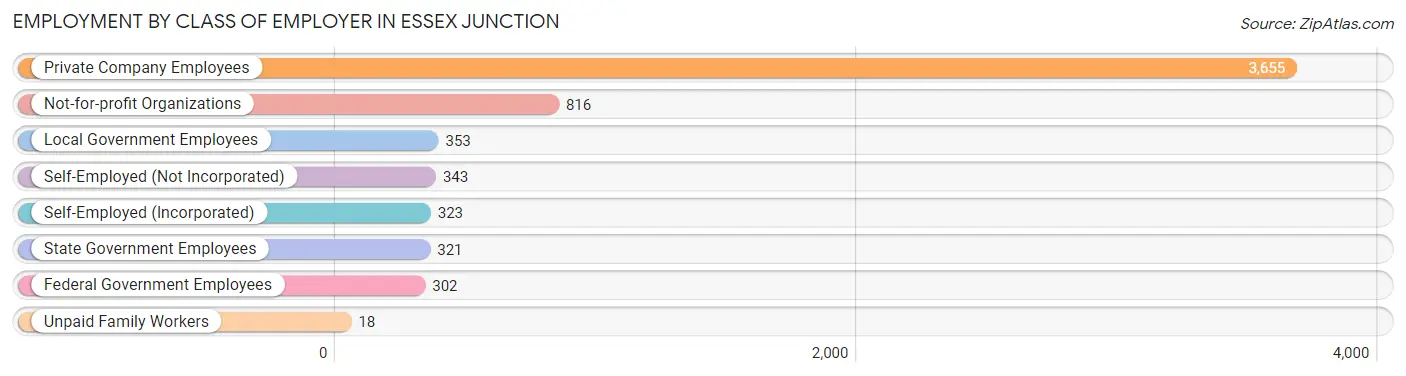
| Employer Class | # Employees | % Employees |
| Private Company Employees | 3,655 | 59.6% |
| Self-Employed (Incorporated) | 323 | 5.3% |
| Self-Employed (Not Incorporated) | 343 | 5.6% |
| Not-for-profit Organizations | 816 | 13.3% |
| Local Government Employees | 353 | 5.8% |
| State Government Employees | 321 | 5.2% |
| Federal Government Employees | 302 | 4.9% |
| Unpaid Family Workers | 18 | 0.3% |
| Total | 6,131 | 100.0% |
Employment Status by Age in Essex Junction
According to the labor force statistics for Essex Junction, out of the total population over 16 years of age (8,802), 71.9% or 6,329 individuals are in the labor force, with 2.5% or 158 of them unemployed. The age group with the highest labor force participation rate is 55 to 59 years, with 98.5% or 636 individuals in the labor force. Within the labor force, the 20 to 24 years age range has the highest percentage of unemployed individuals, with 17.5% or 89 of them being unemployed.
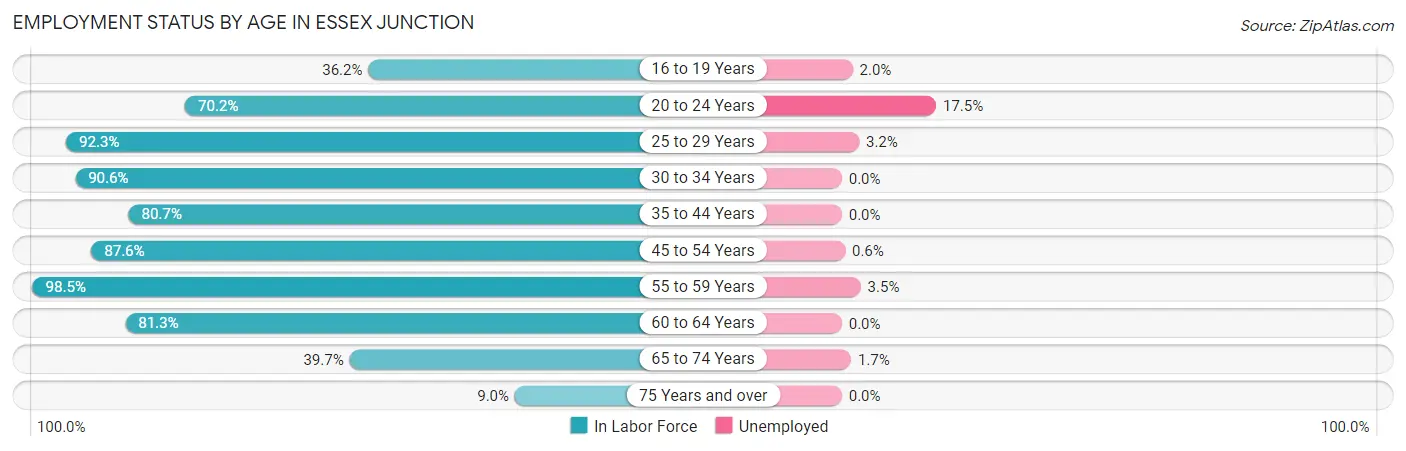
| Age Bracket | In Labor Force | Unemployed |
| 16 to 19 Years | 151 (36.2%) | 3 (2.0%) |
| 20 to 24 Years | 510 (70.2%) | 89 (17.5%) |
| 25 to 29 Years | 874 (92.3%) | 28 (3.2%) |
| 30 to 34 Years | 663 (90.6%) | 0 (0.0%) |
| 35 to 44 Years | 1,117 (80.7%) | 0 (0.0%) |
| 45 to 54 Years | 1,388 (87.6%) | 8 (0.6%) |
| 55 to 59 Years | 636 (98.5%) | 22 (3.5%) |
| 60 to 64 Years | 516 (81.3%) | 0 (0.0%) |
| 65 to 74 Years | 414 (39.7%) | 7 (1.7%) |
| 75 Years and over | 62 (9.0%) | 0 (0.0%) |
| Total | 6,329 (71.9%) | 158 (2.5%) |
Employment Status by Educational Attainment in Essex Junction
According to labor force statistics for Essex Junction, 87.6% of individuals (5,193) out of the total population between 25 and 64 years of age (5,928) are in the labor force, with 1.1% or 57 of them being unemployed. The group with the highest labor force participation rate are those with the educational attainment of bachelor's degree or higher, with 94.7% or 2,810 individuals in the labor force. Within the labor force, individuals with less than high school education have the highest percentage of unemployment, with 1.4% or 5 of them being unemployed.
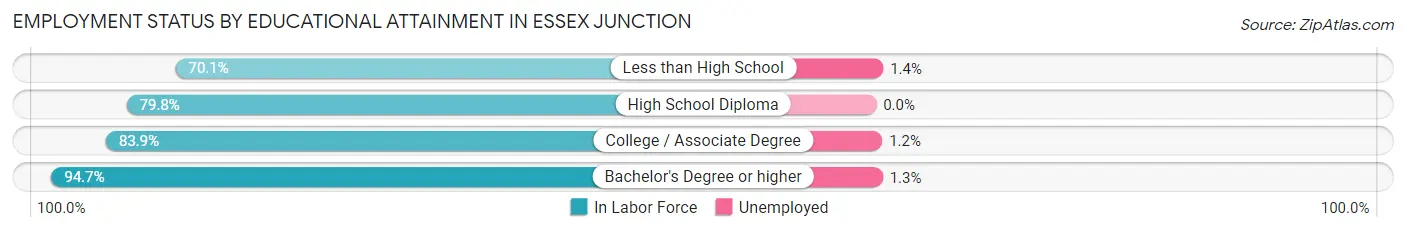
| Educational Attainment | In Labor Force | Unemployed |
| Less than High School | 354 (70.1%) | 7 (1.4%) |
| High School Diploma | 620 (79.8%) | 0 (0.0%) |
| College / Associate Degree | 1,409 (83.9%) | 20 (1.2%) |
| Bachelor's Degree or higher | 2,810 (94.7%) | 39 (1.3%) |
| Total | 5,193 (87.6%) | 65 (1.1%) |
Employment Occupations by Sex in Essex Junction
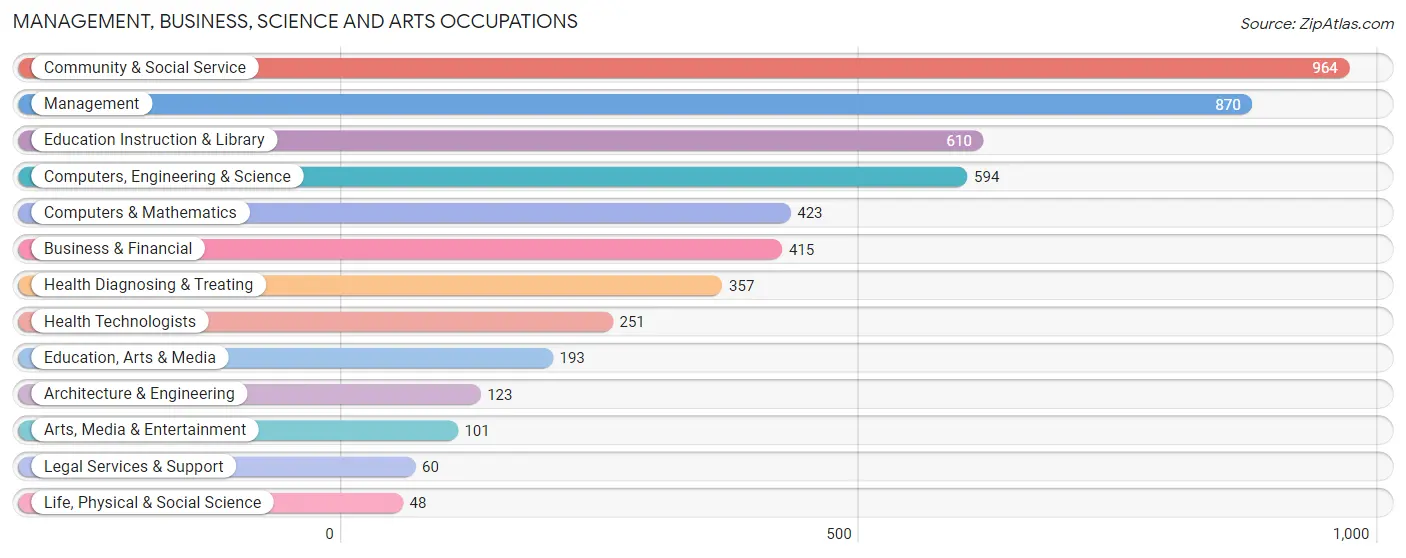
Management, Business, Science and Arts Occupations
The most common Management, Business, Science and Arts occupations in Essex Junction are Community & Social Service (964 | 15.8%), Management (870 | 14.2%), Education Instruction & Library (610 | 10.0%), Computers, Engineering & Science (594 | 9.7%), and Computers & Mathematics (423 | 6.9%).
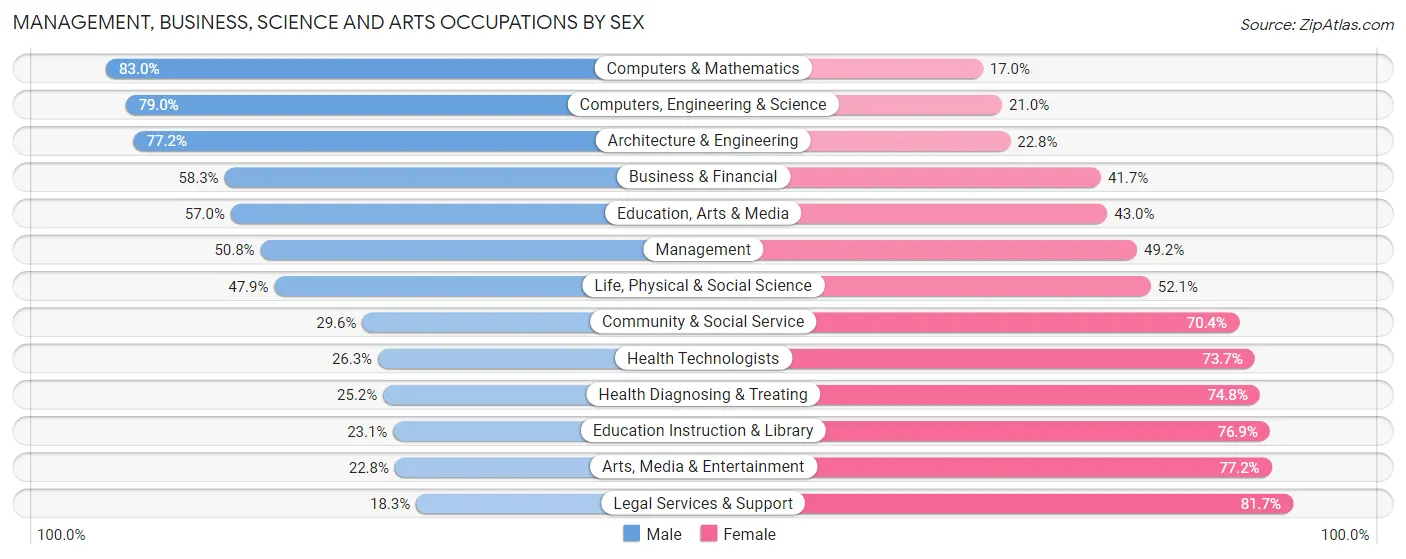
Management, Business, Science and Arts Occupations by Sex
Within the Management, Business, Science and Arts occupations in Essex Junction, the most male-oriented occupations are Computers & Mathematics (83.0%), Computers, Engineering & Science (79.0%), and Architecture & Engineering (77.2%), while the most female-oriented occupations are Legal Services & Support (81.7%), Arts, Media & Entertainment (77.2%), and Education Instruction & Library (76.9%).
| Occupation | Male | Female |
| Management | 442 (50.8%) | 428 (49.2%) |
| Business & Financial | 242 (58.3%) | 173 (41.7%) |
| Computers, Engineering & Science | 469 (79.0%) | 125 (21.0%) |
| Computers & Mathematics | 351 (83.0%) | 72 (17.0%) |
| Architecture & Engineering | 95 (77.2%) | 28 (22.8%) |
| Life, Physical & Social Science | 23 (47.9%) | 25 (52.1%) |
| Community & Social Service | 285 (29.6%) | 679 (70.4%) |
| Education, Arts & Media | 110 (57.0%) | 83 (43.0%) |
| Legal Services & Support | 11 (18.3%) | 49 (81.7%) |
| Education Instruction & Library | 141 (23.1%) | 469 (76.9%) |
| Arts, Media & Entertainment | 23 (22.8%) | 78 (77.2%) |
| Health Diagnosing & Treating | 90 (25.2%) | 267 (74.8%) |
| Health Technologists | 66 (26.3%) | 185 (73.7%) |
| Total (Category) | 1,528 (47.7%) | 1,672 (52.2%) |
| Total (Overall) | 3,131 (51.2%) | 2,989 (48.8%) |
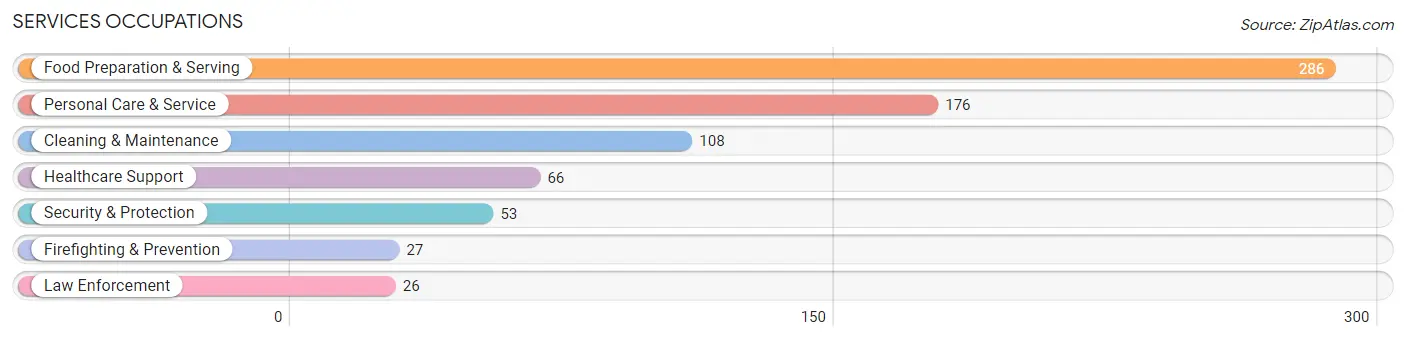
Services Occupations
The most common Services occupations in Essex Junction are Food Preparation & Serving (286 | 4.7%), Personal Care & Service (176 | 2.9%), Cleaning & Maintenance (108 | 1.8%), Healthcare Support (66 | 1.1%), and Security & Protection (53 | 0.9%).
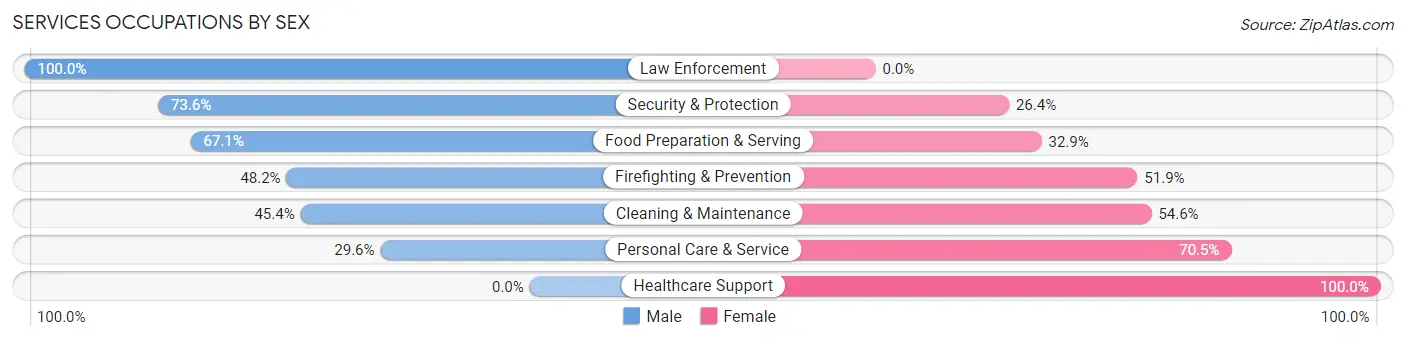
Services Occupations by Sex
Within the Services occupations in Essex Junction, the most male-oriented occupations are Law Enforcement (100.0%), Security & Protection (73.6%), and Food Preparation & Serving (67.1%), while the most female-oriented occupations are Healthcare Support (100.0%), Personal Care & Service (70.5%), and Cleaning & Maintenance (54.6%).
| Occupation | Male | Female |
| Healthcare Support | 0 (0.0%) | 66 (100.0%) |
| Security & Protection | 39 (73.6%) | 14 (26.4%) |
| Firefighting & Prevention | 13 (48.1%) | 14 (51.8%) |
| Law Enforcement | 26 (100.0%) | 0 (0.0%) |
| Food Preparation & Serving | 192 (67.1%) | 94 (32.9%) |
| Cleaning & Maintenance | 49 (45.4%) | 59 (54.6%) |
| Personal Care & Service | 52 (29.5%) | 124 (70.5%) |
| Total (Category) | 332 (48.2%) | 357 (51.8%) |
| Total (Overall) | 3,131 (51.2%) | 2,989 (48.8%) |
Sales and Office Occupations
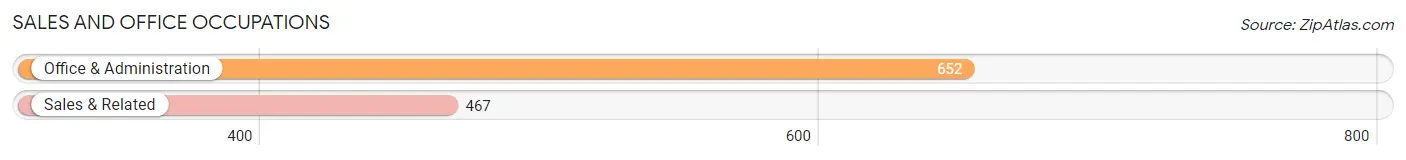
The most common Sales and Office occupations in Essex Junction are Office & Administration (652 | 10.6%), and Sales & Related (467 | 7.6%).
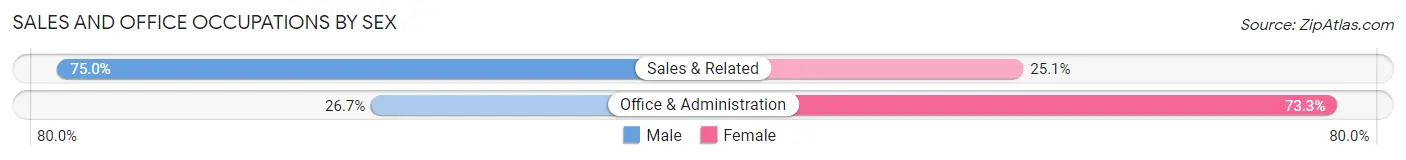
Sales and Office Occupations by Sex
| Occupation | Male | Female |
| Sales & Related | 350 (75.0%) | 117 (25.1%) |
| Office & Administration | 174 (26.7%) | 478 (73.3%) |
| Total (Category) | 524 (46.8%) | 595 (53.2%) |
| Total (Overall) | 3,131 (51.2%) | 2,989 (48.8%) |
Natural Resources, Construction and Maintenance Occupations
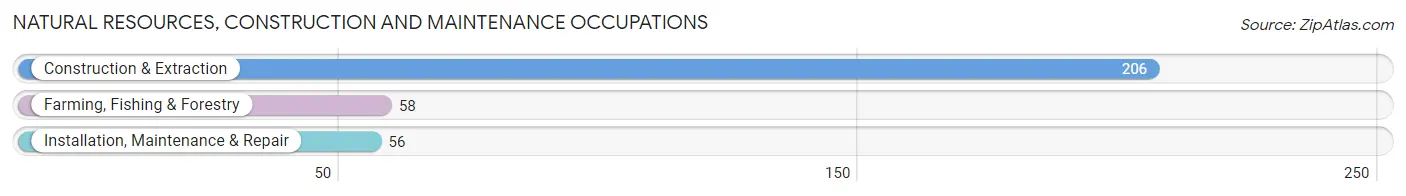
The most common Natural Resources, Construction and Maintenance occupations in Essex Junction are Construction & Extraction (206 | 3.4%), Farming, Fishing & Forestry (58 | 0.9%), and Installation, Maintenance & Repair (56 | 0.9%).
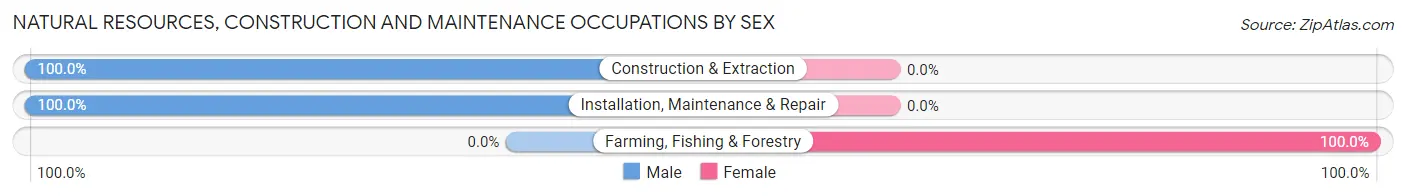
Natural Resources, Construction and Maintenance Occupations by Sex
| Occupation | Male | Female |
| Farming, Fishing & Forestry | 0 (0.0%) | 58 (100.0%) |
| Construction & Extraction | 206 (100.0%) | 0 (0.0%) |
| Installation, Maintenance & Repair | 56 (100.0%) | 0 (0.0%) |
| Total (Category) | 262 (81.9%) | 58 (18.1%) |
| Total (Overall) | 3,131 (51.2%) | 2,989 (48.8%) |
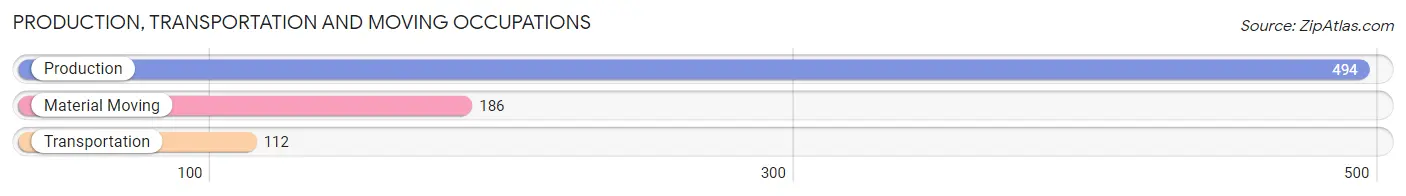
Production, Transportation and Moving Occupations
The most common Production, Transportation and Moving occupations in Essex Junction are Production (494 | 8.1%), Material Moving (186 | 3.0%), and Transportation (112 | 1.8%).
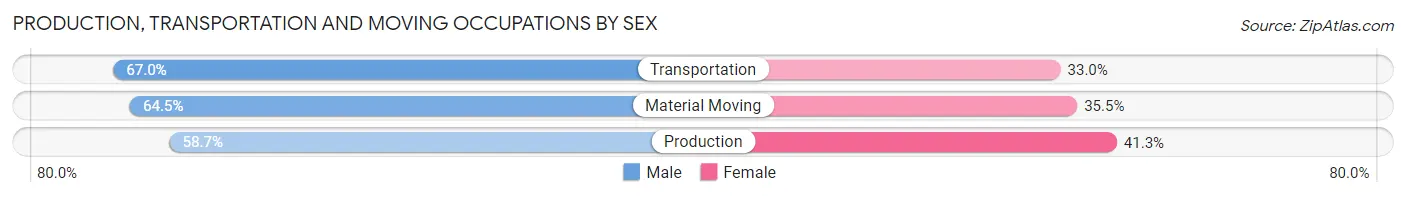
Production, Transportation and Moving Occupations by Sex
| Occupation | Male | Female |
| Production | 290 (58.7%) | 204 (41.3%) |
| Transportation | 75 (67.0%) | 37 (33.0%) |
| Material Moving | 120 (64.5%) | 66 (35.5%) |
| Total (Category) | 485 (61.2%) | 307 (38.8%) |
| Total (Overall) | 3,131 (51.2%) | 2,989 (48.8%) |
Employment Industries by Sex in Essex Junction
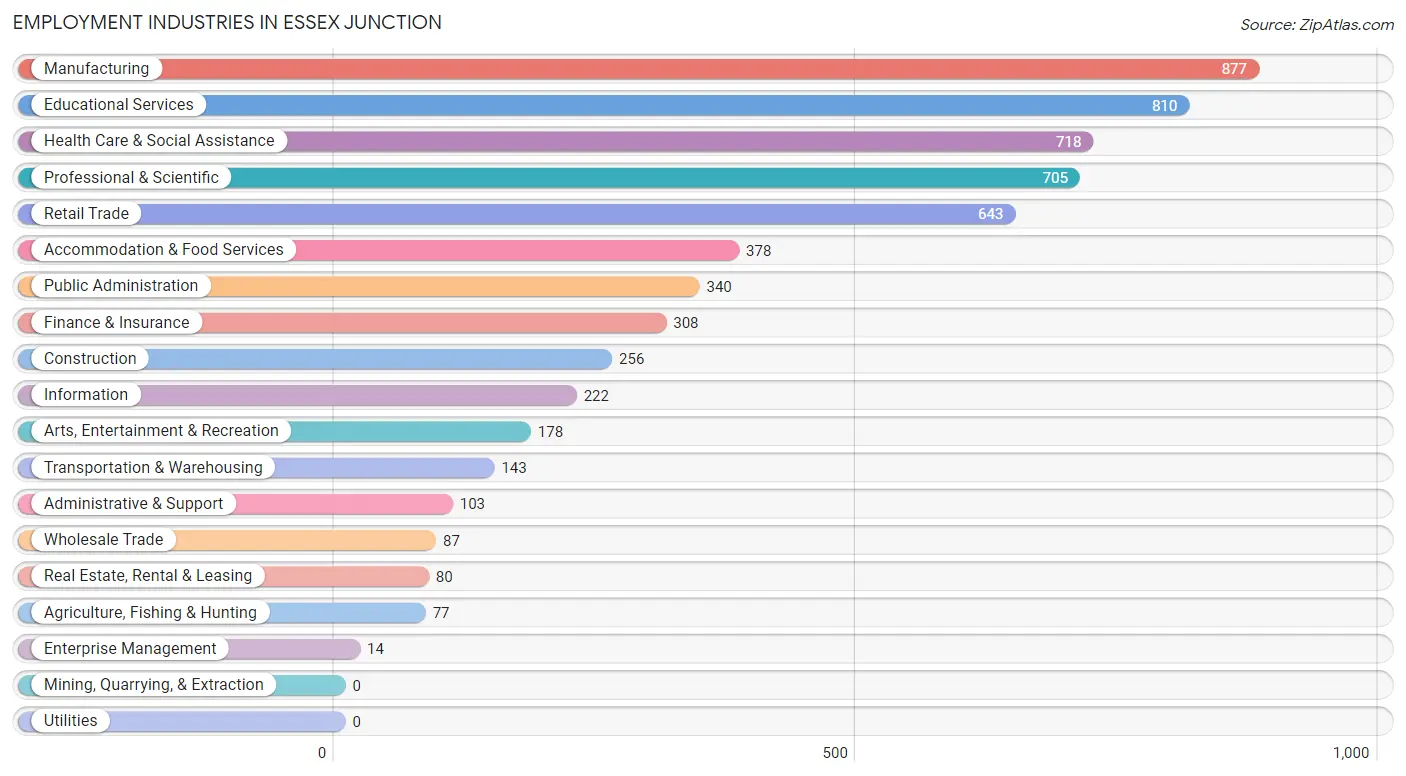
Employment Industries in Essex Junction
The major employment industries in Essex Junction include Manufacturing (877 | 14.3%), Educational Services (810 | 13.2%), Health Care & Social Assistance (718 | 11.7%), Professional & Scientific (705 | 11.5%), and Retail Trade (643 | 10.5%).
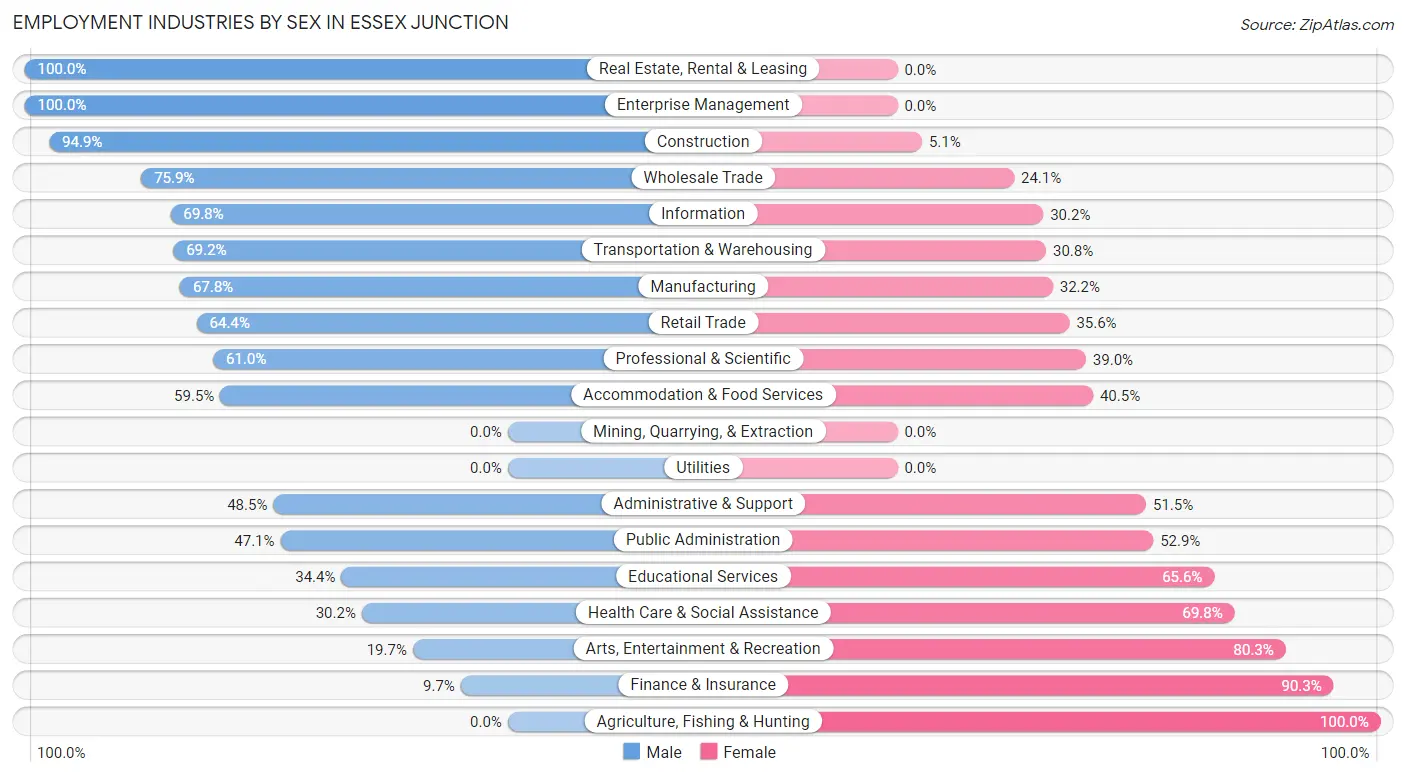
Employment Industries by Sex in Essex Junction
The Essex Junction industries that see more men than women are Real Estate, Rental & Leasing (100.0%), Enterprise Management (100.0%), and Construction (94.9%), whereas the industries that tend to have a higher number of women are Agriculture, Fishing & Hunting (100.0%), Finance & Insurance (90.3%), and Arts, Entertainment & Recreation (80.3%).
| Industry | Male | Female |
| Agriculture, Fishing & Hunting | 0 (0.0%) | 77 (100.0%) |
| Mining, Quarrying, & Extraction | 0 (0.0%) | 0 (0.0%) |
| Construction | 243 (94.9%) | 13 (5.1%) |
| Manufacturing | 595 (67.8%) | 282 (32.2%) |
| Wholesale Trade | 66 (75.9%) | 21 (24.1%) |
| Retail Trade | 414 (64.4%) | 229 (35.6%) |
| Transportation & Warehousing | 99 (69.2%) | 44 (30.8%) |
| Utilities | 0 (0.0%) | 0 (0.0%) |
| Information | 155 (69.8%) | 67 (30.2%) |
| Finance & Insurance | 30 (9.7%) | 278 (90.3%) |
| Real Estate, Rental & Leasing | 80 (100.0%) | 0 (0.0%) |
| Professional & Scientific | 430 (61.0%) | 275 (39.0%) |
| Enterprise Management | 14 (100.0%) | 0 (0.0%) |
| Administrative & Support | 50 (48.5%) | 53 (51.5%) |
| Educational Services | 279 (34.4%) | 531 (65.6%) |
| Health Care & Social Assistance | 217 (30.2%) | 501 (69.8%) |
| Arts, Entertainment & Recreation | 35 (19.7%) | 143 (80.3%) |
| Accommodation & Food Services | 225 (59.5%) | 153 (40.5%) |
| Public Administration | 160 (47.1%) | 180 (52.9%) |
| Total | 3,131 (51.2%) | 2,989 (48.8%) |
Education in Essex Junction
School Enrollment in Essex Junction
The most common levels of schooling among the 2,295 students in Essex Junction are high school (567 | 24.7%), college / undergraduate (483 | 21.0%), and middle school (388 | 16.9%).
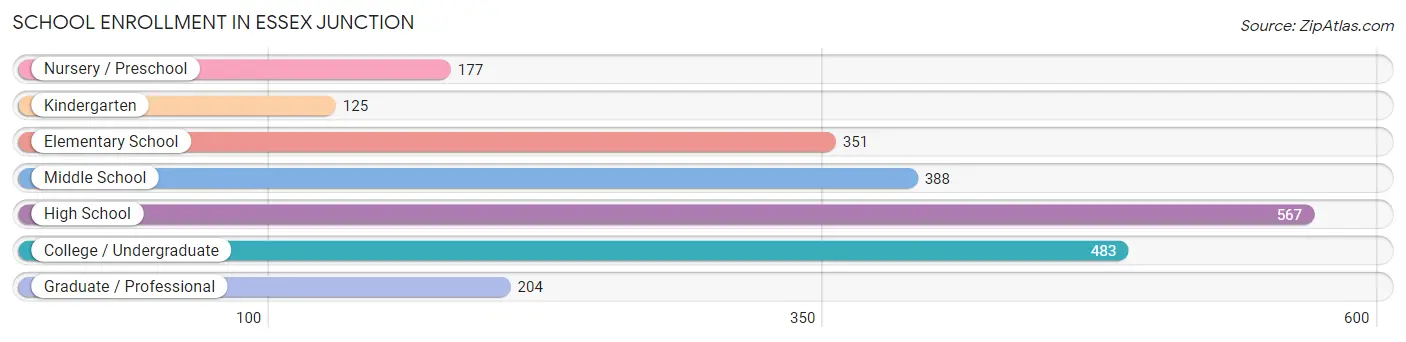
| School Level | # Students | % Students |
| Nursery / Preschool | 177 | 7.7% |
| Kindergarten | 125 | 5.4% |
| Elementary School | 351 | 15.3% |
| Middle School | 388 | 16.9% |
| High School | 567 | 24.7% |
| College / Undergraduate | 483 | 21.0% |
| Graduate / Professional | 204 | 8.9% |
| Total | 2,295 | 100.0% |
School Enrollment by Age by Funding Source in Essex Junction
Out of a total of 2,295 students who are enrolled in schools in Essex Junction, 225 (9.8%) attend a private institution, while the remaining 2,070 (90.2%) are enrolled in public schools. The age group of 35 years and over has the highest likelihood of being enrolled in private schools, with 39 (41.0% in the age bracket) enrolled. Conversely, the age group of 10 to 14 year olds has the lowest likelihood of being enrolled in a private school, with 588 (98.8% in the age bracket) attending a public institution.
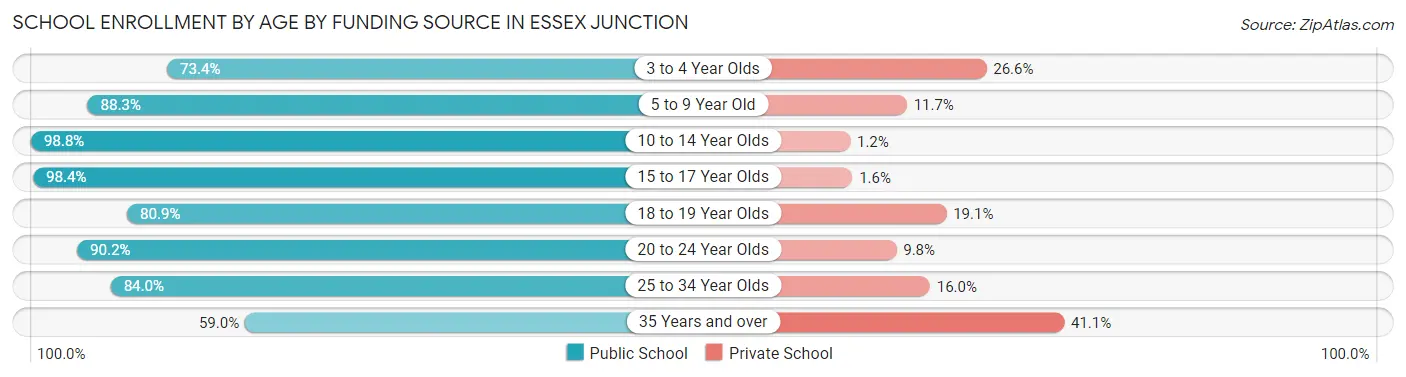
| Age Bracket | Public School | Private School |
| 3 to 4 Year Olds | 94 (73.4%) | 34 (26.6%) |
| 5 to 9 Year Old | 436 (88.3%) | 58 (11.7%) |
| 10 to 14 Year Olds | 588 (98.8%) | 7 (1.2%) |
| 15 to 17 Year Olds | 370 (98.4%) | 6 (1.6%) |
| 18 to 19 Year Olds | 72 (80.9%) | 17 (19.1%) |
| 20 to 24 Year Olds | 276 (90.2%) | 30 (9.8%) |
| 25 to 34 Year Olds | 178 (84.0%) | 34 (16.0%) |
| 35 Years and over | 56 (59.0%) | 39 (41.0%) |
| Total | 2,070 (90.2%) | 225 (9.8%) |
Educational Attainment by Field of Study in Essex Junction
Business (571 | 13.9%), education (483 | 11.7%), social sciences (375 | 9.1%), literature & languages (364 | 8.8%), and science & technology (349 | 8.5%) are the most common fields of study among 4,122 individuals in Essex Junction who have obtained a bachelor's degree or higher.
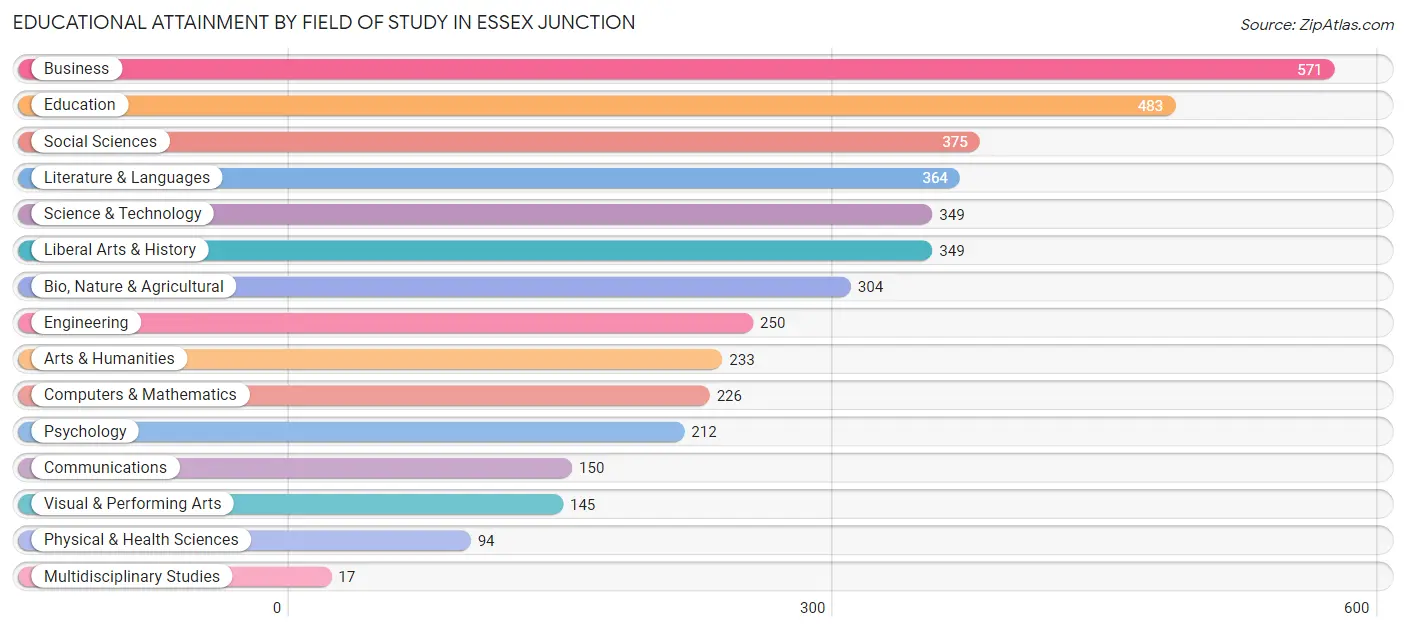
| Field of Study | # Graduates | % Graduates |
| Computers & Mathematics | 226 | 5.5% |
| Bio, Nature & Agricultural | 304 | 7.4% |
| Physical & Health Sciences | 94 | 2.3% |
| Psychology | 212 | 5.1% |
| Social Sciences | 375 | 9.1% |
| Engineering | 250 | 6.1% |
| Multidisciplinary Studies | 17 | 0.4% |
| Science & Technology | 349 | 8.5% |
| Business | 571 | 13.9% |
| Education | 483 | 11.7% |
| Literature & Languages | 364 | 8.8% |
| Liberal Arts & History | 349 | 8.5% |
| Visual & Performing Arts | 145 | 3.5% |
| Communications | 150 | 3.6% |
| Arts & Humanities | 233 | 5.7% |
| Total | 4,122 | 100.0% |
Transportation & Commute in Essex Junction
Vehicle Availability by Sex in Essex Junction
The most prevalent vehicle ownership categories in Essex Junction are males with 2 vehicles (1,474, accounting for 46.3%) and females with 2 vehicles (1,337, making up 50.1%).
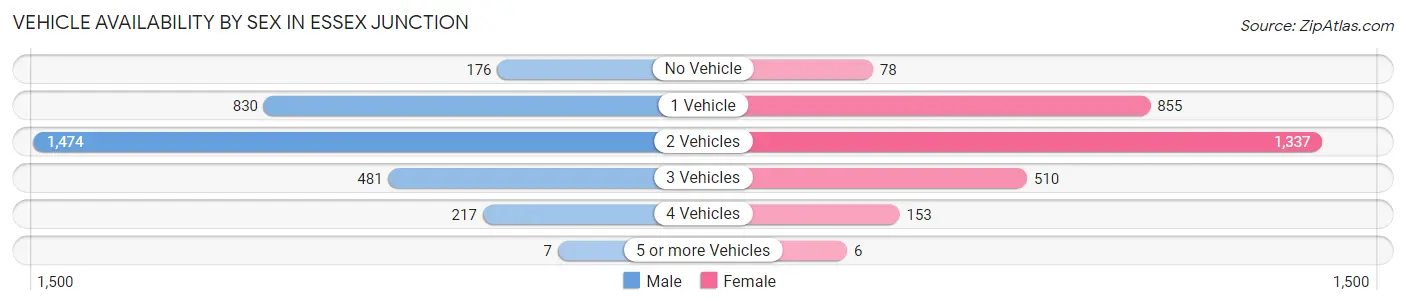
| Vehicles Available | Male | Female |
| No Vehicle | 176 (5.5%) | 78 (2.6%) |
| 1 Vehicle | 830 (26.1%) | 855 (29.1%) |
| 2 Vehicles | 1,474 (46.3%) | 1,337 (45.5%) |
| 3 Vehicles | 481 (15.1%) | 510 (17.3%) |
| 4 Vehicles | 217 (6.8%) | 153 (5.2%) |
| 5 or more Vehicles | 7 (0.2%) | 6 (0.2%) |
| Total | 3,185 (100.0%) | 2,939 (100.0%) |
Commute Time in Essex Junction
The most frequently occuring commute durations in Essex Junction are 15 to 19 minutes (1,195 commuters, 22.6%), 20 to 24 minutes (1,129 commuters, 21.3%), and 5 to 9 minutes (711 commuters, 13.4%).
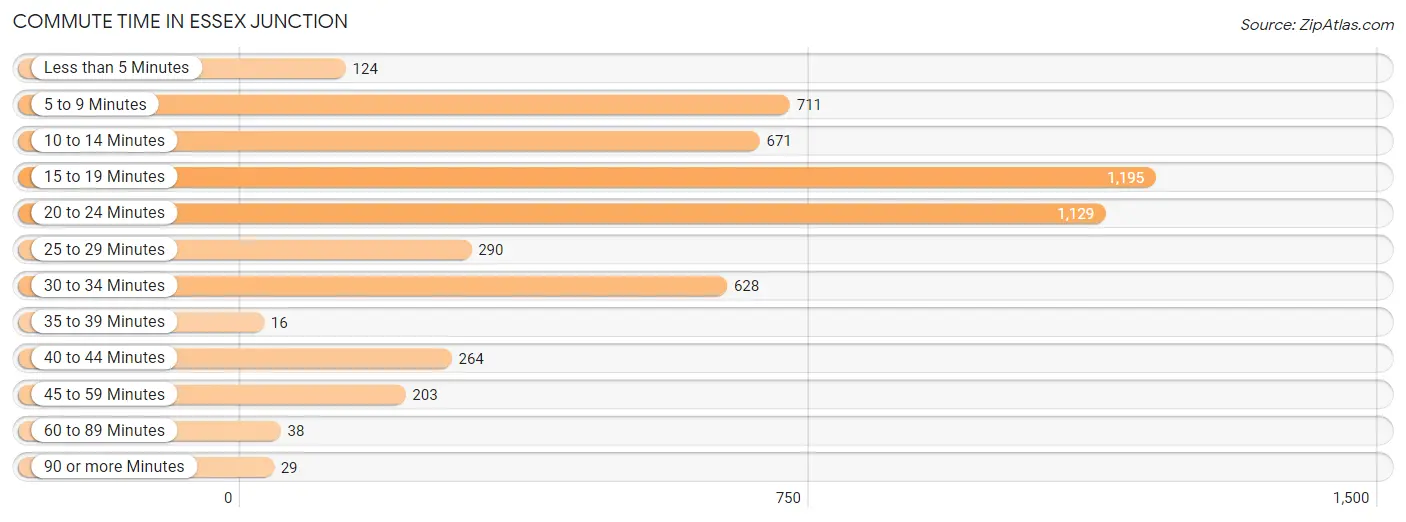
| Commute Time | # Commuters | % Commuters |
| Less than 5 Minutes | 124 | 2.3% |
| 5 to 9 Minutes | 711 | 13.4% |
| 10 to 14 Minutes | 671 | 12.7% |
| 15 to 19 Minutes | 1,195 | 22.6% |
| 20 to 24 Minutes | 1,129 | 21.3% |
| 25 to 29 Minutes | 290 | 5.5% |
| 30 to 34 Minutes | 628 | 11.8% |
| 35 to 39 Minutes | 16 | 0.3% |
| 40 to 44 Minutes | 264 | 5.0% |
| 45 to 59 Minutes | 203 | 3.8% |
| 60 to 89 Minutes | 38 | 0.7% |
| 90 or more Minutes | 29 | 0.5% |
Commute Time by Sex in Essex Junction
The most common commute times in Essex Junction are 15 to 19 minutes (840 commuters, 29.4%) for males and 5 to 9 minutes (431 commuters, 17.6%) for females.
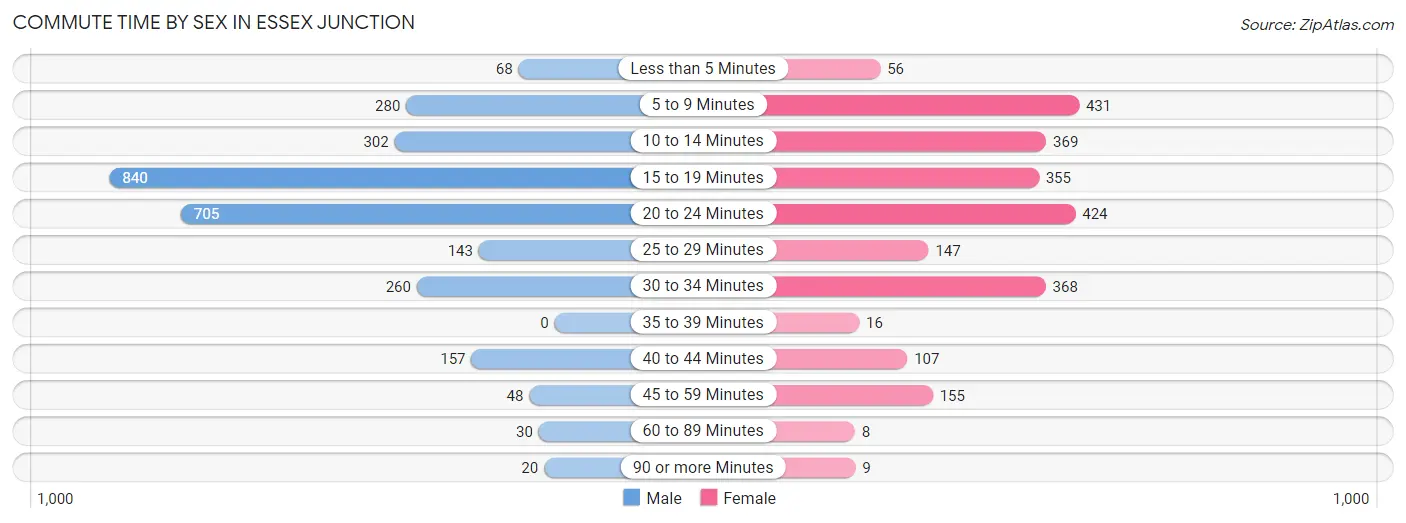
| Commute Time | Male | Female |
| Less than 5 Minutes | 68 (2.4%) | 56 (2.3%) |
| 5 to 9 Minutes | 280 (9.8%) | 431 (17.6%) |
| 10 to 14 Minutes | 302 (10.6%) | 369 (15.1%) |
| 15 to 19 Minutes | 840 (29.4%) | 355 (14.5%) |
| 20 to 24 Minutes | 705 (24.7%) | 424 (17.3%) |
| 25 to 29 Minutes | 143 (5.0%) | 147 (6.0%) |
| 30 to 34 Minutes | 260 (9.1%) | 368 (15.0%) |
| 35 to 39 Minutes | 0 (0.0%) | 16 (0.6%) |
| 40 to 44 Minutes | 157 (5.5%) | 107 (4.4%) |
| 45 to 59 Minutes | 48 (1.7%) | 155 (6.3%) |
| 60 to 89 Minutes | 30 (1.1%) | 8 (0.3%) |
| 90 or more Minutes | 20 (0.7%) | 9 (0.4%) |
Time of Departure to Work by Sex in Essex Junction
The most frequent times of departure to work in Essex Junction are 7:30 AM to 7:59 AM (560, 19.6%) for males and 7:00 AM to 7:29 AM (591, 24.2%) for females.
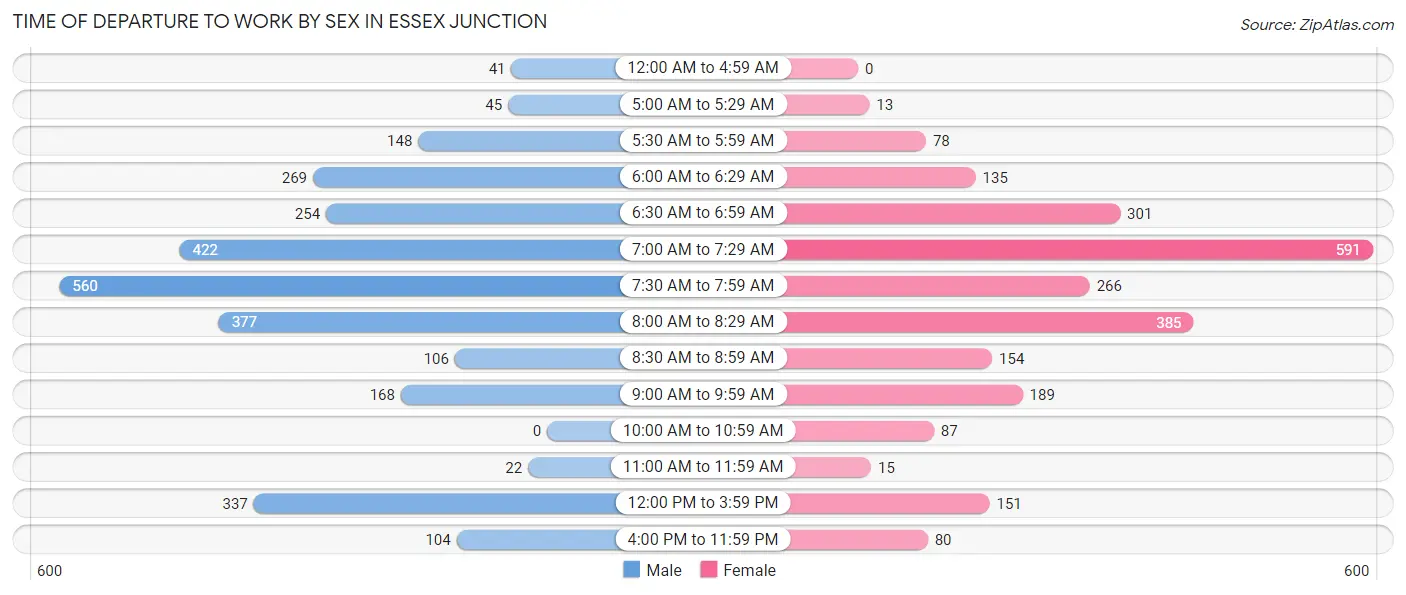
| Time of Departure | Male | Female |
| 12:00 AM to 4:59 AM | 41 (1.4%) | 0 (0.0%) |
| 5:00 AM to 5:29 AM | 45 (1.6%) | 13 (0.5%) |
| 5:30 AM to 5:59 AM | 148 (5.2%) | 78 (3.2%) |
| 6:00 AM to 6:29 AM | 269 (9.4%) | 135 (5.5%) |
| 6:30 AM to 6:59 AM | 254 (8.9%) | 301 (12.3%) |
| 7:00 AM to 7:29 AM | 422 (14.8%) | 591 (24.2%) |
| 7:30 AM to 7:59 AM | 560 (19.6%) | 266 (10.9%) |
| 8:00 AM to 8:29 AM | 377 (13.2%) | 385 (15.8%) |
| 8:30 AM to 8:59 AM | 106 (3.7%) | 154 (6.3%) |
| 9:00 AM to 9:59 AM | 168 (5.9%) | 189 (7.7%) |
| 10:00 AM to 10:59 AM | 0 (0.0%) | 87 (3.6%) |
| 11:00 AM to 11:59 AM | 22 (0.8%) | 15 (0.6%) |
| 12:00 PM to 3:59 PM | 337 (11.8%) | 151 (6.2%) |
| 4:00 PM to 11:59 PM | 104 (3.6%) | 80 (3.3%) |
| Total | 2,853 (100.0%) | 2,445 (100.0%) |
Housing Occupancy in Essex Junction
Occupancy by Ownership in Essex Junction
Of the total 4,604 dwellings in Essex Junction, owner-occupied units account for 2,785 (60.5%), while renter-occupied units make up 1,819 (39.5%).
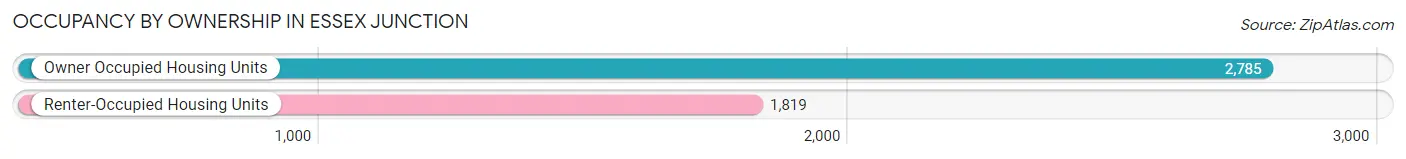
| Occupancy | # Housing Units | % Housing Units |
| Owner Occupied Housing Units | 2,785 | 60.5% |
| Renter-Occupied Housing Units | 1,819 | 39.5% |
| Total Occupied Housing Units | 4,604 | 100.0% |
Occupancy by Household Size in Essex Junction
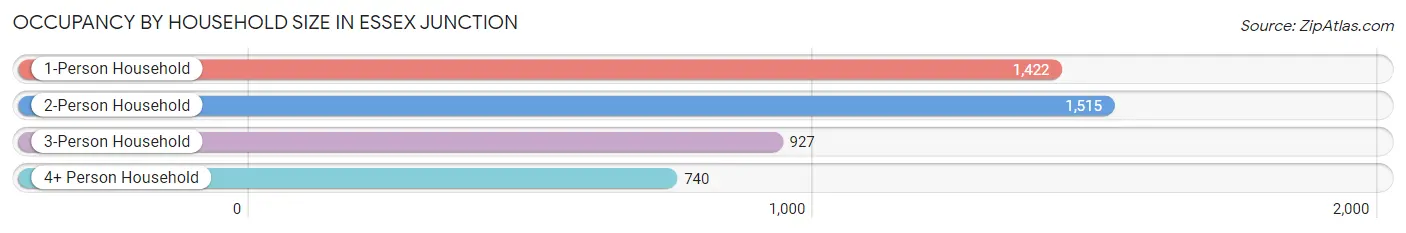
| Household Size | # Housing Units | % Housing Units |
| 1-Person Household | 1,422 | 30.9% |
| 2-Person Household | 1,515 | 32.9% |
| 3-Person Household | 927 | 20.1% |
| 4+ Person Household | 740 | 16.1% |
| Total Housing Units | 4,604 | 100.0% |
Occupancy by Ownership by Household Size in Essex Junction
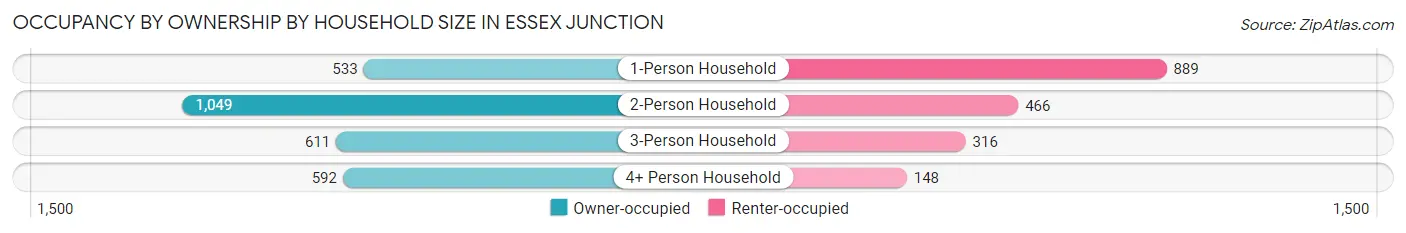
| Household Size | Owner-occupied | Renter-occupied |
| 1-Person Household | 533 (37.5%) | 889 (62.5%) |
| 2-Person Household | 1,049 (69.2%) | 466 (30.8%) |
| 3-Person Household | 611 (65.9%) | 316 (34.1%) |
| 4+ Person Household | 592 (80.0%) | 148 (20.0%) |
| Total Housing Units | 2,785 (60.5%) | 1,819 (39.5%) |
Occupancy by Educational Attainment in Essex Junction
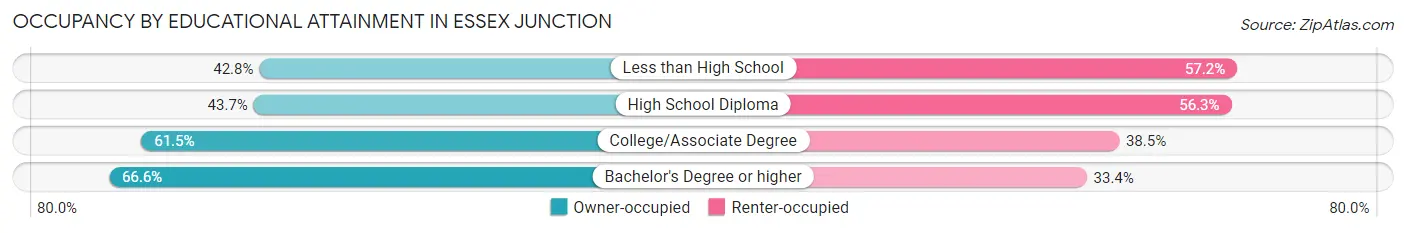
| Household Size | Owner-occupied | Renter-occupied |
| Less than High School | 148 (42.8%) | 198 (57.2%) |
| High School Diploma | 245 (43.7%) | 316 (56.3%) |
| College/Associate Degree | 851 (61.5%) | 533 (38.5%) |
| Bachelor's Degree or higher | 1,541 (66.6%) | 772 (33.4%) |
Occupancy by Age of Householder in Essex Junction
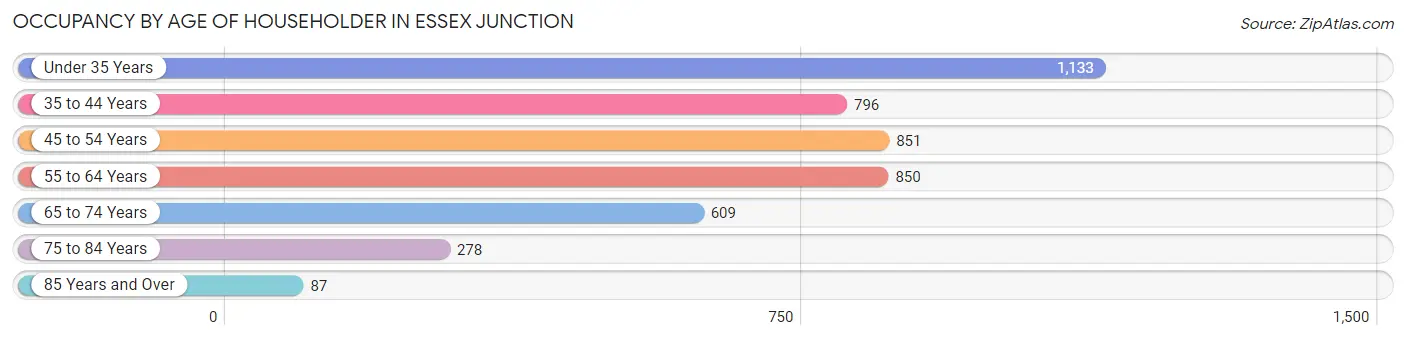
| Age Bracket | # Households | % Households |
| Under 35 Years | 1,133 | 24.6% |
| 35 to 44 Years | 796 | 17.3% |
| 45 to 54 Years | 851 | 18.5% |
| 55 to 64 Years | 850 | 18.5% |
| 65 to 74 Years | 609 | 13.2% |
| 75 to 84 Years | 278 | 6.0% |
| 85 Years and Over | 87 | 1.9% |
| Total | 4,604 | 100.0% |
Housing Finances in Essex Junction
Median Income by Occupancy in Essex Junction
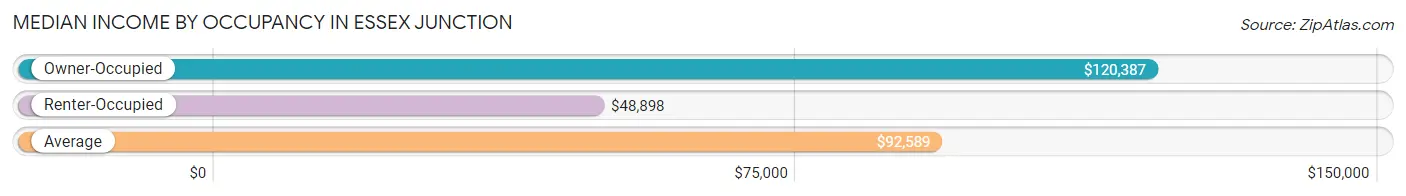
| Occupancy Type | # Households | Median Income |
| Owner-Occupied | 2,785 (60.5%) | $120,387 |
| Renter-Occupied | 1,819 (39.5%) | $48,898 |
| Average | 4,604 (100.0%) | $92,589 |
Occupancy by Householder Income Bracket in Essex Junction
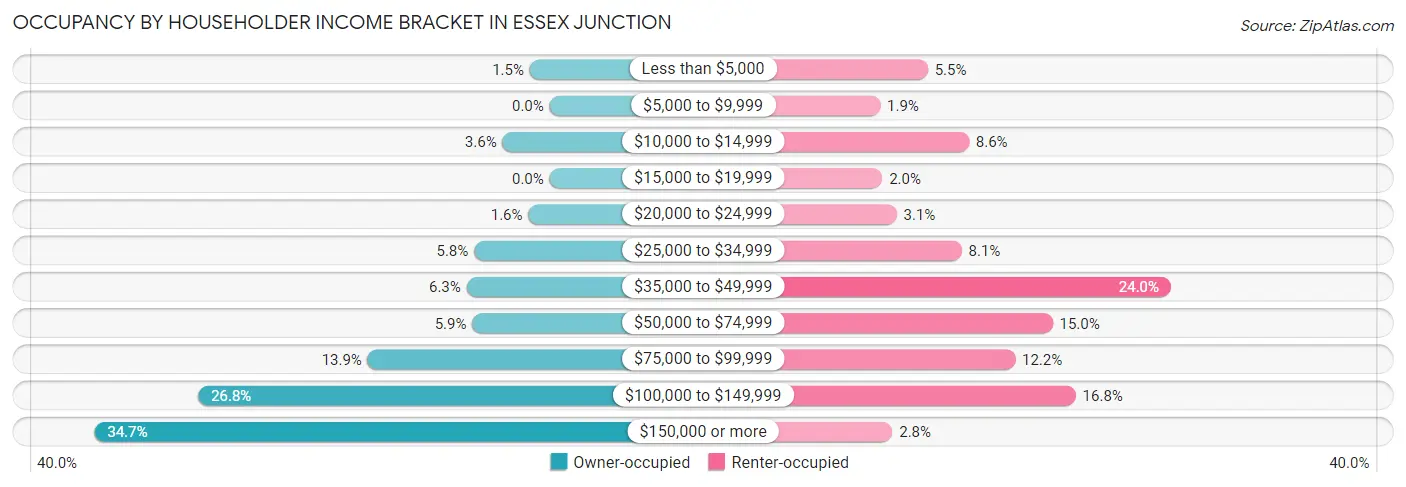
| Income Bracket | Owner-occupied | Renter-occupied |
| Less than $5,000 | 42 (1.5%) | 100 (5.5%) |
| $5,000 to $9,999 | 0 (0.0%) | 34 (1.9%) |
| $10,000 to $14,999 | 100 (3.6%) | 157 (8.6%) |
| $15,000 to $19,999 | 0 (0.0%) | 37 (2.0%) |
| $20,000 to $24,999 | 45 (1.6%) | 57 (3.1%) |
| $25,000 to $34,999 | 160 (5.8%) | 147 (8.1%) |
| $35,000 to $49,999 | 176 (6.3%) | 437 (24.0%) |
| $50,000 to $74,999 | 164 (5.9%) | 273 (15.0%) |
| $75,000 to $99,999 | 386 (13.9%) | 221 (12.1%) |
| $100,000 to $149,999 | 746 (26.8%) | 305 (16.8%) |
| $150,000 or more | 966 (34.7%) | 51 (2.8%) |
| Total | 2,785 (100.0%) | 1,819 (100.0%) |
Monthly Housing Cost Tiers in Essex Junction
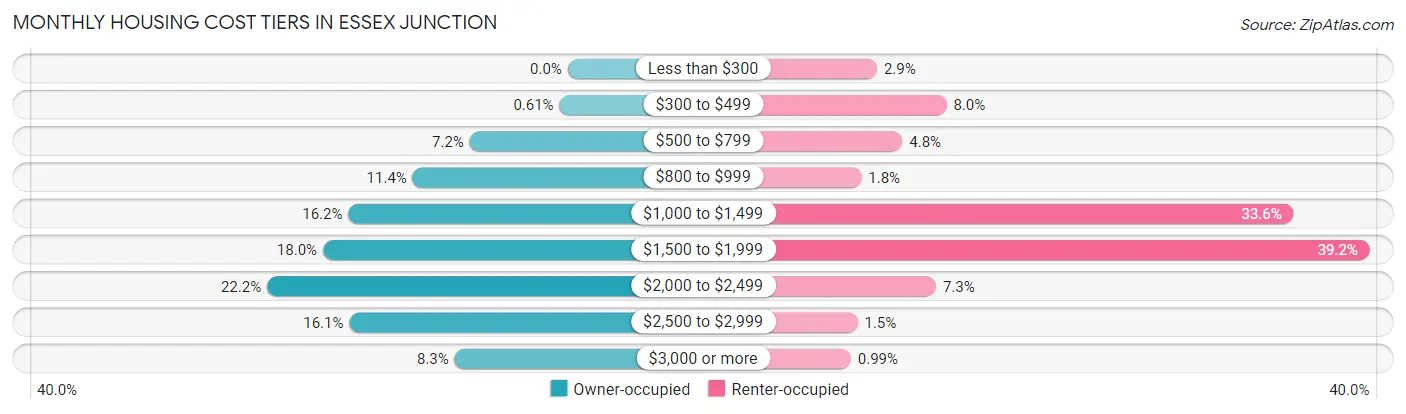
| Monthly Cost | Owner-occupied | Renter-occupied |
| Less than $300 | 0 (0.0%) | 53 (2.9%) |
| $300 to $499 | 17 (0.6%) | 146 (8.0%) |
| $500 to $799 | 201 (7.2%) | 87 (4.8%) |
| $800 to $999 | 318 (11.4%) | 32 (1.8%) |
| $1,000 to $1,499 | 450 (16.2%) | 611 (33.6%) |
| $1,500 to $1,999 | 502 (18.0%) | 713 (39.2%) |
| $2,000 to $2,499 | 617 (22.2%) | 132 (7.3%) |
| $2,500 to $2,999 | 448 (16.1%) | 27 (1.5%) |
| $3,000 or more | 232 (8.3%) | 18 (1.0%) |
| Total | 2,785 (100.0%) | 1,819 (100.0%) |
Physical Housing Characteristics in Essex Junction
Housing Structures in Essex Junction
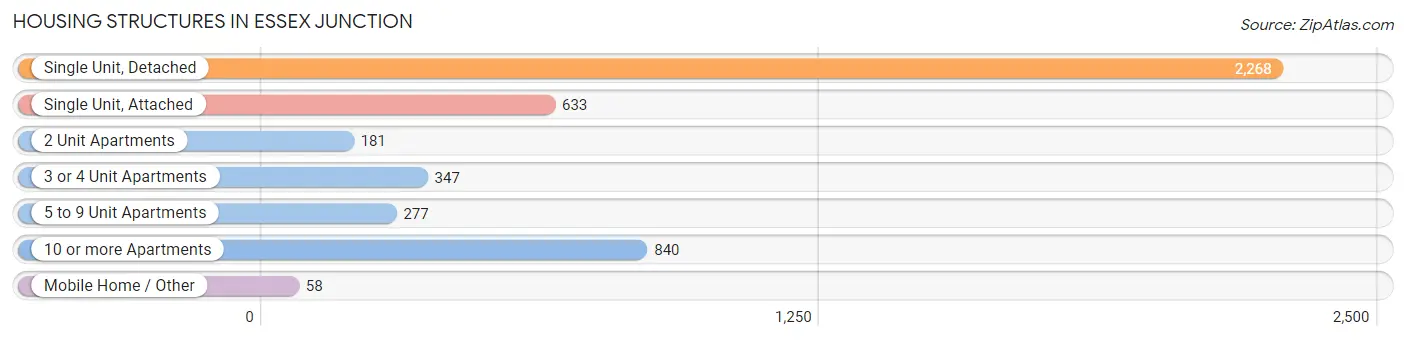
| Structure Type | # Housing Units | % Housing Units |
| Single Unit, Detached | 2,268 | 49.3% |
| Single Unit, Attached | 633 | 13.8% |
| 2 Unit Apartments | 181 | 3.9% |
| 3 or 4 Unit Apartments | 347 | 7.5% |
| 5 to 9 Unit Apartments | 277 | 6.0% |
| 10 or more Apartments | 840 | 18.2% |
| Mobile Home / Other | 58 | 1.3% |
| Total | 4,604 | 100.0% |
Housing Structures by Occupancy in Essex Junction
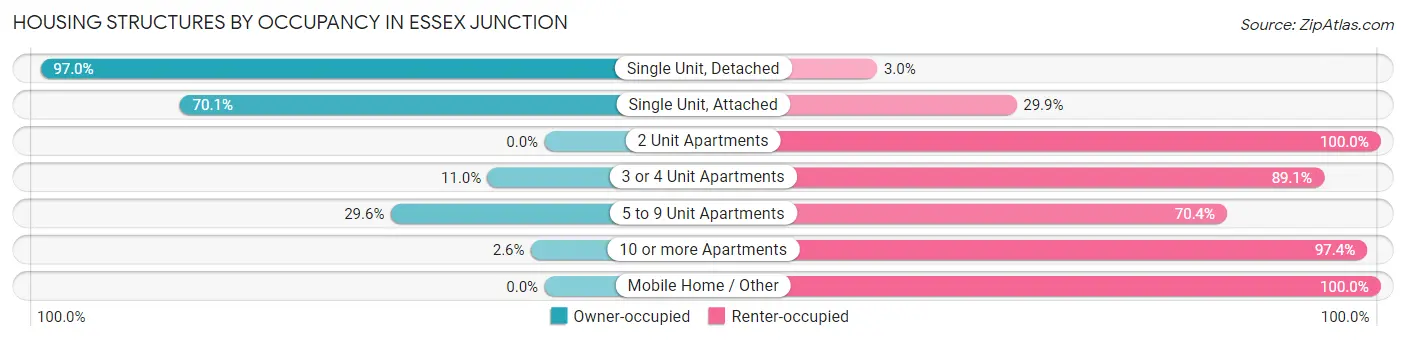
| Structure Type | Owner-occupied | Renter-occupied |
| Single Unit, Detached | 2,199 (97.0%) | 69 (3.0%) |
| Single Unit, Attached | 444 (70.1%) | 189 (29.9%) |
| 2 Unit Apartments | 0 (0.0%) | 181 (100.0%) |
| 3 or 4 Unit Apartments | 38 (11.0%) | 309 (89.0%) |
| 5 to 9 Unit Apartments | 82 (29.6%) | 195 (70.4%) |
| 10 or more Apartments | 22 (2.6%) | 818 (97.4%) |
| Mobile Home / Other | 0 (0.0%) | 58 (100.0%) |
| Total | 2,785 (60.5%) | 1,819 (39.5%) |
Housing Structures by Number of Rooms in Essex Junction
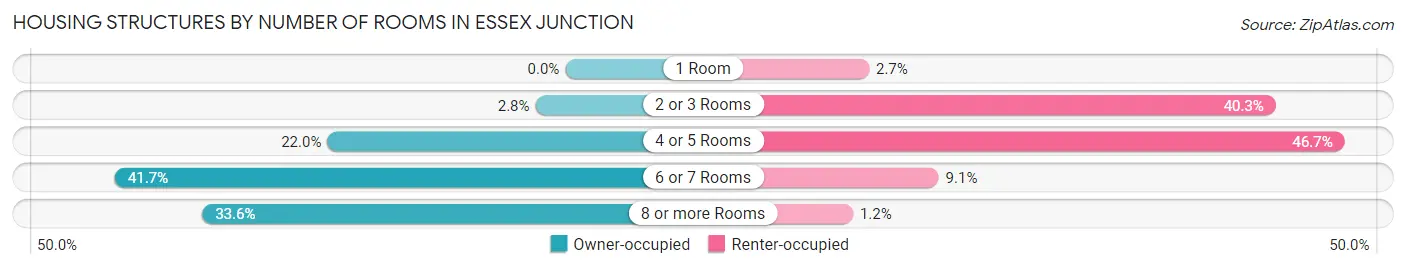
| Number of Rooms | Owner-occupied | Renter-occupied |
| 1 Room | 0 (0.0%) | 49 (2.7%) |
| 2 or 3 Rooms | 77 (2.8%) | 733 (40.3%) |
| 4 or 5 Rooms | 613 (22.0%) | 849 (46.7%) |
| 6 or 7 Rooms | 1,160 (41.6%) | 166 (9.1%) |
| 8 or more Rooms | 935 (33.6%) | 22 (1.2%) |
| Total | 2,785 (100.0%) | 1,819 (100.0%) |
Housing Structure by Heating Type in Essex Junction
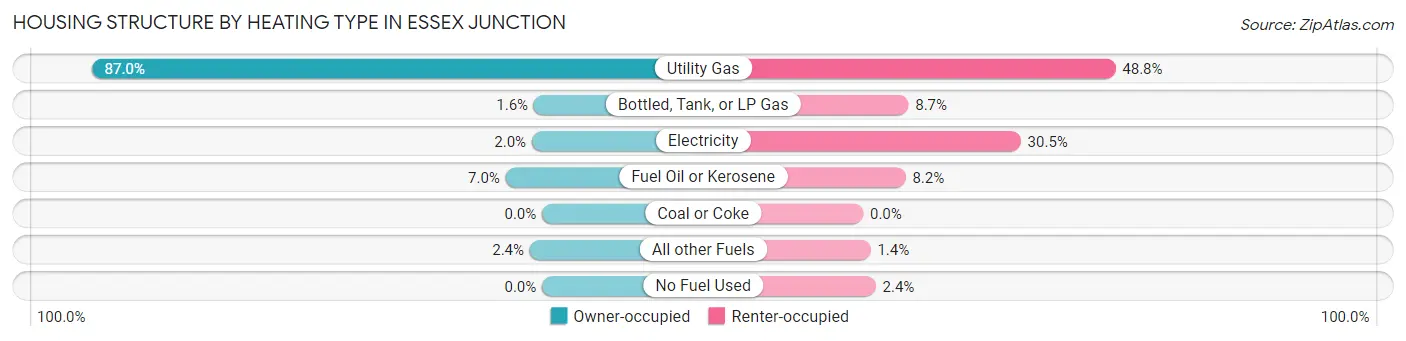
| Heating Type | Owner-occupied | Renter-occupied |
| Utility Gas | 2,424 (87.0%) | 887 (48.8%) |
| Bottled, Tank, or LP Gas | 44 (1.6%) | 159 (8.7%) |
| Electricity | 55 (2.0%) | 554 (30.5%) |
| Fuel Oil or Kerosene | 196 (7.0%) | 149 (8.2%) |
| Coal or Coke | 0 (0.0%) | 0 (0.0%) |
| All other Fuels | 66 (2.4%) | 26 (1.4%) |
| No Fuel Used | 0 (0.0%) | 44 (2.4%) |
| Total | 2,785 (100.0%) | 1,819 (100.0%) |
Household Vehicle Usage in Essex Junction
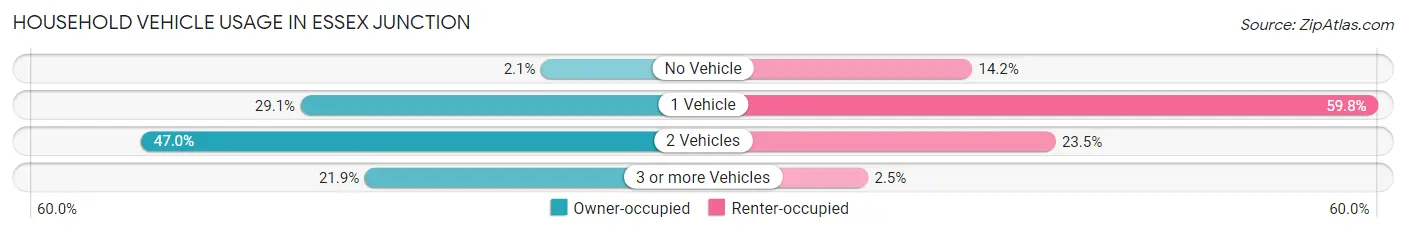
| Vehicles per Household | Owner-occupied | Renter-occupied |
| No Vehicle | 59 (2.1%) | 258 (14.2%) |
| 1 Vehicle | 809 (29.0%) | 1,087 (59.8%) |
| 2 Vehicles | 1,308 (47.0%) | 428 (23.5%) |
| 3 or more Vehicles | 609 (21.9%) | 46 (2.5%) |
| Total | 2,785 (100.0%) | 1,819 (100.0%) |
Real Estate & Mortgages in Essex Junction
Real Estate and Mortgage Overview in Essex Junction
| Characteristic | Without Mortgage | With Mortgage |
| Housing Units | 776 | 2,009 |
| Median Property Value | $356,600 | $352,700 |
| Median Household Income | $98,100 | $811 |
| Monthly Housing Costs | $964 | $232 |
| Real Estate Taxes | $6,825 | $11 |
Property Value by Mortgage Status in Essex Junction
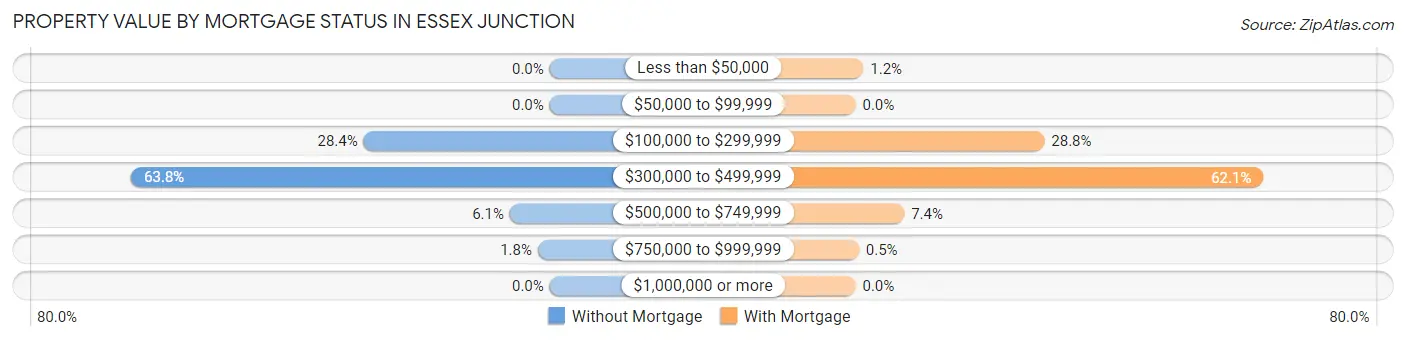
| Property Value | Without Mortgage | With Mortgage |
| Less than $50,000 | 0 (0.0%) | 24 (1.2%) |
| $50,000 to $99,999 | 0 (0.0%) | 0 (0.0%) |
| $100,000 to $299,999 | 220 (28.3%) | 578 (28.8%) |
| $300,000 to $499,999 | 495 (63.8%) | 1,248 (62.1%) |
| $500,000 to $749,999 | 47 (6.1%) | 149 (7.4%) |
| $750,000 to $999,999 | 14 (1.8%) | 10 (0.5%) |
| $1,000,000 or more | 0 (0.0%) | 0 (0.0%) |
| Total | 776 (100.0%) | 2,009 (100.0%) |
Household Income by Mortgage Status in Essex Junction
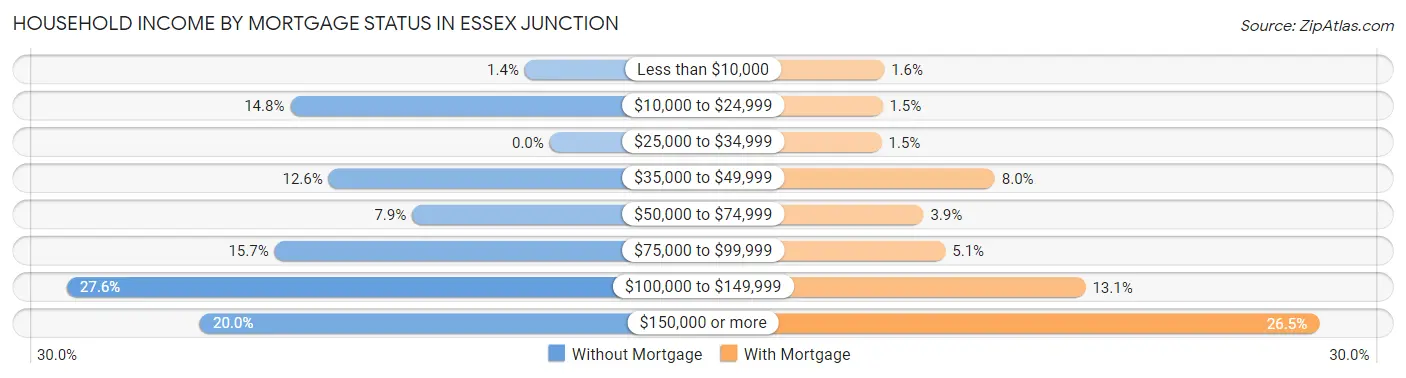
| Household Income | Without Mortgage | With Mortgage |
| Less than $10,000 | 11 (1.4%) | 33 (1.6%) |
| $10,000 to $24,999 | 115 (14.8%) | 31 (1.5%) |
| $25,000 to $34,999 | 0 (0.0%) | 30 (1.5%) |
| $35,000 to $49,999 | 98 (12.6%) | 160 (8.0%) |
| $50,000 to $74,999 | 61 (7.9%) | 78 (3.9%) |
| $75,000 to $99,999 | 122 (15.7%) | 103 (5.1%) |
| $100,000 to $149,999 | 214 (27.6%) | 264 (13.1%) |
| $150,000 or more | 155 (20.0%) | 532 (26.5%) |
| Total | 776 (100.0%) | 2,009 (100.0%) |
Property Value to Household Income Ratio in Essex Junction
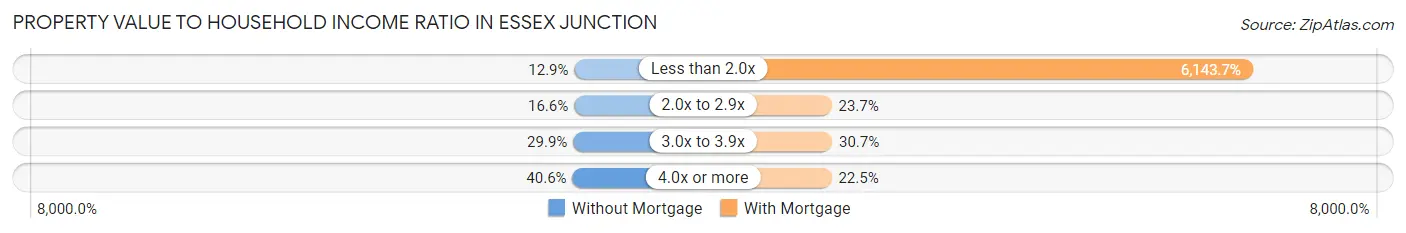
| Value-to-Income Ratio | Without Mortgage | With Mortgage |
| Less than 2.0x | 100 (12.9%) | 123,427 (6,143.7%) |
| 2.0x to 2.9x | 129 (16.6%) | 477 (23.7%) |
| 3.0x to 3.9x | 232 (29.9%) | 617 (30.7%) |
| 4.0x or more | 315 (40.6%) | 451 (22.5%) |
| Total | 776 (100.0%) | 2,009 (100.0%) |
Real Estate Taxes by Mortgage Status in Essex Junction
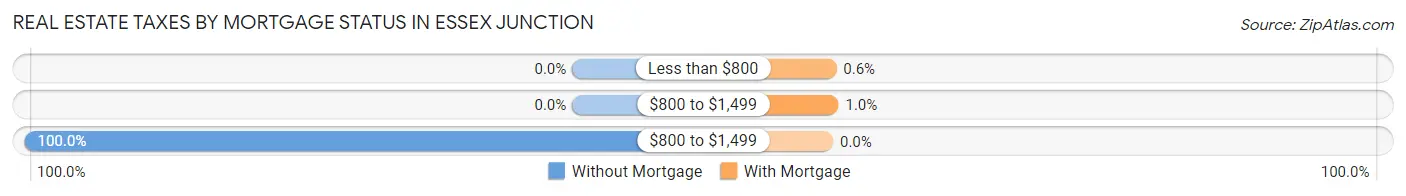
| Property Taxes | Without Mortgage | With Mortgage |
| Less than $800 | 0 (0.0%) | 12 (0.6%) |
| $800 to $1,499 | 0 (0.0%) | 20 (1.0%) |
| $800 to $1,499 | 776 (100.0%) | 0 (0.0%) |
| Total | 776 (100.0%) | 2,009 (100.0%) |
Health & Disability in Essex Junction
Health Insurance Coverage by Age in Essex Junction
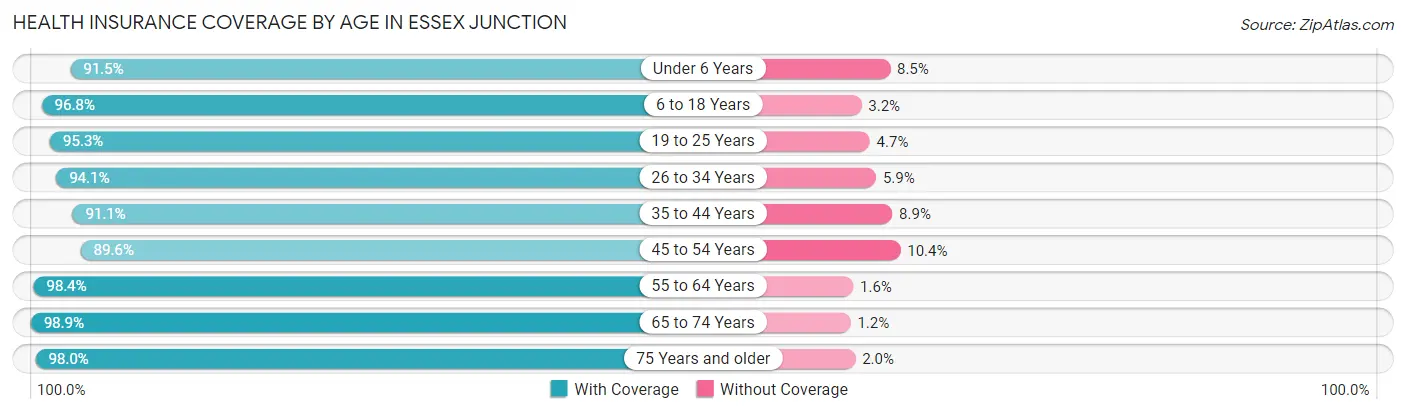
| Age Bracket | With Coverage | Without Coverage |
| Under 6 Years | 708 (91.5%) | 66 (8.5%) |
| 6 to 18 Years | 1,338 (96.8%) | 44 (3.2%) |
| 19 to 25 Years | 966 (95.3%) | 48 (4.7%) |
| 26 to 34 Years | 1,385 (94.1%) | 87 (5.9%) |
| 35 to 44 Years | 1,244 (91.1%) | 122 (8.9%) |
| 45 to 54 Years | 1,407 (89.6%) | 164 (10.4%) |
| 55 to 64 Years | 1,260 (98.4%) | 21 (1.6%) |
| 65 to 74 Years | 1,030 (98.9%) | 12 (1.1%) |
| 75 Years and older | 675 (98.0%) | 14 (2.0%) |
| Total | 10,013 (94.5%) | 578 (5.5%) |
Health Insurance Coverage by Citizenship Status in Essex Junction
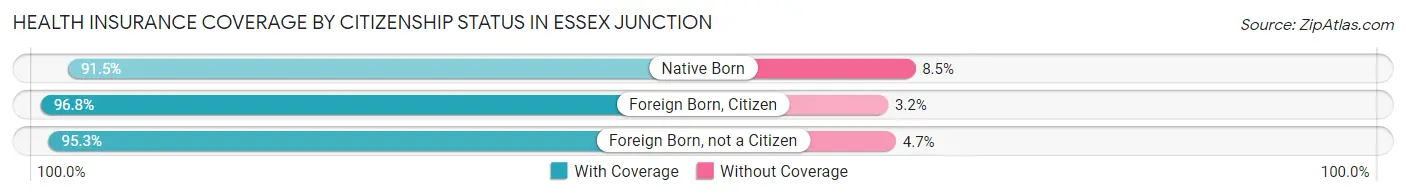
| Citizenship Status | With Coverage | Without Coverage |
| Native Born | 708 (91.5%) | 66 (8.5%) |
| Foreign Born, Citizen | 1,338 (96.8%) | 44 (3.2%) |
| Foreign Born, not a Citizen | 966 (95.3%) | 48 (4.7%) |
Health Insurance Coverage by Household Income in Essex Junction
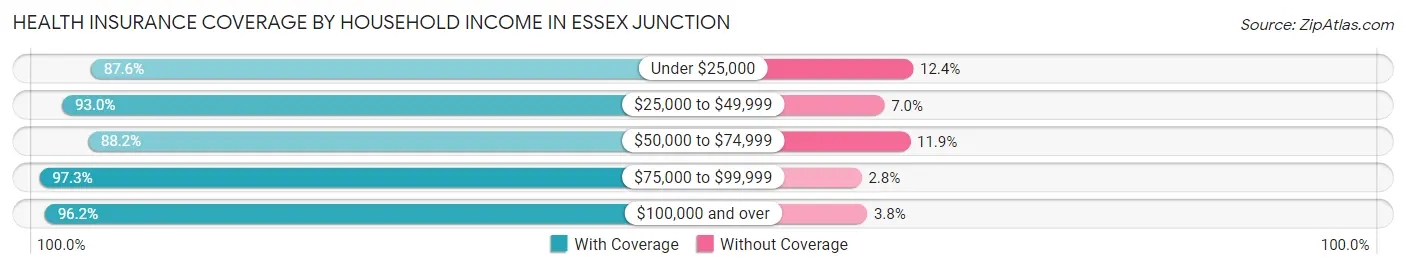
| Household Income | With Coverage | Without Coverage |
| Under $25,000 | 692 (87.6%) | 98 (12.4%) |
| $25,000 to $49,999 | 1,682 (93.0%) | 127 (7.0%) |
| $50,000 to $74,999 | 707 (88.1%) | 95 (11.8%) |
| $75,000 to $99,999 | 1,274 (97.3%) | 36 (2.8%) |
| $100,000 and over | 5,628 (96.2%) | 221 (3.8%) |
Public vs Private Health Insurance Coverage by Age in Essex Junction
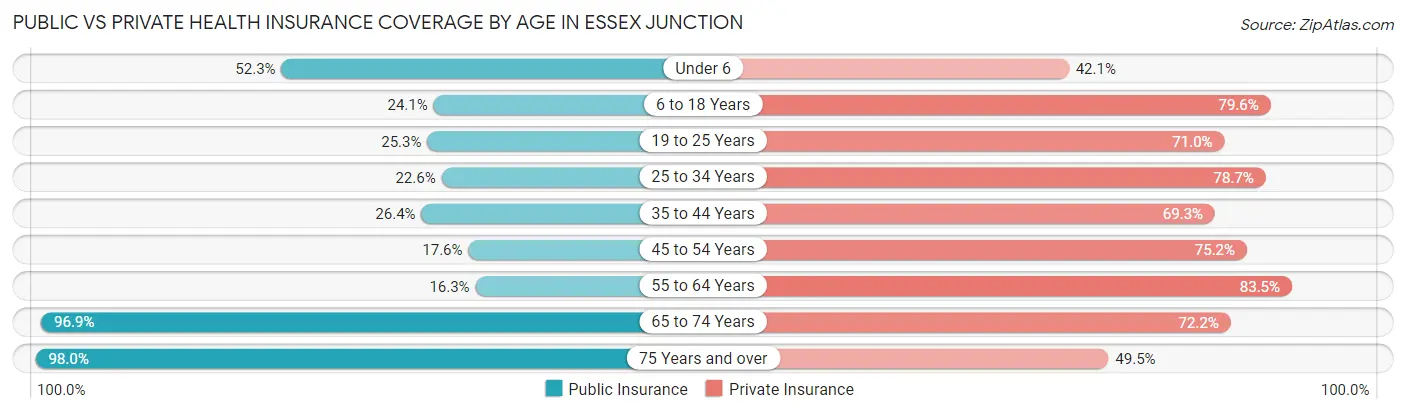
| Age Bracket | Public Insurance | Private Insurance |
| Under 6 | 405 (52.3%) | 326 (42.1%) |
| 6 to 18 Years | 333 (24.1%) | 1,100 (79.6%) |
| 19 to 25 Years | 256 (25.3%) | 720 (71.0%) |
| 25 to 34 Years | 333 (22.6%) | 1,158 (78.7%) |
| 35 to 44 Years | 360 (26.4%) | 946 (69.3%) |
| 45 to 54 Years | 277 (17.6%) | 1,181 (75.2%) |
| 55 to 64 Years | 209 (16.3%) | 1,070 (83.5%) |
| 65 to 74 Years | 1,010 (96.9%) | 752 (72.2%) |
| 75 Years and over | 675 (98.0%) | 341 (49.5%) |
| Total | 3,858 (36.4%) | 7,594 (71.7%) |
Disability Status by Sex by Age in Essex Junction
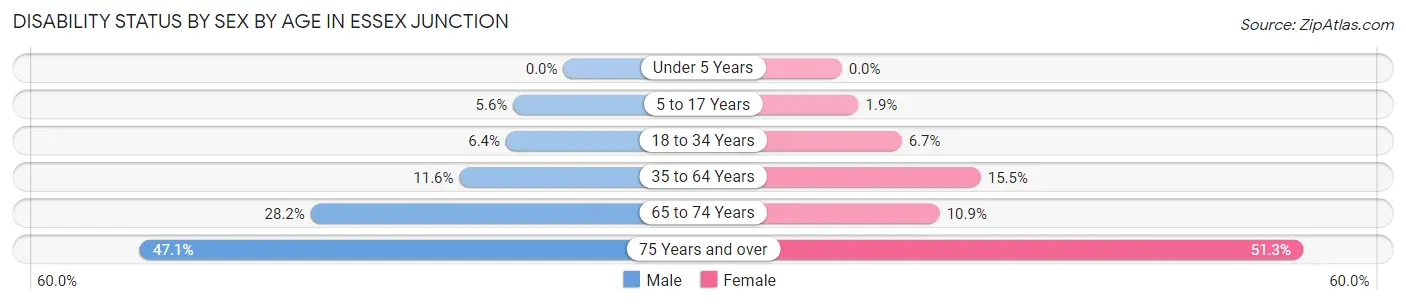
| Age Bracket | Male | Female |
| Under 5 Years | 0 (0.0%) | 0 (0.0%) |
| 5 to 17 Years | 40 (5.6%) | 14 (1.9%) |
| 18 to 34 Years | 92 (6.4%) | 73 (6.7%) |
| 35 to 64 Years | 223 (11.6%) | 355 (15.5%) |
| 65 to 74 Years | 123 (28.1%) | 66 (10.9%) |
| 75 Years and over | 132 (47.1%) | 210 (51.3%) |
Disability Class by Sex by Age in Essex Junction
Disability Class: Hearing Difficulty
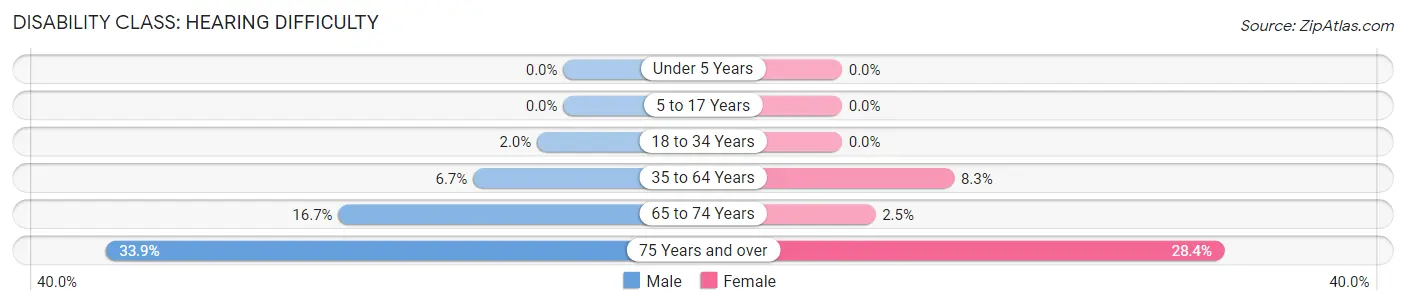
| Age Bracket | Male | Female |
| Under 5 Years | 0 (0.0%) | 0 (0.0%) |
| 5 to 17 Years | 0 (0.0%) | 0 (0.0%) |
| 18 to 34 Years | 28 (1.9%) | 0 (0.0%) |
| 35 to 64 Years | 129 (6.7%) | 191 (8.3%) |
| 65 to 74 Years | 73 (16.7%) | 15 (2.5%) |
| 75 Years and over | 95 (33.9%) | 116 (28.4%) |
Disability Class: Vision Difficulty
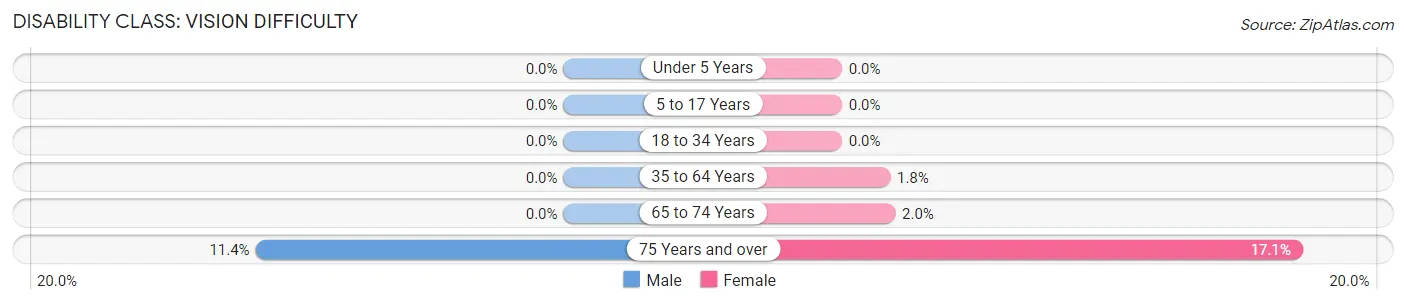
| Age Bracket | Male | Female |
| Under 5 Years | 0 (0.0%) | 0 (0.0%) |
| 5 to 17 Years | 0 (0.0%) | 0 (0.0%) |
| 18 to 34 Years | 0 (0.0%) | 0 (0.0%) |
| 35 to 64 Years | 0 (0.0%) | 41 (1.8%) |
| 65 to 74 Years | 0 (0.0%) | 12 (2.0%) |
| 75 Years and over | 32 (11.4%) | 70 (17.1%) |
Disability Class: Cognitive Difficulty
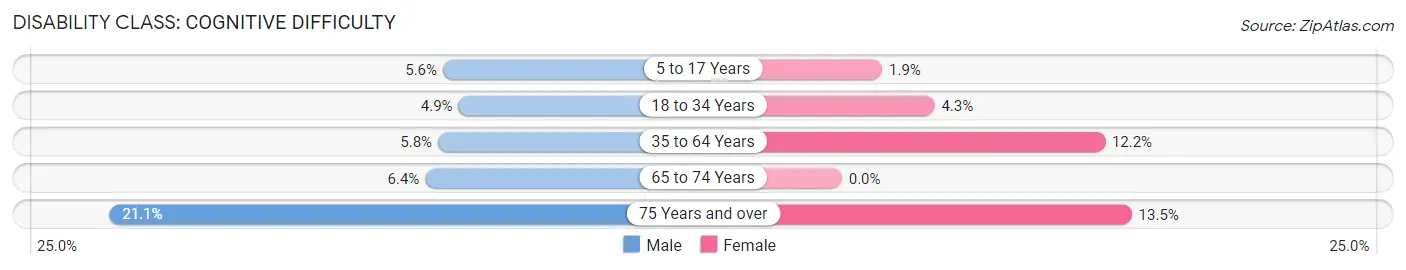
| Age Bracket | Male | Female |
| 5 to 17 Years | 40 (5.6%) | 14 (1.9%) |
| 18 to 34 Years | 70 (4.9%) | 47 (4.3%) |
| 35 to 64 Years | 112 (5.8%) | 280 (12.2%) |
| 65 to 74 Years | 28 (6.4%) | 0 (0.0%) |
| 75 Years and over | 59 (21.1%) | 55 (13.5%) |
Disability Class: Ambulatory Difficulty
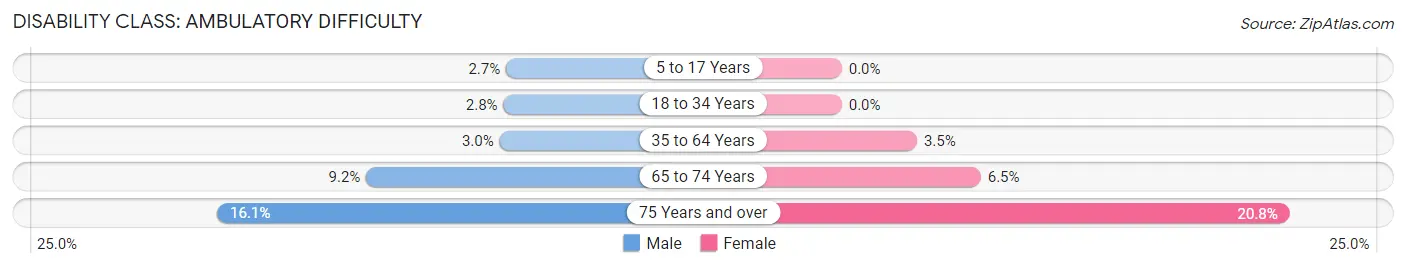
| Age Bracket | Male | Female |
| 5 to 17 Years | 19 (2.7%) | 0 (0.0%) |
| 18 to 34 Years | 40 (2.8%) | 0 (0.0%) |
| 35 to 64 Years | 57 (3.0%) | 80 (3.5%) |
| 65 to 74 Years | 40 (9.1%) | 39 (6.5%) |
| 75 Years and over | 45 (16.1%) | 85 (20.8%) |
Disability Class: Self-Care Difficulty
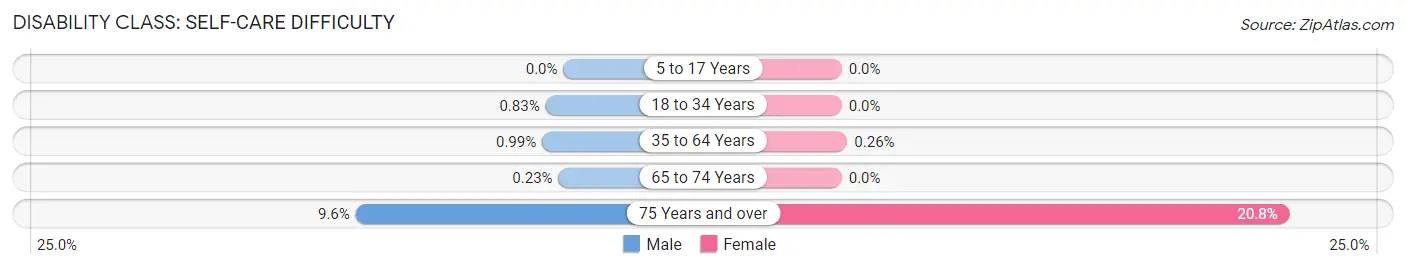
| Age Bracket | Male | Female |
| 5 to 17 Years | 0 (0.0%) | 0 (0.0%) |
| 18 to 34 Years | 12 (0.8%) | 0 (0.0%) |
| 35 to 64 Years | 19 (1.0%) | 6 (0.3%) |
| 65 to 74 Years | 1 (0.2%) | 0 (0.0%) |
| 75 Years and over | 27 (9.6%) | 85 (20.8%) |
Technology Access in Essex Junction
Computing Device Access in Essex Junction
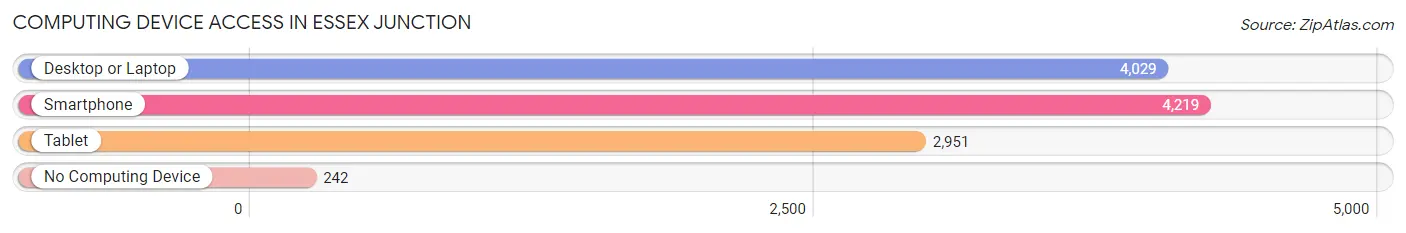
| Device Type | # Households | % Households |
| Desktop or Laptop | 4,029 | 87.5% |
| Smartphone | 4,219 | 91.6% |
| Tablet | 2,951 | 64.1% |
| No Computing Device | 242 | 5.3% |
| Total | 4,604 | 100.0% |
Internet Access in Essex Junction
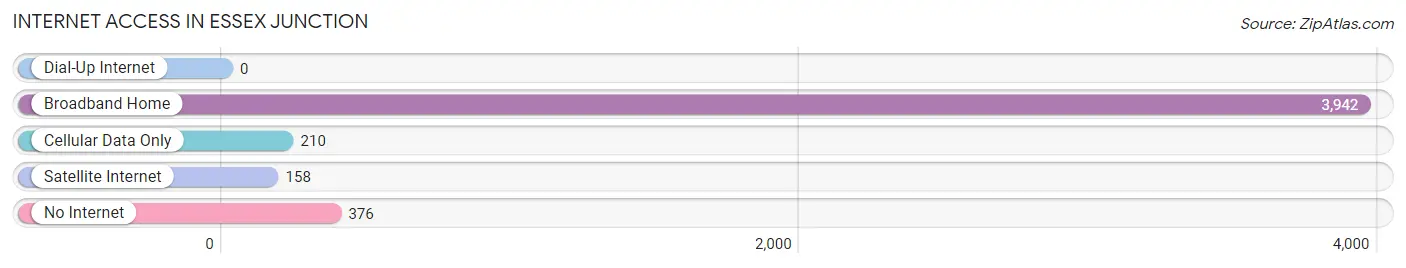
| Internet Type | # Households | % Households |
| Dial-Up Internet | 0 | 0.0% |
| Broadband Home | 3,942 | 85.6% |
| Cellular Data Only | 210 | 4.6% |
| Satellite Internet | 158 | 3.4% |
| No Internet | 376 | 8.2% |
| Total | 4,604 | 100.0% |
Essex Junction Summary
Essex Junction, Vermont is a small town located in Chittenden County, in the northwestern part of the state. It is part of the Burlington-South Burlington metropolitan area and is home to approximately 9,000 people. The town is known for its strong sense of community and its proximity to Burlington, the largest city in Vermont.
History
Essex Junction was first settled in 1763 by a group of settlers from Connecticut. The town was originally known as “The Junction” due to its location at the intersection of the Winooski and Lamoille Rivers. In 1802, the town was officially incorporated and renamed Essex Junction.
The town grew slowly over the next century, with the arrival of the railroad in 1849 providing a major boost to the local economy. The railroad allowed for the transportation of goods and people, and the town quickly became a hub for commerce and industry.
In the late 19th century, the town was home to several factories, including a paper mill, a woolen mill, and a machine shop. These factories provided employment for many of the town’s residents and helped to fuel the local economy.
In the early 20th century, the town experienced a period of rapid growth. The population increased from 1,000 in 1900 to over 5,000 by 1950. This growth was largely due to the expansion of the railroad and the development of the local economy.
Geography
Essex Junction is located in northwestern Vermont, in Chittenden County. The town is situated at the intersection of the Winooski and Lamoille Rivers, and is bordered by the towns of Williston, Colchester, and Winooski.
The town covers an area of 8.3 square miles and is located at an elevation of 441 feet. The terrain is mostly flat, with some rolling hills in the northern part of the town. The climate is humid continental, with cold winters and warm summers.
Economy
Essex Junction’s economy is largely based on manufacturing and services. The town is home to several large employers, including IBM, GlobalFoundries, and the University of Vermont Medical Center. These employers provide employment for many of the town’s residents.
In addition to these large employers, the town is also home to several small businesses, including restaurants, retail stores, and professional services. The town is also home to several industrial parks, which provide employment for many of the town’s residents.
Demographics
As of the 2010 census, the population of Essex Junction was 8,591. The racial makeup of the town was 94.3% White, 1.3% African American, 0.4% Native American, 1.7% Asian, 0.1% Pacific Islander, 0.7% from other races, and 1.5% from two or more races. Hispanic or Latino of any race were 2.2% of the population.
The median household income in Essex Junction was $60,945, and the median family income was $71,917. The per capita income was $30,945. About 4.3% of families and 6.2% of the population were below the poverty line, including 8.2% of those under age 18 and 4.2% of those age 65 or over.
Essex Junction is a small town with a strong sense of community and a diverse economy. The town is home to several large employers, as well as many small businesses. The town’s population is diverse, with a mix of races and ethnicities. The town is a great place to live, work, and raise a family.
Common Questions
What is Per Capita Income in Essex Junction?
Per Capita income in Essex Junction is $46,853.
What is the Median Family Income in Essex Junction?
Median Family Income in Essex Junction is $113,776.
What is the Median Household income in Essex Junction?
Median Household Income in Essex Junction is $92,589.
What is Income or Wage Gap in Essex Junction?
Income or Wage Gap in Essex Junction is 14.4%.
Women in Essex Junction earn 85.6 cents for every dollar earned by a man.
What is Inequality or Gini Index in Essex Junction?
Inequality or Gini Index in Essex Junction is 0.44.
What is the Total Population of Essex Junction?
Total Population of Essex Junction is 10,646.
What is the Total Male Population of Essex Junction?
Total Male Population of Essex Junction is 5,289.
What is the Total Female Population of Essex Junction?
Total Female Population of Essex Junction is 5,357.
What is the Ratio of Males per 100 Females in Essex Junction?
There are 98.73 Males per 100 Females in Essex Junction.
What is the Ratio of Females per 100 Males in Essex Junction?
There are 101.29 Females per 100 Males in Essex Junction.
What is the Median Population Age in Essex Junction?
Median Population Age in Essex Junction is 39.9 Years.
What is the Average Family Size in Essex Junction
Average Family Size in Essex Junction is 3.0 People.
What is the Average Household Size in Essex Junction
Average Household Size in Essex Junction is 2.3 People.
How Large is the Labor Force in Essex Junction?
There are 6,329 People in the Labor Forcein in Essex Junction.
What is the Percentage of People in the Labor Force in Essex Junction?
71.9% of People are in the Labor Force in Essex Junction.
What is the Unemployment Rate in Essex Junction?
Unemployment Rate in Essex Junction is 2.5%.