St Ann, MO Map & Demographics
St Ann Map
St Ann Overview
$26,790
PER CAPITA INCOME
$65,580
AVG FAMILY INCOME
$48,081
AVG HOUSEHOLD INCOME
22.1%
WAGE / INCOME GAP [ % ]
77.9¢/ $1
WAGE / INCOME GAP [ $ ]
$14,450
FAMILY INCOME DEFICIT
0.34
INEQUALITY / GINI INDEX
12,917
TOTAL POPULATION
6,157
MALE POPULATION
6,760
FEMALE POPULATION
91.08
MALES / 100 FEMALES
109.79
FEMALES / 100 MALES
35.2
MEDIAN AGE
2.9
AVG FAMILY SIZE
2.1
AVG HOUSEHOLD SIZE
7,196
LABOR FORCE [ PEOPLE ]
70.2%
PERCENT IN LABOR FORCE
3.0%
UNEMPLOYMENT RATE
Income in St Ann
Income Overview in St Ann
Per Capita Income in St Ann is $26,790, while median incomes of families and households are $65,580 and $48,081 respectively.
| Characteristic | Number | Measure |
| Per Capita Income | 12,917 | $26,790 |
| Median Family Income | 3,233 | $65,580 |
| Mean Family Income | 3,233 | $64,923 |
| Median Household Income | 6,153 | $48,081 |
| Mean Household Income | 6,153 | $55,070 |
| Income Deficit | 3,233 | $14,450 |
| Wage / Income Gap (%) | 12,917 | 22.09% |
| Wage / Income Gap ($) | 12,917 | 77.91¢ per $1 |
| Gini / Inequality Index | 12,917 | 0.34 |
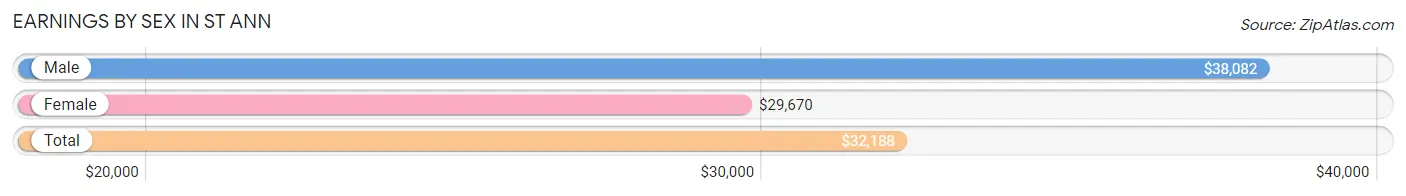
Earnings by Sex in St Ann
Average Earnings in St Ann are $32,188, $38,082 for men and $29,670 for women, a difference of 22.1%.
| Sex | Number | Average Earnings |
| Male | 3,767 (50.7%) | $38,082 |
| Female | 3,656 (49.2%) | $29,670 |
| Total | 7,423 (100.0%) | $32,188 |
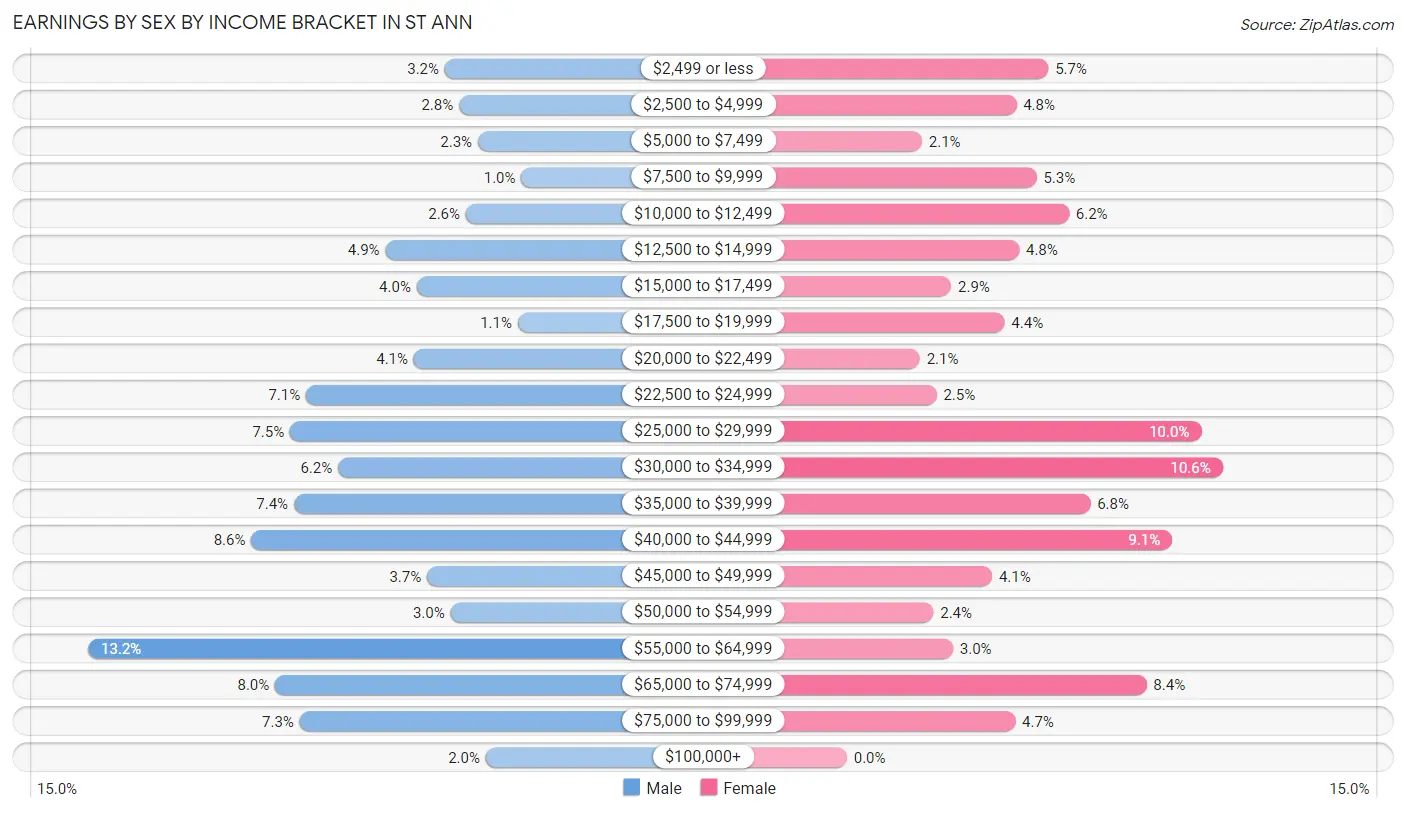
Earnings by Sex by Income Bracket in St Ann
The most common earnings brackets in St Ann are $55,000 to $64,999 for men (498 | 13.2%) and $30,000 to $34,999 for women (386 | 10.6%).
| Income | Male | Female |
| $2,499 or less | 120 (3.2%) | 207 (5.7%) |
| $2,500 to $4,999 | 105 (2.8%) | 174 (4.8%) |
| $5,000 to $7,499 | 85 (2.3%) | 77 (2.1%) |
| $7,500 to $9,999 | 39 (1.0%) | 195 (5.3%) |
| $10,000 to $12,499 | 98 (2.6%) | 228 (6.2%) |
| $12,500 to $14,999 | 183 (4.9%) | 177 (4.8%) |
| $15,000 to $17,499 | 150 (4.0%) | 107 (2.9%) |
| $17,500 to $19,999 | 43 (1.1%) | 162 (4.4%) |
| $20,000 to $22,499 | 153 (4.1%) | 75 (2.1%) |
| $22,500 to $24,999 | 267 (7.1%) | 92 (2.5%) |
| $25,000 to $29,999 | 284 (7.5%) | 364 (10.0%) |
| $30,000 to $34,999 | 233 (6.2%) | 386 (10.6%) |
| $35,000 to $39,999 | 280 (7.4%) | 250 (6.8%) |
| $40,000 to $44,999 | 325 (8.6%) | 334 (9.1%) |
| $45,000 to $49,999 | 139 (3.7%) | 149 (4.1%) |
| $50,000 to $54,999 | 114 (3.0%) | 89 (2.4%) |
| $55,000 to $64,999 | 498 (13.2%) | 109 (3.0%) |
| $65,000 to $74,999 | 300 (8.0%) | 308 (8.4%) |
| $75,000 to $99,999 | 274 (7.3%) | 173 (4.7%) |
| $100,000+ | 77 (2.0%) | 0 (0.0%) |
| Total | 3,767 (100.0%) | 3,656 (100.0%) |
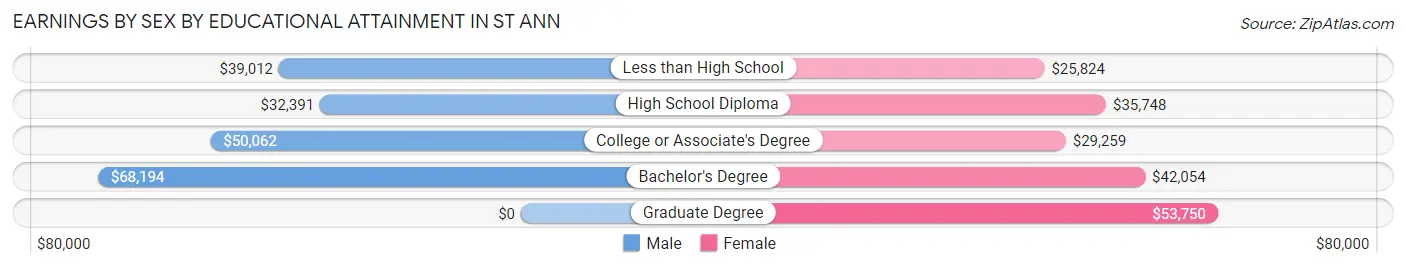
Earnings by Sex by Educational Attainment in St Ann
Average earnings in St Ann are $40,451 for men and $33,016 for women, a difference of 18.4%. Men with an educational attainment of bachelor's degree enjoy the highest average annual earnings of $68,194, while those with high school diploma education earn the least with $32,391. Women with an educational attainment of graduate degree earn the most with the average annual earnings of $53,750, while those with less than high school education have the smallest earnings of $25,824.
| Educational Attainment | Male Income | Female Income |
| Less than High School | $39,012 | $25,824 |
| High School Diploma | $32,391 | $35,748 |
| College or Associate's Degree | $50,062 | $29,259 |
| Bachelor's Degree | $68,194 | $42,054 |
| Graduate Degree | - | - |
| Total | $40,451 | $33,016 |
Family Income in St Ann
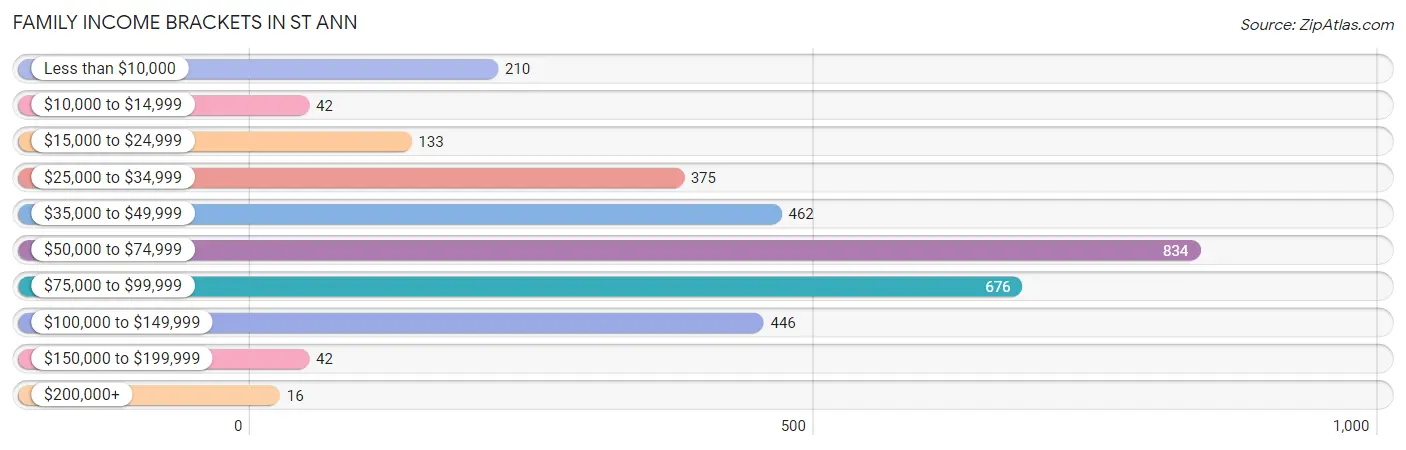
Family Income Brackets in St Ann
According to the St Ann family income data, there are 834 families falling into the $50,000 to $74,999 income range, which is the most common income bracket and makes up 25.8% of all families. Conversely, the $200,000+ income bracket is the least frequent group with only 16 families (0.5%) belonging to this category.
| Income Bracket | # Families | % Families |
| Less than $10,000 | 210 | 6.5% |
| $10,000 to $14,999 | 42 | 1.3% |
| $15,000 to $24,999 | 133 | 4.1% |
| $25,000 to $34,999 | 375 | 11.6% |
| $35,000 to $49,999 | 462 | 14.3% |
| $50,000 to $74,999 | 834 | 25.8% |
| $75,000 to $99,999 | 676 | 20.9% |
| $100,000 to $149,999 | 446 | 13.8% |
| $150,000 to $199,999 | 42 | 1.3% |
| $200,000+ | 16 | 0.5% |
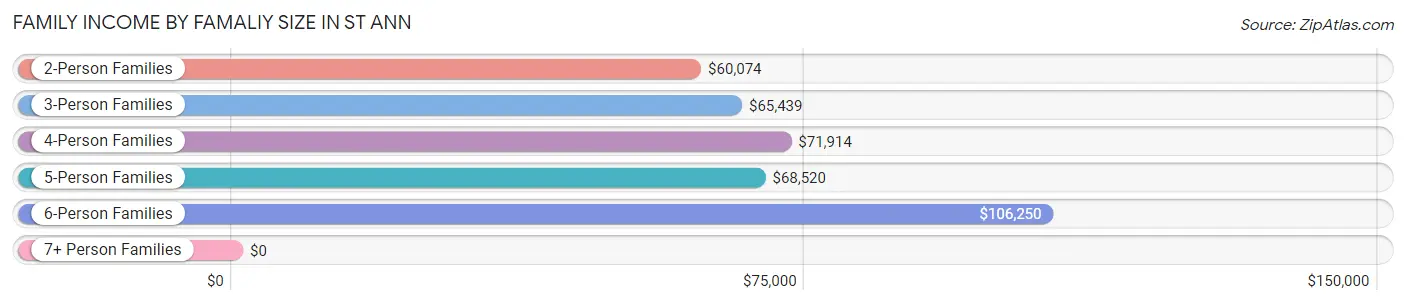
Family Income by Famaliy Size in St Ann
6-person families (41 | 1.3%) account for the highest median family income in St Ann with $106,250 per family, while 2-person families (1,555 | 48.1%) have the highest median income of $30,037 per family member.
| Income Bracket | # Families | Median Income |
| 2-Person Families | 1,555 (48.1%) | $60,074 |
| 3-Person Families | 1,062 (32.9%) | $65,439 |
| 4-Person Families | 419 (13.0%) | $71,914 |
| 5-Person Families | 155 (4.8%) | $68,520 |
| 6-Person Families | 41 (1.3%) | $106,250 |
| 7+ Person Families | 1 (0.0%) | $0 |
| Total | 3,233 (100.0%) | $65,580 |
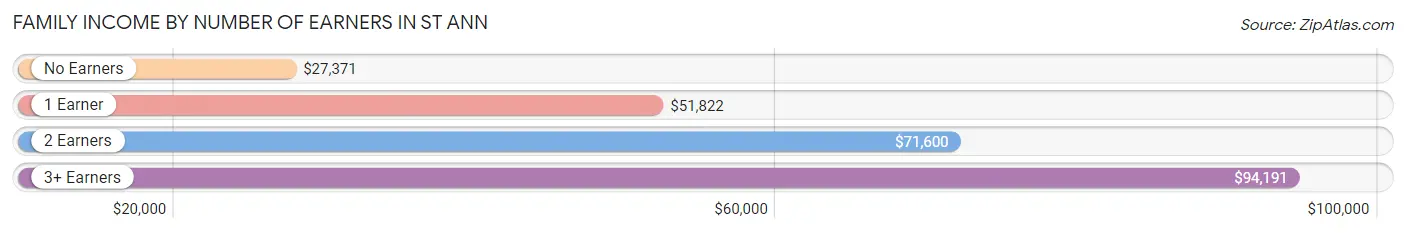
Family Income by Number of Earners in St Ann
The median family income in St Ann is $65,580, with families comprising 3+ earners (269) having the highest median family income of $94,191, while families with no earners (413) have the lowest median family income of $27,371, accounting for 8.3% and 12.8% of families, respectively.
| Number of Earners | # Families | Median Income |
| No Earners | 413 (12.8%) | $27,371 |
| 1 Earner | 1,329 (41.1%) | $51,822 |
| 2 Earners | 1,222 (37.8%) | $71,600 |
| 3+ Earners | 269 (8.3%) | $94,191 |
| Total | 3,233 (100.0%) | $65,580 |
Household Income in St Ann
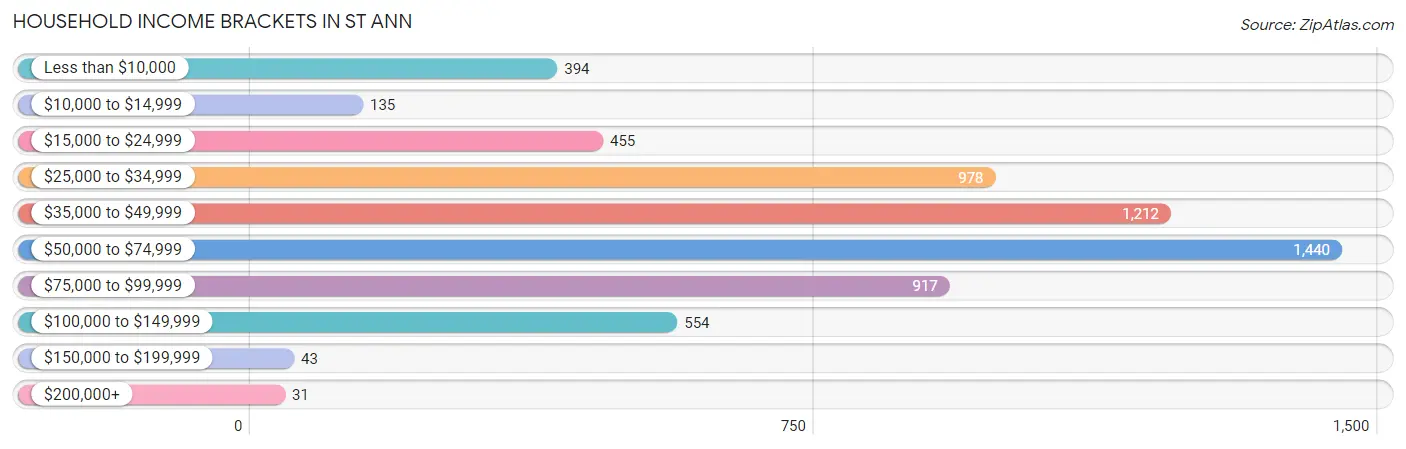
Household Income Brackets in St Ann
With 1,440 households falling in the category, the $50,000 to $74,999 income range is the most frequent in St Ann, accounting for 23.4% of all households. In contrast, only 31 households (0.5%) fall into the $200,000+ income bracket, making it the least populous group.
| Income Bracket | # Households | % Households |
| Less than $10,000 | 394 | 6.4% |
| $10,000 to $14,999 | 135 | 2.2% |
| $15,000 to $24,999 | 455 | 7.4% |
| $25,000 to $34,999 | 978 | 15.9% |
| $35,000 to $49,999 | 1,212 | 19.7% |
| $50,000 to $74,999 | 1,440 | 23.4% |
| $75,000 to $99,999 | 917 | 14.9% |
| $100,000 to $149,999 | 554 | 9.0% |
| $150,000 to $199,999 | 43 | 0.7% |
| $200,000+ | 31 | 0.5% |
Household Income by Householder Age in St Ann
The median household income in St Ann is $48,081, with the highest median household income of $61,310 found in the 25 to 44 years age bracket for the primary householder. A total of 2,130 households (34.6%) fall into this category. Meanwhile, the 15 to 24 years age bracket for the primary householder has the lowest median household income of $29,250, with 433 households (7.0%) in this group.
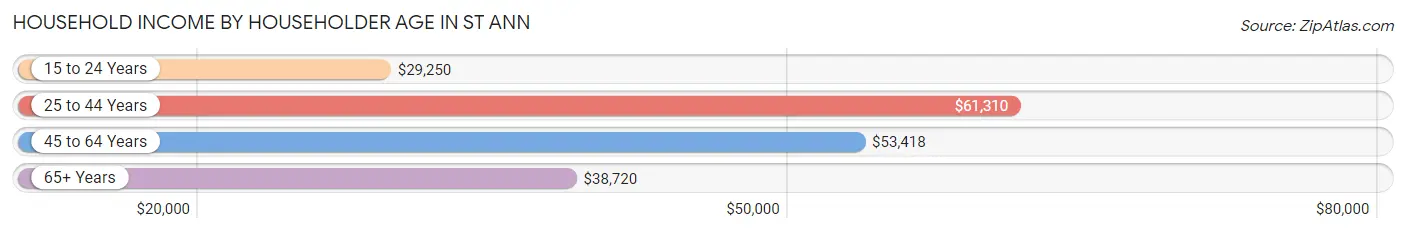
| Income Bracket | # Households | Median Income |
| 15 to 24 Years | 433 (7.0%) | $29,250 |
| 25 to 44 Years | 2,130 (34.6%) | $61,310 |
| 45 to 64 Years | 2,054 (33.4%) | $53,418 |
| 65+ Years | 1,536 (25.0%) | $38,720 |
| Total | 6,153 (100.0%) | $48,081 |
Poverty in St Ann
Income Below Poverty by Sex and Age in St Ann
With 7.6% poverty level for males and 17.1% for females among the residents of St Ann, 6 to 11 year old males and 6 to 11 year old females are the most vulnerable to poverty, with 197 males (35.2%) and 246 females (39.3%) in their respective age groups living below the poverty level.
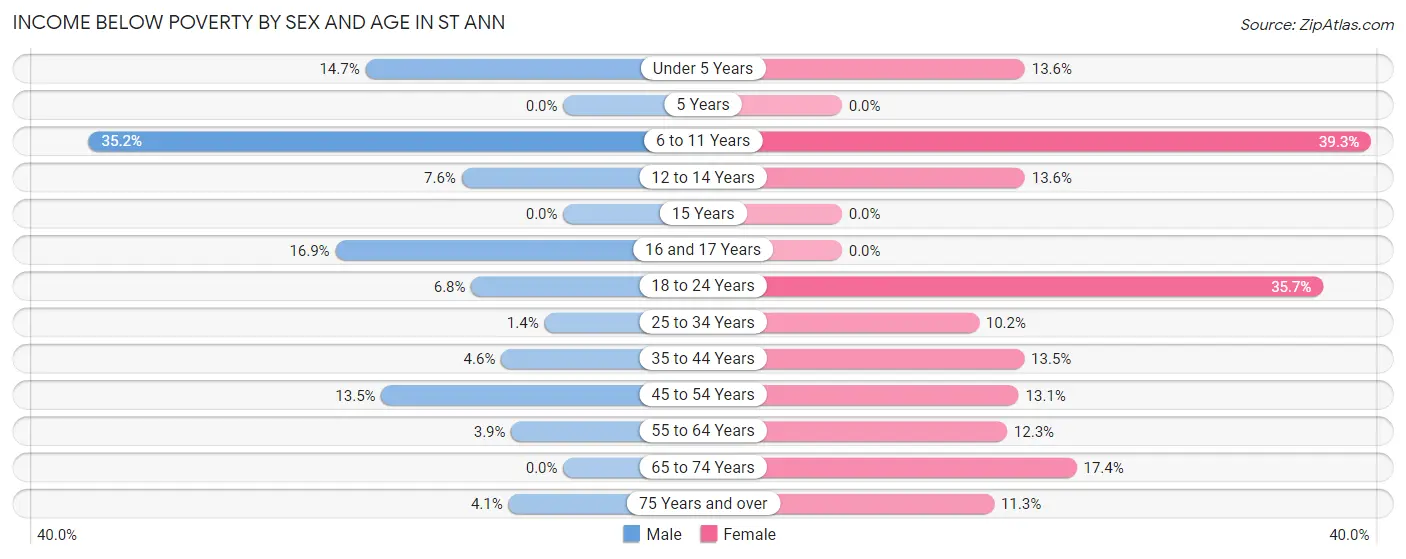
| Age Bracket | Male | Female |
| Under 5 Years | 42 (14.7%) | 89 (13.6%) |
| 5 Years | 0 (0.0%) | 0 (0.0%) |
| 6 to 11 Years | 197 (35.2%) | 246 (39.3%) |
| 12 to 14 Years | 16 (7.5%) | 14 (13.6%) |
| 15 Years | 0 (0.0%) | 0 (0.0%) |
| 16 and 17 Years | 22 (16.9%) | 0 (0.0%) |
| 18 to 24 Years | 28 (6.8%) | 223 (35.7%) |
| 25 to 34 Years | 19 (1.4%) | 106 (10.2%) |
| 35 to 44 Years | 35 (4.6%) | 91 (13.5%) |
| 45 to 54 Years | 60 (13.5%) | 115 (13.1%) |
| 55 to 64 Years | 32 (3.9%) | 102 (12.3%) |
| 65 to 74 Years | 0 (0.0%) | 111 (17.4%) |
| 75 Years and over | 16 (4.1%) | 53 (11.3%) |
| Total | 467 (7.6%) | 1,150 (17.1%) |
Income Above Poverty by Sex and Age in St Ann
According to the poverty statistics in St Ann, males aged 5 years and females aged 5 years are the age groups that are most secure financially, with 100.0% of males and 100.0% of females in these age groups living above the poverty line.
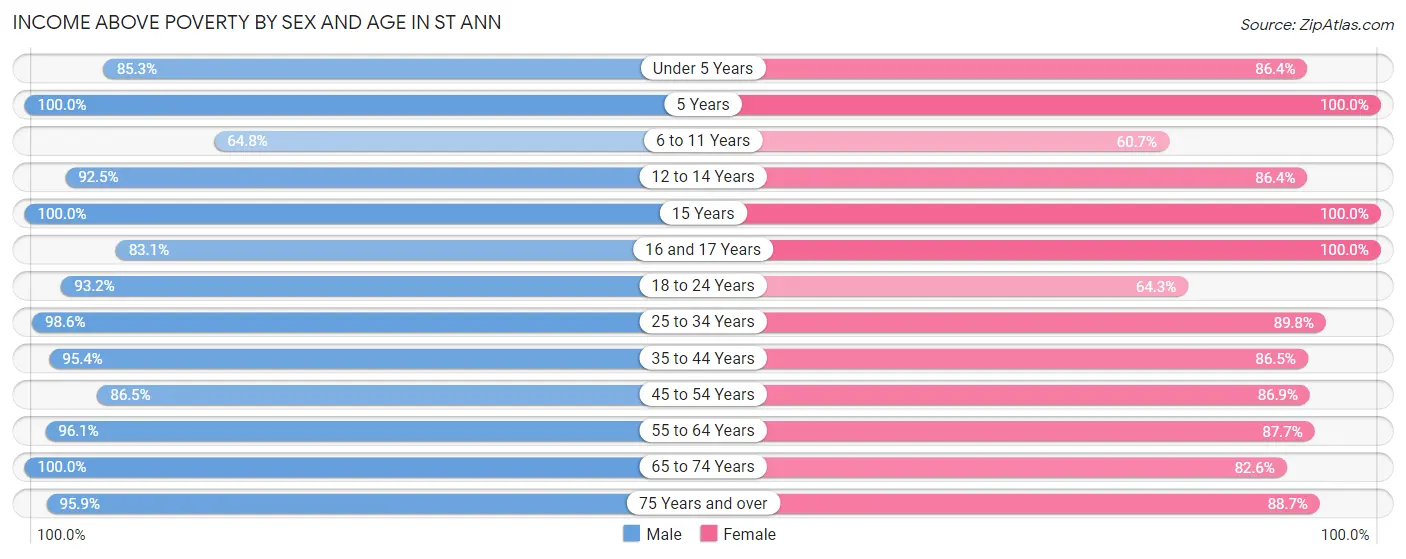
| Age Bracket | Male | Female |
| Under 5 Years | 244 (85.3%) | 566 (86.4%) |
| 5 Years | 90 (100.0%) | 4 (100.0%) |
| 6 to 11 Years | 362 (64.8%) | 380 (60.7%) |
| 12 to 14 Years | 196 (92.4%) | 89 (86.4%) |
| 15 Years | 85 (100.0%) | 27 (100.0%) |
| 16 and 17 Years | 108 (83.1%) | 174 (100.0%) |
| 18 to 24 Years | 382 (93.2%) | 401 (64.3%) |
| 25 to 34 Years | 1,338 (98.6%) | 936 (89.8%) |
| 35 to 44 Years | 725 (95.4%) | 581 (86.5%) |
| 45 to 54 Years | 384 (86.5%) | 761 (86.9%) |
| 55 to 64 Years | 797 (96.1%) | 730 (87.7%) |
| 65 to 74 Years | 600 (100.0%) | 526 (82.6%) |
| 75 Years and over | 377 (95.9%) | 416 (88.7%) |
| Total | 5,688 (92.4%) | 5,591 (82.9%) |
Income Below Poverty Among Married-Couple Families in St Ann
The poverty statistics for married-couple families in St Ann show that 2.9% or 45 of the total 1,526 families live below the poverty line. Families with no children have the highest poverty rate of 3.2%, comprising of 29 families. On the other hand, families with 3 or 4 children have the lowest poverty rate of 0.0%, which includes 0 families.
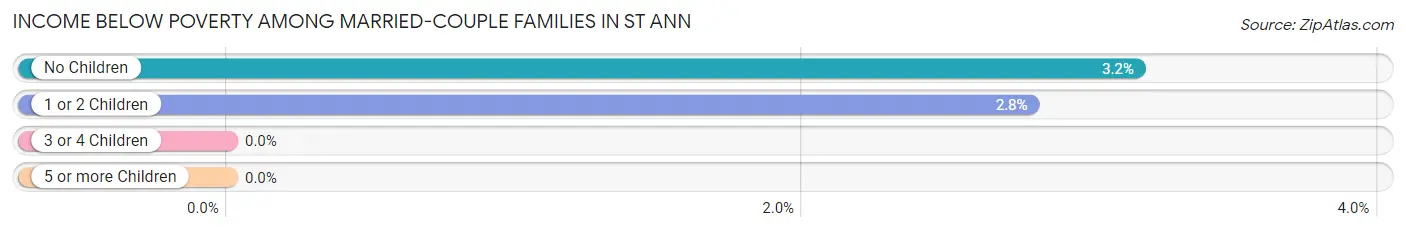
| Children | Above Poverty | Below Poverty |
| No Children | 890 (96.8%) | 29 (3.2%) |
| 1 or 2 Children | 557 (97.2%) | 16 (2.8%) |
| 3 or 4 Children | 34 (100.0%) | 0 (0.0%) |
| 5 or more Children | 0 (0.0%) | 0 (0.0%) |
| Total | 1,481 (97.1%) | 45 (2.9%) |
Income Below Poverty Among Single-Parent Households in St Ann
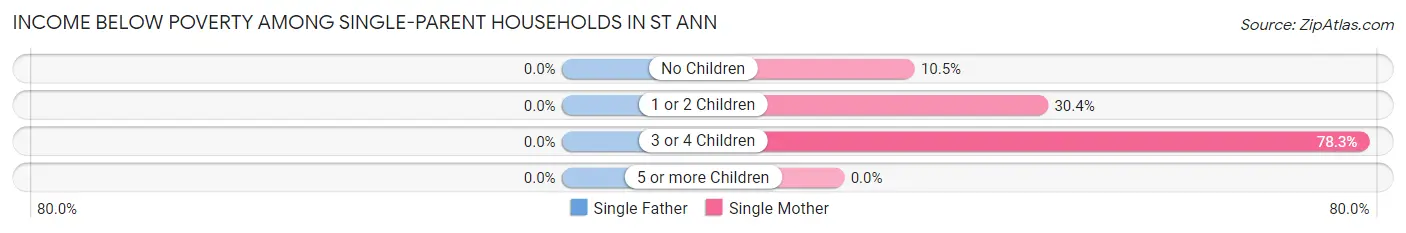
| Children | Single Father | Single Mother |
| No Children | 0 (0.0%) | 29 (10.5%) |
| 1 or 2 Children | 0 (0.0%) | 191 (30.4%) |
| 3 or 4 Children | 0 (0.0%) | 83 (78.3%) |
| 5 or more Children | 0 (0.0%) | 0 (0.0%) |
| Total | 0 (0.0%) | 303 (29.9%) |
Income Below Poverty Among Married-Couple vs Single-Parent Households in St Ann
The poverty data for St Ann shows that 45 of the married-couple family households (2.9%) and 303 of the single-parent households (17.7%) are living below the poverty level. Within the married-couple family households, those with no children have the highest poverty rate, with 29 households (3.2%) falling below the poverty line. Among the single-parent households, those with 3 or 4 children have the highest poverty rate, with 83 household (60.1%) living below poverty.
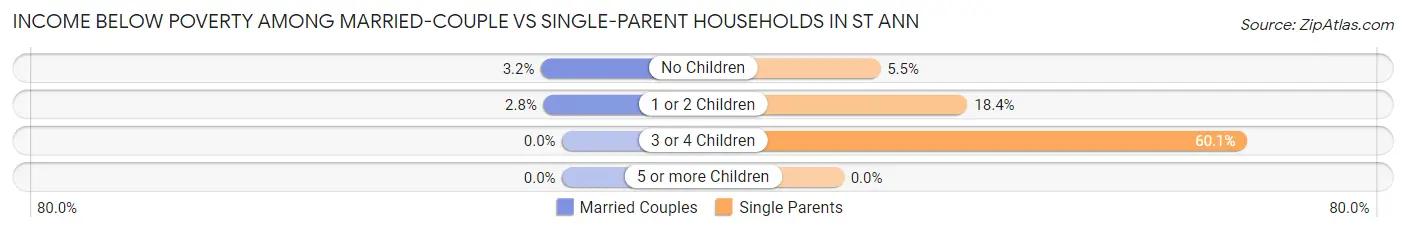
| Children | Married-Couple Families | Single-Parent Households |
| No Children | 29 (3.2%) | 29 (5.4%) |
| 1 or 2 Children | 16 (2.8%) | 191 (18.4%) |
| 3 or 4 Children | 0 (0.0%) | 83 (60.1%) |
| 5 or more Children | 0 (0.0%) | 0 (0.0%) |
| Total | 45 (2.9%) | 303 (17.7%) |
Race in St Ann
The most populous races in St Ann are White / Caucasian (7,876 | 61.0%), Black / African American (4,012 | 31.1%), and Hispanic or Latino (798 | 6.2%).
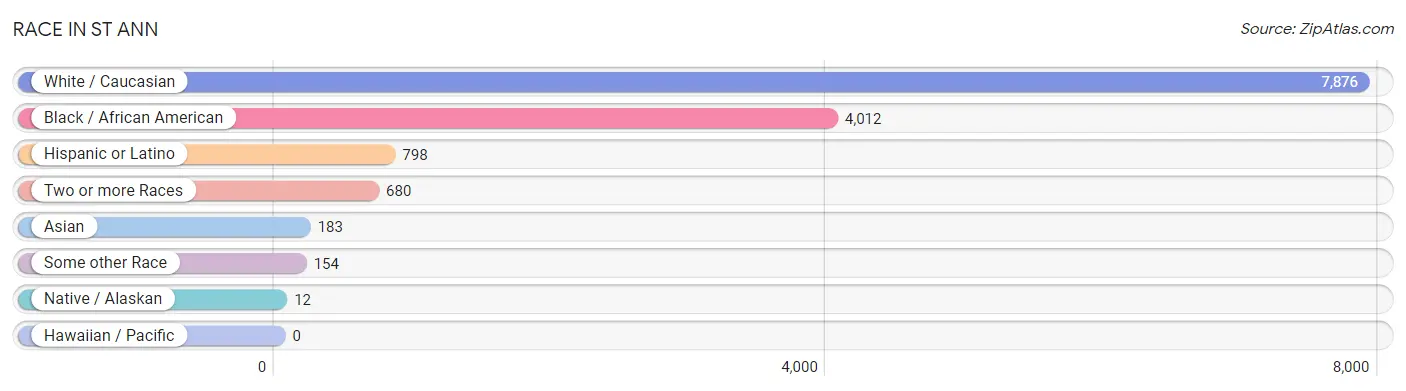
| Race | # Population | % Population |
| Asian | 183 | 1.4% |
| Black / African American | 4,012 | 31.1% |
| Hawaiian / Pacific | 0 | 0.0% |
| Hispanic or Latino | 798 | 6.2% |
| Native / Alaskan | 12 | 0.1% |
| White / Caucasian | 7,876 | 61.0% |
| Two or more Races | 680 | 5.3% |
| Some other Race | 154 | 1.2% |
| Total | 12,917 | 100.0% |
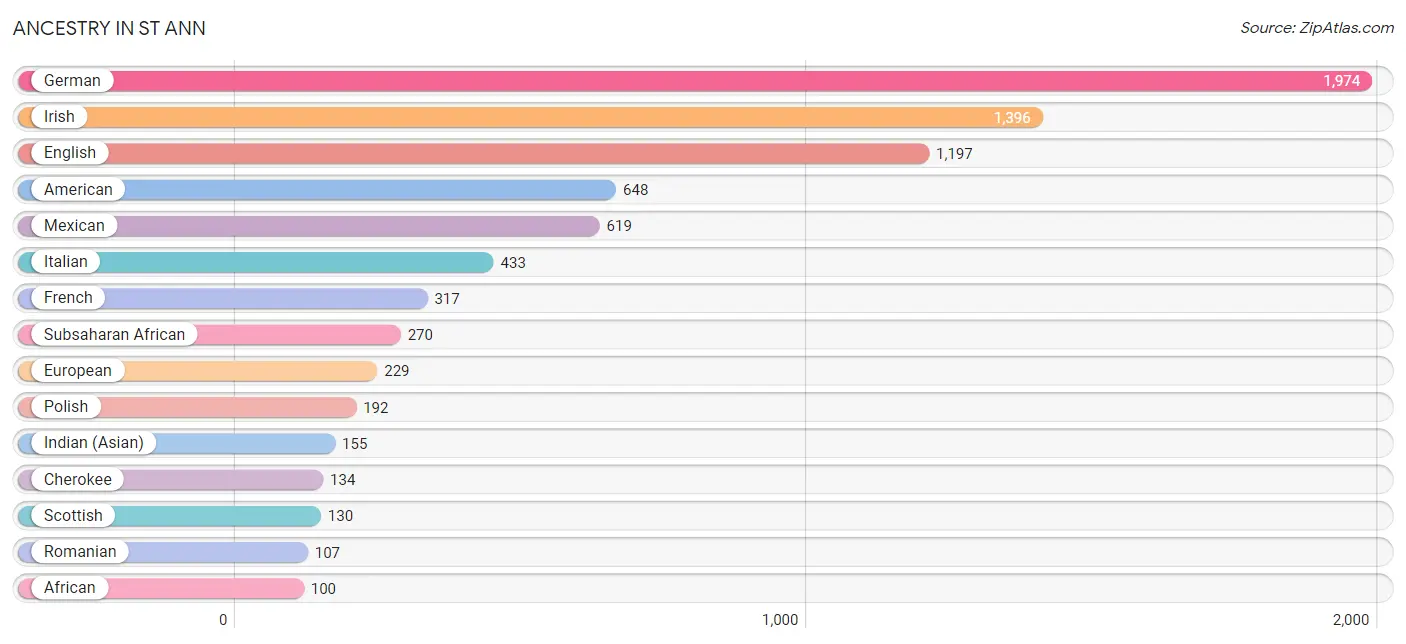
Ancestry in St Ann
The most populous ancestries reported in St Ann are German (1,974 | 15.3%), Irish (1,396 | 10.8%), English (1,197 | 9.3%), American (648 | 5.0%), and Mexican (619 | 4.8%), together accounting for 45.2% of all St Ann residents.
| Ancestry | # Population | % Population |
| African | 100 | 0.8% |
| American | 648 | 5.0% |
| Apache | 15 | 0.1% |
| Australian | 9 | 0.1% |
| Blackfeet | 39 | 0.3% |
| Brazilian | 4 | 0.0% |
| British | 66 | 0.5% |
| Canadian | 16 | 0.1% |
| Central American | 16 | 0.1% |
| Cherokee | 134 | 1.0% |
| Choctaw | 31 | 0.2% |
| Croatian | 17 | 0.1% |
| Czech | 14 | 0.1% |
| Czechoslovakian | 15 | 0.1% |
| Dutch | 63 | 0.5% |
| Eastern European | 20 | 0.2% |
| English | 1,197 | 9.3% |
| European | 229 | 1.8% |
| French | 317 | 2.5% |
| French Canadian | 13 | 0.1% |
| German | 1,974 | 15.3% |
| Greek | 18 | 0.1% |
| Hungarian | 29 | 0.2% |
| Indian (Asian) | 155 | 1.2% |
| Inupiat | 11 | 0.1% |
| Irish | 1,396 | 10.8% |
| Italian | 433 | 3.4% |
| Korean | 15 | 0.1% |
| Mexican | 619 | 4.8% |
| Native Hawaiian | 5 | 0.0% |
| Nicaraguan | 16 | 0.1% |
| Nigerian | 40 | 0.3% |
| Norwegian | 52 | 0.4% |
| Peruvian | 7 | 0.1% |
| Polish | 192 | 1.5% |
| Portuguese | 4 | 0.0% |
| Romanian | 107 | 0.8% |
| Russian | 30 | 0.2% |
| Samoan | 5 | 0.0% |
| Scandinavian | 17 | 0.1% |
| Scotch-Irish | 42 | 0.3% |
| Scottish | 130 | 1.0% |
| Senegalese | 60 | 0.5% |
| Sioux | 42 | 0.3% |
| Slovak | 76 | 0.6% |
| South American | 7 | 0.1% |
| Spaniard | 57 | 0.4% |
| Spanish | 27 | 0.2% |
| Sri Lankan | 1 | 0.0% |
| Subsaharan African | 270 | 2.1% |
| Swedish | 72 | 0.6% |
| Thai | 12 | 0.1% | View All 52 Rows |
Immigrants in St Ann
The most numerous immigrant groups reported in St Ann came from Latin America (292 | 2.3%), Central America (281 | 2.2%), Mexico (226 | 1.8%), Africa (163 | 1.3%), and Western Africa (150 | 1.2%), together accounting for 8.6% of all St Ann residents.
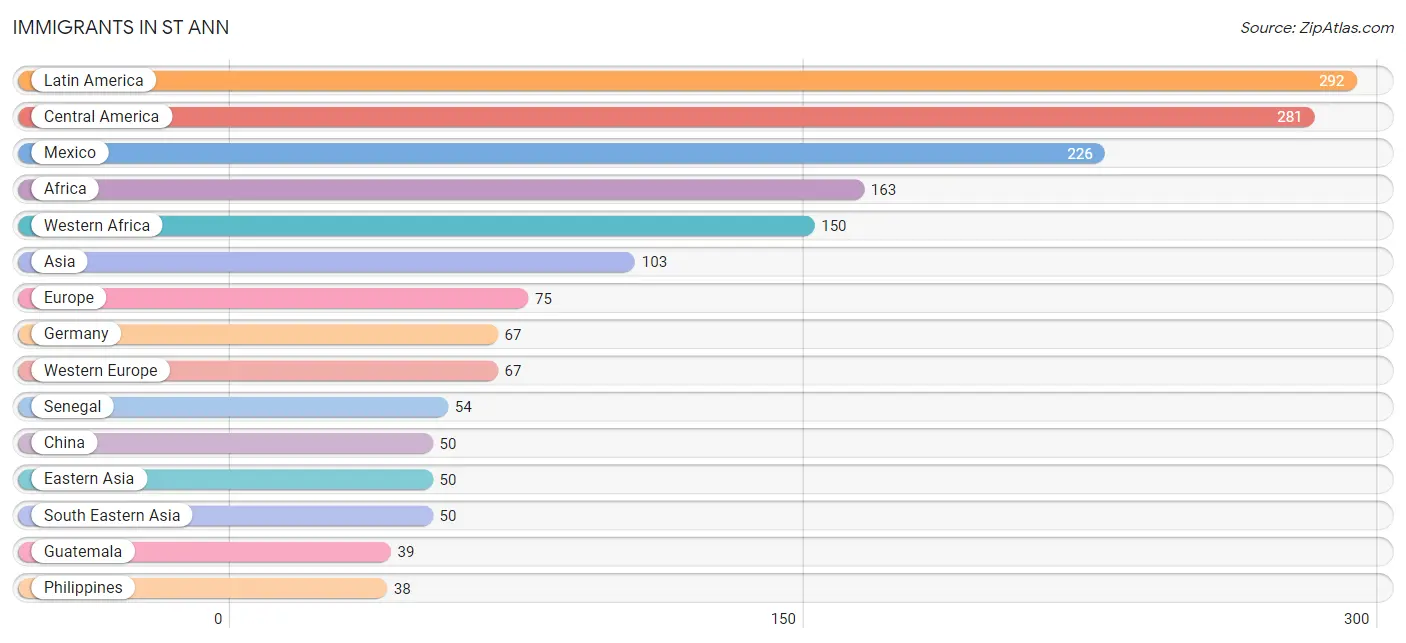
| Immigration Origin | # Population | % Population |
| Africa | 163 | 1.3% |
| Asia | 103 | 0.8% |
| Brazil | 4 | 0.0% |
| Central America | 281 | 2.2% |
| China | 50 | 0.4% |
| Eastern Africa | 13 | 0.1% |
| Eastern Asia | 50 | 0.4% |
| Ethiopia | 13 | 0.1% |
| Europe | 75 | 0.6% |
| Germany | 67 | 0.5% |
| Guatemala | 39 | 0.3% |
| India | 3 | 0.0% |
| Italy | 8 | 0.1% |
| Latin America | 292 | 2.3% |
| Mexico | 226 | 1.8% |
| Nicaragua | 16 | 0.1% |
| Nigeria | 26 | 0.2% |
| Peru | 7 | 0.1% |
| Philippines | 38 | 0.3% |
| Senegal | 54 | 0.4% |
| South America | 11 | 0.1% |
| South Central Asia | 3 | 0.0% |
| South Eastern Asia | 50 | 0.4% |
| Southern Europe | 8 | 0.1% |
| Vietnam | 12 | 0.1% |
| Western Africa | 150 | 1.2% |
| Western Europe | 67 | 0.5% | View All 27 Rows |
Sex and Age in St Ann
Sex and Age in St Ann
The most populous age groups in St Ann are 25 to 29 Years (806 | 13.1%) for men and Under 5 Years (655 | 9.7%) for women.
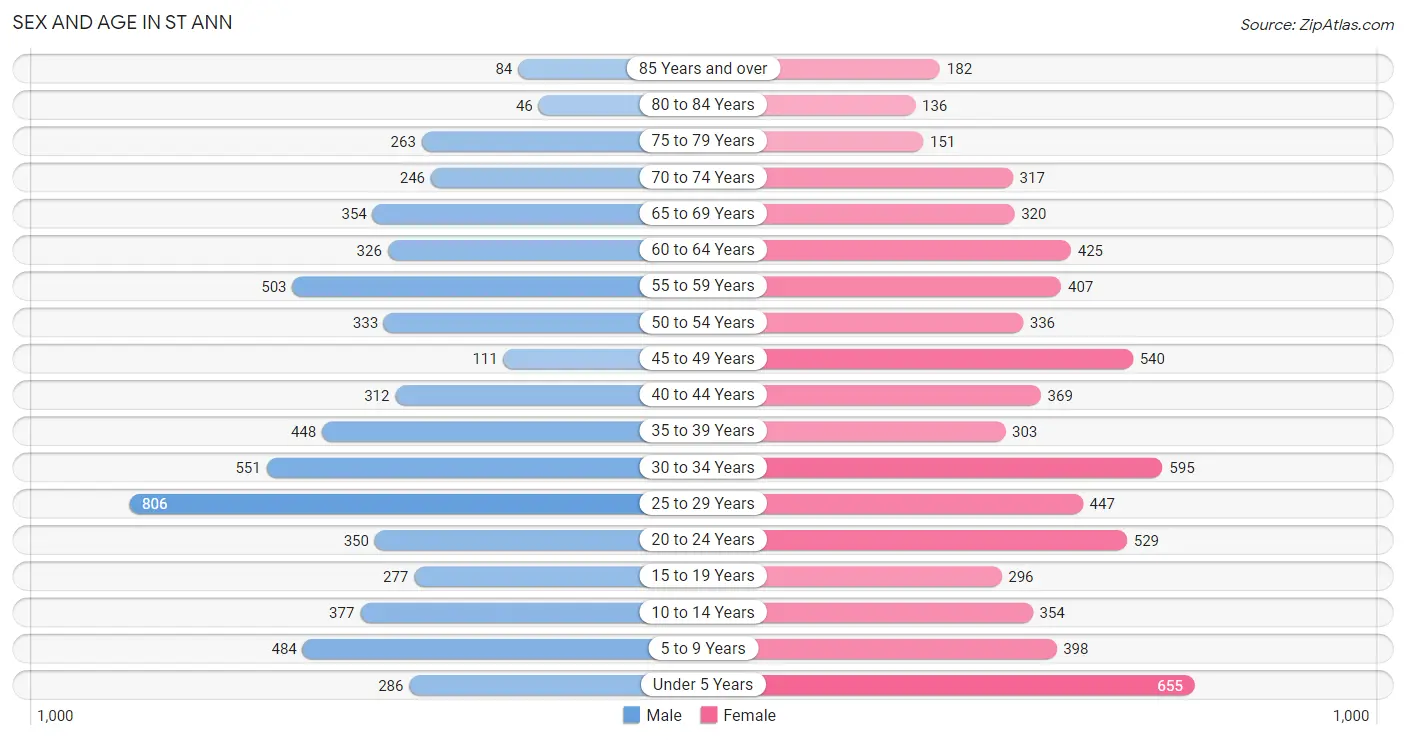
| Age Bracket | Male | Female |
| Under 5 Years | 286 (4.6%) | 655 (9.7%) |
| 5 to 9 Years | 484 (7.9%) | 398 (5.9%) |
| 10 to 14 Years | 377 (6.1%) | 354 (5.2%) |
| 15 to 19 Years | 277 (4.5%) | 296 (4.4%) |
| 20 to 24 Years | 350 (5.7%) | 529 (7.8%) |
| 25 to 29 Years | 806 (13.1%) | 447 (6.6%) |
| 30 to 34 Years | 551 (8.9%) | 595 (8.8%) |
| 35 to 39 Years | 448 (7.3%) | 303 (4.5%) |
| 40 to 44 Years | 312 (5.1%) | 369 (5.5%) |
| 45 to 49 Years | 111 (1.8%) | 540 (8.0%) |
| 50 to 54 Years | 333 (5.4%) | 336 (5.0%) |
| 55 to 59 Years | 503 (8.2%) | 407 (6.0%) |
| 60 to 64 Years | 326 (5.3%) | 425 (6.3%) |
| 65 to 69 Years | 354 (5.8%) | 320 (4.7%) |
| 70 to 74 Years | 246 (4.0%) | 317 (4.7%) |
| 75 to 79 Years | 263 (4.3%) | 151 (2.2%) |
| 80 to 84 Years | 46 (0.7%) | 136 (2.0%) |
| 85 Years and over | 84 (1.4%) | 182 (2.7%) |
| Total | 6,157 (100.0%) | 6,760 (100.0%) |
Families and Households in St Ann
Median Family Size in St Ann
The median family size in St Ann is 2.87 persons per family, with married-couple families (1,526 | 47.2%) accounting for the largest median family size of 2.98 persons per family. On the other hand, single male/father families (695 | 21.5%) represent the smallest median family size with 2.65 persons per family.
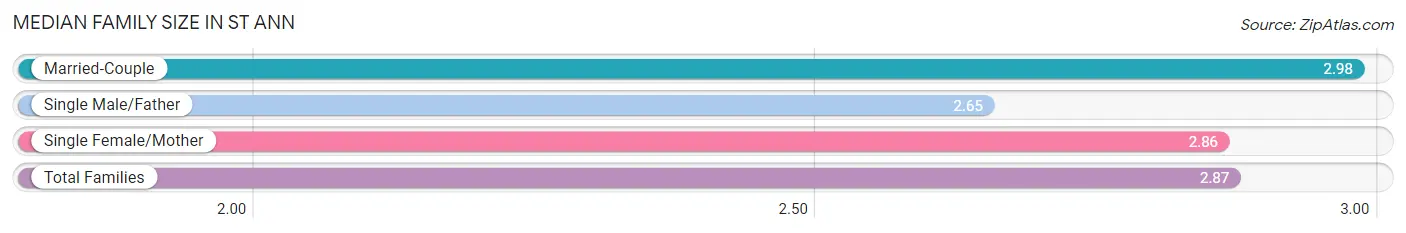
| Family Type | # Families | Family Size |
| Married-Couple | 1,526 (47.2%) | 2.98 |
| Single Male/Father | 695 (21.5%) | 2.65 |
| Single Female/Mother | 1,012 (31.3%) | 2.86 |
| Total Families | 3,233 (100.0%) | 2.87 |
Median Household Size in St Ann
The median household size in St Ann is 2.10 persons per household, with married-couple households (1,526 | 24.8%) accounting for the largest median household size of 3 persons per household. non-family households (2,920 | 47.5%) represent the smallest median household size with 1.16 persons per household.
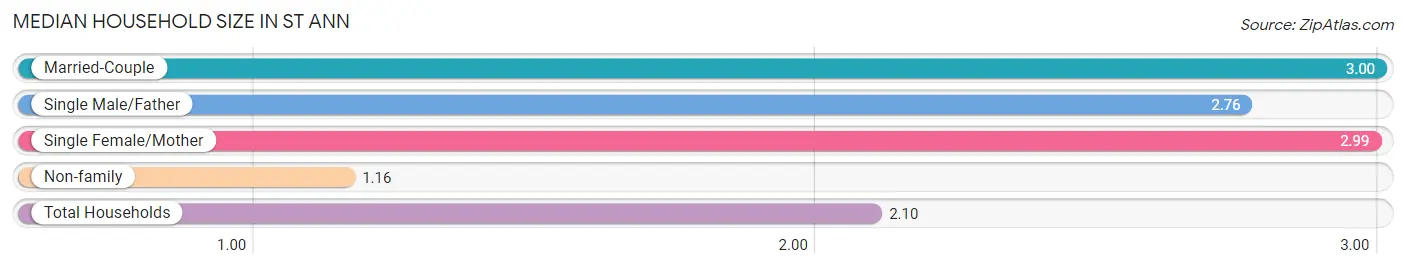
| Household Type | # Households | Household Size |
| Married-Couple | 1,526 (24.8%) | 3.00 |
| Single Male/Father | 695 (11.3%) | 2.76 |
| Single Female/Mother | 1,012 (16.5%) | 2.99 |
| Non-family | 2,920 (47.5%) | 1.16 |
| Total Households | 6,153 (100.0%) | 2.10 |
Household Size by Marriage Status in St Ann
Out of a total of 6,153 households in St Ann, 3,233 (52.5%) are family households, while 2,920 (47.5%) are nonfamily households. The most numerous type of family households are 2-person households, comprising 1,483, and the most common type of nonfamily households are 1-person households, comprising 2,559.
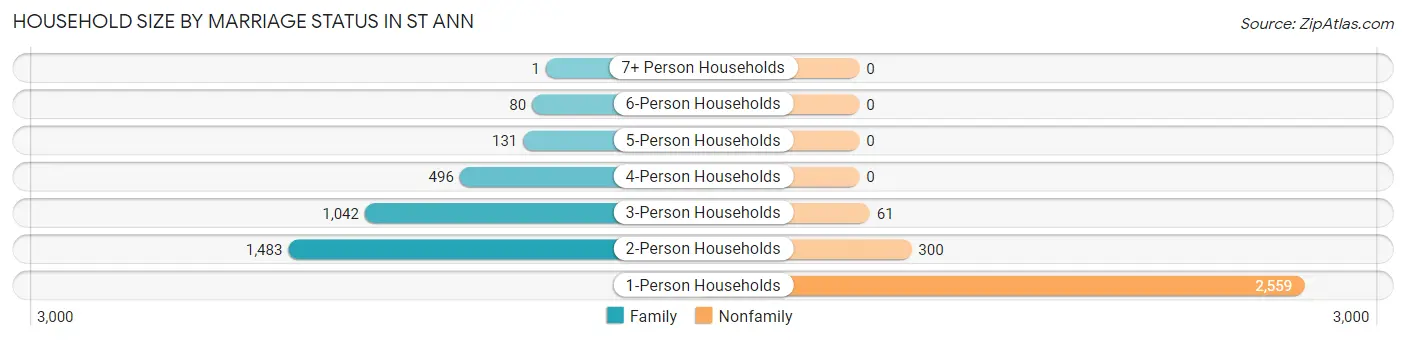
| Household Size | Family Households | Nonfamily Households |
| 1-Person Households | - | 2,559 (41.6%) |
| 2-Person Households | 1,483 (24.1%) | 300 (4.9%) |
| 3-Person Households | 1,042 (16.9%) | 61 (1.0%) |
| 4-Person Households | 496 (8.1%) | 0 (0.0%) |
| 5-Person Households | 131 (2.1%) | 0 (0.0%) |
| 6-Person Households | 80 (1.3%) | 0 (0.0%) |
| 7+ Person Households | 1 (0.0%) | 0 (0.0%) |
| Total | 3,233 (52.5%) | 2,920 (47.5%) |
Female Fertility in St Ann
Fertility by Age in St Ann
Average fertility rate in St Ann is 15.0 births per 1,000 women. Women in the age bracket of 20 to 34 years have the highest fertility rate with 22.0 births per 1,000 women. Women in the age bracket of 20 to 34 years acount for 72.9% of all women with births.
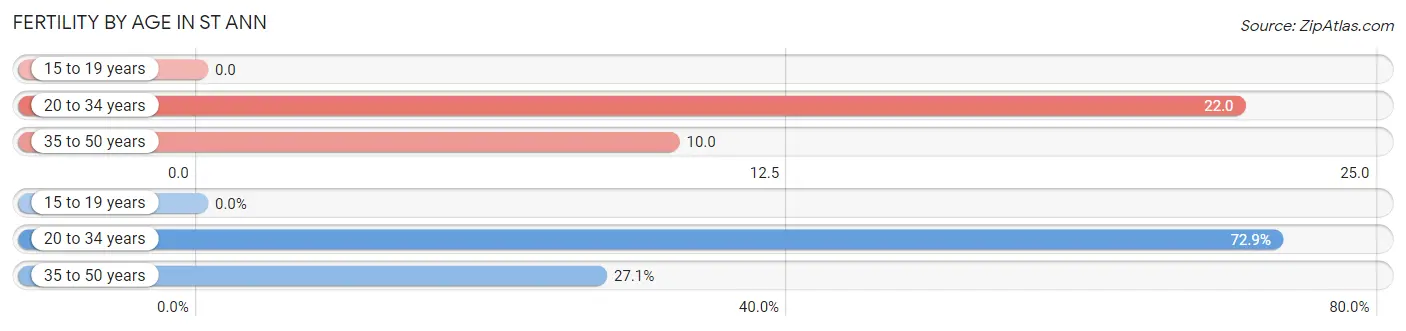
| Age Bracket | Women with Births | Births / 1,000 Women |
| 15 to 19 years | 0 (0.0%) | 0.0 |
| 20 to 34 years | 35 (72.9%) | 22.0 |
| 35 to 50 years | 13 (27.1%) | 10.0 |
| Total | 48 (100.0%) | 15.0 |
Fertility by Age by Marriage Status in St Ann
89.6% of women with births (48) in St Ann are married. The highest percentage of unmarried women with births falls into 20 to 34 years age bracket with 14.3% of them unmarried at the time of birth, while the lowest percentage of unmarried women with births belong to 35 to 50 years age bracket with 0.0% of them unmarried.
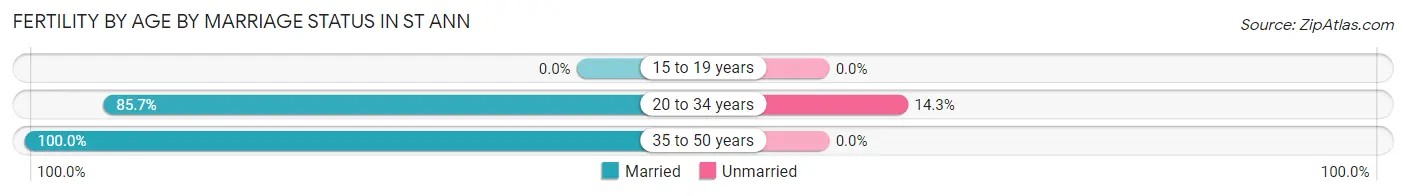
| Age Bracket | Married | Unmarried |
| 15 to 19 years | 0 (0.0%) | 0 (0.0%) |
| 20 to 34 years | 30 (85.7%) | 5 (14.3%) |
| 35 to 50 years | 13 (100.0%) | 0 (0.0%) |
| Total | 43 (89.6%) | 5 (10.4%) |
Fertility by Education in St Ann
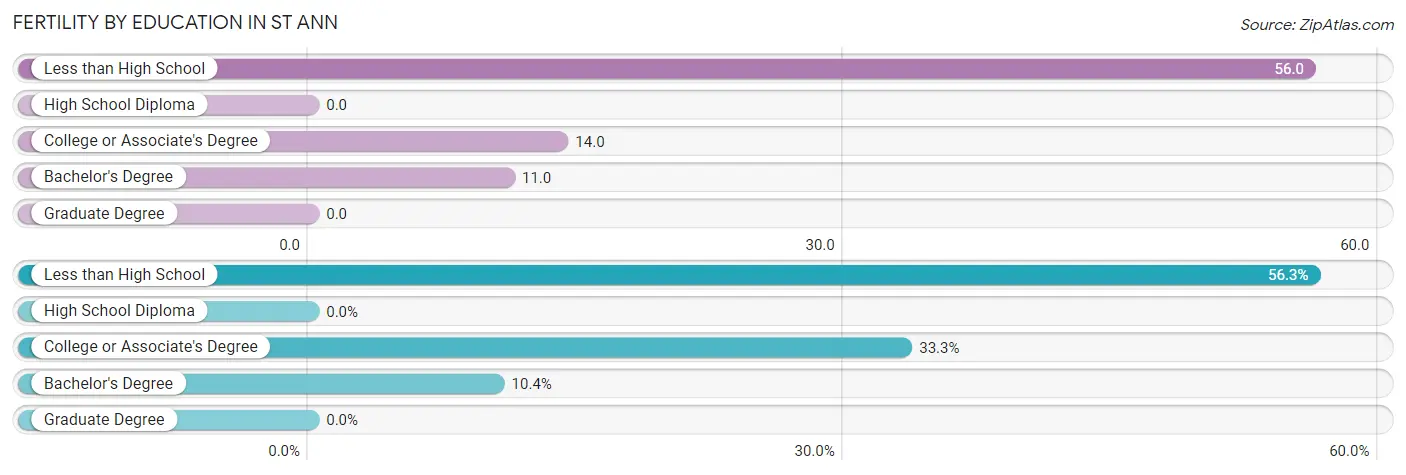
| Educational Attainment | Women with Births | Births / 1,000 Women |
| Less than High School | 27 (56.2%) | 56.0 |
| High School Diploma | 0 (0.0%) | 0.0 |
| College or Associate's Degree | 16 (33.3%) | 14.0 |
| Bachelor's Degree | 5 (10.4%) | 11.0 |
| Graduate Degree | 0 (0.0%) | 0.0 |
| Total | 48 (100.0%) | 15.0 |
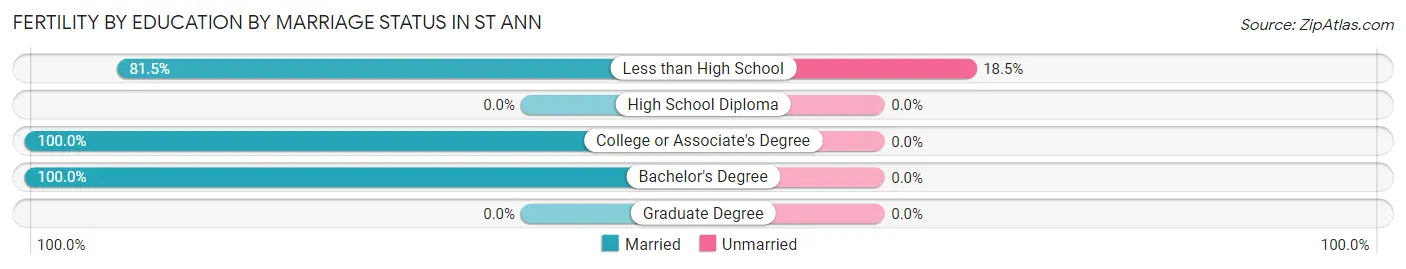
Fertility by Education by Marriage Status in St Ann
10.4% of women with births in St Ann are unmarried. Women with the educational attainment of college or associate's degree are most likely to be married with 100.0% of them married at childbirth, while women with the educational attainment of less than high school are least likely to be married with 18.5% of them unmarried at childbirth.
| Educational Attainment | Married | Unmarried |
| Less than High School | 22 (81.5%) | 5 (18.5%) |
| High School Diploma | 0 (0.0%) | 0 (0.0%) |
| College or Associate's Degree | 16 (100.0%) | 0 (0.0%) |
| Bachelor's Degree | 5 (100.0%) | 0 (0.0%) |
| Graduate Degree | 0 (0.0%) | 0 (0.0%) |
| Total | 43 (89.6%) | 5 (10.4%) |
Employment Characteristics in St Ann
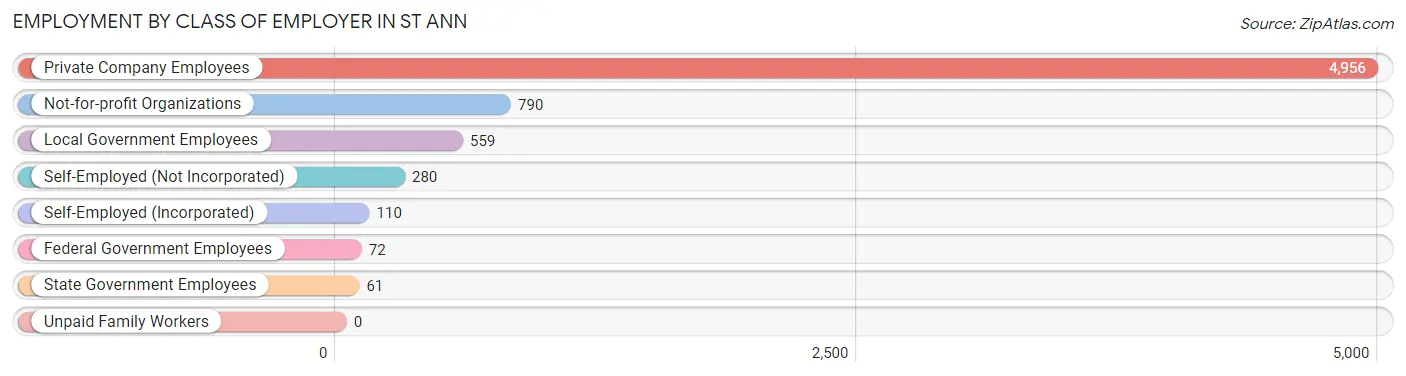
Employment by Class of Employer in St Ann
Among the 6,828 employed individuals in St Ann, private company employees (4,956 | 72.6%), not-for-profit organizations (790 | 11.6%), and local government employees (559 | 8.2%) make up the most common classes of employment.
| Employer Class | # Employees | % Employees |
| Private Company Employees | 4,956 | 72.6% |
| Self-Employed (Incorporated) | 110 | 1.6% |
| Self-Employed (Not Incorporated) | 280 | 4.1% |
| Not-for-profit Organizations | 790 | 11.6% |
| Local Government Employees | 559 | 8.2% |
| State Government Employees | 61 | 0.9% |
| Federal Government Employees | 72 | 1.1% |
| Unpaid Family Workers | 0 | 0.0% |
| Total | 6,828 | 100.0% |
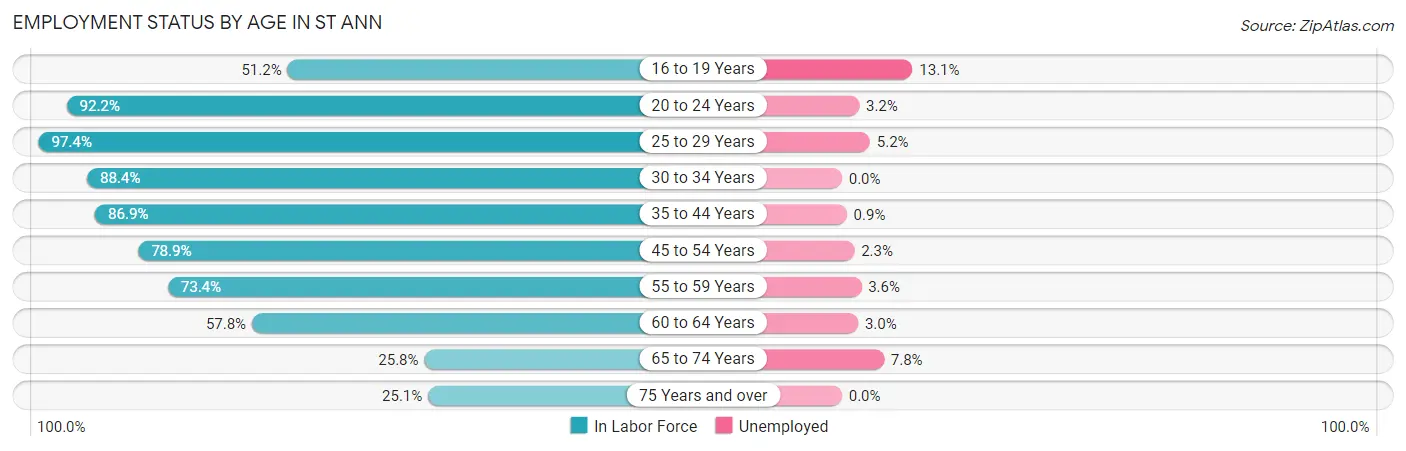
Employment Status by Age in St Ann
According to the labor force statistics for St Ann, out of the total population over 16 years of age (10,251), 70.2% or 7,196 individuals are in the labor force, with 3.0% or 216 of them unemployed. The age group with the highest labor force participation rate is 25 to 29 years, with 97.4% or 1,220 individuals in the labor force. Within the labor force, the 16 to 19 years age range has the highest percentage of unemployed individuals, with 13.1% or 31 of them being unemployed.
| Age Bracket | In Labor Force | Unemployed |
| 16 to 19 Years | 236 (51.2%) | 31 (13.1%) |
| 20 to 24 Years | 810 (92.2%) | 26 (3.2%) |
| 25 to 29 Years | 1,220 (97.4%) | 63 (5.2%) |
| 30 to 34 Years | 1,013 (88.4%) | 0 (0.0%) |
| 35 to 44 Years | 1,244 (86.9%) | 11 (0.9%) |
| 45 to 54 Years | 1,041 (78.9%) | 24 (2.3%) |
| 55 to 59 Years | 668 (73.4%) | 24 (3.6%) |
| 60 to 64 Years | 434 (57.8%) | 13 (3.0%) |
| 65 to 74 Years | 319 (25.8%) | 25 (7.8%) |
| 75 Years and over | 216 (25.1%) | 0 (0.0%) |
| Total | 7,196 (70.2%) | 216 (3.0%) |
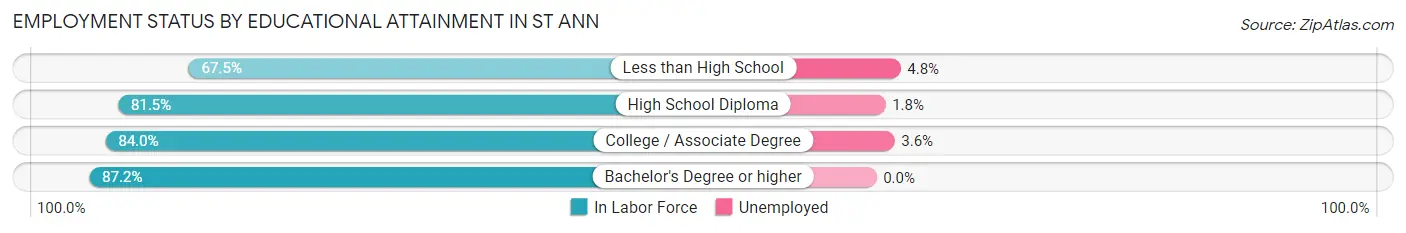
Employment Status by Educational Attainment in St Ann
According to labor force statistics for St Ann, 82.5% of individuals (5,620) out of the total population between 25 and 64 years of age (6,812) are in the labor force, with 2.4% or 135 of them being unemployed. The group with the highest labor force participation rate are those with the educational attainment of bachelor's degree or higher, with 87.2% or 1,006 individuals in the labor force. Within the labor force, individuals with less than high school education have the highest percentage of unemployment, with 4.8% or 15 of them being unemployed.
| Educational Attainment | In Labor Force | Unemployed |
| Less than High School | 314 (67.5%) | 22 (4.8%) |
| High School Diploma | 2,020 (81.5%) | 45 (1.8%) |
| College / Associate Degree | 2,280 (84.0%) | 98 (3.6%) |
| Bachelor's Degree or higher | 1,006 (87.2%) | 0 (0.0%) |
| Total | 5,620 (82.5%) | 163 (2.4%) |
Employment Occupations by Sex in St Ann
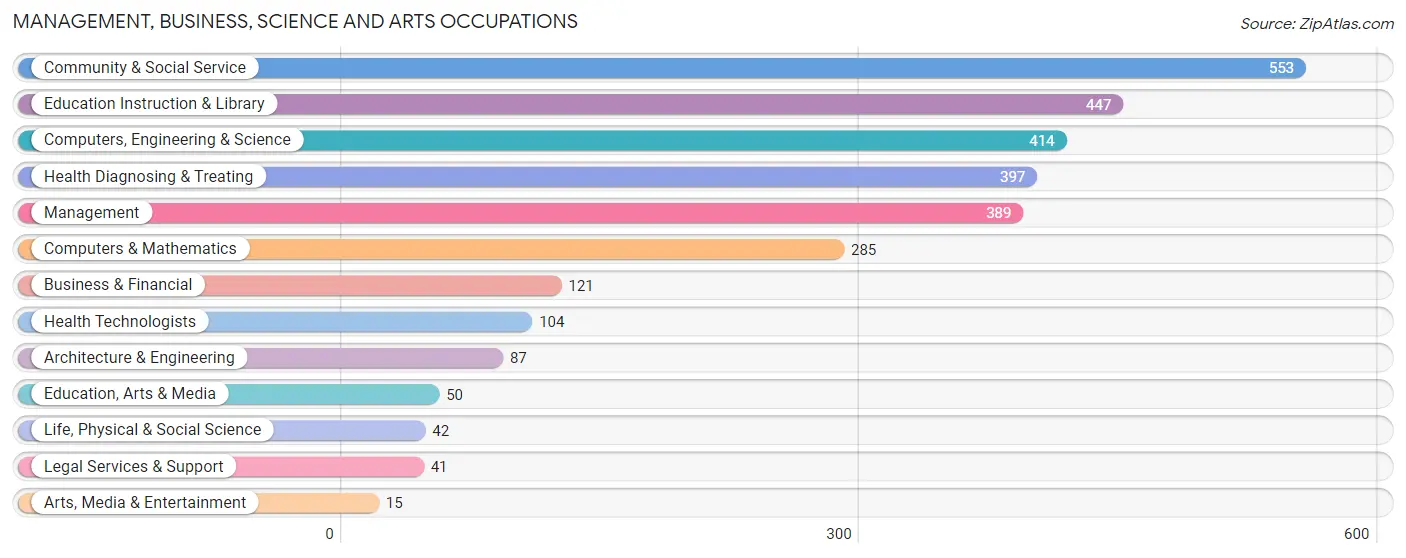
Management, Business, Science and Arts Occupations
The most common Management, Business, Science and Arts occupations in St Ann are Community & Social Service (553 | 7.9%), Education Instruction & Library (447 | 6.4%), Computers, Engineering & Science (414 | 5.9%), Health Diagnosing & Treating (397 | 5.7%), and Management (389 | 5.6%).
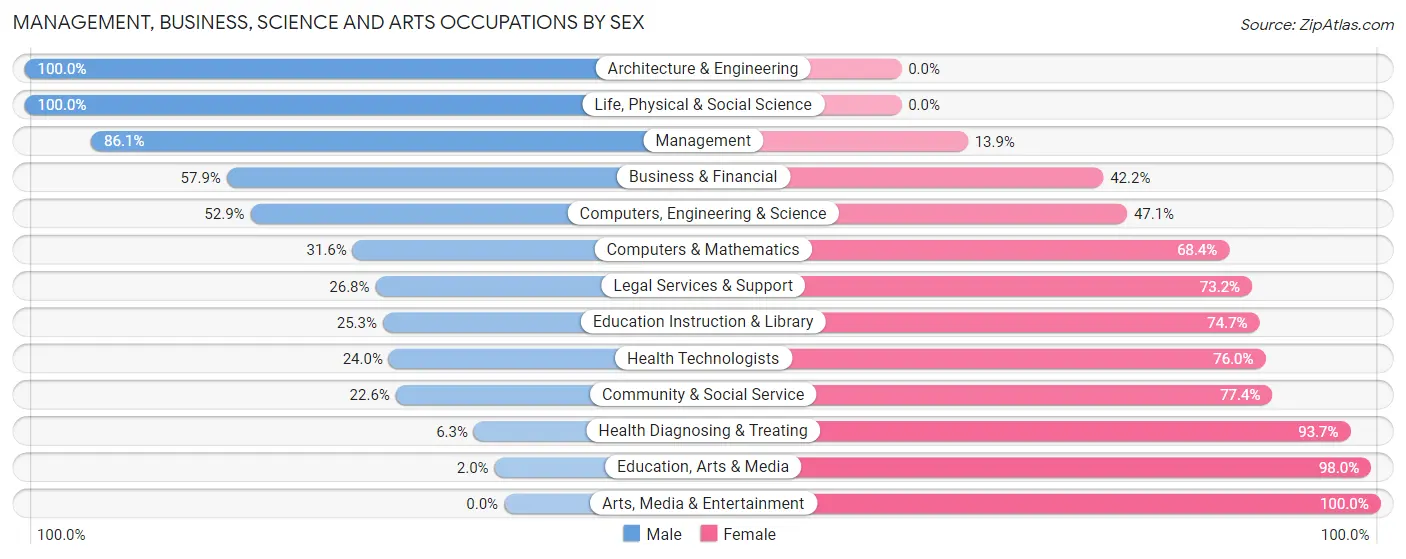
Management, Business, Science and Arts Occupations by Sex
Within the Management, Business, Science and Arts occupations in St Ann, the most male-oriented occupations are Architecture & Engineering (100.0%), Life, Physical & Social Science (100.0%), and Management (86.1%), while the most female-oriented occupations are Arts, Media & Entertainment (100.0%), Education, Arts & Media (98.0%), and Health Diagnosing & Treating (93.7%).
| Occupation | Male | Female |
| Management | 335 (86.1%) | 54 (13.9%) |
| Business & Financial | 70 (57.9%) | 51 (42.1%) |
| Computers, Engineering & Science | 219 (52.9%) | 195 (47.1%) |
| Computers & Mathematics | 90 (31.6%) | 195 (68.4%) |
| Architecture & Engineering | 87 (100.0%) | 0 (0.0%) |
| Life, Physical & Social Science | 42 (100.0%) | 0 (0.0%) |
| Community & Social Service | 125 (22.6%) | 428 (77.4%) |
| Education, Arts & Media | 1 (2.0%) | 49 (98.0%) |
| Legal Services & Support | 11 (26.8%) | 30 (73.2%) |
| Education Instruction & Library | 113 (25.3%) | 334 (74.7%) |
| Arts, Media & Entertainment | 0 (0.0%) | 15 (100.0%) |
| Health Diagnosing & Treating | 25 (6.3%) | 372 (93.7%) |
| Health Technologists | 25 (24.0%) | 79 (76.0%) |
| Total (Category) | 774 (41.3%) | 1,100 (58.7%) |
| Total (Overall) | 3,536 (50.6%) | 3,448 (49.4%) |
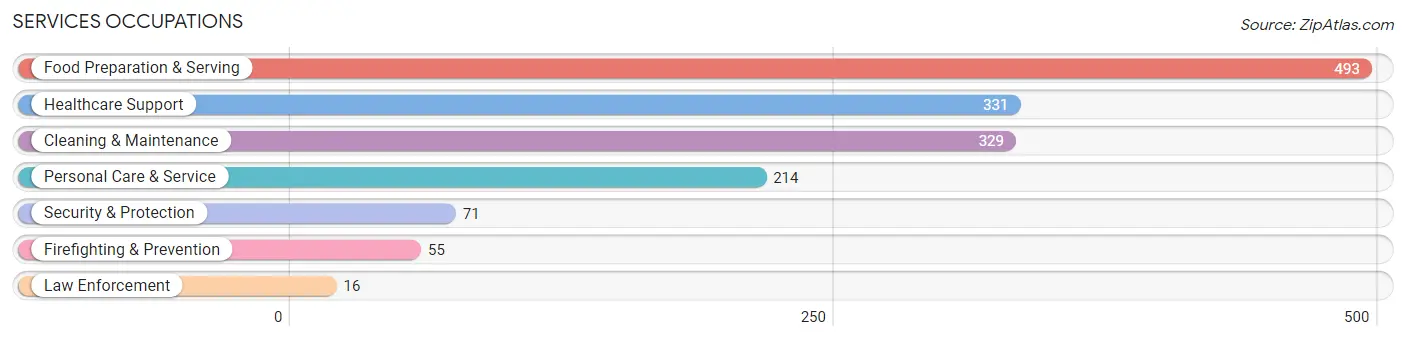
Services Occupations
The most common Services occupations in St Ann are Food Preparation & Serving (493 | 7.1%), Healthcare Support (331 | 4.7%), Cleaning & Maintenance (329 | 4.7%), Personal Care & Service (214 | 3.1%), and Security & Protection (71 | 1.0%).
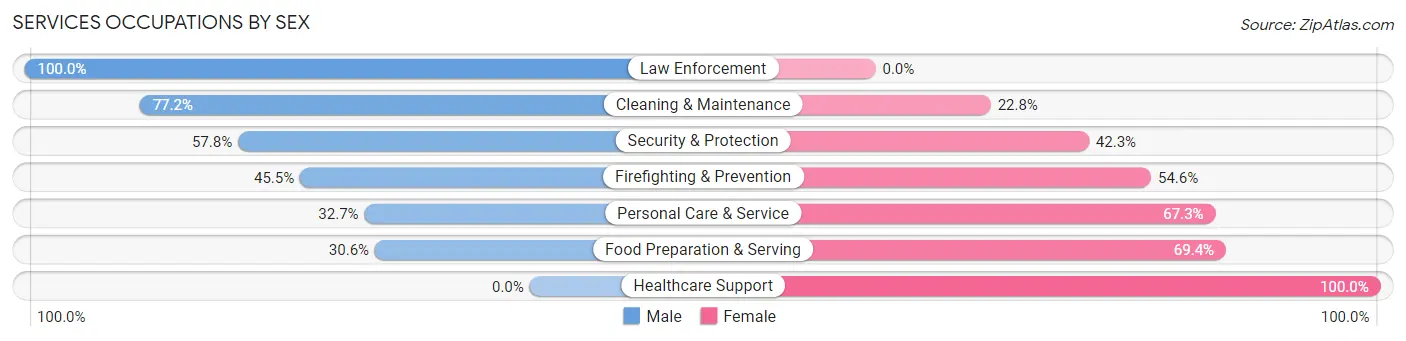
Services Occupations by Sex
Within the Services occupations in St Ann, the most male-oriented occupations are Law Enforcement (100.0%), Cleaning & Maintenance (77.2%), and Security & Protection (57.8%), while the most female-oriented occupations are Healthcare Support (100.0%), Food Preparation & Serving (69.4%), and Personal Care & Service (67.3%).
| Occupation | Male | Female |
| Healthcare Support | 0 (0.0%) | 331 (100.0%) |
| Security & Protection | 41 (57.8%) | 30 (42.2%) |
| Firefighting & Prevention | 25 (45.5%) | 30 (54.5%) |
| Law Enforcement | 16 (100.0%) | 0 (0.0%) |
| Food Preparation & Serving | 151 (30.6%) | 342 (69.4%) |
| Cleaning & Maintenance | 254 (77.2%) | 75 (22.8%) |
| Personal Care & Service | 70 (32.7%) | 144 (67.3%) |
| Total (Category) | 516 (35.9%) | 922 (64.1%) |
| Total (Overall) | 3,536 (50.6%) | 3,448 (49.4%) |
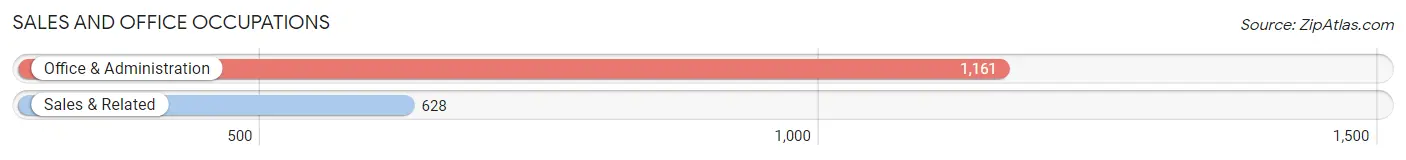
Sales and Office Occupations
The most common Sales and Office occupations in St Ann are Office & Administration (1,161 | 16.6%), and Sales & Related (628 | 9.0%).
Sales and Office Occupations by Sex
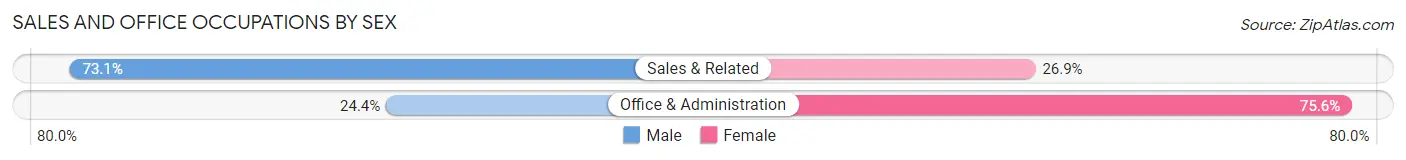
| Occupation | Male | Female |
| Sales & Related | 459 (73.1%) | 169 (26.9%) |
| Office & Administration | 283 (24.4%) | 878 (75.6%) |
| Total (Category) | 742 (41.5%) | 1,047 (58.5%) |
| Total (Overall) | 3,536 (50.6%) | 3,448 (49.4%) |
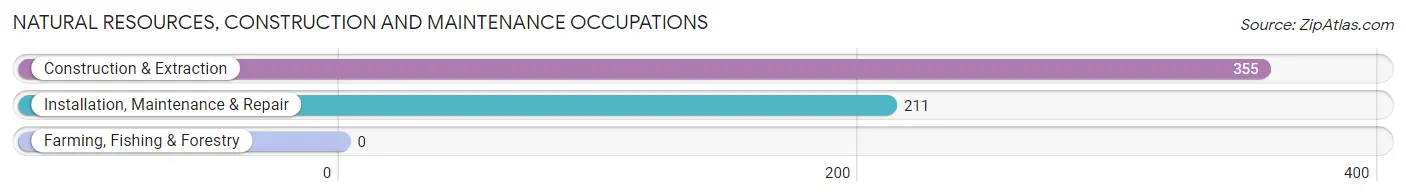
Natural Resources, Construction and Maintenance Occupations
The most common Natural Resources, Construction and Maintenance occupations in St Ann are Construction & Extraction (355 | 5.1%), and Installation, Maintenance & Repair (211 | 3.0%).
Natural Resources, Construction and Maintenance Occupations by Sex
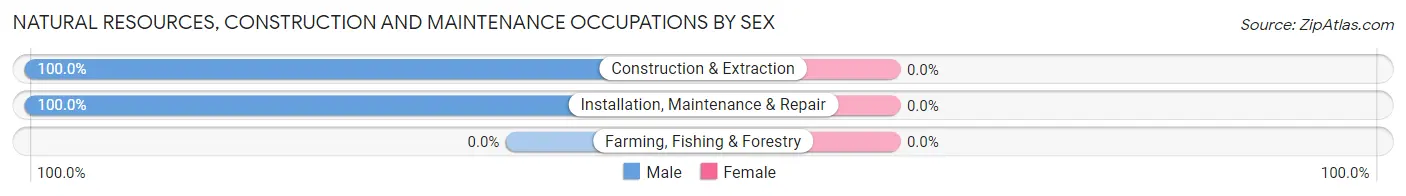
| Occupation | Male | Female |
| Farming, Fishing & Forestry | 0 (0.0%) | 0 (0.0%) |
| Construction & Extraction | 355 (100.0%) | 0 (0.0%) |
| Installation, Maintenance & Repair | 211 (100.0%) | 0 (0.0%) |
| Total (Category) | 566 (100.0%) | 0 (0.0%) |
| Total (Overall) | 3,536 (50.6%) | 3,448 (49.4%) |
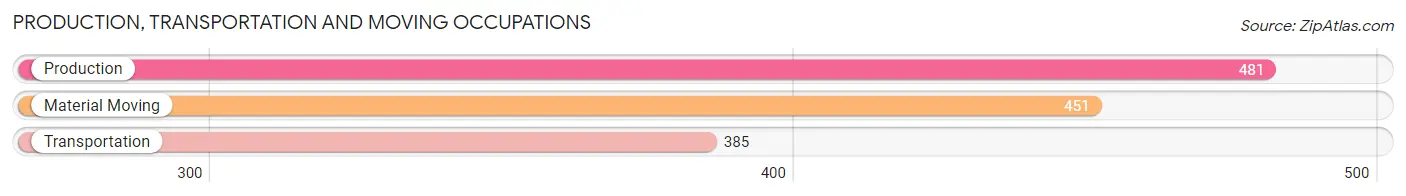
Production, Transportation and Moving Occupations
The most common Production, Transportation and Moving occupations in St Ann are Production (481 | 6.9%), Material Moving (451 | 6.5%), and Transportation (385 | 5.5%).
Production, Transportation and Moving Occupations by Sex
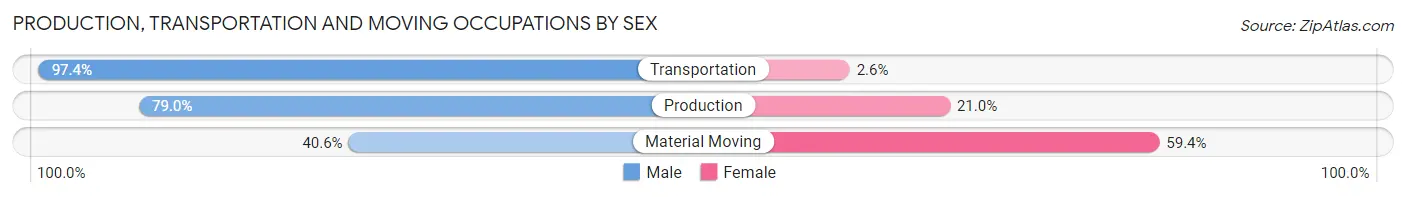
| Occupation | Male | Female |
| Production | 380 (79.0%) | 101 (21.0%) |
| Transportation | 375 (97.4%) | 10 (2.6%) |
| Material Moving | 183 (40.6%) | 268 (59.4%) |
| Total (Category) | 938 (71.2%) | 379 (28.8%) |
| Total (Overall) | 3,536 (50.6%) | 3,448 (49.4%) |
Employment Industries by Sex in St Ann
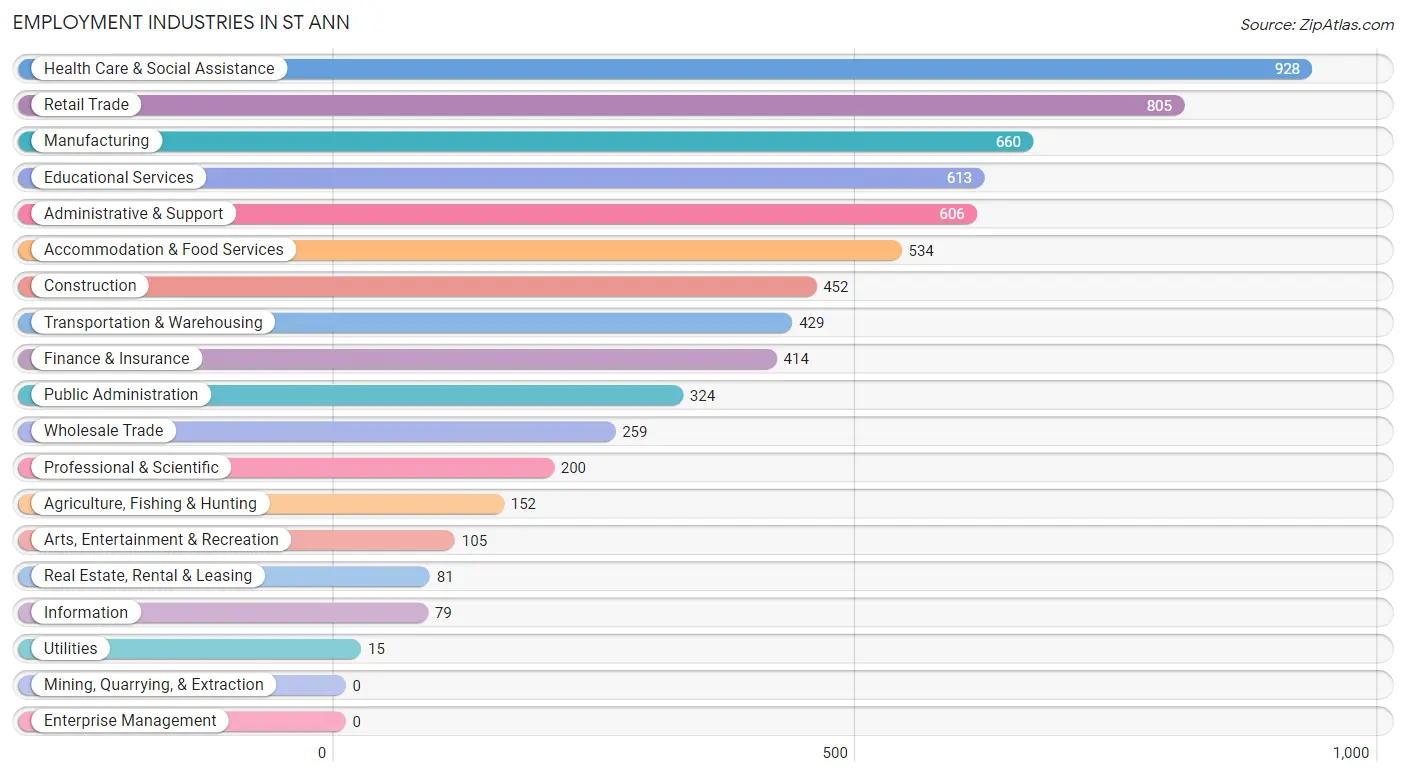
Employment Industries in St Ann
The major employment industries in St Ann include Health Care & Social Assistance (928 | 13.3%), Retail Trade (805 | 11.5%), Manufacturing (660 | 9.5%), Educational Services (613 | 8.8%), and Administrative & Support (606 | 8.7%).
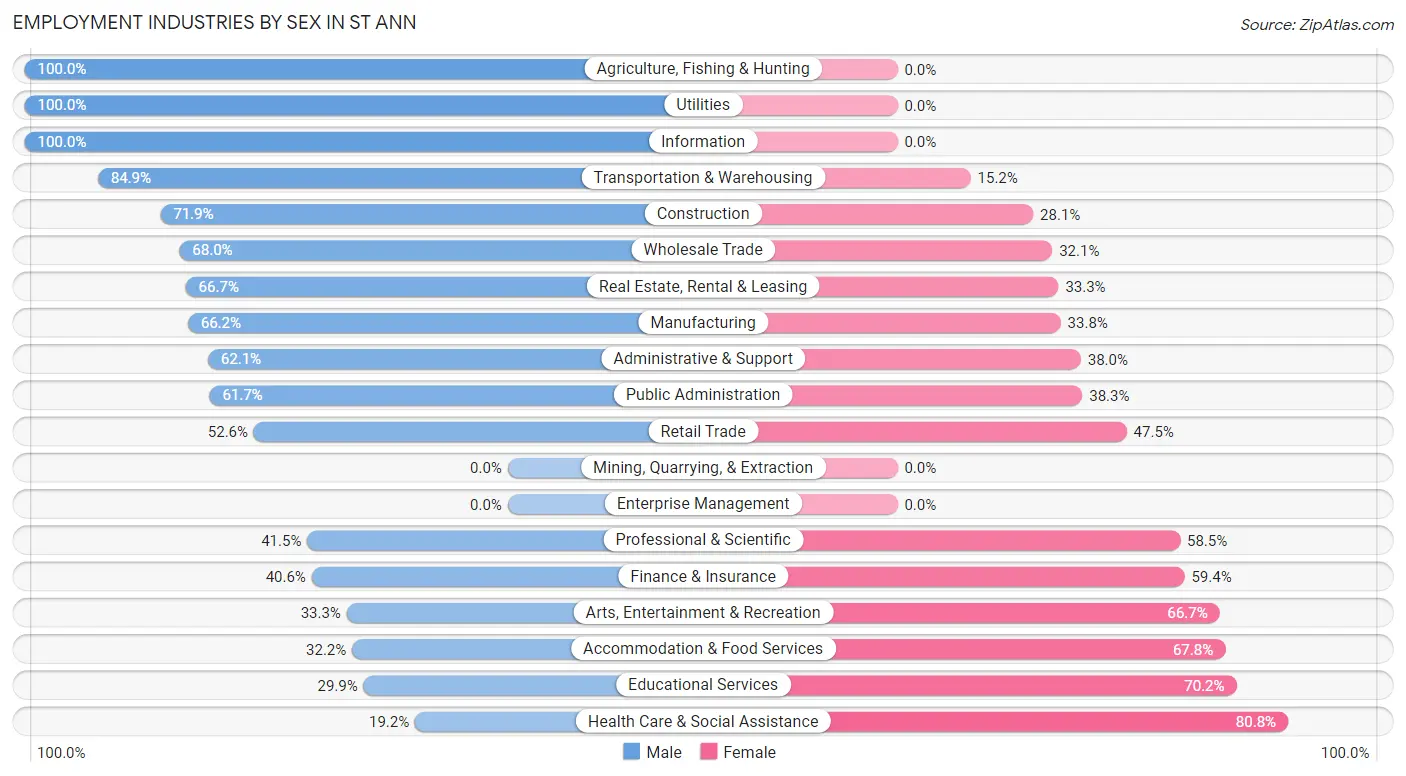
Employment Industries by Sex in St Ann
The St Ann industries that see more men than women are Agriculture, Fishing & Hunting (100.0%), Utilities (100.0%), and Information (100.0%), whereas the industries that tend to have a higher number of women are Health Care & Social Assistance (80.8%), Educational Services (70.2%), and Accommodation & Food Services (67.8%).
| Industry | Male | Female |
| Agriculture, Fishing & Hunting | 152 (100.0%) | 0 (0.0%) |
| Mining, Quarrying, & Extraction | 0 (0.0%) | 0 (0.0%) |
| Construction | 325 (71.9%) | 127 (28.1%) |
| Manufacturing | 437 (66.2%) | 223 (33.8%) |
| Wholesale Trade | 176 (67.9%) | 83 (32.1%) |
| Retail Trade | 423 (52.5%) | 382 (47.4%) |
| Transportation & Warehousing | 364 (84.9%) | 65 (15.1%) |
| Utilities | 15 (100.0%) | 0 (0.0%) |
| Information | 79 (100.0%) | 0 (0.0%) |
| Finance & Insurance | 168 (40.6%) | 246 (59.4%) |
| Real Estate, Rental & Leasing | 54 (66.7%) | 27 (33.3%) |
| Professional & Scientific | 83 (41.5%) | 117 (58.5%) |
| Enterprise Management | 0 (0.0%) | 0 (0.0%) |
| Administrative & Support | 376 (62.1%) | 230 (38.0%) |
| Educational Services | 183 (29.8%) | 430 (70.2%) |
| Health Care & Social Assistance | 178 (19.2%) | 750 (80.8%) |
| Arts, Entertainment & Recreation | 35 (33.3%) | 70 (66.7%) |
| Accommodation & Food Services | 172 (32.2%) | 362 (67.8%) |
| Public Administration | 200 (61.7%) | 124 (38.3%) |
| Total | 3,536 (50.6%) | 3,448 (49.4%) |
Education in St Ann
School Enrollment in St Ann
The most common levels of schooling among the 2,594 students in St Ann are elementary school (791 | 30.5%), high school (510 | 19.7%), and middle school (475 | 18.3%).
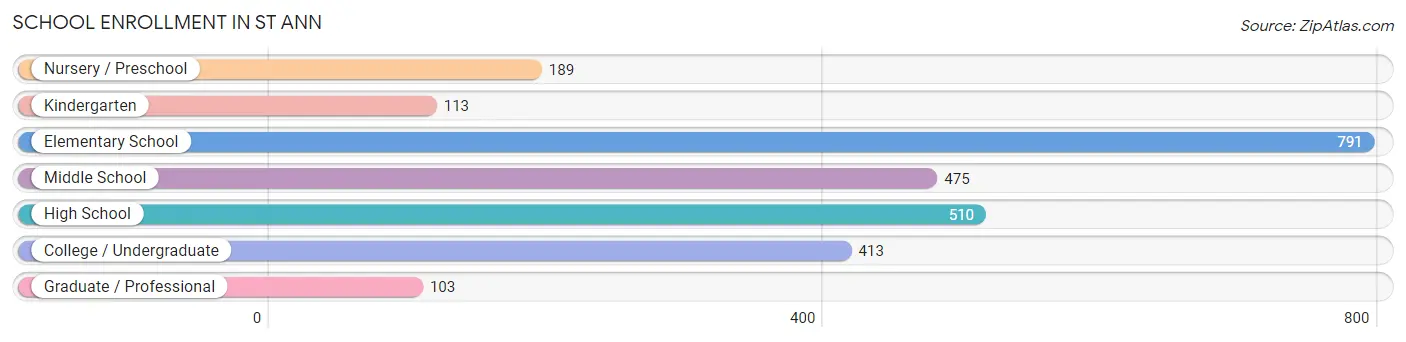
| School Level | # Students | % Students |
| Nursery / Preschool | 189 | 7.3% |
| Kindergarten | 113 | 4.4% |
| Elementary School | 791 | 30.5% |
| Middle School | 475 | 18.3% |
| High School | 510 | 19.7% |
| College / Undergraduate | 413 | 15.9% |
| Graduate / Professional | 103 | 4.0% |
| Total | 2,594 | 100.0% |
School Enrollment by Age by Funding Source in St Ann
Out of a total of 2,594 students who are enrolled in schools in St Ann, 387 (14.9%) attend a private institution, while the remaining 2,207 (85.1%) are enrolled in public schools. The age group of 25 to 34 year olds has the highest likelihood of being enrolled in private schools, with 49 (21.7% in the age bracket) enrolled. Conversely, the age group of 3 to 4 year olds has the lowest likelihood of being enrolled in a private school, with 95 (100.0% in the age bracket) attending a public institution.
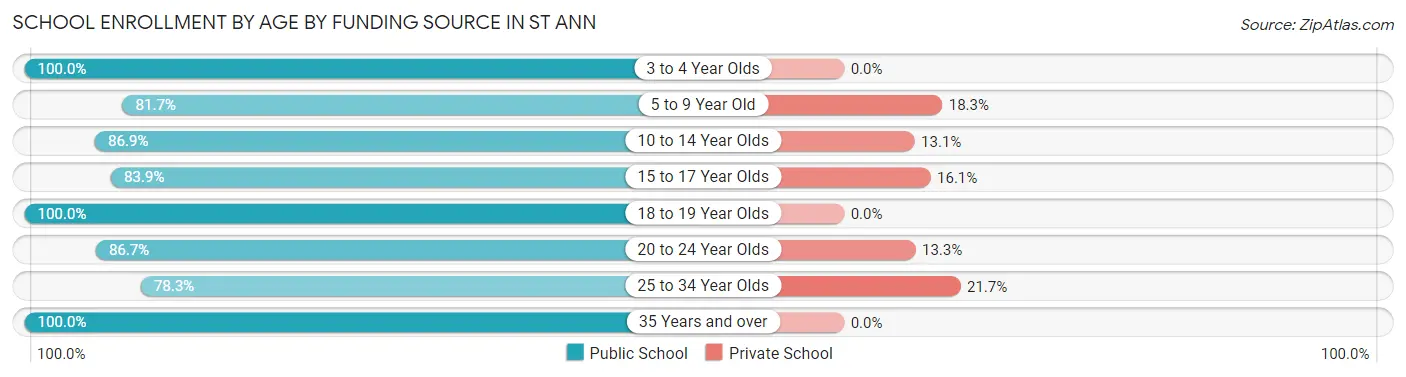
| Age Bracket | Public School | Private School |
| 3 to 4 Year Olds | 95 (100.0%) | 0 (0.0%) |
| 5 to 9 Year Old | 662 (81.7%) | 148 (18.3%) |
| 10 to 14 Year Olds | 635 (86.9%) | 96 (13.1%) |
| 15 to 17 Year Olds | 323 (83.9%) | 62 (16.1%) |
| 18 to 19 Year Olds | 82 (100.0%) | 0 (0.0%) |
| 20 to 24 Year Olds | 202 (86.7%) | 31 (13.3%) |
| 25 to 34 Year Olds | 177 (78.3%) | 49 (21.7%) |
| 35 Years and over | 32 (100.0%) | 0 (0.0%) |
| Total | 2,207 (85.1%) | 387 (14.9%) |
Educational Attainment by Field of Study in St Ann
Education (253 | 15.9%), business (247 | 15.5%), arts & humanities (239 | 15.0%), science & technology (160 | 10.0%), and engineering (128 | 8.0%) are the most common fields of study among 1,595 individuals in St Ann who have obtained a bachelor's degree or higher.
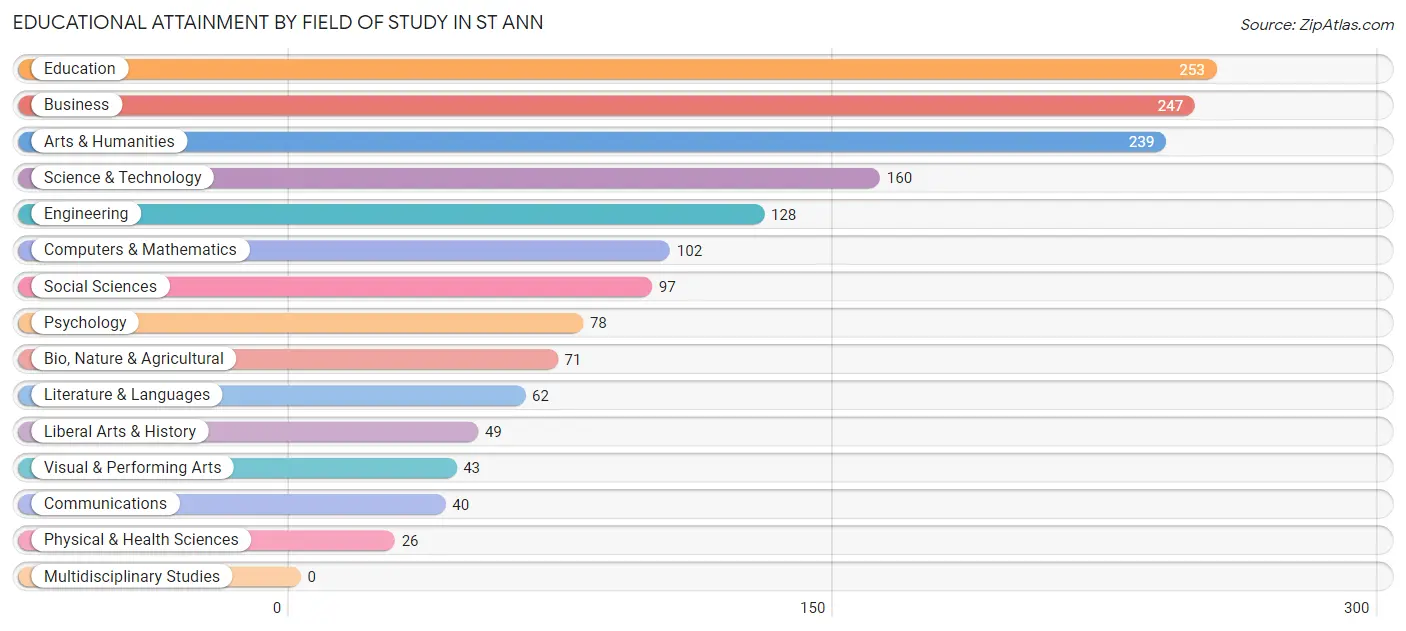
| Field of Study | # Graduates | % Graduates |
| Computers & Mathematics | 102 | 6.4% |
| Bio, Nature & Agricultural | 71 | 4.4% |
| Physical & Health Sciences | 26 | 1.6% |
| Psychology | 78 | 4.9% |
| Social Sciences | 97 | 6.1% |
| Engineering | 128 | 8.0% |
| Multidisciplinary Studies | 0 | 0.0% |
| Science & Technology | 160 | 10.0% |
| Business | 247 | 15.5% |
| Education | 253 | 15.9% |
| Literature & Languages | 62 | 3.9% |
| Liberal Arts & History | 49 | 3.1% |
| Visual & Performing Arts | 43 | 2.7% |
| Communications | 40 | 2.5% |
| Arts & Humanities | 239 | 15.0% |
| Total | 1,595 | 100.0% |
Transportation & Commute in St Ann
Vehicle Availability by Sex in St Ann
The most prevalent vehicle ownership categories in St Ann are males with 2 vehicles (1,283, accounting for 37.0%) and females with 2 vehicles (1,155, making up 38.2%).
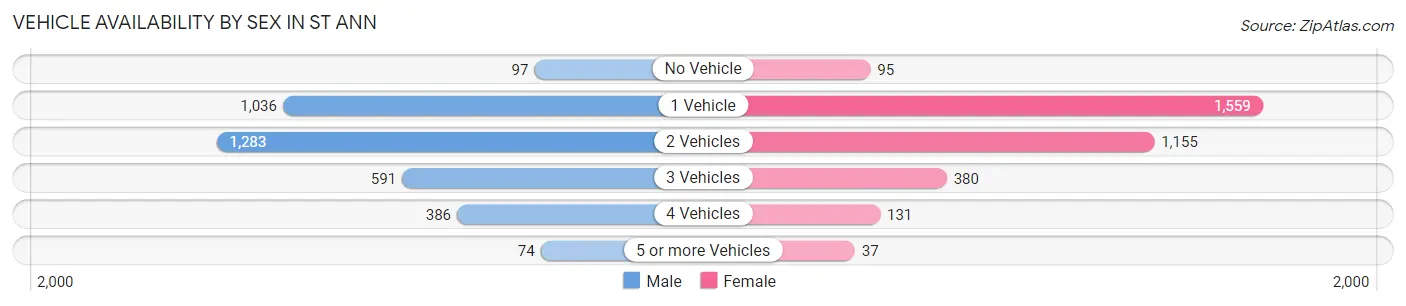
| Vehicles Available | Male | Female |
| No Vehicle | 97 (2.8%) | 95 (2.8%) |
| 1 Vehicle | 1,036 (29.9%) | 1,559 (46.4%) |
| 2 Vehicles | 1,283 (37.0%) | 1,155 (34.4%) |
| 3 Vehicles | 591 (17.1%) | 380 (11.3%) |
| 4 Vehicles | 386 (11.1%) | 131 (3.9%) |
| 5 or more Vehicles | 74 (2.1%) | 37 (1.1%) |
| Total | 3,467 (100.0%) | 3,357 (100.0%) |
Commute Time in St Ann
The most frequently occuring commute durations in St Ann are 15 to 19 minutes (1,599 commuters, 25.3%), 20 to 24 minutes (1,529 commuters, 24.2%), and 10 to 14 minutes (996 commuters, 15.7%).
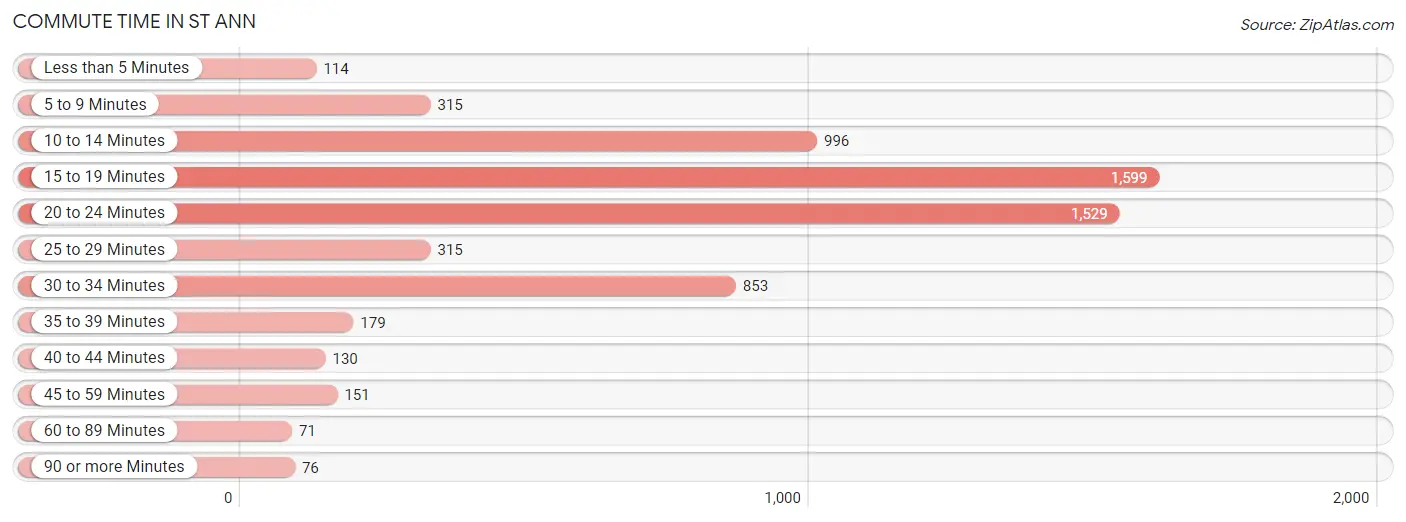
| Commute Time | # Commuters | % Commuters |
| Less than 5 Minutes | 114 | 1.8% |
| 5 to 9 Minutes | 315 | 5.0% |
| 10 to 14 Minutes | 996 | 15.7% |
| 15 to 19 Minutes | 1,599 | 25.3% |
| 20 to 24 Minutes | 1,529 | 24.2% |
| 25 to 29 Minutes | 315 | 5.0% |
| 30 to 34 Minutes | 853 | 13.5% |
| 35 to 39 Minutes | 179 | 2.8% |
| 40 to 44 Minutes | 130 | 2.1% |
| 45 to 59 Minutes | 151 | 2.4% |
| 60 to 89 Minutes | 71 | 1.1% |
| 90 or more Minutes | 76 | 1.2% |
Commute Time by Sex in St Ann
The most common commute times in St Ann are 20 to 24 minutes (859 commuters, 26.4%) for males and 15 to 19 minutes (871 commuters, 28.3%) for females.
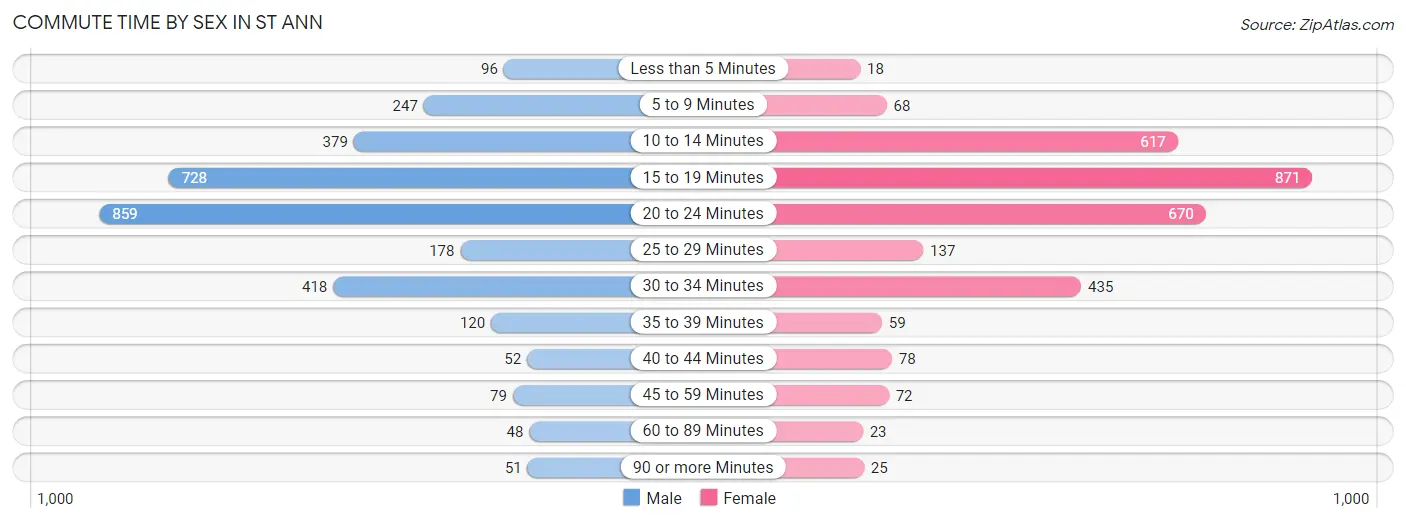
| Commute Time | Male | Female |
| Less than 5 Minutes | 96 (2.9%) | 18 (0.6%) |
| 5 to 9 Minutes | 247 (7.6%) | 68 (2.2%) |
| 10 to 14 Minutes | 379 (11.6%) | 617 (20.1%) |
| 15 to 19 Minutes | 728 (22.4%) | 871 (28.3%) |
| 20 to 24 Minutes | 859 (26.4%) | 670 (21.8%) |
| 25 to 29 Minutes | 178 (5.5%) | 137 (4.5%) |
| 30 to 34 Minutes | 418 (12.8%) | 435 (14.2%) |
| 35 to 39 Minutes | 120 (3.7%) | 59 (1.9%) |
| 40 to 44 Minutes | 52 (1.6%) | 78 (2.5%) |
| 45 to 59 Minutes | 79 (2.4%) | 72 (2.3%) |
| 60 to 89 Minutes | 48 (1.5%) | 23 (0.7%) |
| 90 or more Minutes | 51 (1.6%) | 25 (0.8%) |
Time of Departure to Work by Sex in St Ann
The most frequent times of departure to work in St Ann are 8:00 AM to 8:29 AM (549, 16.9%) for males and 12:00 PM to 3:59 PM (429, 14.0%) for females.
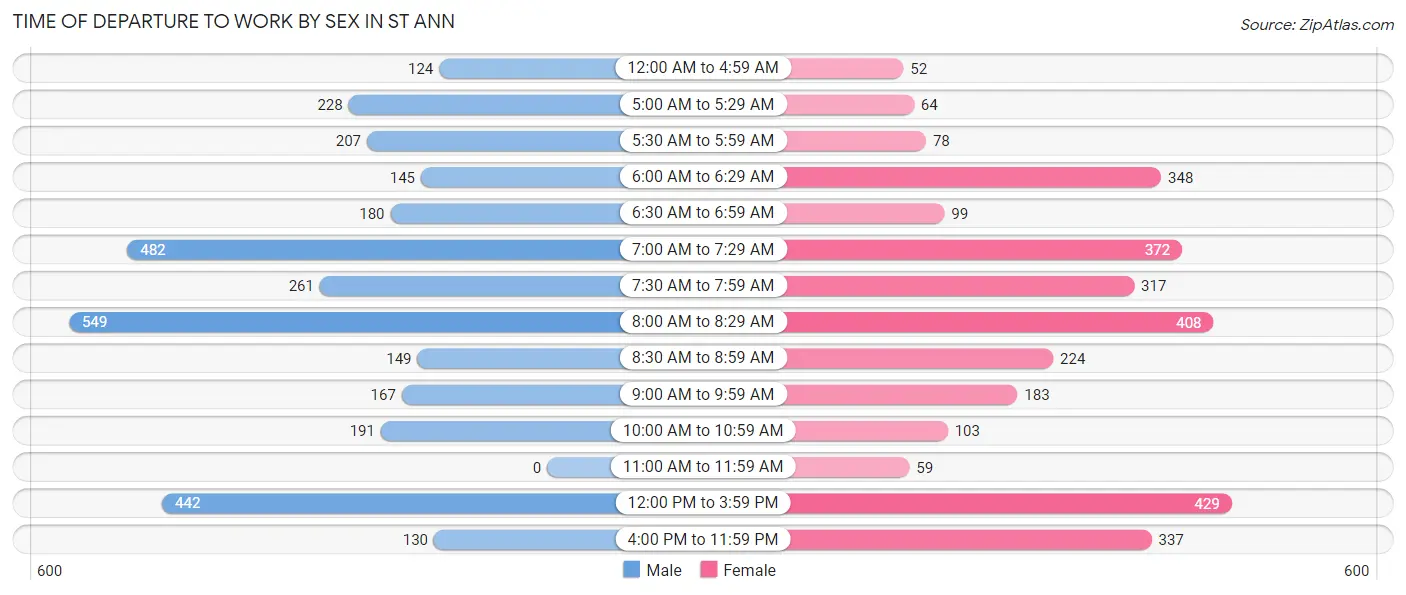
| Time of Departure | Male | Female |
| 12:00 AM to 4:59 AM | 124 (3.8%) | 52 (1.7%) |
| 5:00 AM to 5:29 AM | 228 (7.0%) | 64 (2.1%) |
| 5:30 AM to 5:59 AM | 207 (6.4%) | 78 (2.5%) |
| 6:00 AM to 6:29 AM | 145 (4.4%) | 348 (11.3%) |
| 6:30 AM to 6:59 AM | 180 (5.5%) | 99 (3.2%) |
| 7:00 AM to 7:29 AM | 482 (14.8%) | 372 (12.1%) |
| 7:30 AM to 7:59 AM | 261 (8.0%) | 317 (10.3%) |
| 8:00 AM to 8:29 AM | 549 (16.9%) | 408 (13.3%) |
| 8:30 AM to 8:59 AM | 149 (4.6%) | 224 (7.3%) |
| 9:00 AM to 9:59 AM | 167 (5.1%) | 183 (6.0%) |
| 10:00 AM to 10:59 AM | 191 (5.9%) | 103 (3.4%) |
| 11:00 AM to 11:59 AM | 0 (0.0%) | 59 (1.9%) |
| 12:00 PM to 3:59 PM | 442 (13.6%) | 429 (14.0%) |
| 4:00 PM to 11:59 PM | 130 (4.0%) | 337 (11.0%) |
| Total | 3,255 (100.0%) | 3,073 (100.0%) |
Housing Occupancy in St Ann
Occupancy by Ownership in St Ann
Of the total 6,153 dwellings in St Ann, owner-occupied units account for 3,278 (53.3%), while renter-occupied units make up 2,875 (46.7%).
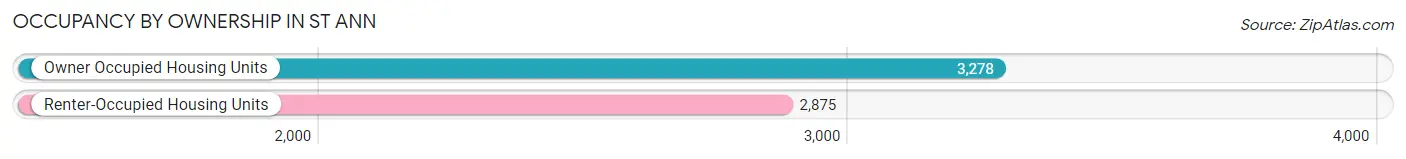
| Occupancy | # Housing Units | % Housing Units |
| Owner Occupied Housing Units | 3,278 | 53.3% |
| Renter-Occupied Housing Units | 2,875 | 46.7% |
| Total Occupied Housing Units | 6,153 | 100.0% |
Occupancy by Household Size in St Ann
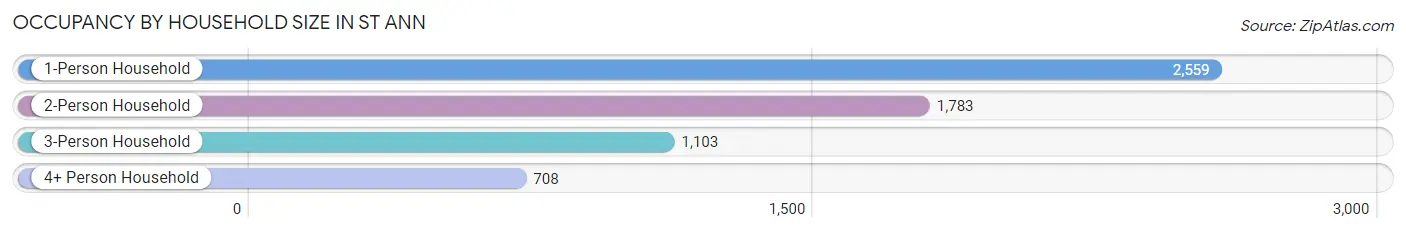
| Household Size | # Housing Units | % Housing Units |
| 1-Person Household | 2,559 | 41.6% |
| 2-Person Household | 1,783 | 29.0% |
| 3-Person Household | 1,103 | 17.9% |
| 4+ Person Household | 708 | 11.5% |
| Total Housing Units | 6,153 | 100.0% |
Occupancy by Ownership by Household Size in St Ann
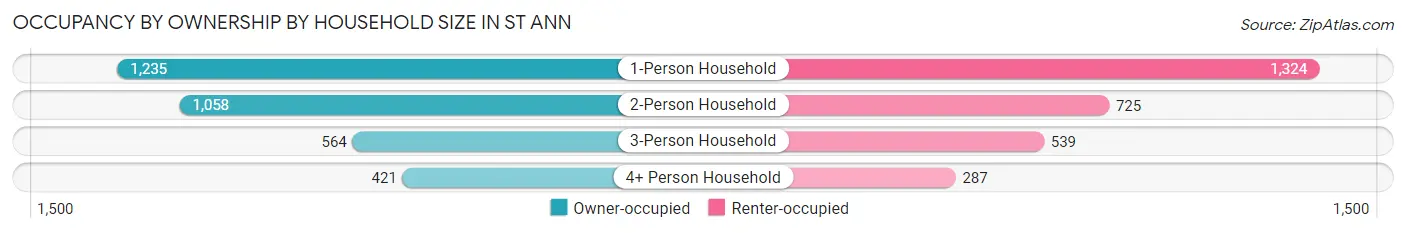
| Household Size | Owner-occupied | Renter-occupied |
| 1-Person Household | 1,235 (48.3%) | 1,324 (51.7%) |
| 2-Person Household | 1,058 (59.3%) | 725 (40.7%) |
| 3-Person Household | 564 (51.1%) | 539 (48.9%) |
| 4+ Person Household | 421 (59.5%) | 287 (40.5%) |
| Total Housing Units | 3,278 (53.3%) | 2,875 (46.7%) |
Occupancy by Educational Attainment in St Ann
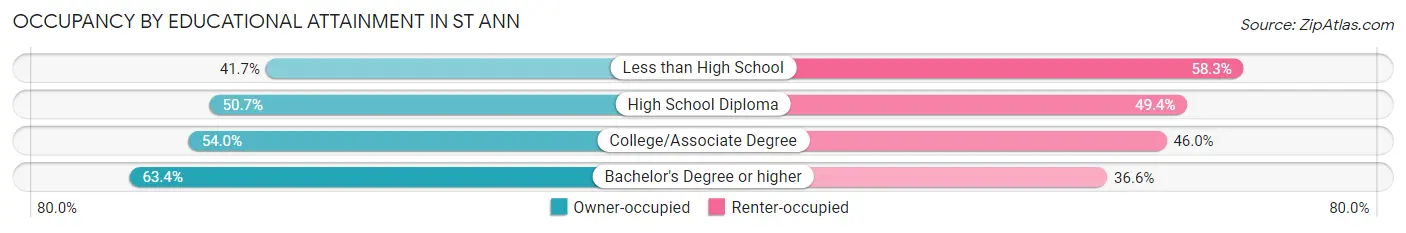
| Household Size | Owner-occupied | Renter-occupied |
| Less than High School | 192 (41.7%) | 268 (58.3%) |
| High School Diploma | 1,087 (50.6%) | 1,059 (49.3%) |
| College/Associate Degree | 1,425 (54.0%) | 1,216 (46.0%) |
| Bachelor's Degree or higher | 574 (63.4%) | 332 (36.6%) |
Occupancy by Age of Householder in St Ann
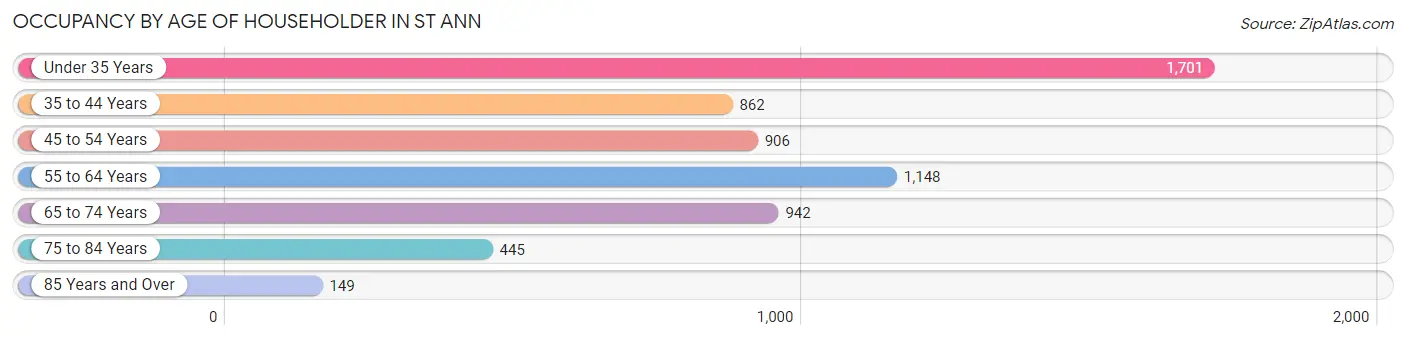
| Age Bracket | # Households | % Households |
| Under 35 Years | 1,701 | 27.7% |
| 35 to 44 Years | 862 | 14.0% |
| 45 to 54 Years | 906 | 14.7% |
| 55 to 64 Years | 1,148 | 18.7% |
| 65 to 74 Years | 942 | 15.3% |
| 75 to 84 Years | 445 | 7.2% |
| 85 Years and Over | 149 | 2.4% |
| Total | 6,153 | 100.0% |
Housing Finances in St Ann
Median Income by Occupancy in St Ann
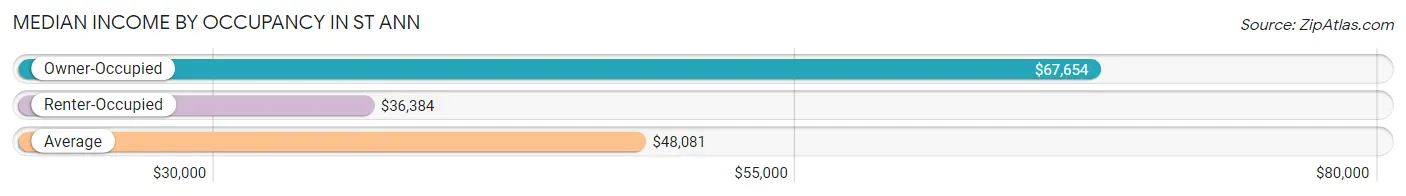
| Occupancy Type | # Households | Median Income |
| Owner-Occupied | 3,278 (53.3%) | $67,654 |
| Renter-Occupied | 2,875 (46.7%) | $36,384 |
| Average | 6,153 (100.0%) | $48,081 |
Occupancy by Householder Income Bracket in St Ann
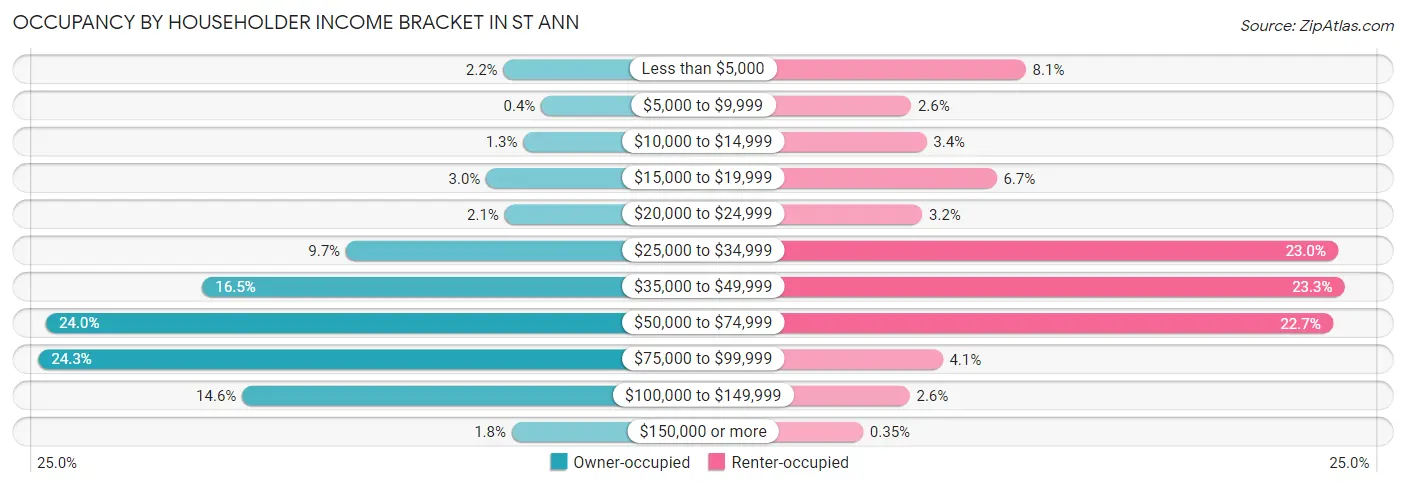
| Income Bracket | Owner-occupied | Renter-occupied |
| Less than $5,000 | 72 (2.2%) | 233 (8.1%) |
| $5,000 to $9,999 | 13 (0.4%) | 76 (2.6%) |
| $10,000 to $14,999 | 41 (1.3%) | 97 (3.4%) |
| $15,000 to $19,999 | 99 (3.0%) | 193 (6.7%) |
| $20,000 to $24,999 | 70 (2.1%) | 91 (3.2%) |
| $25,000 to $34,999 | 318 (9.7%) | 660 (23.0%) |
| $35,000 to $49,999 | 542 (16.5%) | 669 (23.3%) |
| $50,000 to $74,999 | 786 (24.0%) | 653 (22.7%) |
| $75,000 to $99,999 | 798 (24.3%) | 119 (4.1%) |
| $100,000 to $149,999 | 480 (14.6%) | 74 (2.6%) |
| $150,000 or more | 59 (1.8%) | 10 (0.4%) |
| Total | 3,278 (100.0%) | 2,875 (100.0%) |
Monthly Housing Cost Tiers in St Ann
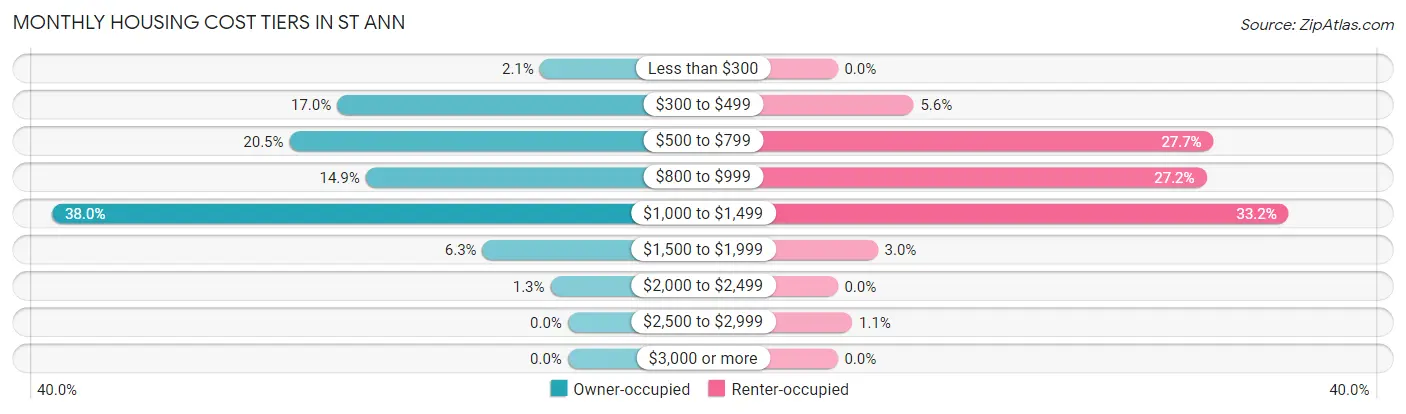
| Monthly Cost | Owner-occupied | Renter-occupied |
| Less than $300 | 68 (2.1%) | 0 (0.0%) |
| $300 to $499 | 557 (17.0%) | 161 (5.6%) |
| $500 to $799 | 672 (20.5%) | 796 (27.7%) |
| $800 to $999 | 488 (14.9%) | 781 (27.2%) |
| $1,000 to $1,499 | 1,245 (38.0%) | 955 (33.2%) |
| $1,500 to $1,999 | 206 (6.3%) | 85 (3.0%) |
| $2,000 to $2,499 | 42 (1.3%) | 0 (0.0%) |
| $2,500 to $2,999 | 0 (0.0%) | 31 (1.1%) |
| $3,000 or more | 0 (0.0%) | 0 (0.0%) |
| Total | 3,278 (100.0%) | 2,875 (100.0%) |
Physical Housing Characteristics in St Ann
Housing Structures in St Ann
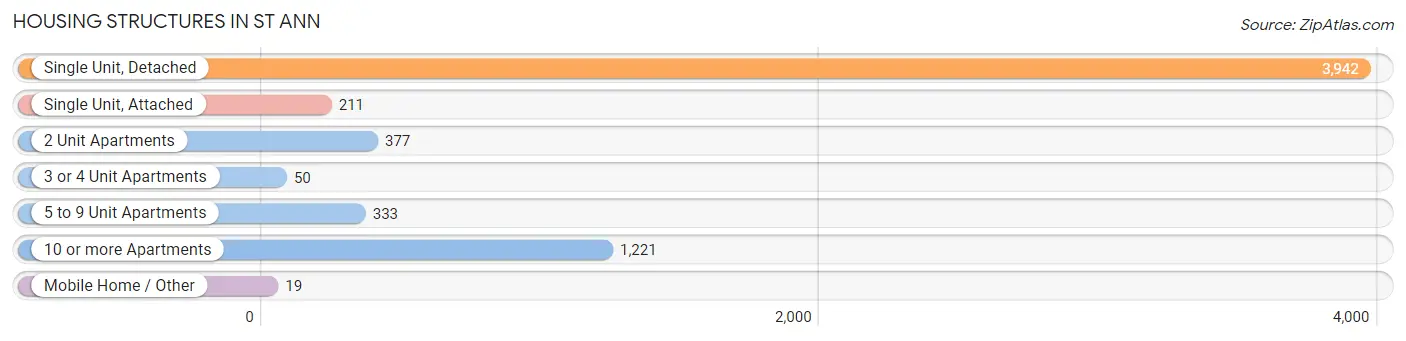
| Structure Type | # Housing Units | % Housing Units |
| Single Unit, Detached | 3,942 | 64.1% |
| Single Unit, Attached | 211 | 3.4% |
| 2 Unit Apartments | 377 | 6.1% |
| 3 or 4 Unit Apartments | 50 | 0.8% |
| 5 to 9 Unit Apartments | 333 | 5.4% |
| 10 or more Apartments | 1,221 | 19.8% |
| Mobile Home / Other | 19 | 0.3% |
| Total | 6,153 | 100.0% |
Housing Structures by Occupancy in St Ann
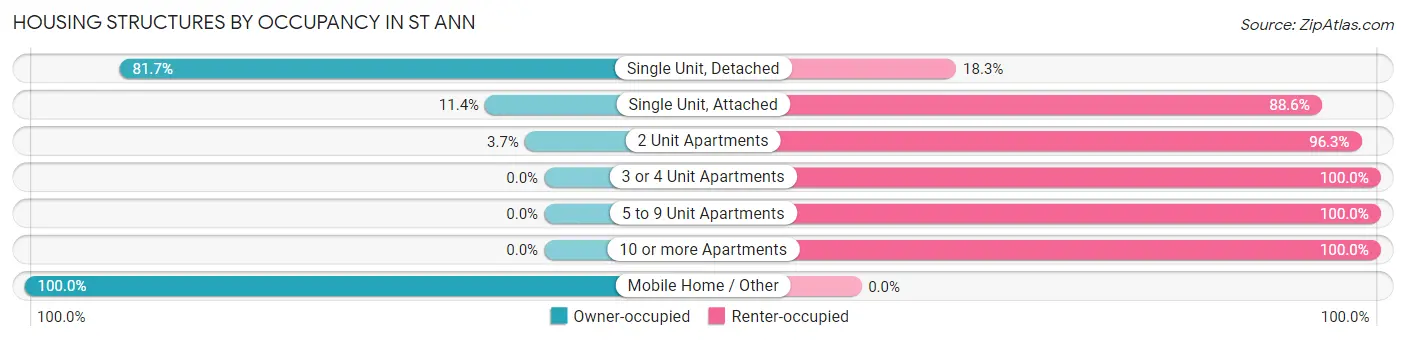
| Structure Type | Owner-occupied | Renter-occupied |
| Single Unit, Detached | 3,221 (81.7%) | 721 (18.3%) |
| Single Unit, Attached | 24 (11.4%) | 187 (88.6%) |
| 2 Unit Apartments | 14 (3.7%) | 363 (96.3%) |
| 3 or 4 Unit Apartments | 0 (0.0%) | 50 (100.0%) |
| 5 to 9 Unit Apartments | 0 (0.0%) | 333 (100.0%) |
| 10 or more Apartments | 0 (0.0%) | 1,221 (100.0%) |
| Mobile Home / Other | 19 (100.0%) | 0 (0.0%) |
| Total | 3,278 (53.3%) | 2,875 (46.7%) |
Housing Structures by Number of Rooms in St Ann
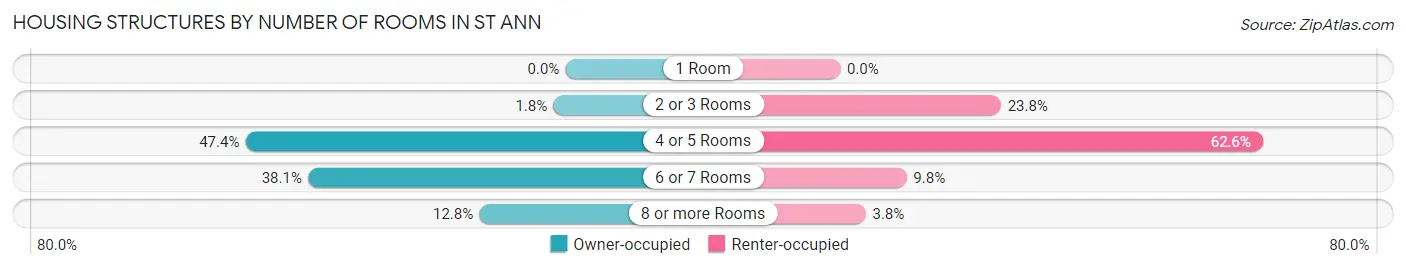
| Number of Rooms | Owner-occupied | Renter-occupied |
| 1 Room | 0 (0.0%) | 0 (0.0%) |
| 2 or 3 Rooms | 59 (1.8%) | 684 (23.8%) |
| 4 or 5 Rooms | 1,552 (47.3%) | 1,799 (62.6%) |
| 6 or 7 Rooms | 1,249 (38.1%) | 283 (9.8%) |
| 8 or more Rooms | 418 (12.8%) | 109 (3.8%) |
| Total | 3,278 (100.0%) | 2,875 (100.0%) |
Housing Structure by Heating Type in St Ann
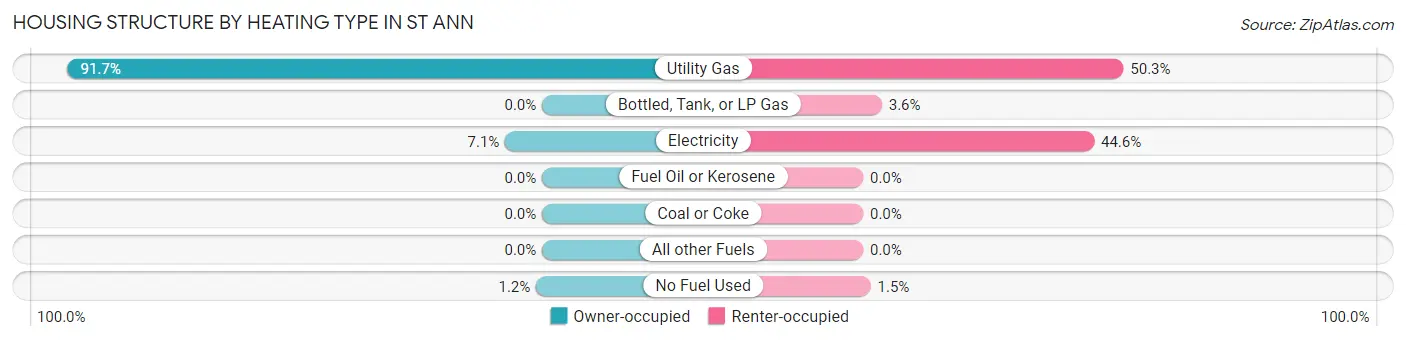
| Heating Type | Owner-occupied | Renter-occupied |
| Utility Gas | 3,006 (91.7%) | 1,446 (50.3%) |
| Bottled, Tank, or LP Gas | 0 (0.0%) | 104 (3.6%) |
| Electricity | 234 (7.1%) | 1,283 (44.6%) |
| Fuel Oil or Kerosene | 0 (0.0%) | 0 (0.0%) |
| Coal or Coke | 0 (0.0%) | 0 (0.0%) |
| All other Fuels | 0 (0.0%) | 0 (0.0%) |
| No Fuel Used | 38 (1.2%) | 42 (1.5%) |
| Total | 3,278 (100.0%) | 2,875 (100.0%) |
Household Vehicle Usage in St Ann
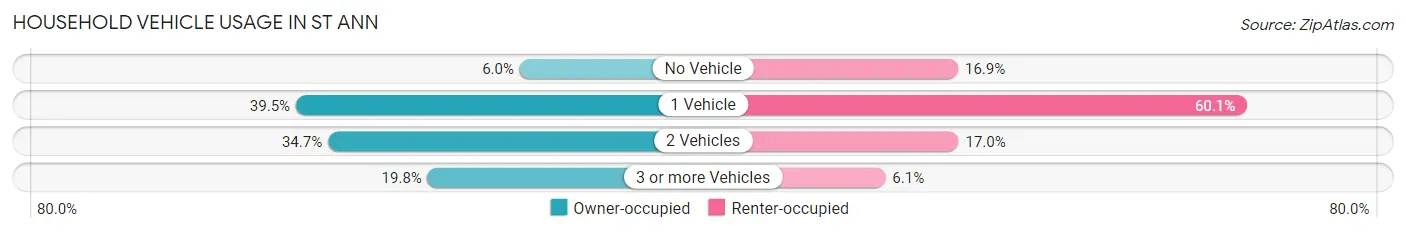
| Vehicles per Household | Owner-occupied | Renter-occupied |
| No Vehicle | 198 (6.0%) | 486 (16.9%) |
| 1 Vehicle | 1,294 (39.5%) | 1,727 (60.1%) |
| 2 Vehicles | 1,137 (34.7%) | 488 (17.0%) |
| 3 or more Vehicles | 649 (19.8%) | 174 (6.0%) |
| Total | 3,278 (100.0%) | 2,875 (100.0%) |
Real Estate & Mortgages in St Ann
Real Estate and Mortgage Overview in St Ann
| Characteristic | Without Mortgage | With Mortgage |
| Housing Units | 1,013 | 2,265 |
| Median Property Value | $98,900 | $115,000 |
| Median Household Income | $55,321 | $53 |
| Monthly Housing Costs | $475 | $0 |
| Real Estate Taxes | $2,011 | $29 |
Property Value by Mortgage Status in St Ann
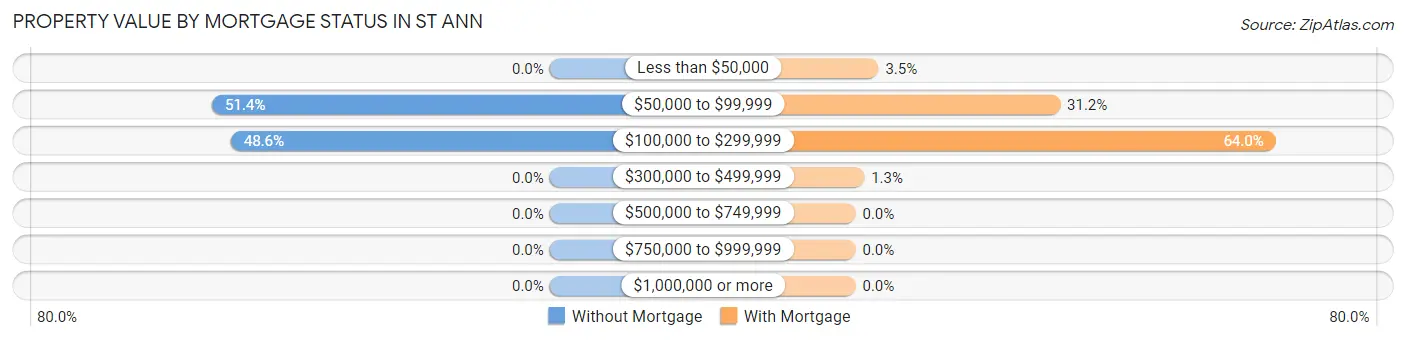
| Property Value | Without Mortgage | With Mortgage |
| Less than $50,000 | 0 (0.0%) | 79 (3.5%) |
| $50,000 to $99,999 | 521 (51.4%) | 706 (31.2%) |
| $100,000 to $299,999 | 492 (48.6%) | 1,450 (64.0%) |
| $300,000 to $499,999 | 0 (0.0%) | 30 (1.3%) |
| $500,000 to $749,999 | 0 (0.0%) | 0 (0.0%) |
| $750,000 to $999,999 | 0 (0.0%) | 0 (0.0%) |
| $1,000,000 or more | 0 (0.0%) | 0 (0.0%) |
| Total | 1,013 (100.0%) | 2,265 (100.0%) |
Household Income by Mortgage Status in St Ann
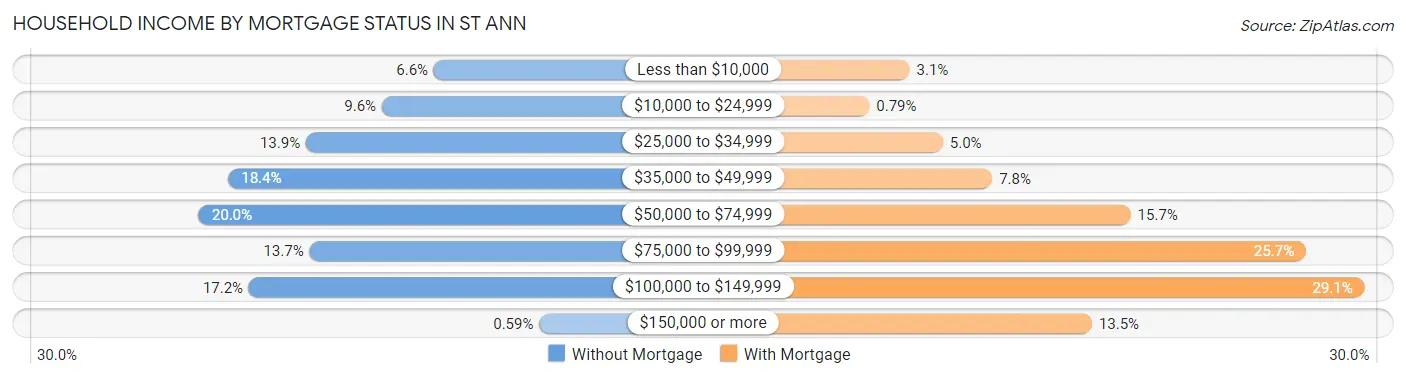
| Household Income | Without Mortgage | With Mortgage |
| Less than $10,000 | 67 (6.6%) | 70 (3.1%) |
| $10,000 to $24,999 | 97 (9.6%) | 18 (0.8%) |
| $25,000 to $34,999 | 141 (13.9%) | 113 (5.0%) |
| $35,000 to $49,999 | 186 (18.4%) | 177 (7.8%) |
| $50,000 to $74,999 | 203 (20.0%) | 356 (15.7%) |
| $75,000 to $99,999 | 139 (13.7%) | 583 (25.7%) |
| $100,000 to $149,999 | 174 (17.2%) | 659 (29.1%) |
| $150,000 or more | 6 (0.6%) | 306 (13.5%) |
| Total | 1,013 (100.0%) | 2,265 (100.0%) |
Property Value to Household Income Ratio in St Ann
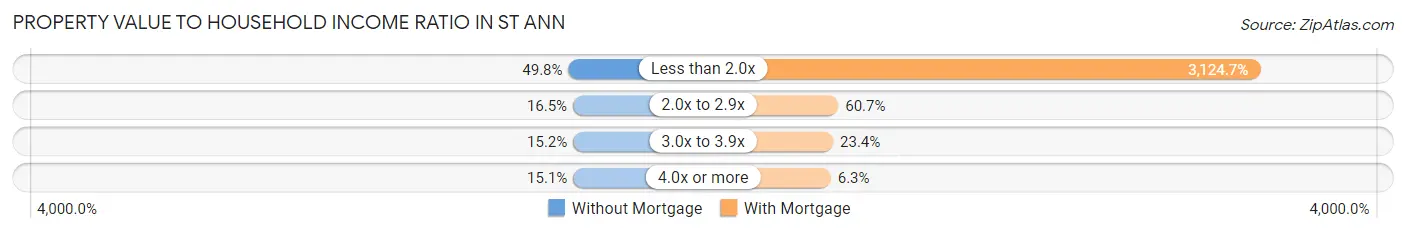
| Value-to-Income Ratio | Without Mortgage | With Mortgage |
| Less than 2.0x | 504 (49.7%) | 70,774 (3,124.7%) |
| 2.0x to 2.9x | 167 (16.5%) | 1,375 (60.7%) |
| 3.0x to 3.9x | 154 (15.2%) | 529 (23.4%) |
| 4.0x or more | 153 (15.1%) | 142 (6.3%) |
| Total | 1,013 (100.0%) | 2,265 (100.0%) |
Real Estate Taxes by Mortgage Status in St Ann
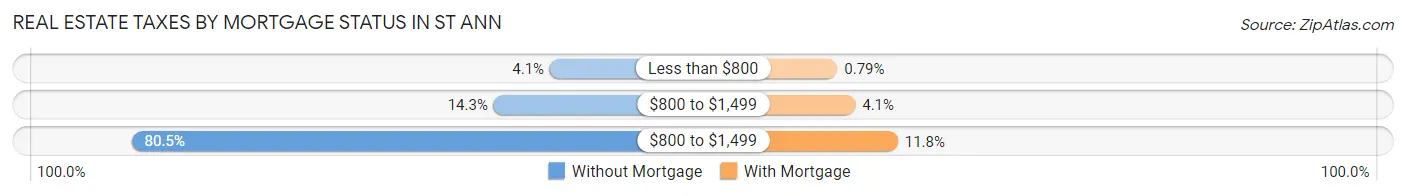
| Property Taxes | Without Mortgage | With Mortgage |
| Less than $800 | 41 (4.1%) | 18 (0.8%) |
| $800 to $1,499 | 145 (14.3%) | 92 (4.1%) |
| $800 to $1,499 | 815 (80.4%) | 268 (11.8%) |
| Total | 1,013 (100.0%) | 2,265 (100.0%) |
Health & Disability in St Ann
Health Insurance Coverage by Age in St Ann
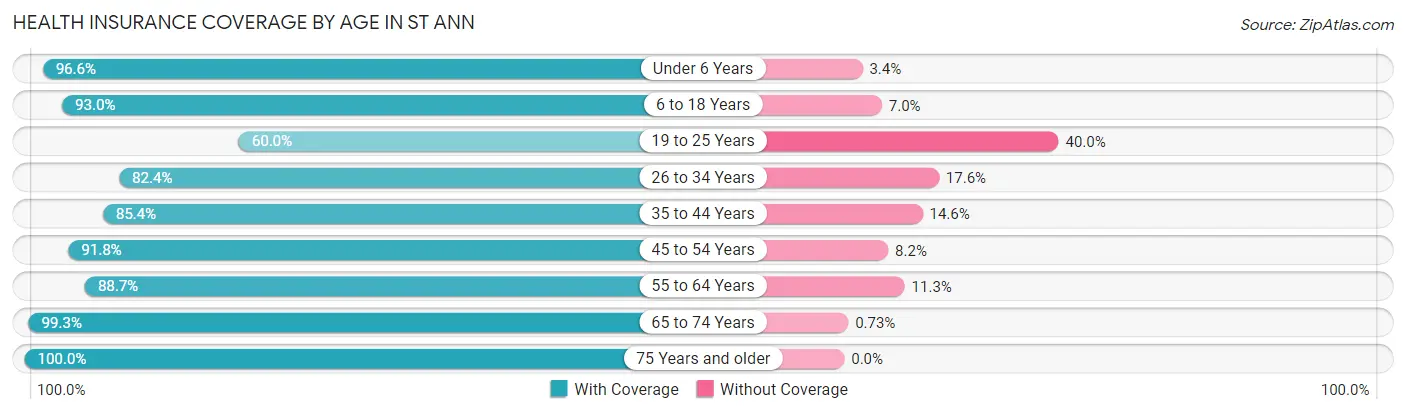
| Age Bracket | With Coverage | Without Coverage |
| Under 6 Years | 1,000 (96.6%) | 35 (3.4%) |
| 6 to 18 Years | 1,857 (93.0%) | 140 (7.0%) |
| 19 to 25 Years | 819 (60.0%) | 545 (40.0%) |
| 26 to 34 Years | 1,653 (82.4%) | 354 (17.6%) |
| 35 to 44 Years | 1,223 (85.4%) | 209 (14.6%) |
| 45 to 54 Years | 1,212 (91.8%) | 108 (8.2%) |
| 55 to 64 Years | 1,474 (88.7%) | 187 (11.3%) |
| 65 to 74 Years | 1,228 (99.3%) | 9 (0.7%) |
| 75 Years and older | 862 (100.0%) | 0 (0.0%) |
| Total | 11,328 (87.7%) | 1,587 (12.3%) |
Health Insurance Coverage by Citizenship Status in St Ann
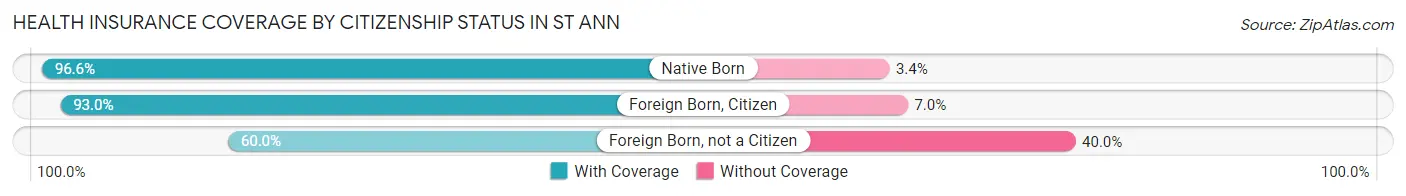
| Citizenship Status | With Coverage | Without Coverage |
| Native Born | 1,000 (96.6%) | 35 (3.4%) |
| Foreign Born, Citizen | 1,857 (93.0%) | 140 (7.0%) |
| Foreign Born, not a Citizen | 819 (60.0%) | 545 (40.0%) |
Health Insurance Coverage by Household Income in St Ann
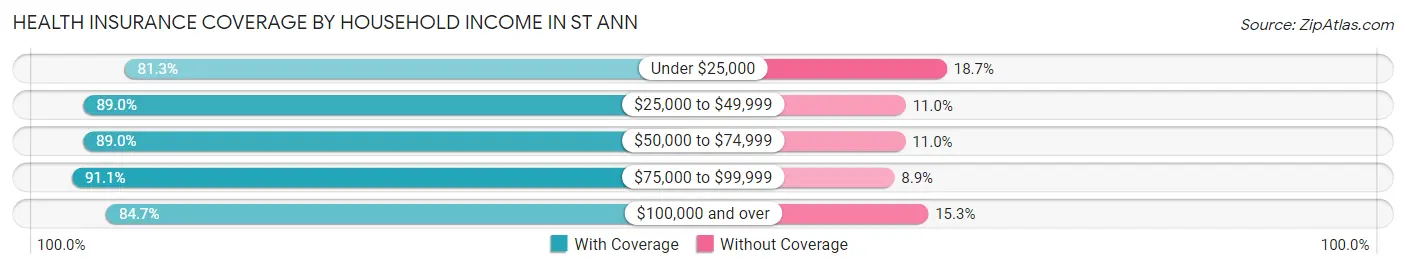
| Household Income | With Coverage | Without Coverage |
| Under $25,000 | 1,340 (81.3%) | 309 (18.7%) |
| $25,000 to $49,999 | 3,109 (89.0%) | 386 (11.0%) |
| $50,000 to $74,999 | 3,211 (89.0%) | 396 (11.0%) |
| $75,000 to $99,999 | 1,984 (91.1%) | 194 (8.9%) |
| $100,000 and over | 1,671 (84.7%) | 301 (15.3%) |
Public vs Private Health Insurance Coverage by Age in St Ann
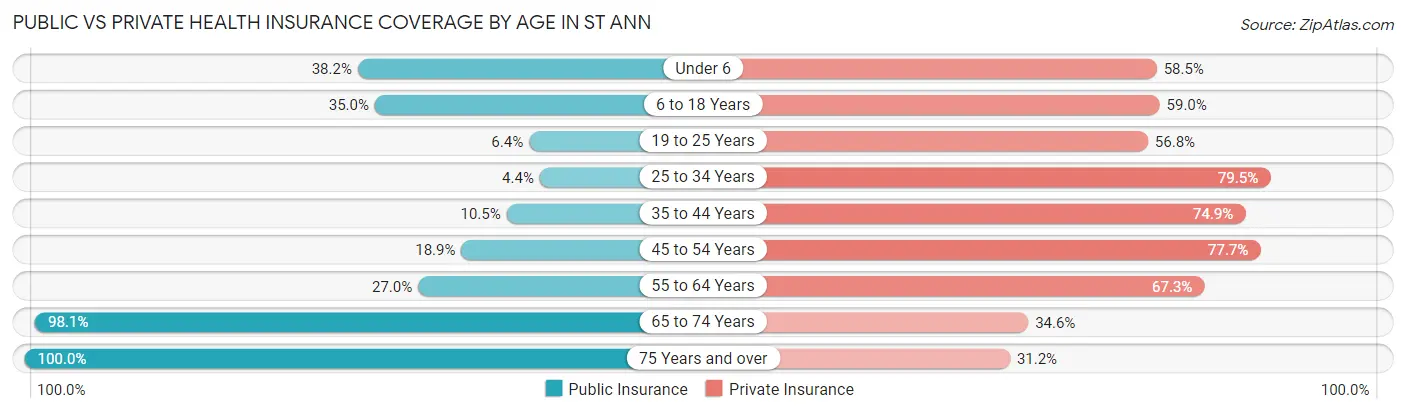
| Age Bracket | Public Insurance | Private Insurance |
| Under 6 | 395 (38.2%) | 605 (58.5%) |
| 6 to 18 Years | 699 (35.0%) | 1,178 (59.0%) |
| 19 to 25 Years | 87 (6.4%) | 775 (56.8%) |
| 25 to 34 Years | 88 (4.4%) | 1,595 (79.5%) |
| 35 to 44 Years | 151 (10.5%) | 1,072 (74.9%) |
| 45 to 54 Years | 250 (18.9%) | 1,025 (77.6%) |
| 55 to 64 Years | 448 (27.0%) | 1,117 (67.2%) |
| 65 to 74 Years | 1,213 (98.1%) | 428 (34.6%) |
| 75 Years and over | 862 (100.0%) | 269 (31.2%) |
| Total | 4,193 (32.5%) | 8,064 (62.4%) |
Disability Status by Sex by Age in St Ann
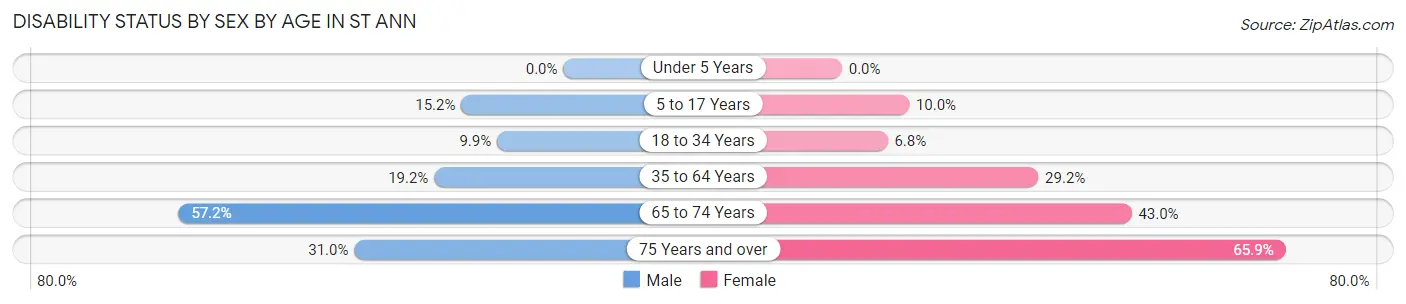
| Age Bracket | Male | Female |
| Under 5 Years | 0 (0.0%) | 0 (0.0%) |
| 5 to 17 Years | 163 (15.1%) | 95 (10.0%) |
| 18 to 34 Years | 174 (9.9%) | 113 (6.8%) |
| 35 to 64 Years | 390 (19.2%) | 694 (29.2%) |
| 65 to 74 Years | 343 (57.2%) | 274 (43.0%) |
| 75 Years and over | 122 (31.0%) | 309 (65.9%) |
Disability Class by Sex by Age in St Ann
Disability Class: Hearing Difficulty
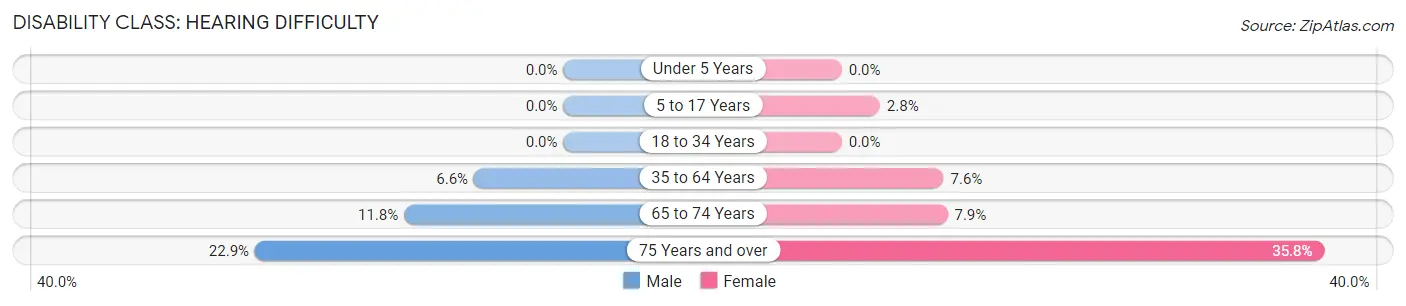
| Age Bracket | Male | Female |
| Under 5 Years | 0 (0.0%) | 0 (0.0%) |
| 5 to 17 Years | 0 (0.0%) | 27 (2.8%) |
| 18 to 34 Years | 0 (0.0%) | 0 (0.0%) |
| 35 to 64 Years | 135 (6.6%) | 180 (7.6%) |
| 65 to 74 Years | 71 (11.8%) | 50 (7.9%) |
| 75 Years and over | 90 (22.9%) | 168 (35.8%) |
Disability Class: Vision Difficulty
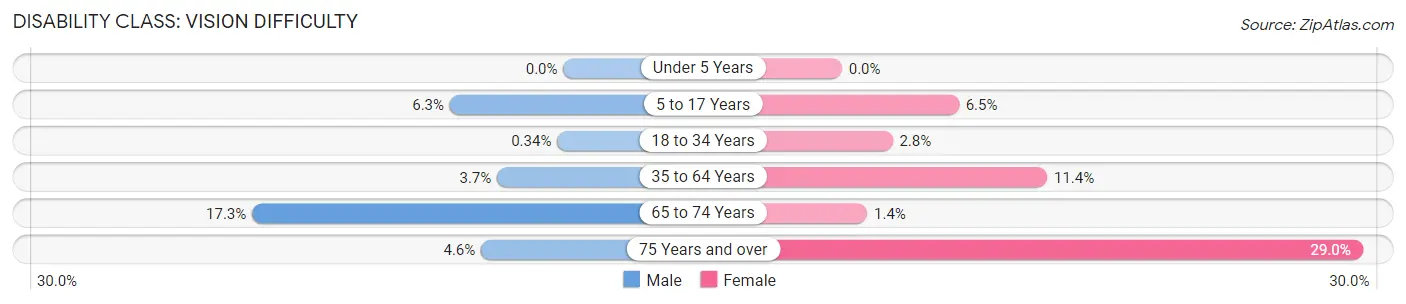
| Age Bracket | Male | Female |
| Under 5 Years | 0 (0.0%) | 0 (0.0%) |
| 5 to 17 Years | 68 (6.3%) | 62 (6.5%) |
| 18 to 34 Years | 6 (0.3%) | 47 (2.8%) |
| 35 to 64 Years | 75 (3.7%) | 272 (11.4%) |
| 65 to 74 Years | 104 (17.3%) | 9 (1.4%) |
| 75 Years and over | 18 (4.6%) | 136 (29.0%) |
Disability Class: Cognitive Difficulty
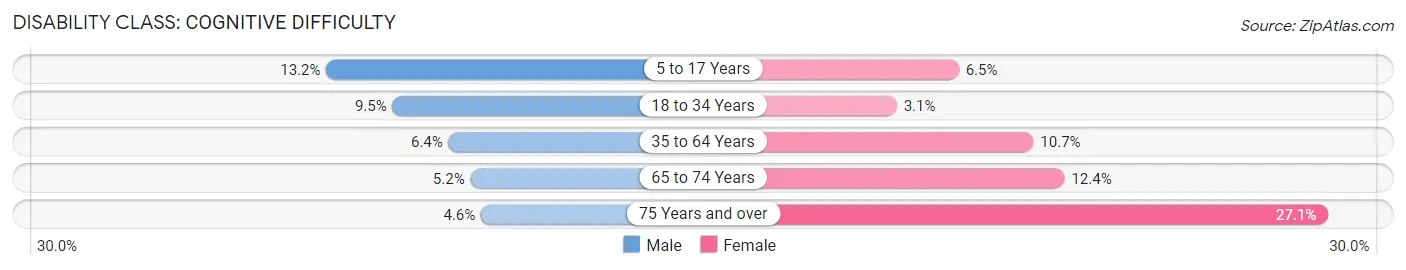
| Age Bracket | Male | Female |
| 5 to 17 Years | 142 (13.2%) | 62 (6.5%) |
| 18 to 34 Years | 168 (9.5%) | 51 (3.1%) |
| 35 to 64 Years | 130 (6.4%) | 254 (10.7%) |
| 65 to 74 Years | 31 (5.2%) | 79 (12.4%) |
| 75 Years and over | 18 (4.6%) | 127 (27.1%) |
Disability Class: Ambulatory Difficulty
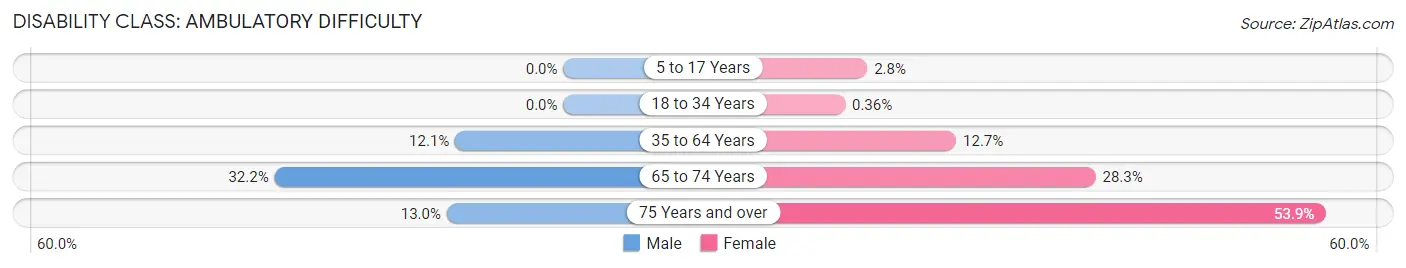
| Age Bracket | Male | Female |
| 5 to 17 Years | 0 (0.0%) | 27 (2.8%) |
| 18 to 34 Years | 0 (0.0%) | 6 (0.4%) |
| 35 to 64 Years | 245 (12.0%) | 303 (12.7%) |
| 65 to 74 Years | 193 (32.2%) | 180 (28.3%) |
| 75 Years and over | 51 (13.0%) | 253 (53.9%) |
Disability Class: Self-Care Difficulty
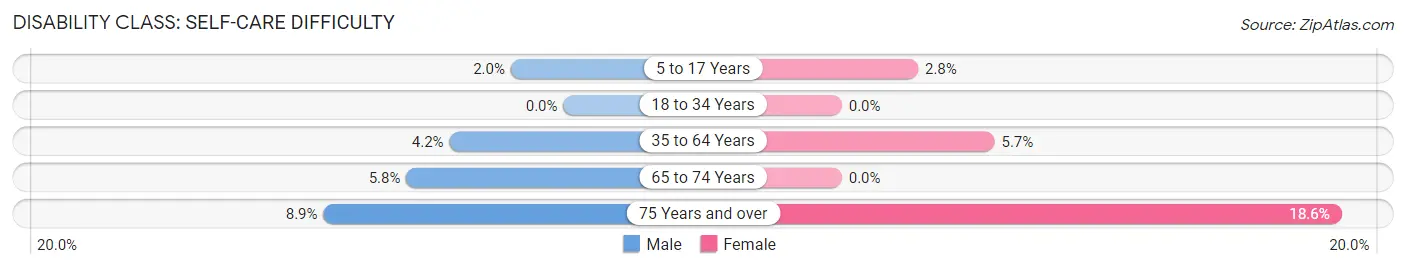
| Age Bracket | Male | Female |
| 5 to 17 Years | 21 (1.9%) | 27 (2.8%) |
| 18 to 34 Years | 0 (0.0%) | 0 (0.0%) |
| 35 to 64 Years | 86 (4.2%) | 135 (5.7%) |
| 65 to 74 Years | 35 (5.8%) | 0 (0.0%) |
| 75 Years and over | 35 (8.9%) | 87 (18.5%) |
Technology Access in St Ann
Computing Device Access in St Ann
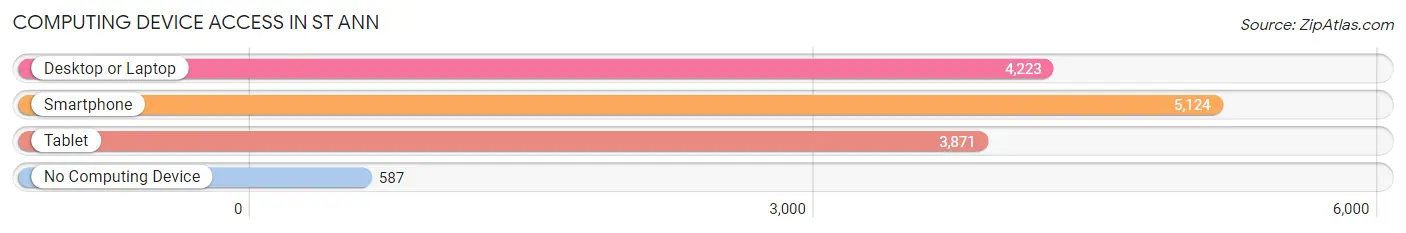
| Device Type | # Households | % Households |
| Desktop or Laptop | 4,223 | 68.6% |
| Smartphone | 5,124 | 83.3% |
| Tablet | 3,871 | 62.9% |
| No Computing Device | 587 | 9.5% |
| Total | 6,153 | 100.0% |
Internet Access in St Ann
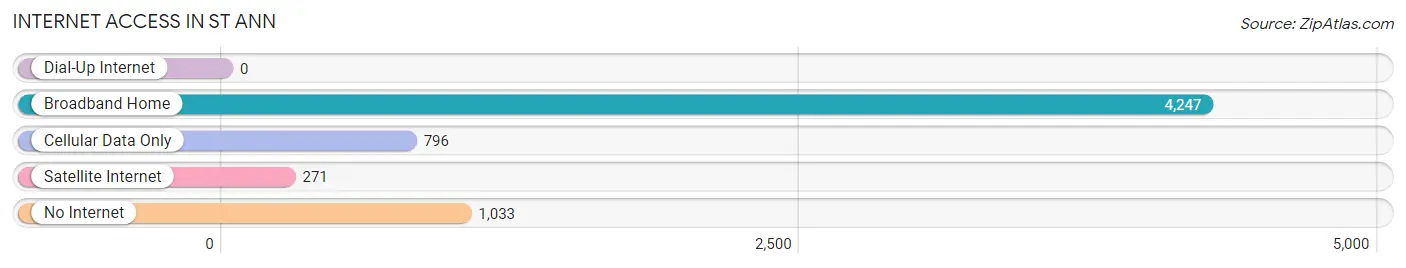
| Internet Type | # Households | % Households |
| Dial-Up Internet | 0 | 0.0% |
| Broadband Home | 4,247 | 69.0% |
| Cellular Data Only | 796 | 12.9% |
| Satellite Internet | 271 | 4.4% |
| No Internet | 1,033 | 16.8% |
| Total | 6,153 | 100.0% |
St Ann Summary
St Ann, Missouri is a small city located in St. Louis County, Missouri. It is located just north of St. Louis and is part of the Greater St. Louis metropolitan area. The city has a population of 11,521 as of the 2010 census.
History
St Ann was founded in 1876 by German immigrants who were looking for a place to settle and start a new life. The city was named after St. Ann, the mother of the Virgin Mary. The city was incorporated in 1887 and was originally a farming community. The city grew slowly over the years and by the 1950s, it had become a bedroom community for St. Louis.
Geography
St Ann is located in St. Louis County, Missouri. It is situated just north of St. Louis and is part of the Greater St. Louis metropolitan area. The city has a total area of 4.2 square miles, all of which is land. The city is located on the Missouri River and is bordered by the cities of Bridgeton, Maryland Heights, and St. Charles.
Economy
St Ann’s economy is largely based on retail and services. The city is home to several large shopping centers, including the St. Ann Center and the St. Ann Marketplace. The city also has a number of restaurants, bars, and other businesses. The city is also home to several manufacturing companies, including the St. Ann Manufacturing Company and the St. Ann Tool and Die Company.
Demographics
As of the 2010 census, St Ann had a population of 11,521. The racial makeup of the city was 79.2% White, 13.2% African American, 0.4% Native American, 1.7% Asian, 0.1% Pacific Islander, 2.3% from other races, and 3.1% from two or more races. Hispanic or Latino of any race were 5.3% of the population.
The median income for a household in St Ann was $45,945, and the median income for a family was $54,945. The per capita income for the city was $21,945. About 8.2% of families and 10.2% of the population were below the poverty line, including 14.2% of those under age 18 and 6.2% of those age 65 or over.
St Ann is a small city with a rich history and a diverse population. The city has a strong economy based on retail and services, and it is home to several manufacturing companies. The city has a population of 11,521 as of the 2010 census, and the median income for a household is $45,945. St Ann is a great place to live and work, and it is a great place to call home.
Common Questions
What is Per Capita Income in St Ann?
Per Capita income in St Ann is $26,790.
What is the Median Family Income in St Ann?
Median Family Income in St Ann is $65,580.
What is the Median Household income in St Ann?
Median Household Income in St Ann is $48,081.
What is Income or Wage Gap in St Ann?
Income or Wage Gap in St Ann is 22.1%.
Women in St Ann earn 77.9 cents for every dollar earned by a man.
What is Family Income Deficit in St Ann?
Family Income Deficit in St Ann is $14,450.
Families that are below poverty line in St Ann earn $14,450 less on average than the poverty threshold level.
What is Inequality or Gini Index in St Ann?
Inequality or Gini Index in St Ann is 0.34.
What is the Total Population of St Ann?
Total Population of St Ann is 12,917.
What is the Total Male Population of St Ann?
Total Male Population of St Ann is 6,157.
What is the Total Female Population of St Ann?
Total Female Population of St Ann is 6,760.
What is the Ratio of Males per 100 Females in St Ann?
There are 91.08 Males per 100 Females in St Ann.
What is the Ratio of Females per 100 Males in St Ann?
There are 109.79 Females per 100 Males in St Ann.
What is the Median Population Age in St Ann?
Median Population Age in St Ann is 35.2 Years.
What is the Average Family Size in St Ann
Average Family Size in St Ann is 2.9 People.
What is the Average Household Size in St Ann
Average Household Size in St Ann is 2.1 People.
How Large is the Labor Force in St Ann?
There are 7,196 People in the Labor Forcein in St Ann.
What is the Percentage of People in the Labor Force in St Ann?
70.2% of People are in the Labor Force in St Ann.
What is the Unemployment Rate in St Ann?
Unemployment Rate in St Ann is 3.0%.