Millersville, TN Map & Demographics
Millersville Map
Millersville Overview
$32,240
PER CAPITA INCOME
$81,667
AVG FAMILY INCOME
$67,445
AVG HOUSEHOLD INCOME
28.9%
WAGE / INCOME GAP [ % ]
71.1¢/ $1
WAGE / INCOME GAP [ $ ]
0.33
INEQUALITY / GINI INDEX
5,818
TOTAL POPULATION
2,876
MALE POPULATION
2,942
FEMALE POPULATION
97.76
MALES / 100 FEMALES
102.29
FEMALES / 100 MALES
38.9
MEDIAN AGE
3.0
AVG FAMILY SIZE
2.5
AVG HOUSEHOLD SIZE
3,394
LABOR FORCE [ PEOPLE ]
71.1%
PERCENT IN LABOR FORCE
2.3%
UNEMPLOYMENT RATE
Income in Millersville
Income Overview in Millersville
Per Capita Income in Millersville is $32,240, while median incomes of families and households are $81,667 and $67,445 respectively.
| Characteristic | Number | Measure |
| Per Capita Income | 5,818 | $32,240 |
| Median Family Income | 1,400 | $81,667 |
| Mean Family Income | 1,400 | $84,522 |
| Median Household Income | 2,359 | $67,445 |
| Mean Household Income | 2,359 | $78,707 |
| Income Deficit | 1,400 | $0 |
| Wage / Income Gap (%) | 5,818 | 28.94% |
| Wage / Income Gap ($) | 5,818 | 71.06¢ per $1 |
| Gini / Inequality Index | 5,818 | 0.33 |
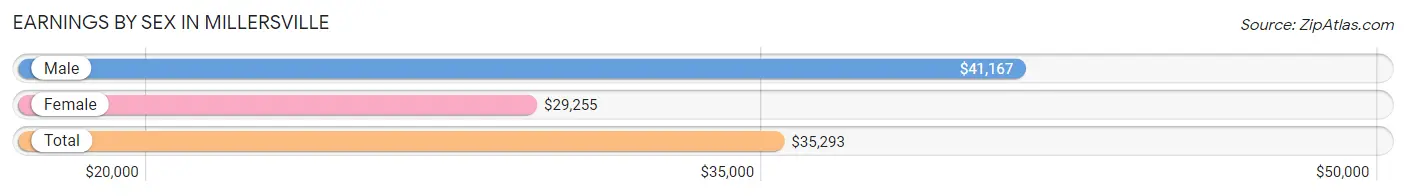
Earnings by Sex in Millersville
Average Earnings in Millersville are $35,293, $41,167 for men and $29,255 for women, a difference of 28.9%.
| Sex | Number | Average Earnings |
| Male | 1,814 (52.1%) | $41,167 |
| Female | 1,667 (47.9%) | $29,255 |
| Total | 3,481 (100.0%) | $35,293 |
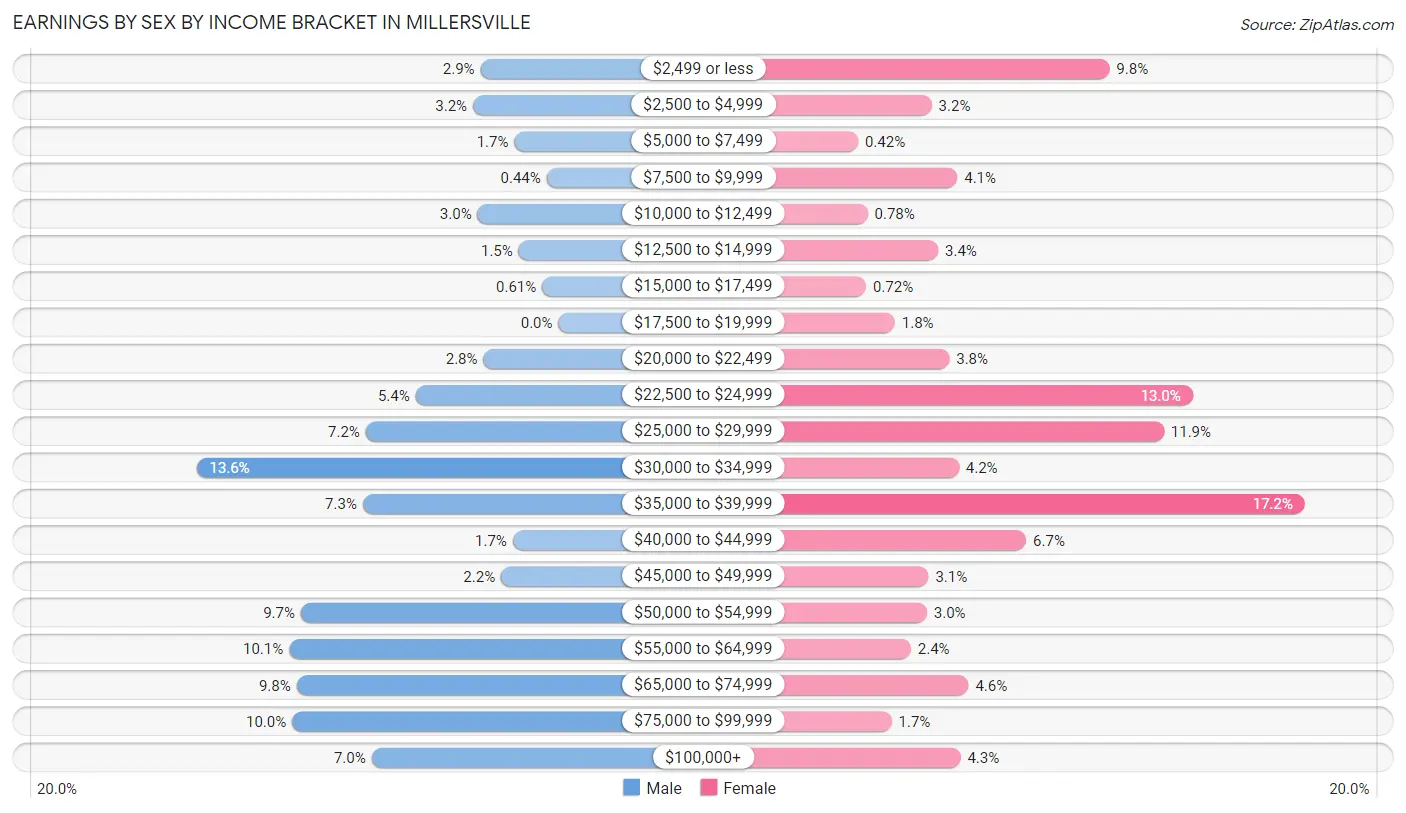
Earnings by Sex by Income Bracket in Millersville
The most common earnings brackets in Millersville are $30,000 to $34,999 for men (246 | 13.6%) and $35,000 to $39,999 for women (286 | 17.2%).
| Income | Male | Female |
| $2,499 or less | 53 (2.9%) | 164 (9.8%) |
| $2,500 to $4,999 | 58 (3.2%) | 53 (3.2%) |
| $5,000 to $7,499 | 30 (1.7%) | 7 (0.4%) |
| $7,500 to $9,999 | 8 (0.4%) | 69 (4.1%) |
| $10,000 to $12,499 | 55 (3.0%) | 13 (0.8%) |
| $12,500 to $14,999 | 27 (1.5%) | 57 (3.4%) |
| $15,000 to $17,499 | 11 (0.6%) | 12 (0.7%) |
| $17,500 to $19,999 | 0 (0.0%) | 30 (1.8%) |
| $20,000 to $22,499 | 51 (2.8%) | 64 (3.8%) |
| $22,500 to $24,999 | 97 (5.3%) | 216 (13.0%) |
| $25,000 to $29,999 | 131 (7.2%) | 198 (11.9%) |
| $30,000 to $34,999 | 246 (13.6%) | 70 (4.2%) |
| $35,000 to $39,999 | 133 (7.3%) | 286 (17.2%) |
| $40,000 to $44,999 | 31 (1.7%) | 112 (6.7%) |
| $45,000 to $49,999 | 39 (2.1%) | 51 (3.1%) |
| $50,000 to $54,999 | 175 (9.7%) | 50 (3.0%) |
| $55,000 to $64,999 | 183 (10.1%) | 40 (2.4%) |
| $65,000 to $74,999 | 178 (9.8%) | 76 (4.6%) |
| $75,000 to $99,999 | 181 (10.0%) | 28 (1.7%) |
| $100,000+ | 127 (7.0%) | 71 (4.3%) |
| Total | 1,814 (100.0%) | 1,667 (100.0%) |
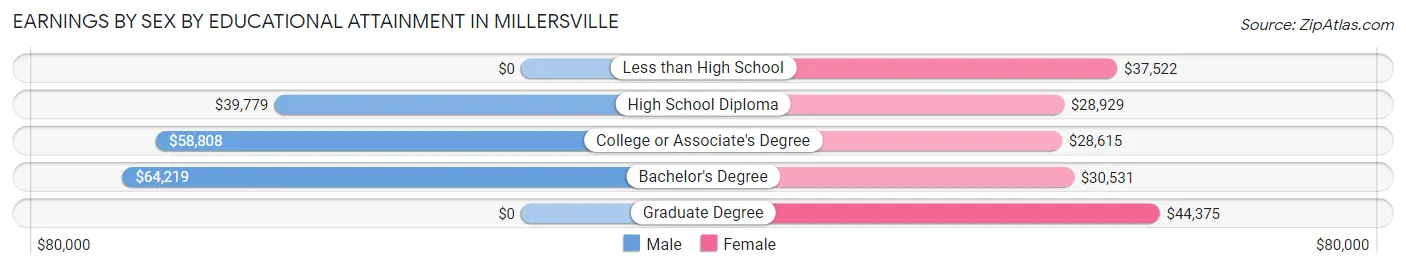
Earnings by Sex by Educational Attainment in Millersville
Average earnings in Millersville are $51,404 for men and $29,868 for women, a difference of 41.9%. Men with an educational attainment of bachelor's degree enjoy the highest average annual earnings of $64,219, while those with high school diploma education earn the least with $39,779. Women with an educational attainment of graduate degree earn the most with the average annual earnings of $44,375, while those with college or associate's degree education have the smallest earnings of $28,615.
| Educational Attainment | Male Income | Female Income |
| Less than High School | - | - |
| High School Diploma | $39,779 | $28,929 |
| College or Associate's Degree | $58,808 | $28,615 |
| Bachelor's Degree | $64,219 | $30,531 |
| Graduate Degree | - | - |
| Total | $51,404 | $29,868 |
Family Income in Millersville
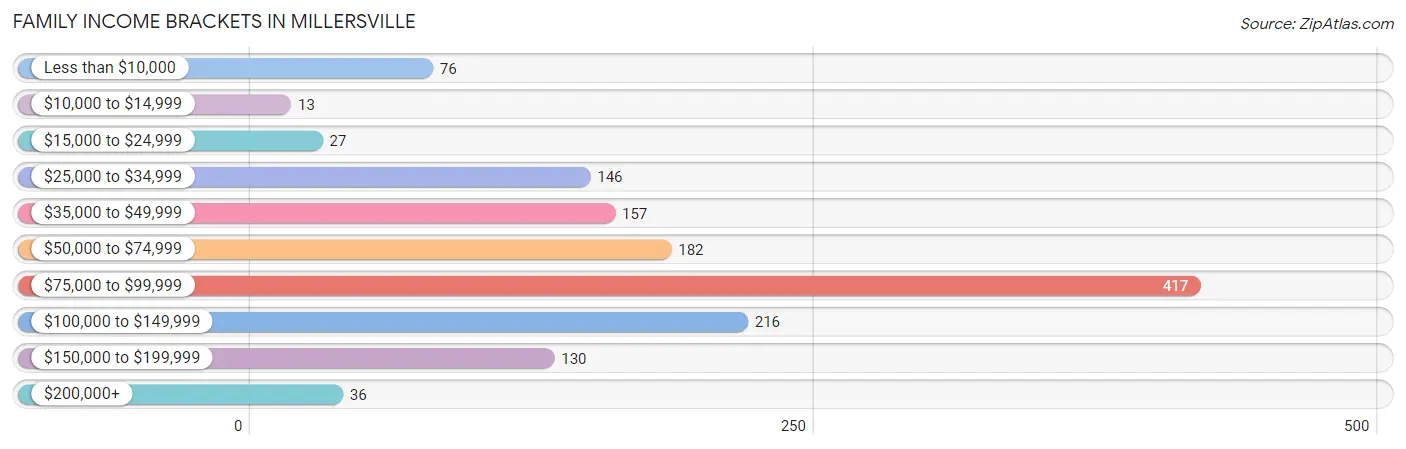
Family Income Brackets in Millersville
According to the Millersville family income data, there are 417 families falling into the $75,000 to $99,999 income range, which is the most common income bracket and makes up 29.8% of all families. Conversely, the $10,000 to $14,999 income bracket is the least frequent group with only 13 families (0.9%) belonging to this category.
| Income Bracket | # Families | % Families |
| Less than $10,000 | 76 | 5.4% |
| $10,000 to $14,999 | 13 | 0.9% |
| $15,000 to $24,999 | 27 | 1.9% |
| $25,000 to $34,999 | 146 | 10.4% |
| $35,000 to $49,999 | 157 | 11.2% |
| $50,000 to $74,999 | 182 | 13.0% |
| $75,000 to $99,999 | 417 | 29.8% |
| $100,000 to $149,999 | 216 | 15.4% |
| $150,000 to $199,999 | 130 | 9.3% |
| $200,000+ | 36 | 2.6% |
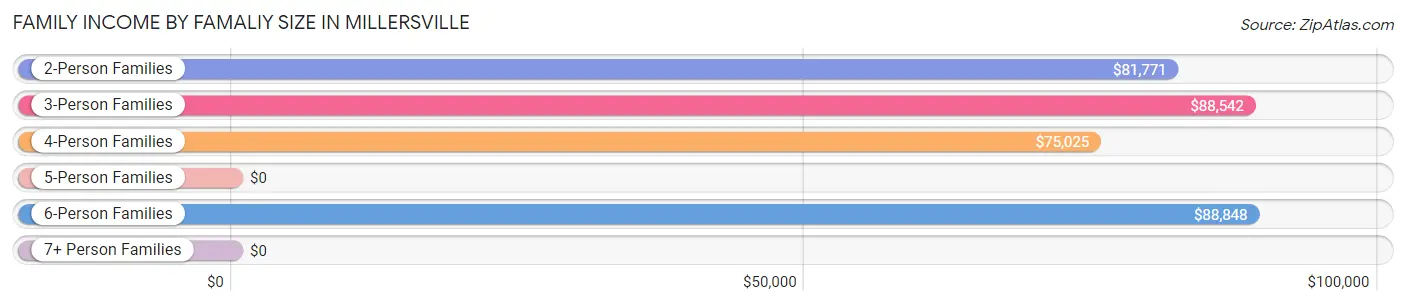
Family Income by Famaliy Size in Millersville
6-person families (87 | 6.2%) account for the highest median family income in Millersville with $88,848 per family, while 2-person families (679 | 48.5%) have the highest median income of $40,886 per family member.
| Income Bracket | # Families | Median Income |
| 2-Person Families | 679 (48.5%) | $81,771 |
| 3-Person Families | 284 (20.3%) | $88,542 |
| 4-Person Families | 321 (22.9%) | $75,025 |
| 5-Person Families | 29 (2.1%) | $0 |
| 6-Person Families | 87 (6.2%) | $88,848 |
| 7+ Person Families | 0 (0.0%) | $0 |
| Total | 1,400 (100.0%) | $81,667 |
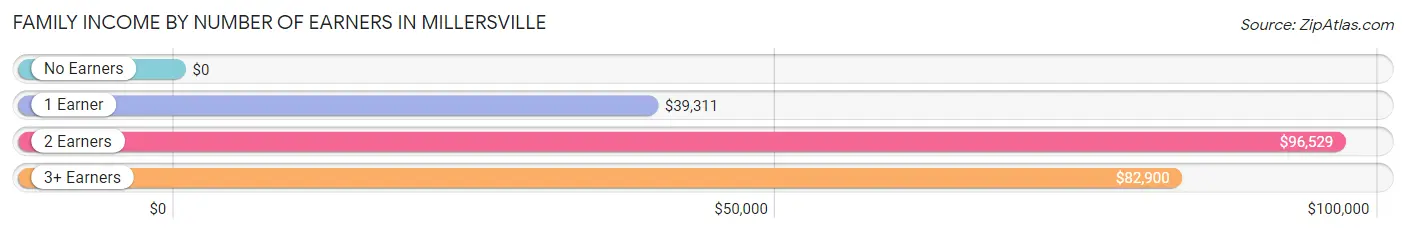
Family Income by Number of Earners in Millersville
| Number of Earners | # Families | Median Income |
| No Earners | 123 (8.8%) | $0 |
| 1 Earner | 529 (37.8%) | $39,311 |
| 2 Earners | 638 (45.6%) | $96,529 |
| 3+ Earners | 110 (7.9%) | $82,900 |
| Total | 1,400 (100.0%) | $81,667 |
Household Income in Millersville
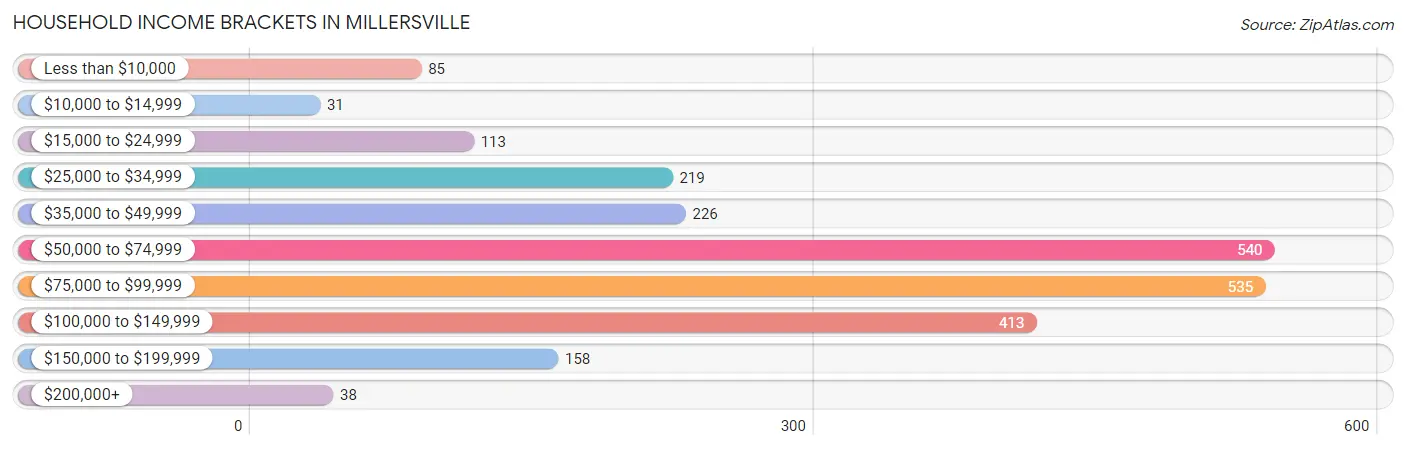
Household Income Brackets in Millersville
With 540 households falling in the category, the $50,000 to $74,999 income range is the most frequent in Millersville, accounting for 22.9% of all households. In contrast, only 31 households (1.3%) fall into the $10,000 to $14,999 income bracket, making it the least populous group.
| Income Bracket | # Households | % Households |
| Less than $10,000 | 85 | 3.6% |
| $10,000 to $14,999 | 31 | 1.3% |
| $15,000 to $24,999 | 113 | 4.8% |
| $25,000 to $34,999 | 219 | 9.3% |
| $35,000 to $49,999 | 226 | 9.6% |
| $50,000 to $74,999 | 540 | 22.9% |
| $75,000 to $99,999 | 535 | 22.7% |
| $100,000 to $149,999 | 413 | 17.5% |
| $150,000 to $199,999 | 158 | 6.7% |
| $200,000+ | 38 | 1.6% |
Household Income by Householder Age in Millersville
The median household income in Millersville is $67,445, with the highest median household income of $85,987 found in the 45 to 64 years age bracket for the primary householder. A total of 875 households (37.1%) fall into this category. Meanwhile, the 15 to 24 years age bracket for the primary householder has the lowest median household income of $61,250, with 128 households (5.4%) in this group.
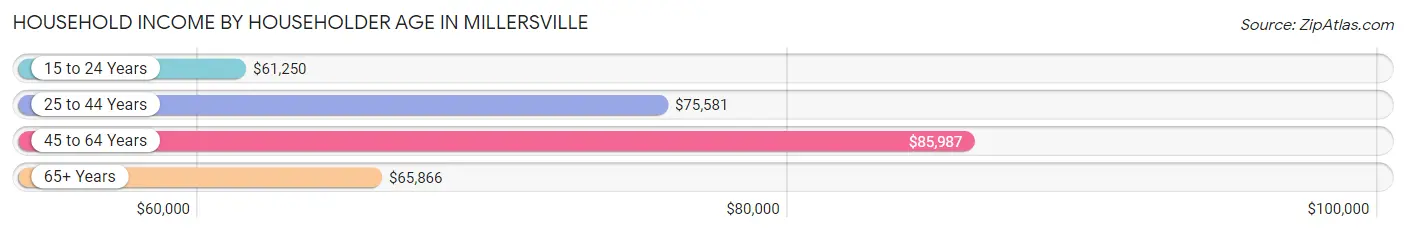
| Income Bracket | # Households | Median Income |
| 15 to 24 Years | 128 (5.4%) | $61,250 |
| 25 to 44 Years | 805 (34.1%) | $75,581 |
| 45 to 64 Years | 875 (37.1%) | $85,987 |
| 65+ Years | 551 (23.4%) | $65,866 |
| Total | 2,359 (100.0%) | $67,445 |
Poverty in Millersville
Income Below Poverty by Sex and Age in Millersville
With 4.6% poverty level for males and 12.2% for females among the residents of Millersville, 18 to 24 year old males and 5 year old females are the most vulnerable to poverty, with 40 males (12.9%) and 41 females (73.2%) in their respective age groups living below the poverty level.
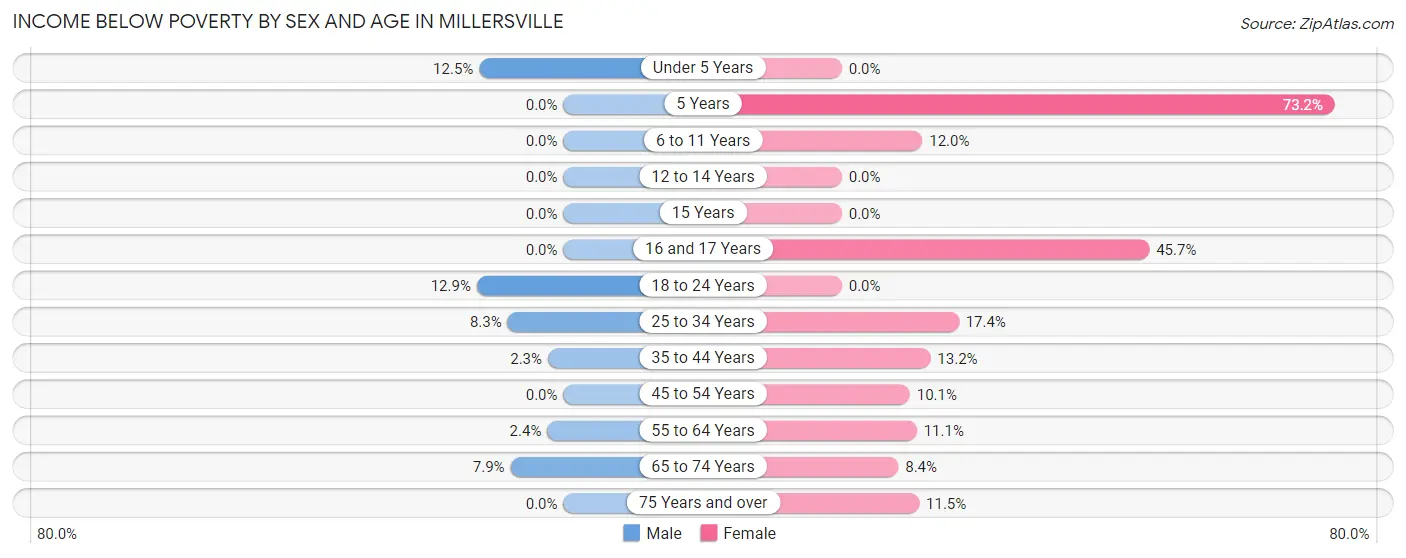
| Age Bracket | Male | Female |
| Under 5 Years | 10 (12.5%) | 0 (0.0%) |
| 5 Years | 0 (0.0%) | 41 (73.2%) |
| 6 to 11 Years | 0 (0.0%) | 25 (12.0%) |
| 12 to 14 Years | 0 (0.0%) | 0 (0.0%) |
| 15 Years | 0 (0.0%) | 0 (0.0%) |
| 16 and 17 Years | 0 (0.0%) | 42 (45.7%) |
| 18 to 24 Years | 40 (12.9%) | 0 (0.0%) |
| 25 to 34 Years | 31 (8.3%) | 71 (17.4%) |
| 35 to 44 Years | 11 (2.3%) | 40 (13.2%) |
| 45 to 54 Years | 0 (0.0%) | 31 (10.1%) |
| 55 to 64 Years | 11 (2.4%) | 55 (11.1%) |
| 65 to 74 Years | 29 (7.9%) | 40 (8.4%) |
| 75 Years and over | 0 (0.0%) | 14 (11.5%) |
| Total | 132 (4.6%) | 359 (12.2%) |
Income Above Poverty by Sex and Age in Millersville
According to the poverty statistics in Millersville, males aged 6 to 11 years and females aged under 5 years are the age groups that are most secure financially, with 100.0% of males and 100.0% of females in these age groups living above the poverty line.
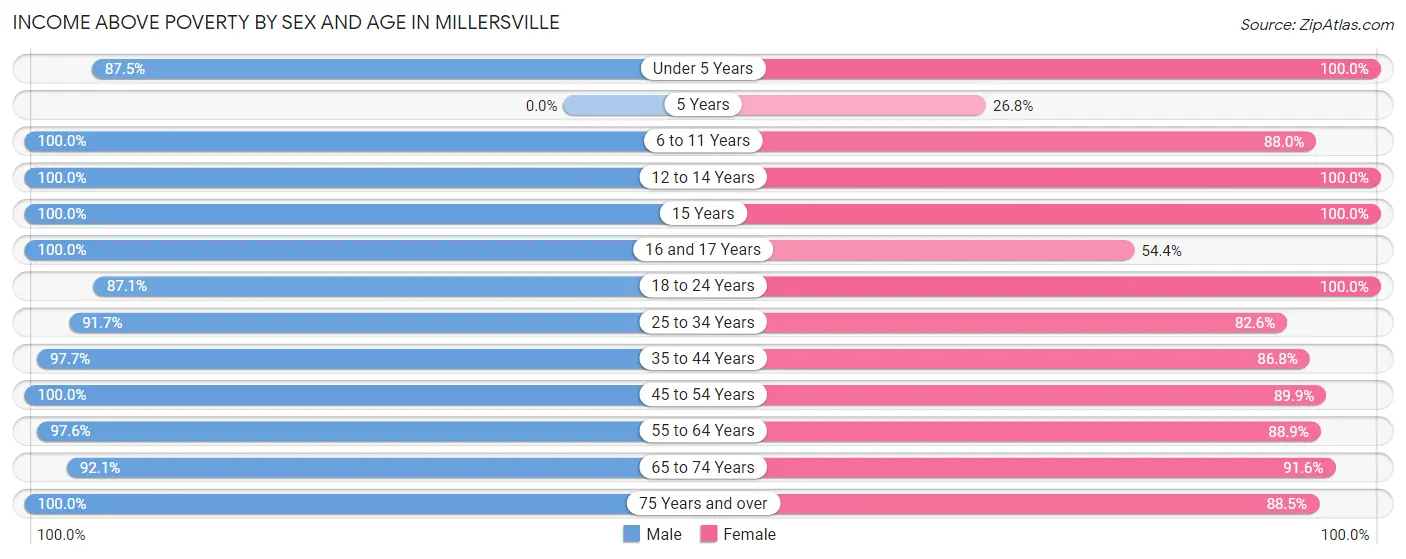
| Age Bracket | Male | Female |
| Under 5 Years | 70 (87.5%) | 130 (100.0%) |
| 5 Years | 0 (0.0%) | 15 (26.8%) |
| 6 to 11 Years | 290 (100.0%) | 184 (88.0%) |
| 12 to 14 Years | 62 (100.0%) | 114 (100.0%) |
| 15 Years | 21 (100.0%) | 82 (100.0%) |
| 16 and 17 Years | 151 (100.0%) | 50 (54.3%) |
| 18 to 24 Years | 271 (87.1%) | 146 (100.0%) |
| 25 to 34 Years | 343 (91.7%) | 338 (82.6%) |
| 35 to 44 Years | 468 (97.7%) | 264 (86.8%) |
| 45 to 54 Years | 189 (100.0%) | 276 (89.9%) |
| 55 to 64 Years | 449 (97.6%) | 439 (88.9%) |
| 65 to 74 Years | 340 (92.1%) | 437 (91.6%) |
| 75 Years and over | 90 (100.0%) | 108 (88.5%) |
| Total | 2,744 (95.4%) | 2,583 (87.8%) |
Income Below Poverty Among Married-Couple Families in Millersville
The poverty statistics for married-couple families in Millersville show that 1.6% or 13 of the total 824 families live below the poverty line. Families with no children have the highest poverty rate of 2.3%, comprising of 13 families. On the other hand, families with 1 or 2 children have the lowest poverty rate of 0.0%, which includes 0 families.
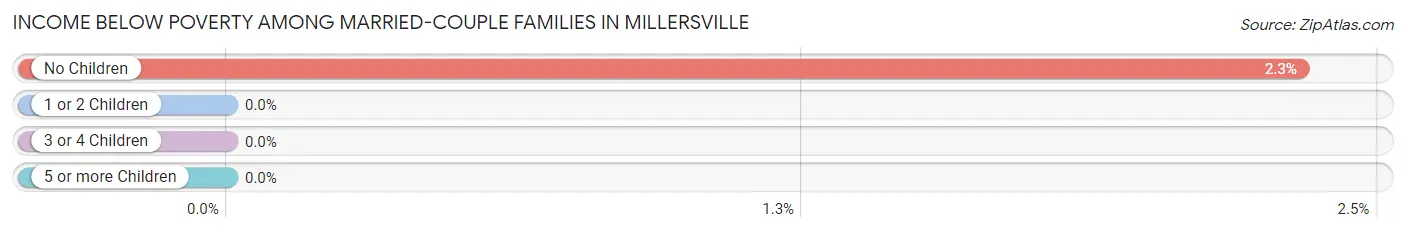
| Children | Above Poverty | Below Poverty |
| No Children | 544 (97.7%) | 13 (2.3%) |
| 1 or 2 Children | 236 (100.0%) | 0 (0.0%) |
| 3 or 4 Children | 31 (100.0%) | 0 (0.0%) |
| 5 or more Children | 0 (0.0%) | 0 (0.0%) |
| Total | 811 (98.4%) | 13 (1.6%) |
Income Below Poverty Among Single-Parent Households in Millersville
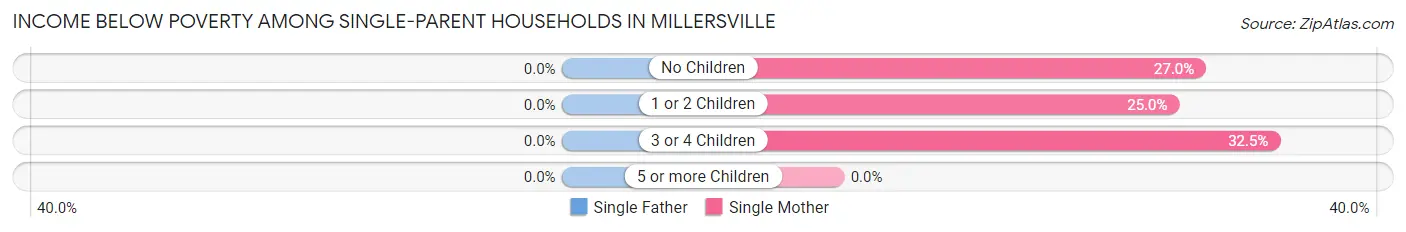
| Children | Single Father | Single Mother |
| No Children | 0 (0.0%) | 27 (27.0%) |
| 1 or 2 Children | 0 (0.0%) | 35 (25.0%) |
| 3 or 4 Children | 0 (0.0%) | 40 (32.5%) |
| 5 or more Children | 0 (0.0%) | 0 (0.0%) |
| Total | 0 (0.0%) | 102 (28.1%) |
Income Below Poverty Among Married-Couple vs Single-Parent Households in Millersville
The poverty data for Millersville shows that 13 of the married-couple family households (1.6%) and 102 of the single-parent households (17.7%) are living below the poverty level. Within the married-couple family households, those with no children have the highest poverty rate, with 13 households (2.3%) falling below the poverty line. Among the single-parent households, those with 3 or 4 children have the highest poverty rate, with 40 household (23.0%) living below poverty.
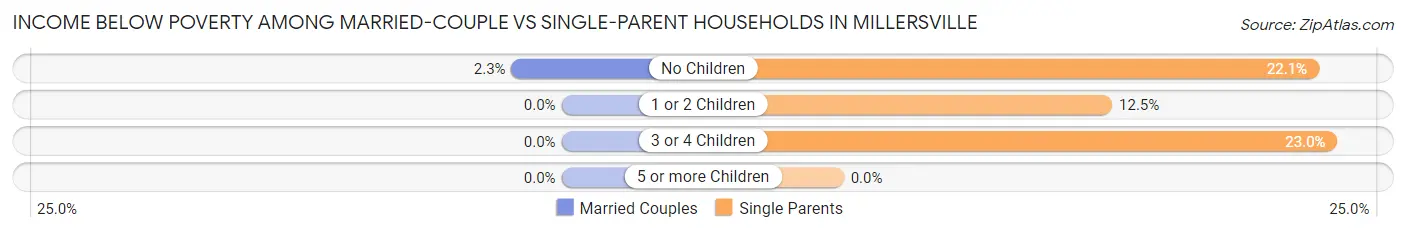
| Children | Married-Couple Families | Single-Parent Households |
| No Children | 13 (2.3%) | 27 (22.1%) |
| 1 or 2 Children | 0 (0.0%) | 35 (12.5%) |
| 3 or 4 Children | 0 (0.0%) | 40 (23.0%) |
| 5 or more Children | 0 (0.0%) | 0 (0.0%) |
| Total | 13 (1.6%) | 102 (17.7%) |
Race in Millersville
The most populous races in Millersville are White / Caucasian (4,337 | 74.5%), Black / African American (629 | 10.8%), and Hispanic or Latino (500 | 8.6%).
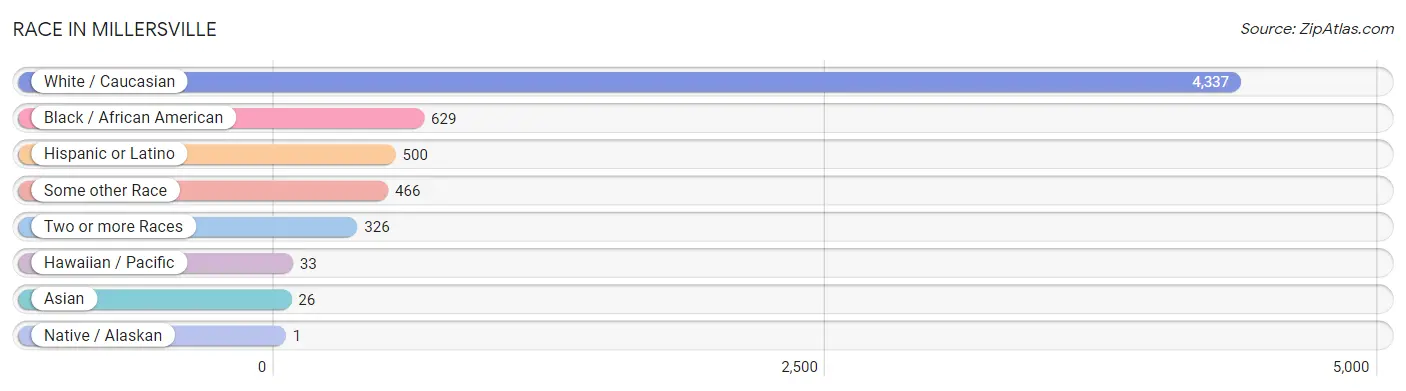
| Race | # Population | % Population |
| Asian | 26 | 0.4% |
| Black / African American | 629 | 10.8% |
| Hawaiian / Pacific | 33 | 0.6% |
| Hispanic or Latino | 500 | 8.6% |
| Native / Alaskan | 1 | 0.0% |
| White / Caucasian | 4,337 | 74.5% |
| Two or more Races | 326 | 5.6% |
| Some other Race | 466 | 8.0% |
| Total | 5,818 | 100.0% |
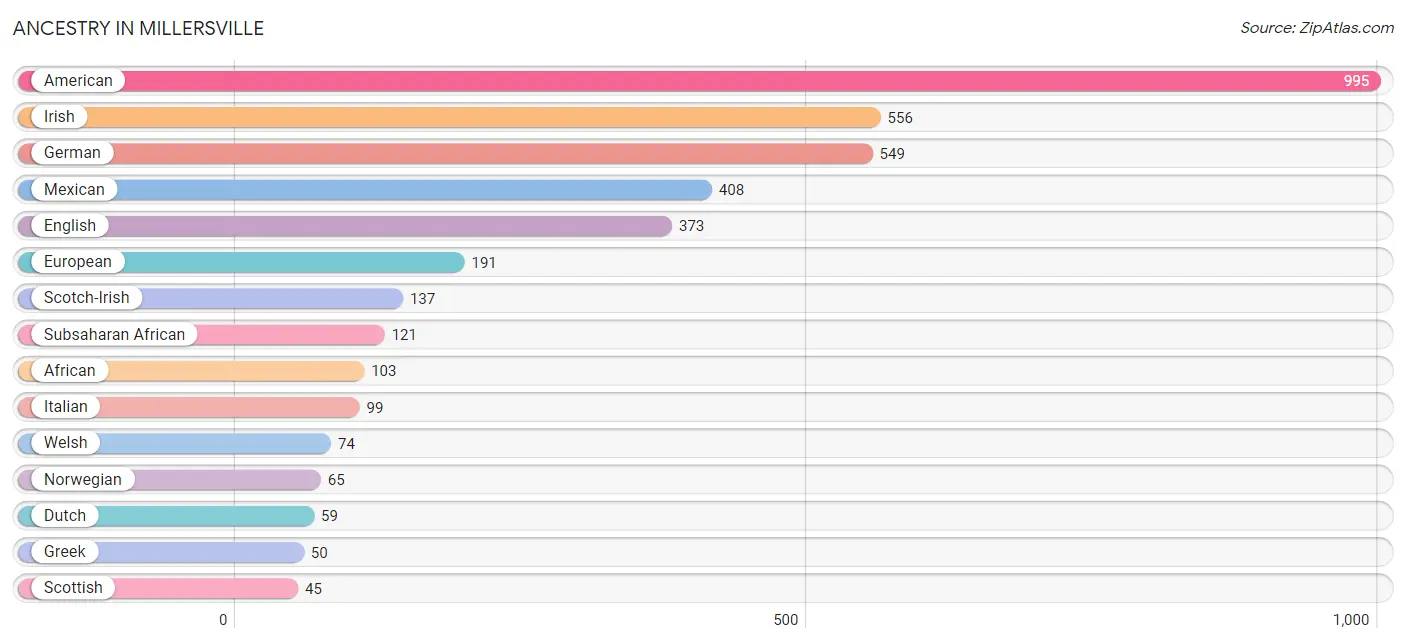
Ancestry in Millersville
The most populous ancestries reported in Millersville are American (995 | 17.1%), Irish (556 | 9.6%), German (549 | 9.4%), Mexican (408 | 7.0%), and English (373 | 6.4%), together accounting for 49.5% of all Millersville residents.
| Ancestry | # Population | % Population |
| African | 103 | 1.8% |
| American | 995 | 17.1% |
| Arab | 14 | 0.2% |
| Blackfeet | 2 | 0.0% |
| British | 24 | 0.4% |
| Canadian | 14 | 0.2% |
| Central American | 33 | 0.6% |
| Cherokee | 3 | 0.1% |
| Czech | 10 | 0.2% |
| Dominican | 33 | 0.6% |
| Dutch | 59 | 1.0% |
| English | 373 | 6.4% |
| European | 191 | 3.3% |
| French | 31 | 0.5% |
| French Canadian | 8 | 0.1% |
| German | 549 | 9.4% |
| Greek | 50 | 0.9% |
| Guatemalan | 8 | 0.1% |
| Honduran | 25 | 0.4% |
| Indian (Asian) | 8 | 0.1% |
| Irish | 556 | 9.6% |
| Italian | 99 | 1.7% |
| Korean | 13 | 0.2% |
| Lebanese | 14 | 0.2% |
| Malaysian | 18 | 0.3% |
| Mexican | 408 | 7.0% |
| Norwegian | 65 | 1.1% |
| Polish | 31 | 0.5% |
| Portuguese | 16 | 0.3% |
| Puerto Rican | 26 | 0.4% |
| Scandinavian | 11 | 0.2% |
| Scotch-Irish | 137 | 2.4% |
| Scottish | 45 | 0.8% |
| Senegalese | 18 | 0.3% |
| Subsaharan African | 121 | 2.1% |
| Swedish | 21 | 0.4% |
| Swiss | 9 | 0.2% |
| Welsh | 74 | 1.3% | View All 38 Rows |
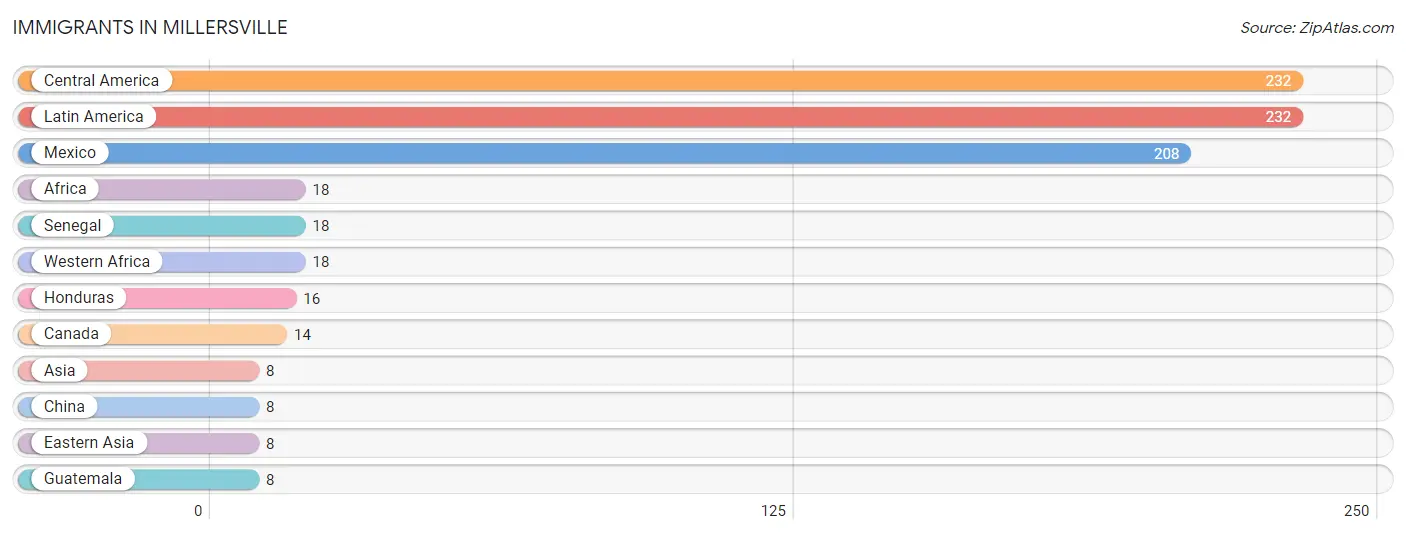
Immigrants in Millersville
The most numerous immigrant groups reported in Millersville came from Central America (232 | 4.0%), Latin America (232 | 4.0%), Mexico (208 | 3.6%), Africa (18 | 0.3%), and Senegal (18 | 0.3%), together accounting for 12.2% of all Millersville residents.
| Immigration Origin | # Population | % Population |
| Africa | 18 | 0.3% |
| Asia | 8 | 0.1% |
| Canada | 14 | 0.2% |
| Central America | 232 | 4.0% |
| China | 8 | 0.1% |
| Eastern Asia | 8 | 0.1% |
| Guatemala | 8 | 0.1% |
| Honduras | 16 | 0.3% |
| Latin America | 232 | 4.0% |
| Mexico | 208 | 3.6% |
| Senegal | 18 | 0.3% |
| Western Africa | 18 | 0.3% | View All 12 Rows |
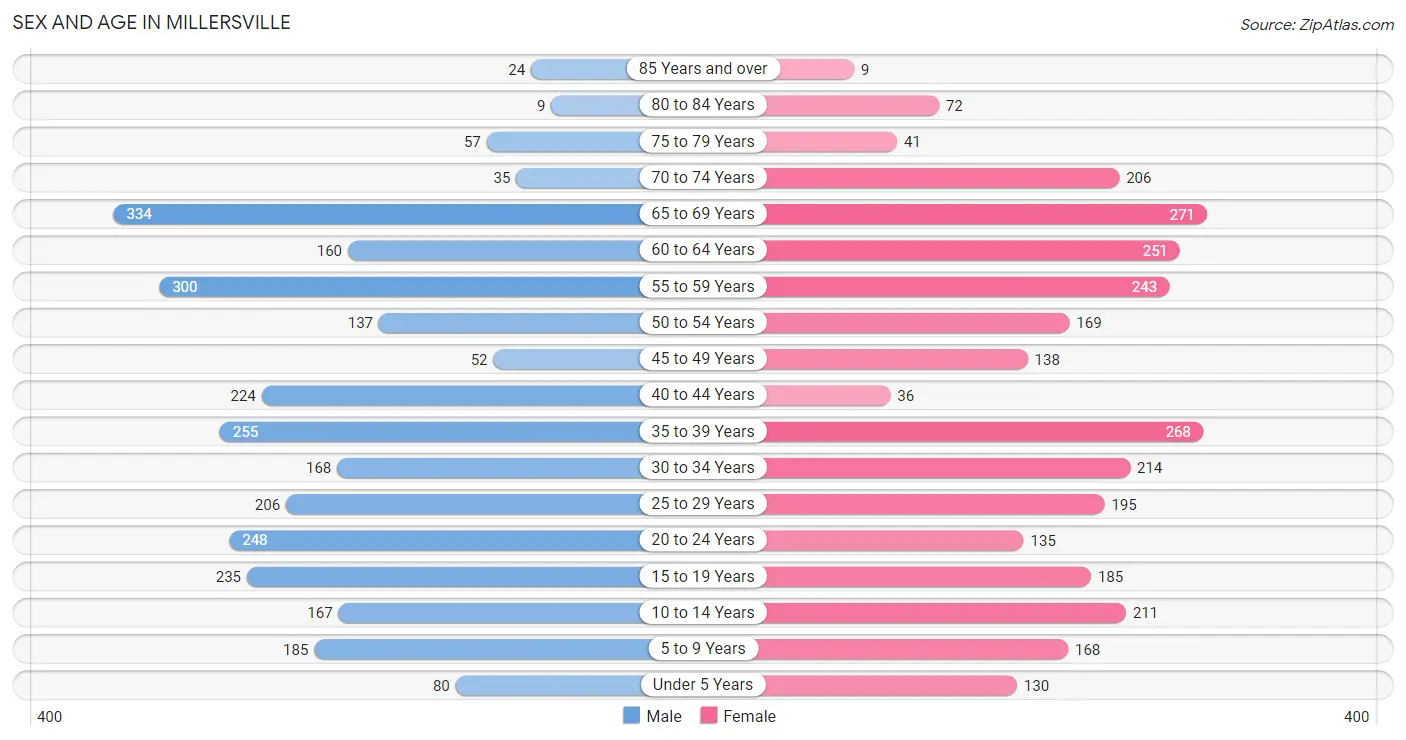
Sex and Age in Millersville
Sex and Age in Millersville
The most populous age groups in Millersville are 65 to 69 Years (334 | 11.6%) for men and 65 to 69 Years (271 | 9.2%) for women.
| Age Bracket | Male | Female |
| Under 5 Years | 80 (2.8%) | 130 (4.4%) |
| 5 to 9 Years | 185 (6.4%) | 168 (5.7%) |
| 10 to 14 Years | 167 (5.8%) | 211 (7.2%) |
| 15 to 19 Years | 235 (8.2%) | 185 (6.3%) |
| 20 to 24 Years | 248 (8.6%) | 135 (4.6%) |
| 25 to 29 Years | 206 (7.2%) | 195 (6.6%) |
| 30 to 34 Years | 168 (5.8%) | 214 (7.3%) |
| 35 to 39 Years | 255 (8.9%) | 268 (9.1%) |
| 40 to 44 Years | 224 (7.8%) | 36 (1.2%) |
| 45 to 49 Years | 52 (1.8%) | 138 (4.7%) |
| 50 to 54 Years | 137 (4.8%) | 169 (5.7%) |
| 55 to 59 Years | 300 (10.4%) | 243 (8.3%) |
| 60 to 64 Years | 160 (5.6%) | 251 (8.5%) |
| 65 to 69 Years | 334 (11.6%) | 271 (9.2%) |
| 70 to 74 Years | 35 (1.2%) | 206 (7.0%) |
| 75 to 79 Years | 57 (2.0%) | 41 (1.4%) |
| 80 to 84 Years | 9 (0.3%) | 72 (2.5%) |
| 85 Years and over | 24 (0.8%) | 9 (0.3%) |
| Total | 2,876 (100.0%) | 2,942 (100.0%) |
Families and Households in Millersville
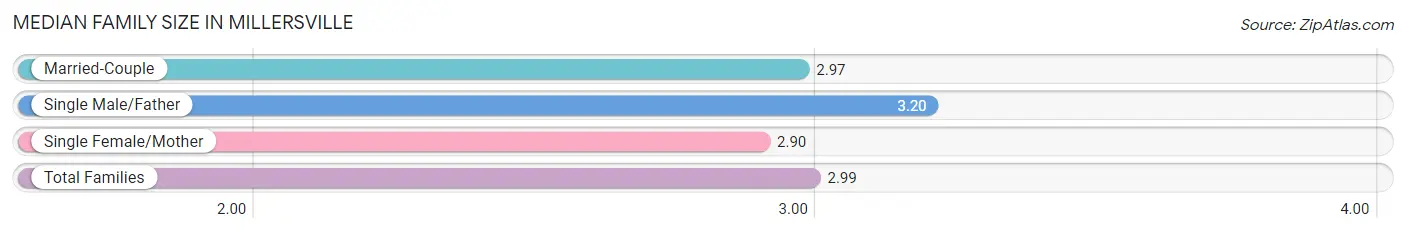
Median Family Size in Millersville
The median family size in Millersville is 2.99 persons per family, with single male/father families (213 | 15.2%) accounting for the largest median family size of 3.2 persons per family. On the other hand, single female/mother families (363 | 25.9%) represent the smallest median family size with 2.90 persons per family.
| Family Type | # Families | Family Size |
| Married-Couple | 824 (58.9%) | 2.97 |
| Single Male/Father | 213 (15.2%) | 3.20 |
| Single Female/Mother | 363 (25.9%) | 2.90 |
| Total Families | 1,400 (100.0%) | 2.99 |
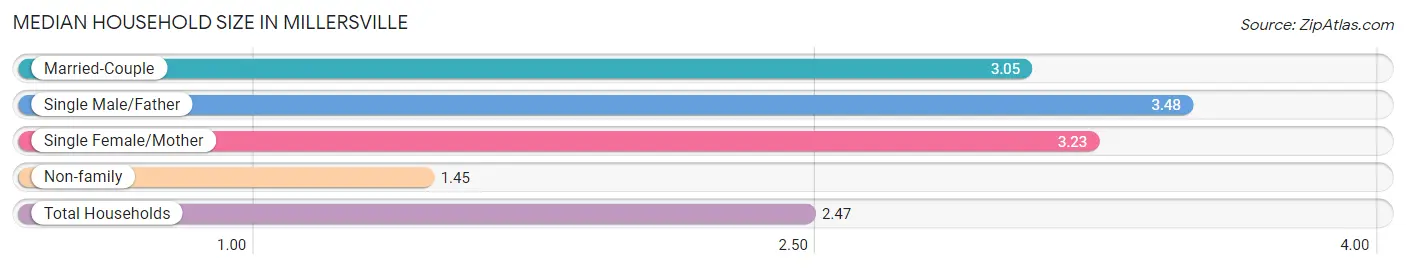
Median Household Size in Millersville
The median household size in Millersville is 2.47 persons per household, with single male/father households (213 | 9.0%) accounting for the largest median household size of 3.48 persons per household. non-family households (959 | 40.6%) represent the smallest median household size with 1.45 persons per household.
| Household Type | # Households | Household Size |
| Married-Couple | 824 (34.9%) | 3.05 |
| Single Male/Father | 213 (9.0%) | 3.48 |
| Single Female/Mother | 363 (15.4%) | 3.23 |
| Non-family | 959 (40.6%) | 1.45 |
| Total Households | 2,359 (100.0%) | 2.47 |
Household Size by Marriage Status in Millersville
Out of a total of 2,359 households in Millersville, 1,400 (59.4%) are family households, while 959 (40.6%) are nonfamily households. The most numerous type of family households are 2-person households, comprising 584, and the most common type of nonfamily households are 1-person households, comprising 602.
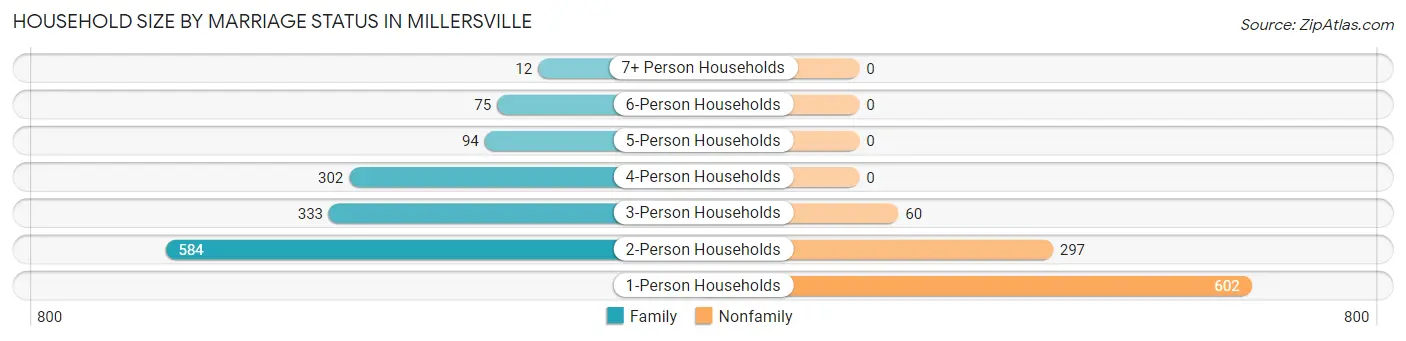
| Household Size | Family Households | Nonfamily Households |
| 1-Person Households | - | 602 (25.5%) |
| 2-Person Households | 584 (24.8%) | 297 (12.6%) |
| 3-Person Households | 333 (14.1%) | 60 (2.5%) |
| 4-Person Households | 302 (12.8%) | 0 (0.0%) |
| 5-Person Households | 94 (4.0%) | 0 (0.0%) |
| 6-Person Households | 75 (3.2%) | 0 (0.0%) |
| 7+ Person Households | 12 (0.5%) | 0 (0.0%) |
| Total | 1,400 (59.4%) | 959 (40.6%) |
Female Fertility in Millersville
Fertility by Age in Millersville
Average fertility rate in Millersville is 26.0 births per 1,000 women. Women in the age bracket of 35 to 50 years have the highest fertility rate with 34.0 births per 1,000 women. Women in the age bracket of 35 to 50 years acount for 51.6% of all women with births.
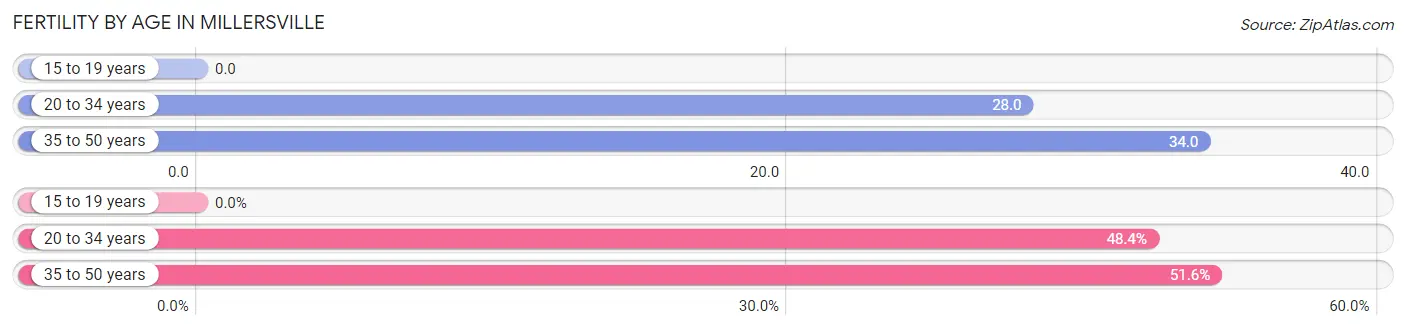
| Age Bracket | Women with Births | Births / 1,000 Women |
| 15 to 19 years | 0 (0.0%) | 0.0 |
| 20 to 34 years | 15 (48.4%) | 28.0 |
| 35 to 50 years | 16 (51.6%) | 34.0 |
| Total | 31 (100.0%) | 26.0 |
Fertility by Age by Marriage Status in Millersville
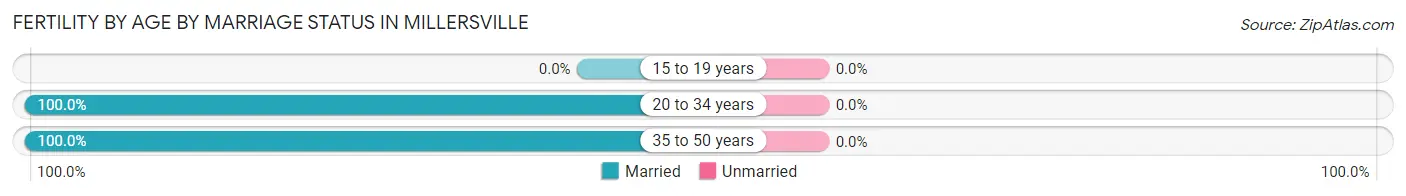
| Age Bracket | Married | Unmarried |
| 15 to 19 years | 0 (0.0%) | 0 (0.0%) |
| 20 to 34 years | 15 (100.0%) | 0 (0.0%) |
| 35 to 50 years | 16 (100.0%) | 0 (0.0%) |
| Total | 31 (100.0%) | 0 (0.0%) |
Fertility by Education in Millersville
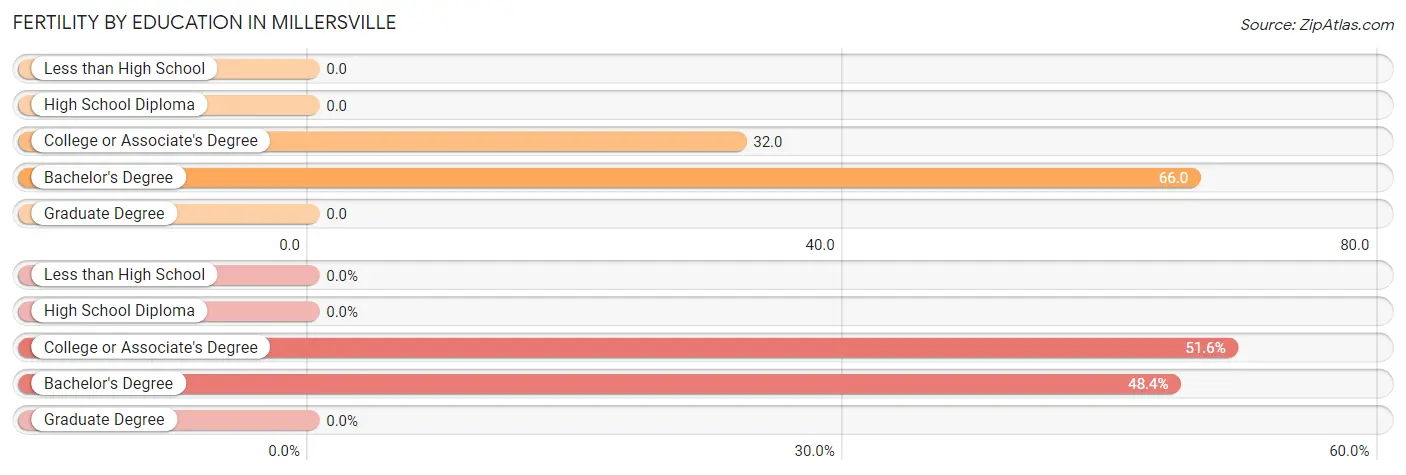
| Educational Attainment | Women with Births | Births / 1,000 Women |
| Less than High School | 0 (0.0%) | 0.0 |
| High School Diploma | 0 (0.0%) | 0.0 |
| College or Associate's Degree | 16 (51.6%) | 32.0 |
| Bachelor's Degree | 15 (48.4%) | 66.0 |
| Graduate Degree | 0 (0.0%) | 0.0 |
| Total | 31 (100.0%) | 26.0 |
Fertility by Education by Marriage Status in Millersville
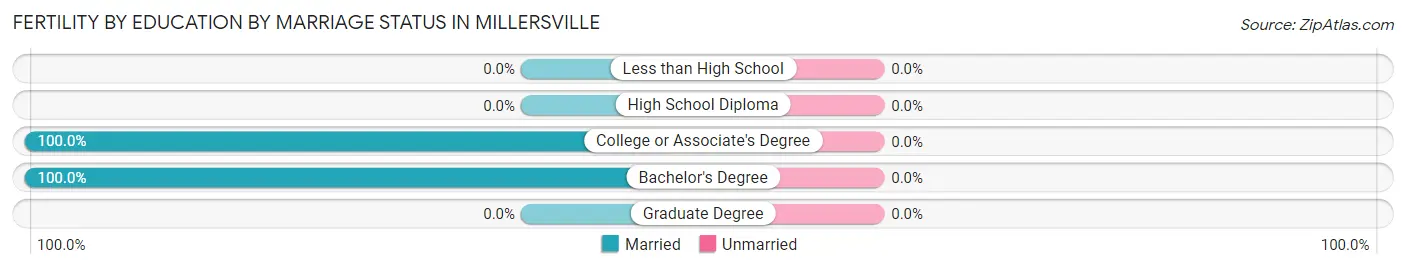
| Educational Attainment | Married | Unmarried |
| Less than High School | 0 (0.0%) | 0 (0.0%) |
| High School Diploma | 0 (0.0%) | 0 (0.0%) |
| College or Associate's Degree | 16 (100.0%) | 0 (0.0%) |
| Bachelor's Degree | 15 (100.0%) | 0 (0.0%) |
| Graduate Degree | 0 (0.0%) | 0 (0.0%) |
| Total | 31 (100.0%) | 0 (0.0%) |
Employment Characteristics in Millersville
Employment by Class of Employer in Millersville
Among the 3,313 employed individuals in Millersville, private company employees (2,317 | 69.9%), self-employed (not incorporated) (390 | 11.8%), and not-for-profit organizations (182 | 5.5%) make up the most common classes of employment.
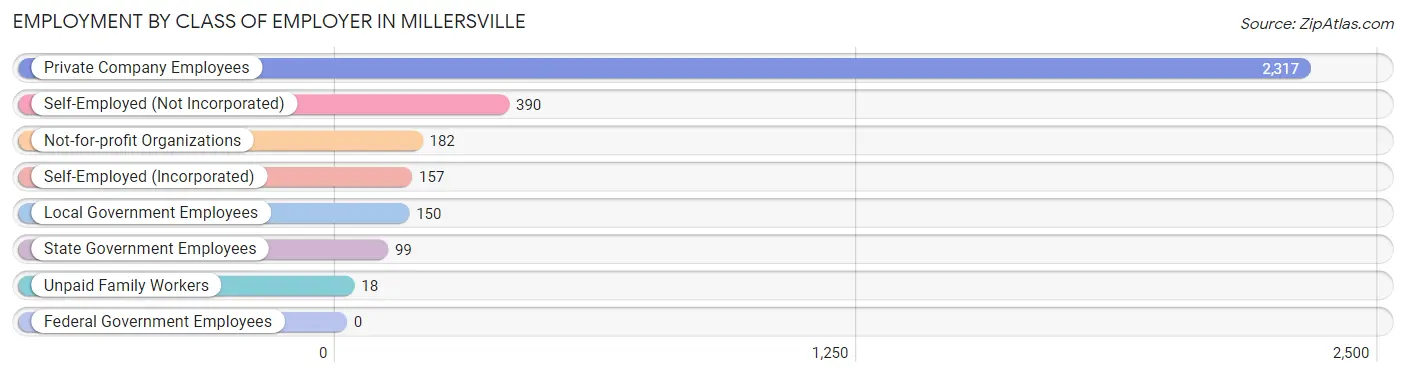
| Employer Class | # Employees | % Employees |
| Private Company Employees | 2,317 | 69.9% |
| Self-Employed (Incorporated) | 157 | 4.7% |
| Self-Employed (Not Incorporated) | 390 | 11.8% |
| Not-for-profit Organizations | 182 | 5.5% |
| Local Government Employees | 150 | 4.5% |
| State Government Employees | 99 | 3.0% |
| Federal Government Employees | 0 | 0.0% |
| Unpaid Family Workers | 18 | 0.5% |
| Total | 3,313 | 100.0% |
Employment Status by Age in Millersville
According to the labor force statistics for Millersville, out of the total population over 16 years of age (4,774), 71.1% or 3,394 individuals are in the labor force, with 2.3% or 78 of them unemployed. The age group with the highest labor force participation rate is 20 to 24 years, with 96.1% or 368 individuals in the labor force. Within the labor force, the 65 to 74 years age range has the highest percentage of unemployed individuals, with 18.4% or 59 of them being unemployed.
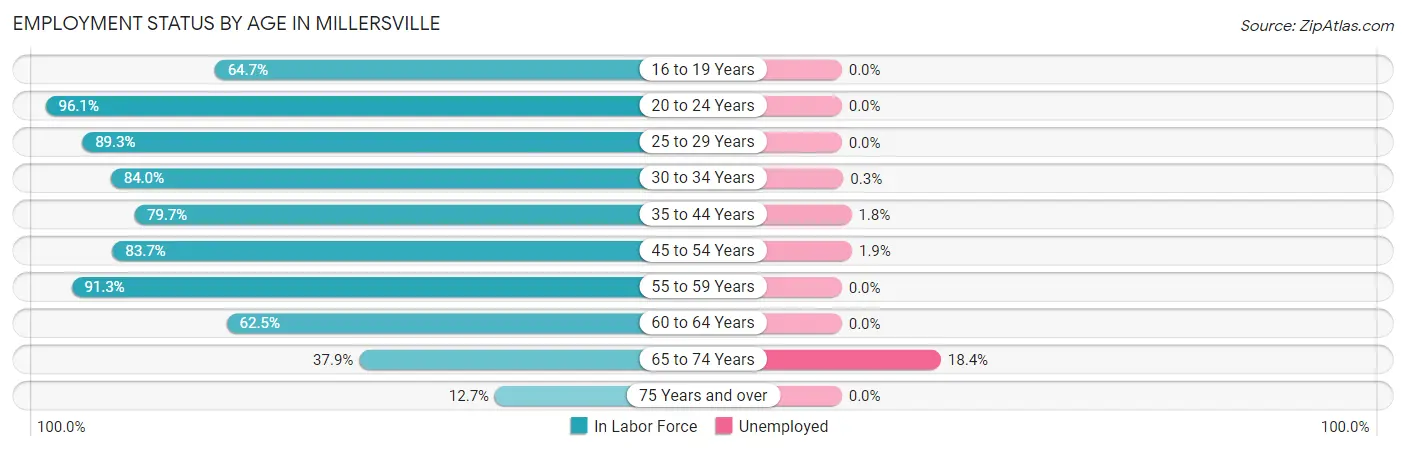
| Age Bracket | In Labor Force | Unemployed |
| 16 to 19 Years | 205 (64.7%) | 0 (0.0%) |
| 20 to 24 Years | 368 (96.1%) | 0 (0.0%) |
| 25 to 29 Years | 358 (89.3%) | 0 (0.0%) |
| 30 to 34 Years | 321 (84.0%) | 1 (0.3%) |
| 35 to 44 Years | 624 (79.7%) | 11 (1.8%) |
| 45 to 54 Years | 415 (83.7%) | 8 (1.9%) |
| 55 to 59 Years | 496 (91.3%) | 0 (0.0%) |
| 60 to 64 Years | 257 (62.5%) | 0 (0.0%) |
| 65 to 74 Years | 321 (37.9%) | 59 (18.4%) |
| 75 Years and over | 27 (12.7%) | 0 (0.0%) |
| Total | 3,394 (71.1%) | 78 (2.3%) |
Employment Status by Educational Attainment in Millersville
According to labor force statistics for Millersville, 81.9% of individuals (2,470) out of the total population between 25 and 64 years of age (3,016) are in the labor force, with 0.8% or 20 of them being unemployed. The group with the highest labor force participation rate are those with the educational attainment of high school diploma, with 85.1% or 695 individuals in the labor force. Within the labor force, individuals with bachelor's degree or higher education have the highest percentage of unemployment, with 3.6% or 19 of them being unemployed.
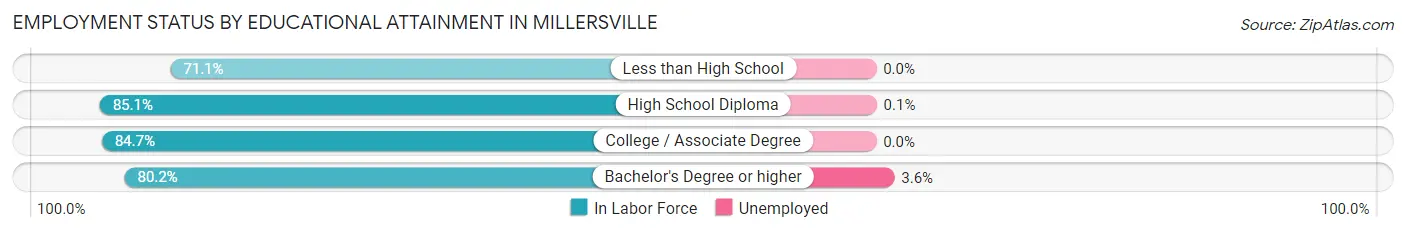
| Educational Attainment | In Labor Force | Unemployed |
| Less than High School | 298 (71.1%) | 0 (0.0%) |
| High School Diploma | 695 (85.1%) | 1 (0.1%) |
| College / Associate Degree | 953 (84.7%) | 0 (0.0%) |
| Bachelor's Degree or higher | 525 (80.2%) | 24 (3.6%) |
| Total | 2,470 (81.9%) | 24 (0.8%) |
Employment Occupations by Sex in Millersville
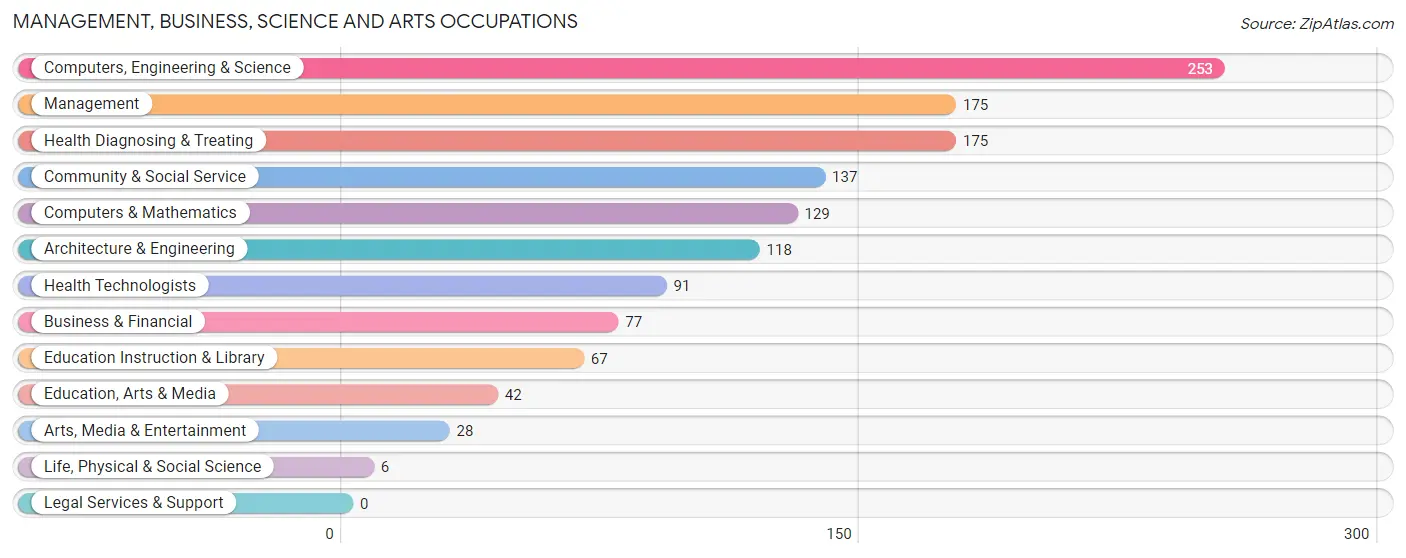
Management, Business, Science and Arts Occupations
The most common Management, Business, Science and Arts occupations in Millersville are Computers, Engineering & Science (253 | 7.6%), Management (175 | 5.3%), Health Diagnosing & Treating (175 | 5.3%), Community & Social Service (137 | 4.1%), and Computers & Mathematics (129 | 3.9%).
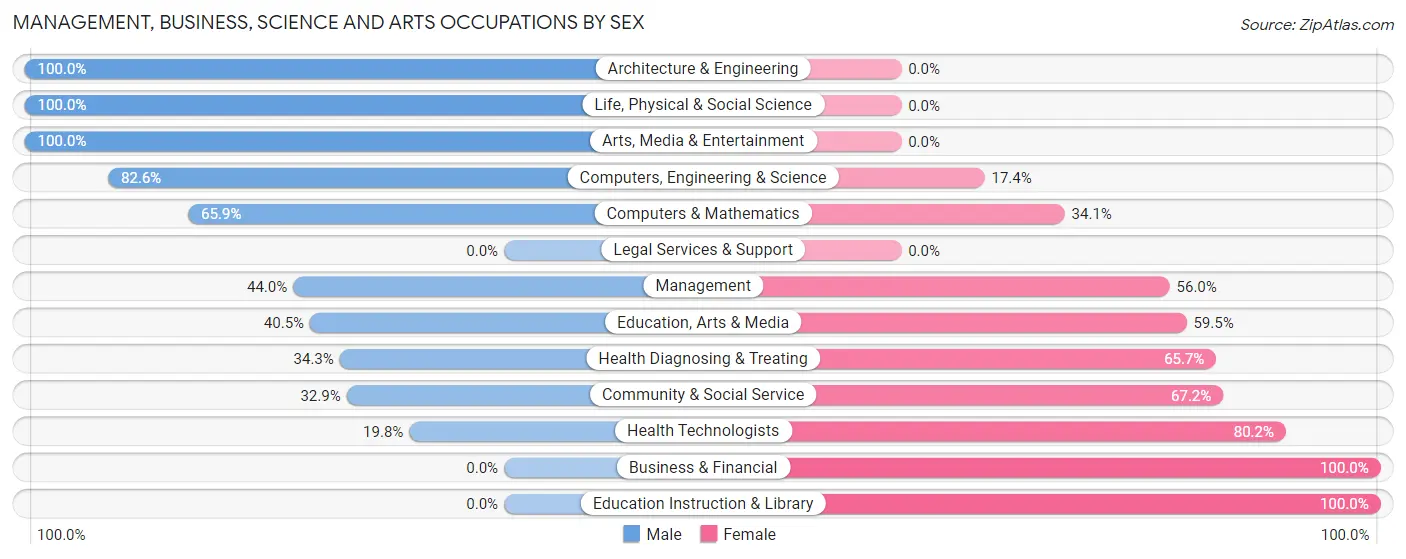
Management, Business, Science and Arts Occupations by Sex
Within the Management, Business, Science and Arts occupations in Millersville, the most male-oriented occupations are Architecture & Engineering (100.0%), Life, Physical & Social Science (100.0%), and Arts, Media & Entertainment (100.0%), while the most female-oriented occupations are Business & Financial (100.0%), Education Instruction & Library (100.0%), and Health Technologists (80.2%).
| Occupation | Male | Female |
| Management | 77 (44.0%) | 98 (56.0%) |
| Business & Financial | 0 (0.0%) | 77 (100.0%) |
| Computers, Engineering & Science | 209 (82.6%) | 44 (17.4%) |
| Computers & Mathematics | 85 (65.9%) | 44 (34.1%) |
| Architecture & Engineering | 118 (100.0%) | 0 (0.0%) |
| Life, Physical & Social Science | 6 (100.0%) | 0 (0.0%) |
| Community & Social Service | 45 (32.9%) | 92 (67.1%) |
| Education, Arts & Media | 17 (40.5%) | 25 (59.5%) |
| Legal Services & Support | 0 (0.0%) | 0 (0.0%) |
| Education Instruction & Library | 0 (0.0%) | 67 (100.0%) |
| Arts, Media & Entertainment | 28 (100.0%) | 0 (0.0%) |
| Health Diagnosing & Treating | 60 (34.3%) | 115 (65.7%) |
| Health Technologists | 18 (19.8%) | 73 (80.2%) |
| Total (Category) | 391 (47.9%) | 426 (52.1%) |
| Total (Overall) | 1,770 (53.4%) | 1,543 (46.6%) |
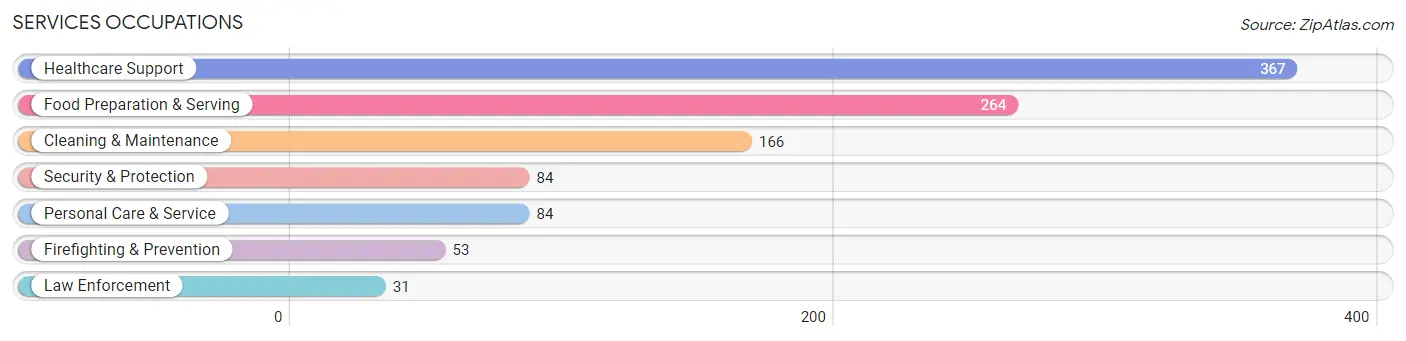
Services Occupations
The most common Services occupations in Millersville are Healthcare Support (367 | 11.1%), Food Preparation & Serving (264 | 8.0%), Cleaning & Maintenance (166 | 5.0%), Security & Protection (84 | 2.5%), and Personal Care & Service (84 | 2.5%).
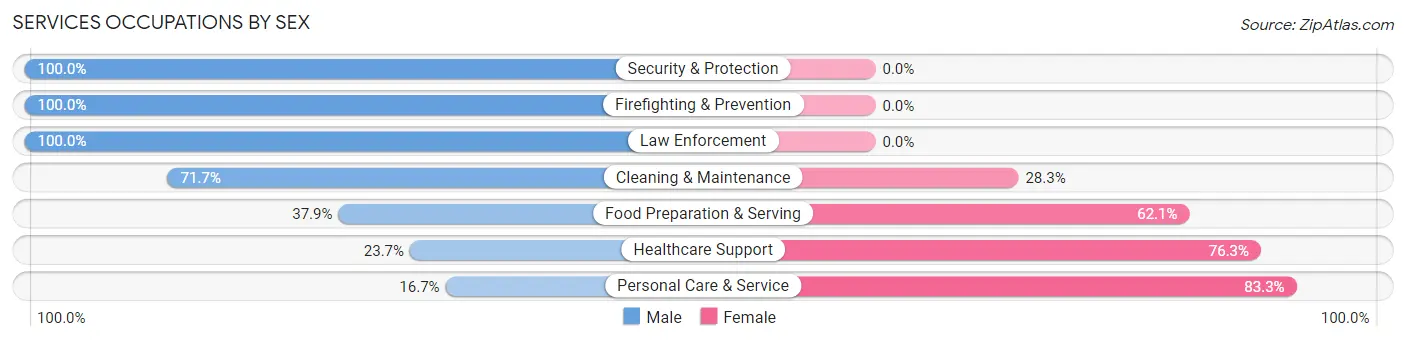
Services Occupations by Sex
Within the Services occupations in Millersville, the most male-oriented occupations are Security & Protection (100.0%), Firefighting & Prevention (100.0%), and Law Enforcement (100.0%), while the most female-oriented occupations are Personal Care & Service (83.3%), Healthcare Support (76.3%), and Food Preparation & Serving (62.1%).
| Occupation | Male | Female |
| Healthcare Support | 87 (23.7%) | 280 (76.3%) |
| Security & Protection | 84 (100.0%) | 0 (0.0%) |
| Firefighting & Prevention | 53 (100.0%) | 0 (0.0%) |
| Law Enforcement | 31 (100.0%) | 0 (0.0%) |
| Food Preparation & Serving | 100 (37.9%) | 164 (62.1%) |
| Cleaning & Maintenance | 119 (71.7%) | 47 (28.3%) |
| Personal Care & Service | 14 (16.7%) | 70 (83.3%) |
| Total (Category) | 404 (41.9%) | 561 (58.1%) |
| Total (Overall) | 1,770 (53.4%) | 1,543 (46.6%) |
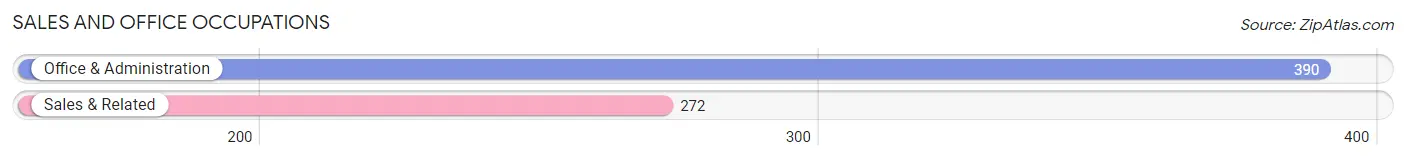
Sales and Office Occupations
The most common Sales and Office occupations in Millersville are Office & Administration (390 | 11.8%), and Sales & Related (272 | 8.2%).
Sales and Office Occupations by Sex
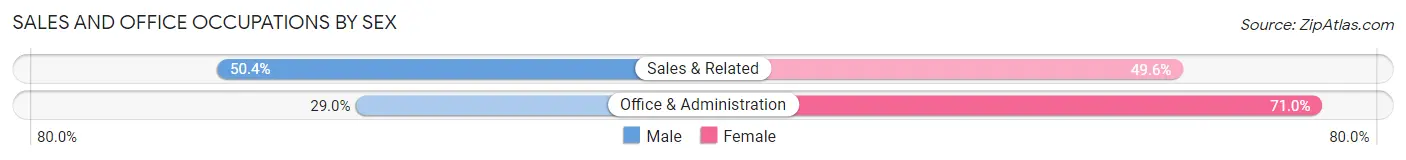
| Occupation | Male | Female |
| Sales & Related | 137 (50.4%) | 135 (49.6%) |
| Office & Administration | 113 (29.0%) | 277 (71.0%) |
| Total (Category) | 250 (37.8%) | 412 (62.2%) |
| Total (Overall) | 1,770 (53.4%) | 1,543 (46.6%) |
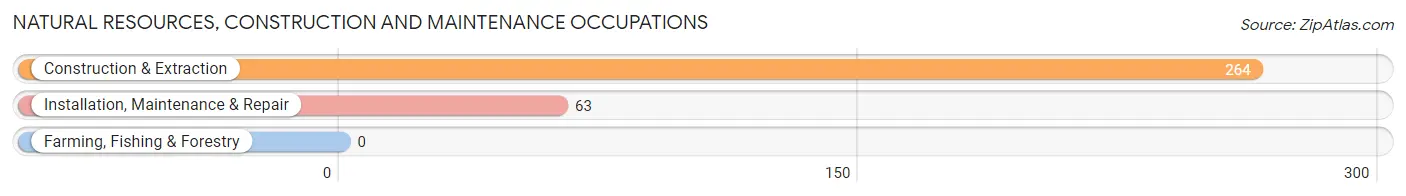
Natural Resources, Construction and Maintenance Occupations
The most common Natural Resources, Construction and Maintenance occupations in Millersville are Construction & Extraction (264 | 8.0%), and Installation, Maintenance & Repair (63 | 1.9%).
Natural Resources, Construction and Maintenance Occupations by Sex

| Occupation | Male | Female |
| Farming, Fishing & Forestry | 0 (0.0%) | 0 (0.0%) |
| Construction & Extraction | 264 (100.0%) | 0 (0.0%) |
| Installation, Maintenance & Repair | 63 (100.0%) | 0 (0.0%) |
| Total (Category) | 327 (100.0%) | 0 (0.0%) |
| Total (Overall) | 1,770 (53.4%) | 1,543 (46.6%) |
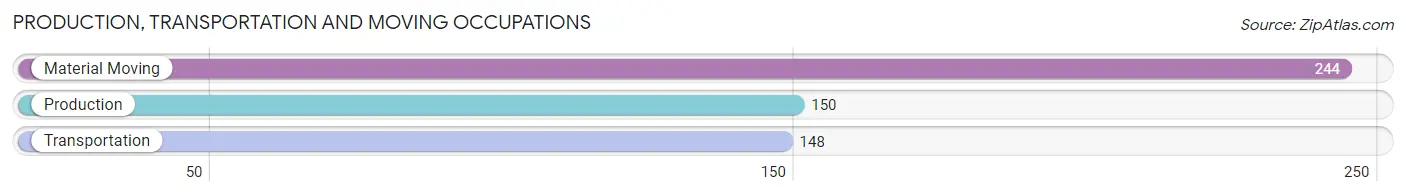
Production, Transportation and Moving Occupations
The most common Production, Transportation and Moving occupations in Millersville are Material Moving (244 | 7.4%), Production (150 | 4.5%), and Transportation (148 | 4.5%).
Production, Transportation and Moving Occupations by Sex
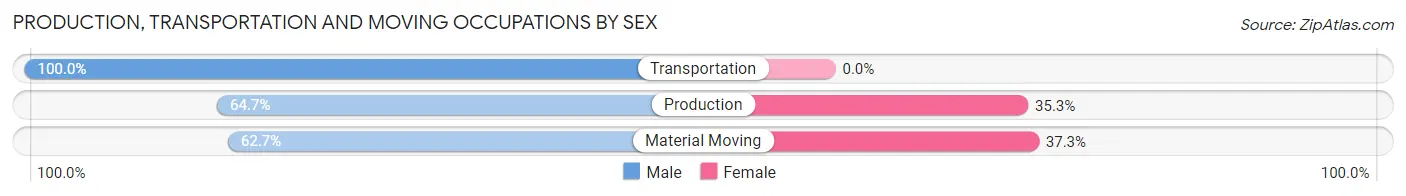
| Occupation | Male | Female |
| Production | 97 (64.7%) | 53 (35.3%) |
| Transportation | 148 (100.0%) | 0 (0.0%) |
| Material Moving | 153 (62.7%) | 91 (37.3%) |
| Total (Category) | 398 (73.4%) | 144 (26.6%) |
| Total (Overall) | 1,770 (53.4%) | 1,543 (46.6%) |
Employment Industries by Sex in Millersville
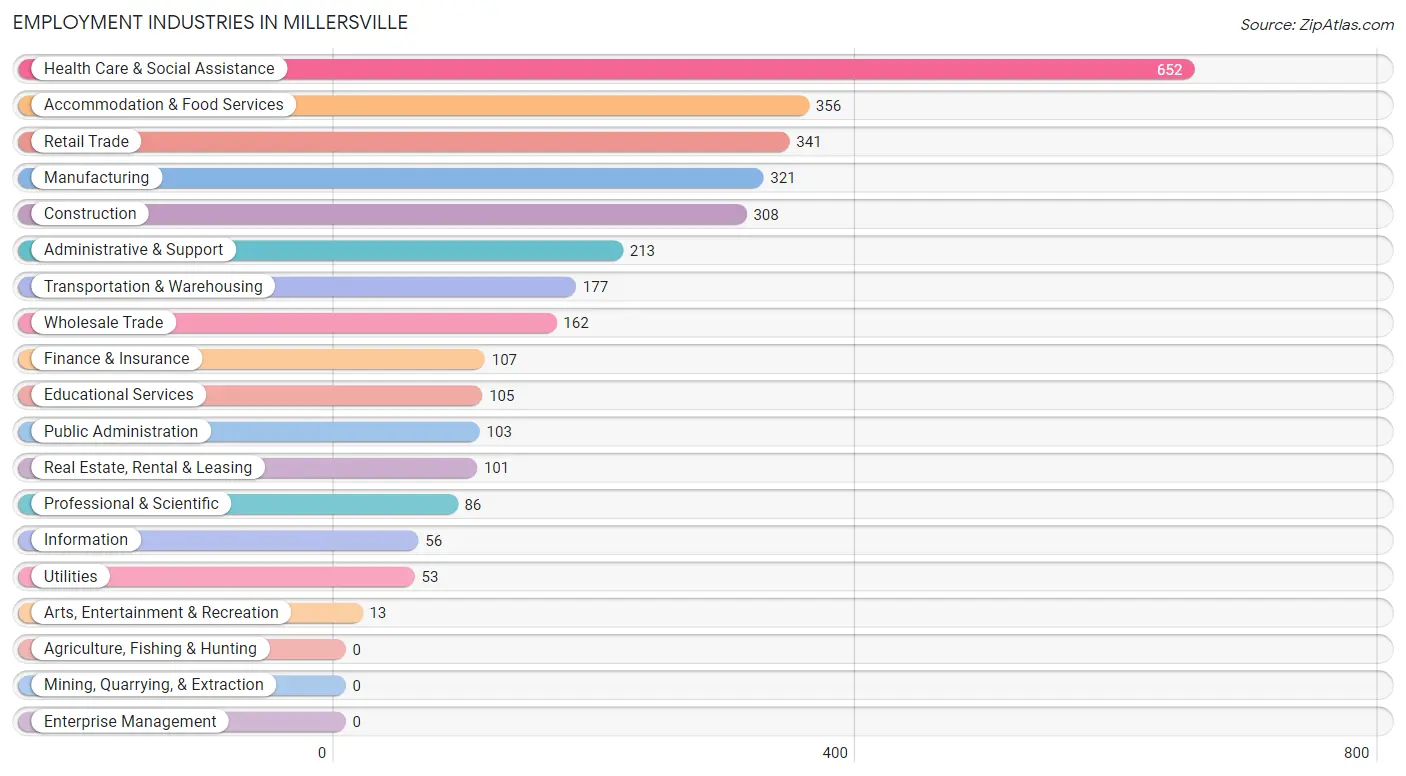
Employment Industries in Millersville
The major employment industries in Millersville include Health Care & Social Assistance (652 | 19.7%), Accommodation & Food Services (356 | 10.7%), Retail Trade (341 | 10.3%), Manufacturing (321 | 9.7%), and Construction (308 | 9.3%).
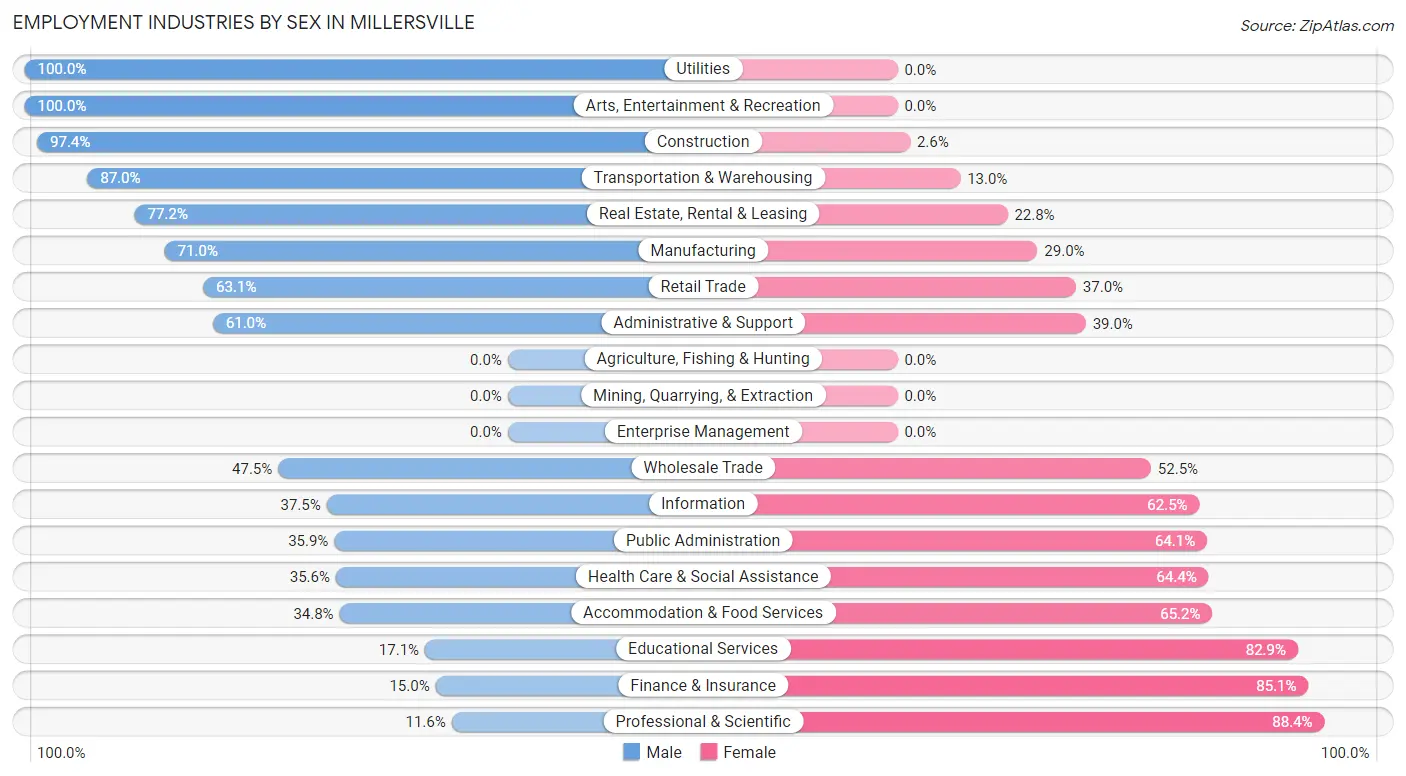
Employment Industries by Sex in Millersville
The Millersville industries that see more men than women are Utilities (100.0%), Arts, Entertainment & Recreation (100.0%), and Construction (97.4%), whereas the industries that tend to have a higher number of women are Professional & Scientific (88.4%), Finance & Insurance (85.1%), and Educational Services (82.9%).
| Industry | Male | Female |
| Agriculture, Fishing & Hunting | 0 (0.0%) | 0 (0.0%) |
| Mining, Quarrying, & Extraction | 0 (0.0%) | 0 (0.0%) |
| Construction | 300 (97.4%) | 8 (2.6%) |
| Manufacturing | 228 (71.0%) | 93 (29.0%) |
| Wholesale Trade | 77 (47.5%) | 85 (52.5%) |
| Retail Trade | 215 (63.0%) | 126 (36.9%) |
| Transportation & Warehousing | 154 (87.0%) | 23 (13.0%) |
| Utilities | 53 (100.0%) | 0 (0.0%) |
| Information | 21 (37.5%) | 35 (62.5%) |
| Finance & Insurance | 16 (14.9%) | 91 (85.1%) |
| Real Estate, Rental & Leasing | 78 (77.2%) | 23 (22.8%) |
| Professional & Scientific | 10 (11.6%) | 76 (88.4%) |
| Enterprise Management | 0 (0.0%) | 0 (0.0%) |
| Administrative & Support | 130 (61.0%) | 83 (39.0%) |
| Educational Services | 18 (17.1%) | 87 (82.9%) |
| Health Care & Social Assistance | 232 (35.6%) | 420 (64.4%) |
| Arts, Entertainment & Recreation | 13 (100.0%) | 0 (0.0%) |
| Accommodation & Food Services | 124 (34.8%) | 232 (65.2%) |
| Public Administration | 37 (35.9%) | 66 (64.1%) |
| Total | 1,770 (53.4%) | 1,543 (46.6%) |
Education in Millersville
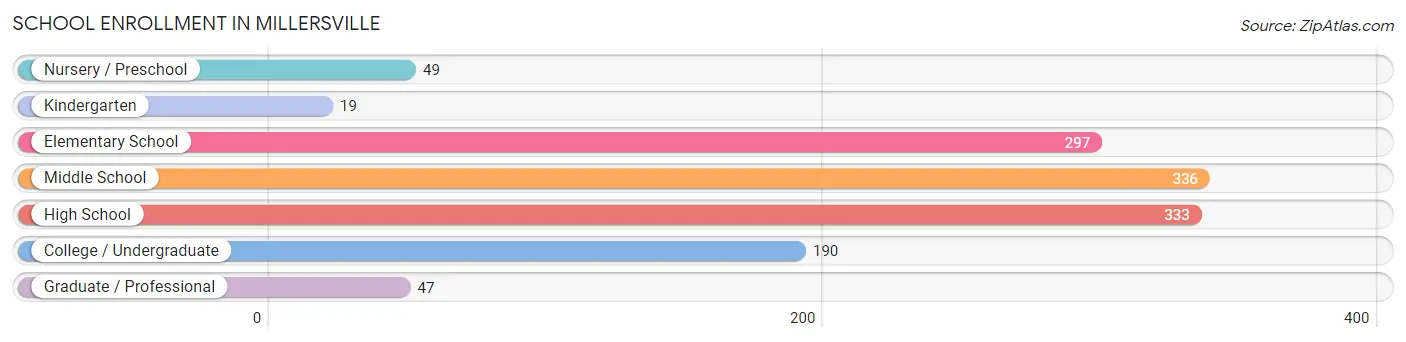
School Enrollment in Millersville
The most common levels of schooling among the 1,271 students in Millersville are middle school (336 | 26.4%), high school (333 | 26.2%), and elementary school (297 | 23.4%).
| School Level | # Students | % Students |
| Nursery / Preschool | 49 | 3.9% |
| Kindergarten | 19 | 1.5% |
| Elementary School | 297 | 23.4% |
| Middle School | 336 | 26.4% |
| High School | 333 | 26.2% |
| College / Undergraduate | 190 | 14.9% |
| Graduate / Professional | 47 | 3.7% |
| Total | 1,271 | 100.0% |
School Enrollment by Age by Funding Source in Millersville
Out of a total of 1,271 students who are enrolled in schools in Millersville, 214 (16.8%) attend a private institution, while the remaining 1,057 (83.2%) are enrolled in public schools. The age group of 3 to 4 year olds has the highest likelihood of being enrolled in private schools, with 34 (100.0% in the age bracket) enrolled. Conversely, the age group of 18 to 19 year olds has the lowest likelihood of being enrolled in a private school, with 18 (100.0% in the age bracket) attending a public institution.
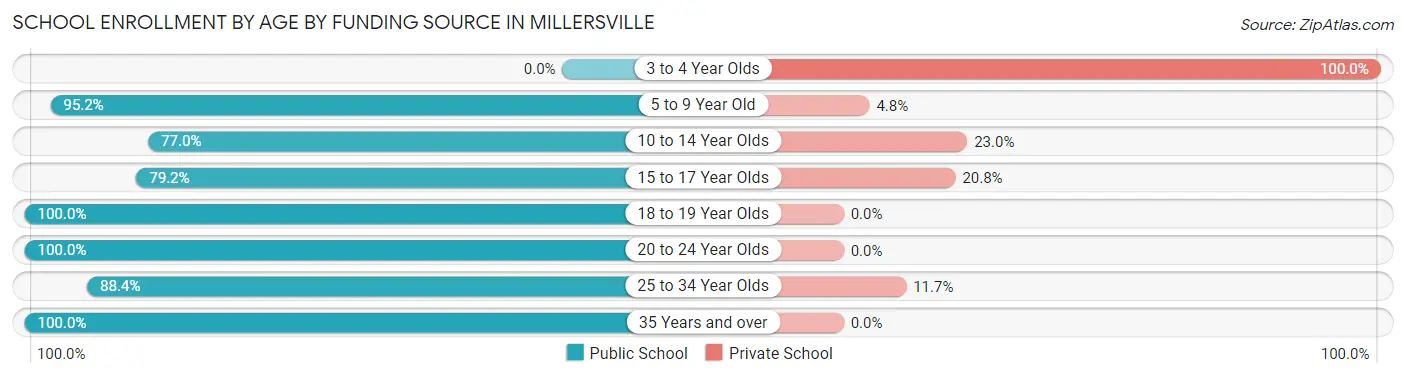
| Age Bracket | Public School | Private School |
| 3 to 4 Year Olds | 0 (0.0%) | 34 (100.0%) |
| 5 to 9 Year Old | 297 (95.2%) | 15 (4.8%) |
| 10 to 14 Year Olds | 291 (77.0%) | 87 (23.0%) |
| 15 to 17 Year Olds | 251 (79.2%) | 66 (20.8%) |
| 18 to 19 Year Olds | 18 (100.0%) | 0 (0.0%) |
| 20 to 24 Year Olds | 96 (100.0%) | 0 (0.0%) |
| 25 to 34 Year Olds | 91 (88.3%) | 12 (11.7%) |
| 35 Years and over | 13 (100.0%) | 0 (0.0%) |
| Total | 1,057 (83.2%) | 214 (16.8%) |
Educational Attainment by Field of Study in Millersville
Business (159 | 21.1%), science & technology (99 | 13.2%), visual & performing arts (89 | 11.8%), social sciences (76 | 10.1%), and bio, nature & agricultural (56 | 7.4%) are the most common fields of study among 752 individuals in Millersville who have obtained a bachelor's degree or higher.
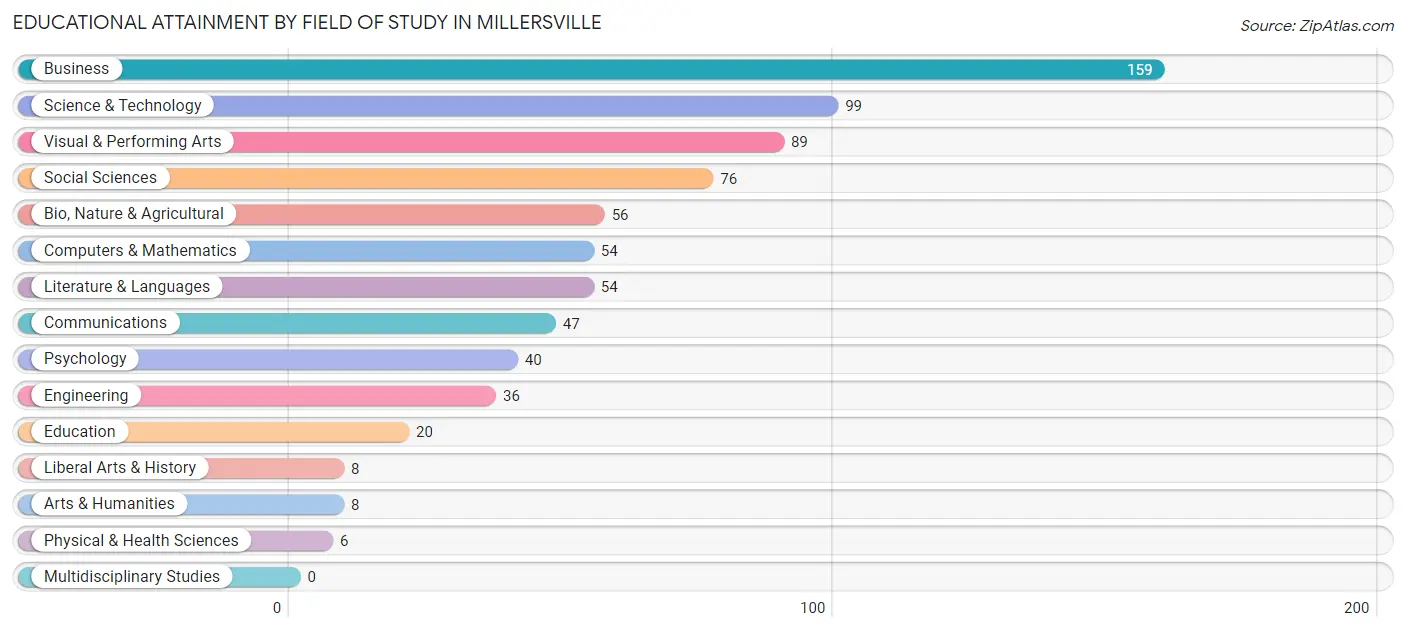
| Field of Study | # Graduates | % Graduates |
| Computers & Mathematics | 54 | 7.2% |
| Bio, Nature & Agricultural | 56 | 7.4% |
| Physical & Health Sciences | 6 | 0.8% |
| Psychology | 40 | 5.3% |
| Social Sciences | 76 | 10.1% |
| Engineering | 36 | 4.8% |
| Multidisciplinary Studies | 0 | 0.0% |
| Science & Technology | 99 | 13.2% |
| Business | 159 | 21.1% |
| Education | 20 | 2.7% |
| Literature & Languages | 54 | 7.2% |
| Liberal Arts & History | 8 | 1.1% |
| Visual & Performing Arts | 89 | 11.8% |
| Communications | 47 | 6.2% |
| Arts & Humanities | 8 | 1.1% |
| Total | 752 | 100.0% |
Transportation & Commute in Millersville
Vehicle Availability by Sex in Millersville
The most prevalent vehicle ownership categories in Millersville are males with 2 vehicles (753, accounting for 42.5%) and females with 2 vehicles (597, making up 48.8%).
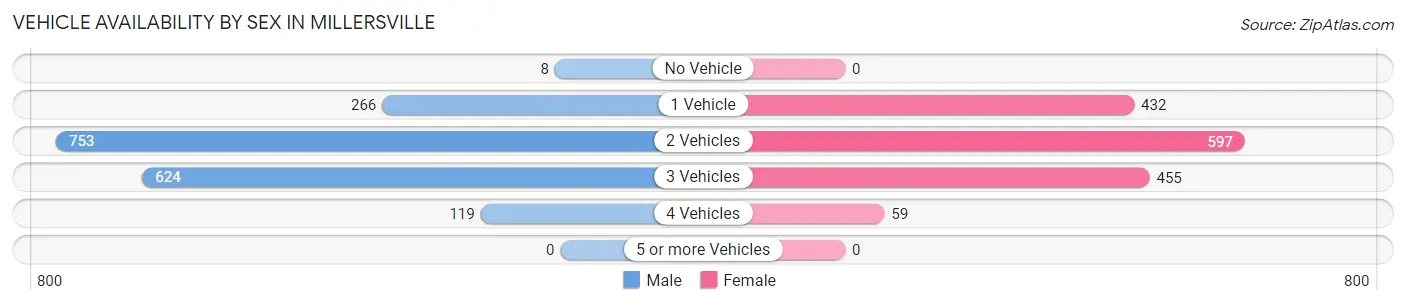
| Vehicles Available | Male | Female |
| No Vehicle | 8 (0.4%) | 0 (0.0%) |
| 1 Vehicle | 266 (15.0%) | 432 (28.0%) |
| 2 Vehicles | 753 (42.5%) | 597 (38.7%) |
| 3 Vehicles | 624 (35.2%) | 455 (29.5%) |
| 4 Vehicles | 119 (6.7%) | 59 (3.8%) |
| 5 or more Vehicles | 0 (0.0%) | 0 (0.0%) |
| Total | 1,770 (100.0%) | 1,543 (100.0%) |
Commute Time in Millersville
The most frequently occuring commute durations in Millersville are 20 to 24 minutes (444 commuters, 15.3%), 10 to 14 minutes (413 commuters, 14.2%), and 30 to 34 minutes (406 commuters, 14.0%).
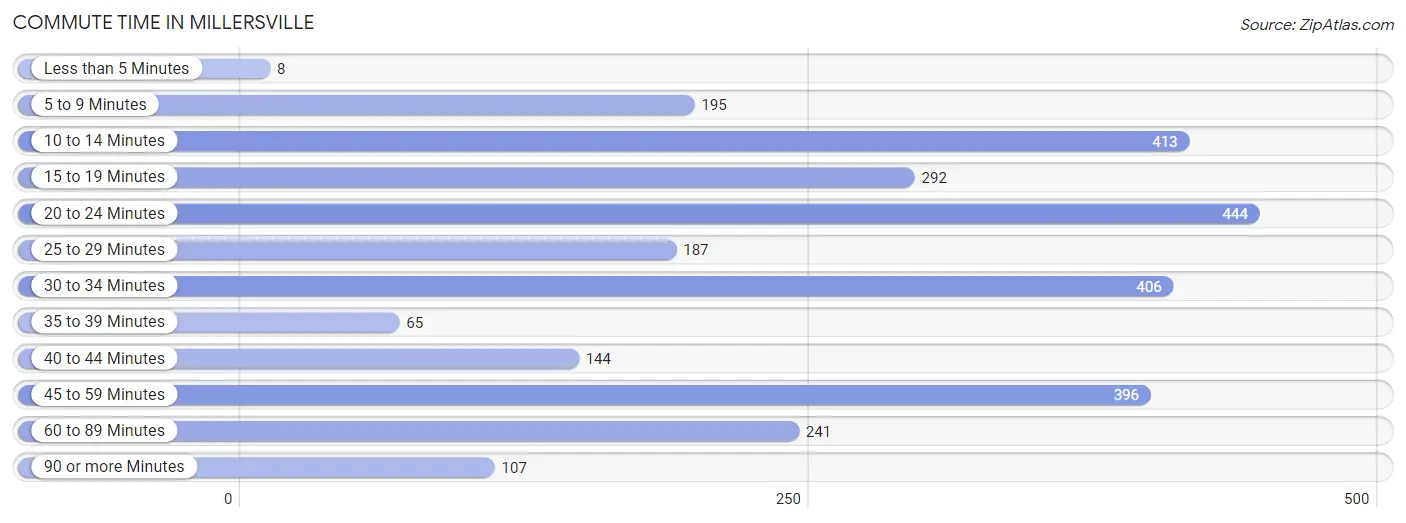
| Commute Time | # Commuters | % Commuters |
| Less than 5 Minutes | 8 | 0.3% |
| 5 to 9 Minutes | 195 | 6.7% |
| 10 to 14 Minutes | 413 | 14.2% |
| 15 to 19 Minutes | 292 | 10.1% |
| 20 to 24 Minutes | 444 | 15.3% |
| 25 to 29 Minutes | 187 | 6.5% |
| 30 to 34 Minutes | 406 | 14.0% |
| 35 to 39 Minutes | 65 | 2.2% |
| 40 to 44 Minutes | 144 | 5.0% |
| 45 to 59 Minutes | 396 | 13.7% |
| 60 to 89 Minutes | 241 | 8.3% |
| 90 or more Minutes | 107 | 3.7% |
Commute Time by Sex in Millersville
The most common commute times in Millersville are 20 to 24 minutes (320 commuters, 19.4%) for males and 10 to 14 minutes (253 commuters, 20.3%) for females.
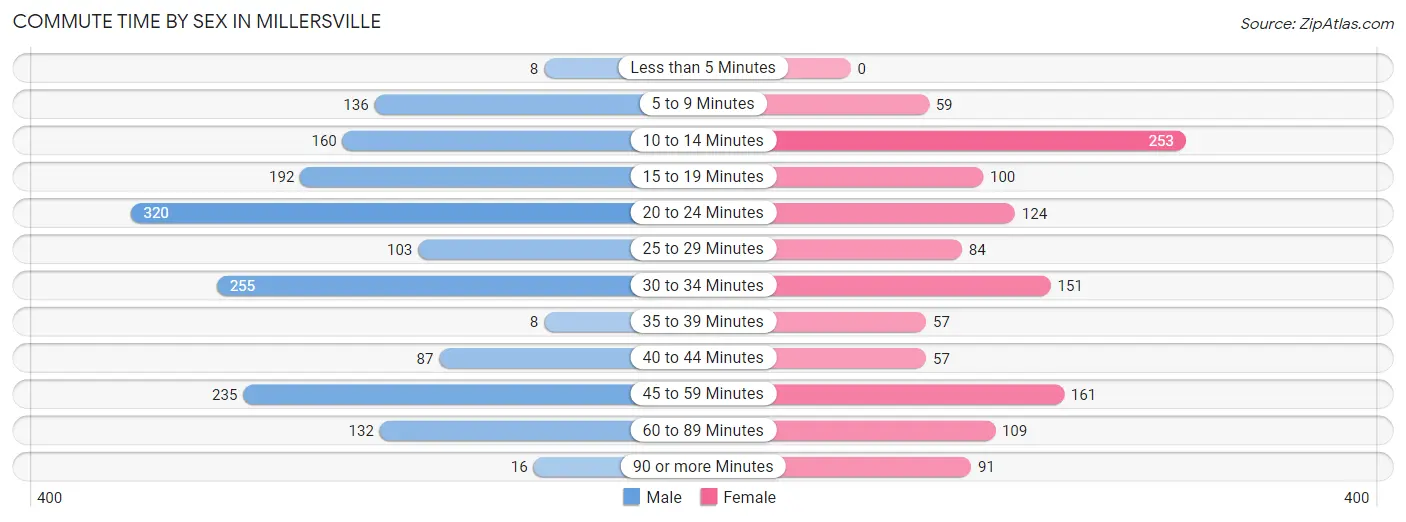
| Commute Time | Male | Female |
| Less than 5 Minutes | 8 (0.5%) | 0 (0.0%) |
| 5 to 9 Minutes | 136 (8.2%) | 59 (4.7%) |
| 10 to 14 Minutes | 160 (9.7%) | 253 (20.3%) |
| 15 to 19 Minutes | 192 (11.6%) | 100 (8.0%) |
| 20 to 24 Minutes | 320 (19.4%) | 124 (10.0%) |
| 25 to 29 Minutes | 103 (6.2%) | 84 (6.7%) |
| 30 to 34 Minutes | 255 (15.4%) | 151 (12.1%) |
| 35 to 39 Minutes | 8 (0.5%) | 57 (4.6%) |
| 40 to 44 Minutes | 87 (5.3%) | 57 (4.6%) |
| 45 to 59 Minutes | 235 (14.2%) | 161 (12.9%) |
| 60 to 89 Minutes | 132 (8.0%) | 109 (8.7%) |
| 90 or more Minutes | 16 (1.0%) | 91 (7.3%) |
Time of Departure to Work by Sex in Millersville
The most frequent times of departure to work in Millersville are 5:00 AM to 5:29 AM (298, 18.0%) for males and 6:30 AM to 6:59 AM (164, 13.2%) for females.
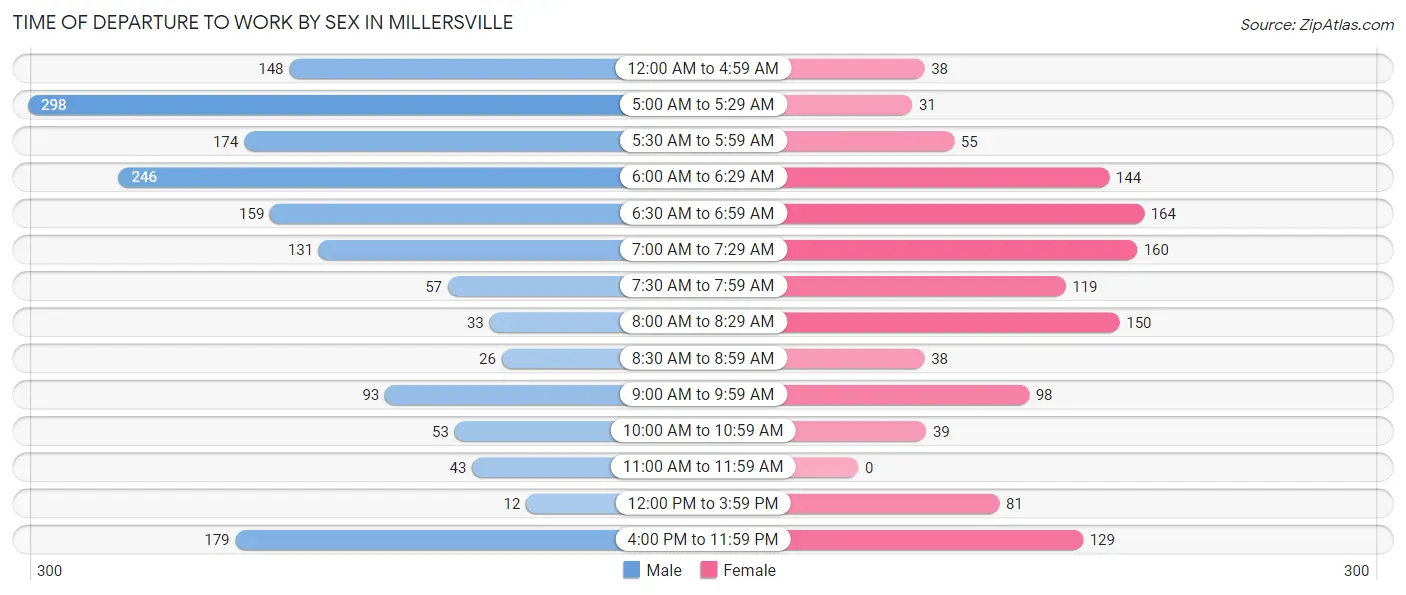
| Time of Departure | Male | Female |
| 12:00 AM to 4:59 AM | 148 (9.0%) | 38 (3.0%) |
| 5:00 AM to 5:29 AM | 298 (18.0%) | 31 (2.5%) |
| 5:30 AM to 5:59 AM | 174 (10.5%) | 55 (4.4%) |
| 6:00 AM to 6:29 AM | 246 (14.9%) | 144 (11.6%) |
| 6:30 AM to 6:59 AM | 159 (9.6%) | 164 (13.2%) |
| 7:00 AM to 7:29 AM | 131 (7.9%) | 160 (12.8%) |
| 7:30 AM to 7:59 AM | 57 (3.5%) | 119 (9.6%) |
| 8:00 AM to 8:29 AM | 33 (2.0%) | 150 (12.0%) |
| 8:30 AM to 8:59 AM | 26 (1.6%) | 38 (3.0%) |
| 9:00 AM to 9:59 AM | 93 (5.6%) | 98 (7.9%) |
| 10:00 AM to 10:59 AM | 53 (3.2%) | 39 (3.1%) |
| 11:00 AM to 11:59 AM | 43 (2.6%) | 0 (0.0%) |
| 12:00 PM to 3:59 PM | 12 (0.7%) | 81 (6.5%) |
| 4:00 PM to 11:59 PM | 179 (10.8%) | 129 (10.3%) |
| Total | 1,652 (100.0%) | 1,246 (100.0%) |
Housing Occupancy in Millersville
Occupancy by Ownership in Millersville
Of the total 2,359 dwellings in Millersville, owner-occupied units account for 1,582 (67.1%), while renter-occupied units make up 777 (32.9%).
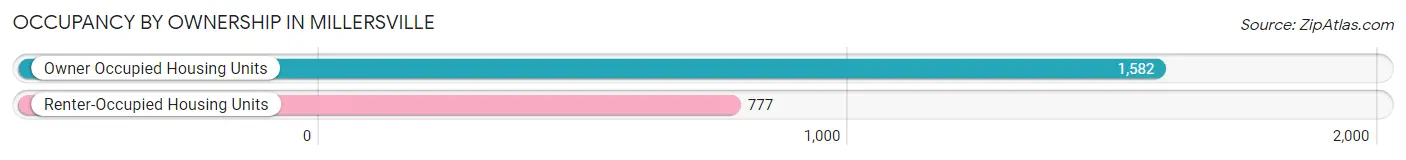
| Occupancy | # Housing Units | % Housing Units |
| Owner Occupied Housing Units | 1,582 | 67.1% |
| Renter-Occupied Housing Units | 777 | 32.9% |
| Total Occupied Housing Units | 2,359 | 100.0% |
Occupancy by Household Size in Millersville
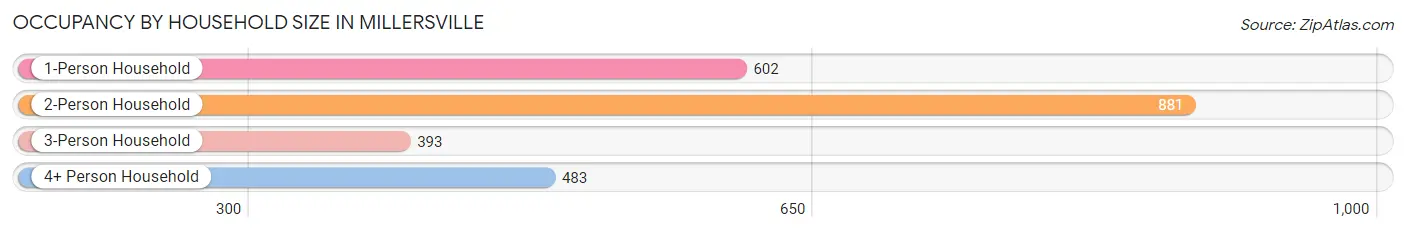
| Household Size | # Housing Units | % Housing Units |
| 1-Person Household | 602 | 25.5% |
| 2-Person Household | 881 | 37.3% |
| 3-Person Household | 393 | 16.7% |
| 4+ Person Household | 483 | 20.5% |
| Total Housing Units | 2,359 | 100.0% |
Occupancy by Ownership by Household Size in Millersville
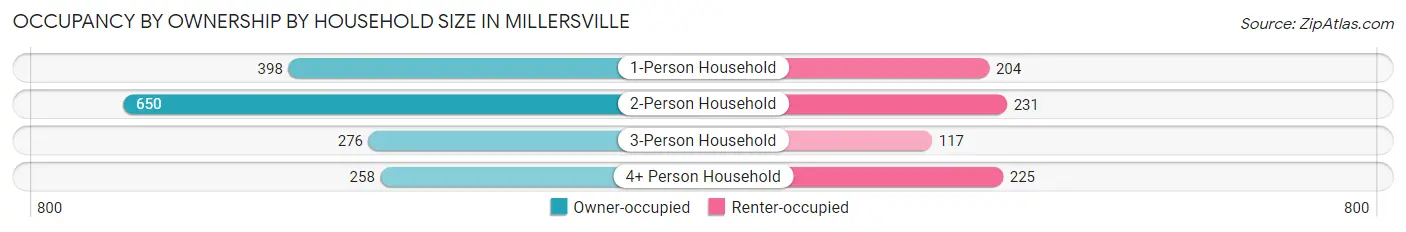
| Household Size | Owner-occupied | Renter-occupied |
| 1-Person Household | 398 (66.1%) | 204 (33.9%) |
| 2-Person Household | 650 (73.8%) | 231 (26.2%) |
| 3-Person Household | 276 (70.2%) | 117 (29.8%) |
| 4+ Person Household | 258 (53.4%) | 225 (46.6%) |
| Total Housing Units | 1,582 (67.1%) | 777 (32.9%) |
Occupancy by Educational Attainment in Millersville
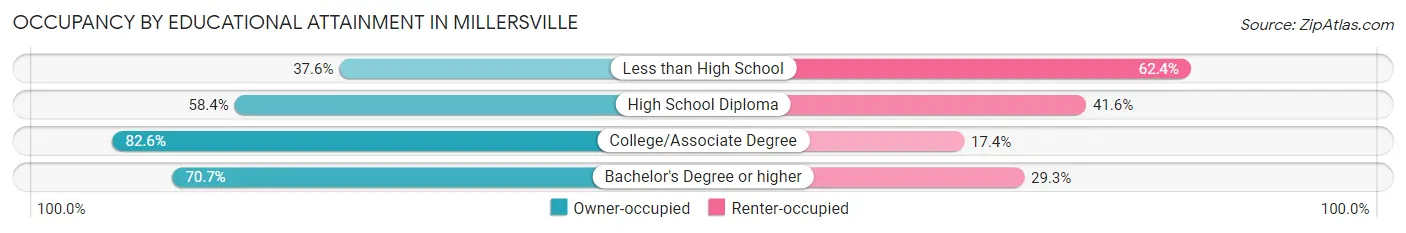
| Household Size | Owner-occupied | Renter-occupied |
| Less than High School | 114 (37.6%) | 189 (62.4%) |
| High School Diploma | 418 (58.4%) | 298 (41.6%) |
| College/Associate Degree | 715 (82.6%) | 151 (17.4%) |
| Bachelor's Degree or higher | 335 (70.7%) | 139 (29.3%) |
Occupancy by Age of Householder in Millersville
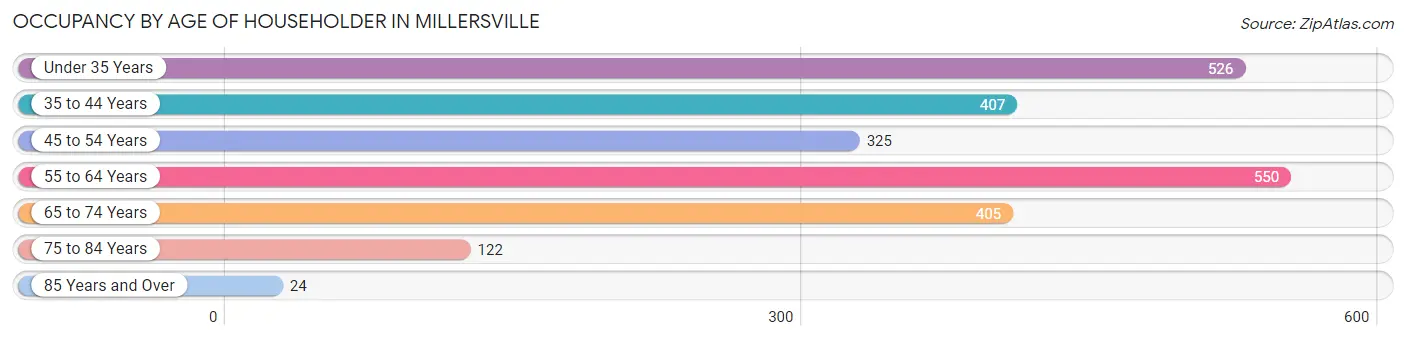
| Age Bracket | # Households | % Households |
| Under 35 Years | 526 | 22.3% |
| 35 to 44 Years | 407 | 17.2% |
| 45 to 54 Years | 325 | 13.8% |
| 55 to 64 Years | 550 | 23.3% |
| 65 to 74 Years | 405 | 17.2% |
| 75 to 84 Years | 122 | 5.2% |
| 85 Years and Over | 24 | 1.0% |
| Total | 2,359 | 100.0% |
Housing Finances in Millersville
Median Income by Occupancy in Millersville
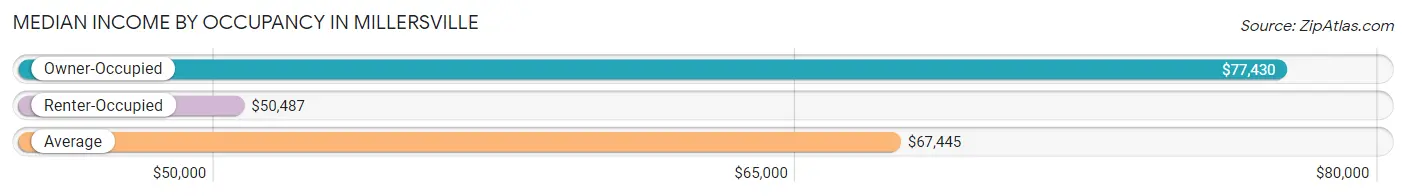
| Occupancy Type | # Households | Median Income |
| Owner-Occupied | 1,582 (67.1%) | $77,430 |
| Renter-Occupied | 777 (32.9%) | $50,487 |
| Average | 2,359 (100.0%) | $67,445 |
Occupancy by Householder Income Bracket in Millersville
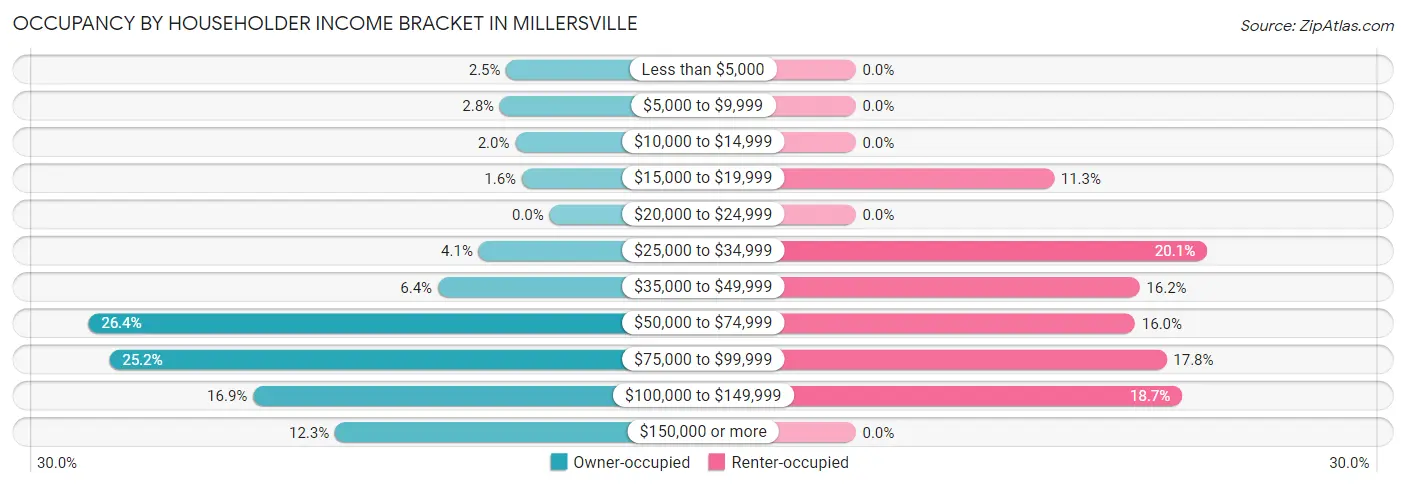
| Income Bracket | Owner-occupied | Renter-occupied |
| Less than $5,000 | 39 (2.5%) | 0 (0.0%) |
| $5,000 to $9,999 | 45 (2.8%) | 0 (0.0%) |
| $10,000 to $14,999 | 31 (2.0%) | 0 (0.0%) |
| $15,000 to $19,999 | 25 (1.6%) | 88 (11.3%) |
| $20,000 to $24,999 | 0 (0.0%) | 0 (0.0%) |
| $25,000 to $34,999 | 64 (4.1%) | 156 (20.1%) |
| $35,000 to $49,999 | 101 (6.4%) | 126 (16.2%) |
| $50,000 to $74,999 | 417 (26.4%) | 124 (16.0%) |
| $75,000 to $99,999 | 398 (25.2%) | 138 (17.8%) |
| $100,000 to $149,999 | 268 (16.9%) | 145 (18.7%) |
| $150,000 or more | 194 (12.3%) | 0 (0.0%) |
| Total | 1,582 (100.0%) | 777 (100.0%) |
Monthly Housing Cost Tiers in Millersville
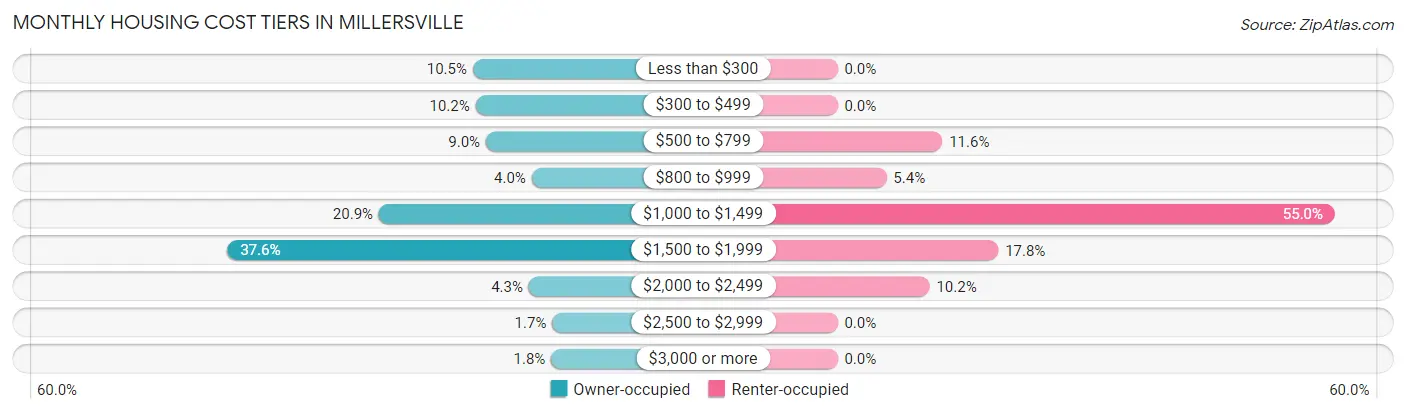
| Monthly Cost | Owner-occupied | Renter-occupied |
| Less than $300 | 166 (10.5%) | 0 (0.0%) |
| $300 to $499 | 161 (10.2%) | 0 (0.0%) |
| $500 to $799 | 143 (9.0%) | 90 (11.6%) |
| $800 to $999 | 63 (4.0%) | 42 (5.4%) |
| $1,000 to $1,499 | 330 (20.9%) | 427 (54.9%) |
| $1,500 to $1,999 | 595 (37.6%) | 138 (17.8%) |
| $2,000 to $2,499 | 68 (4.3%) | 79 (10.2%) |
| $2,500 to $2,999 | 27 (1.7%) | 0 (0.0%) |
| $3,000 or more | 29 (1.8%) | 0 (0.0%) |
| Total | 1,582 (100.0%) | 777 (100.0%) |
Physical Housing Characteristics in Millersville
Housing Structures in Millersville
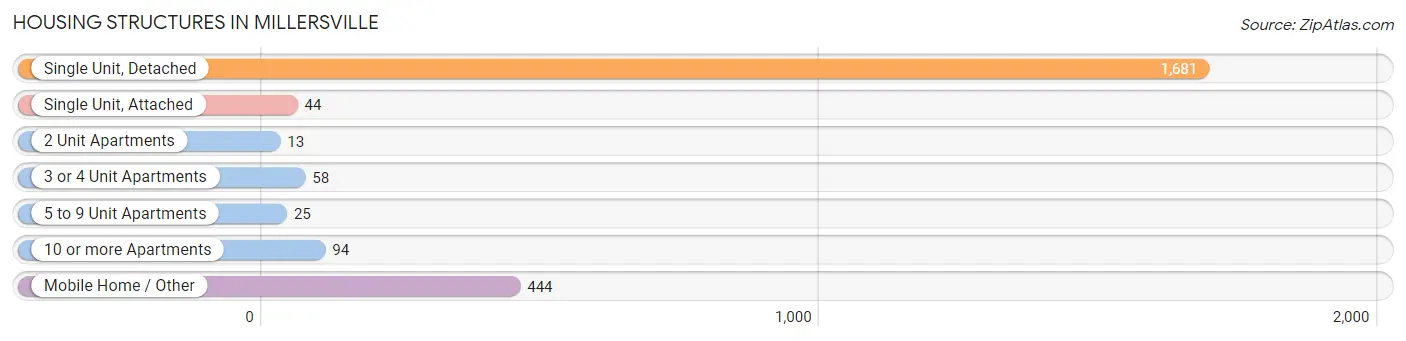
| Structure Type | # Housing Units | % Housing Units |
| Single Unit, Detached | 1,681 | 71.3% |
| Single Unit, Attached | 44 | 1.9% |
| 2 Unit Apartments | 13 | 0.5% |
| 3 or 4 Unit Apartments | 58 | 2.5% |
| 5 to 9 Unit Apartments | 25 | 1.1% |
| 10 or more Apartments | 94 | 4.0% |
| Mobile Home / Other | 444 | 18.8% |
| Total | 2,359 | 100.0% |
Housing Structures by Occupancy in Millersville
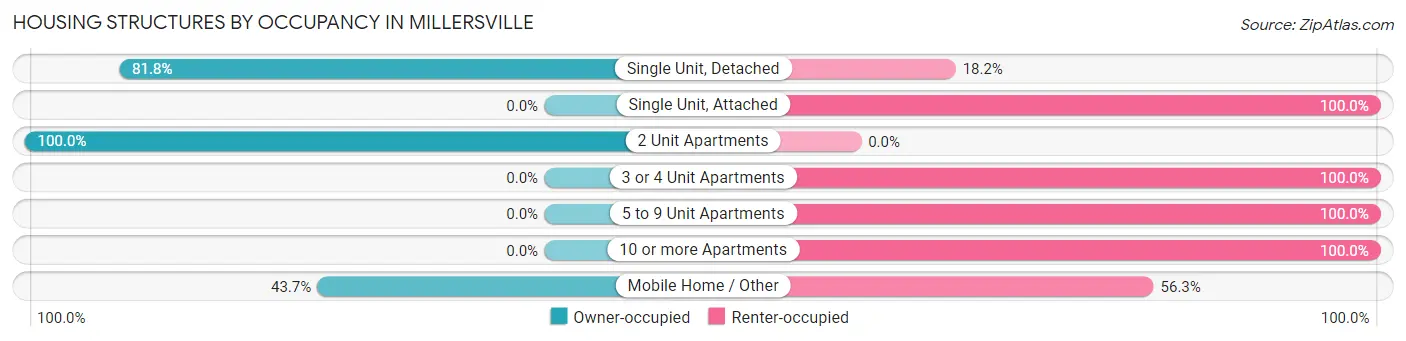
| Structure Type | Owner-occupied | Renter-occupied |
| Single Unit, Detached | 1,375 (81.8%) | 306 (18.2%) |
| Single Unit, Attached | 0 (0.0%) | 44 (100.0%) |
| 2 Unit Apartments | 13 (100.0%) | 0 (0.0%) |
| 3 or 4 Unit Apartments | 0 (0.0%) | 58 (100.0%) |
| 5 to 9 Unit Apartments | 0 (0.0%) | 25 (100.0%) |
| 10 or more Apartments | 0 (0.0%) | 94 (100.0%) |
| Mobile Home / Other | 194 (43.7%) | 250 (56.3%) |
| Total | 1,582 (67.1%) | 777 (32.9%) |
Housing Structures by Number of Rooms in Millersville
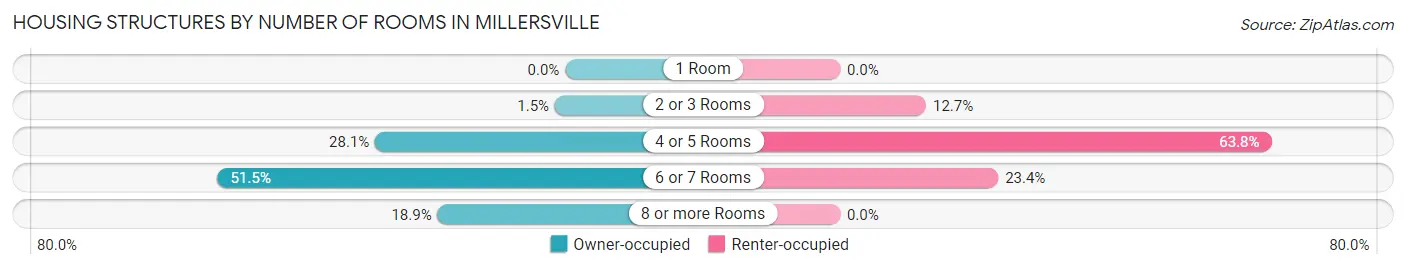
| Number of Rooms | Owner-occupied | Renter-occupied |
| 1 Room | 0 (0.0%) | 0 (0.0%) |
| 2 or 3 Rooms | 24 (1.5%) | 99 (12.7%) |
| 4 or 5 Rooms | 445 (28.1%) | 496 (63.8%) |
| 6 or 7 Rooms | 814 (51.4%) | 182 (23.4%) |
| 8 or more Rooms | 299 (18.9%) | 0 (0.0%) |
| Total | 1,582 (100.0%) | 777 (100.0%) |
Housing Structure by Heating Type in Millersville
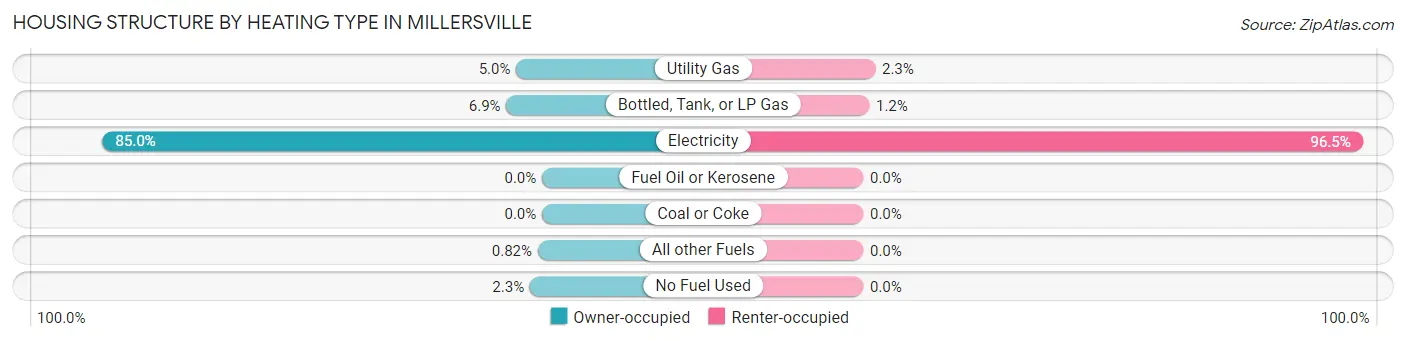
| Heating Type | Owner-occupied | Renter-occupied |
| Utility Gas | 79 (5.0%) | 18 (2.3%) |
| Bottled, Tank, or LP Gas | 109 (6.9%) | 9 (1.2%) |
| Electricity | 1,344 (85.0%) | 750 (96.5%) |
| Fuel Oil or Kerosene | 0 (0.0%) | 0 (0.0%) |
| Coal or Coke | 0 (0.0%) | 0 (0.0%) |
| All other Fuels | 13 (0.8%) | 0 (0.0%) |
| No Fuel Used | 37 (2.3%) | 0 (0.0%) |
| Total | 1,582 (100.0%) | 777 (100.0%) |
Household Vehicle Usage in Millersville
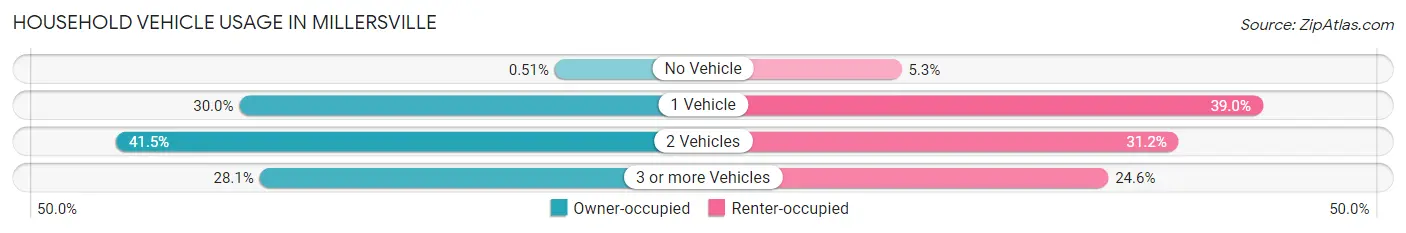
| Vehicles per Household | Owner-occupied | Renter-occupied |
| No Vehicle | 8 (0.5%) | 41 (5.3%) |
| 1 Vehicle | 474 (30.0%) | 303 (39.0%) |
| 2 Vehicles | 656 (41.5%) | 242 (31.1%) |
| 3 or more Vehicles | 444 (28.1%) | 191 (24.6%) |
| Total | 1,582 (100.0%) | 777 (100.0%) |
Real Estate & Mortgages in Millersville
Real Estate and Mortgage Overview in Millersville
| Characteristic | Without Mortgage | With Mortgage |
| Housing Units | 498 | 1,084 |
| Median Property Value | $203,100 | $246,800 |
| Median Household Income | $58,864 | $133 |
| Monthly Housing Costs | $405 | $29 |
| Real Estate Taxes | $1,363 | $0 |
Property Value by Mortgage Status in Millersville
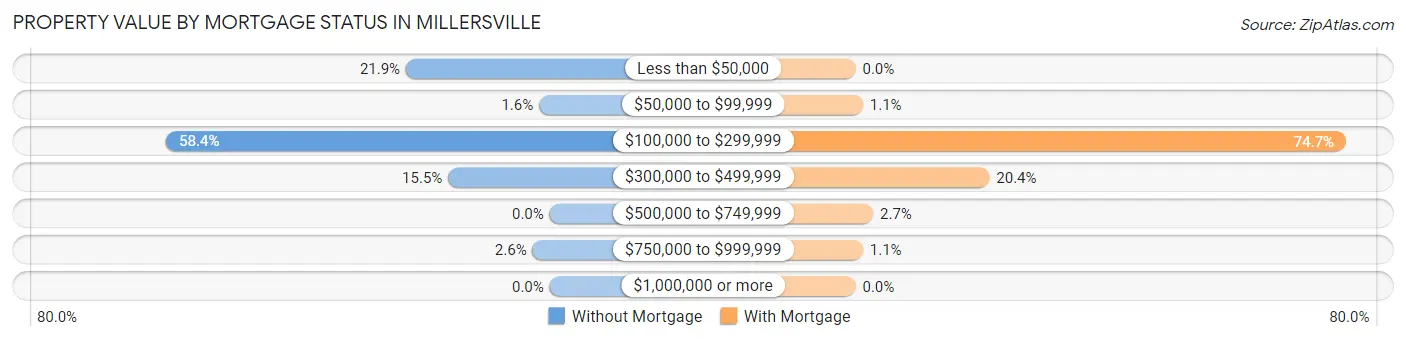
| Property Value | Without Mortgage | With Mortgage |
| Less than $50,000 | 109 (21.9%) | 0 (0.0%) |
| $50,000 to $99,999 | 8 (1.6%) | 12 (1.1%) |
| $100,000 to $299,999 | 291 (58.4%) | 810 (74.7%) |
| $300,000 to $499,999 | 77 (15.5%) | 221 (20.4%) |
| $500,000 to $749,999 | 0 (0.0%) | 29 (2.7%) |
| $750,000 to $999,999 | 13 (2.6%) | 12 (1.1%) |
| $1,000,000 or more | 0 (0.0%) | 0 (0.0%) |
| Total | 498 (100.0%) | 1,084 (100.0%) |
Household Income by Mortgage Status in Millersville
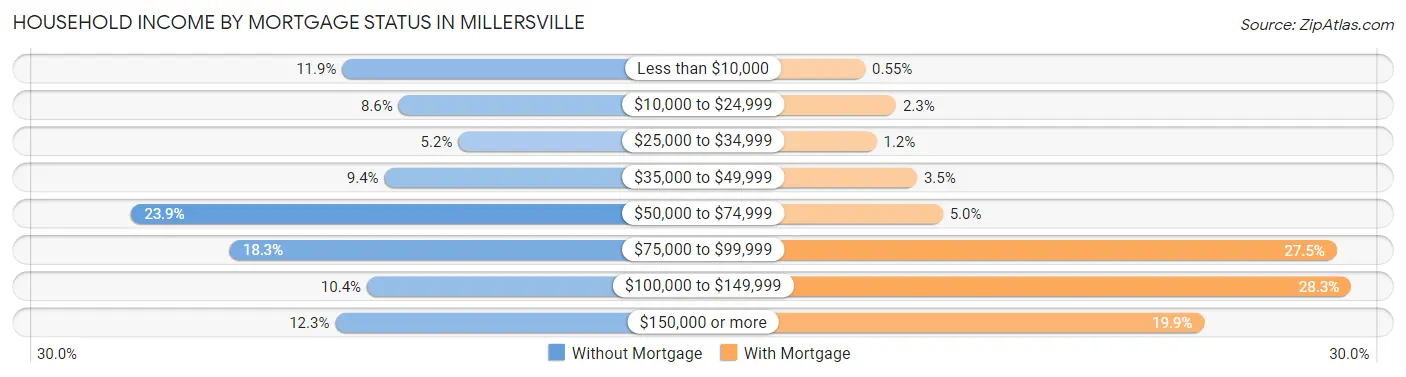
| Household Income | Without Mortgage | With Mortgage |
| Less than $10,000 | 59 (11.8%) | 6 (0.5%) |
| $10,000 to $24,999 | 43 (8.6%) | 25 (2.3%) |
| $25,000 to $34,999 | 26 (5.2%) | 13 (1.2%) |
| $35,000 to $49,999 | 47 (9.4%) | 38 (3.5%) |
| $50,000 to $74,999 | 119 (23.9%) | 54 (5.0%) |
| $75,000 to $99,999 | 91 (18.3%) | 298 (27.5%) |
| $100,000 to $149,999 | 52 (10.4%) | 307 (28.3%) |
| $150,000 or more | 61 (12.2%) | 216 (19.9%) |
| Total | 498 (100.0%) | 1,084 (100.0%) |
Property Value to Household Income Ratio in Millersville
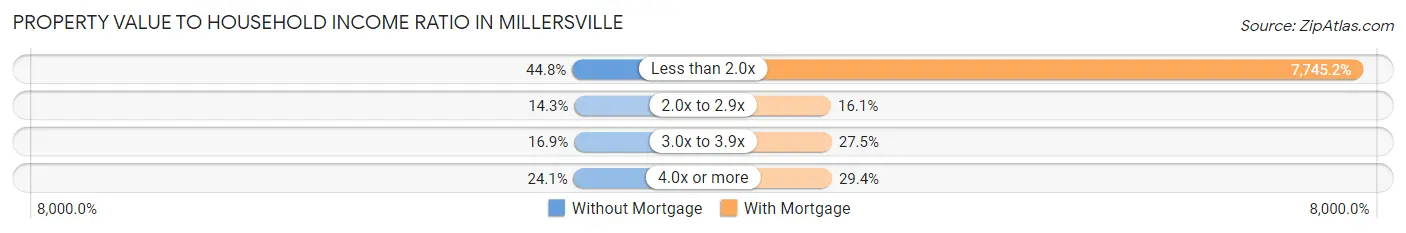
| Value-to-Income Ratio | Without Mortgage | With Mortgage |
| Less than 2.0x | 223 (44.8%) | 83,958 (7,745.2%) |
| 2.0x to 2.9x | 71 (14.3%) | 174 (16.1%) |
| 3.0x to 3.9x | 84 (16.9%) | 298 (27.5%) |
| 4.0x or more | 120 (24.1%) | 319 (29.4%) |
| Total | 498 (100.0%) | 1,084 (100.0%) |
Real Estate Taxes by Mortgage Status in Millersville
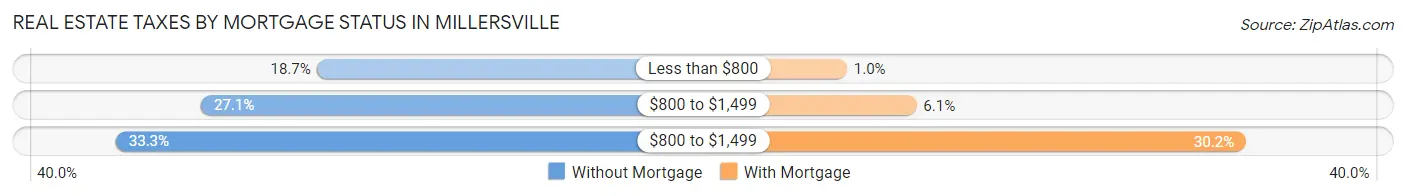
| Property Taxes | Without Mortgage | With Mortgage |
| Less than $800 | 93 (18.7%) | 11 (1.0%) |
| $800 to $1,499 | 135 (27.1%) | 66 (6.1%) |
| $800 to $1,499 | 166 (33.3%) | 327 (30.2%) |
| Total | 498 (100.0%) | 1,084 (100.0%) |
Health & Disability in Millersville
Health Insurance Coverage by Age in Millersville
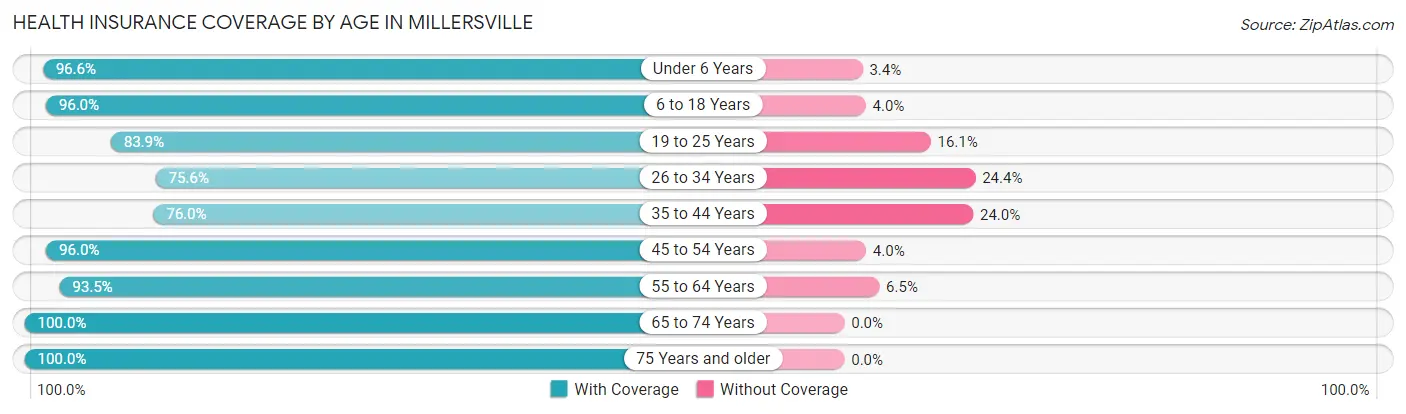
| Age Bracket | With Coverage | Without Coverage |
| Under 6 Years | 257 (96.6%) | 9 (3.4%) |
| 6 to 18 Years | 1,041 (96.0%) | 43 (4.0%) |
| 19 to 25 Years | 407 (83.9%) | 78 (16.1%) |
| 26 to 34 Years | 523 (75.6%) | 169 (24.4%) |
| 35 to 44 Years | 595 (76.0%) | 188 (24.0%) |
| 45 to 54 Years | 476 (96.0%) | 20 (4.0%) |
| 55 to 64 Years | 892 (93.5%) | 62 (6.5%) |
| 65 to 74 Years | 846 (100.0%) | 0 (0.0%) |
| 75 Years and older | 212 (100.0%) | 0 (0.0%) |
| Total | 5,249 (90.2%) | 569 (9.8%) |
Health Insurance Coverage by Citizenship Status in Millersville
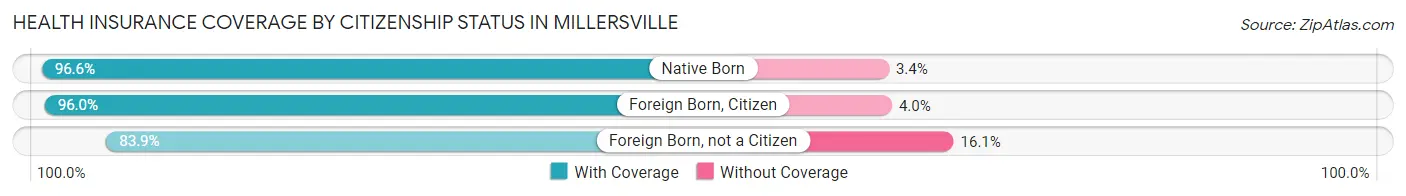
| Citizenship Status | With Coverage | Without Coverage |
| Native Born | 257 (96.6%) | 9 (3.4%) |
| Foreign Born, Citizen | 1,041 (96.0%) | 43 (4.0%) |
| Foreign Born, not a Citizen | 407 (83.9%) | 78 (16.1%) |
Health Insurance Coverage by Household Income in Millersville
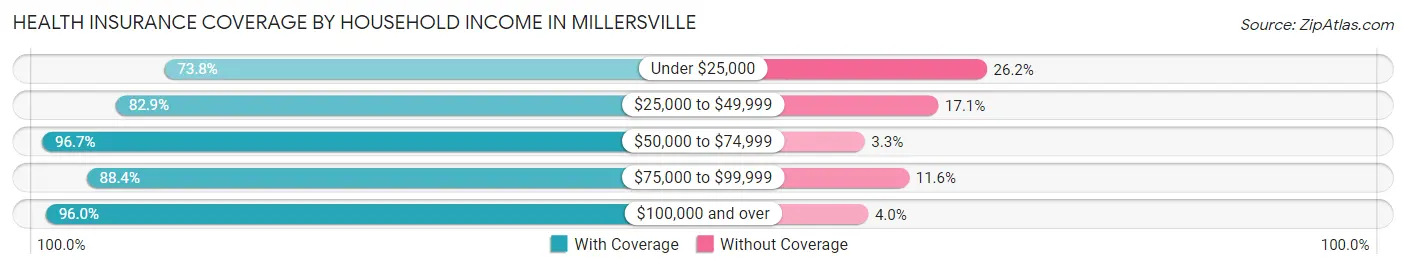
| Household Income | With Coverage | Without Coverage |
| Under $25,000 | 231 (73.8%) | 82 (26.2%) |
| $25,000 to $49,999 | 940 (82.9%) | 194 (17.1%) |
| $50,000 to $74,999 | 997 (96.7%) | 34 (3.3%) |
| $75,000 to $99,999 | 1,430 (88.4%) | 188 (11.6%) |
| $100,000 and over | 1,651 (96.0%) | 68 (4.0%) |
Public vs Private Health Insurance Coverage by Age in Millersville
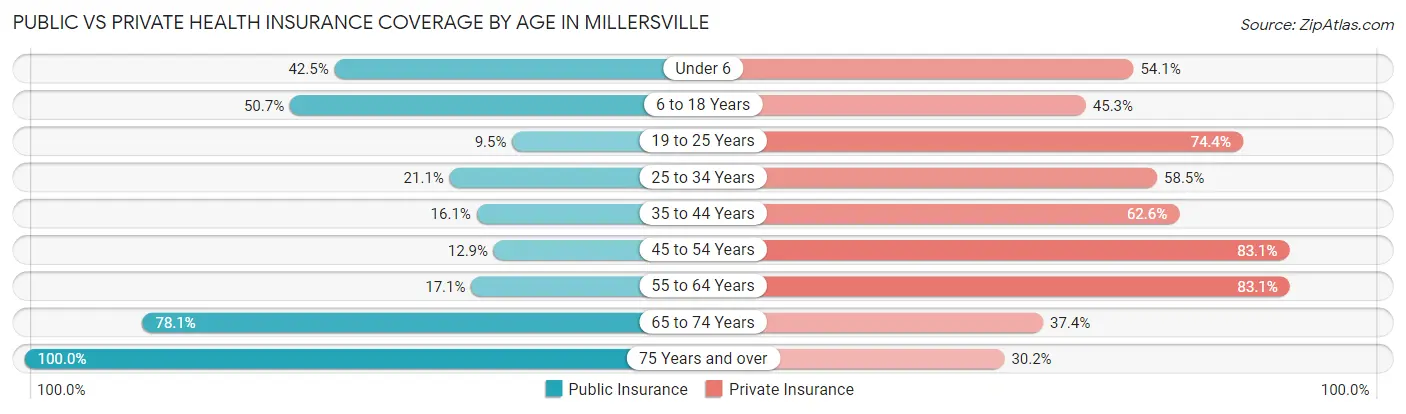
| Age Bracket | Public Insurance | Private Insurance |
| Under 6 | 113 (42.5%) | 144 (54.1%) |
| 6 to 18 Years | 550 (50.7%) | 491 (45.3%) |
| 19 to 25 Years | 46 (9.5%) | 361 (74.4%) |
| 25 to 34 Years | 146 (21.1%) | 405 (58.5%) |
| 35 to 44 Years | 126 (16.1%) | 490 (62.6%) |
| 45 to 54 Years | 64 (12.9%) | 412 (83.1%) |
| 55 to 64 Years | 163 (17.1%) | 793 (83.1%) |
| 65 to 74 Years | 661 (78.1%) | 316 (37.3%) |
| 75 Years and over | 212 (100.0%) | 64 (30.2%) |
| Total | 2,081 (35.8%) | 3,476 (59.8%) |
Disability Status by Sex by Age in Millersville
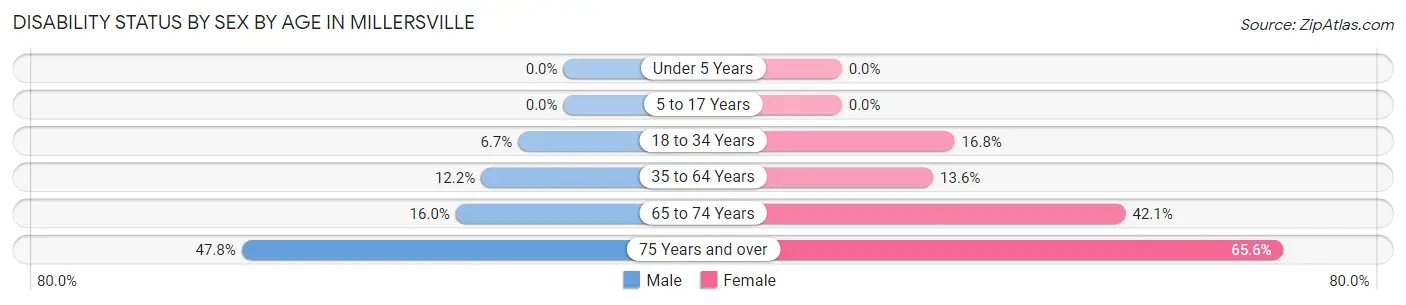
| Age Bracket | Male | Female |
| Under 5 Years | 0 (0.0%) | 0 (0.0%) |
| 5 to 17 Years | 0 (0.0%) | 0 (0.0%) |
| 18 to 34 Years | 46 (6.7%) | 93 (16.8%) |
| 35 to 64 Years | 138 (12.2%) | 150 (13.6%) |
| 65 to 74 Years | 59 (16.0%) | 201 (42.1%) |
| 75 Years and over | 43 (47.8%) | 80 (65.6%) |
Disability Class by Sex by Age in Millersville
Disability Class: Hearing Difficulty
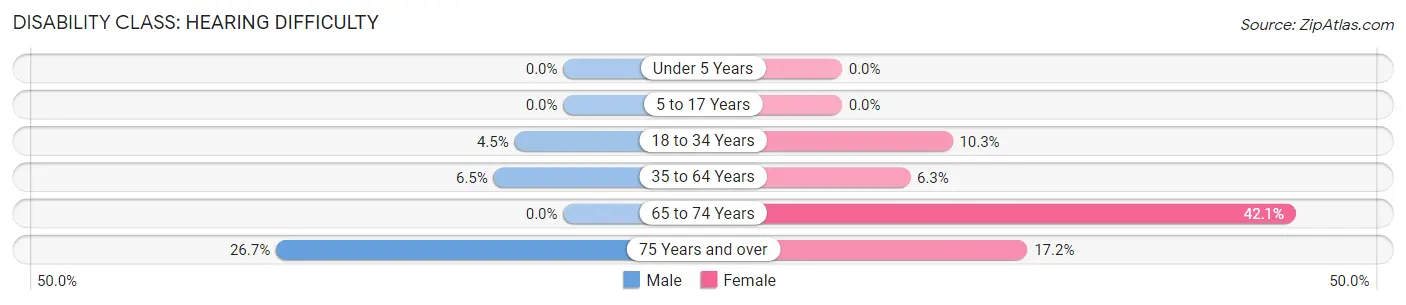
| Age Bracket | Male | Female |
| Under 5 Years | 0 (0.0%) | 0 (0.0%) |
| 5 to 17 Years | 0 (0.0%) | 0 (0.0%) |
| 18 to 34 Years | 31 (4.5%) | 57 (10.3%) |
| 35 to 64 Years | 73 (6.5%) | 70 (6.3%) |
| 65 to 74 Years | 0 (0.0%) | 201 (42.1%) |
| 75 Years and over | 24 (26.7%) | 21 (17.2%) |
Disability Class: Vision Difficulty
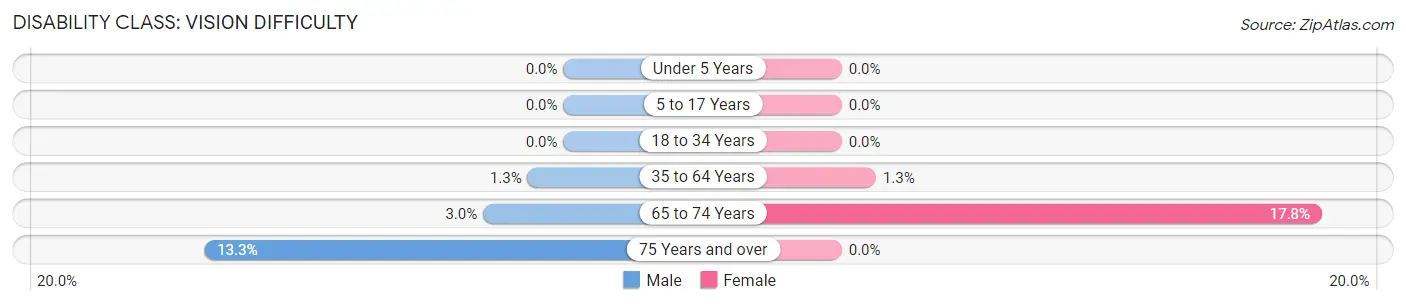
| Age Bracket | Male | Female |
| Under 5 Years | 0 (0.0%) | 0 (0.0%) |
| 5 to 17 Years | 0 (0.0%) | 0 (0.0%) |
| 18 to 34 Years | 0 (0.0%) | 0 (0.0%) |
| 35 to 64 Years | 15 (1.3%) | 14 (1.3%) |
| 65 to 74 Years | 11 (3.0%) | 85 (17.8%) |
| 75 Years and over | 12 (13.3%) | 0 (0.0%) |
Disability Class: Cognitive Difficulty
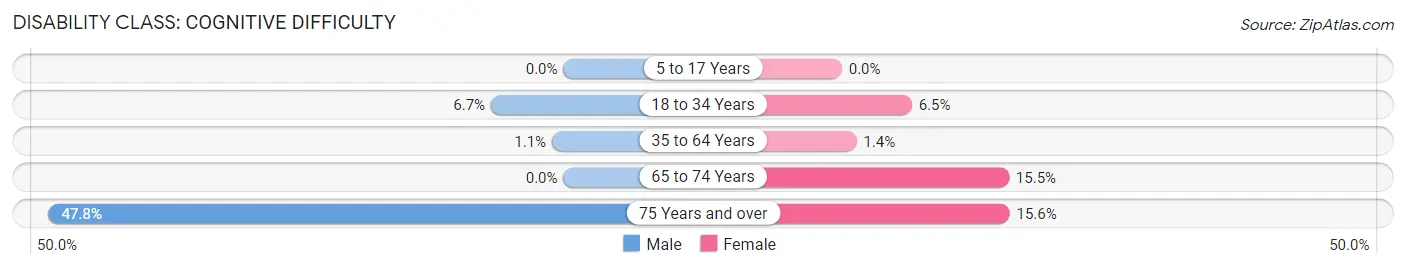
| Age Bracket | Male | Female |
| 5 to 17 Years | 0 (0.0%) | 0 (0.0%) |
| 18 to 34 Years | 46 (6.7%) | 36 (6.5%) |
| 35 to 64 Years | 12 (1.1%) | 15 (1.4%) |
| 65 to 74 Years | 0 (0.0%) | 74 (15.5%) |
| 75 Years and over | 43 (47.8%) | 19 (15.6%) |
Disability Class: Ambulatory Difficulty
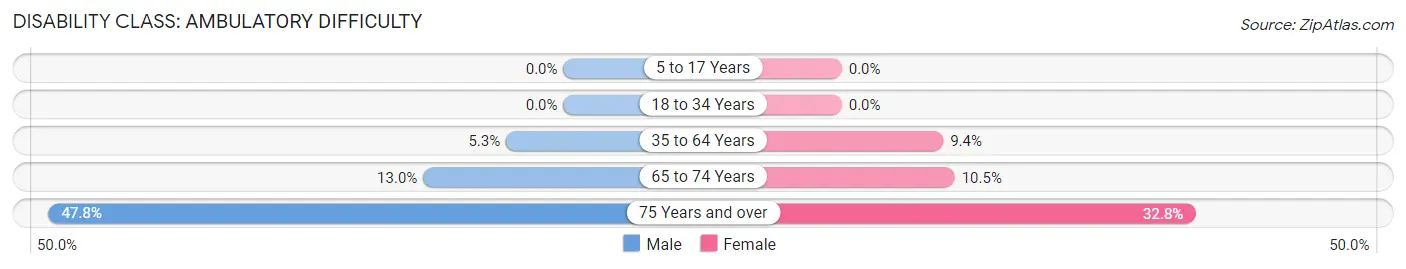
| Age Bracket | Male | Female |
| 5 to 17 Years | 0 (0.0%) | 0 (0.0%) |
| 18 to 34 Years | 0 (0.0%) | 0 (0.0%) |
| 35 to 64 Years | 60 (5.3%) | 104 (9.4%) |
| 65 to 74 Years | 48 (13.0%) | 50 (10.5%) |
| 75 Years and over | 43 (47.8%) | 40 (32.8%) |
Disability Class: Self-Care Difficulty
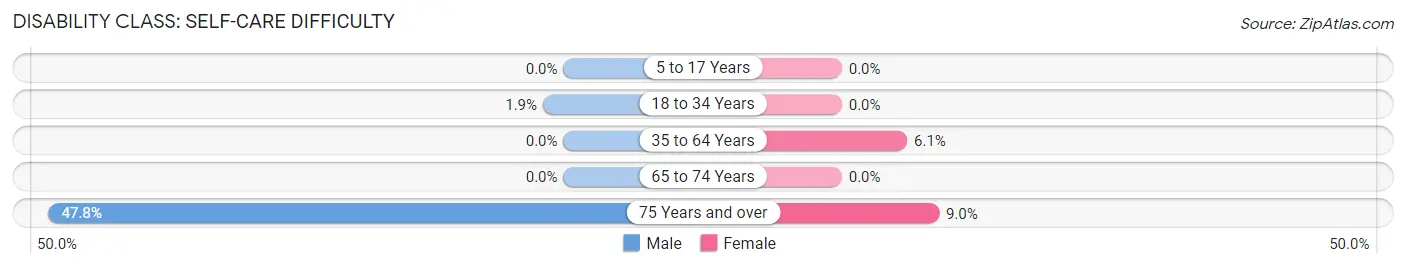
| Age Bracket | Male | Female |
| 5 to 17 Years | 0 (0.0%) | 0 (0.0%) |
| 18 to 34 Years | 13 (1.9%) | 0 (0.0%) |
| 35 to 64 Years | 0 (0.0%) | 67 (6.1%) |
| 65 to 74 Years | 0 (0.0%) | 0 (0.0%) |
| 75 Years and over | 43 (47.8%) | 11 (9.0%) |
Technology Access in Millersville
Computing Device Access in Millersville
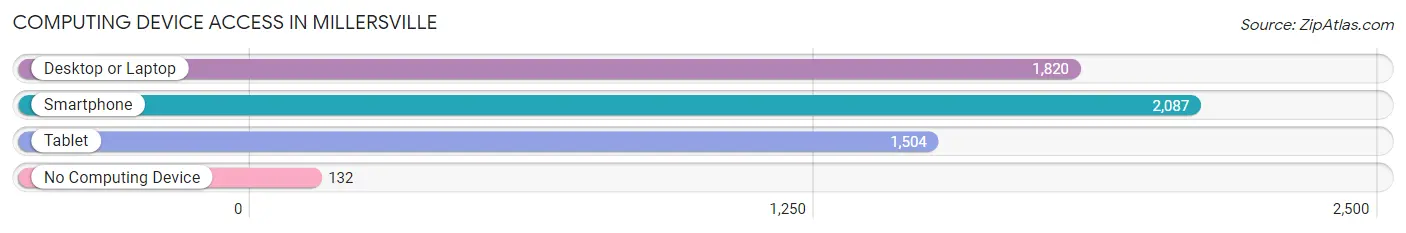
| Device Type | # Households | % Households |
| Desktop or Laptop | 1,820 | 77.1% |
| Smartphone | 2,087 | 88.5% |
| Tablet | 1,504 | 63.8% |
| No Computing Device | 132 | 5.6% |
| Total | 2,359 | 100.0% |
Internet Access in Millersville
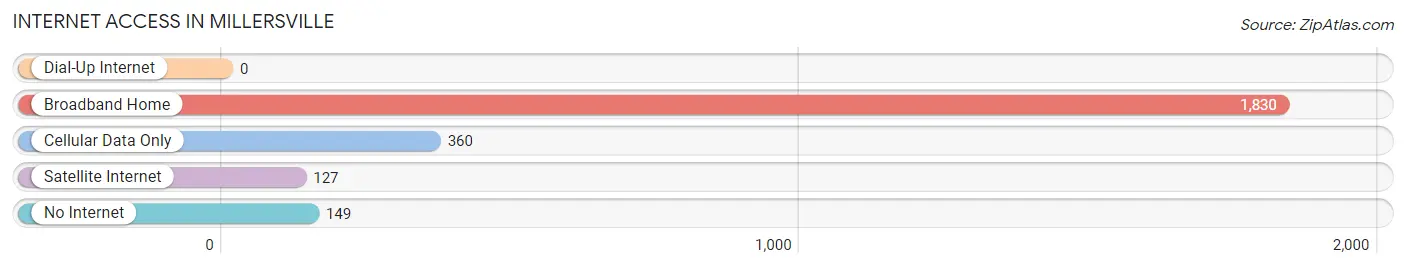
| Internet Type | # Households | % Households |
| Dial-Up Internet | 0 | 0.0% |
| Broadband Home | 1,830 | 77.6% |
| Cellular Data Only | 360 | 15.3% |
| Satellite Internet | 127 | 5.4% |
| No Internet | 149 | 6.3% |
| Total | 2,359 | 100.0% |
Millersville Summary
Millerville is a small town located in the state of Tennessee, in the United States. It is situated in the southern part of the state, in the foothills of the Appalachian Mountains. The town is located in the county of Maury, and is part of the Nashville metropolitan area. The population of Millerville was estimated to be 1,845 in 2019.
History
Millerville was founded in 1820 by a group of settlers from North Carolina. The town was named after the Miller family, who were among the first settlers. The town was originally a farming community, and the main crops grown were cotton, corn, and tobacco. The town was also known for its production of whiskey, which was made from the local corn and rye.
In the late 19th century, the town began to grow and develop. The railroad was built through the town, and the town became a stop on the Nashville and Chattanooga Railroad. This allowed the town to become a center for trade and commerce. The town also became a popular tourist destination, as it was close to the Great Smoky Mountains National Park.
Geography
Millerville is located in the southern part of the state of Tennessee, in the foothills of the Appalachian Mountains. The town is situated in the county of Maury, and is part of the Nashville metropolitan area. The town is located at an elevation of 845 feet above sea level. The town is located near the Duck River, which is a tributary of the Tennessee River.
The climate in Millerville is humid subtropical, with hot summers and mild winters. The average annual temperature is around 64 degrees Fahrenheit. The average annual precipitation is around 45 inches.
Economy
The economy of Millerville is largely based on agriculture and tourism. The town is home to several farms, which produce a variety of crops, including corn, soybeans, cotton, and tobacco. The town is also home to several wineries, which produce a variety of wines.
The town is also a popular tourist destination, as it is close to the Great Smoky Mountains National Park. The town is home to several bed and breakfasts, as well as several restaurants and shops. The town also hosts several festivals throughout the year, including the Millerville Music Festival and the Millerville Fall Festival.
Demographics
The population of Millerville was estimated to be 1,845 in 2019. The population is predominantly white, with a small percentage of African Americans and Hispanics. The median household income in Millerville is around $45,000, and the median home value is around $150,000. The town has a low unemployment rate, and the poverty rate is below the national average.
Millerville is a small town with a rich history and a vibrant economy. The town is home to several farms, wineries, and tourist attractions, and is a popular destination for visitors from all over the world. The town is also home to a diverse population, with a variety of backgrounds and cultures. Millerville is a great place to live, work, and visit.
Common Questions
What is Per Capita Income in Millersville?
Per Capita income in Millersville is $32,240.
What is the Median Family Income in Millersville?
Median Family Income in Millersville is $81,667.
What is the Median Household income in Millersville?
Median Household Income in Millersville is $67,445.
What is Income or Wage Gap in Millersville?
Income or Wage Gap in Millersville is 28.9%.
Women in Millersville earn 71.1 cents for every dollar earned by a man.
What is Inequality or Gini Index in Millersville?
Inequality or Gini Index in Millersville is 0.33.
What is the Total Population of Millersville?
Total Population of Millersville is 5,818.
What is the Total Male Population of Millersville?
Total Male Population of Millersville is 2,876.
What is the Total Female Population of Millersville?
Total Female Population of Millersville is 2,942.
What is the Ratio of Males per 100 Females in Millersville?
There are 97.76 Males per 100 Females in Millersville.
What is the Ratio of Females per 100 Males in Millersville?
There are 102.29 Females per 100 Males in Millersville.
What is the Median Population Age in Millersville?
Median Population Age in Millersville is 38.9 Years.
What is the Average Family Size in Millersville
Average Family Size in Millersville is 3.0 People.
What is the Average Household Size in Millersville
Average Household Size in Millersville is 2.5 People.
How Large is the Labor Force in Millersville?
There are 3,394 People in the Labor Forcein in Millersville.
What is the Percentage of People in the Labor Force in Millersville?
71.1% of People are in the Labor Force in Millersville.
What is the Unemployment Rate in Millersville?
Unemployment Rate in Millersville is 2.3%.