Black Springs, AR Map & Demographics
Black Springs Map
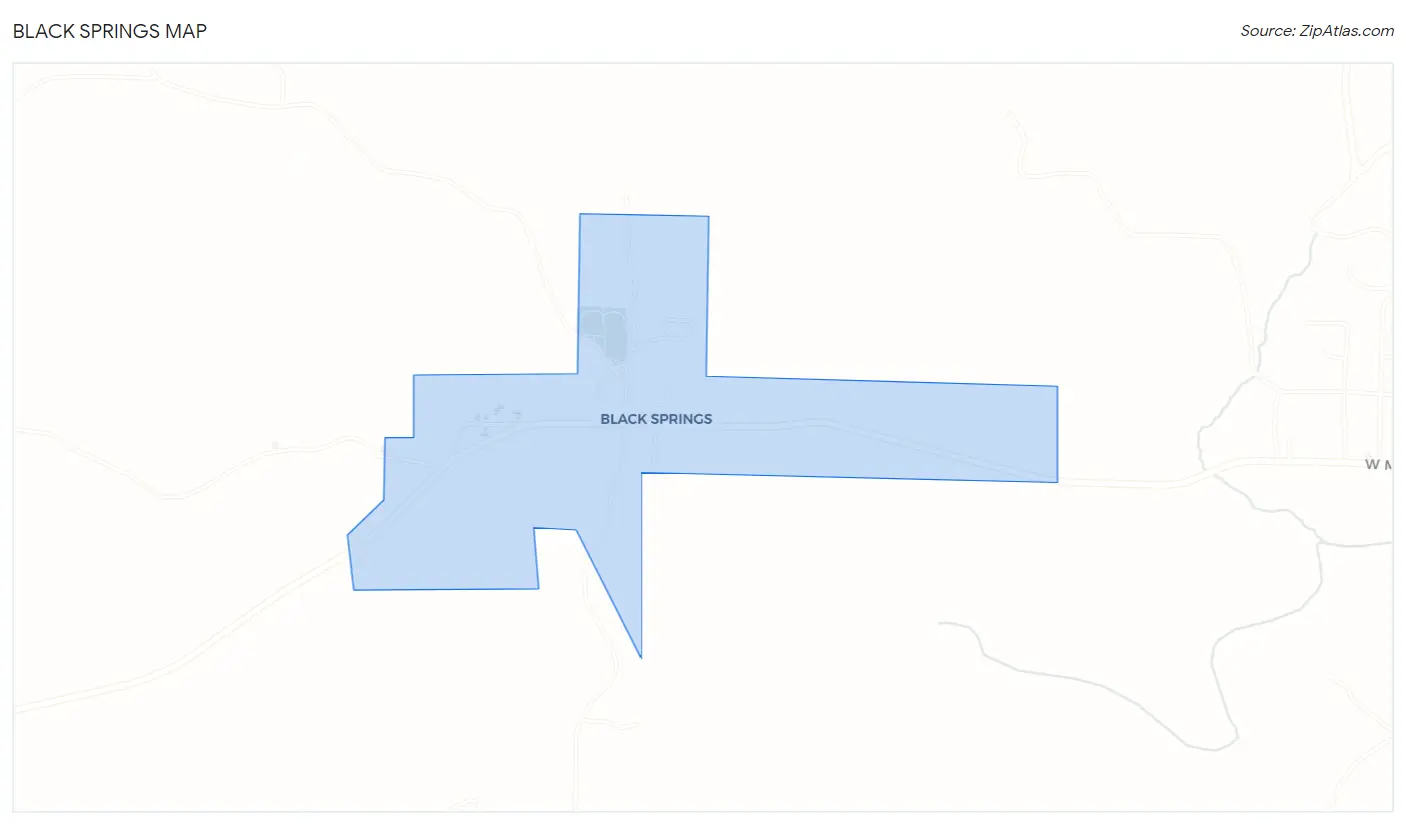
Black Springs Overview
$26,764
PER CAPITA INCOME
$55,000
AVG HOUSEHOLD INCOME
$5,367
FAMILY INCOME DEFICIT
0.41
INEQUALITY / GINI INDEX
89
TOTAL POPULATION
50
MALE POPULATION
39
FEMALE POPULATION
128.21
MALES / 100 FEMALES
78.00
FEMALES / 100 MALES
35.8
MEDIAN AGE
4.2
AVG FAMILY SIZE
3.4
AVG HOUSEHOLD SIZE
22
LABOR FORCE [ PEOPLE ]
31.0%
PERCENT IN LABOR FORCE
18.2%
UNEMPLOYMENT RATE
Income in Black Springs
Income Overview in Black Springs
| Characteristic | Number | Measure |
| Per Capita Income | 89 | $26,764 |
| Median Family Income | 19 | $0 |
| Mean Family Income | 19 | $90,716 |
| Median Household Income | 26 | $55,000 |
| Mean Household Income | 26 | $82,400 |
| Income Deficit | 19 | $5,367 |
| Wage / Income Gap (%) | 89 | 0.00% |
| Wage / Income Gap ($) | 89 | 100.00¢ per $1 |
| Gini / Inequality Index | 89 | 0.41 |
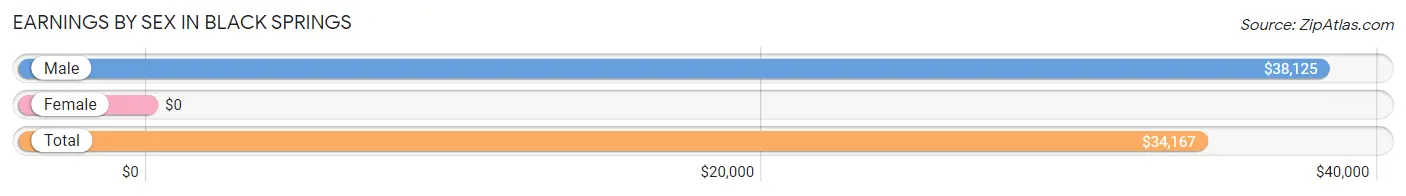
Earnings by Sex in Black Springs
| Sex | Number | Average Earnings |
| Male | 7 (29.2%) | $38,125 |
| Female | 17 (70.8%) | $0 |
| Total | 24 (100.0%) | $34,167 |
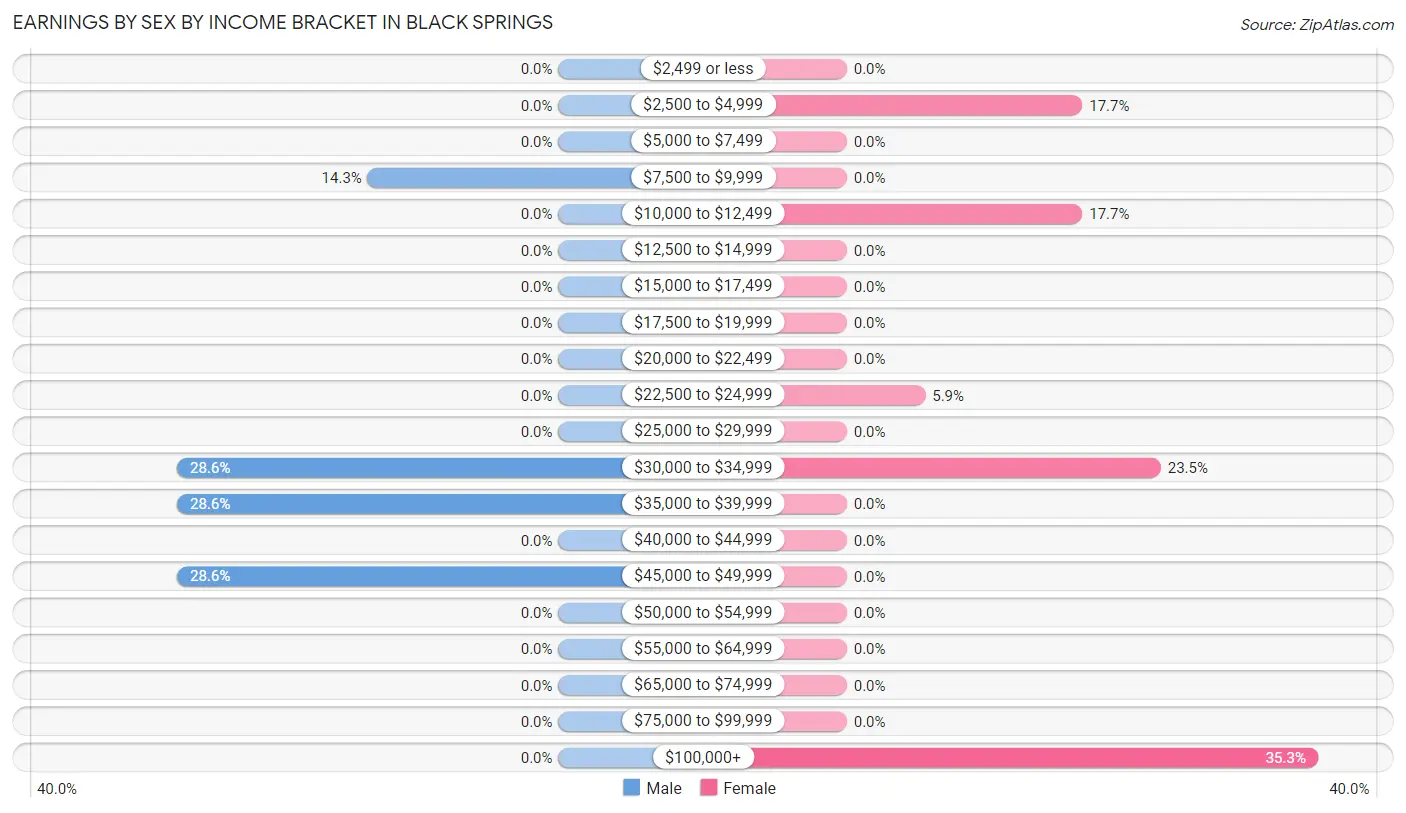
Earnings by Sex by Income Bracket in Black Springs
The most common earnings brackets in Black Springs are $30,000 to $34,999 for men (2 | 28.6%) and $100,000+ for women (6 | 35.3%).
| Income | Male | Female |
| $2,499 or less | 0 (0.0%) | 0 (0.0%) |
| $2,500 to $4,999 | 0 (0.0%) | 3 (17.6%) |
| $5,000 to $7,499 | 0 (0.0%) | 0 (0.0%) |
| $7,500 to $9,999 | 1 (14.3%) | 0 (0.0%) |
| $10,000 to $12,499 | 0 (0.0%) | 3 (17.6%) |
| $12,500 to $14,999 | 0 (0.0%) | 0 (0.0%) |
| $15,000 to $17,499 | 0 (0.0%) | 0 (0.0%) |
| $17,500 to $19,999 | 0 (0.0%) | 0 (0.0%) |
| $20,000 to $22,499 | 0 (0.0%) | 0 (0.0%) |
| $22,500 to $24,999 | 0 (0.0%) | 1 (5.9%) |
| $25,000 to $29,999 | 0 (0.0%) | 0 (0.0%) |
| $30,000 to $34,999 | 2 (28.6%) | 4 (23.5%) |
| $35,000 to $39,999 | 2 (28.6%) | 0 (0.0%) |
| $40,000 to $44,999 | 0 (0.0%) | 0 (0.0%) |
| $45,000 to $49,999 | 2 (28.6%) | 0 (0.0%) |
| $50,000 to $54,999 | 0 (0.0%) | 0 (0.0%) |
| $55,000 to $64,999 | 0 (0.0%) | 0 (0.0%) |
| $65,000 to $74,999 | 0 (0.0%) | 0 (0.0%) |
| $75,000 to $99,999 | 0 (0.0%) | 0 (0.0%) |
| $100,000+ | 0 (0.0%) | 6 (35.3%) |
| Total | 7 (100.0%) | 17 (100.0%) |
Earnings by Sex by Educational Attainment in Black Springs
| Educational Attainment | Male Income | Female Income |
| Less than High School | - | - |
| High School Diploma | - | - |
| College or Associate's Degree | - | - |
| Bachelor's Degree | - | - |
| Graduate Degree | - | - |
| Total | $38,750 | $0 |
Family Income in Black Springs
Family Income Brackets in Black Springs
According to the Black Springs family income data, there are 6 families falling into the $150,000 to $199,999 income range, which is the most common income bracket and makes up 31.6% of all families.
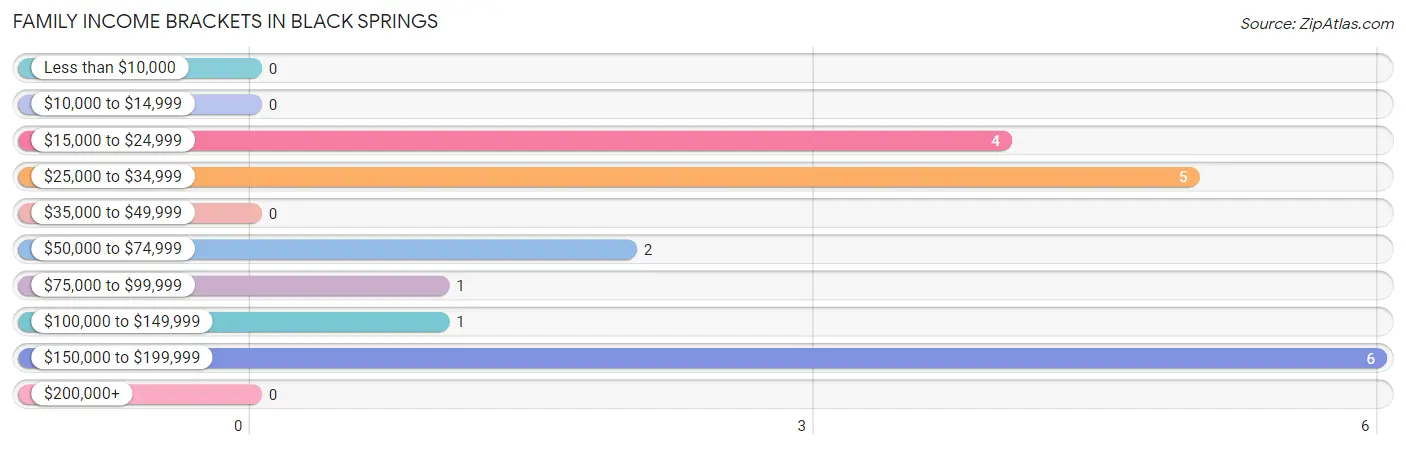
| Income Bracket | # Families | % Families |
| Less than $10,000 | 0 | 0.0% |
| $10,000 to $14,999 | 0 | 0.0% |
| $15,000 to $24,999 | 4 | 21.1% |
| $25,000 to $34,999 | 5 | 26.3% |
| $35,000 to $49,999 | 0 | 0.0% |
| $50,000 to $74,999 | 2 | 10.5% |
| $75,000 to $99,999 | 1 | 5.3% |
| $100,000 to $149,999 | 1 | 5.3% |
| $150,000 to $199,999 | 6 | 31.6% |
| $200,000+ | 0 | 0.0% |
Family Income by Famaliy Size in Black Springs
5-person families (4 | 21.0%) account for the highest median family income in Black Springs with $47,500 per family, while 5-person families (4 | 21.0%) have the highest median income of $9,500 per family member.
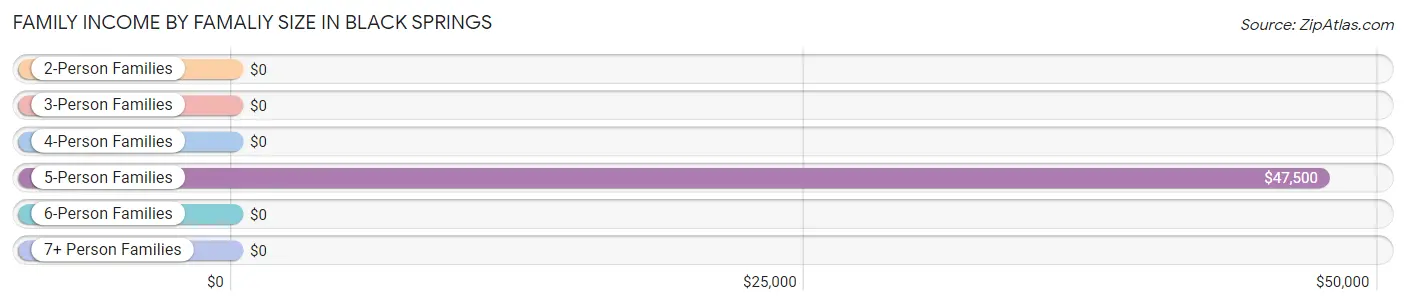
| Income Bracket | # Families | Median Income |
| 2-Person Families | 9 (47.4%) | $0 |
| 3-Person Families | 6 (31.6%) | $0 |
| 4-Person Families | 0 (0.0%) | $0 |
| 5-Person Families | 4 (21.0%) | $47,500 |
| 6-Person Families | 0 (0.0%) | $0 |
| 7+ Person Families | 0 (0.0%) | $0 |
| Total | 19 (100.0%) | $0 |
Family Income by Number of Earners in Black Springs
| Number of Earners | # Families | Median Income |
| No Earners | 2 (10.5%) | $0 |
| 1 Earner | 16 (84.2%) | $0 |
| 2 Earners | 1 (5.3%) | $0 |
| 3+ Earners | 0 (0.0%) | $0 |
| Total | 19 (100.0%) | $0 |
Household Income in Black Springs
Household Income Brackets in Black Springs
With 6 households falling in the category, the $150,000 to $199,999 income range is the most frequent in Black Springs, accounting for 23.1% of all households.
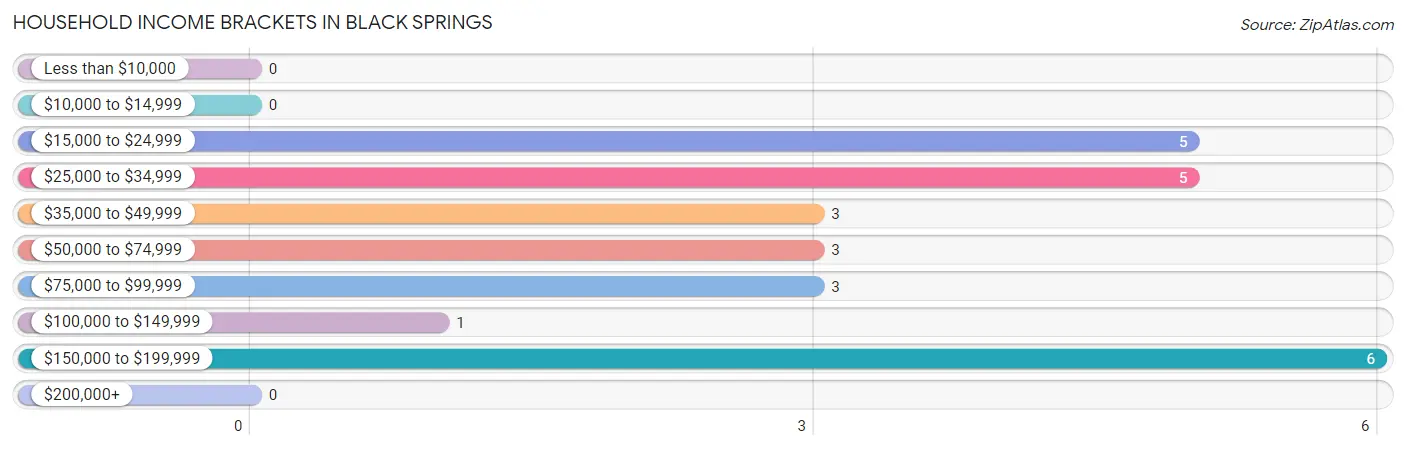
| Income Bracket | # Households | % Households |
| Less than $10,000 | 0 | 0.0% |
| $10,000 to $14,999 | 0 | 0.0% |
| $15,000 to $24,999 | 5 | 19.2% |
| $25,000 to $34,999 | 5 | 19.2% |
| $35,000 to $49,999 | 3 | 11.5% |
| $50,000 to $74,999 | 3 | 11.5% |
| $75,000 to $99,999 | 3 | 11.5% |
| $100,000 to $149,999 | 1 | 3.8% |
| $150,000 to $199,999 | 6 | 23.1% |
| $200,000+ | 0 | 0.0% |
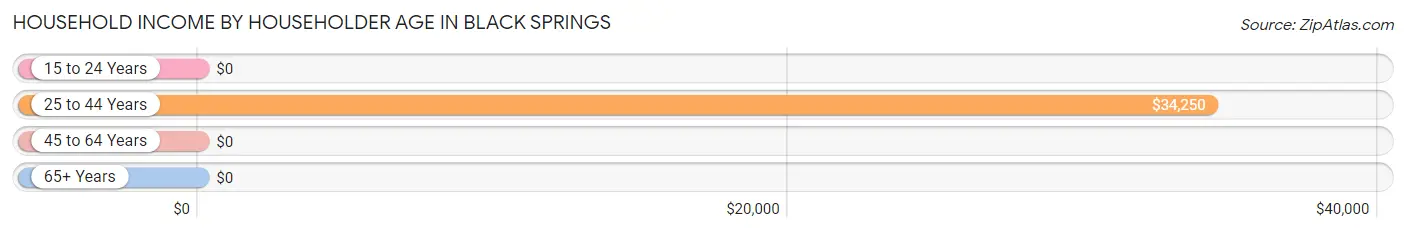
Household Income by Householder Age in Black Springs
The median household income in Black Springs is $55,000, with the highest median household income of $34,250 found in the 25 to 44 years age bracket for the primary householder. A total of 7 households (26.9%) fall into this category.
| Income Bracket | # Households | Median Income |
| 15 to 24 Years | 0 (0.0%) | $0 |
| 25 to 44 Years | 7 (26.9%) | $34,250 |
| 45 to 64 Years | 13 (50.0%) | $0 |
| 65+ Years | 6 (23.1%) | $0 |
| Total | 26 (100.0%) | $55,000 |
Poverty in Black Springs
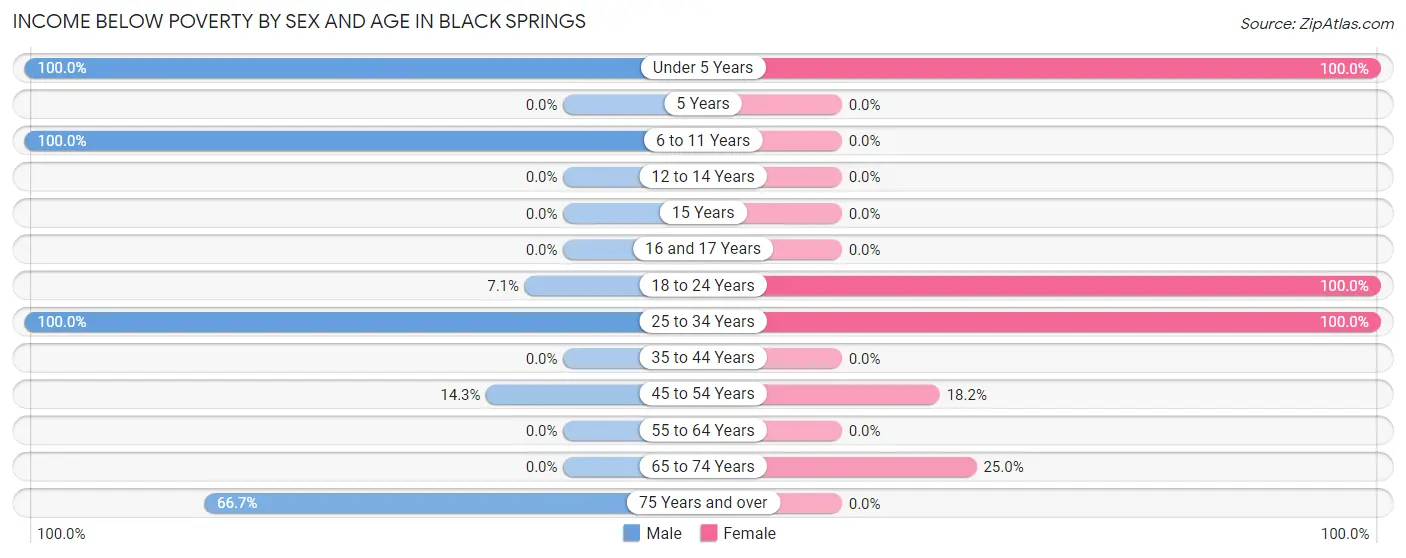
Income Below Poverty by Sex and Age in Black Springs
With 18.0% poverty level for males and 25.6% for females among the residents of Black Springs, under 5 year old males and under 5 year old females are the most vulnerable to poverty, with 2 males (100.0%) and 3 females (100.0%) in their respective age groups living below the poverty level.
| Age Bracket | Male | Female |
| Under 5 Years | 2 (100.0%) | 3 (100.0%) |
| 5 Years | 0 (0.0%) | 0 (0.0%) |
| 6 to 11 Years | 1 (100.0%) | 0 (0.0%) |
| 12 to 14 Years | 0 (0.0%) | 0 (0.0%) |
| 15 Years | 0 (0.0%) | 0 (0.0%) |
| 16 and 17 Years | 0 (0.0%) | 0 (0.0%) |
| 18 to 24 Years | 1 (7.1%) | 3 (100.0%) |
| 25 to 34 Years | 2 (100.0%) | 1 (100.0%) |
| 35 to 44 Years | 0 (0.0%) | 0 (0.0%) |
| 45 to 54 Years | 1 (14.3%) | 2 (18.2%) |
| 55 to 64 Years | 0 (0.0%) | 0 (0.0%) |
| 65 to 74 Years | 0 (0.0%) | 1 (25.0%) |
| 75 Years and over | 2 (66.7%) | 0 (0.0%) |
| Total | 9 (18.0%) | 10 (25.6%) |
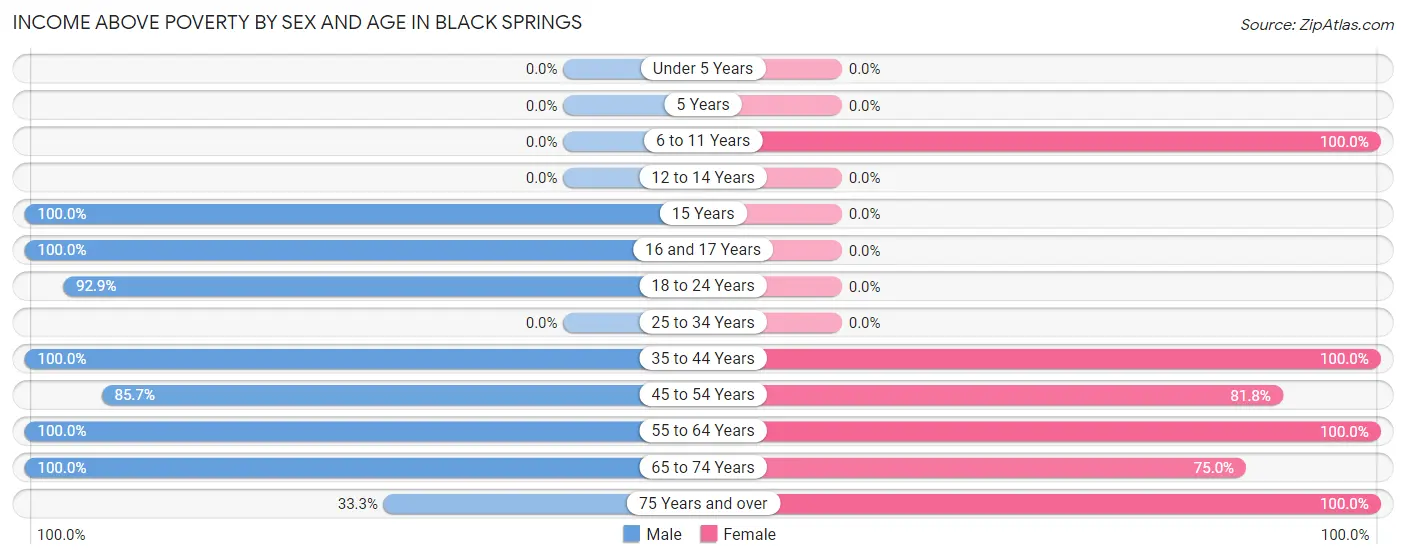
Income Above Poverty by Sex and Age in Black Springs
According to the poverty statistics in Black Springs, males aged 15 years and females aged 6 to 11 years are the age groups that are most secure financially, with 100.0% of males and 100.0% of females in these age groups living above the poverty line.
| Age Bracket | Male | Female |
| Under 5 Years | 0 (0.0%) | 0 (0.0%) |
| 5 Years | 0 (0.0%) | 0 (0.0%) |
| 6 to 11 Years | 0 (0.0%) | 4 (100.0%) |
| 12 to 14 Years | 0 (0.0%) | 0 (0.0%) |
| 15 Years | 8 (100.0%) | 0 (0.0%) |
| 16 and 17 Years | 5 (100.0%) | 0 (0.0%) |
| 18 to 24 Years | 13 (92.9%) | 0 (0.0%) |
| 25 to 34 Years | 0 (0.0%) | 0 (0.0%) |
| 35 to 44 Years | 2 (100.0%) | 6 (100.0%) |
| 45 to 54 Years | 6 (85.7%) | 9 (81.8%) |
| 55 to 64 Years | 5 (100.0%) | 2 (100.0%) |
| 65 to 74 Years | 1 (100.0%) | 3 (75.0%) |
| 75 Years and over | 1 (33.3%) | 5 (100.0%) |
| Total | 41 (82.0%) | 29 (74.4%) |
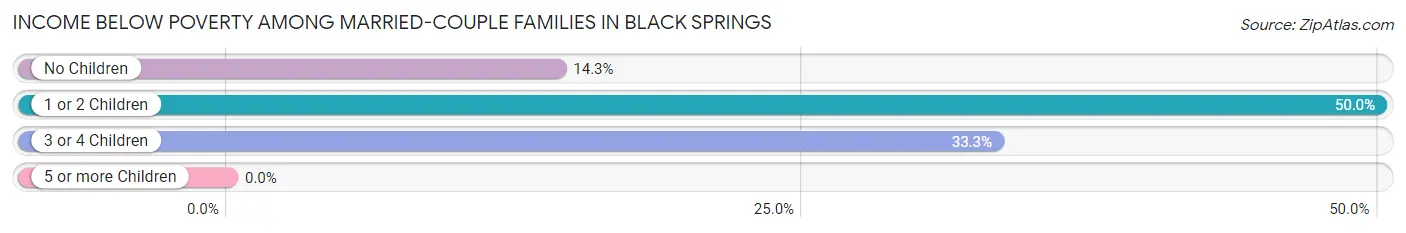
Income Below Poverty Among Married-Couple Families in Black Springs
The poverty statistics for married-couple families in Black Springs show that 25.0% or 3 of the total 12 families live below the poverty line. Families with 1 or 2 children have the highest poverty rate of 50.0%, comprising of 1 families. On the other hand, families with no children have the lowest poverty rate of 14.3%, which includes 1 families.
| Children | Above Poverty | Below Poverty |
| No Children | 6 (85.7%) | 1 (14.3%) |
| 1 or 2 Children | 1 (50.0%) | 1 (50.0%) |
| 3 or 4 Children | 2 (66.7%) | 1 (33.3%) |
| 5 or more Children | 0 (0.0%) | 0 (0.0%) |
| Total | 9 (75.0%) | 3 (25.0%) |
Income Below Poverty Among Single-Parent Households in Black Springs
| Children | Single Father | Single Mother |
| No Children | 0 (0.0%) | 0 (0.0%) |
| 1 or 2 Children | 0 (0.0%) | 0 (0.0%) |
| 3 or 4 Children | 0 (0.0%) | 0 (0.0%) |
| 5 or more Children | 0 (0.0%) | 0 (0.0%) |
| Total | 0 (0.0%) | 0 (0.0%) |
Income Below Poverty Among Married-Couple vs Single-Parent Households in Black Springs
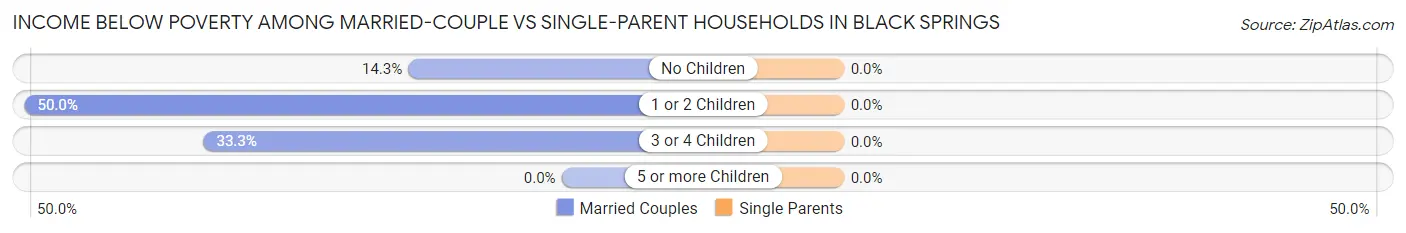
| Children | Married-Couple Families | Single-Parent Households |
| No Children | 1 (14.3%) | 0 (0.0%) |
| 1 or 2 Children | 1 (50.0%) | 0 (0.0%) |
| 3 or 4 Children | 1 (33.3%) | 0 (0.0%) |
| 5 or more Children | 0 (0.0%) | 0 (0.0%) |
| Total | 3 (25.0%) | 0 (0.0%) |
Race in Black Springs
The most populous races in Black Springs are White / Caucasian (83 | 93.3%), and Two or more Races (6 | 6.7%).
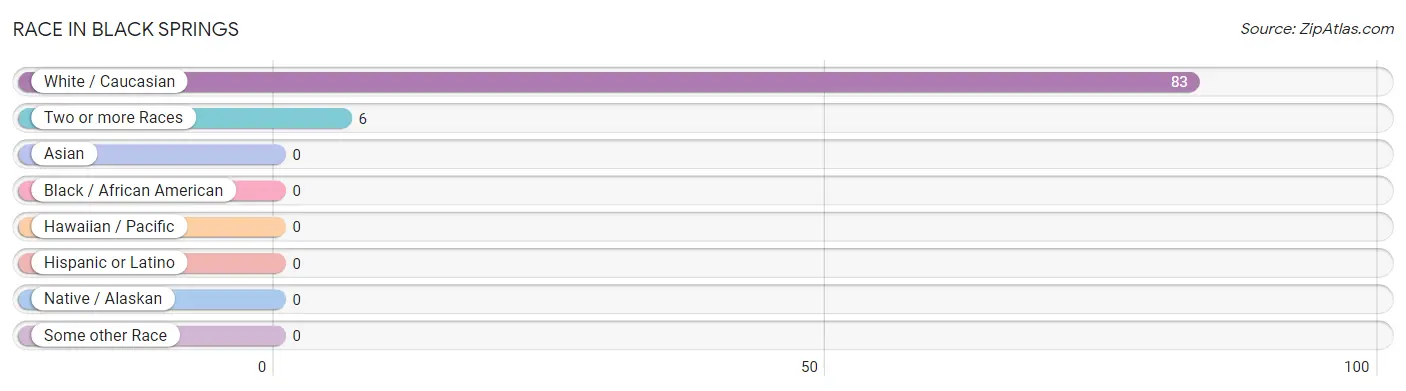
| Race | # Population | % Population |
| Asian | 0 | 0.0% |
| Black / African American | 0 | 0.0% |
| Hawaiian / Pacific | 0 | 0.0% |
| Hispanic or Latino | 0 | 0.0% |
| Native / Alaskan | 0 | 0.0% |
| White / Caucasian | 83 | 93.3% |
| Two or more Races | 6 | 6.7% |
| Some other Race | 0 | 0.0% |
| Total | 89 | 100.0% |
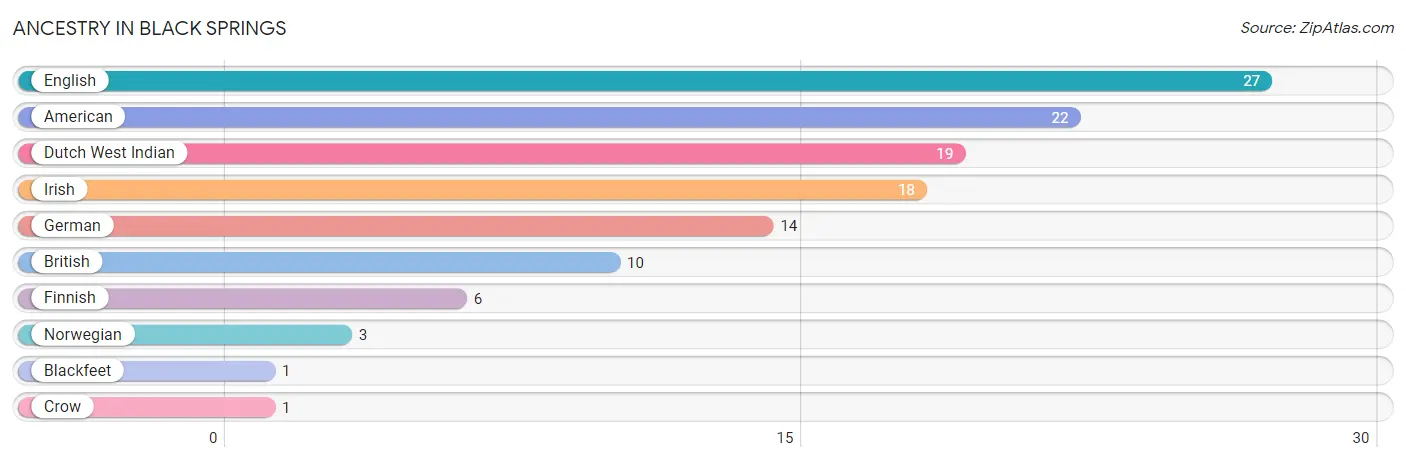
Ancestry in Black Springs
The most populous ancestries reported in Black Springs are English (27 | 30.3%), American (22 | 24.7%), Dutch West Indian (19 | 21.3%), Irish (18 | 20.2%), and German (14 | 15.7%), together accounting for 112.4% of all Black Springs residents.
| Ancestry | # Population | % Population |
| American | 22 | 24.7% |
| Blackfeet | 1 | 1.1% |
| British | 10 | 11.2% |
| Crow | 1 | 1.1% |
| Dutch West Indian | 19 | 21.3% |
| English | 27 | 30.3% |
| Finnish | 6 | 6.7% |
| German | 14 | 15.7% |
| Irish | 18 | 20.2% |
| Norwegian | 3 | 3.4% | View All 10 Rows |
Immigrants in Black Springs

| Immigration Origin | # Population | % Population | View All 0 Rows |
Sex and Age in Black Springs
Sex and Age in Black Springs
The most populous age groups in Black Springs are 15 to 19 Years (26 | 52.0%) for men and 50 to 54 Years (9 | 23.1%) for women.
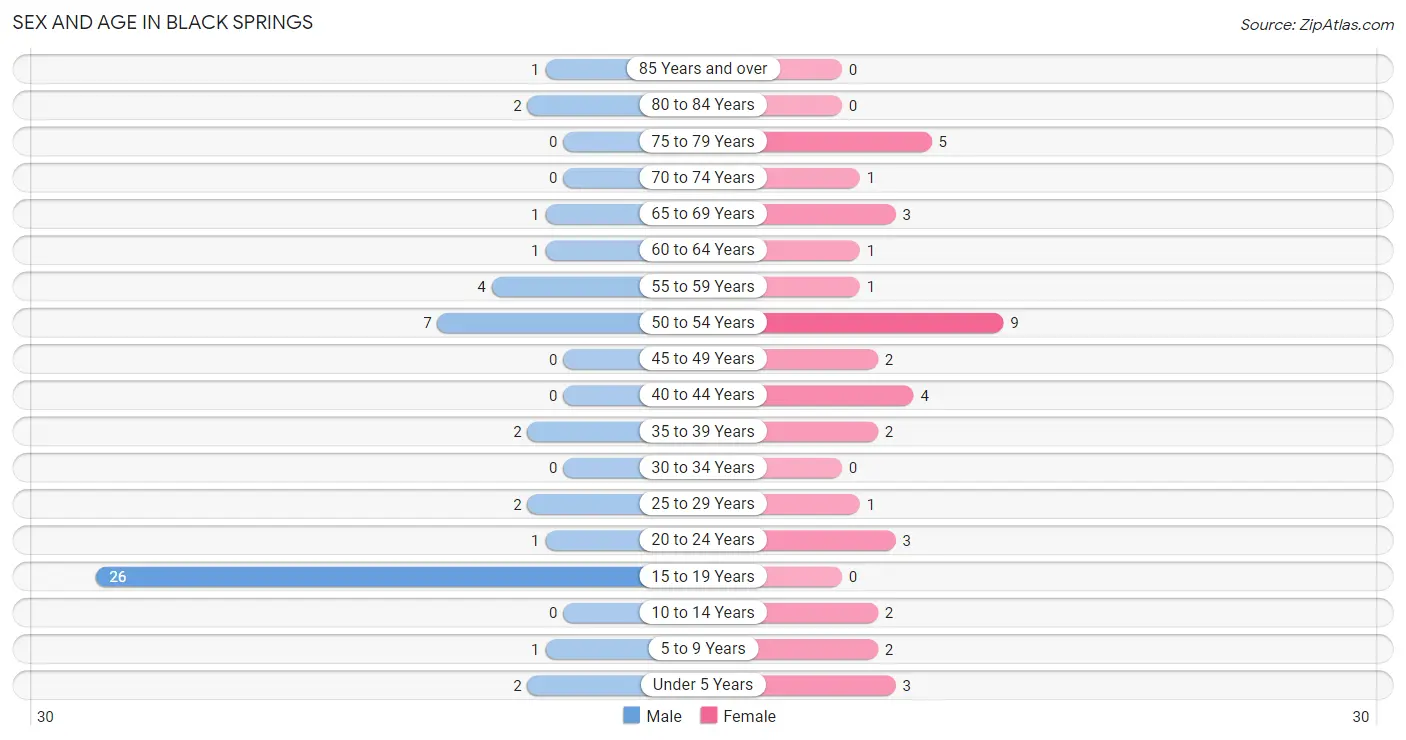
| Age Bracket | Male | Female |
| Under 5 Years | 2 (4.0%) | 3 (7.7%) |
| 5 to 9 Years | 1 (2.0%) | 2 (5.1%) |
| 10 to 14 Years | 0 (0.0%) | 2 (5.1%) |
| 15 to 19 Years | 26 (52.0%) | 0 (0.0%) |
| 20 to 24 Years | 1 (2.0%) | 3 (7.7%) |
| 25 to 29 Years | 2 (4.0%) | 1 (2.6%) |
| 30 to 34 Years | 0 (0.0%) | 0 (0.0%) |
| 35 to 39 Years | 2 (4.0%) | 2 (5.1%) |
| 40 to 44 Years | 0 (0.0%) | 4 (10.3%) |
| 45 to 49 Years | 0 (0.0%) | 2 (5.1%) |
| 50 to 54 Years | 7 (14.0%) | 9 (23.1%) |
| 55 to 59 Years | 4 (8.0%) | 1 (2.6%) |
| 60 to 64 Years | 1 (2.0%) | 1 (2.6%) |
| 65 to 69 Years | 1 (2.0%) | 3 (7.7%) |
| 70 to 74 Years | 0 (0.0%) | 1 (2.6%) |
| 75 to 79 Years | 0 (0.0%) | 5 (12.8%) |
| 80 to 84 Years | 2 (4.0%) | 0 (0.0%) |
| 85 Years and over | 1 (2.0%) | 0 (0.0%) |
| Total | 50 (100.0%) | 39 (100.0%) |
Families and Households in Black Springs
Median Family Size in Black Springs
The median family size in Black Springs is 4.16 persons per family, with single male/father families (1 | 5.3%) accounting for the largest median family size of 5 persons per family. On the other hand, married-couple families (12 | 63.2%) represent the smallest median family size with 3.83 persons per family.
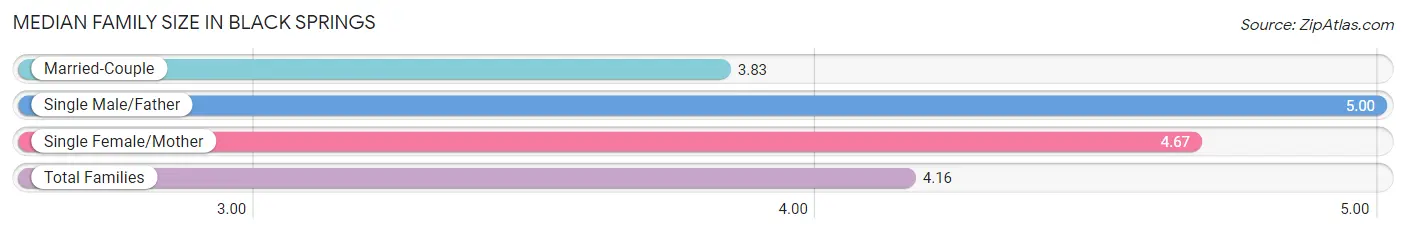
| Family Type | # Families | Family Size |
| Married-Couple | 12 (63.2%) | 3.83 |
| Single Male/Father | 1 (5.3%) | 5.00 |
| Single Female/Mother | 6 (31.6%) | 4.67 |
| Total Families | 19 (100.0%) | 4.16 |
Median Household Size in Black Springs
The median household size in Black Springs is 3.42 persons per household, with single male/father households (1 | 3.8%) accounting for the largest median household size of 5 persons per household. non-family households (7 | 26.9%) represent the smallest median household size with 1.43 persons per household.
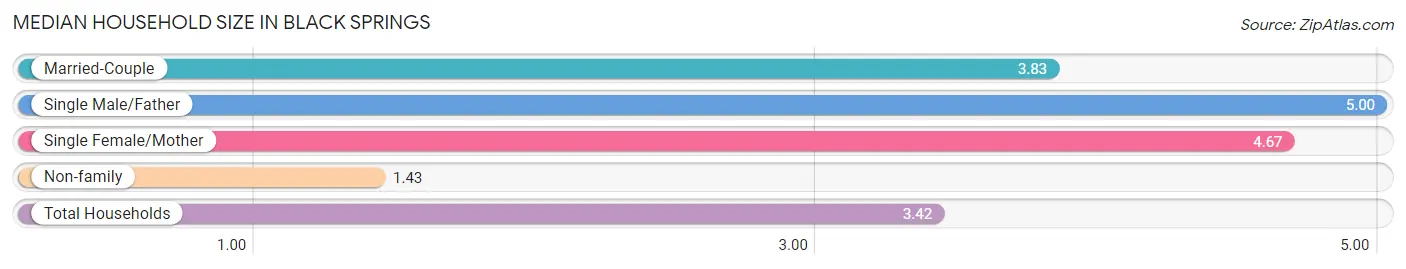
| Household Type | # Households | Household Size |
| Married-Couple | 12 (46.2%) | 3.83 |
| Single Male/Father | 1 (3.8%) | 5.00 |
| Single Female/Mother | 6 (23.1%) | 4.67 |
| Non-family | 7 (26.9%) | 1.43 |
| Total Households | 26 (100.0%) | 3.42 |
Household Size by Marriage Status in Black Springs
Out of a total of 26 households in Black Springs, 19 (73.1%) are family households, while 7 (26.9%) are nonfamily households. The most numerous type of family households are 2-person households, comprising 9, and the most common type of nonfamily households are 1-person households, comprising 6.
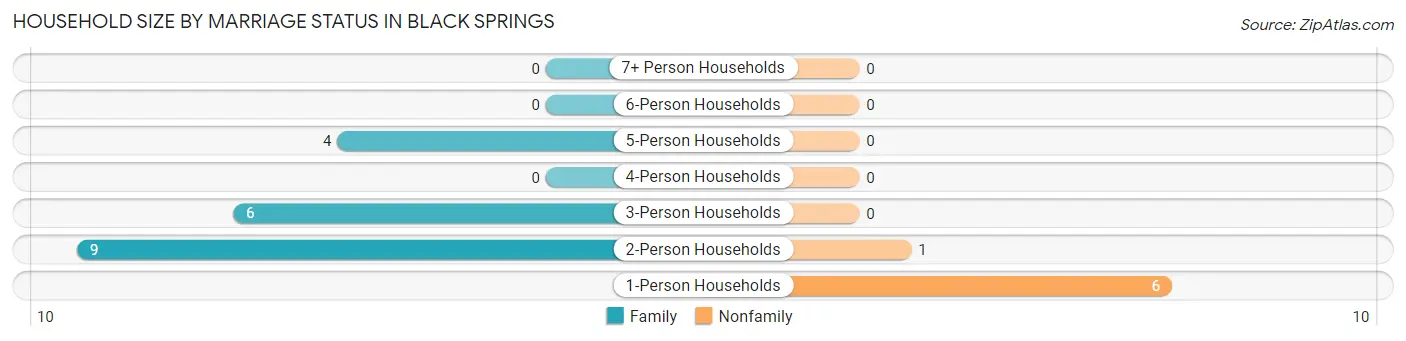
| Household Size | Family Households | Nonfamily Households |
| 1-Person Households | - | 6 (23.1%) |
| 2-Person Households | 9 (34.6%) | 1 (3.8%) |
| 3-Person Households | 6 (23.1%) | 0 (0.0%) |
| 4-Person Households | 0 (0.0%) | 0 (0.0%) |
| 5-Person Households | 4 (15.4%) | 0 (0.0%) |
| 6-Person Households | 0 (0.0%) | 0 (0.0%) |
| 7+ Person Households | 0 (0.0%) | 0 (0.0%) |
| Total | 19 (73.1%) | 7 (26.9%) |
Female Fertility in Black Springs
Fertility by Age in Black Springs
| Age Bracket | Women with Births | Births / 1,000 Women |
| 15 to 19 years | 0 (0.0%) | 0.0 |
| 20 to 34 years | 0 (0.0%) | 0.0 |
| 35 to 50 years | 0 (0.0%) | 0.0 |
| Total | 0 (0.0%) | 0.0 |
Fertility by Age by Marriage Status in Black Springs
| Age Bracket | Married | Unmarried |
| 15 to 19 years | 0 (0.0%) | 0 (0.0%) |
| 20 to 34 years | 0 (0.0%) | 0 (0.0%) |
| 35 to 50 years | 0 (0.0%) | 0 (0.0%) |
| Total | 0 (0.0%) | 0 (0.0%) |
Fertility by Education in Black Springs
| Educational Attainment | Women with Births | Births / 1,000 Women |
| Less than High School | 0 (0.0%) | 0.0 |
| High School Diploma | 0 (0.0%) | 0.0 |
| College or Associate's Degree | 0 (0.0%) | 0.0 |
| Bachelor's Degree | 0 (0.0%) | 0.0 |
| Graduate Degree | 0 (0.0%) | 0.0 |
| Total | 0 (0.0%) | 0.0 |
Fertility by Education by Marriage Status in Black Springs
| Educational Attainment | Married | Unmarried |
| Less than High School | 0 (0.0%) | 0 (0.0%) |
| High School Diploma | 0 (0.0%) | 0 (0.0%) |
| College or Associate's Degree | 0 (0.0%) | 0 (0.0%) |
| Bachelor's Degree | 0 (0.0%) | 0 (0.0%) |
| Graduate Degree | 0 (0.0%) | 0 (0.0%) |
| Total | 0 (0.0%) | 0 (0.0%) |
Employment Characteristics in Black Springs
Employment by Class of Employer in Black Springs
Among the 18 employed individuals in Black Springs, private company employees (8 | 44.4%), not-for-profit organizations (4 | 22.2%), and unpaid family workers (3 | 16.7%) make up the most common classes of employment.
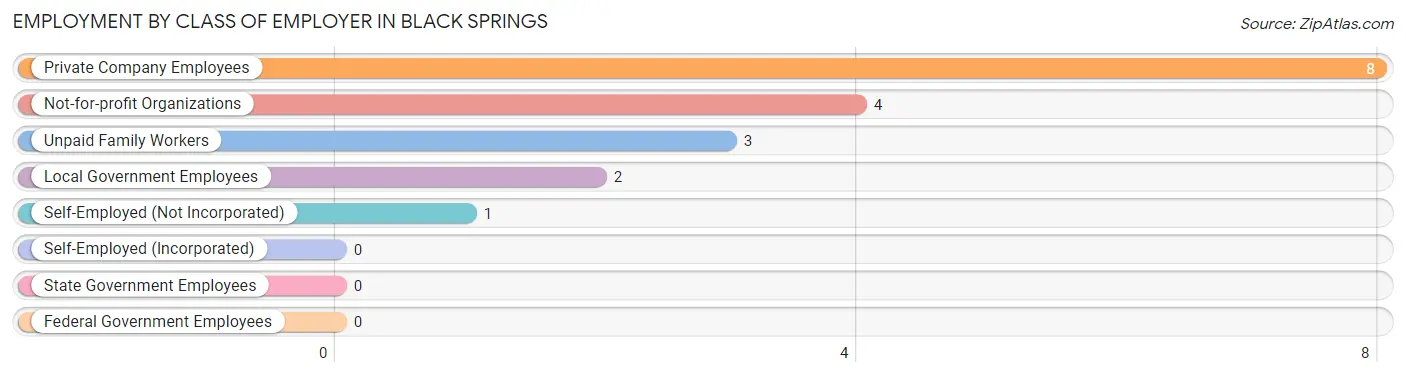
| Employer Class | # Employees | % Employees |
| Private Company Employees | 8 | 44.4% |
| Self-Employed (Incorporated) | 0 | 0.0% |
| Self-Employed (Not Incorporated) | 1 | 5.6% |
| Not-for-profit Organizations | 4 | 22.2% |
| Local Government Employees | 2 | 11.1% |
| State Government Employees | 0 | 0.0% |
| Federal Government Employees | 0 | 0.0% |
| Unpaid Family Workers | 3 | 16.7% |
| Total | 18 | 100.0% |
Employment Status by Age in Black Springs
According to the labor force statistics for Black Springs, out of the total population over 16 years of age (71), 31.0% or 22 individuals are in the labor force, with 18.2% or 4 of them unemployed. The age group with the highest labor force participation rate is 25 to 29 years, with 100.0% or 3 individuals in the labor force. Within the labor force, the 20 to 24 years age range has the highest percentage of unemployed individuals, with 100.0% or 1 of them being unemployed.
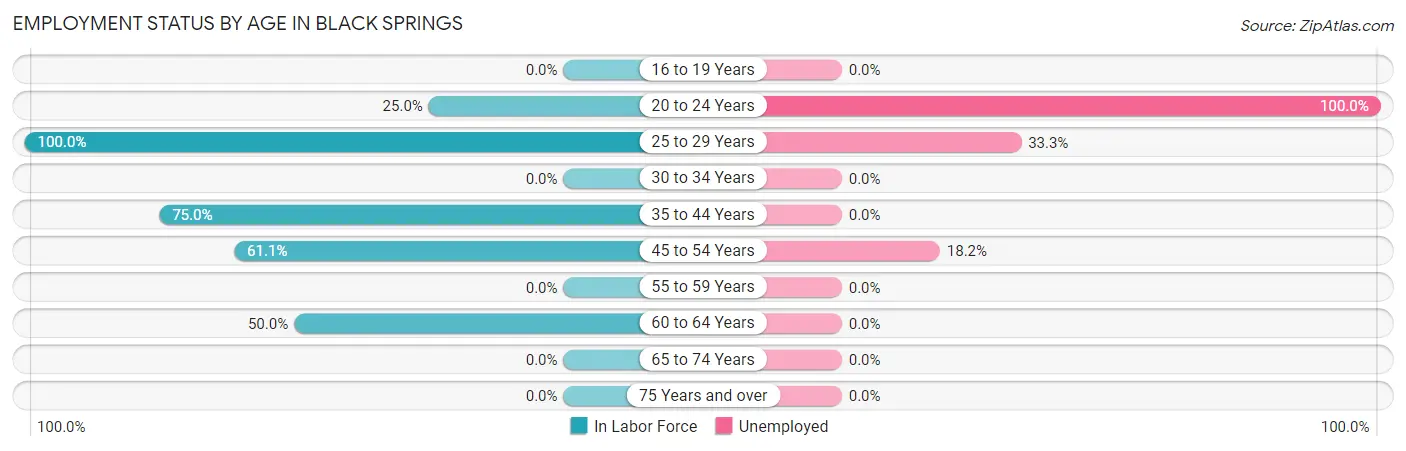
| Age Bracket | In Labor Force | Unemployed |
| 16 to 19 Years | 0 (0.0%) | 0 (0.0%) |
| 20 to 24 Years | 1 (25.0%) | 1 (100.0%) |
| 25 to 29 Years | 3 (100.0%) | 1 (33.3%) |
| 30 to 34 Years | 0 (0.0%) | 0 (0.0%) |
| 35 to 44 Years | 6 (75.0%) | 0 (0.0%) |
| 45 to 54 Years | 11 (61.1%) | 2 (18.2%) |
| 55 to 59 Years | 0 (0.0%) | 0 (0.0%) |
| 60 to 64 Years | 1 (50.0%) | 0 (0.0%) |
| 65 to 74 Years | 0 (0.0%) | 0 (0.0%) |
| 75 Years and over | 0 (0.0%) | 0 (0.0%) |
| Total | 22 (31.0%) | 4 (18.2%) |
Employment Status by Educational Attainment in Black Springs
According to labor force statistics for Black Springs, 58.3% of individuals (21) out of the total population between 25 and 64 years of age (36) are in the labor force, with 14.3% or 3 of them being unemployed. The group with the highest labor force participation rate are those with the educational attainment of college / associate degree, with 85.7% or 12 individuals in the labor force. Within the labor force, individuals with college / associate degree education have the highest percentage of unemployment, with 25.0% or 3 of them being unemployed.
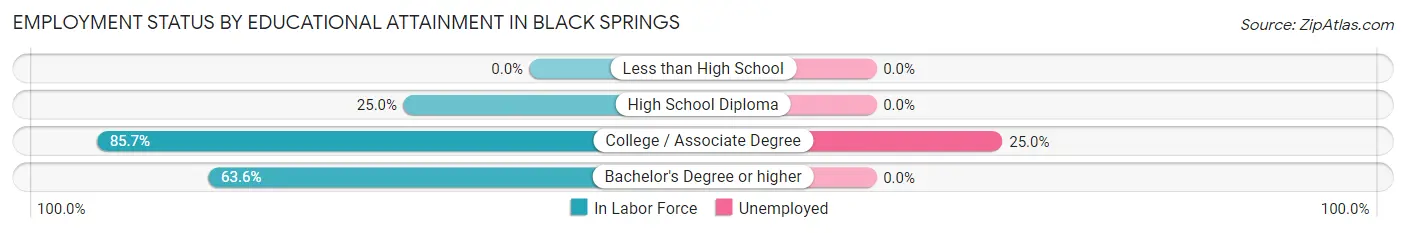
| Educational Attainment | In Labor Force | Unemployed |
| Less than High School | 0 (0.0%) | 0 (0.0%) |
| High School Diploma | 2 (25.0%) | 0 (0.0%) |
| College / Associate Degree | 12 (85.7%) | 4 (25.0%) |
| Bachelor's Degree or higher | 7 (63.6%) | 0 (0.0%) |
| Total | 21 (58.3%) | 5 (14.3%) |
Employment Occupations by Sex in Black Springs
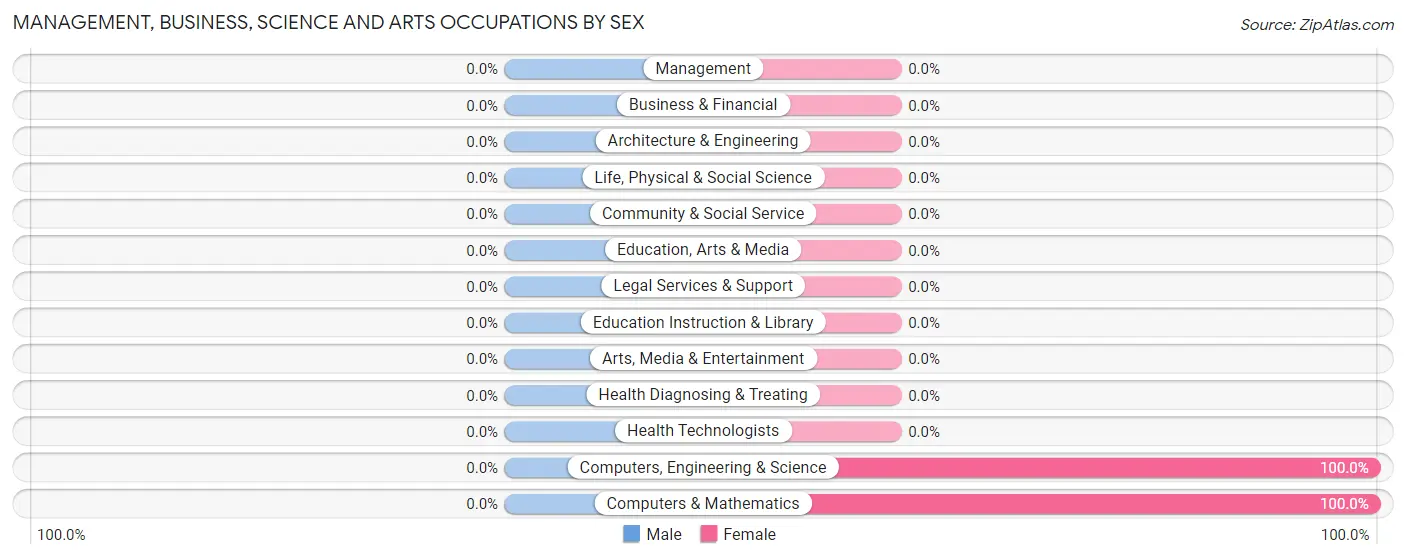
Management, Business, Science and Arts Occupations
The most common Management, Business, Science and Arts occupations in Black Springs are Computers, Engineering & Science (6 | 33.3%), and Computers & Mathematics (6 | 33.3%).
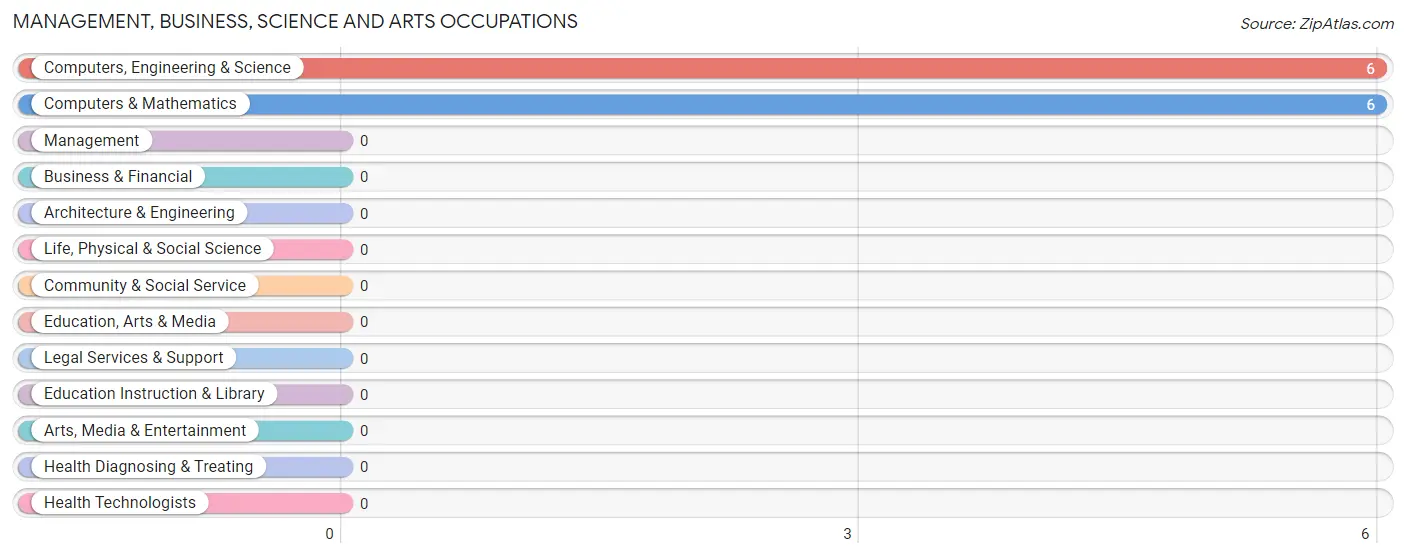
Management, Business, Science and Arts Occupations by Sex
| Occupation | Male | Female |
| Management | 0 (0.0%) | 0 (0.0%) |
| Business & Financial | 0 (0.0%) | 0 (0.0%) |
| Computers, Engineering & Science | 0 (0.0%) | 6 (100.0%) |
| Computers & Mathematics | 0 (0.0%) | 6 (100.0%) |
| Architecture & Engineering | 0 (0.0%) | 0 (0.0%) |
| Life, Physical & Social Science | 0 (0.0%) | 0 (0.0%) |
| Community & Social Service | 0 (0.0%) | 0 (0.0%) |
| Education, Arts & Media | 0 (0.0%) | 0 (0.0%) |
| Legal Services & Support | 0 (0.0%) | 0 (0.0%) |
| Education Instruction & Library | 0 (0.0%) | 0 (0.0%) |
| Arts, Media & Entertainment | 0 (0.0%) | 0 (0.0%) |
| Health Diagnosing & Treating | 0 (0.0%) | 0 (0.0%) |
| Health Technologists | 0 (0.0%) | 0 (0.0%) |
| Total (Category) | 0 (0.0%) | 6 (100.0%) |
| Total (Overall) | 4 (22.2%) | 14 (77.8%) |
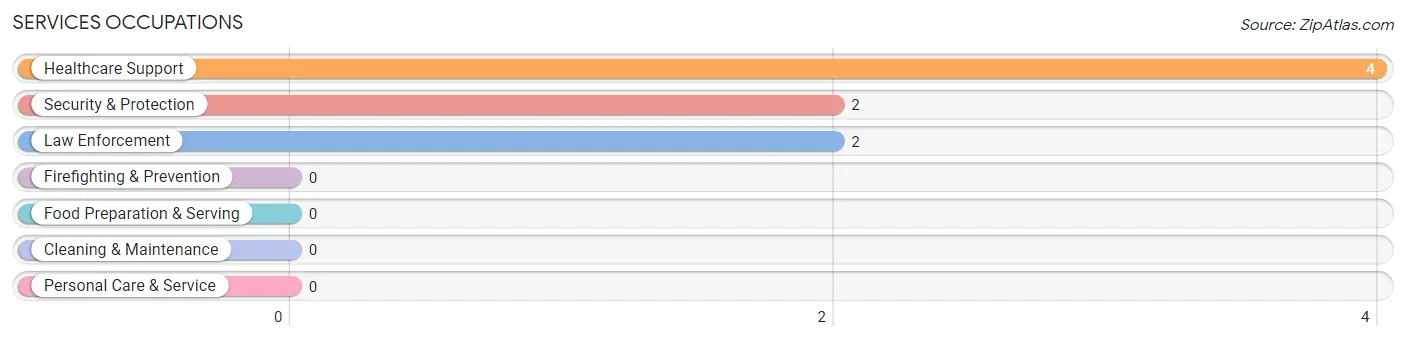
Services Occupations
The most common Services occupations in Black Springs are Healthcare Support (4 | 22.2%), Security & Protection (2 | 11.1%), and Law Enforcement (2 | 11.1%).
Services Occupations by Sex
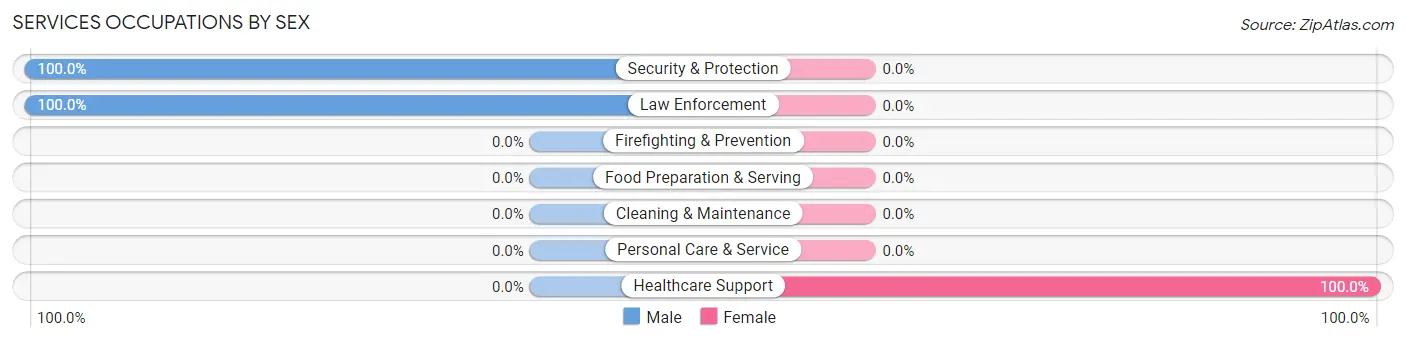
| Occupation | Male | Female |
| Healthcare Support | 0 (0.0%) | 4 (100.0%) |
| Security & Protection | 2 (100.0%) | 0 (0.0%) |
| Firefighting & Prevention | 0 (0.0%) | 0 (0.0%) |
| Law Enforcement | 2 (100.0%) | 0 (0.0%) |
| Food Preparation & Serving | 0 (0.0%) | 0 (0.0%) |
| Cleaning & Maintenance | 0 (0.0%) | 0 (0.0%) |
| Personal Care & Service | 0 (0.0%) | 0 (0.0%) |
| Total (Category) | 2 (33.3%) | 4 (66.7%) |
| Total (Overall) | 4 (22.2%) | 14 (77.8%) |
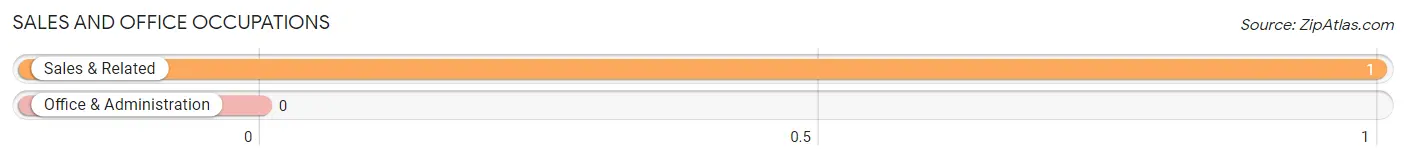
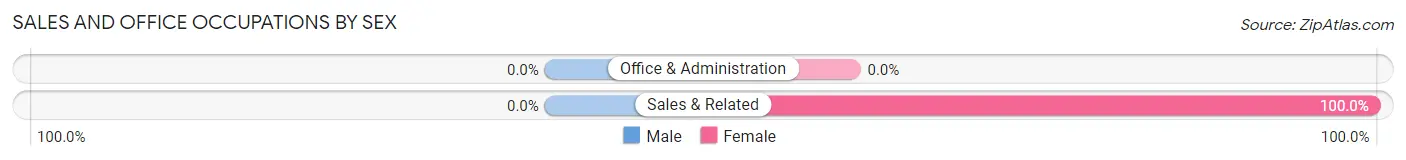
Sales and Office Occupations
The most common Sales and Office occupations in Black Springs are , and Sales & Related (1 | 5.6%).
Sales and Office Occupations by Sex
| Occupation | Male | Female |
| Sales & Related | 0 (0.0%) | 1 (100.0%) |
| Office & Administration | 0 (0.0%) | 0 (0.0%) |
| Total (Category) | 0 (0.0%) | 1 (100.0%) |
| Total (Overall) | 4 (22.2%) | 14 (77.8%) |
Natural Resources, Construction and Maintenance Occupations
The most common Natural Resources, Construction and Maintenance occupations in Black Springs are , and Construction & Extraction (3 | 16.7%).
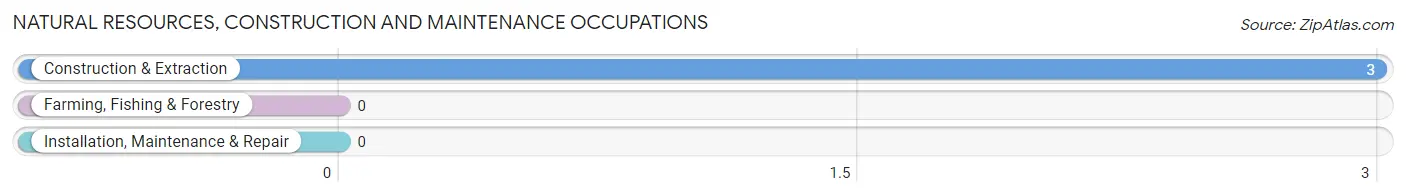
Natural Resources, Construction and Maintenance Occupations by Sex
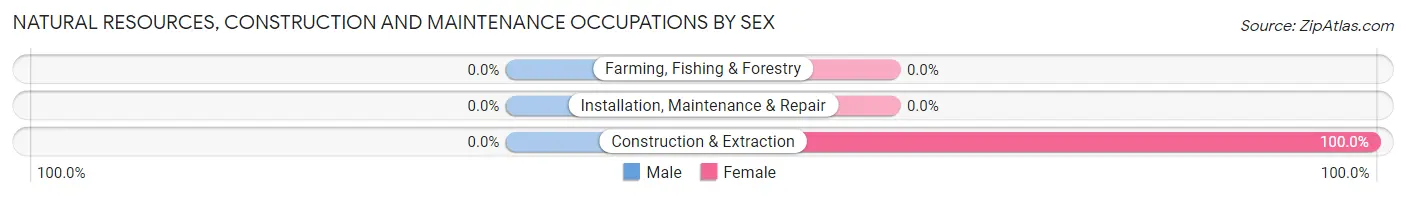
| Occupation | Male | Female |
| Farming, Fishing & Forestry | 0 (0.0%) | 0 (0.0%) |
| Construction & Extraction | 0 (0.0%) | 3 (100.0%) |
| Installation, Maintenance & Repair | 0 (0.0%) | 0 (0.0%) |
| Total (Category) | 0 (0.0%) | 3 (100.0%) |
| Total (Overall) | 4 (22.2%) | 14 (77.8%) |
Production, Transportation and Moving Occupations
The most common Production, Transportation and Moving occupations in Black Springs are , and Material Moving (2 | 11.1%).
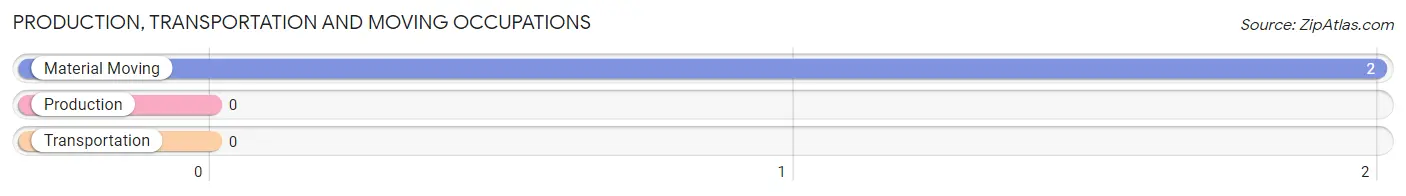
Production, Transportation and Moving Occupations by Sex
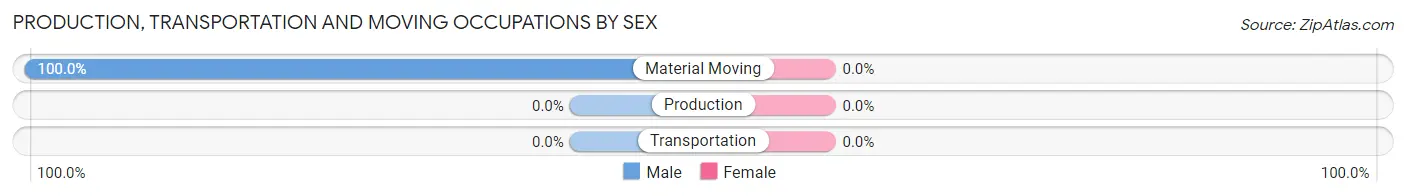
| Occupation | Male | Female |
| Production | 0 (0.0%) | 0 (0.0%) |
| Transportation | 0 (0.0%) | 0 (0.0%) |
| Material Moving | 2 (100.0%) | 0 (0.0%) |
| Total (Category) | 2 (100.0%) | 0 (0.0%) |
| Total (Overall) | 4 (22.2%) | 14 (77.8%) |
Employment Industries by Sex in Black Springs
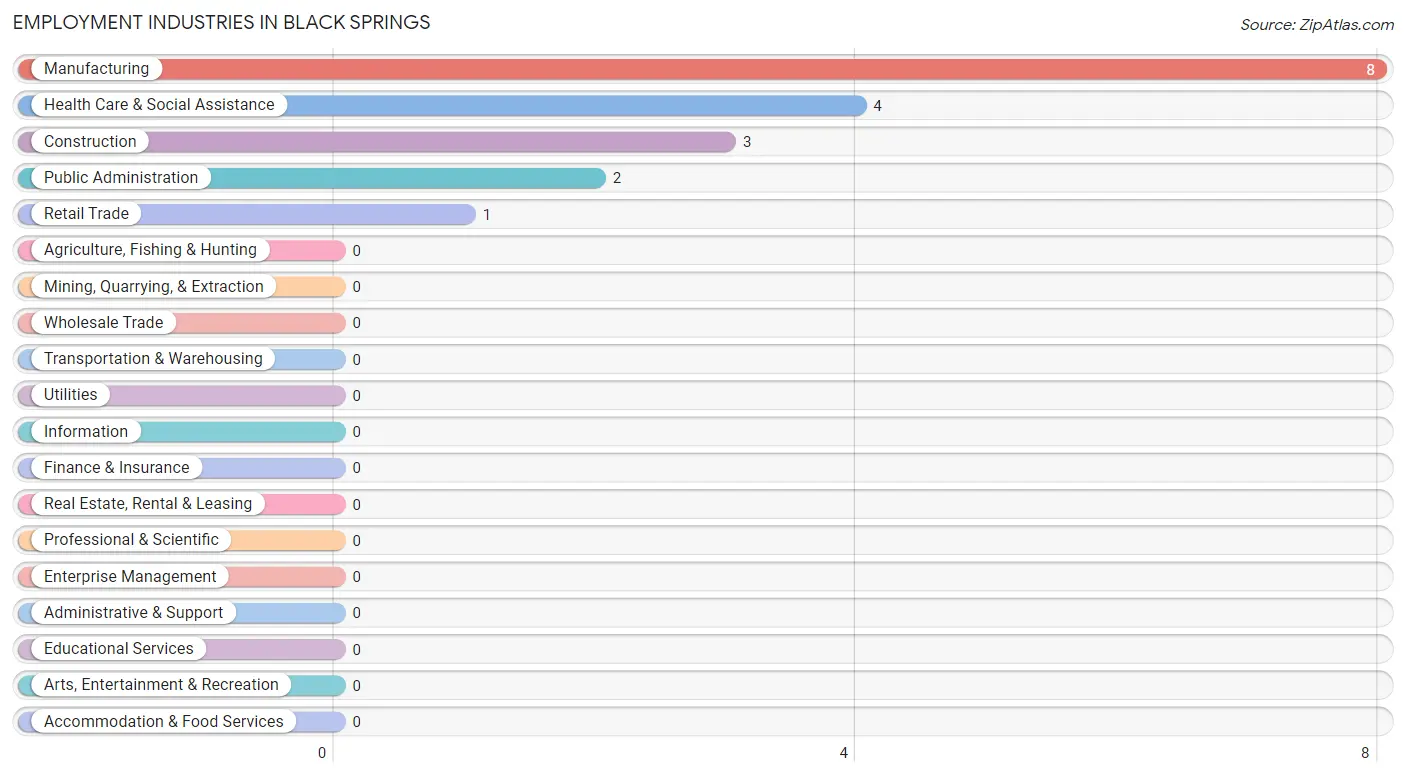
Employment Industries in Black Springs
The major employment industries in Black Springs include Manufacturing (8 | 44.4%), Health Care & Social Assistance (4 | 22.2%), Construction (3 | 16.7%), Public Administration (2 | 11.1%), and Retail Trade (1 | 5.6%).
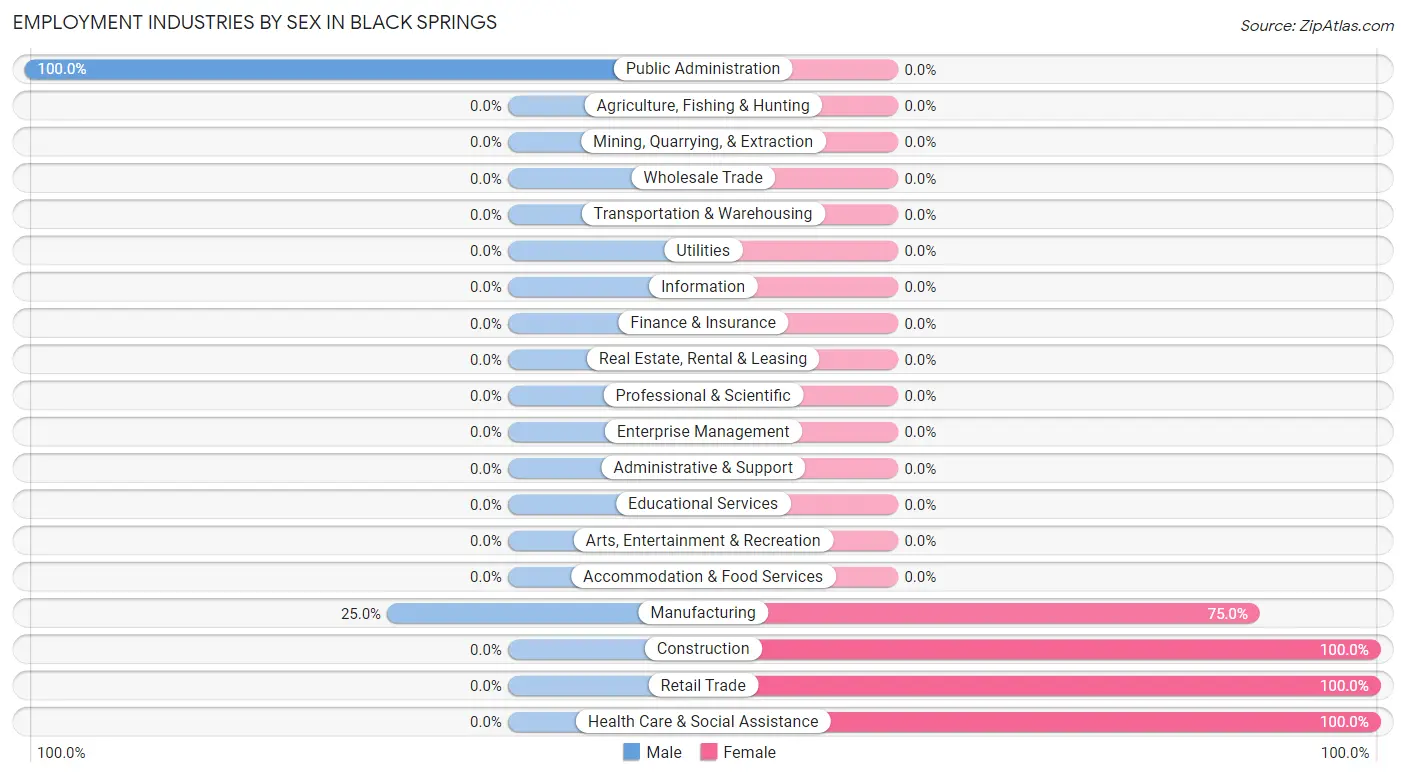
Employment Industries by Sex in Black Springs
The Black Springs industries that see more men than women are Public Administration (100.0%), and Manufacturing (25.0%), whereas the industries that tend to have a higher number of women are Construction (100.0%), Retail Trade (100.0%), and Health Care & Social Assistance (100.0%).
| Industry | Male | Female |
| Agriculture, Fishing & Hunting | 0 (0.0%) | 0 (0.0%) |
| Mining, Quarrying, & Extraction | 0 (0.0%) | 0 (0.0%) |
| Construction | 0 (0.0%) | 3 (100.0%) |
| Manufacturing | 2 (25.0%) | 6 (75.0%) |
| Wholesale Trade | 0 (0.0%) | 0 (0.0%) |
| Retail Trade | 0 (0.0%) | 1 (100.0%) |
| Transportation & Warehousing | 0 (0.0%) | 0 (0.0%) |
| Utilities | 0 (0.0%) | 0 (0.0%) |
| Information | 0 (0.0%) | 0 (0.0%) |
| Finance & Insurance | 0 (0.0%) | 0 (0.0%) |
| Real Estate, Rental & Leasing | 0 (0.0%) | 0 (0.0%) |
| Professional & Scientific | 0 (0.0%) | 0 (0.0%) |
| Enterprise Management | 0 (0.0%) | 0 (0.0%) |
| Administrative & Support | 0 (0.0%) | 0 (0.0%) |
| Educational Services | 0 (0.0%) | 0 (0.0%) |
| Health Care & Social Assistance | 0 (0.0%) | 4 (100.0%) |
| Arts, Entertainment & Recreation | 0 (0.0%) | 0 (0.0%) |
| Accommodation & Food Services | 0 (0.0%) | 0 (0.0%) |
| Public Administration | 2 (100.0%) | 0 (0.0%) |
| Total | 4 (22.2%) | 14 (77.8%) |
Education in Black Springs
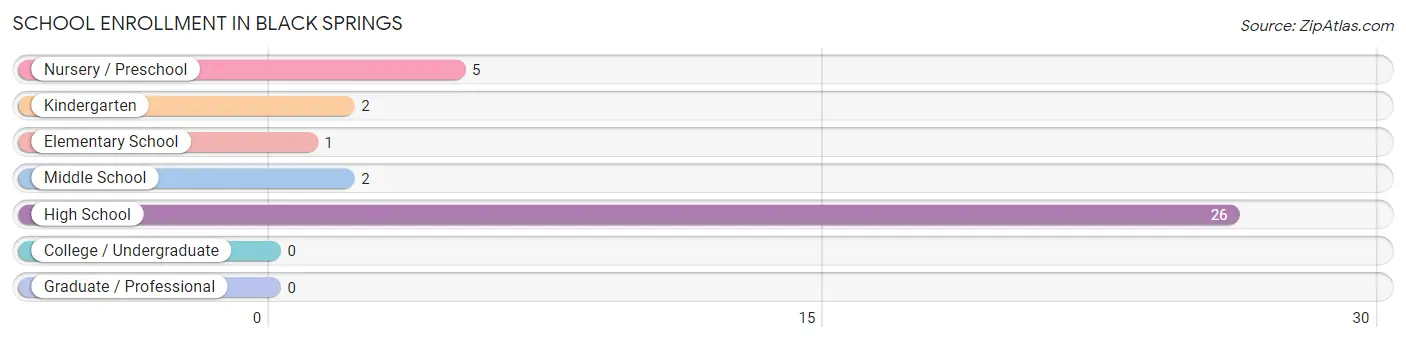
School Enrollment in Black Springs
The most common levels of schooling among the 36 students in Black Springs are high school (26 | 72.2%), nursery / preschool (5 | 13.9%), and kindergarten (2 | 5.6%).
| School Level | # Students | % Students |
| Nursery / Preschool | 5 | 13.9% |
| Kindergarten | 2 | 5.6% |
| Elementary School | 1 | 2.8% |
| Middle School | 2 | 5.6% |
| High School | 26 | 72.2% |
| College / Undergraduate | 0 | 0.0% |
| Graduate / Professional | 0 | 0.0% |
| Total | 36 | 100.0% |
School Enrollment by Age by Funding Source in Black Springs
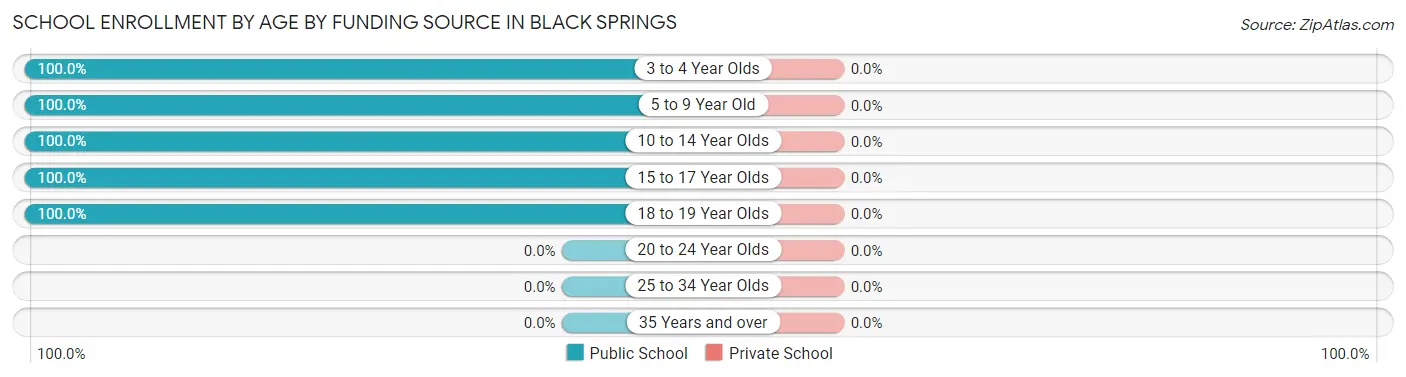
| Age Bracket | Public School | Private School |
| 3 to 4 Year Olds | 5 (100.0%) | 0 (0.0%) |
| 5 to 9 Year Old | 3 (100.0%) | 0 (0.0%) |
| 10 to 14 Year Olds | 2 (100.0%) | 0 (0.0%) |
| 15 to 17 Year Olds | 13 (100.0%) | 0 (0.0%) |
| 18 to 19 Year Olds | 13 (100.0%) | 0 (0.0%) |
| 20 to 24 Year Olds | 0 (0.0%) | 0 (0.0%) |
| 25 to 34 Year Olds | 0 (0.0%) | 0 (0.0%) |
| 35 Years and over | 0 (0.0%) | 0 (0.0%) |
| Total | 36 (100.0%) | 0 (0.0%) |
Educational Attainment by Field of Study in Black Springs
Physical & health sciences (6 | 54.5%), psychology (4 | 36.4%), and education (1 | 9.1%) are the most common fields of study among 11 individuals in Black Springs who have obtained a bachelor's degree or higher.
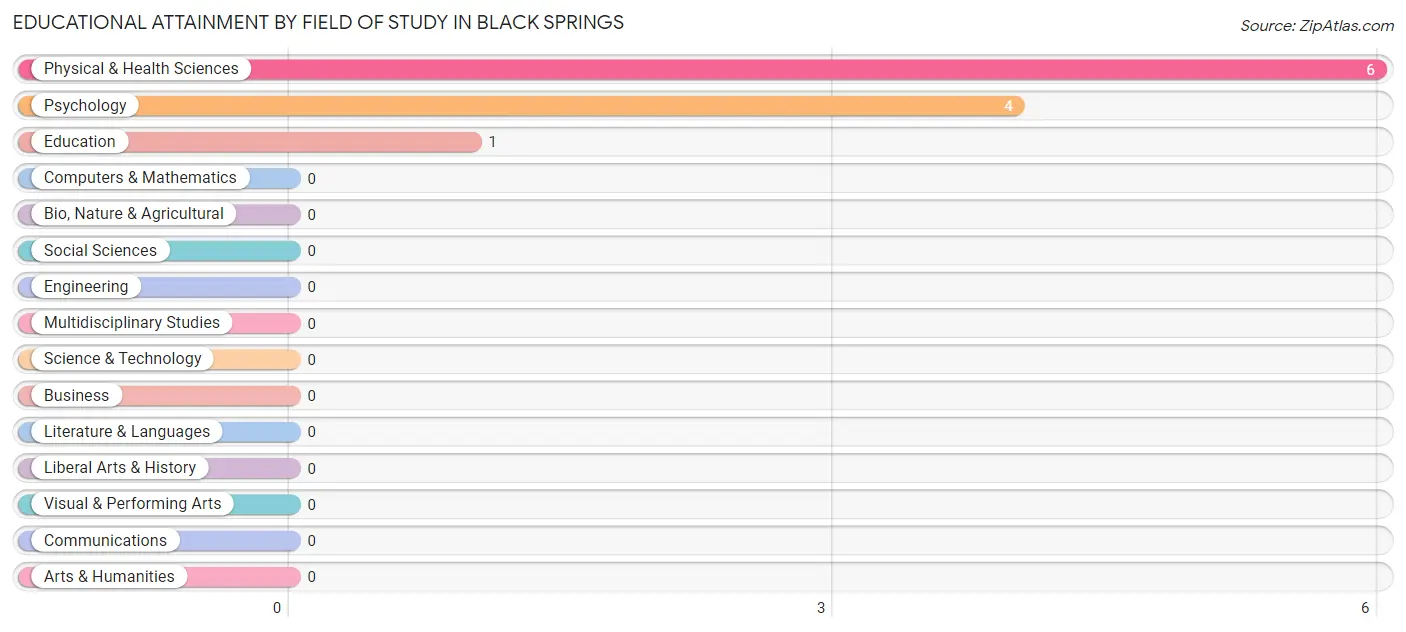
| Field of Study | # Graduates | % Graduates |
| Computers & Mathematics | 0 | 0.0% |
| Bio, Nature & Agricultural | 0 | 0.0% |
| Physical & Health Sciences | 6 | 54.5% |
| Psychology | 4 | 36.4% |
| Social Sciences | 0 | 0.0% |
| Engineering | 0 | 0.0% |
| Multidisciplinary Studies | 0 | 0.0% |
| Science & Technology | 0 | 0.0% |
| Business | 0 | 0.0% |
| Education | 1 | 9.1% |
| Literature & Languages | 0 | 0.0% |
| Liberal Arts & History | 0 | 0.0% |
| Visual & Performing Arts | 0 | 0.0% |
| Communications | 0 | 0.0% |
| Arts & Humanities | 0 | 0.0% |
| Total | 11 | 100.0% |
Transportation & Commute in Black Springs
Vehicle Availability by Sex in Black Springs
The most prevalent vehicle ownership categories in Black Springs are males with 1 vehicle (2, accounting for 50.0%) and females with 1 vehicle (0, making up 14.3%).
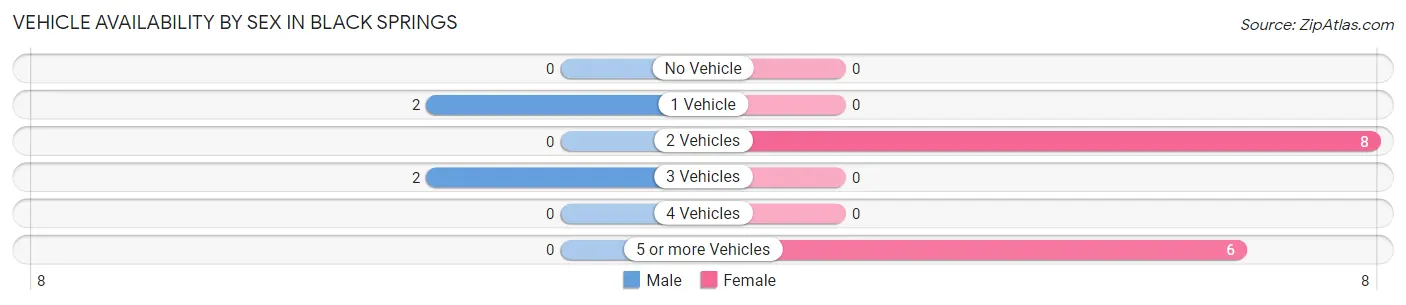
| Vehicles Available | Male | Female |
| No Vehicle | 0 (0.0%) | 0 (0.0%) |
| 1 Vehicle | 2 (50.0%) | 0 (0.0%) |
| 2 Vehicles | 0 (0.0%) | 8 (57.1%) |
| 3 Vehicles | 2 (50.0%) | 0 (0.0%) |
| 4 Vehicles | 0 (0.0%) | 0 (0.0%) |
| 5 or more Vehicles | 0 (0.0%) | 6 (42.9%) |
| Total | 4 (100.0%) | 14 (100.0%) |
Commute Time in Black Springs
The most frequently occuring commute durations in Black Springs are 90 or more minutes (7 commuters, 63.6%), 15 to 19 minutes (2 commuters, 18.2%), and 30 to 34 minutes (2 commuters, 18.2%).
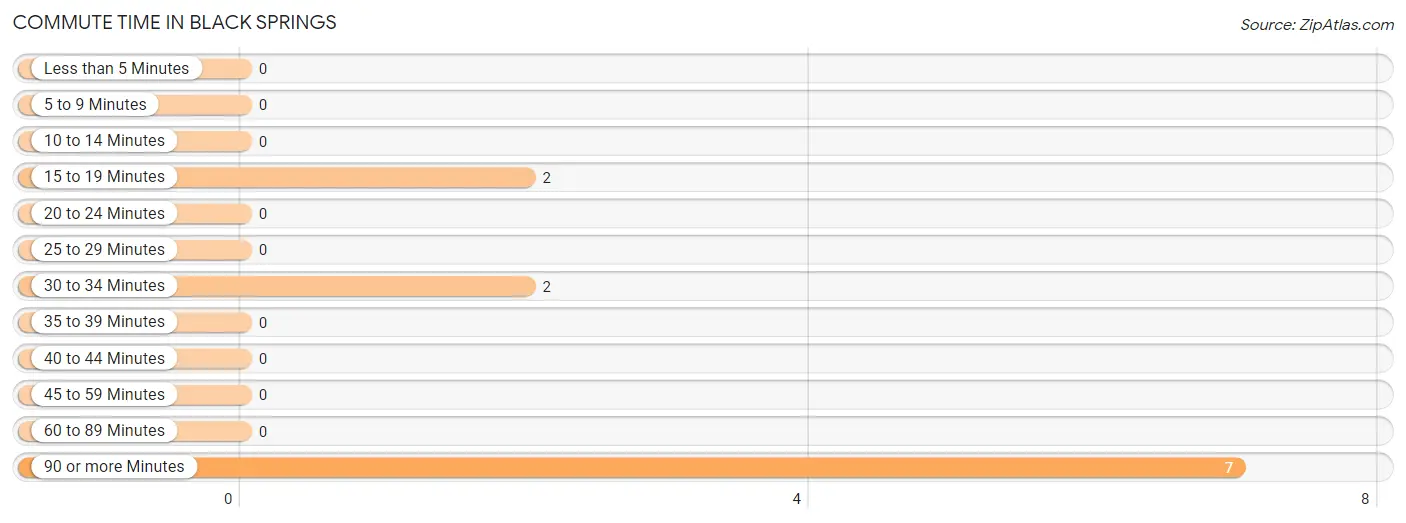
| Commute Time | # Commuters | % Commuters |
| Less than 5 Minutes | 0 | 0.0% |
| 5 to 9 Minutes | 0 | 0.0% |
| 10 to 14 Minutes | 0 | 0.0% |
| 15 to 19 Minutes | 2 | 18.2% |
| 20 to 24 Minutes | 0 | 0.0% |
| 25 to 29 Minutes | 0 | 0.0% |
| 30 to 34 Minutes | 2 | 18.2% |
| 35 to 39 Minutes | 0 | 0.0% |
| 40 to 44 Minutes | 0 | 0.0% |
| 45 to 59 Minutes | 0 | 0.0% |
| 60 to 89 Minutes | 0 | 0.0% |
| 90 or more Minutes | 7 | 63.6% |
Commute Time by Sex in Black Springs
The most common commute times in Black Springs are 15 to 19 minutes (2 commuters, 50.0%) for males and 90 or more minutes (7 commuters, 100.0%) for females.
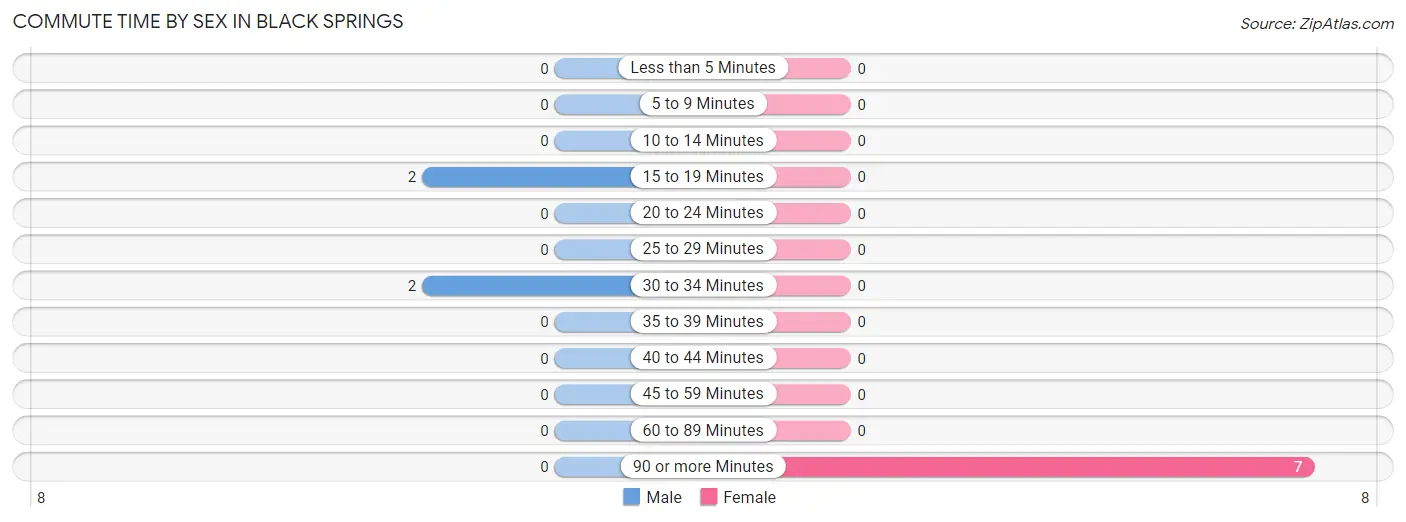
| Commute Time | Male | Female |
| Less than 5 Minutes | 0 (0.0%) | 0 (0.0%) |
| 5 to 9 Minutes | 0 (0.0%) | 0 (0.0%) |
| 10 to 14 Minutes | 0 (0.0%) | 0 (0.0%) |
| 15 to 19 Minutes | 2 (50.0%) | 0 (0.0%) |
| 20 to 24 Minutes | 0 (0.0%) | 0 (0.0%) |
| 25 to 29 Minutes | 0 (0.0%) | 0 (0.0%) |
| 30 to 34 Minutes | 2 (50.0%) | 0 (0.0%) |
| 35 to 39 Minutes | 0 (0.0%) | 0 (0.0%) |
| 40 to 44 Minutes | 0 (0.0%) | 0 (0.0%) |
| 45 to 59 Minutes | 0 (0.0%) | 0 (0.0%) |
| 60 to 89 Minutes | 0 (0.0%) | 0 (0.0%) |
| 90 or more Minutes | 0 (0.0%) | 7 (100.0%) |
Time of Departure to Work by Sex in Black Springs
The most frequent times of departure to work in Black Springs are 5:30 AM to 5:59 AM (2, 50.0%) for males and 12:00 AM to 4:59 AM (4, 57.1%) for females.
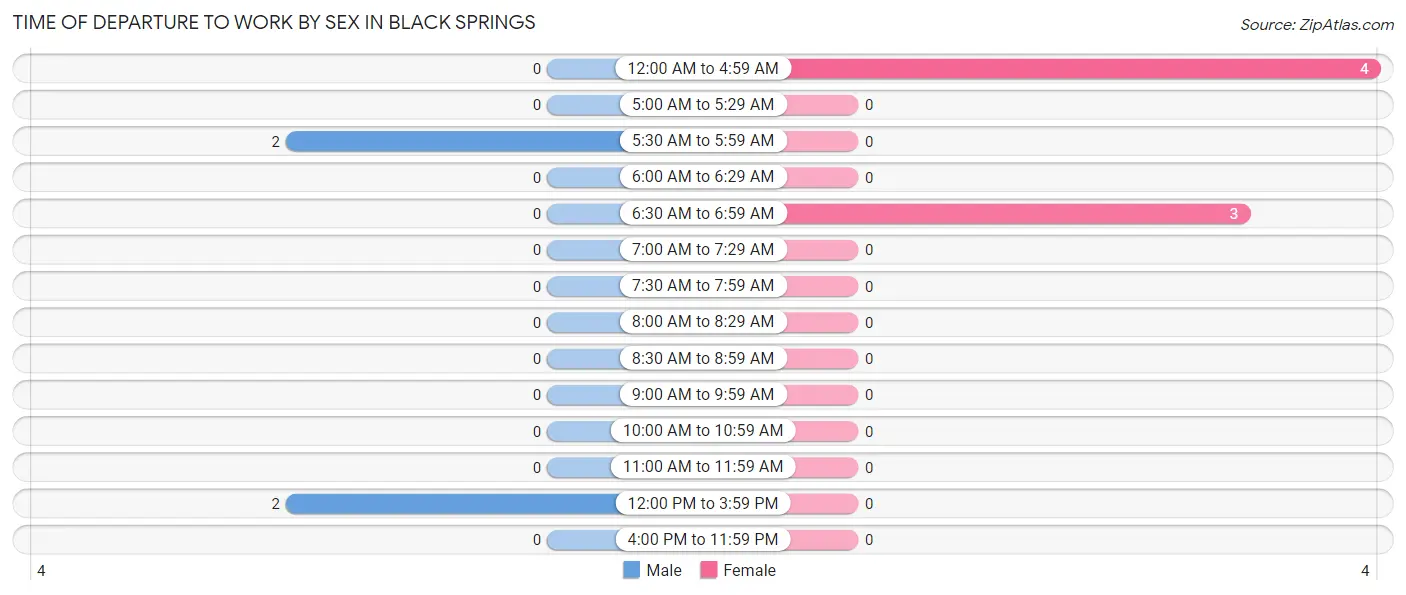
| Time of Departure | Male | Female |
| 12:00 AM to 4:59 AM | 0 (0.0%) | 4 (57.1%) |
| 5:00 AM to 5:29 AM | 0 (0.0%) | 0 (0.0%) |
| 5:30 AM to 5:59 AM | 2 (50.0%) | 0 (0.0%) |
| 6:00 AM to 6:29 AM | 0 (0.0%) | 0 (0.0%) |
| 6:30 AM to 6:59 AM | 0 (0.0%) | 3 (42.9%) |
| 7:00 AM to 7:29 AM | 0 (0.0%) | 0 (0.0%) |
| 7:30 AM to 7:59 AM | 0 (0.0%) | 0 (0.0%) |
| 8:00 AM to 8:29 AM | 0 (0.0%) | 0 (0.0%) |
| 8:30 AM to 8:59 AM | 0 (0.0%) | 0 (0.0%) |
| 9:00 AM to 9:59 AM | 0 (0.0%) | 0 (0.0%) |
| 10:00 AM to 10:59 AM | 0 (0.0%) | 0 (0.0%) |
| 11:00 AM to 11:59 AM | 0 (0.0%) | 0 (0.0%) |
| 12:00 PM to 3:59 PM | 2 (50.0%) | 0 (0.0%) |
| 4:00 PM to 11:59 PM | 0 (0.0%) | 0 (0.0%) |
| Total | 4 (100.0%) | 7 (100.0%) |
Housing Occupancy in Black Springs
Occupancy by Ownership in Black Springs
Of the total 26 dwellings in Black Springs, owner-occupied units account for 26 (100.0%), while renter-occupied units make up 0 (0.0%).
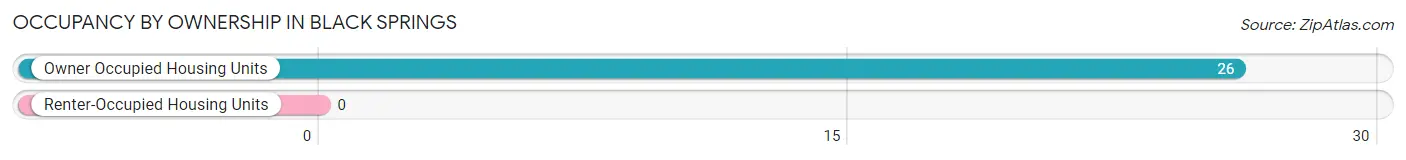
| Occupancy | # Housing Units | % Housing Units |
| Owner Occupied Housing Units | 26 | 100.0% |
| Renter-Occupied Housing Units | 0 | 0.0% |
| Total Occupied Housing Units | 26 | 100.0% |
Occupancy by Household Size in Black Springs
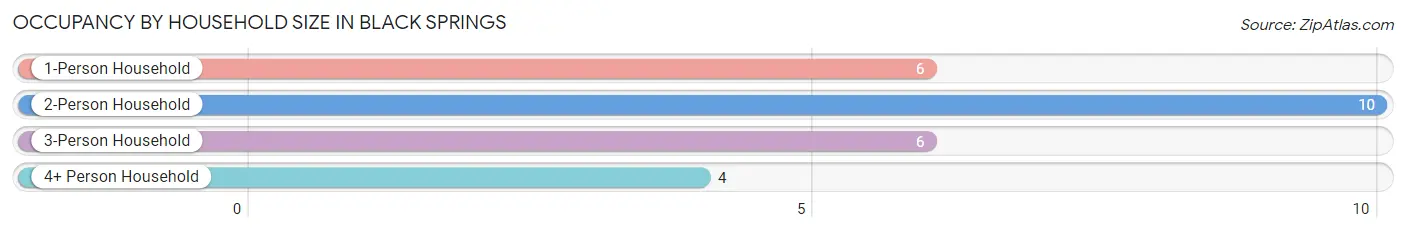
| Household Size | # Housing Units | % Housing Units |
| 1-Person Household | 6 | 23.1% |
| 2-Person Household | 10 | 38.5% |
| 3-Person Household | 6 | 23.1% |
| 4+ Person Household | 4 | 15.4% |
| Total Housing Units | 26 | 100.0% |
Occupancy by Ownership by Household Size in Black Springs
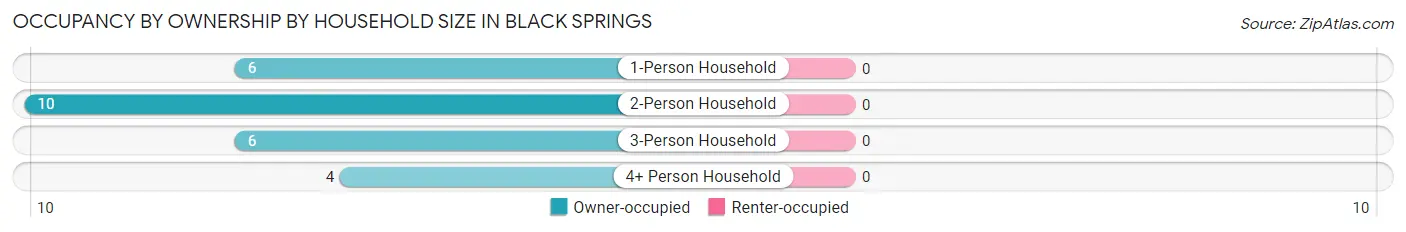
| Household Size | Owner-occupied | Renter-occupied |
| 1-Person Household | 6 (100.0%) | 0 (0.0%) |
| 2-Person Household | 10 (100.0%) | 0 (0.0%) |
| 3-Person Household | 6 (100.0%) | 0 (0.0%) |
| 4+ Person Household | 4 (100.0%) | 0 (0.0%) |
| Total Housing Units | 26 (100.0%) | 0 (0.0%) |
Occupancy by Educational Attainment in Black Springs
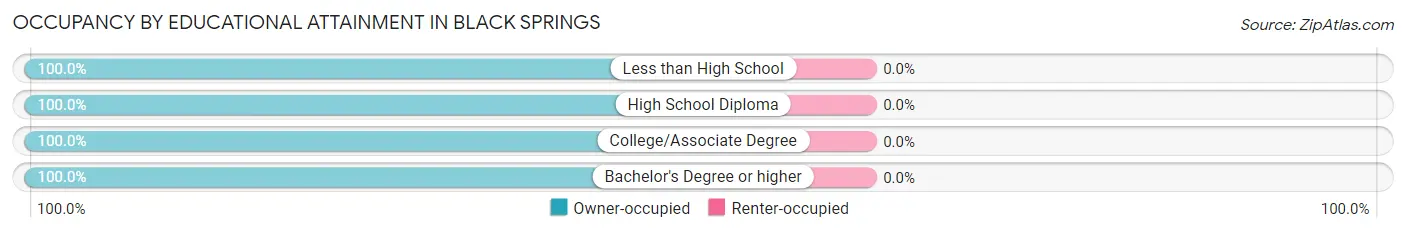
| Household Size | Owner-occupied | Renter-occupied |
| Less than High School | 3 (100.0%) | 0 (0.0%) |
| High School Diploma | 6 (100.0%) | 0 (0.0%) |
| College/Associate Degree | 11 (100.0%) | 0 (0.0%) |
| Bachelor's Degree or higher | 6 (100.0%) | 0 (0.0%) |
Occupancy by Age of Householder in Black Springs
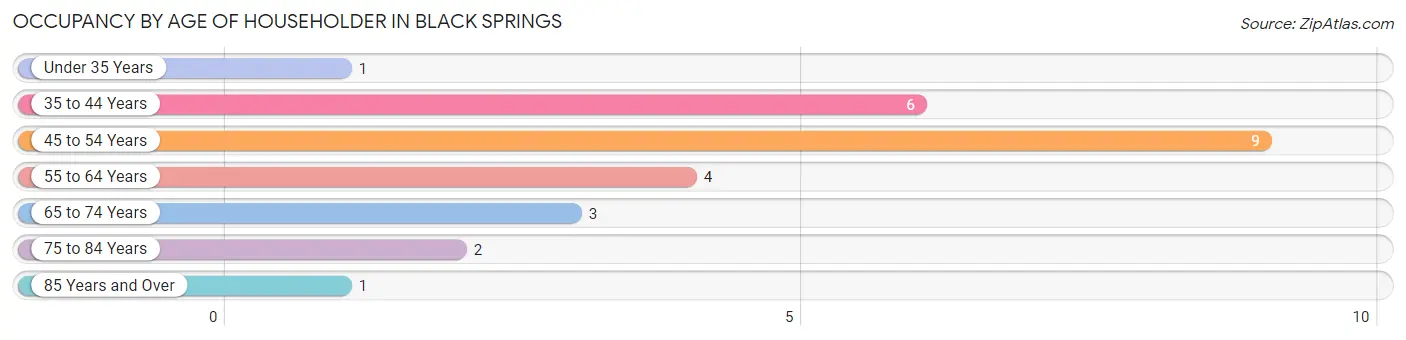
| Age Bracket | # Households | % Households |
| Under 35 Years | 1 | 3.8% |
| 35 to 44 Years | 6 | 23.1% |
| 45 to 54 Years | 9 | 34.6% |
| 55 to 64 Years | 4 | 15.4% |
| 65 to 74 Years | 3 | 11.5% |
| 75 to 84 Years | 2 | 7.7% |
| 85 Years and Over | 1 | 3.8% |
| Total | 26 | 100.0% |
Housing Finances in Black Springs
Median Income by Occupancy in Black Springs
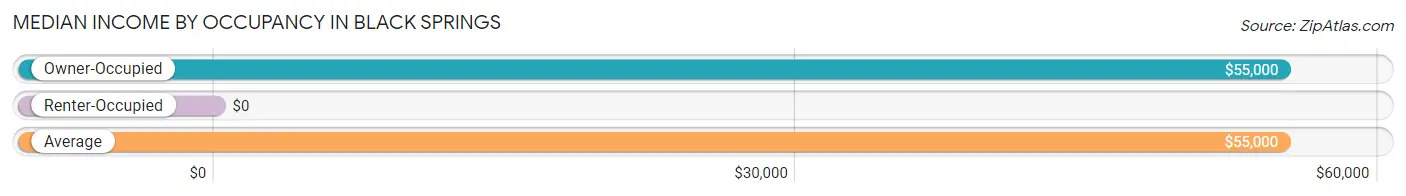
| Occupancy Type | # Households | Median Income |
| Owner-Occupied | 26 (100.0%) | $55,000 |
| Renter-Occupied | 0 (0.0%) | $0 |
| Average | 26 (100.0%) | $55,000 |
Occupancy by Householder Income Bracket in Black Springs
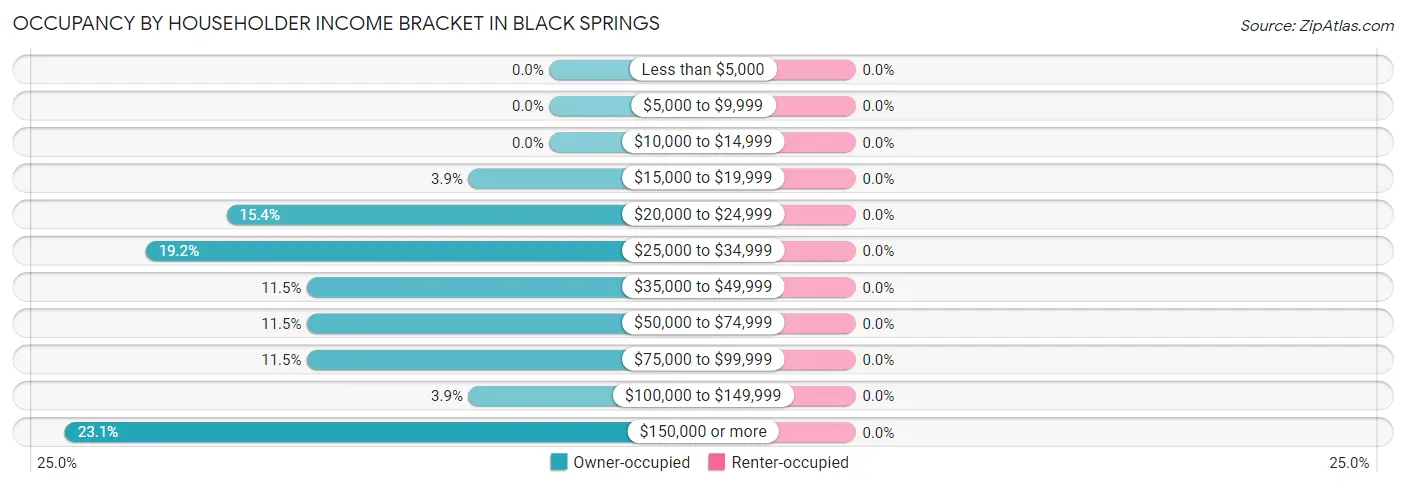
| Income Bracket | Owner-occupied | Renter-occupied |
| Less than $5,000 | 0 (0.0%) | 0 (0.0%) |
| $5,000 to $9,999 | 0 (0.0%) | 0 (0.0%) |
| $10,000 to $14,999 | 0 (0.0%) | 0 (0.0%) |
| $15,000 to $19,999 | 1 (3.8%) | 0 (0.0%) |
| $20,000 to $24,999 | 4 (15.4%) | 0 (0.0%) |
| $25,000 to $34,999 | 5 (19.2%) | 0 (0.0%) |
| $35,000 to $49,999 | 3 (11.5%) | 0 (0.0%) |
| $50,000 to $74,999 | 3 (11.5%) | 0 (0.0%) |
| $75,000 to $99,999 | 3 (11.5%) | 0 (0.0%) |
| $100,000 to $149,999 | 1 (3.8%) | 0 (0.0%) |
| $150,000 or more | 6 (23.1%) | 0 (0.0%) |
| Total | 26 (100.0%) | 0 (0.0%) |
Monthly Housing Cost Tiers in Black Springs
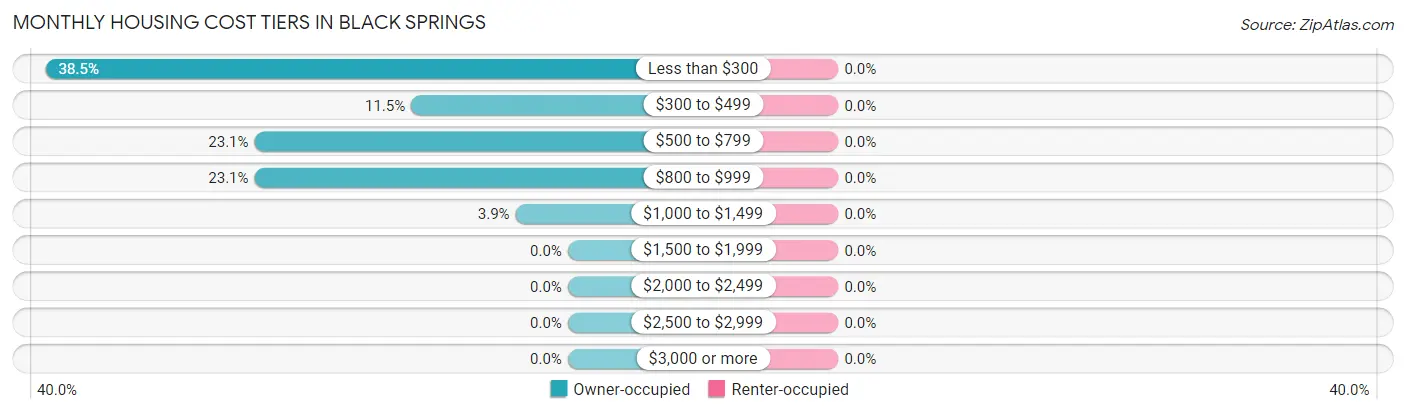
| Monthly Cost | Owner-occupied | Renter-occupied |
| Less than $300 | 10 (38.5%) | 0 (0.0%) |
| $300 to $499 | 3 (11.5%) | 0 (0.0%) |
| $500 to $799 | 6 (23.1%) | 0 (0.0%) |
| $800 to $999 | 6 (23.1%) | 0 (0.0%) |
| $1,000 to $1,499 | 1 (3.8%) | 0 (0.0%) |
| $1,500 to $1,999 | 0 (0.0%) | 0 (0.0%) |
| $2,000 to $2,499 | 0 (0.0%) | 0 (0.0%) |
| $2,500 to $2,999 | 0 (0.0%) | 0 (0.0%) |
| $3,000 or more | 0 (0.0%) | 0 (0.0%) |
| Total | 26 (100.0%) | 0 (0.0%) |
Physical Housing Characteristics in Black Springs
Housing Structures in Black Springs
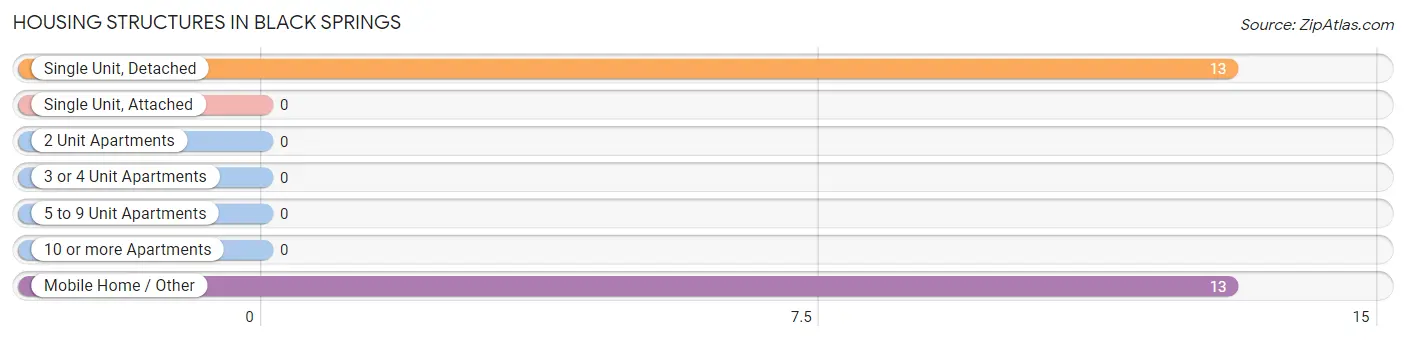
| Structure Type | # Housing Units | % Housing Units |
| Single Unit, Detached | 13 | 50.0% |
| Single Unit, Attached | 0 | 0.0% |
| 2 Unit Apartments | 0 | 0.0% |
| 3 or 4 Unit Apartments | 0 | 0.0% |
| 5 to 9 Unit Apartments | 0 | 0.0% |
| 10 or more Apartments | 0 | 0.0% |
| Mobile Home / Other | 13 | 50.0% |
| Total | 26 | 100.0% |
Housing Structures by Occupancy in Black Springs
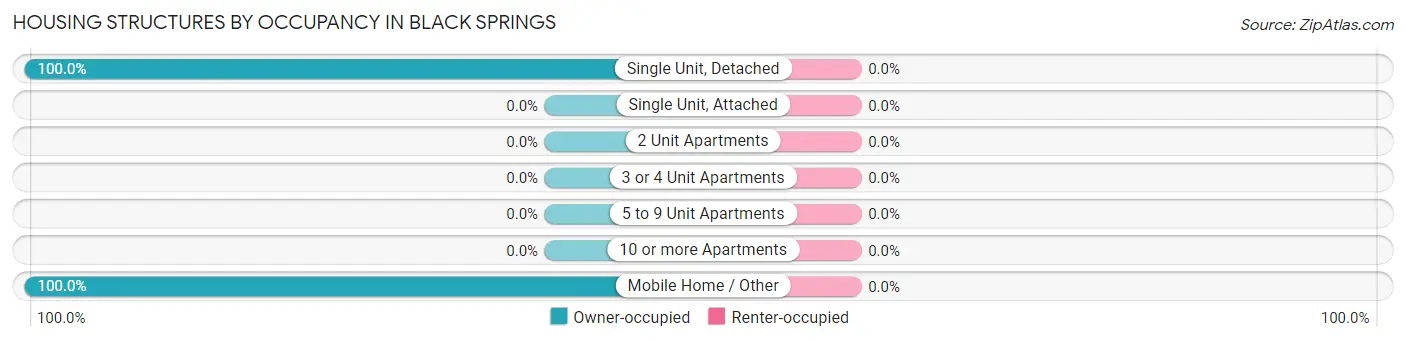
| Structure Type | Owner-occupied | Renter-occupied |
| Single Unit, Detached | 13 (100.0%) | 0 (0.0%) |
| Single Unit, Attached | 0 (0.0%) | 0 (0.0%) |
| 2 Unit Apartments | 0 (0.0%) | 0 (0.0%) |
| 3 or 4 Unit Apartments | 0 (0.0%) | 0 (0.0%) |
| 5 to 9 Unit Apartments | 0 (0.0%) | 0 (0.0%) |
| 10 or more Apartments | 0 (0.0%) | 0 (0.0%) |
| Mobile Home / Other | 13 (100.0%) | 0 (0.0%) |
| Total | 26 (100.0%) | 0 (0.0%) |
Housing Structures by Number of Rooms in Black Springs
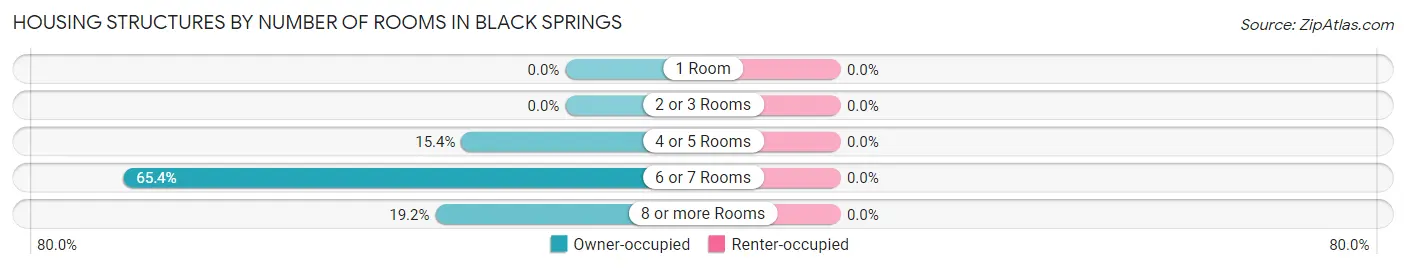
| Number of Rooms | Owner-occupied | Renter-occupied |
| 1 Room | 0 (0.0%) | 0 (0.0%) |
| 2 or 3 Rooms | 0 (0.0%) | 0 (0.0%) |
| 4 or 5 Rooms | 4 (15.4%) | 0 (0.0%) |
| 6 or 7 Rooms | 17 (65.4%) | 0 (0.0%) |
| 8 or more Rooms | 5 (19.2%) | 0 (0.0%) |
| Total | 26 (100.0%) | 0 (0.0%) |
Housing Structure by Heating Type in Black Springs
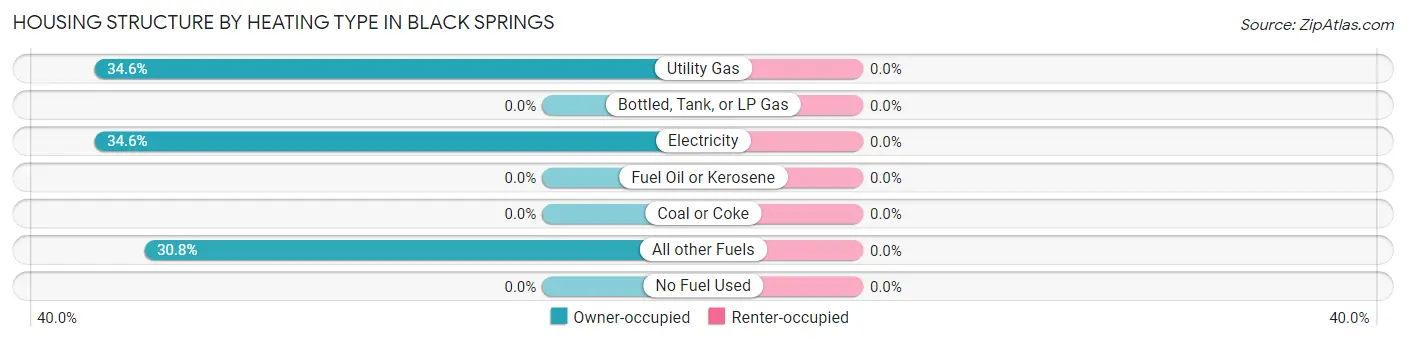
| Heating Type | Owner-occupied | Renter-occupied |
| Utility Gas | 9 (34.6%) | 0 (0.0%) |
| Bottled, Tank, or LP Gas | 0 (0.0%) | 0 (0.0%) |
| Electricity | 9 (34.6%) | 0 (0.0%) |
| Fuel Oil or Kerosene | 0 (0.0%) | 0 (0.0%) |
| Coal or Coke | 0 (0.0%) | 0 (0.0%) |
| All other Fuels | 8 (30.8%) | 0 (0.0%) |
| No Fuel Used | 0 (0.0%) | 0 (0.0%) |
| Total | 26 (100.0%) | 0 (0.0%) |
Household Vehicle Usage in Black Springs
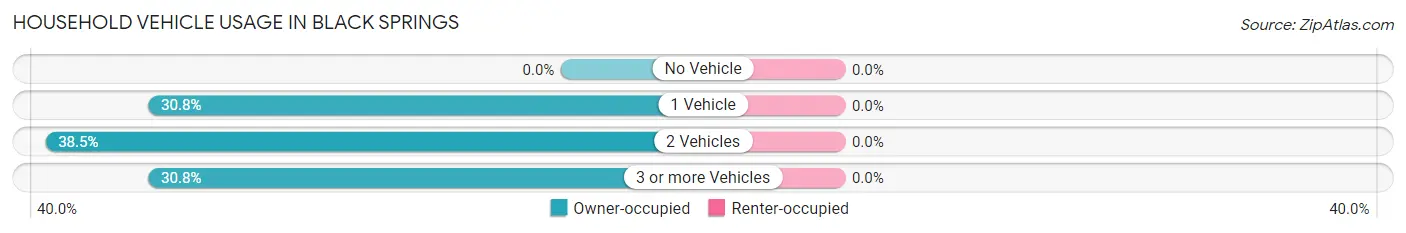
| Vehicles per Household | Owner-occupied | Renter-occupied |
| No Vehicle | 0 (0.0%) | 0 (0.0%) |
| 1 Vehicle | 8 (30.8%) | 0 (0.0%) |
| 2 Vehicles | 10 (38.5%) | 0 (0.0%) |
| 3 or more Vehicles | 8 (30.8%) | 0 (0.0%) |
| Total | 26 (100.0%) | 0 (0.0%) |
Real Estate & Mortgages in Black Springs
Real Estate and Mortgage Overview in Black Springs
| Characteristic | Without Mortgage | With Mortgage |
| Housing Units | 18 | 8 |
| Median Property Value | $93,300 | $46,000 |
| Median Household Income | - | - |
| Monthly Housing Costs | $293 | $0 |
| Real Estate Taxes | $317 | $4 |
Property Value by Mortgage Status in Black Springs
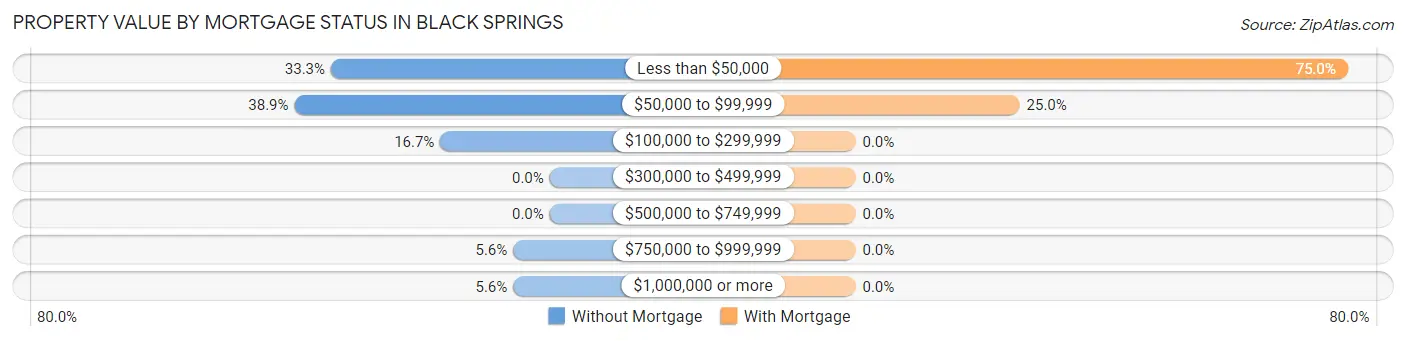
| Property Value | Without Mortgage | With Mortgage |
| Less than $50,000 | 6 (33.3%) | 6 (75.0%) |
| $50,000 to $99,999 | 7 (38.9%) | 2 (25.0%) |
| $100,000 to $299,999 | 3 (16.7%) | 0 (0.0%) |
| $300,000 to $499,999 | 0 (0.0%) | 0 (0.0%) |
| $500,000 to $749,999 | 0 (0.0%) | 0 (0.0%) |
| $750,000 to $999,999 | 1 (5.6%) | 0 (0.0%) |
| $1,000,000 or more | 1 (5.6%) | 0 (0.0%) |
| Total | 18 (100.0%) | 8 (100.0%) |
Household Income by Mortgage Status in Black Springs
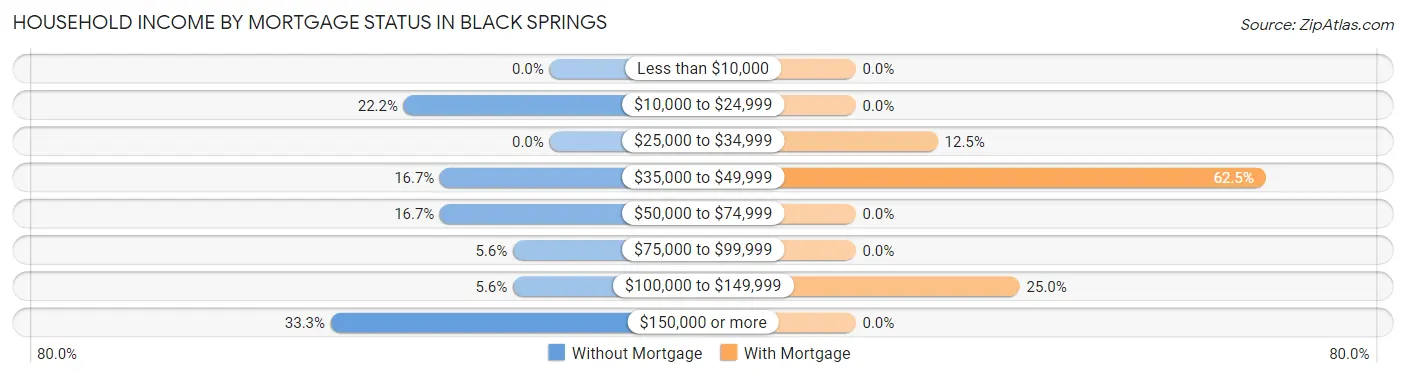
| Household Income | Without Mortgage | With Mortgage |
| Less than $10,000 | 0 (0.0%) | 0 (0.0%) |
| $10,000 to $24,999 | 4 (22.2%) | 0 (0.0%) |
| $25,000 to $34,999 | 0 (0.0%) | 1 (12.5%) |
| $35,000 to $49,999 | 3 (16.7%) | 5 (62.5%) |
| $50,000 to $74,999 | 3 (16.7%) | 0 (0.0%) |
| $75,000 to $99,999 | 1 (5.6%) | 0 (0.0%) |
| $100,000 to $149,999 | 1 (5.6%) | 2 (25.0%) |
| $150,000 or more | 6 (33.3%) | 0 (0.0%) |
| Total | 18 (100.0%) | 8 (100.0%) |
Property Value to Household Income Ratio in Black Springs
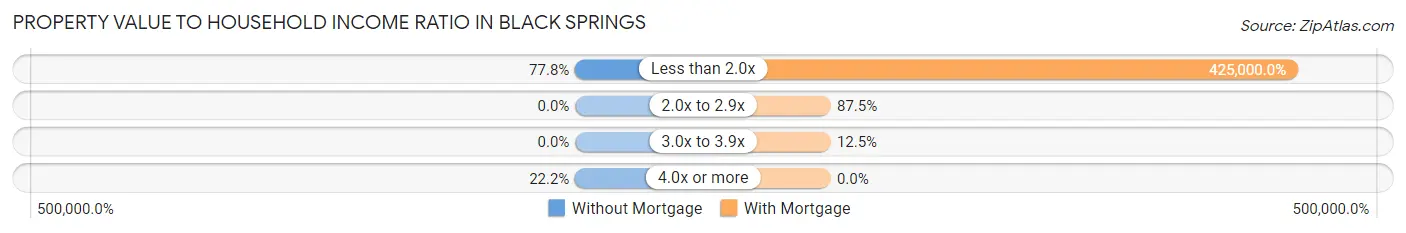
| Value-to-Income Ratio | Without Mortgage | With Mortgage |
| Less than 2.0x | 14 (77.8%) | 34,000 (425,000.0%) |
| 2.0x to 2.9x | 0 (0.0%) | 7 (87.5%) |
| 3.0x to 3.9x | 0 (0.0%) | 1 (12.5%) |
| 4.0x or more | 4 (22.2%) | 0 (0.0%) |
| Total | 18 (100.0%) | 8 (100.0%) |
Real Estate Taxes by Mortgage Status in Black Springs
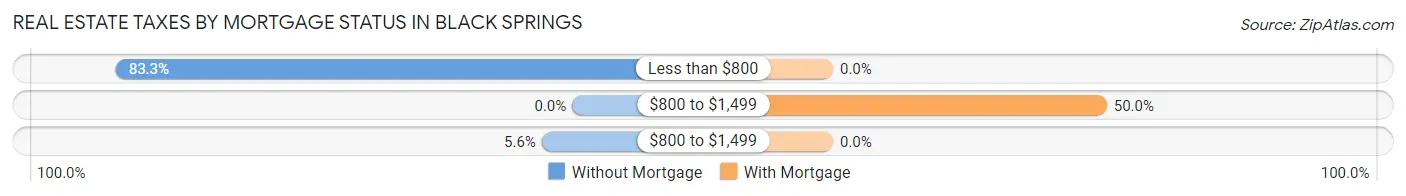
| Property Taxes | Without Mortgage | With Mortgage |
| Less than $800 | 15 (83.3%) | 0 (0.0%) |
| $800 to $1,499 | 0 (0.0%) | 4 (50.0%) |
| $800 to $1,499 | 1 (5.6%) | 0 (0.0%) |
| Total | 18 (100.0%) | 8 (100.0%) |
Health & Disability in Black Springs
Health Insurance Coverage by Age in Black Springs
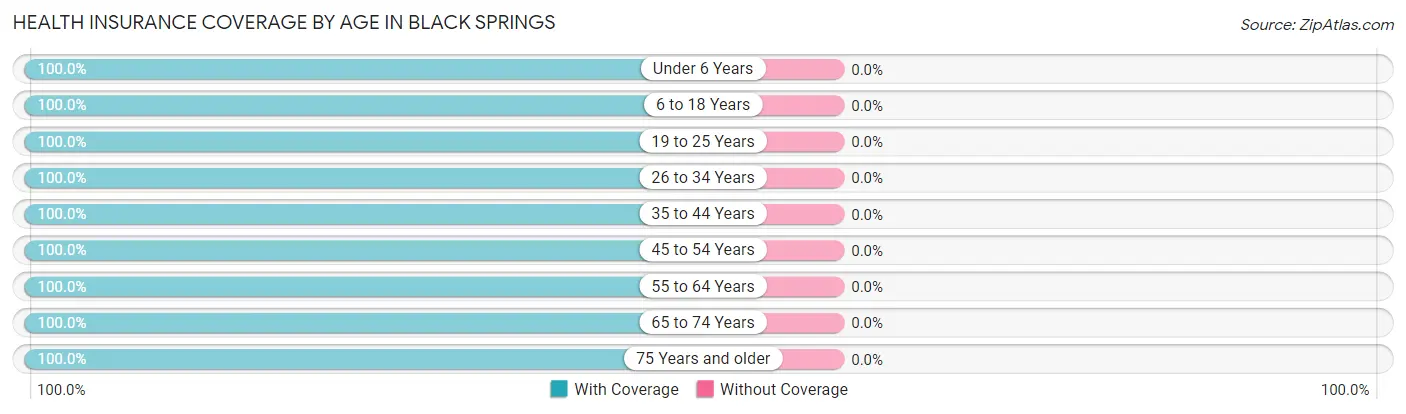
| Age Bracket | With Coverage | Without Coverage |
| Under 6 Years | 5 (100.0%) | 0 (0.0%) |
| 6 to 18 Years | 31 (100.0%) | 0 (0.0%) |
| 19 to 25 Years | 5 (100.0%) | 0 (0.0%) |
| 26 to 34 Years | 2 (100.0%) | 0 (0.0%) |
| 35 to 44 Years | 8 (100.0%) | 0 (0.0%) |
| 45 to 54 Years | 18 (100.0%) | 0 (0.0%) |
| 55 to 64 Years | 7 (100.0%) | 0 (0.0%) |
| 65 to 74 Years | 5 (100.0%) | 0 (0.0%) |
| 75 Years and older | 8 (100.0%) | 0 (0.0%) |
| Total | 89 (100.0%) | 0 (0.0%) |
Health Insurance Coverage by Citizenship Status in Black Springs
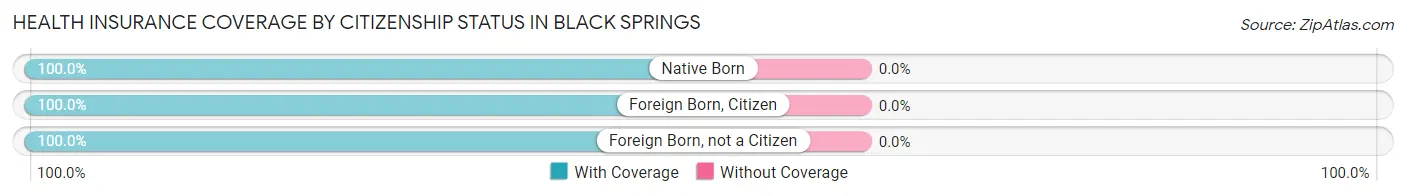
| Citizenship Status | With Coverage | Without Coverage |
| Native Born | 5 (100.0%) | 0 (0.0%) |
| Foreign Born, Citizen | 31 (100.0%) | 0 (0.0%) |
| Foreign Born, not a Citizen | 5 (100.0%) | 0 (0.0%) |
Health Insurance Coverage by Household Income in Black Springs
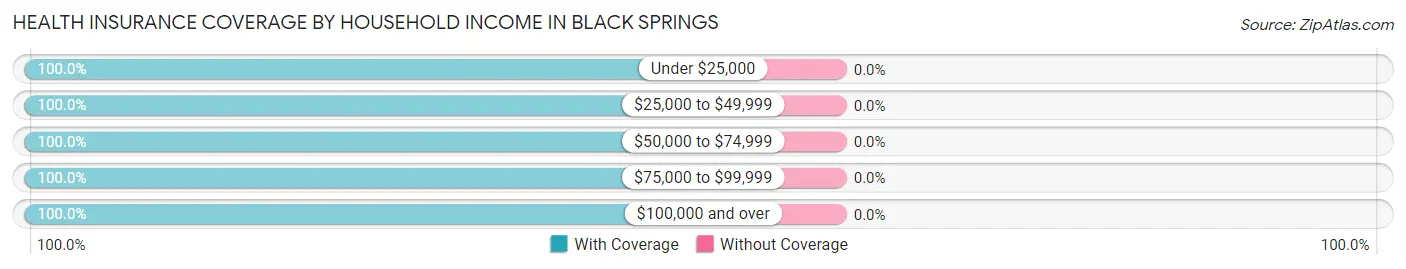
| Household Income | With Coverage | Without Coverage |
| Under $25,000 | 17 (100.0%) | 0 (0.0%) |
| $25,000 to $49,999 | 37 (100.0%) | 0 (0.0%) |
| $50,000 to $74,999 | 14 (100.0%) | 0 (0.0%) |
| $75,000 to $99,999 | 6 (100.0%) | 0 (0.0%) |
| $100,000 and over | 15 (100.0%) | 0 (0.0%) |
Public vs Private Health Insurance Coverage by Age in Black Springs
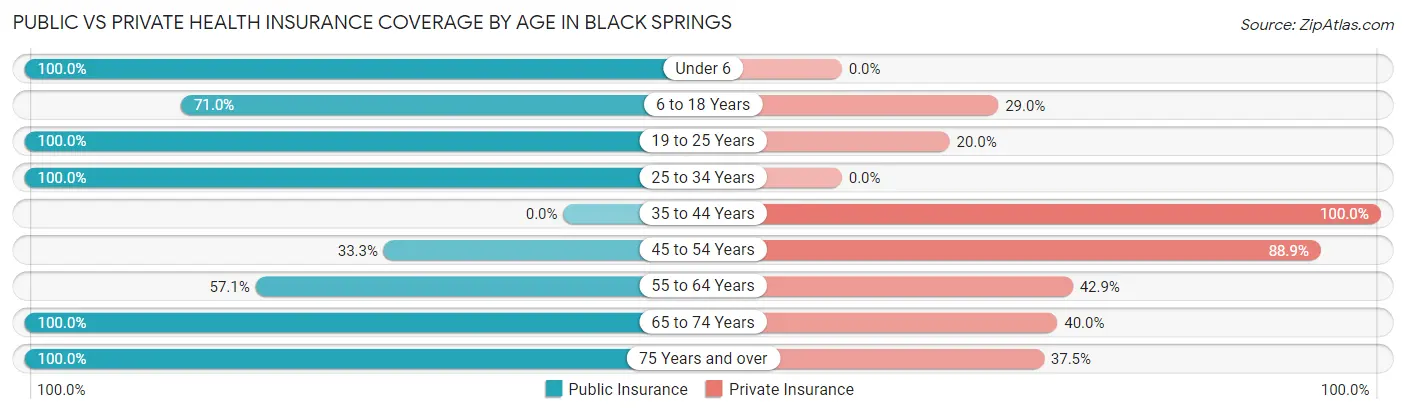
| Age Bracket | Public Insurance | Private Insurance |
| Under 6 | 5 (100.0%) | 0 (0.0%) |
| 6 to 18 Years | 22 (71.0%) | 9 (29.0%) |
| 19 to 25 Years | 5 (100.0%) | 1 (20.0%) |
| 25 to 34 Years | 2 (100.0%) | 0 (0.0%) |
| 35 to 44 Years | 0 (0.0%) | 8 (100.0%) |
| 45 to 54 Years | 6 (33.3%) | 16 (88.9%) |
| 55 to 64 Years | 4 (57.1%) | 3 (42.9%) |
| 65 to 74 Years | 5 (100.0%) | 2 (40.0%) |
| 75 Years and over | 8 (100.0%) | 3 (37.5%) |
| Total | 57 (64.0%) | 42 (47.2%) |
Disability Status by Sex by Age in Black Springs
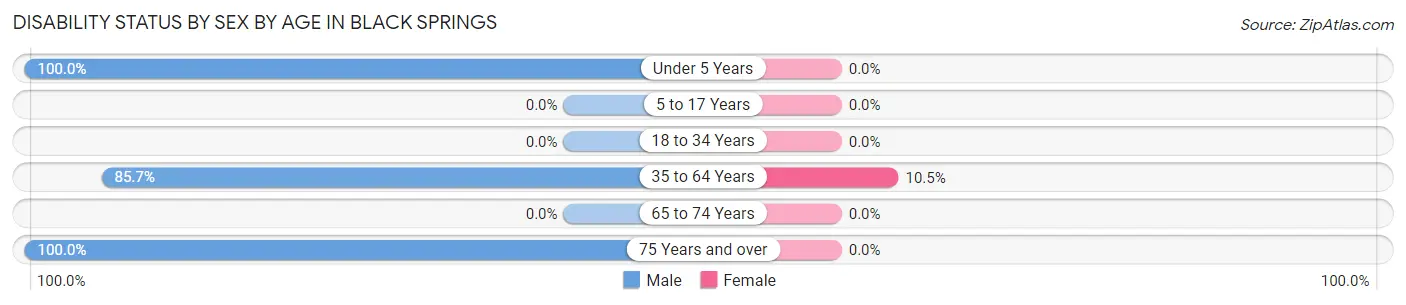
| Age Bracket | Male | Female |
| Under 5 Years | 2 (100.0%) | 0 (0.0%) |
| 5 to 17 Years | 0 (0.0%) | 0 (0.0%) |
| 18 to 34 Years | 0 (0.0%) | 0 (0.0%) |
| 35 to 64 Years | 12 (85.7%) | 2 (10.5%) |
| 65 to 74 Years | 0 (0.0%) | 0 (0.0%) |
| 75 Years and over | 3 (100.0%) | 0 (0.0%) |
Disability Class by Sex by Age in Black Springs
Disability Class: Hearing Difficulty
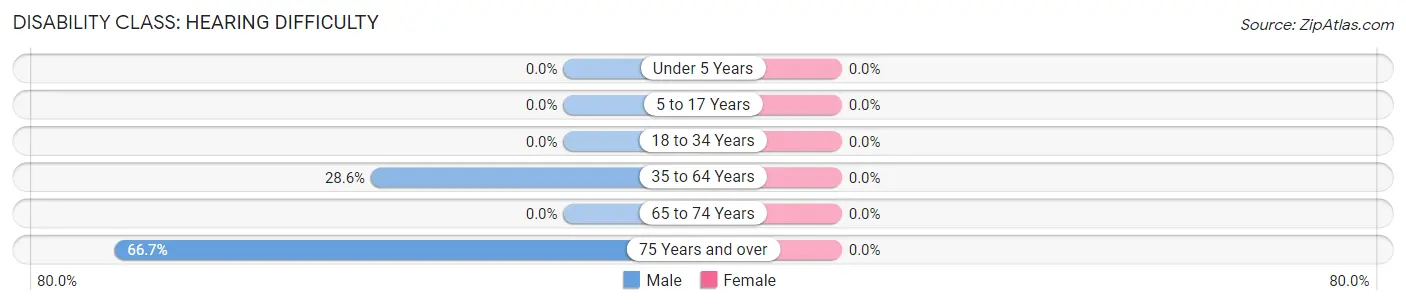
| Age Bracket | Male | Female |
| Under 5 Years | 0 (0.0%) | 0 (0.0%) |
| 5 to 17 Years | 0 (0.0%) | 0 (0.0%) |
| 18 to 34 Years | 0 (0.0%) | 0 (0.0%) |
| 35 to 64 Years | 4 (28.6%) | 0 (0.0%) |
| 65 to 74 Years | 0 (0.0%) | 0 (0.0%) |
| 75 Years and over | 2 (66.7%) | 0 (0.0%) |
Disability Class: Vision Difficulty
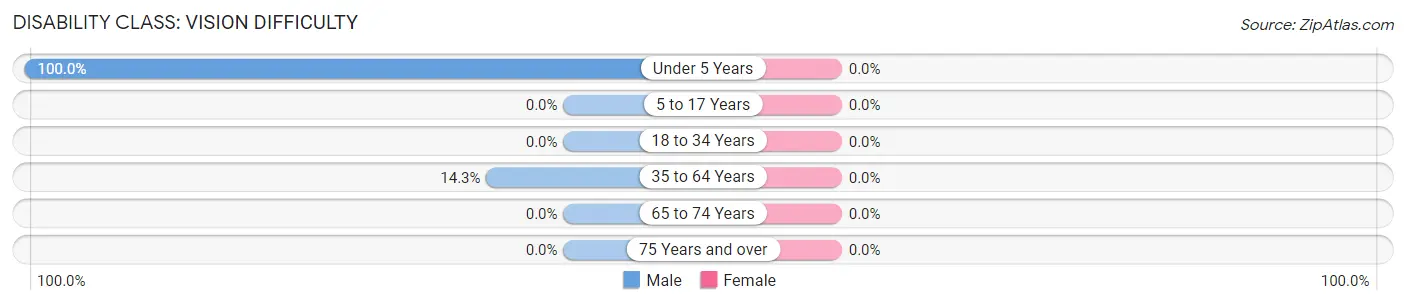
| Age Bracket | Male | Female |
| Under 5 Years | 2 (100.0%) | 0 (0.0%) |
| 5 to 17 Years | 0 (0.0%) | 0 (0.0%) |
| 18 to 34 Years | 0 (0.0%) | 0 (0.0%) |
| 35 to 64 Years | 2 (14.3%) | 0 (0.0%) |
| 65 to 74 Years | 0 (0.0%) | 0 (0.0%) |
| 75 Years and over | 0 (0.0%) | 0 (0.0%) |
Disability Class: Cognitive Difficulty
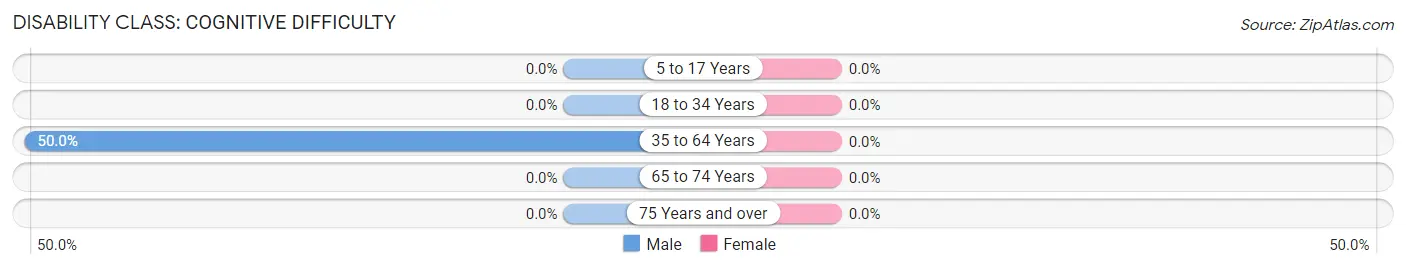
| Age Bracket | Male | Female |
| 5 to 17 Years | 0 (0.0%) | 0 (0.0%) |
| 18 to 34 Years | 0 (0.0%) | 0 (0.0%) |
| 35 to 64 Years | 7 (50.0%) | 0 (0.0%) |
| 65 to 74 Years | 0 (0.0%) | 0 (0.0%) |
| 75 Years and over | 0 (0.0%) | 0 (0.0%) |
Disability Class: Ambulatory Difficulty
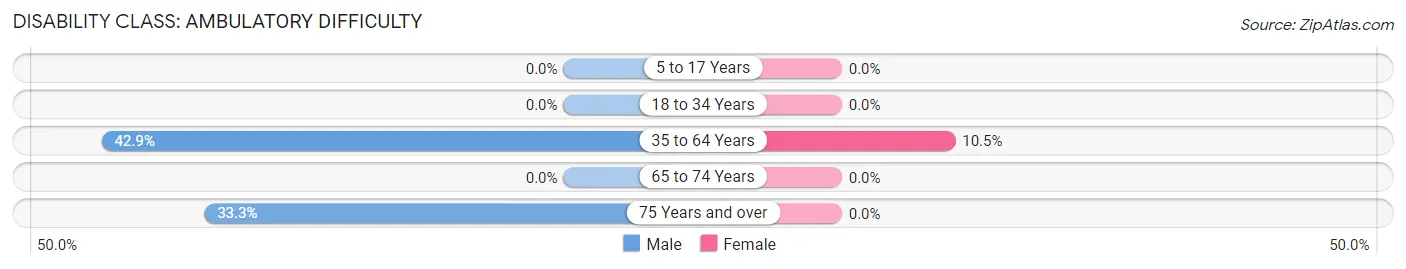
| Age Bracket | Male | Female |
| 5 to 17 Years | 0 (0.0%) | 0 (0.0%) |
| 18 to 34 Years | 0 (0.0%) | 0 (0.0%) |
| 35 to 64 Years | 6 (42.9%) | 2 (10.5%) |
| 65 to 74 Years | 0 (0.0%) | 0 (0.0%) |
| 75 Years and over | 1 (33.3%) | 0 (0.0%) |
Disability Class: Self-Care Difficulty
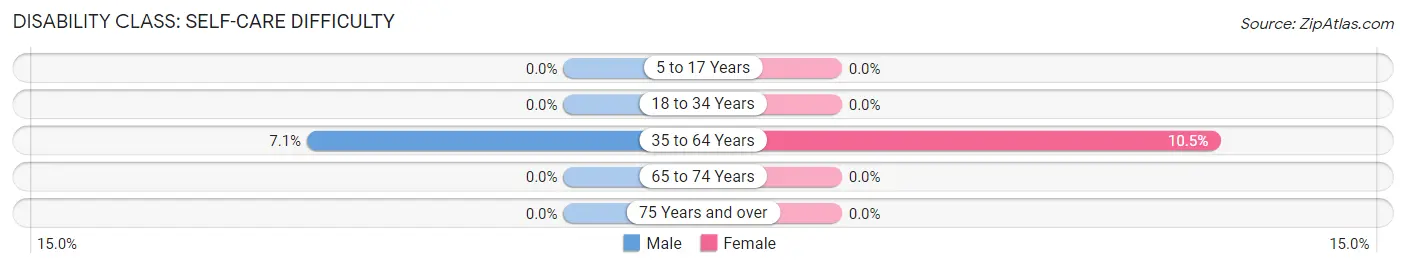
| Age Bracket | Male | Female |
| 5 to 17 Years | 0 (0.0%) | 0 (0.0%) |
| 18 to 34 Years | 0 (0.0%) | 0 (0.0%) |
| 35 to 64 Years | 1 (7.1%) | 2 (10.5%) |
| 65 to 74 Years | 0 (0.0%) | 0 (0.0%) |
| 75 Years and over | 0 (0.0%) | 0 (0.0%) |
Technology Access in Black Springs
Computing Device Access in Black Springs
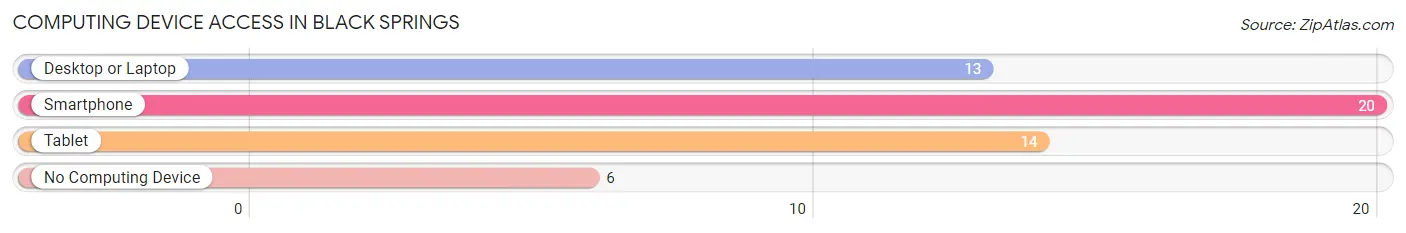
| Device Type | # Households | % Households |
| Desktop or Laptop | 13 | 50.0% |
| Smartphone | 20 | 76.9% |
| Tablet | 14 | 53.8% |
| No Computing Device | 6 | 23.1% |
| Total | 26 | 100.0% |
Internet Access in Black Springs
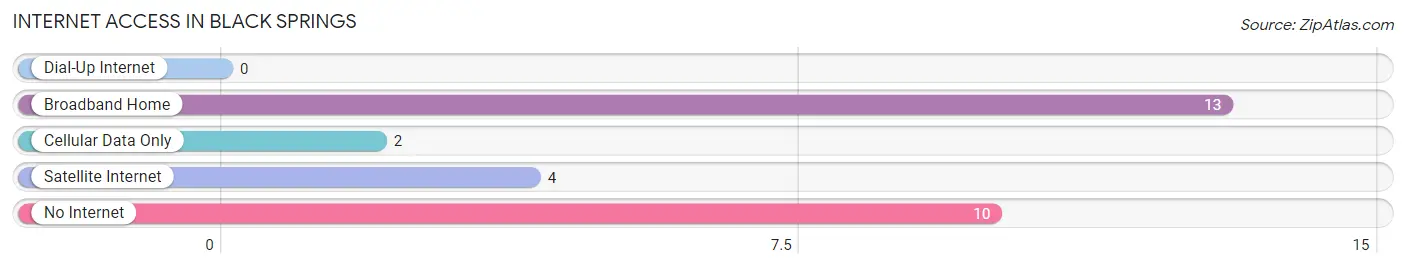
| Internet Type | # Households | % Households |
| Dial-Up Internet | 0 | 0.0% |
| Broadband Home | 13 | 50.0% |
| Cellular Data Only | 2 | 7.7% |
| Satellite Internet | 4 | 15.4% |
| No Internet | 10 | 38.5% |
| Total | 26 | 100.0% |
Black Springs Summary
History
Black Springs is a small unincorporated community located in the Ozark Mountains of Arkansas. It is situated in the northwest corner of the state, near the Oklahoma border. The community was first settled in the early 1800s by settlers from Tennessee and Kentucky. The first settlers were primarily farmers and loggers, and the area was known for its abundant timber and fertile soil.
The town was officially established in 1883, when the post office was established. The town was named after the nearby Black Springs, which were believed to have healing properties. The springs were a popular destination for travelers and settlers alike, and the town quickly grew in size and importance.
In the early 1900s, the town was a bustling center of commerce and industry. The town had several stores, a hotel, a bank, a sawmill, and a cotton gin. The town also had a school, a church, and a newspaper.
The town's economy was largely based on agriculture, and the area was known for its production of cotton, corn, and other crops. The town also had a thriving timber industry, and the surrounding forests were home to a variety of wildlife.
In the late 1950s, the town began to decline as the timber industry declined and the population began to move away. The town's population has remained relatively stable since then, and the town is now home to about 200 people.
Geography
Black Springs is located in the northwest corner of Arkansas, near the Oklahoma border. The town is situated in the Ozark Mountains, and the surrounding area is characterized by rolling hills and dense forests. The town is located near the Black Springs, which are believed to have healing properties.
The town is located about 30 miles from the nearest major city, Fayetteville. The nearest major highway is Interstate 40, which runs through the town.
Economy
The economy of Black Springs is largely based on agriculture. The town is known for its production of cotton, corn, and other crops. The town also has a thriving timber industry, and the surrounding forests are home to a variety of wildlife.
The town also has a few small businesses, including a general store, a gas station, and a restaurant. The town also has a post office and a bank.
Demographics
As of the 2010 census, the population of Black Springs was 200 people. The town is predominantly white, with about 95% of the population being white. The median household income is $30,000, and the median age is 44 years. The town has a low unemployment rate, and the poverty rate is below the national average.
Common Questions
What is Per Capita Income in Black Springs?
Per Capita income in Black Springs is $26,764.
What is the Median Household income in Black Springs?
Median Household Income in Black Springs is $55,000.
What is Family Income Deficit in Black Springs?
Family Income Deficit in Black Springs is $5,367.
Families that are below poverty line in Black Springs earn $5,367 less on average than the poverty threshold level.
What is Inequality or Gini Index in Black Springs?
Inequality or Gini Index in Black Springs is 0.41.
What is the Total Population of Black Springs?
Total Population of Black Springs is 89.
What is the Total Male Population of Black Springs?
Total Male Population of Black Springs is 50.
What is the Total Female Population of Black Springs?
Total Female Population of Black Springs is 39.
What is the Ratio of Males per 100 Females in Black Springs?
There are 128.21 Males per 100 Females in Black Springs.
What is the Ratio of Females per 100 Males in Black Springs?
There are 78.00 Females per 100 Males in Black Springs.
What is the Median Population Age in Black Springs?
Median Population Age in Black Springs is 35.8 Years.
What is the Average Family Size in Black Springs
Average Family Size in Black Springs is 4.2 People.
What is the Average Household Size in Black Springs
Average Household Size in Black Springs is 3.4 People.
How Large is the Labor Force in Black Springs?
There are 22 People in the Labor Forcein in Black Springs.
What is the Percentage of People in the Labor Force in Black Springs?
31.0% of People are in the Labor Force in Black Springs.
What is the Unemployment Rate in Black Springs?
Unemployment Rate in Black Springs is 18.2%.