Belfry, KY Map & Demographics
Belfry Map
Belfry Overview
$61,844
PER CAPITA INCOME
$132,361
AVG FAMILY INCOME
$131,597
AVG HOUSEHOLD INCOME
0.23
INEQUALITY / GINI INDEX
233
TOTAL POPULATION
156
MALE POPULATION
77
FEMALE POPULATION
202.60
MALES / 100 FEMALES
49.36
FEMALES / 100 MALES
54.6
MEDIAN AGE
2.3
AVG FAMILY SIZE
2.0
AVG HOUSEHOLD SIZE
122
LABOR FORCE [ PEOPLE ]
54.7%
PERCENT IN LABOR FORCE
38.5%
UNEMPLOYMENT RATE
Belfry Zip Codes
Belfry Area Codes
Income in Belfry
Income Overview in Belfry
Per Capita Income in Belfry is $61,844, while median incomes of families and households are $132,361 and $131,597 respectively.
| Characteristic | Number | Measure |
| Per Capita Income | 233 | $61,844 |
| Median Family Income | 92 | $132,361 |
| Mean Family Income | 92 | $144,134 |
| Median Household Income | 114 | $131,597 |
| Mean Household Income | 114 | $121,429 |
| Income Deficit | 92 | $0 |
| Wage / Income Gap (%) | 233 | 0.00% |
| Wage / Income Gap ($) | 233 | 100.00¢ per $1 |
| Gini / Inequality Index | 233 | 0.23 |
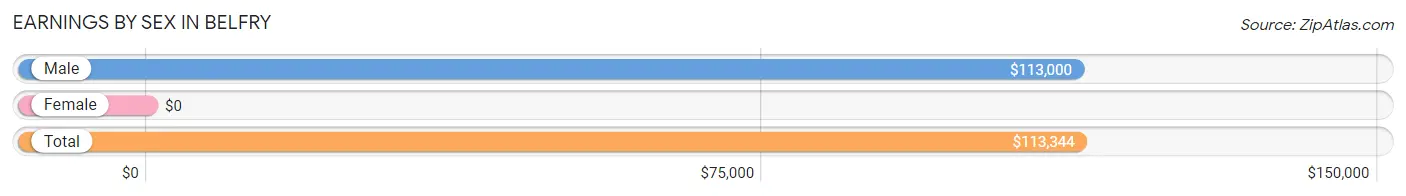
Earnings by Sex in Belfry
| Sex | Number | Average Earnings |
| Male | 64 (85.3%) | $113,000 |
| Female | 11 (14.7%) | $0 |
| Total | 75 (100.0%) | $113,344 |
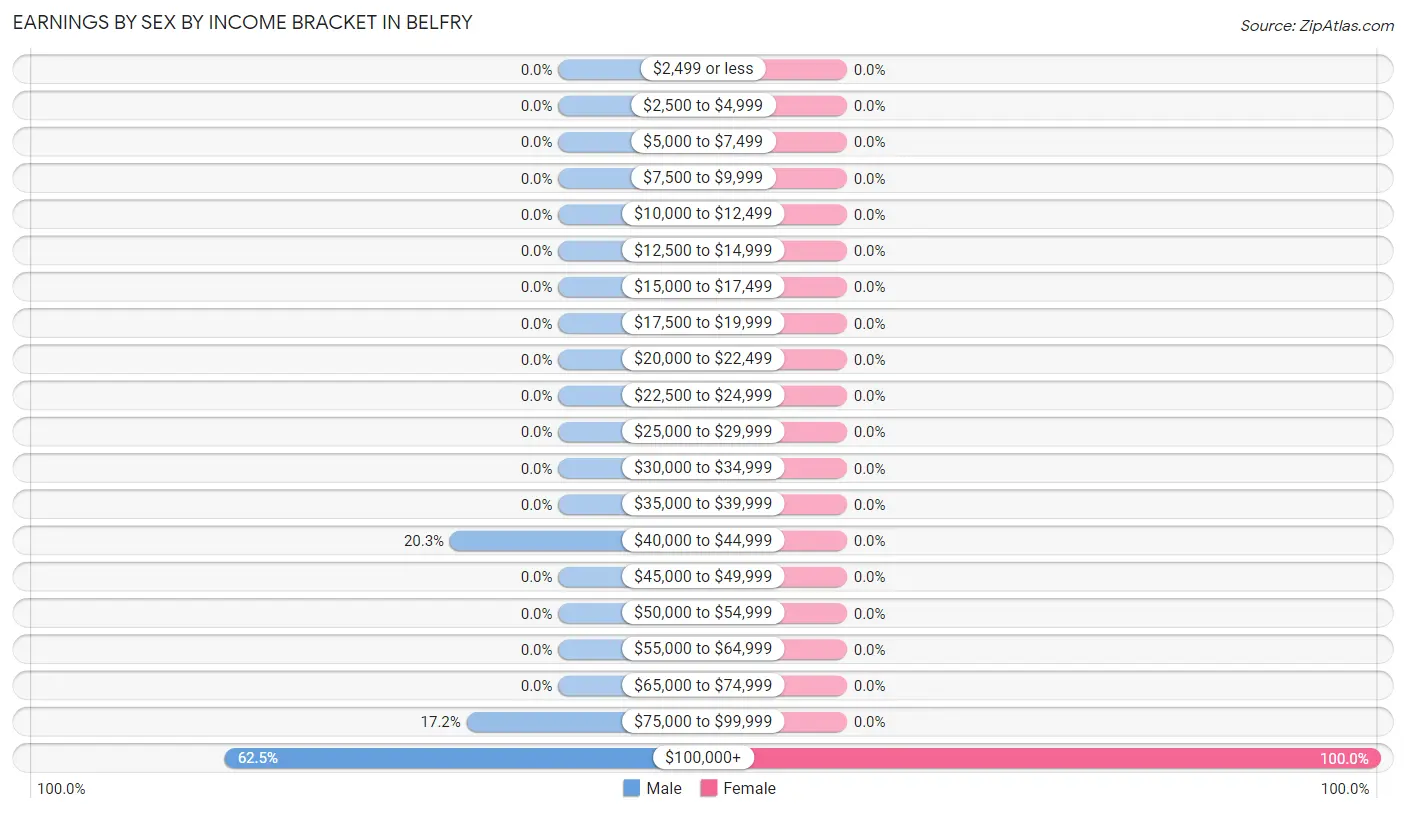
Earnings by Sex by Income Bracket in Belfry
The most common earnings brackets in Belfry are $100,000+ for men (40 | 62.5%) and $100,000+ for women (11 | 100.0%).
| Income | Male | Female |
| $2,499 or less | 0 (0.0%) | 0 (0.0%) |
| $2,500 to $4,999 | 0 (0.0%) | 0 (0.0%) |
| $5,000 to $7,499 | 0 (0.0%) | 0 (0.0%) |
| $7,500 to $9,999 | 0 (0.0%) | 0 (0.0%) |
| $10,000 to $12,499 | 0 (0.0%) | 0 (0.0%) |
| $12,500 to $14,999 | 0 (0.0%) | 0 (0.0%) |
| $15,000 to $17,499 | 0 (0.0%) | 0 (0.0%) |
| $17,500 to $19,999 | 0 (0.0%) | 0 (0.0%) |
| $20,000 to $22,499 | 0 (0.0%) | 0 (0.0%) |
| $22,500 to $24,999 | 0 (0.0%) | 0 (0.0%) |
| $25,000 to $29,999 | 0 (0.0%) | 0 (0.0%) |
| $30,000 to $34,999 | 0 (0.0%) | 0 (0.0%) |
| $35,000 to $39,999 | 0 (0.0%) | 0 (0.0%) |
| $40,000 to $44,999 | 13 (20.3%) | 0 (0.0%) |
| $45,000 to $49,999 | 0 (0.0%) | 0 (0.0%) |
| $50,000 to $54,999 | 0 (0.0%) | 0 (0.0%) |
| $55,000 to $64,999 | 0 (0.0%) | 0 (0.0%) |
| $65,000 to $74,999 | 0 (0.0%) | 0 (0.0%) |
| $75,000 to $99,999 | 11 (17.2%) | 0 (0.0%) |
| $100,000+ | 40 (62.5%) | 11 (100.0%) |
| Total | 64 (100.0%) | 11 (100.0%) |
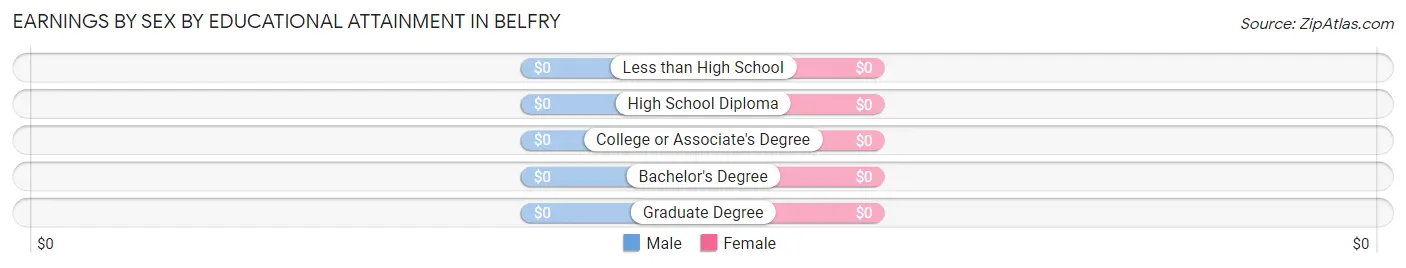
Earnings by Sex by Educational Attainment in Belfry
| Educational Attainment | Male Income | Female Income |
| Less than High School | - | - |
| High School Diploma | - | - |
| College or Associate's Degree | - | - |
| Bachelor's Degree | - | - |
| Graduate Degree | - | - |
| Total | $113,000 | $0 |
Family Income in Belfry
Family Income Brackets in Belfry
According to the Belfry family income data, there are 81 families falling into the $100,000 to $149,999 income range, which is the most common income bracket and makes up 88.0% of all families.
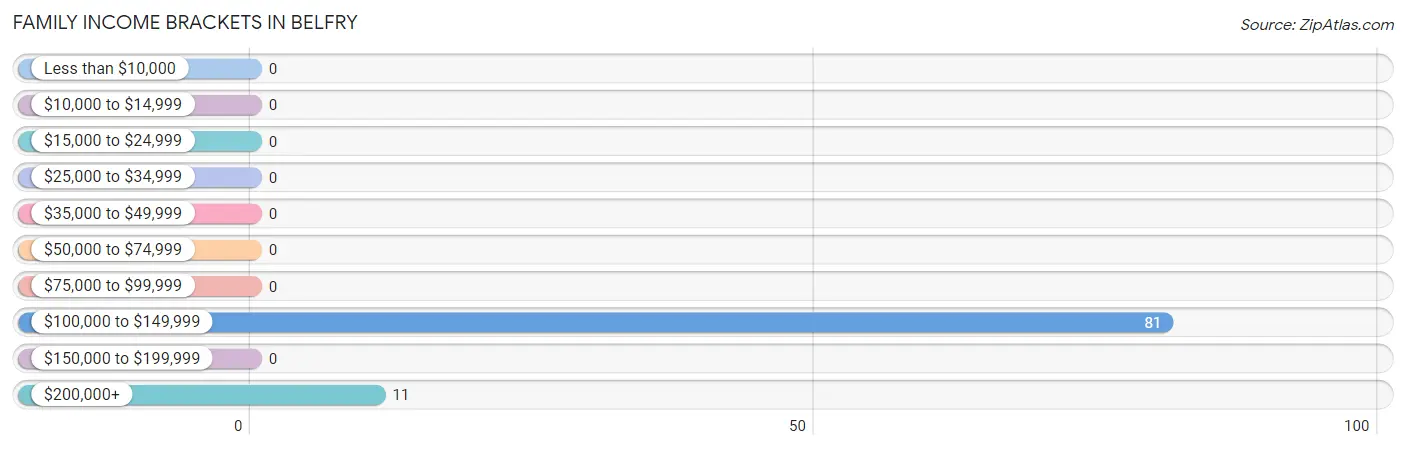
| Income Bracket | # Families | % Families |
| Less than $10,000 | 0 | 0.0% |
| $10,000 to $14,999 | 0 | 0.0% |
| $15,000 to $24,999 | 0 | 0.0% |
| $25,000 to $34,999 | 0 | 0.0% |
| $35,000 to $49,999 | 0 | 0.0% |
| $50,000 to $74,999 | 0 | 0.0% |
| $75,000 to $99,999 | 0 | 0.0% |
| $100,000 to $149,999 | 81 | 88.0% |
| $150,000 to $199,999 | 0 | 0.0% |
| $200,000+ | 11 | 12.0% |
Family Income by Famaliy Size in Belfry
2-person families (81 | 88.0%) account for the highest median family income in Belfry with $131,979 per family, while 2-person families (81 | 88.0%) have the highest median income of $65,990 per family member.
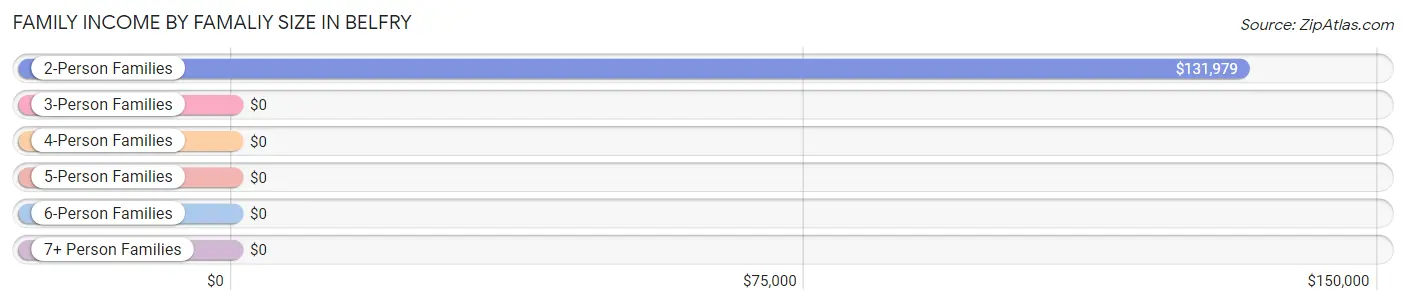
| Income Bracket | # Families | Median Income |
| 2-Person Families | 81 (88.0%) | $131,979 |
| 3-Person Families | 11 (12.0%) | $0 |
| 4-Person Families | 0 (0.0%) | $0 |
| 5-Person Families | 0 (0.0%) | $0 |
| 6-Person Families | 0 (0.0%) | $0 |
| 7+ Person Families | 0 (0.0%) | $0 |
| Total | 92 (100.0%) | $132,361 |
Family Income by Number of Earners in Belfry
| Number of Earners | # Families | Median Income |
| No Earners | 45 (48.9%) | $0 |
| 1 Earner | 36 (39.1%) | $0 |
| 2 Earners | 11 (12.0%) | $0 |
| 3+ Earners | 0 (0.0%) | $0 |
| Total | 92 (100.0%) | $132,361 |
Household Income in Belfry
Household Income Brackets in Belfry
With 81 households falling in the category, the $100,000 to $149,999 income range is the most frequent in Belfry, accounting for 71.1% of all households.
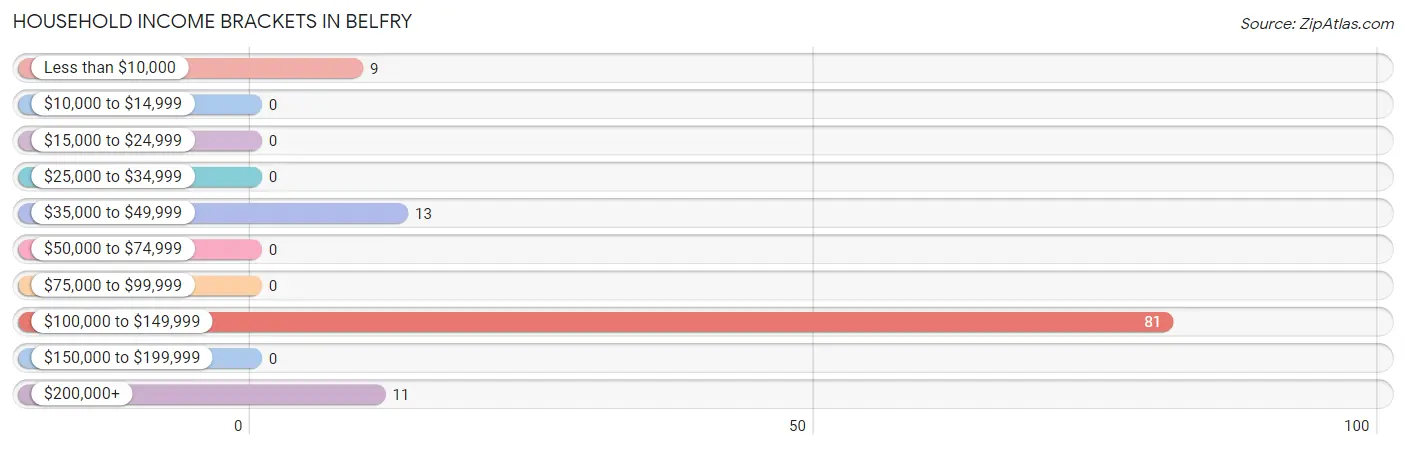
| Income Bracket | # Households | % Households |
| Less than $10,000 | 9 | 7.9% |
| $10,000 to $14,999 | 0 | 0.0% |
| $15,000 to $24,999 | 0 | 0.0% |
| $25,000 to $34,999 | 0 | 0.0% |
| $35,000 to $49,999 | 13 | 11.4% |
| $50,000 to $74,999 | 0 | 0.0% |
| $75,000 to $99,999 | 0 | 0.0% |
| $100,000 to $149,999 | 81 | 71.1% |
| $150,000 to $199,999 | 0 | 0.0% |
| $200,000+ | 11 | 9.6% |
Household Income by Householder Age in Belfry
| Income Bracket | # Households | Median Income |
| 15 to 24 Years | 0 (0.0%) | $0 |
| 25 to 44 Years | 24 (21.0%) | $0 |
| 45 to 64 Years | 21 (18.4%) | $0 |
| 65+ Years | 69 (60.5%) | $0 |
| Total | 114 (100.0%) | $131,597 |
Poverty in Belfry
Income Below Poverty by Sex and Age in Belfry
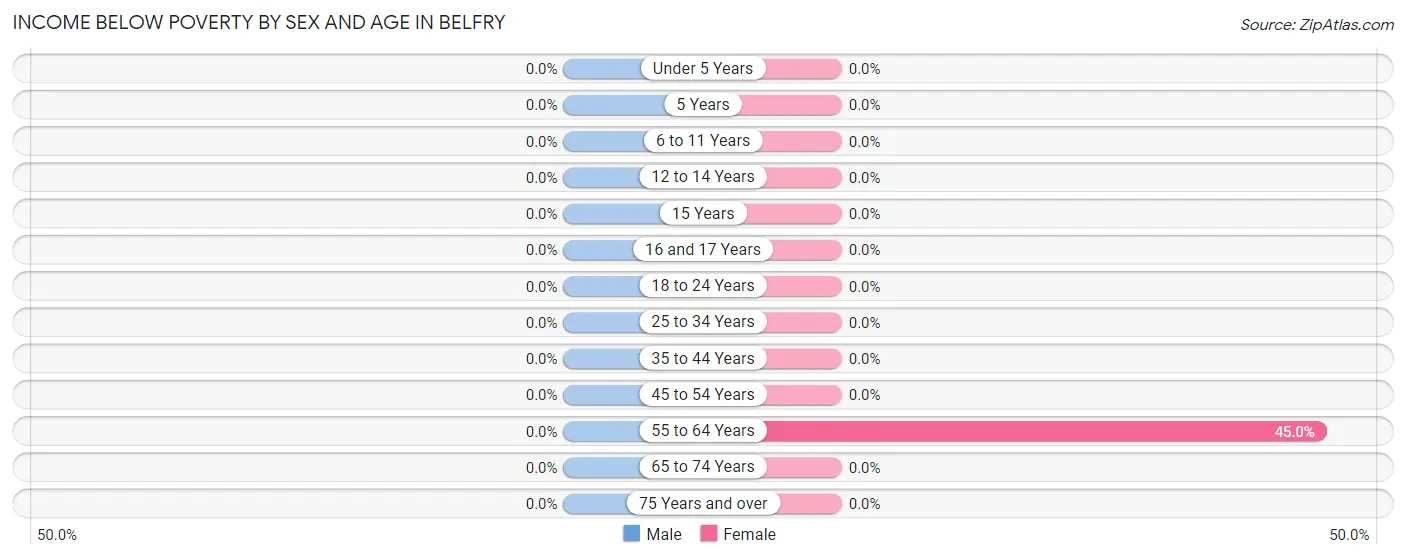
| Age Bracket | Male | Female |
| Under 5 Years | 0 (0.0%) | 0 (0.0%) |
| 5 Years | 0 (0.0%) | 0 (0.0%) |
| 6 to 11 Years | 0 (0.0%) | 0 (0.0%) |
| 12 to 14 Years | 0 (0.0%) | 0 (0.0%) |
| 15 Years | 0 (0.0%) | 0 (0.0%) |
| 16 and 17 Years | 0 (0.0%) | 0 (0.0%) |
| 18 to 24 Years | 0 (0.0%) | 0 (0.0%) |
| 25 to 34 Years | 0 (0.0%) | 0 (0.0%) |
| 35 to 44 Years | 0 (0.0%) | 0 (0.0%) |
| 45 to 54 Years | 0 (0.0%) | 0 (0.0%) |
| 55 to 64 Years | 0 (0.0%) | 9 (45.0%) |
| 65 to 74 Years | 0 (0.0%) | 0 (0.0%) |
| 75 Years and over | 0 (0.0%) | 0 (0.0%) |
| Total | 0 (0.0%) | 9 (11.7%) |
Income Above Poverty by Sex and Age in Belfry
According to the poverty statistics in Belfry, males aged 18 to 24 years and females aged under 5 years are the age groups that are most secure financially, with 100.0% of males and 100.0% of females in these age groups living above the poverty line.
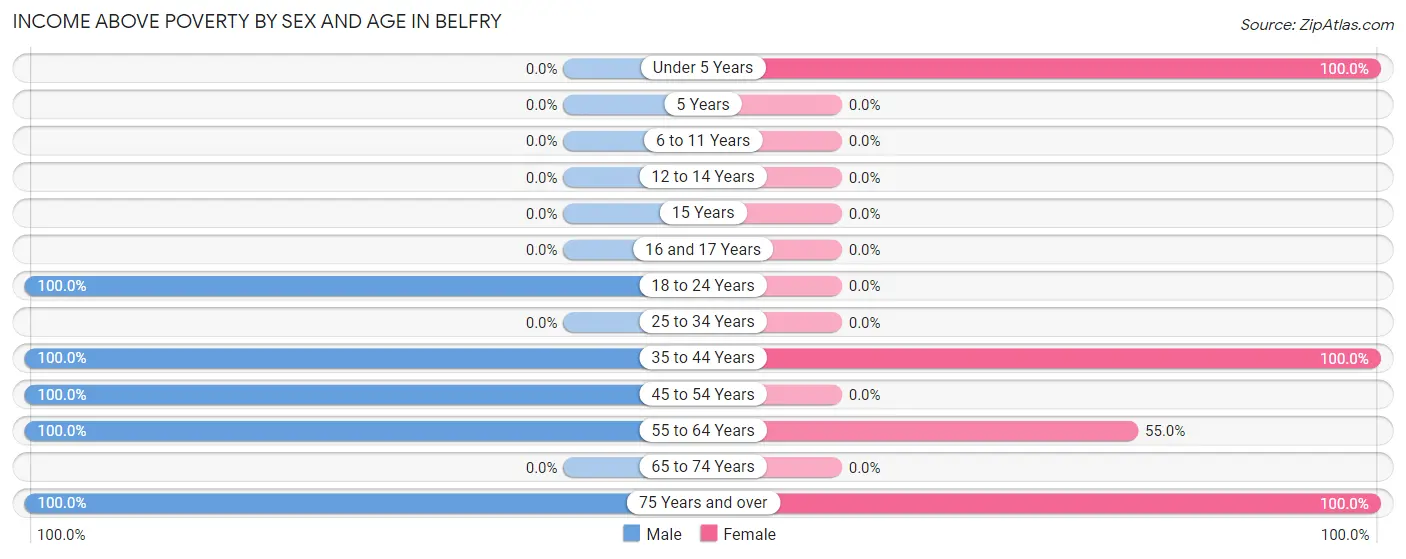
| Age Bracket | Male | Female |
| Under 5 Years | 0 (0.0%) | 10 (100.0%) |
| 5 Years | 0 (0.0%) | 0 (0.0%) |
| 6 to 11 Years | 0 (0.0%) | 0 (0.0%) |
| 12 to 14 Years | 0 (0.0%) | 0 (0.0%) |
| 15 Years | 0 (0.0%) | 0 (0.0%) |
| 16 and 17 Years | 0 (0.0%) | 0 (0.0%) |
| 18 to 24 Years | 47 (100.0%) | 0 (0.0%) |
| 25 to 34 Years | 0 (0.0%) | 0 (0.0%) |
| 35 to 44 Years | 24 (100.0%) | 11 (100.0%) |
| 45 to 54 Years | 40 (100.0%) | 0 (0.0%) |
| 55 to 64 Years | 12 (100.0%) | 11 (55.0%) |
| 65 to 74 Years | 0 (0.0%) | 0 (0.0%) |
| 75 Years and over | 33 (100.0%) | 36 (100.0%) |
| Total | 156 (100.0%) | 68 (88.3%) |
Income Below Poverty Among Married-Couple Families in Belfry
| Children | Above Poverty | Below Poverty |
| No Children | 12 (100.0%) | 0 (0.0%) |
| 1 or 2 Children | 11 (100.0%) | 0 (0.0%) |
| 3 or 4 Children | 0 (0.0%) | 0 (0.0%) |
| 5 or more Children | 0 (0.0%) | 0 (0.0%) |
| Total | 23 (100.0%) | 0 (0.0%) |
Income Below Poverty Among Single-Parent Households in Belfry
| Children | Single Father | Single Mother |
| No Children | 0 (0.0%) | 0 (0.0%) |
| 1 or 2 Children | 0 (0.0%) | 0 (0.0%) |
| 3 or 4 Children | 0 (0.0%) | 0 (0.0%) |
| 5 or more Children | 0 (0.0%) | 0 (0.0%) |
| Total | 0 (0.0%) | 0 (0.0%) |
Income Below Poverty Among Married-Couple vs Single-Parent Households in Belfry
| Children | Married-Couple Families | Single-Parent Households |
| No Children | 0 (0.0%) | 0 (0.0%) |
| 1 or 2 Children | 0 (0.0%) | 0 (0.0%) |
| 3 or 4 Children | 0 (0.0%) | 0 (0.0%) |
| 5 or more Children | 0 (0.0%) | 0 (0.0%) |
| Total | 0 (0.0%) | 0 (0.0%) |
Race in Belfry
The most populous races in Belfry are , and White / Caucasian (233 | 100.0%).
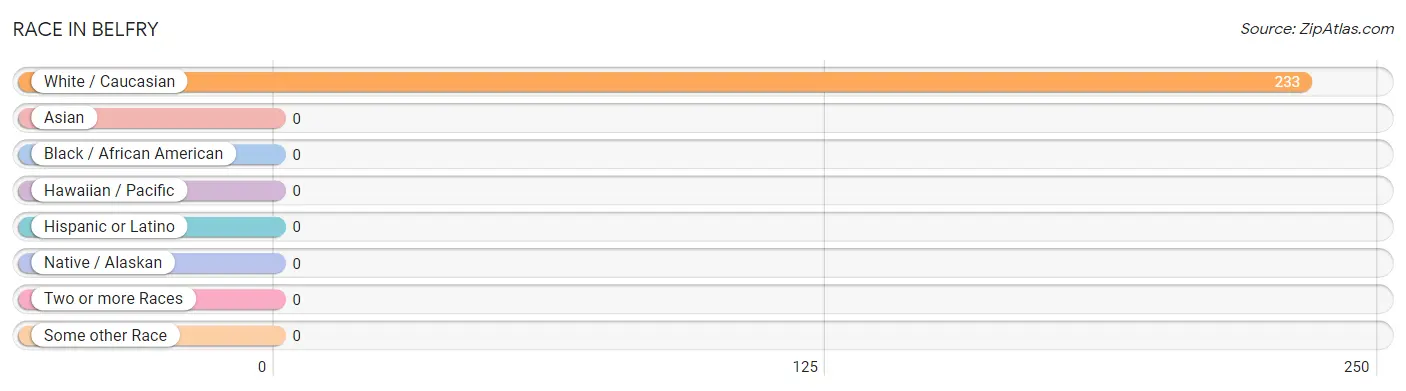
| Race | # Population | % Population |
| Asian | 0 | 0.0% |
| Black / African American | 0 | 0.0% |
| Hawaiian / Pacific | 0 | 0.0% |
| Hispanic or Latino | 0 | 0.0% |
| Native / Alaskan | 0 | 0.0% |
| White / Caucasian | 233 | 100.0% |
| Two or more Races | 0 | 0.0% |
| Some other Race | 0 | 0.0% |
| Total | 233 | 100.0% |
Ancestry in Belfry
The most populous ancestries reported in Belfry are Scotch-Irish (80 | 34.3%), English (32 | 13.7%), British (23 | 9.9%), and American (13 | 5.6%), together accounting for 63.5% of all Belfry residents.
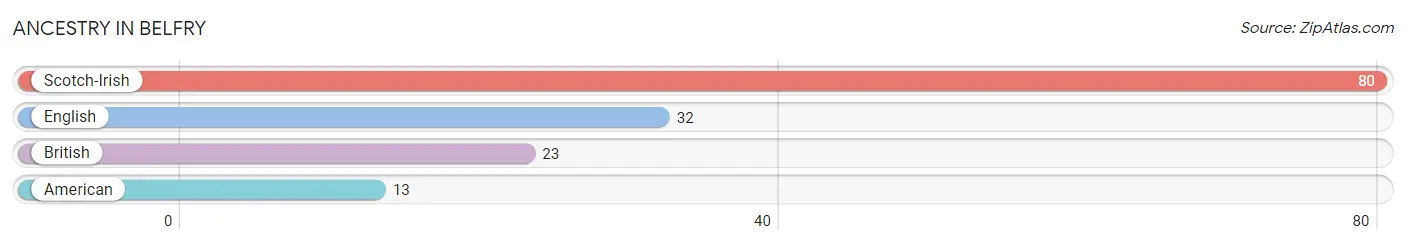
| Ancestry | # Population | % Population |
| American | 13 | 5.6% |
| British | 23 | 9.9% |
| English | 32 | 13.7% |
| Scotch-Irish | 80 | 34.3% | View All 4 Rows |
Immigrants in Belfry

| Immigration Origin | # Population | % Population | View All 0 Rows |
Sex and Age in Belfry
Sex and Age in Belfry
The most populous age groups in Belfry are 20 to 24 Years (47 | 30.1%) for men and 80 to 84 Years (36 | 46.8%) for women.
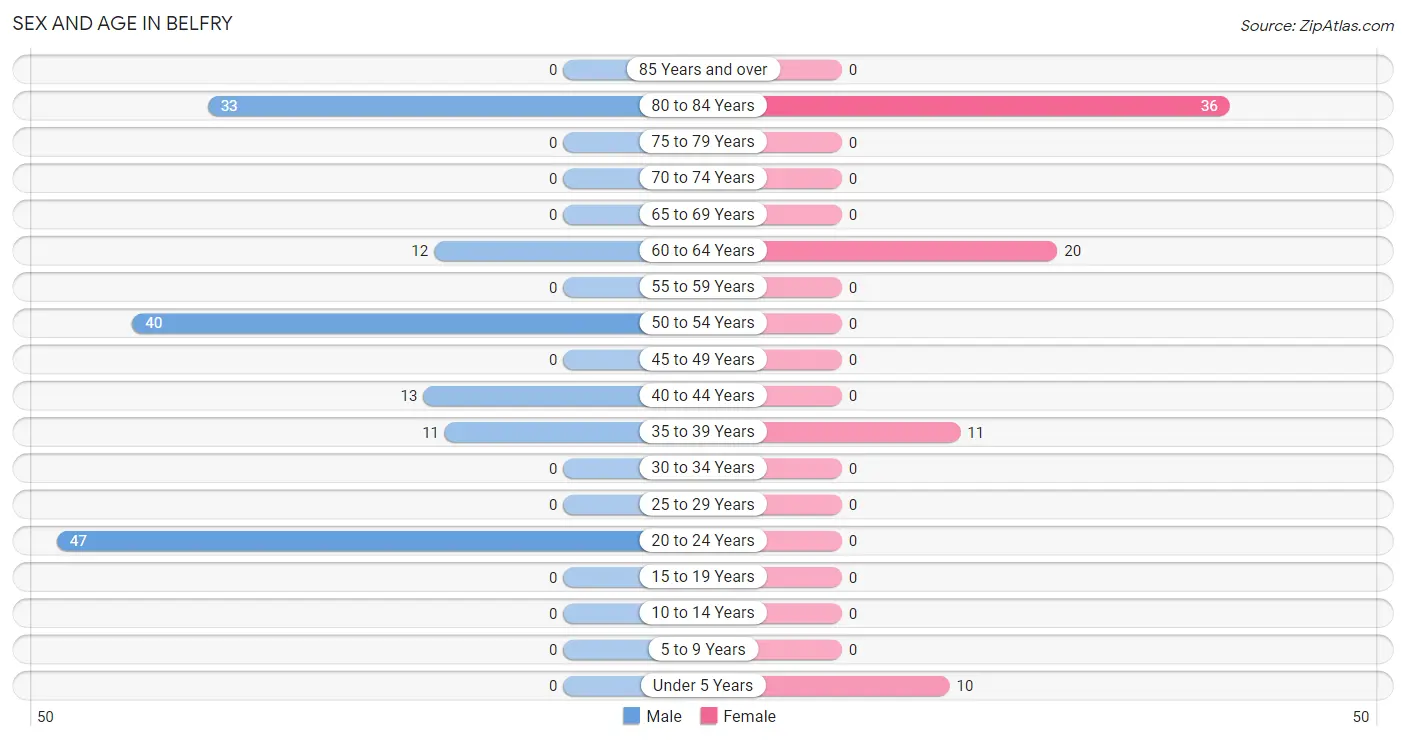
| Age Bracket | Male | Female |
| Under 5 Years | 0 (0.0%) | 10 (13.0%) |
| 5 to 9 Years | 0 (0.0%) | 0 (0.0%) |
| 10 to 14 Years | 0 (0.0%) | 0 (0.0%) |
| 15 to 19 Years | 0 (0.0%) | 0 (0.0%) |
| 20 to 24 Years | 47 (30.1%) | 0 (0.0%) |
| 25 to 29 Years | 0 (0.0%) | 0 (0.0%) |
| 30 to 34 Years | 0 (0.0%) | 0 (0.0%) |
| 35 to 39 Years | 11 (7.0%) | 11 (14.3%) |
| 40 to 44 Years | 13 (8.3%) | 0 (0.0%) |
| 45 to 49 Years | 0 (0.0%) | 0 (0.0%) |
| 50 to 54 Years | 40 (25.6%) | 0 (0.0%) |
| 55 to 59 Years | 0 (0.0%) | 0 (0.0%) |
| 60 to 64 Years | 12 (7.7%) | 20 (26.0%) |
| 65 to 69 Years | 0 (0.0%) | 0 (0.0%) |
| 70 to 74 Years | 0 (0.0%) | 0 (0.0%) |
| 75 to 79 Years | 0 (0.0%) | 0 (0.0%) |
| 80 to 84 Years | 33 (21.1%) | 36 (46.8%) |
| 85 Years and over | 0 (0.0%) | 0 (0.0%) |
| Total | 156 (100.0%) | 77 (100.0%) |
Families and Households in Belfry
Median Family Size in Belfry
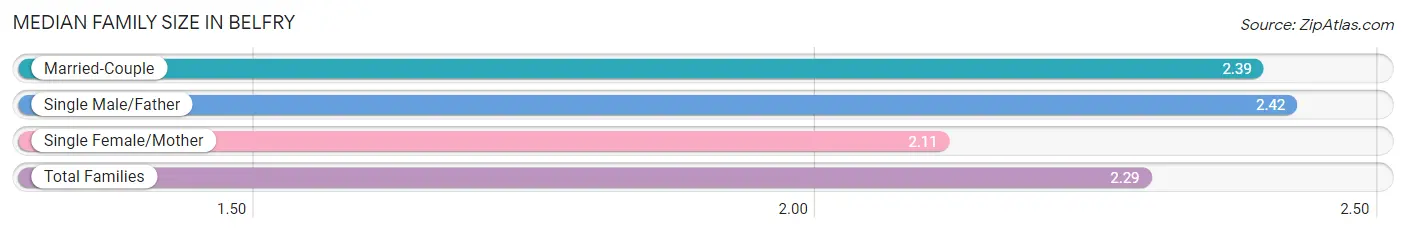
The median family size in Belfry is 2.29 persons per family, with single male/father families (33 | 35.9%) accounting for the largest median family size of 2.42 persons per family. On the other hand, single female/mother families (36 | 39.1%) represent the smallest median family size with 2.11 persons per family.
| Family Type | # Families | Family Size |
| Married-Couple | 23 (25.0%) | 2.39 |
| Single Male/Father | 33 (35.9%) | 2.42 |
| Single Female/Mother | 36 (39.1%) | 2.11 |
| Total Families | 92 (100.0%) | 2.29 |
Median Household Size in Belfry
| Household Type | # Households | Household Size |
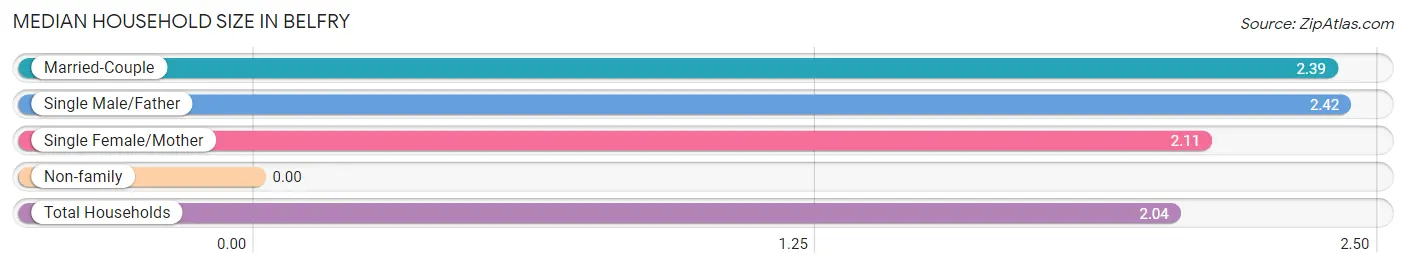
| Married-Couple | 23 (20.2%) | 2.39 |
| Single Male/Father | 33 (28.9%) | 2.42 |
| Single Female/Mother | 36 (31.6%) | 2.11 |
| Non-family | 22 (19.3%) | - |
| Total Households | 114 (100.0%) | 2.04 |
Household Size by Marriage Status in Belfry
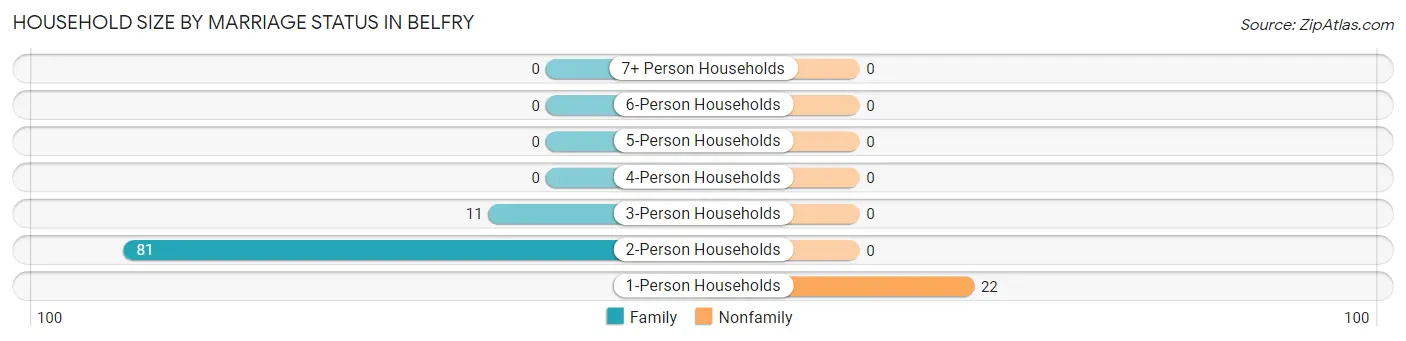
Out of a total of 114 households in Belfry, 92 (80.7%) are family households, while 22 (19.3%) are nonfamily households. The most numerous type of family households are 2-person households, comprising 81, and the most common type of nonfamily households are 1-person households, comprising 22.
| Household Size | Family Households | Nonfamily Households |
| 1-Person Households | - | 22 (19.3%) |
| 2-Person Households | 81 (71.1%) | 0 (0.0%) |
| 3-Person Households | 11 (9.7%) | 0 (0.0%) |
| 4-Person Households | 0 (0.0%) | 0 (0.0%) |
| 5-Person Households | 0 (0.0%) | 0 (0.0%) |
| 6-Person Households | 0 (0.0%) | 0 (0.0%) |
| 7+ Person Households | 0 (0.0%) | 0 (0.0%) |
| Total | 92 (80.7%) | 22 (19.3%) |
Female Fertility in Belfry
Fertility by Age in Belfry
| Age Bracket | Women with Births | Births / 1,000 Women |
| 15 to 19 years | 0 (0.0%) | 0.0 |
| 20 to 34 years | 0 (0.0%) | 0.0 |
| 35 to 50 years | 0 (0.0%) | 0.0 |
| Total | 0 (0.0%) | 0.0 |
Fertility by Age by Marriage Status in Belfry
| Age Bracket | Married | Unmarried |
| 15 to 19 years | 0 (0.0%) | 0 (0.0%) |
| 20 to 34 years | 0 (0.0%) | 0 (0.0%) |
| 35 to 50 years | 0 (0.0%) | 0 (0.0%) |
| Total | 0 (0.0%) | 0 (0.0%) |
Fertility by Education in Belfry
| Educational Attainment | Women with Births | Births / 1,000 Women |
| Less than High School | 0 (0.0%) | 0.0 |
| High School Diploma | 0 (0.0%) | 0.0 |
| College or Associate's Degree | 0 (0.0%) | 0.0 |
| Bachelor's Degree | 0 (0.0%) | 0.0 |
| Graduate Degree | 0 (0.0%) | 0.0 |
| Total | 0 (0.0%) | 0.0 |
Fertility by Education by Marriage Status in Belfry
| Educational Attainment | Married | Unmarried |
| Less than High School | 0 (0.0%) | 0 (0.0%) |
| High School Diploma | 0 (0.0%) | 0 (0.0%) |
| College or Associate's Degree | 0 (0.0%) | 0 (0.0%) |
| Bachelor's Degree | 0 (0.0%) | 0 (0.0%) |
| Graduate Degree | 0 (0.0%) | 0 (0.0%) |
| Total | 0 (0.0%) | 0 (0.0%) |
Employment Characteristics in Belfry
Employment by Class of Employer in Belfry
Among the 75 employed individuals in Belfry, private company employees (64 | 85.3%), and self-employed (not incorporated) (11 | 14.7%) make up the most common classes of employment.
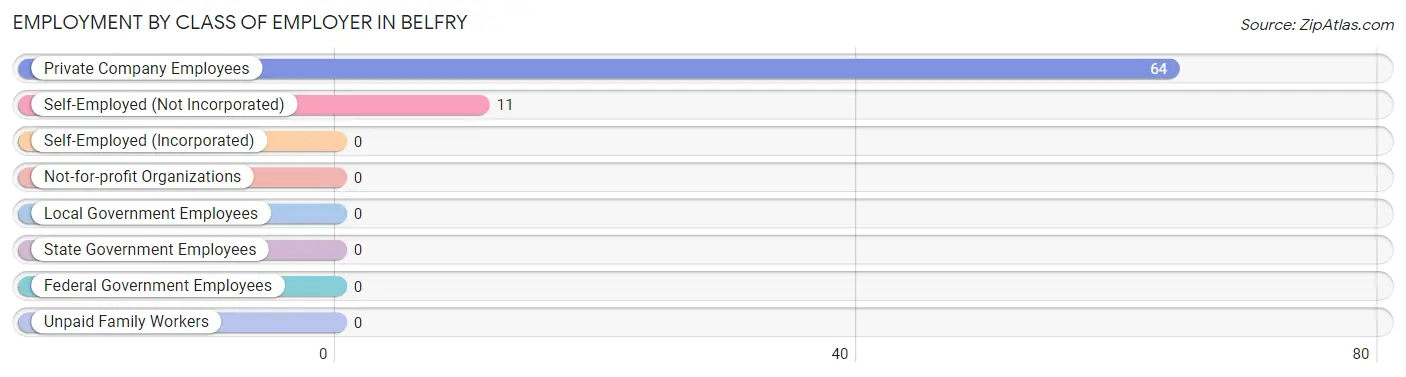
| Employer Class | # Employees | % Employees |
| Private Company Employees | 64 | 85.3% |
| Self-Employed (Incorporated) | 0 | 0.0% |
| Self-Employed (Not Incorporated) | 11 | 14.7% |
| Not-for-profit Organizations | 0 | 0.0% |
| Local Government Employees | 0 | 0.0% |
| State Government Employees | 0 | 0.0% |
| Federal Government Employees | 0 | 0.0% |
| Unpaid Family Workers | 0 | 0.0% |
| Total | 75 | 100.0% |
Employment Status by Age in Belfry
According to the labor force statistics for Belfry, out of the total population over 16 years of age (223), 54.7% or 122 individuals are in the labor force, with 38.5% or 47 of them unemployed. The age group with the highest labor force participation rate is 20 to 24 years, with 100.0% or 47 individuals in the labor force. Within the labor force, the 20 to 24 years age range has the highest percentage of unemployed individuals, with 100.0% or 47 of them being unemployed.
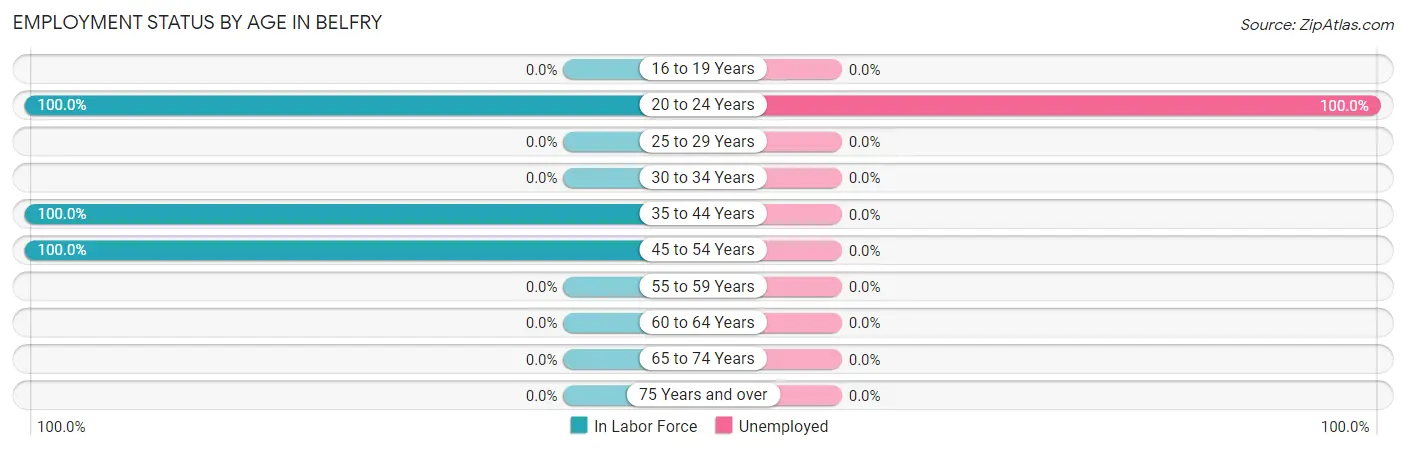
| Age Bracket | In Labor Force | Unemployed |
| 16 to 19 Years | 0 (0.0%) | 0 (0.0%) |
| 20 to 24 Years | 47 (100.0%) | 47 (100.0%) |
| 25 to 29 Years | 0 (0.0%) | 0 (0.0%) |
| 30 to 34 Years | 0 (0.0%) | 0 (0.0%) |
| 35 to 44 Years | 35 (100.0%) | 0 (0.0%) |
| 45 to 54 Years | 40 (100.0%) | 0 (0.0%) |
| 55 to 59 Years | 0 (0.0%) | 0 (0.0%) |
| 60 to 64 Years | 0 (0.0%) | 0 (0.0%) |
| 65 to 74 Years | 0 (0.0%) | 0 (0.0%) |
| 75 Years and over | 0 (0.0%) | 0 (0.0%) |
| Total | 122 (54.7%) | 47 (38.5%) |
Employment Status by Educational Attainment in Belfry
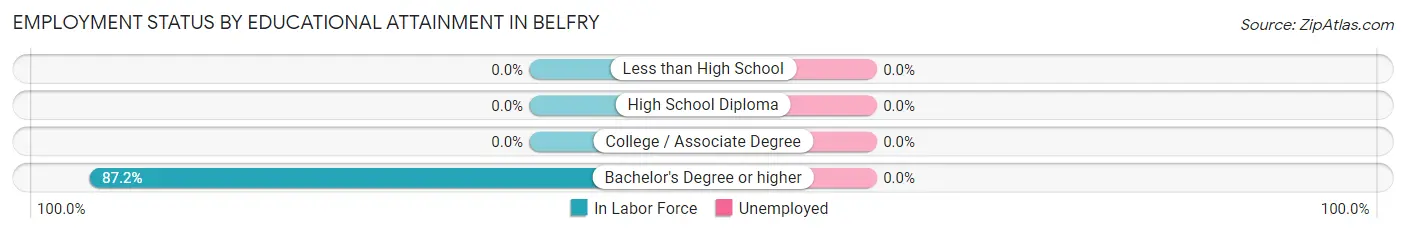
| Educational Attainment | In Labor Force | Unemployed |
| Less than High School | 0 (0.0%) | 0 (0.0%) |
| High School Diploma | 0 (0.0%) | 0 (0.0%) |
| College / Associate Degree | 0 (0.0%) | 0 (0.0%) |
| Bachelor's Degree or higher | 75 (87.2%) | 0 (0.0%) |
| Total | 75 (70.1%) | 0 (0.0%) |
Employment Occupations by Sex in Belfry
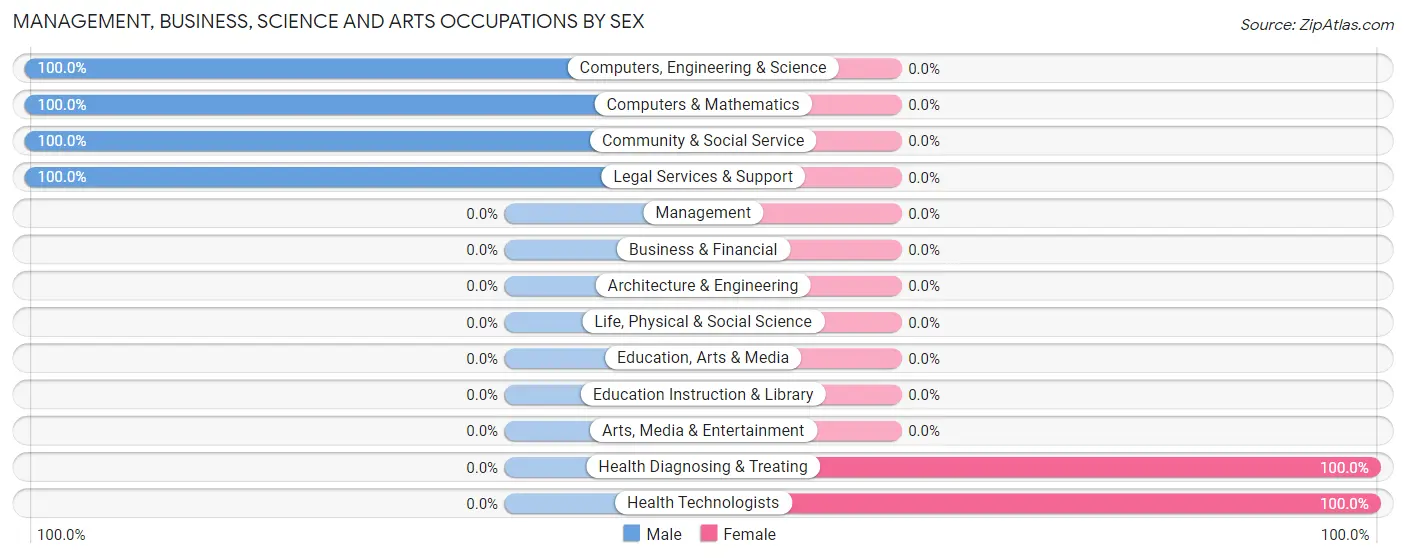
Management, Business, Science and Arts Occupations
The most common Management, Business, Science and Arts occupations in Belfry are Computers, Engineering & Science (40 | 53.3%), Computers & Mathematics (40 | 53.3%), Community & Social Service (11 | 14.7%), Legal Services & Support (11 | 14.7%), and Health Diagnosing & Treating (11 | 14.7%).
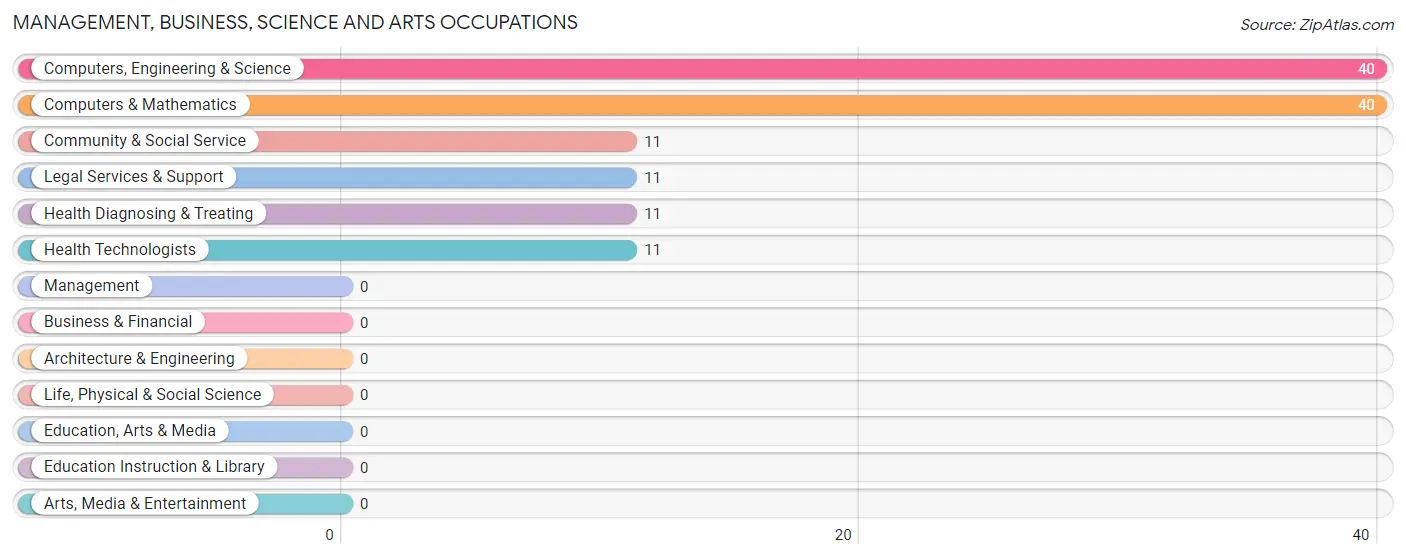
Management, Business, Science and Arts Occupations by Sex
Within the Management, Business, Science and Arts occupations in Belfry, the most male-oriented occupations are Computers, Engineering & Science (100.0%), Computers & Mathematics (100.0%), and Community & Social Service (100.0%), while the most female-oriented occupations are Health Diagnosing & Treating (100.0%), and Health Technologists (100.0%).
| Occupation | Male | Female |
| Management | 0 (0.0%) | 0 (0.0%) |
| Business & Financial | 0 (0.0%) | 0 (0.0%) |
| Computers, Engineering & Science | 40 (100.0%) | 0 (0.0%) |
| Computers & Mathematics | 40 (100.0%) | 0 (0.0%) |
| Architecture & Engineering | 0 (0.0%) | 0 (0.0%) |
| Life, Physical & Social Science | 0 (0.0%) | 0 (0.0%) |
| Community & Social Service | 11 (100.0%) | 0 (0.0%) |
| Education, Arts & Media | 0 (0.0%) | 0 (0.0%) |
| Legal Services & Support | 11 (100.0%) | 0 (0.0%) |
| Education Instruction & Library | 0 (0.0%) | 0 (0.0%) |
| Arts, Media & Entertainment | 0 (0.0%) | 0 (0.0%) |
| Health Diagnosing & Treating | 0 (0.0%) | 11 (100.0%) |
| Health Technologists | 0 (0.0%) | 11 (100.0%) |
| Total (Category) | 51 (82.3%) | 11 (17.7%) |
| Total (Overall) | 64 (85.3%) | 11 (14.7%) |
Services Occupations
Services Occupations by Sex
| Occupation | Male | Female |
| Healthcare Support | 0 (0.0%) | 0 (0.0%) |
| Security & Protection | 0 (0.0%) | 0 (0.0%) |
| Firefighting & Prevention | 0 (0.0%) | 0 (0.0%) |
| Law Enforcement | 0 (0.0%) | 0 (0.0%) |
| Food Preparation & Serving | 0 (0.0%) | 0 (0.0%) |
| Cleaning & Maintenance | 0 (0.0%) | 0 (0.0%) |
| Personal Care & Service | 0 (0.0%) | 0 (0.0%) |
| Total (Category) | 0 (0.0%) | 0 (0.0%) |
| Total (Overall) | 64 (85.3%) | 11 (14.7%) |
Sales and Office Occupations
The most common Sales and Office occupations in Belfry are , and Office & Administration (13 | 17.3%).

Sales and Office Occupations by Sex

| Occupation | Male | Female |
| Sales & Related | 0 (0.0%) | 0 (0.0%) |
| Office & Administration | 13 (100.0%) | 0 (0.0%) |
| Total (Category) | 13 (100.0%) | 0 (0.0%) |
| Total (Overall) | 64 (85.3%) | 11 (14.7%) |
Natural Resources, Construction and Maintenance Occupations

Natural Resources, Construction and Maintenance Occupations by Sex
| Occupation | Male | Female |
| Farming, Fishing & Forestry | 0 (0.0%) | 0 (0.0%) |
| Construction & Extraction | 0 (0.0%) | 0 (0.0%) |
| Installation, Maintenance & Repair | 0 (0.0%) | 0 (0.0%) |
| Total (Category) | 0 (0.0%) | 0 (0.0%) |
| Total (Overall) | 64 (85.3%) | 11 (14.7%) |
Production, Transportation and Moving Occupations
Production, Transportation and Moving Occupations by Sex
| Occupation | Male | Female |
| Production | 0 (0.0%) | 0 (0.0%) |
| Transportation | 0 (0.0%) | 0 (0.0%) |
| Material Moving | 0 (0.0%) | 0 (0.0%) |
| Total (Category) | 0 (0.0%) | 0 (0.0%) |
| Total (Overall) | 64 (85.3%) | 11 (14.7%) |
Employment Industries by Sex in Belfry
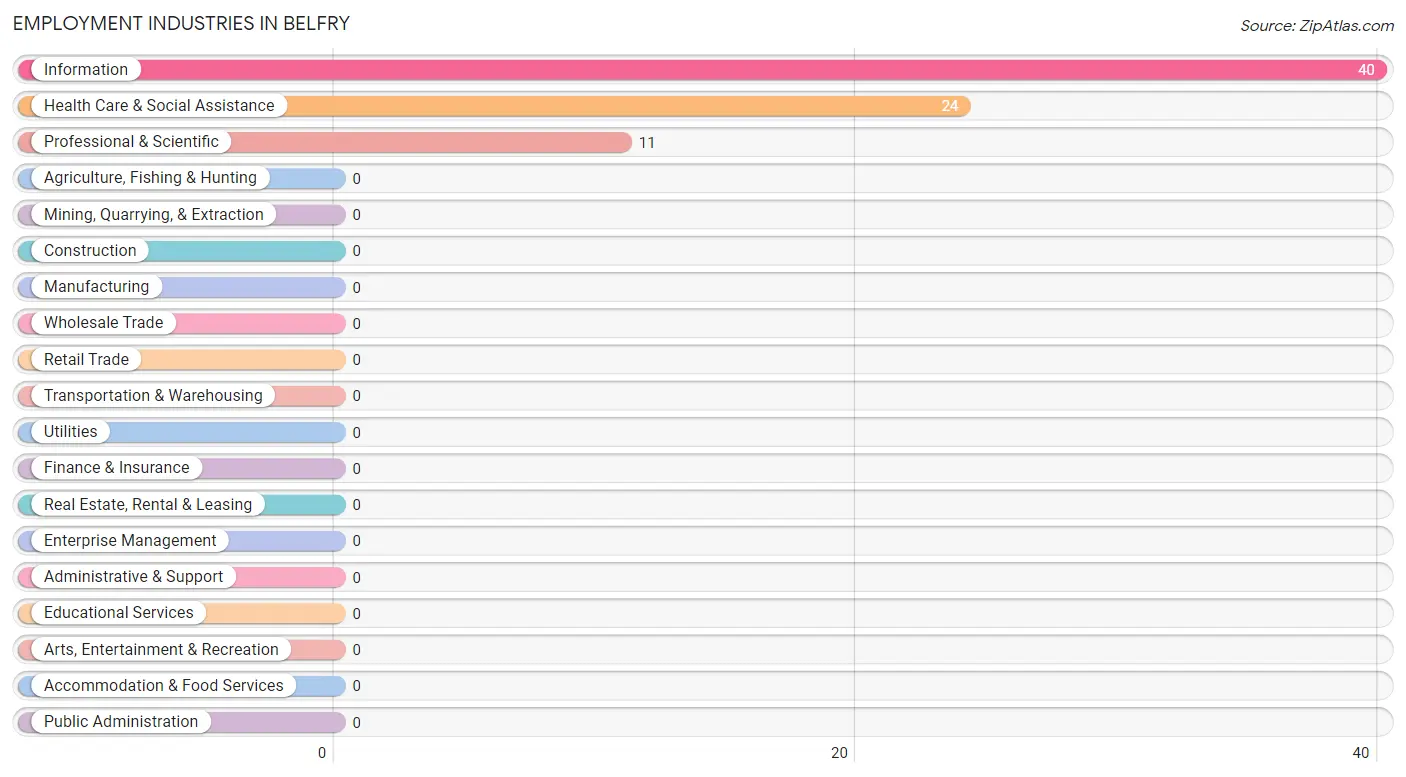
Employment Industries in Belfry
The major employment industries in Belfry include Information (40 | 53.3%), Health Care & Social Assistance (24 | 32.0%), and Professional & Scientific (11 | 14.7%).
Employment Industries by Sex in Belfry
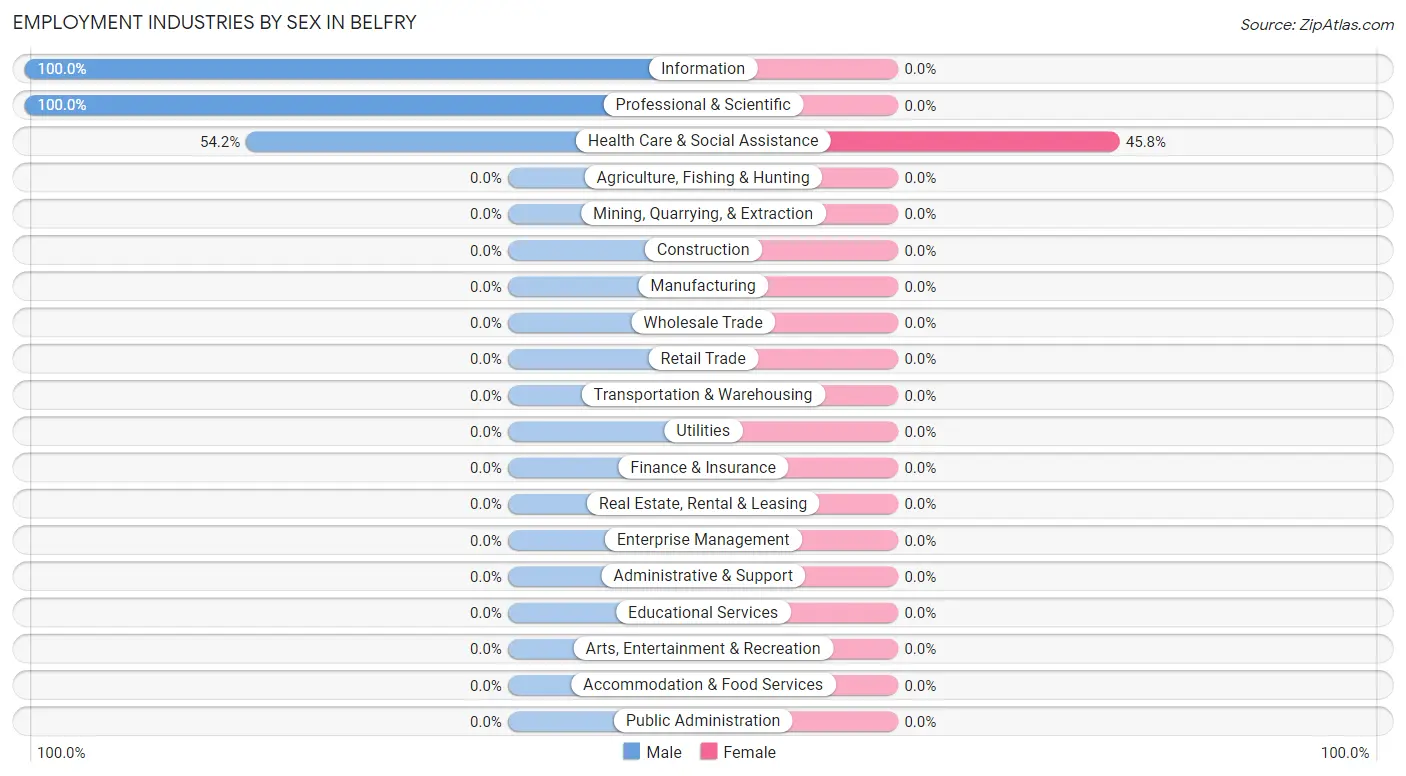
| Industry | Male | Female |
| Agriculture, Fishing & Hunting | 0 (0.0%) | 0 (0.0%) |
| Mining, Quarrying, & Extraction | 0 (0.0%) | 0 (0.0%) |
| Construction | 0 (0.0%) | 0 (0.0%) |
| Manufacturing | 0 (0.0%) | 0 (0.0%) |
| Wholesale Trade | 0 (0.0%) | 0 (0.0%) |
| Retail Trade | 0 (0.0%) | 0 (0.0%) |
| Transportation & Warehousing | 0 (0.0%) | 0 (0.0%) |
| Utilities | 0 (0.0%) | 0 (0.0%) |
| Information | 40 (100.0%) | 0 (0.0%) |
| Finance & Insurance | 0 (0.0%) | 0 (0.0%) |
| Real Estate, Rental & Leasing | 0 (0.0%) | 0 (0.0%) |
| Professional & Scientific | 11 (100.0%) | 0 (0.0%) |
| Enterprise Management | 0 (0.0%) | 0 (0.0%) |
| Administrative & Support | 0 (0.0%) | 0 (0.0%) |
| Educational Services | 0 (0.0%) | 0 (0.0%) |
| Health Care & Social Assistance | 13 (54.2%) | 11 (45.8%) |
| Arts, Entertainment & Recreation | 0 (0.0%) | 0 (0.0%) |
| Accommodation & Food Services | 0 (0.0%) | 0 (0.0%) |
| Public Administration | 0 (0.0%) | 0 (0.0%) |
| Total | 64 (85.3%) | 11 (14.7%) |
Education in Belfry
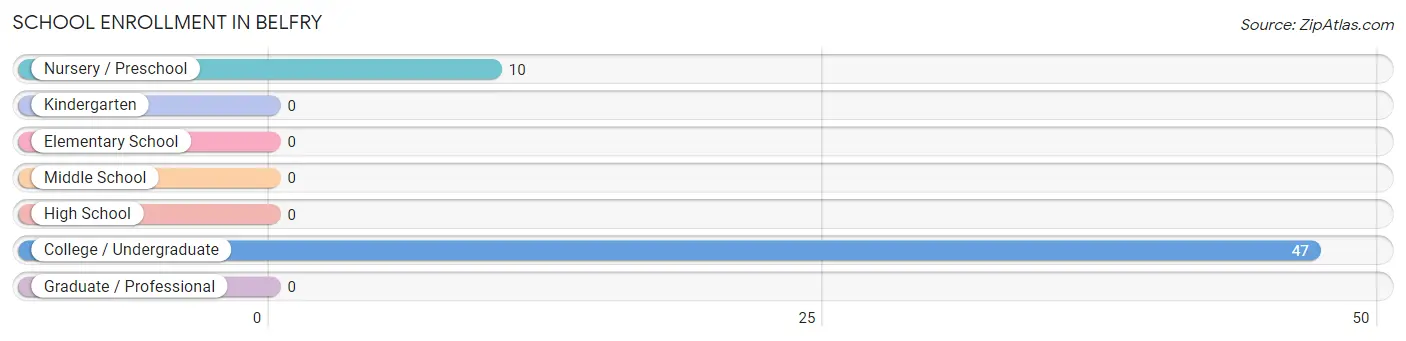
School Enrollment in Belfry
The most common levels of schooling among the 57 students in Belfry are college / undergraduate (47 | 82.5%), and nursery / preschool (10 | 17.5%).
| School Level | # Students | % Students |
| Nursery / Preschool | 10 | 17.5% |
| Kindergarten | 0 | 0.0% |
| Elementary School | 0 | 0.0% |
| Middle School | 0 | 0.0% |
| High School | 0 | 0.0% |
| College / Undergraduate | 47 | 82.5% |
| Graduate / Professional | 0 | 0.0% |
| Total | 57 | 100.0% |
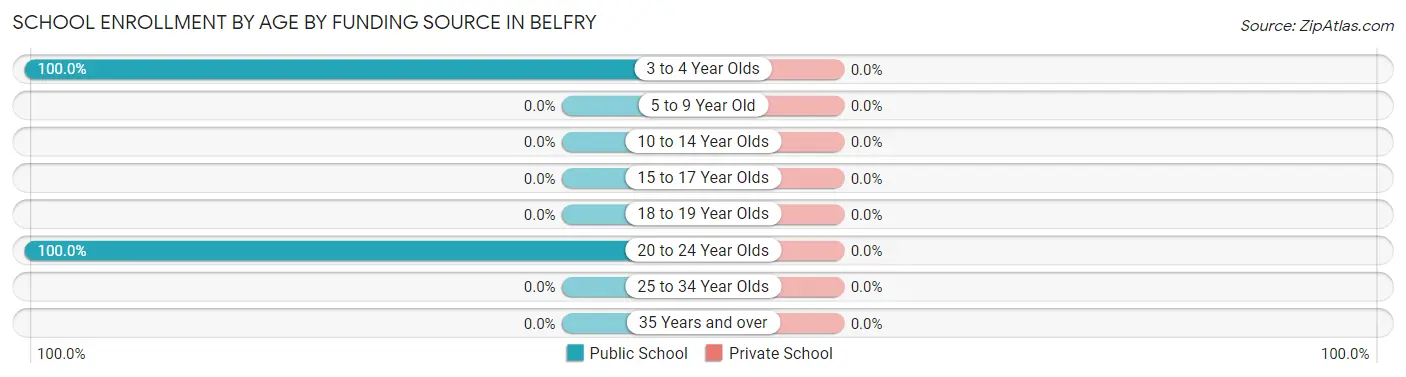
School Enrollment by Age by Funding Source in Belfry
| Age Bracket | Public School | Private School |
| 3 to 4 Year Olds | 10 (100.0%) | 0 (0.0%) |
| 5 to 9 Year Old | 0 (0.0%) | 0 (0.0%) |
| 10 to 14 Year Olds | 0 (0.0%) | 0 (0.0%) |
| 15 to 17 Year Olds | 0 (0.0%) | 0 (0.0%) |
| 18 to 19 Year Olds | 0 (0.0%) | 0 (0.0%) |
| 20 to 24 Year Olds | 47 (100.0%) | 0 (0.0%) |
| 25 to 34 Year Olds | 0 (0.0%) | 0 (0.0%) |
| 35 Years and over | 0 (0.0%) | 0 (0.0%) |
| Total | 57 (100.0%) | 0 (0.0%) |
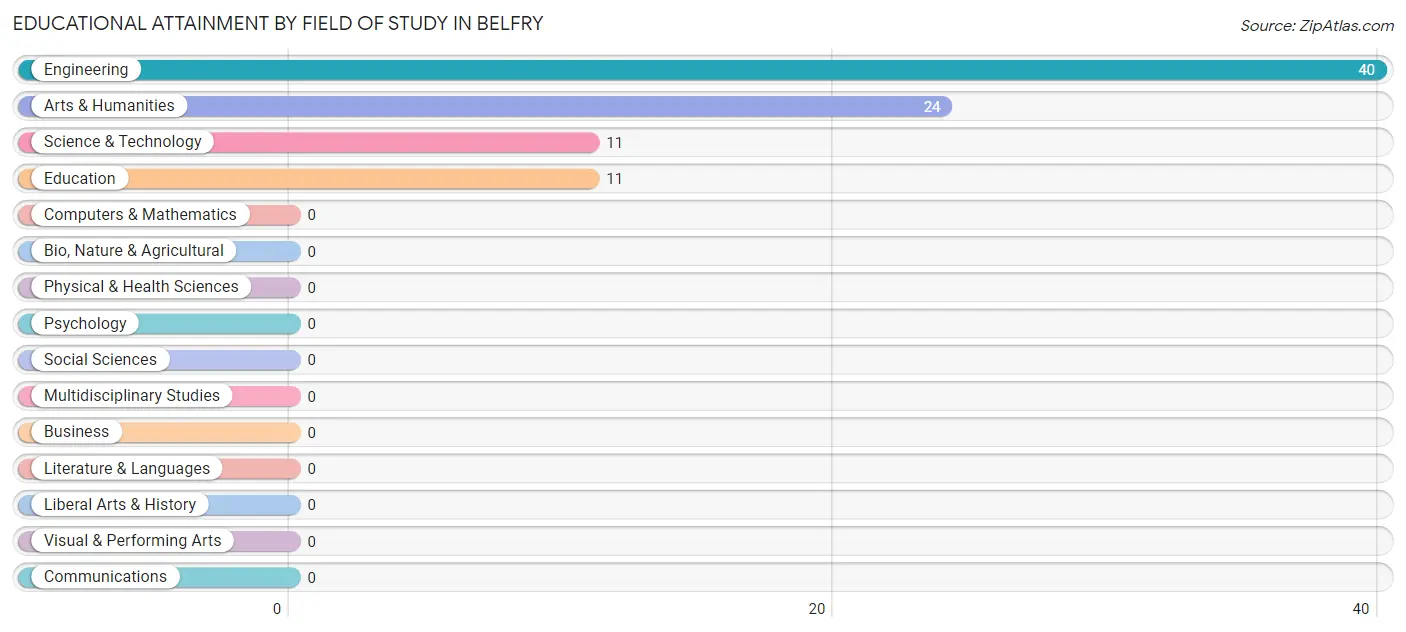
Educational Attainment by Field of Study in Belfry
Engineering (40 | 46.5%), arts & humanities (24 | 27.9%), science & technology (11 | 12.8%), and education (11 | 12.8%) are the most common fields of study among 86 individuals in Belfry who have obtained a bachelor's degree or higher.
| Field of Study | # Graduates | % Graduates |
| Computers & Mathematics | 0 | 0.0% |
| Bio, Nature & Agricultural | 0 | 0.0% |
| Physical & Health Sciences | 0 | 0.0% |
| Psychology | 0 | 0.0% |
| Social Sciences | 0 | 0.0% |
| Engineering | 40 | 46.5% |
| Multidisciplinary Studies | 0 | 0.0% |
| Science & Technology | 11 | 12.8% |
| Business | 0 | 0.0% |
| Education | 11 | 12.8% |
| Literature & Languages | 0 | 0.0% |
| Liberal Arts & History | 0 | 0.0% |
| Visual & Performing Arts | 0 | 0.0% |
| Communications | 0 | 0.0% |
| Arts & Humanities | 24 | 27.9% |
| Total | 86 | 100.0% |
Transportation & Commute in Belfry
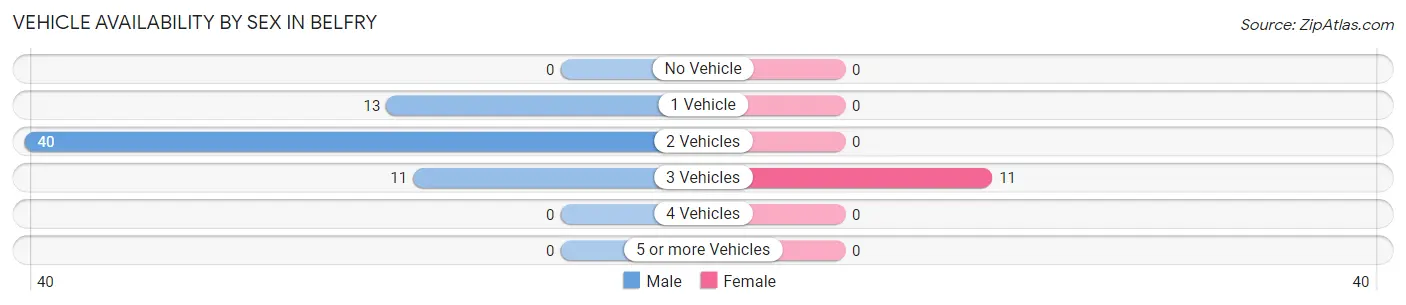
Vehicle Availability by Sex in Belfry
The most prevalent vehicle ownership categories in Belfry are males with 2 vehicles (40, accounting for 62.5%) and females with 2 vehicles (0, making up 363.6%).
| Vehicles Available | Male | Female |
| No Vehicle | 0 (0.0%) | 0 (0.0%) |
| 1 Vehicle | 13 (20.3%) | 0 (0.0%) |
| 2 Vehicles | 40 (62.5%) | 0 (0.0%) |
| 3 Vehicles | 11 (17.2%) | 11 (100.0%) |
| 4 Vehicles | 0 (0.0%) | 0 (0.0%) |
| 5 or more Vehicles | 0 (0.0%) | 0 (0.0%) |
| Total | 64 (100.0%) | 11 (100.0%) |
Commute Time in Belfry
The most frequently occuring commute durations in Belfry are 20 to 24 minutes (51 commuters, 82.3%), 30 to 34 minutes (11 commuters, 17.7%), and less than 5 minutes (0 commuters, 0.0%).
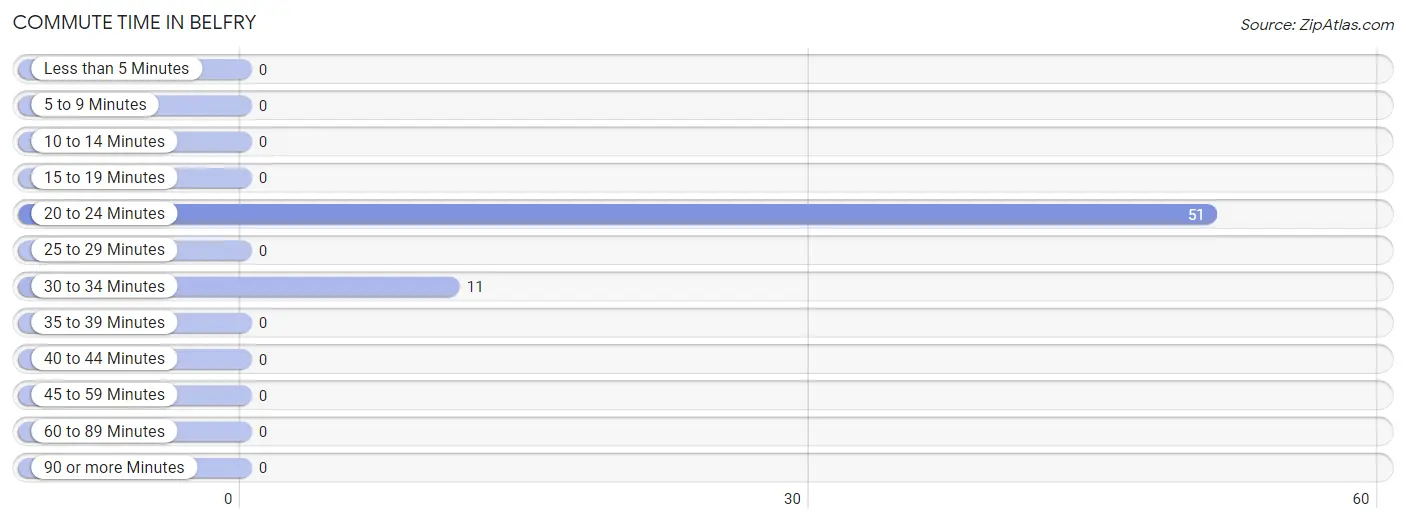
| Commute Time | # Commuters | % Commuters |
| Less than 5 Minutes | 0 | 0.0% |
| 5 to 9 Minutes | 0 | 0.0% |
| 10 to 14 Minutes | 0 | 0.0% |
| 15 to 19 Minutes | 0 | 0.0% |
| 20 to 24 Minutes | 51 | 82.3% |
| 25 to 29 Minutes | 0 | 0.0% |
| 30 to 34 Minutes | 11 | 17.7% |
| 35 to 39 Minutes | 0 | 0.0% |
| 40 to 44 Minutes | 0 | 0.0% |
| 45 to 59 Minutes | 0 | 0.0% |
| 60 to 89 Minutes | 0 | 0.0% |
| 90 or more Minutes | 0 | 0.0% |
Commute Time by Sex in Belfry
The most common commute times in Belfry are 20 to 24 minutes (51 commuters, 100.0%) for males and 30 to 34 minutes (11 commuters, 100.0%) for females.
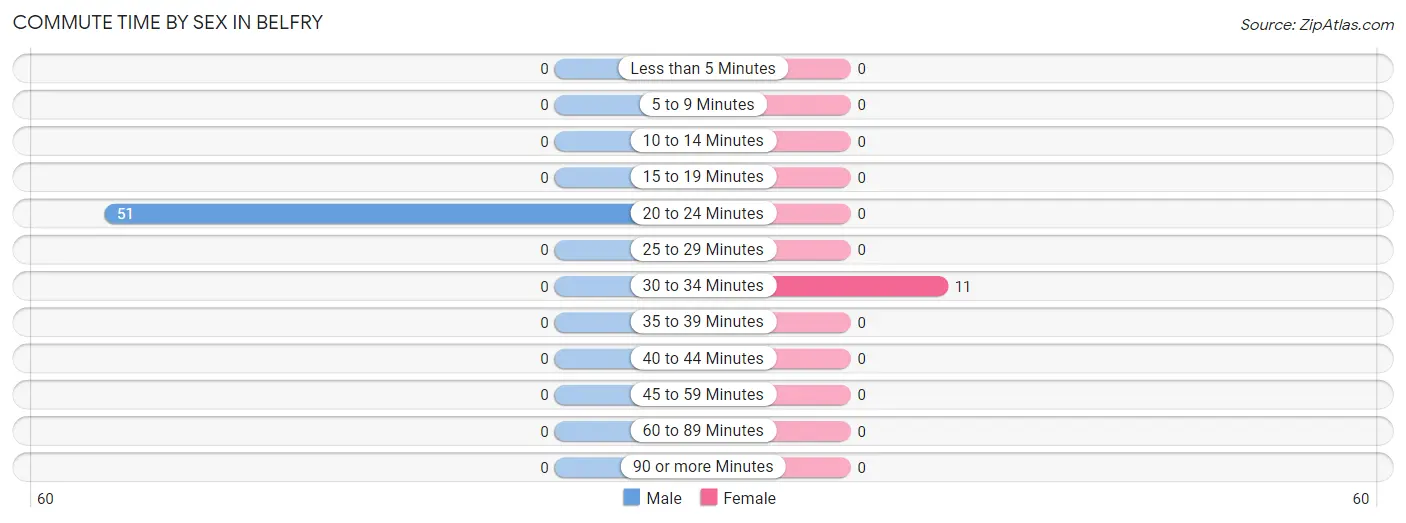
| Commute Time | Male | Female |
| Less than 5 Minutes | 0 (0.0%) | 0 (0.0%) |
| 5 to 9 Minutes | 0 (0.0%) | 0 (0.0%) |
| 10 to 14 Minutes | 0 (0.0%) | 0 (0.0%) |
| 15 to 19 Minutes | 0 (0.0%) | 0 (0.0%) |
| 20 to 24 Minutes | 51 (100.0%) | 0 (0.0%) |
| 25 to 29 Minutes | 0 (0.0%) | 0 (0.0%) |
| 30 to 34 Minutes | 0 (0.0%) | 11 (100.0%) |
| 35 to 39 Minutes | 0 (0.0%) | 0 (0.0%) |
| 40 to 44 Minutes | 0 (0.0%) | 0 (0.0%) |
| 45 to 59 Minutes | 0 (0.0%) | 0 (0.0%) |
| 60 to 89 Minutes | 0 (0.0%) | 0 (0.0%) |
| 90 or more Minutes | 0 (0.0%) | 0 (0.0%) |
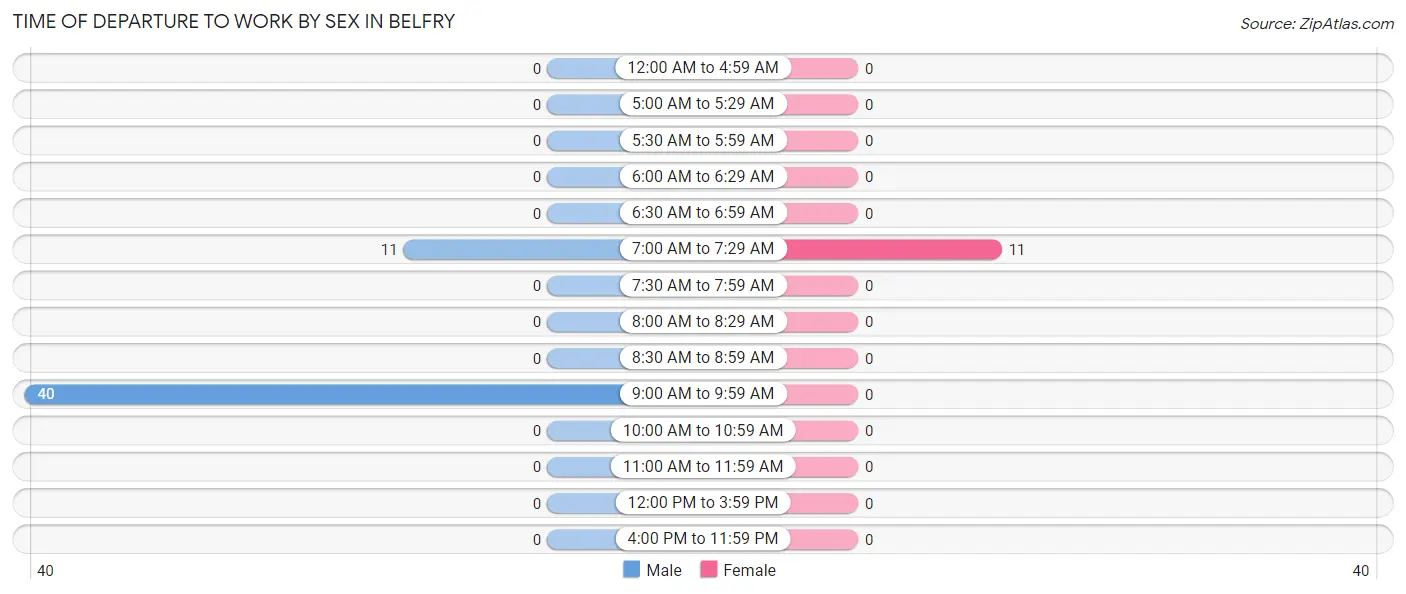
Time of Departure to Work by Sex in Belfry
The most frequent times of departure to work in Belfry are 9:00 AM to 9:59 AM (40, 78.4%) for males and 7:00 AM to 7:29 AM (11, 100.0%) for females.
| Time of Departure | Male | Female |
| 12:00 AM to 4:59 AM | 0 (0.0%) | 0 (0.0%) |
| 5:00 AM to 5:29 AM | 0 (0.0%) | 0 (0.0%) |
| 5:30 AM to 5:59 AM | 0 (0.0%) | 0 (0.0%) |
| 6:00 AM to 6:29 AM | 0 (0.0%) | 0 (0.0%) |
| 6:30 AM to 6:59 AM | 0 (0.0%) | 0 (0.0%) |
| 7:00 AM to 7:29 AM | 11 (21.6%) | 11 (100.0%) |
| 7:30 AM to 7:59 AM | 0 (0.0%) | 0 (0.0%) |
| 8:00 AM to 8:29 AM | 0 (0.0%) | 0 (0.0%) |
| 8:30 AM to 8:59 AM | 0 (0.0%) | 0 (0.0%) |
| 9:00 AM to 9:59 AM | 40 (78.4%) | 0 (0.0%) |
| 10:00 AM to 10:59 AM | 0 (0.0%) | 0 (0.0%) |
| 11:00 AM to 11:59 AM | 0 (0.0%) | 0 (0.0%) |
| 12:00 PM to 3:59 PM | 0 (0.0%) | 0 (0.0%) |
| 4:00 PM to 11:59 PM | 0 (0.0%) | 0 (0.0%) |
| Total | 51 (100.0%) | 11 (100.0%) |
Housing Occupancy in Belfry
Occupancy by Ownership in Belfry
Of the total 114 dwellings in Belfry, owner-occupied units account for 105 (92.1%), while renter-occupied units make up 9 (7.9%).
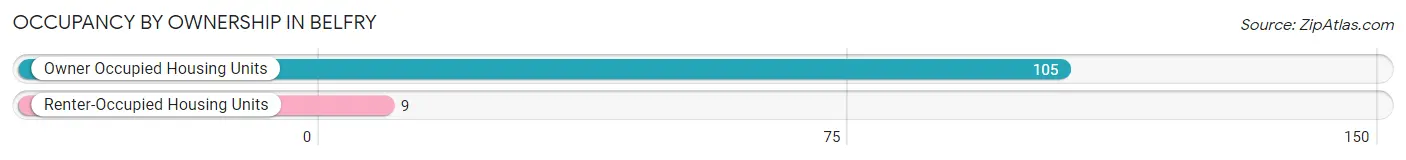
| Occupancy | # Housing Units | % Housing Units |
| Owner Occupied Housing Units | 105 | 92.1% |
| Renter-Occupied Housing Units | 9 | 7.9% |
| Total Occupied Housing Units | 114 | 100.0% |
Occupancy by Household Size in Belfry
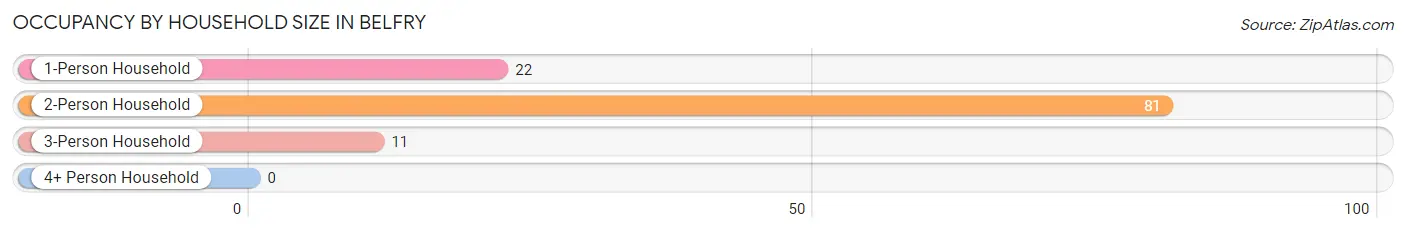
| Household Size | # Housing Units | % Housing Units |
| 1-Person Household | 22 | 19.3% |
| 2-Person Household | 81 | 71.1% |
| 3-Person Household | 11 | 9.7% |
| 4+ Person Household | 0 | 0.0% |
| Total Housing Units | 114 | 100.0% |
Occupancy by Ownership by Household Size in Belfry
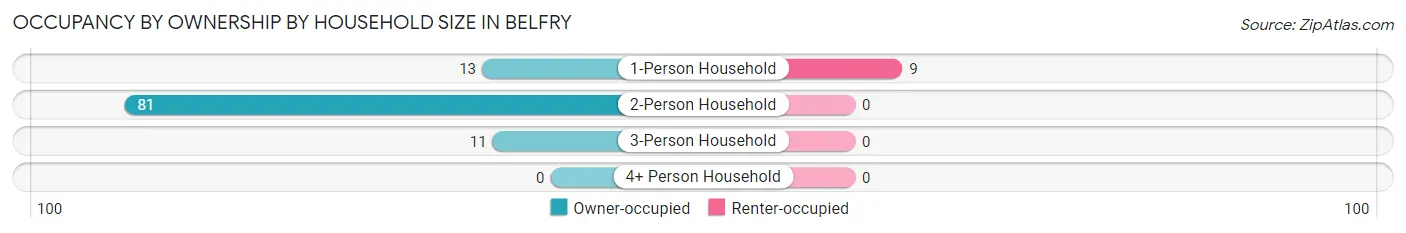
| Household Size | Owner-occupied | Renter-occupied |
| 1-Person Household | 13 (59.1%) | 9 (40.9%) |
| 2-Person Household | 81 (100.0%) | 0 (0.0%) |
| 3-Person Household | 11 (100.0%) | 0 (0.0%) |
| 4+ Person Household | 0 (0.0%) | 0 (0.0%) |
| Total Housing Units | 105 (92.1%) | 9 (7.9%) |
Occupancy by Educational Attainment in Belfry
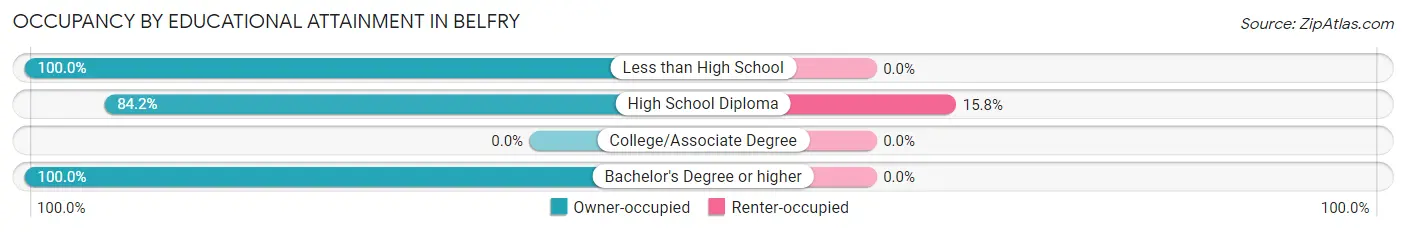
| Household Size | Owner-occupied | Renter-occupied |
| Less than High School | 33 (100.0%) | 0 (0.0%) |
| High School Diploma | 48 (84.2%) | 9 (15.8%) |
| College/Associate Degree | 0 (0.0%) | 0 (0.0%) |
| Bachelor's Degree or higher | 24 (100.0%) | 0 (0.0%) |
Occupancy by Age of Householder in Belfry
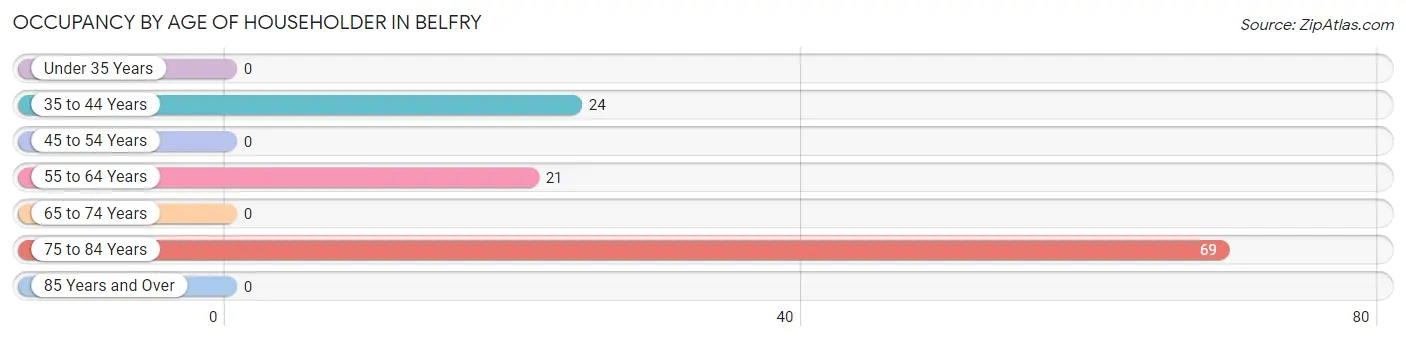
| Age Bracket | # Households | % Households |
| Under 35 Years | 0 | 0.0% |
| 35 to 44 Years | 24 | 21.0% |
| 45 to 54 Years | 0 | 0.0% |
| 55 to 64 Years | 21 | 18.4% |
| 65 to 74 Years | 0 | 0.0% |
| 75 to 84 Years | 69 | 60.5% |
| 85 Years and Over | 0 | 0.0% |
| Total | 114 | 100.0% |
Housing Finances in Belfry
Median Income by Occupancy in Belfry
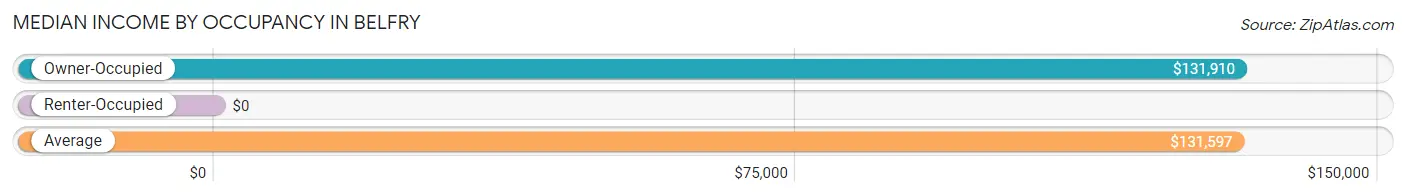
| Occupancy Type | # Households | Median Income |
| Owner-Occupied | 105 (92.1%) | $131,910 |
| Renter-Occupied | 9 (7.9%) | $0 |
| Average | 114 (100.0%) | $131,597 |
Occupancy by Householder Income Bracket in Belfry
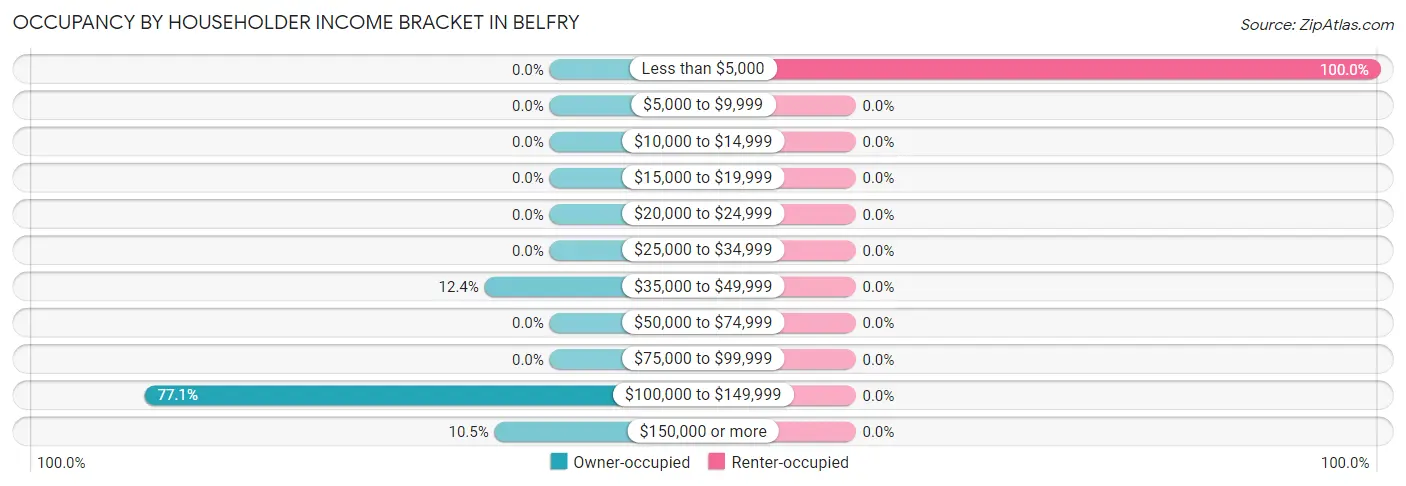
| Income Bracket | Owner-occupied | Renter-occupied |
| Less than $5,000 | 0 (0.0%) | 9 (100.0%) |
| $5,000 to $9,999 | 0 (0.0%) | 0 (0.0%) |
| $10,000 to $14,999 | 0 (0.0%) | 0 (0.0%) |
| $15,000 to $19,999 | 0 (0.0%) | 0 (0.0%) |
| $20,000 to $24,999 | 0 (0.0%) | 0 (0.0%) |
| $25,000 to $34,999 | 0 (0.0%) | 0 (0.0%) |
| $35,000 to $49,999 | 13 (12.4%) | 0 (0.0%) |
| $50,000 to $74,999 | 0 (0.0%) | 0 (0.0%) |
| $75,000 to $99,999 | 0 (0.0%) | 0 (0.0%) |
| $100,000 to $149,999 | 81 (77.1%) | 0 (0.0%) |
| $150,000 or more | 11 (10.5%) | 0 (0.0%) |
| Total | 105 (100.0%) | 9 (100.0%) |
Monthly Housing Cost Tiers in Belfry
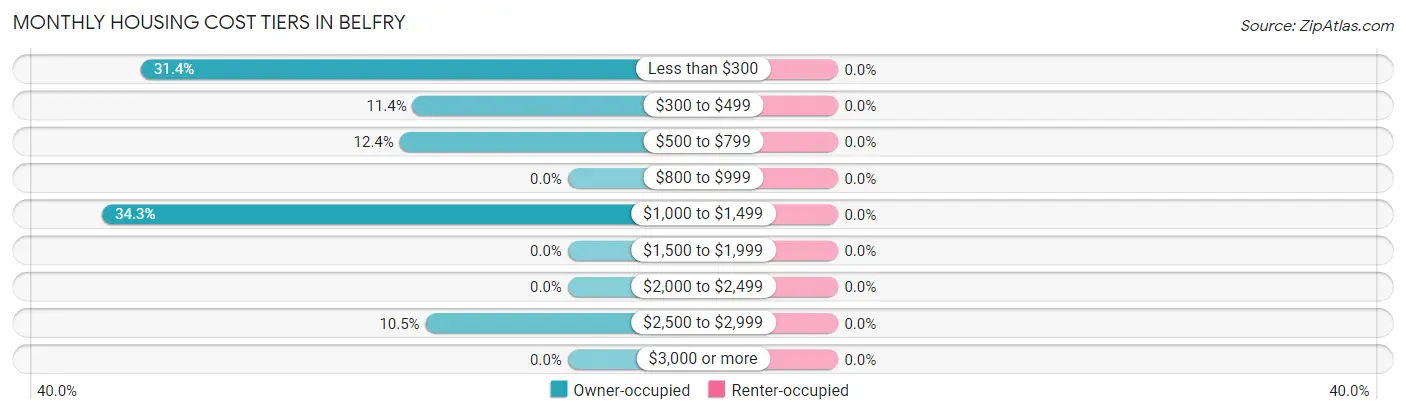
| Monthly Cost | Owner-occupied | Renter-occupied |
| Less than $300 | 33 (31.4%) | 0 (0.0%) |
| $300 to $499 | 12 (11.4%) | 0 (0.0%) |
| $500 to $799 | 13 (12.4%) | 0 (0.0%) |
| $800 to $999 | 0 (0.0%) | 0 (0.0%) |
| $1,000 to $1,499 | 36 (34.3%) | 0 (0.0%) |
| $1,500 to $1,999 | 0 (0.0%) | 0 (0.0%) |
| $2,000 to $2,499 | 0 (0.0%) | 0 (0.0%) |
| $2,500 to $2,999 | 11 (10.5%) | 0 (0.0%) |
| $3,000 or more | 0 (0.0%) | 0 (0.0%) |
| Total | 105 (100.0%) | 9 (100.0%) |
Physical Housing Characteristics in Belfry
Housing Structures in Belfry
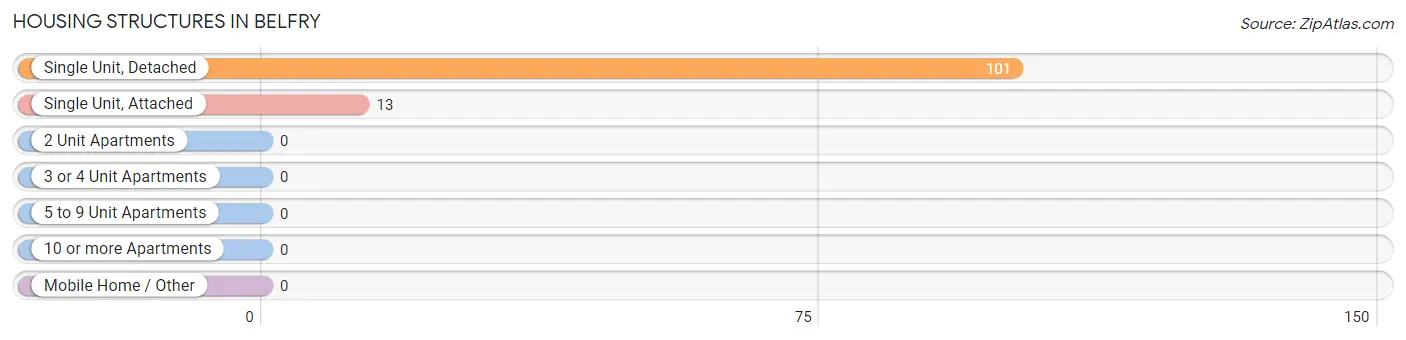
| Structure Type | # Housing Units | % Housing Units |
| Single Unit, Detached | 101 | 88.6% |
| Single Unit, Attached | 13 | 11.4% |
| 2 Unit Apartments | 0 | 0.0% |
| 3 or 4 Unit Apartments | 0 | 0.0% |
| 5 to 9 Unit Apartments | 0 | 0.0% |
| 10 or more Apartments | 0 | 0.0% |
| Mobile Home / Other | 0 | 0.0% |
| Total | 114 | 100.0% |
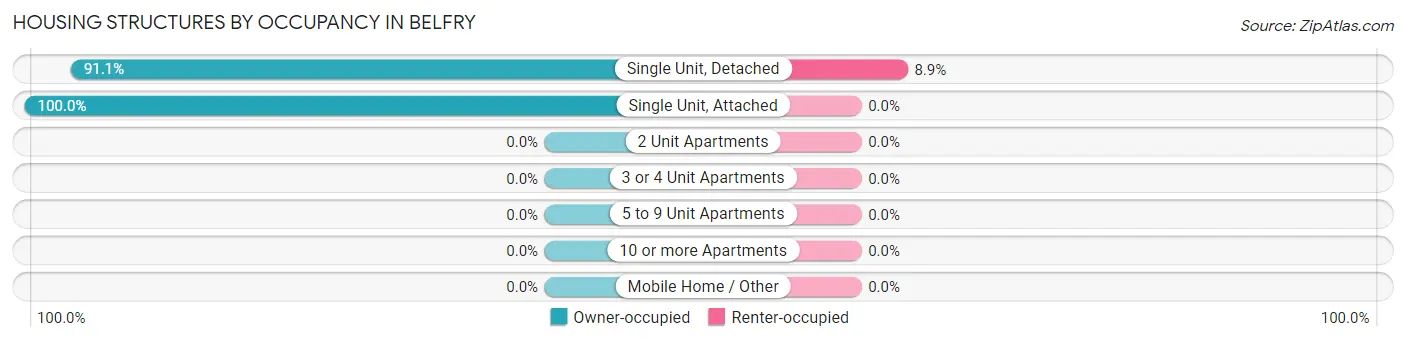
Housing Structures by Occupancy in Belfry
| Structure Type | Owner-occupied | Renter-occupied |
| Single Unit, Detached | 92 (91.1%) | 9 (8.9%) |
| Single Unit, Attached | 13 (100.0%) | 0 (0.0%) |
| 2 Unit Apartments | 0 (0.0%) | 0 (0.0%) |
| 3 or 4 Unit Apartments | 0 (0.0%) | 0 (0.0%) |
| 5 to 9 Unit Apartments | 0 (0.0%) | 0 (0.0%) |
| 10 or more Apartments | 0 (0.0%) | 0 (0.0%) |
| Mobile Home / Other | 0 (0.0%) | 0 (0.0%) |
| Total | 105 (92.1%) | 9 (7.9%) |
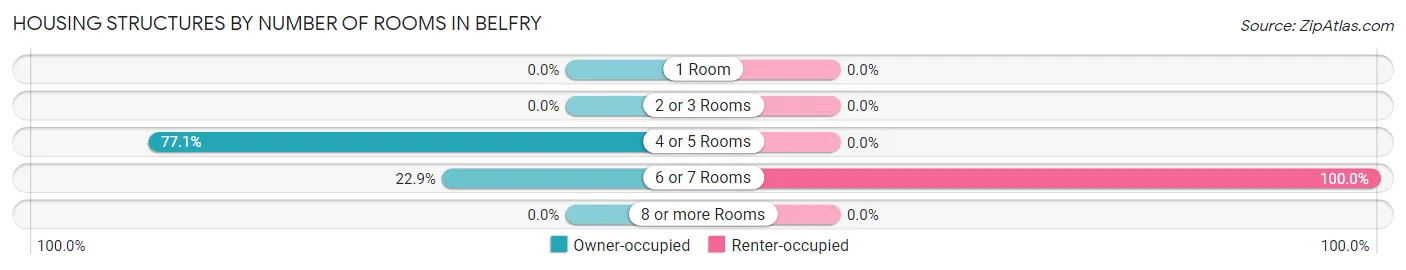
Housing Structures by Number of Rooms in Belfry
| Number of Rooms | Owner-occupied | Renter-occupied |
| 1 Room | 0 (0.0%) | 0 (0.0%) |
| 2 or 3 Rooms | 0 (0.0%) | 0 (0.0%) |
| 4 or 5 Rooms | 81 (77.1%) | 0 (0.0%) |
| 6 or 7 Rooms | 24 (22.9%) | 9 (100.0%) |
| 8 or more Rooms | 0 (0.0%) | 0 (0.0%) |
| Total | 105 (100.0%) | 9 (100.0%) |
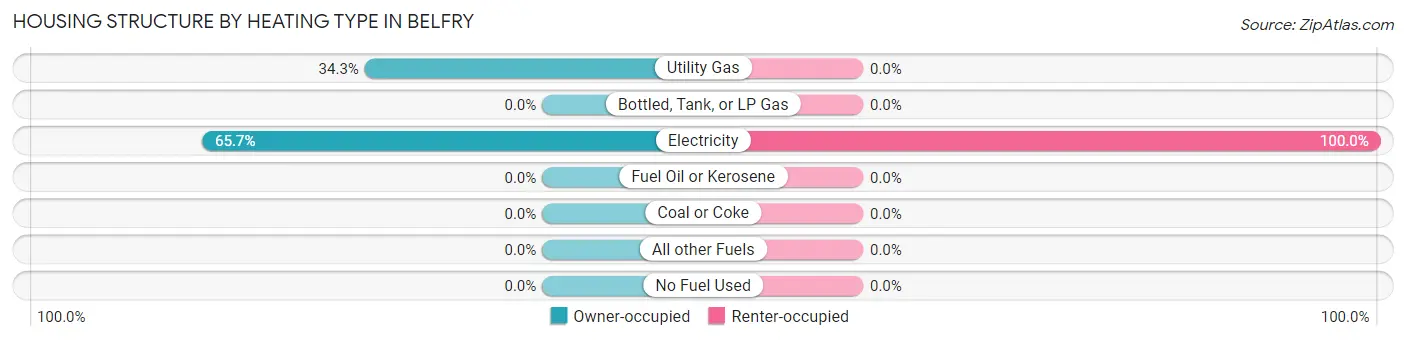
Housing Structure by Heating Type in Belfry
| Heating Type | Owner-occupied | Renter-occupied |
| Utility Gas | 36 (34.3%) | 0 (0.0%) |
| Bottled, Tank, or LP Gas | 0 (0.0%) | 0 (0.0%) |
| Electricity | 69 (65.7%) | 9 (100.0%) |
| Fuel Oil or Kerosene | 0 (0.0%) | 0 (0.0%) |
| Coal or Coke | 0 (0.0%) | 0 (0.0%) |
| All other Fuels | 0 (0.0%) | 0 (0.0%) |
| No Fuel Used | 0 (0.0%) | 0 (0.0%) |
| Total | 105 (100.0%) | 9 (100.0%) |
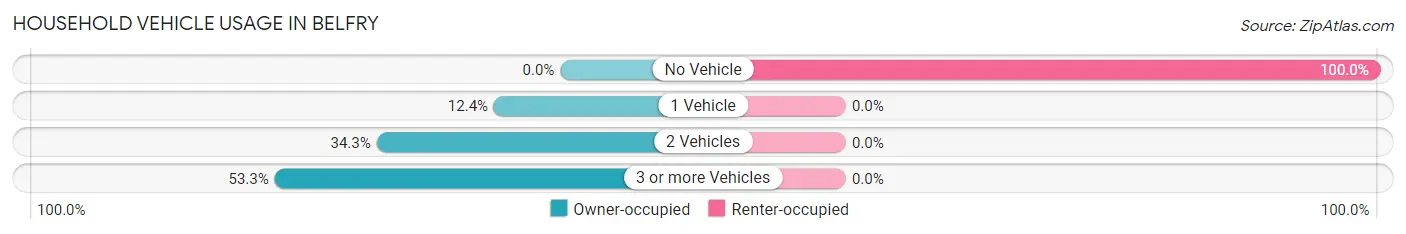
Household Vehicle Usage in Belfry
| Vehicles per Household | Owner-occupied | Renter-occupied |
| No Vehicle | 0 (0.0%) | 9 (100.0%) |
| 1 Vehicle | 13 (12.4%) | 0 (0.0%) |
| 2 Vehicles | 36 (34.3%) | 0 (0.0%) |
| 3 or more Vehicles | 56 (53.3%) | 0 (0.0%) |
| Total | 105 (100.0%) | 9 (100.0%) |
Real Estate & Mortgages in Belfry
Real Estate and Mortgage Overview in Belfry
| Characteristic | Without Mortgage | With Mortgage |
| Housing Units | 58 | 47 |
| Median Property Value | $88,800 | $0 |
| Median Household Income | $137,803 | $11 |
| Monthly Housing Costs | $99 | $0 |
| Real Estate Taxes | - | - |
Property Value by Mortgage Status in Belfry
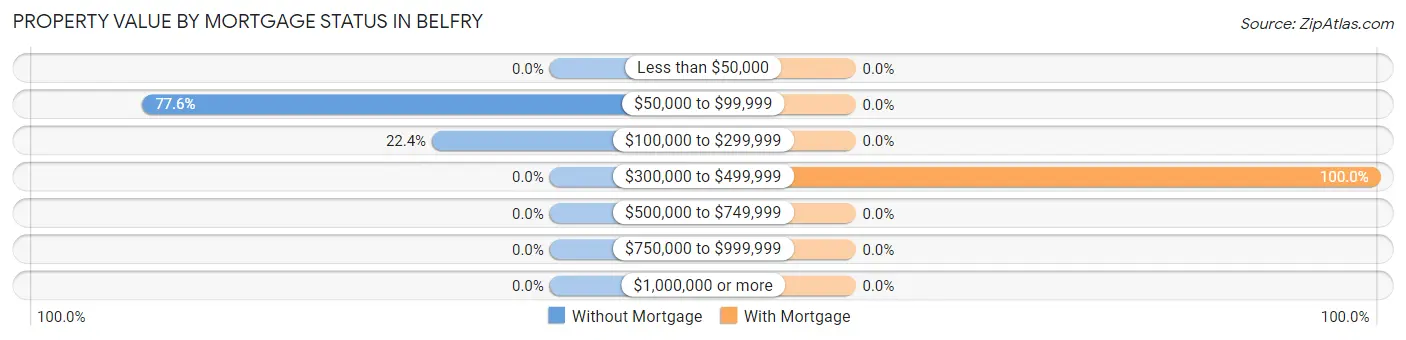
| Property Value | Without Mortgage | With Mortgage |
| Less than $50,000 | 0 (0.0%) | 0 (0.0%) |
| $50,000 to $99,999 | 45 (77.6%) | 0 (0.0%) |
| $100,000 to $299,999 | 13 (22.4%) | 0 (0.0%) |
| $300,000 to $499,999 | 0 (0.0%) | 47 (100.0%) |
| $500,000 to $749,999 | 0 (0.0%) | 0 (0.0%) |
| $750,000 to $999,999 | 0 (0.0%) | 0 (0.0%) |
| $1,000,000 or more | 0 (0.0%) | 0 (0.0%) |
| Total | 58 (100.0%) | 47 (100.0%) |
Household Income by Mortgage Status in Belfry
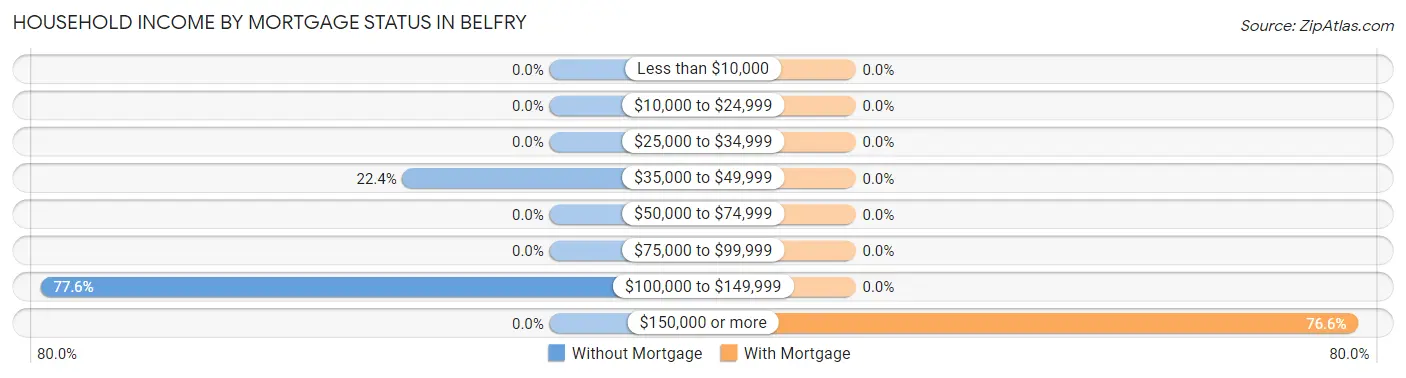
| Household Income | Without Mortgage | With Mortgage |
| Less than $10,000 | 0 (0.0%) | 0 (0.0%) |
| $10,000 to $24,999 | 0 (0.0%) | 0 (0.0%) |
| $25,000 to $34,999 | 0 (0.0%) | 0 (0.0%) |
| $35,000 to $49,999 | 13 (22.4%) | 0 (0.0%) |
| $50,000 to $74,999 | 0 (0.0%) | 0 (0.0%) |
| $75,000 to $99,999 | 0 (0.0%) | 0 (0.0%) |
| $100,000 to $149,999 | 45 (77.6%) | 0 (0.0%) |
| $150,000 or more | 0 (0.0%) | 36 (76.6%) |
| Total | 58 (100.0%) | 47 (100.0%) |
Property Value to Household Income Ratio in Belfry
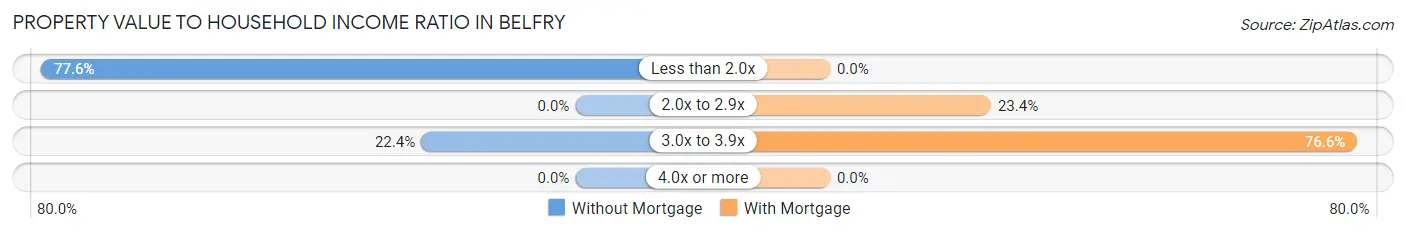
| Value-to-Income Ratio | Without Mortgage | With Mortgage |
| Less than 2.0x | 45 (77.6%) | 0 (0.0%) |
| 2.0x to 2.9x | 0 (0.0%) | 11 (23.4%) |
| 3.0x to 3.9x | 13 (22.4%) | 36 (76.6%) |
| 4.0x or more | 0 (0.0%) | 0 (0.0%) |
| Total | 58 (100.0%) | 47 (100.0%) |
Real Estate Taxes by Mortgage Status in Belfry
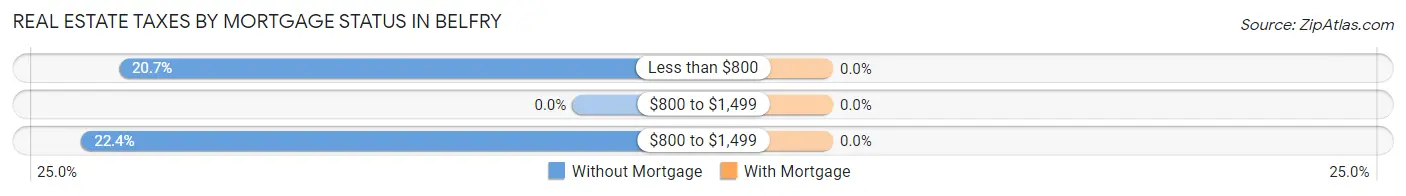
| Property Taxes | Without Mortgage | With Mortgage |
| Less than $800 | 12 (20.7%) | 0 (0.0%) |
| $800 to $1,499 | 0 (0.0%) | 0 (0.0%) |
| $800 to $1,499 | 13 (22.4%) | 0 (0.0%) |
| Total | 58 (100.0%) | 47 (100.0%) |
Health & Disability in Belfry
Health Insurance Coverage by Age in Belfry
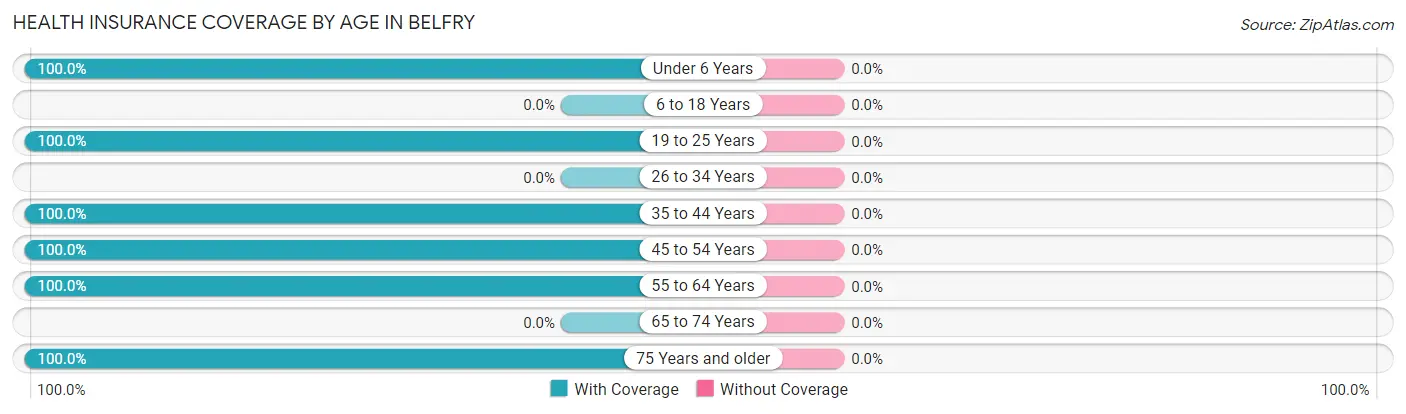
| Age Bracket | With Coverage | Without Coverage |
| Under 6 Years | 10 (100.0%) | 0 (0.0%) |
| 6 to 18 Years | 0 (0.0%) | 0 (0.0%) |
| 19 to 25 Years | 47 (100.0%) | 0 (0.0%) |
| 26 to 34 Years | 0 (0.0%) | 0 (0.0%) |
| 35 to 44 Years | 35 (100.0%) | 0 (0.0%) |
| 45 to 54 Years | 40 (100.0%) | 0 (0.0%) |
| 55 to 64 Years | 32 (100.0%) | 0 (0.0%) |
| 65 to 74 Years | 0 (0.0%) | 0 (0.0%) |
| 75 Years and older | 69 (100.0%) | 0 (0.0%) |
| Total | 233 (100.0%) | 0 (0.0%) |
Health Insurance Coverage by Citizenship Status in Belfry

| Citizenship Status | With Coverage | Without Coverage |
| Native Born | 10 (100.0%) | 0 (0.0%) |
| Foreign Born, Citizen | 0 (0.0%) | 0 (0.0%) |
| Foreign Born, not a Citizen | 47 (100.0%) | 0 (0.0%) |
Health Insurance Coverage by Household Income in Belfry
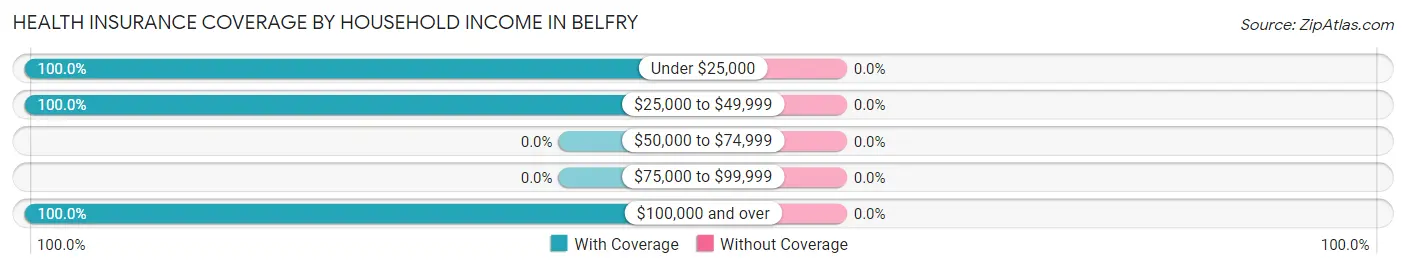
| Household Income | With Coverage | Without Coverage |
| Under $25,000 | 9 (100.0%) | 0 (0.0%) |
| $25,000 to $49,999 | 13 (100.0%) | 0 (0.0%) |
| $50,000 to $74,999 | 0 (0.0%) | 0 (0.0%) |
| $75,000 to $99,999 | 0 (0.0%) | 0 (0.0%) |
| $100,000 and over | 211 (100.0%) | 0 (0.0%) |
Public vs Private Health Insurance Coverage by Age in Belfry
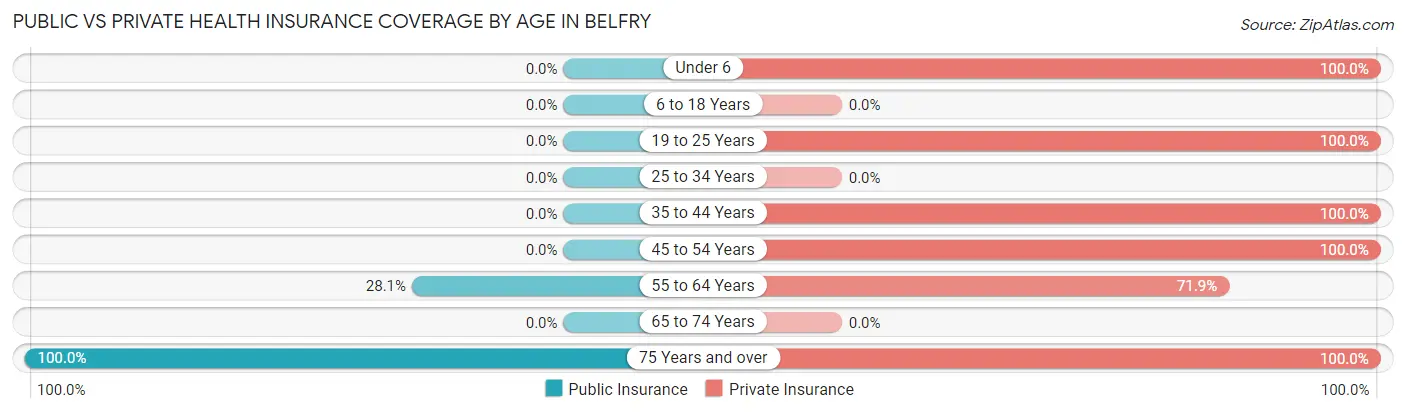
| Age Bracket | Public Insurance | Private Insurance |
| Under 6 | 0 (0.0%) | 10 (100.0%) |
| 6 to 18 Years | 0 (0.0%) | 0 (0.0%) |
| 19 to 25 Years | 0 (0.0%) | 47 (100.0%) |
| 25 to 34 Years | 0 (0.0%) | 0 (0.0%) |
| 35 to 44 Years | 0 (0.0%) | 35 (100.0%) |
| 45 to 54 Years | 0 (0.0%) | 40 (100.0%) |
| 55 to 64 Years | 9 (28.1%) | 23 (71.9%) |
| 65 to 74 Years | 0 (0.0%) | 0 (0.0%) |
| 75 Years and over | 69 (100.0%) | 69 (100.0%) |
| Total | 78 (33.5%) | 224 (96.1%) |
Disability Status by Sex by Age in Belfry
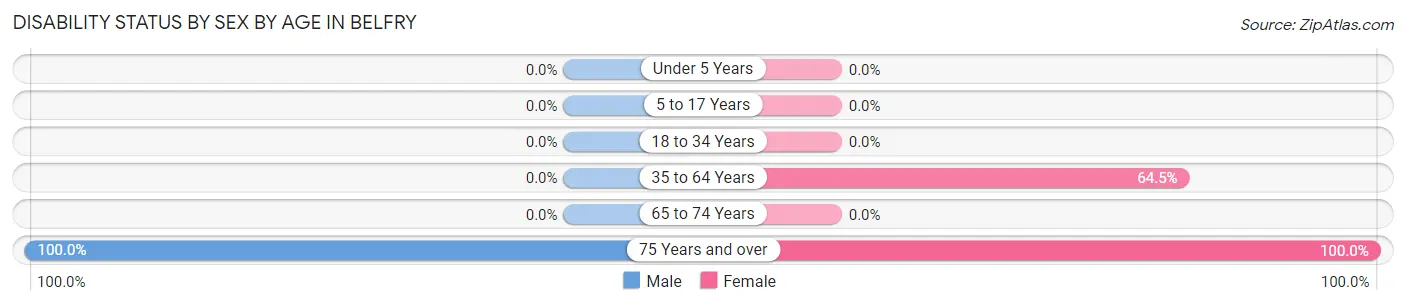
| Age Bracket | Male | Female |
| Under 5 Years | 0 (0.0%) | 0 (0.0%) |
| 5 to 17 Years | 0 (0.0%) | 0 (0.0%) |
| 18 to 34 Years | 0 (0.0%) | 0 (0.0%) |
| 35 to 64 Years | 0 (0.0%) | 20 (64.5%) |
| 65 to 74 Years | 0 (0.0%) | 0 (0.0%) |
| 75 Years and over | 33 (100.0%) | 36 (100.0%) |
Disability Class by Sex by Age in Belfry
Disability Class: Hearing Difficulty
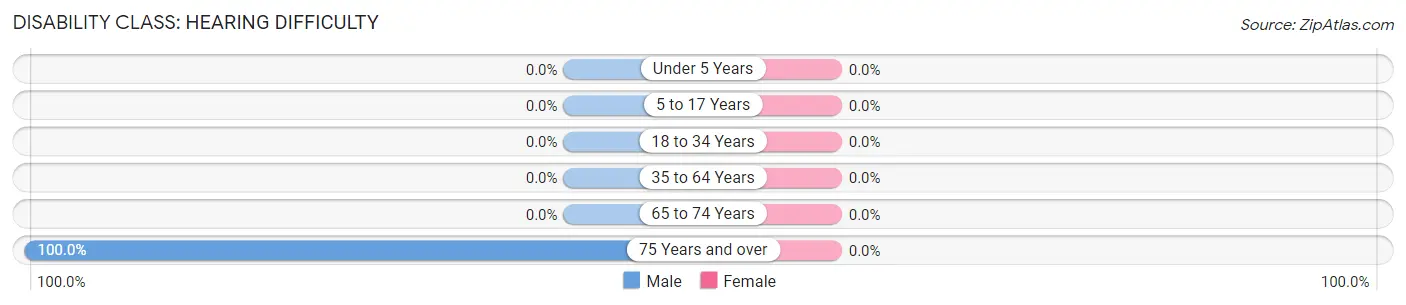
| Age Bracket | Male | Female |
| Under 5 Years | 0 (0.0%) | 0 (0.0%) |
| 5 to 17 Years | 0 (0.0%) | 0 (0.0%) |
| 18 to 34 Years | 0 (0.0%) | 0 (0.0%) |
| 35 to 64 Years | 0 (0.0%) | 0 (0.0%) |
| 65 to 74 Years | 0 (0.0%) | 0 (0.0%) |
| 75 Years and over | 33 (100.0%) | 0 (0.0%) |
Disability Class: Vision Difficulty
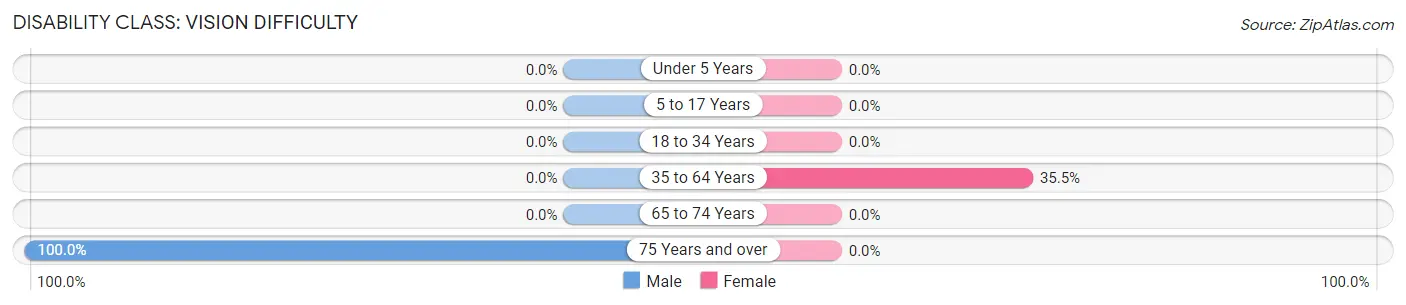
| Age Bracket | Male | Female |
| Under 5 Years | 0 (0.0%) | 0 (0.0%) |
| 5 to 17 Years | 0 (0.0%) | 0 (0.0%) |
| 18 to 34 Years | 0 (0.0%) | 0 (0.0%) |
| 35 to 64 Years | 0 (0.0%) | 11 (35.5%) |
| 65 to 74 Years | 0 (0.0%) | 0 (0.0%) |
| 75 Years and over | 33 (100.0%) | 0 (0.0%) |
Disability Class: Cognitive Difficulty
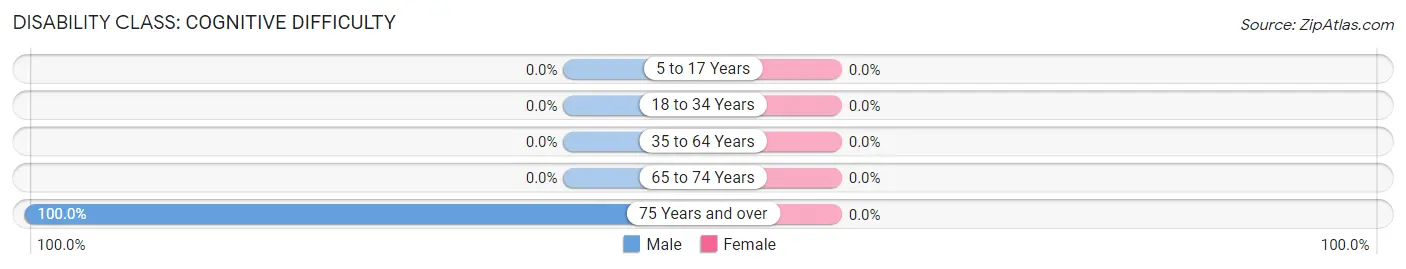
| Age Bracket | Male | Female |
| 5 to 17 Years | 0 (0.0%) | 0 (0.0%) |
| 18 to 34 Years | 0 (0.0%) | 0 (0.0%) |
| 35 to 64 Years | 0 (0.0%) | 0 (0.0%) |
| 65 to 74 Years | 0 (0.0%) | 0 (0.0%) |
| 75 Years and over | 33 (100.0%) | 0 (0.0%) |
Disability Class: Ambulatory Difficulty
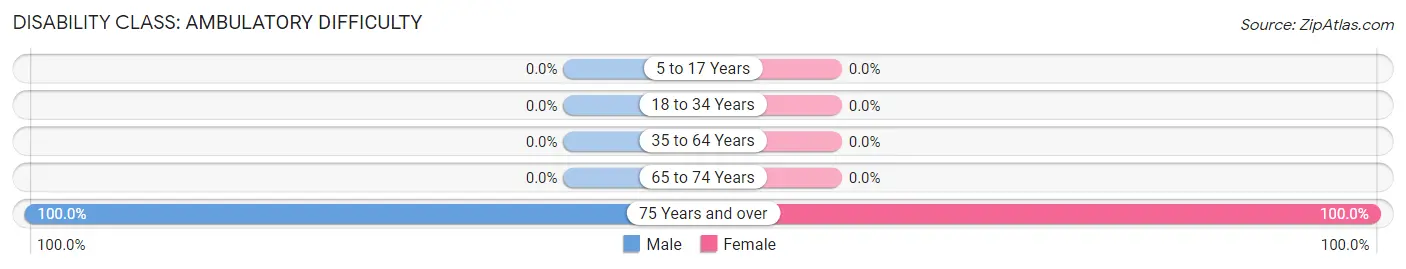
| Age Bracket | Male | Female |
| 5 to 17 Years | 0 (0.0%) | 0 (0.0%) |
| 18 to 34 Years | 0 (0.0%) | 0 (0.0%) |
| 35 to 64 Years | 0 (0.0%) | 0 (0.0%) |
| 65 to 74 Years | 0 (0.0%) | 0 (0.0%) |
| 75 Years and over | 33 (100.0%) | 36 (100.0%) |
Disability Class: Self-Care Difficulty
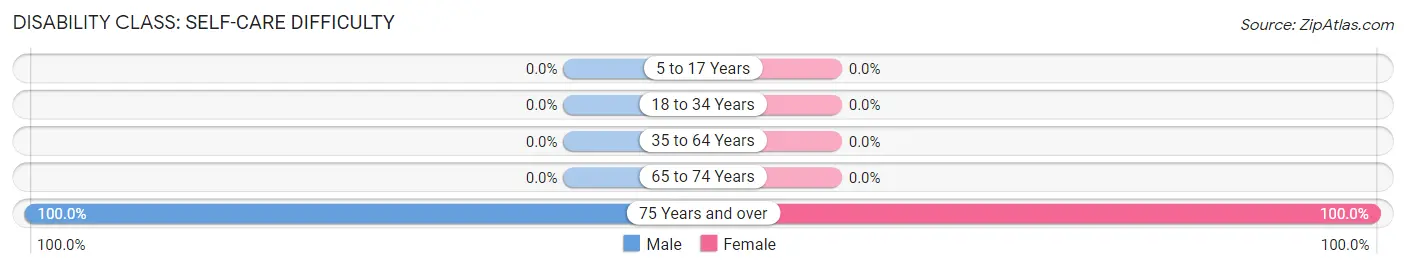
| Age Bracket | Male | Female |
| 5 to 17 Years | 0 (0.0%) | 0 (0.0%) |
| 18 to 34 Years | 0 (0.0%) | 0 (0.0%) |
| 35 to 64 Years | 0 (0.0%) | 0 (0.0%) |
| 65 to 74 Years | 0 (0.0%) | 0 (0.0%) |
| 75 Years and over | 33 (100.0%) | 36 (100.0%) |
Technology Access in Belfry
Computing Device Access in Belfry
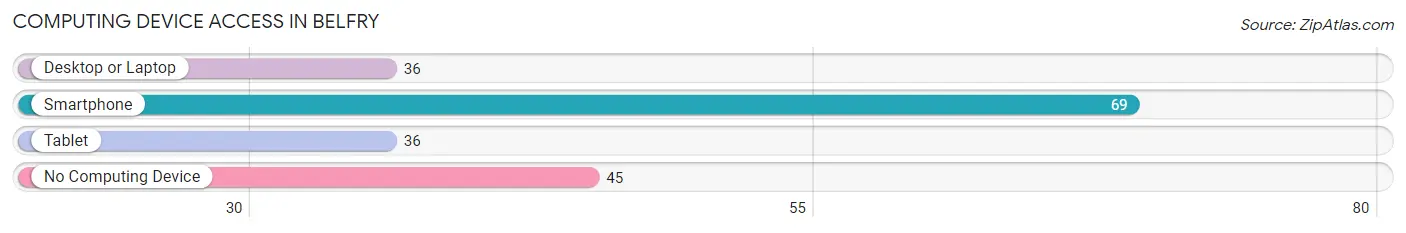
| Device Type | # Households | % Households |
| Desktop or Laptop | 36 | 31.6% |
| Smartphone | 69 | 60.5% |
| Tablet | 36 | 31.6% |
| No Computing Device | 45 | 39.5% |
| Total | 114 | 100.0% |
Internet Access in Belfry
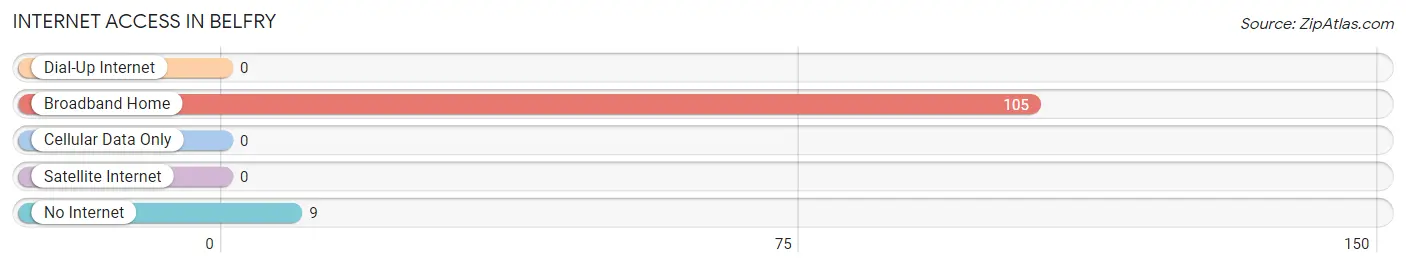
| Internet Type | # Households | % Households |
| Dial-Up Internet | 0 | 0.0% |
| Broadband Home | 105 | 92.1% |
| Cellular Data Only | 0 | 0.0% |
| Satellite Internet | 0 | 0.0% |
| No Internet | 9 | 7.9% |
| Total | 114 | 100.0% |
Belfry Summary
Belfry is a small unincorporated community located in Pike County, Kentucky, United States. It is situated along the banks of the Big Sandy River, and is part of the Appalachian region of the state. The population of Belfry was estimated to be 1,845 in the year 2000.
History
The area that is now Belfry was first settled in the late 1700s by a group of settlers from Virginia. The town was originally known as “Belfry Station”, and was named after a nearby church bell tower. The town was officially incorporated in 1891, and was the first town in Pike County to be incorporated.
The town was a major hub for the coal mining industry in the late 19th and early 20th centuries. The coal industry was the primary source of employment for the town’s residents, and the town was home to several coal mines. The town was also home to a number of other businesses, including a sawmill, a gristmill, and a general store.
Geography
Belfry is located in the Appalachian region of Kentucky, and is situated along the banks of the Big Sandy River. The town is located in the foothills of the Appalachian Mountains, and is surrounded by rolling hills and forests. The town is located approximately 25 miles from the city of Pikeville, and is approximately 75 miles from Lexington.
The climate in Belfry is humid subtropical, with hot summers and mild winters. The average annual temperature is around 57 degrees Fahrenheit, and the average annual precipitation is around 45 inches.
Economy
The economy of Belfry is largely based on the coal mining industry. The town is home to several coal mines, and the coal industry is the primary source of employment for the town’s residents. The town is also home to a number of other businesses, including a sawmill, a gristmill, and a general store.
Demographics
The population of Belfry was estimated to be 1,845 in the year 2000. The racial makeup of the town was 97.3% White, 0.9% African American, 0.2% Native American, 0.2% Asian, and 1.4% from other races. The median household income in Belfry was $25,938 in the year 2000.
Conclusion
Belfry is a small unincorporated community located in Pike County, Kentucky. It is situated along the banks of the Big Sandy River, and is part of the Appalachian region of the state. The town was originally settled in the late 1700s, and was officially incorporated in 1891. The economy of Belfry is largely based on the coal mining industry, and the town is home to several coal mines. The population of Belfry was estimated to be 1,845 in the year 2000, and the racial makeup of the town was 97.3% White, 0.9% African American, 0.2% Native American, 0.2% Asian, and 1.4% from other races.
Common Questions
What is Per Capita Income in Belfry?
Per Capita income in Belfry is $61,844.
What is the Median Family Income in Belfry?
Median Family Income in Belfry is $132,361.
What is the Median Household income in Belfry?
Median Household Income in Belfry is $131,597.
What is Inequality or Gini Index in Belfry?
Inequality or Gini Index in Belfry is 0.23.
What is the Total Population of Belfry?
Total Population of Belfry is 233.
What is the Total Male Population of Belfry?
Total Male Population of Belfry is 156.
What is the Total Female Population of Belfry?
Total Female Population of Belfry is 77.
What is the Ratio of Males per 100 Females in Belfry?
There are 202.60 Males per 100 Females in Belfry.
What is the Ratio of Females per 100 Males in Belfry?
There are 49.36 Females per 100 Males in Belfry.
What is the Median Population Age in Belfry?
Median Population Age in Belfry is 54.6 Years.
What is the Average Family Size in Belfry
Average Family Size in Belfry is 2.3 People.
What is the Average Household Size in Belfry
Average Household Size in Belfry is 2.0 People.
How Large is the Labor Force in Belfry?
There are 122 People in the Labor Forcein in Belfry.
What is the Percentage of People in the Labor Force in Belfry?
54.7% of People are in the Labor Force in Belfry.
What is the Unemployment Rate in Belfry?
Unemployment Rate in Belfry is 38.5%.