Preston, NE Map & Demographics
Preston Map
Preston Overview
$33,805
PER CAPITA INCOME
$51,875
AVG FAMILY INCOME
$51,875
AVG HOUSEHOLD INCOME
62.5%
WAGE / INCOME GAP [ % ]
37.5¢/ $1
WAGE / INCOME GAP [ $ ]
0.21
INEQUALITY / GINI INDEX
38
TOTAL POPULATION
23
MALE POPULATION
15
FEMALE POPULATION
153.33
MALES / 100 FEMALES
65.22
FEMALES / 100 MALES
57.5
MEDIAN AGE
1.8
AVG FAMILY SIZE
1.7
AVG HOUSEHOLD SIZE
18
LABOR FORCE [ PEOPLE ]
52.9%
PERCENT IN LABOR FORCE
Income in Preston
Income Overview in Preston
Per Capita Income in Preston is $33,805, while median incomes of families and households are $51,875 and $51,875 respectively.
| Characteristic | Number | Measure |
| Per Capita Income | 38 | $33,805 |
| Median Family Income | 19 | $51,875 |
| Mean Family Income | 19 | $60,153 |
| Median Household Income | 22 | $51,875 |
| Mean Household Income | 22 | $61,855 |
| Income Deficit | 19 | $0 |
| Wage / Income Gap (%) | 38 | 62.47% |
| Wage / Income Gap ($) | 38 | 37.53¢ per $1 |
| Gini / Inequality Index | 38 | 0.21 |
Earnings by Sex in Preston
Average Earnings in Preston are $59,375, $63,281 for men and $23,750 for women, a difference of 62.5%.
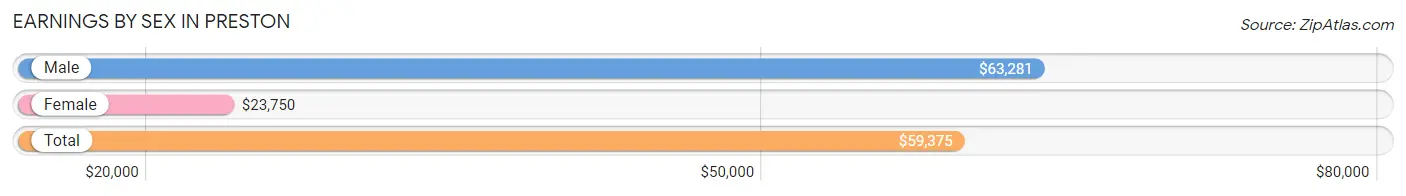
| Sex | Number | Average Earnings |
| Male | 13 (68.4%) | $63,281 |
| Female | 6 (31.6%) | $23,750 |
| Total | 19 (100.0%) | $59,375 |
Earnings by Sex by Income Bracket in Preston
The most common earnings brackets in Preston are $55,000 to $64,999 for men (8 | 61.5%) and $15,000 to $17,499 for women (2 | 33.3%).
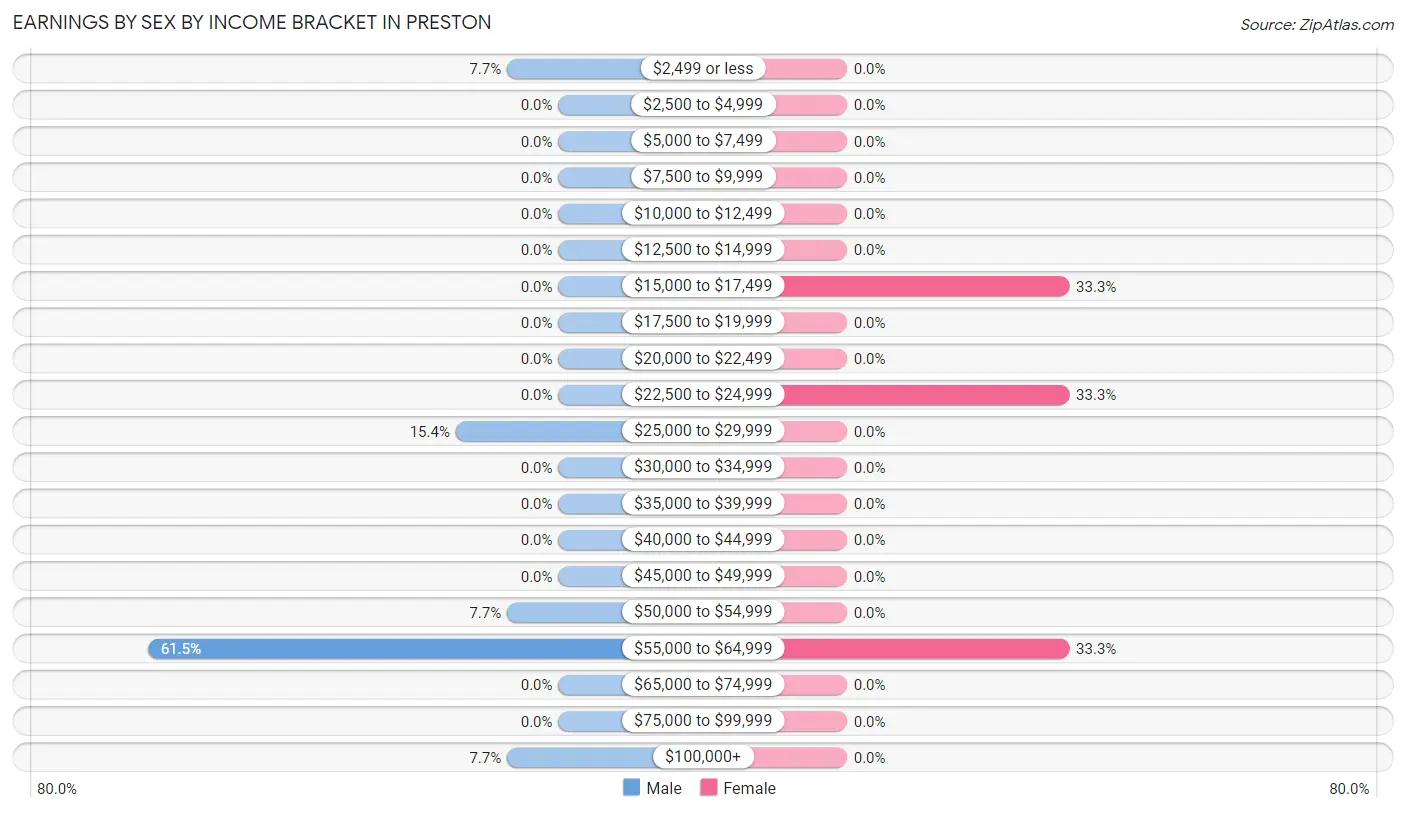
| Income | Male | Female |
| $2,499 or less | 1 (7.7%) | 0 (0.0%) |
| $2,500 to $4,999 | 0 (0.0%) | 0 (0.0%) |
| $5,000 to $7,499 | 0 (0.0%) | 0 (0.0%) |
| $7,500 to $9,999 | 0 (0.0%) | 0 (0.0%) |
| $10,000 to $12,499 | 0 (0.0%) | 0 (0.0%) |
| $12,500 to $14,999 | 0 (0.0%) | 0 (0.0%) |
| $15,000 to $17,499 | 0 (0.0%) | 2 (33.3%) |
| $17,500 to $19,999 | 0 (0.0%) | 0 (0.0%) |
| $20,000 to $22,499 | 0 (0.0%) | 0 (0.0%) |
| $22,500 to $24,999 | 0 (0.0%) | 2 (33.3%) |
| $25,000 to $29,999 | 2 (15.4%) | 0 (0.0%) |
| $30,000 to $34,999 | 0 (0.0%) | 0 (0.0%) |
| $35,000 to $39,999 | 0 (0.0%) | 0 (0.0%) |
| $40,000 to $44,999 | 0 (0.0%) | 0 (0.0%) |
| $45,000 to $49,999 | 0 (0.0%) | 0 (0.0%) |
| $50,000 to $54,999 | 1 (7.7%) | 0 (0.0%) |
| $55,000 to $64,999 | 8 (61.5%) | 2 (33.3%) |
| $65,000 to $74,999 | 0 (0.0%) | 0 (0.0%) |
| $75,000 to $99,999 | 0 (0.0%) | 0 (0.0%) |
| $100,000+ | 1 (7.7%) | 0 (0.0%) |
| Total | 13 (100.0%) | 6 (100.0%) |
Earnings by Sex by Educational Attainment in Preston
| Educational Attainment | Male Income | Female Income |
| Less than High School | - | - |
| High School Diploma | - | - |
| College or Associate's Degree | - | - |
| Bachelor's Degree | - | - |
| Graduate Degree | - | - |
| Total | $63,281 | $23,750 |
Family Income in Preston
Family Income Brackets in Preston
According to the Preston family income data, there are 10 families falling into the $50,000 to $74,999 income range, which is the most common income bracket and makes up 52.6% of all families.
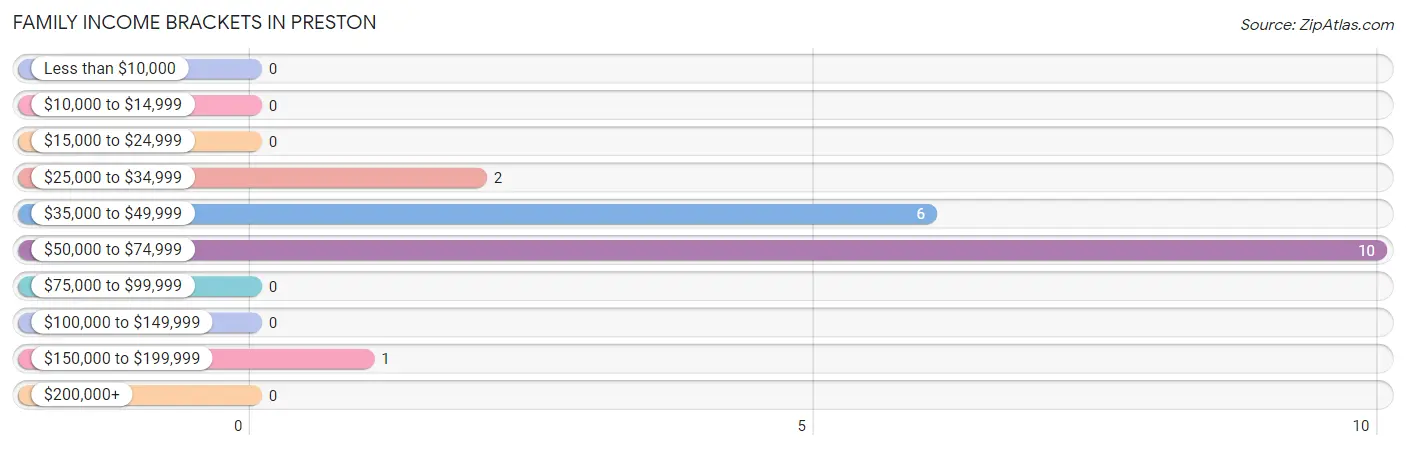
| Income Bracket | # Families | % Families |
| Less than $10,000 | 0 | 0.0% |
| $10,000 to $14,999 | 0 | 0.0% |
| $15,000 to $24,999 | 0 | 0.0% |
| $25,000 to $34,999 | 2 | 10.5% |
| $35,000 to $49,999 | 6 | 31.6% |
| $50,000 to $74,999 | 10 | 52.6% |
| $75,000 to $99,999 | 0 | 0.0% |
| $100,000 to $149,999 | 0 | 0.0% |
| $150,000 to $199,999 | 1 | 5.3% |
| $200,000+ | 0 | 0.0% |
Family Income by Famaliy Size in Preston
2-person families (10 | 52.6%) account for the highest median family income in Preston with $48,125 per family, while 2-person families (10 | 52.6%) have the highest median income of $24,062 per family member.
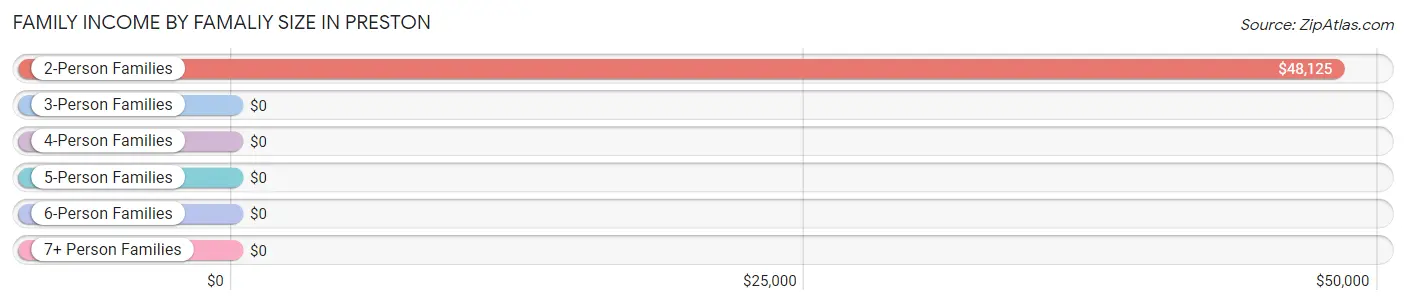
| Income Bracket | # Families | Median Income |
| 2-Person Families | 10 (52.6%) | $48,125 |
| 3-Person Families | 1 (5.3%) | $0 |
| 4-Person Families | 8 (42.1%) | $0 |
| 5-Person Families | 0 (0.0%) | $0 |
| 6-Person Families | 0 (0.0%) | $0 |
| 7+ Person Families | 0 (0.0%) | $0 |
| Total | 19 (100.0%) | $51,875 |
Family Income by Number of Earners in Preston
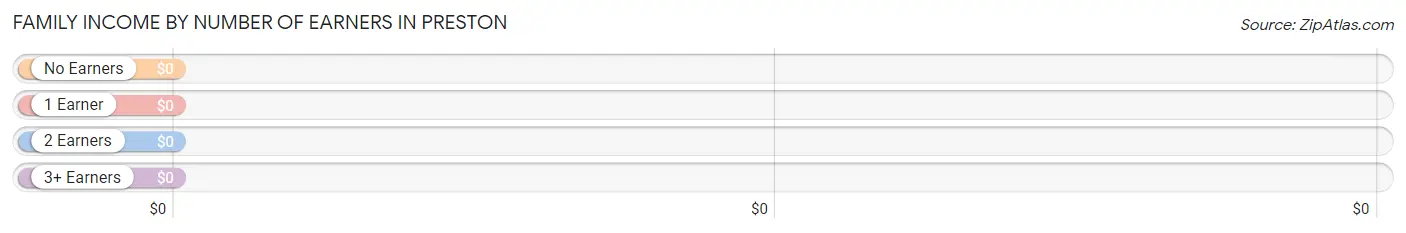
| Number of Earners | # Families | Median Income |
| No Earners | 6 (31.6%) | $0 |
| 1 Earner | 10 (52.6%) | $0 |
| 2 Earners | 2 (10.5%) | $0 |
| 3+ Earners | 1 (5.3%) | $0 |
| Total | 19 (100.0%) | $51,875 |
Household Income in Preston
Household Income Brackets in Preston
With 12 households falling in the category, the $50,000 to $74,999 income range is the most frequent in Preston, accounting for 54.5% of all households.
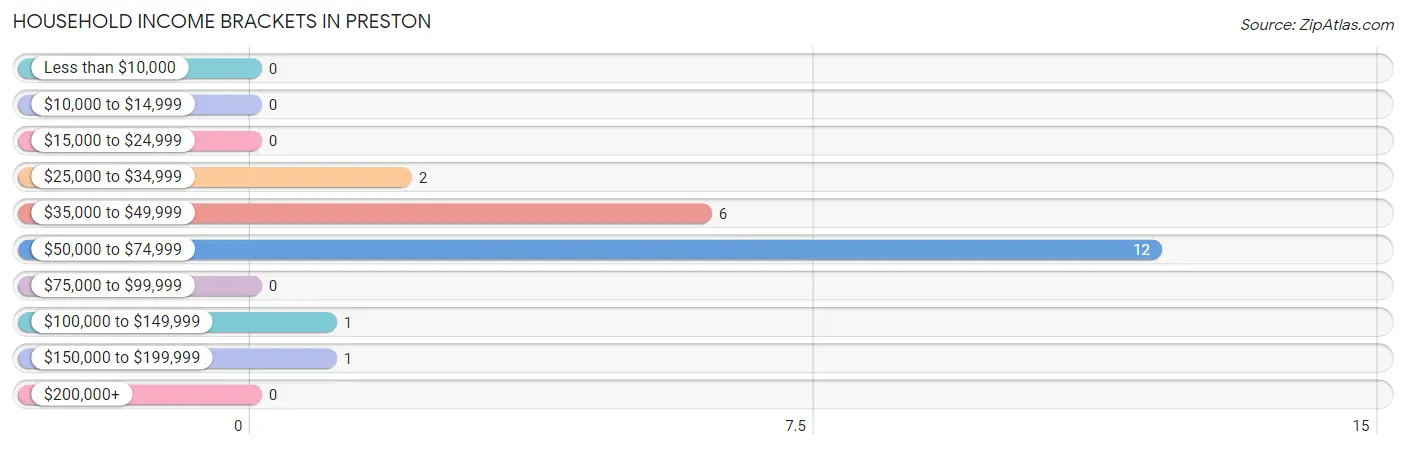
| Income Bracket | # Households | % Households |
| Less than $10,000 | 0 | 0.0% |
| $10,000 to $14,999 | 0 | 0.0% |
| $15,000 to $24,999 | 0 | 0.0% |
| $25,000 to $34,999 | 2 | 9.1% |
| $35,000 to $49,999 | 6 | 27.3% |
| $50,000 to $74,999 | 12 | 54.5% |
| $75,000 to $99,999 | 0 | 0.0% |
| $100,000 to $149,999 | 1 | 4.5% |
| $150,000 to $199,999 | 1 | 4.5% |
| $200,000+ | 0 | 0.0% |
Household Income by Householder Age in Preston
The median household income in Preston is $51,875, with the highest median household income of $48,125 found in the 65+ years age bracket for the primary householder. A total of 10 households (45.5%) fall into this category.
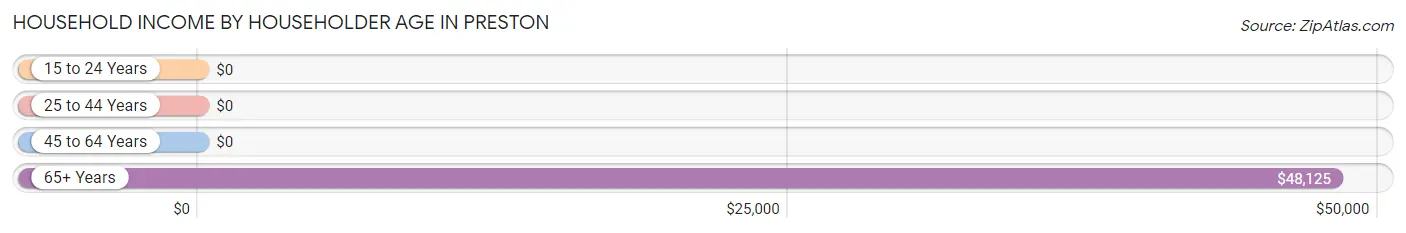
| Income Bracket | # Households | Median Income |
| 15 to 24 Years | 0 (0.0%) | $0 |
| 25 to 44 Years | 8 (36.4%) | $0 |
| 45 to 64 Years | 4 (18.2%) | $0 |
| 65+ Years | 10 (45.5%) | $48,125 |
| Total | 22 (100.0%) | $51,875 |
Poverty in Preston
Income Below Poverty by Sex and Age in Preston
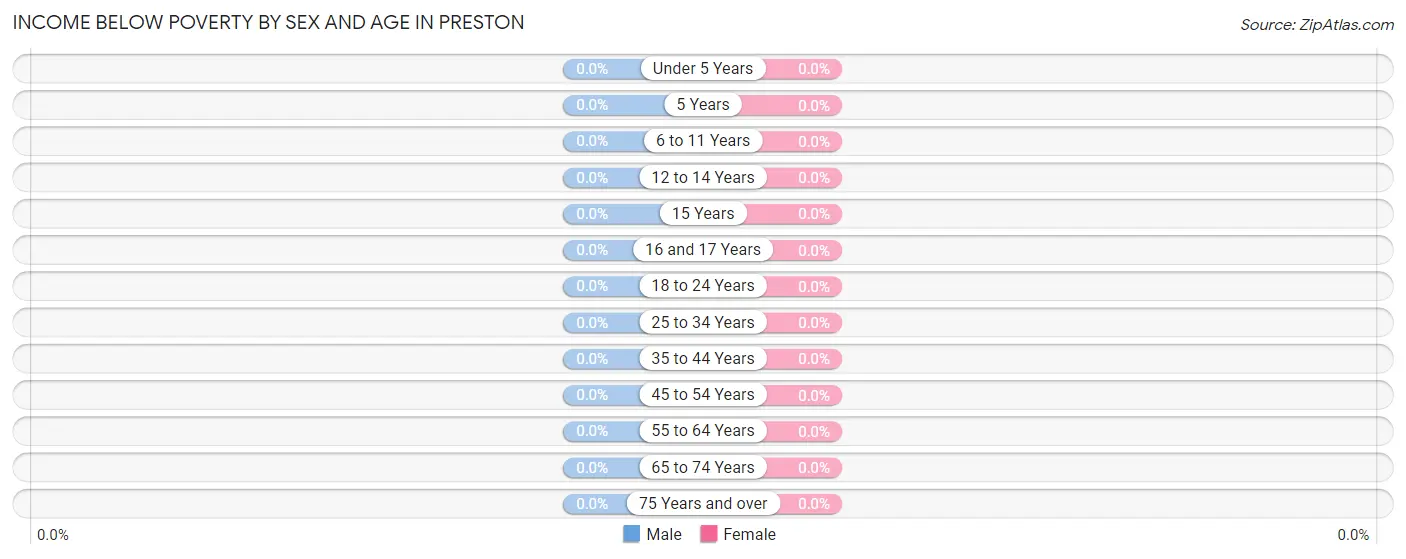
| Age Bracket | Male | Female |
| Under 5 Years | 0 (0.0%) | 0 (0.0%) |
| 5 Years | 0 (0.0%) | 0 (0.0%) |
| 6 to 11 Years | 0 (0.0%) | 0 (0.0%) |
| 12 to 14 Years | 0 (0.0%) | 0 (0.0%) |
| 15 Years | 0 (0.0%) | 0 (0.0%) |
| 16 and 17 Years | 0 (0.0%) | 0 (0.0%) |
| 18 to 24 Years | 0 (0.0%) | 0 (0.0%) |
| 25 to 34 Years | 0 (0.0%) | 0 (0.0%) |
| 35 to 44 Years | 0 (0.0%) | 0 (0.0%) |
| 45 to 54 Years | 0 (0.0%) | 0 (0.0%) |
| 55 to 64 Years | 0 (0.0%) | 0 (0.0%) |
| 65 to 74 Years | 0 (0.0%) | 0 (0.0%) |
| 75 Years and over | 0 (0.0%) | 0 (0.0%) |
| Total | 0 (0.0%) | 0 (0.0%) |
Income Above Poverty by Sex and Age in Preston
According to the poverty statistics in Preston, males aged 6 to 11 years and females aged 25 to 34 years are the age groups that are most secure financially, with 100.0% of males and 100.0% of females in these age groups living above the poverty line.
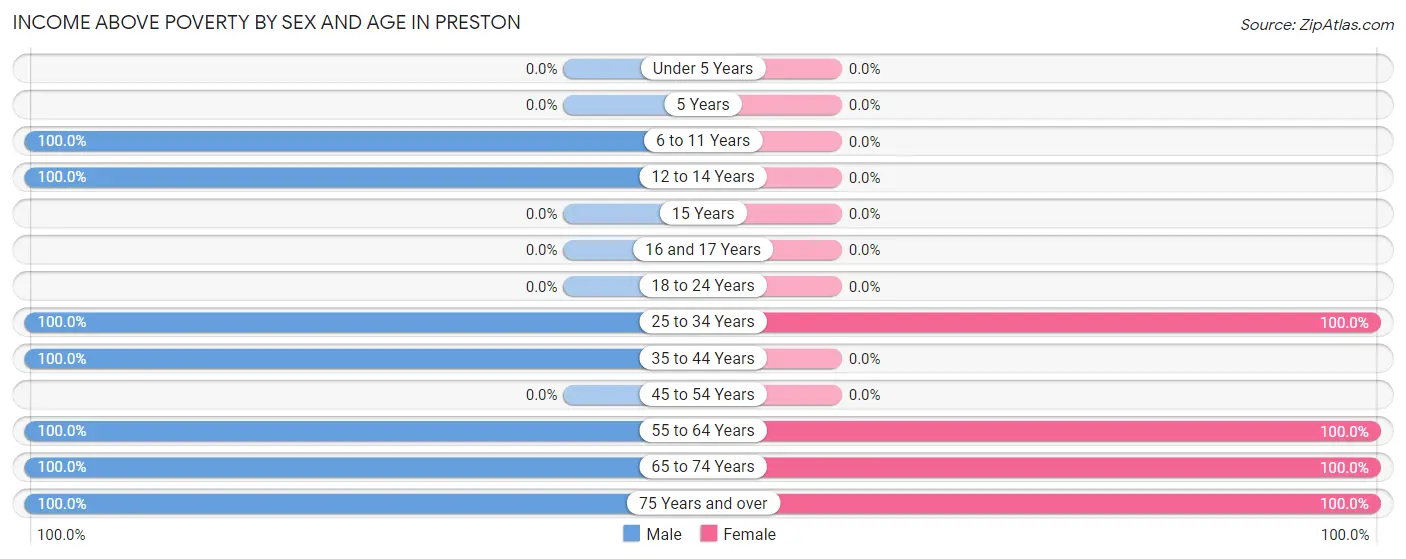
| Age Bracket | Male | Female |
| Under 5 Years | 0 (0.0%) | 0 (0.0%) |
| 5 Years | 0 (0.0%) | 0 (0.0%) |
| 6 to 11 Years | 2 (100.0%) | 0 (0.0%) |
| 12 to 14 Years | 2 (100.0%) | 0 (0.0%) |
| 15 Years | 0 (0.0%) | 0 (0.0%) |
| 16 and 17 Years | 0 (0.0%) | 0 (0.0%) |
| 18 to 24 Years | 0 (0.0%) | 0 (0.0%) |
| 25 to 34 Years | 1 (100.0%) | 3 (100.0%) |
| 35 to 44 Years | 8 (100.0%) | 0 (0.0%) |
| 45 to 54 Years | 0 (0.0%) | 0 (0.0%) |
| 55 to 64 Years | 4 (100.0%) | 4 (100.0%) |
| 65 to 74 Years | 3 (100.0%) | 6 (100.0%) |
| 75 Years and over | 3 (100.0%) | 2 (100.0%) |
| Total | 23 (100.0%) | 15 (100.0%) |
Income Below Poverty Among Married-Couple Families in Preston
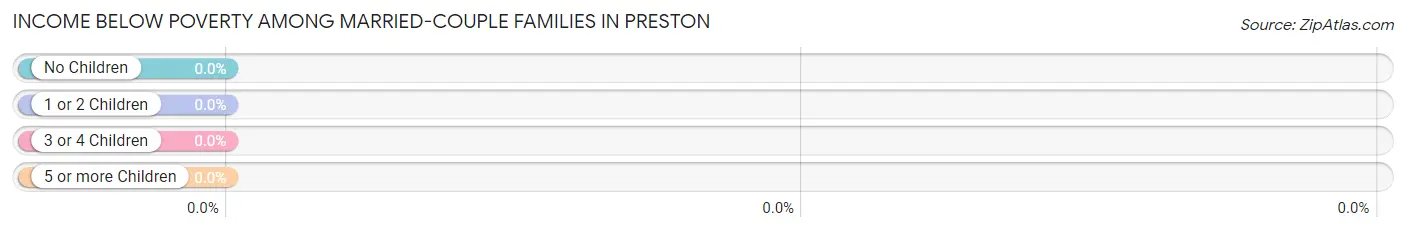
| Children | Above Poverty | Below Poverty |
| No Children | 11 (100.0%) | 0 (0.0%) |
| 1 or 2 Children | 8 (100.0%) | 0 (0.0%) |
| 3 or 4 Children | 0 (0.0%) | 0 (0.0%) |
| 5 or more Children | 0 (0.0%) | 0 (0.0%) |
| Total | 19 (100.0%) | 0 (0.0%) |
Income Below Poverty Among Single-Parent Households in Preston
| Children | Single Father | Single Mother |
| No Children | 0 (0.0%) | 0 (0.0%) |
| 1 or 2 Children | 0 (0.0%) | 0 (0.0%) |
| 3 or 4 Children | 0 (0.0%) | 0 (0.0%) |
| 5 or more Children | 0 (0.0%) | 0 (0.0%) |
| Total | 0 (0.0%) | 0 (0.0%) |
Income Below Poverty Among Married-Couple vs Single-Parent Households in Preston
| Children | Married-Couple Families | Single-Parent Households |
| No Children | 0 (0.0%) | 0 (0.0%) |
| 1 or 2 Children | 0 (0.0%) | 0 (0.0%) |
| 3 or 4 Children | 0 (0.0%) | 0 (0.0%) |
| 5 or more Children | 0 (0.0%) | 0 (0.0%) |
| Total | 0 (0.0%) | 0 (0.0%) |
Race in Preston
The most populous races in Preston are White / Caucasian (19 | 50.0%), Native / Alaskan (14 | 36.8%), and Hispanic or Latino (9 | 23.7%).
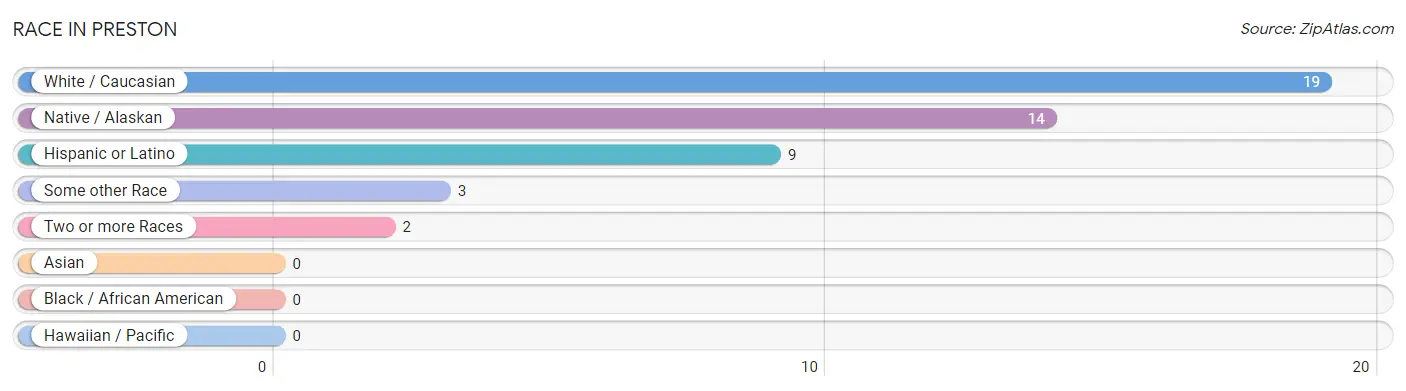
| Race | # Population | % Population |
| Asian | 0 | 0.0% |
| Black / African American | 0 | 0.0% |
| Hawaiian / Pacific | 0 | 0.0% |
| Hispanic or Latino | 9 | 23.7% |
| Native / Alaskan | 14 | 36.8% |
| White / Caucasian | 19 | 50.0% |
| Two or more Races | 2 | 5.3% |
| Some other Race | 3 | 7.9% |
| Total | 38 | 100.0% |
Ancestry in Preston
The most populous ancestries reported in Preston are German (12 | 31.6%), Potawatomi (12 | 31.6%), Mexican (9 | 23.7%), Irish (4 | 10.5%), and English (1 | 2.6%), together accounting for 100.0% of all Preston residents.
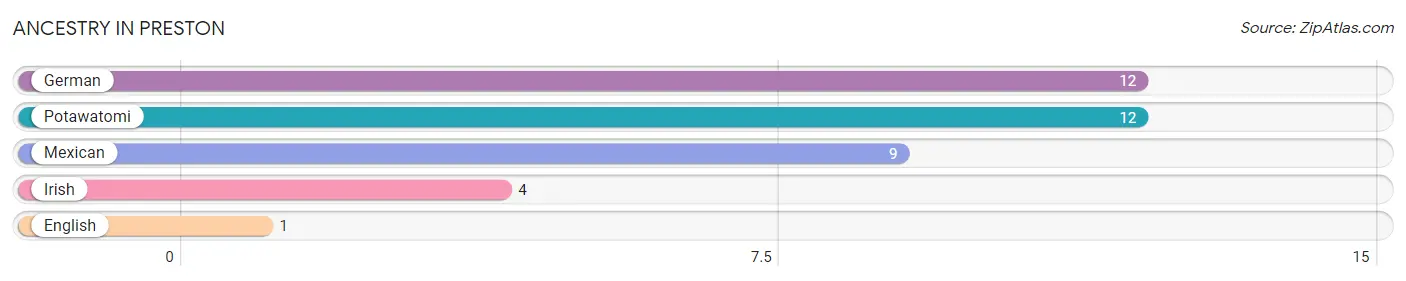
| Ancestry | # Population | % Population |
| English | 1 | 2.6% |
| German | 12 | 31.6% |
| Irish | 4 | 10.5% |
| Mexican | 9 | 23.7% |
| Potawatomi | 12 | 31.6% | View All 5 Rows |
Immigrants in Preston

| Immigration Origin | # Population | % Population | View All 0 Rows |
Sex and Age in Preston
Sex and Age in Preston
The most populous age groups in Preston are 35 to 39 Years (8 | 34.8%) for men and 70 to 74 Years (6 | 40.0%) for women.
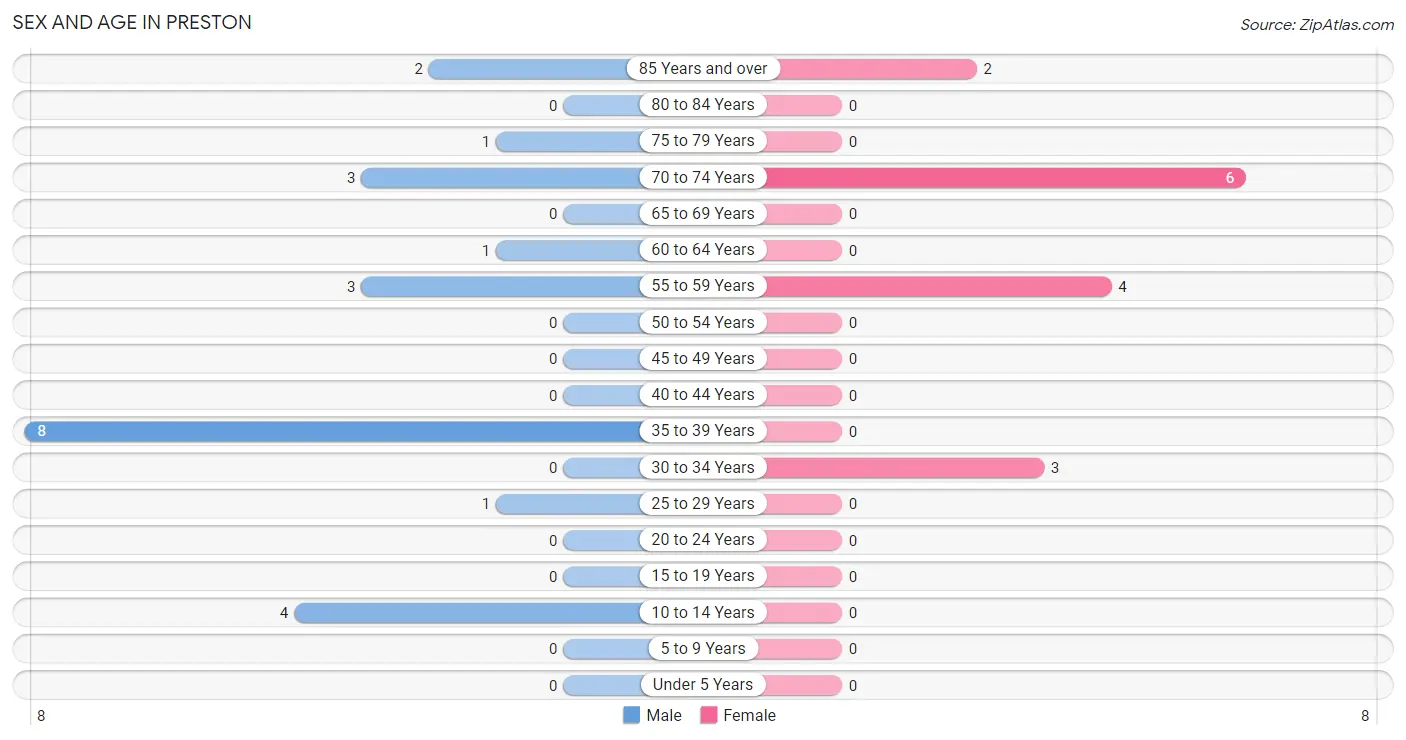
| Age Bracket | Male | Female |
| Under 5 Years | 0 (0.0%) | 0 (0.0%) |
| 5 to 9 Years | 0 (0.0%) | 0 (0.0%) |
| 10 to 14 Years | 4 (17.4%) | 0 (0.0%) |
| 15 to 19 Years | 0 (0.0%) | 0 (0.0%) |
| 20 to 24 Years | 0 (0.0%) | 0 (0.0%) |
| 25 to 29 Years | 1 (4.3%) | 0 (0.0%) |
| 30 to 34 Years | 0 (0.0%) | 3 (20.0%) |
| 35 to 39 Years | 8 (34.8%) | 0 (0.0%) |
| 40 to 44 Years | 0 (0.0%) | 0 (0.0%) |
| 45 to 49 Years | 0 (0.0%) | 0 (0.0%) |
| 50 to 54 Years | 0 (0.0%) | 0 (0.0%) |
| 55 to 59 Years | 3 (13.0%) | 4 (26.7%) |
| 60 to 64 Years | 1 (4.3%) | 0 (0.0%) |
| 65 to 69 Years | 0 (0.0%) | 0 (0.0%) |
| 70 to 74 Years | 3 (13.0%) | 6 (40.0%) |
| 75 to 79 Years | 1 (4.3%) | 0 (0.0%) |
| 80 to 84 Years | 0 (0.0%) | 0 (0.0%) |
| 85 Years and over | 2 (8.7%) | 2 (13.3%) |
| Total | 23 (100.0%) | 15 (100.0%) |
Families and Households in Preston
Median Family Size in Preston
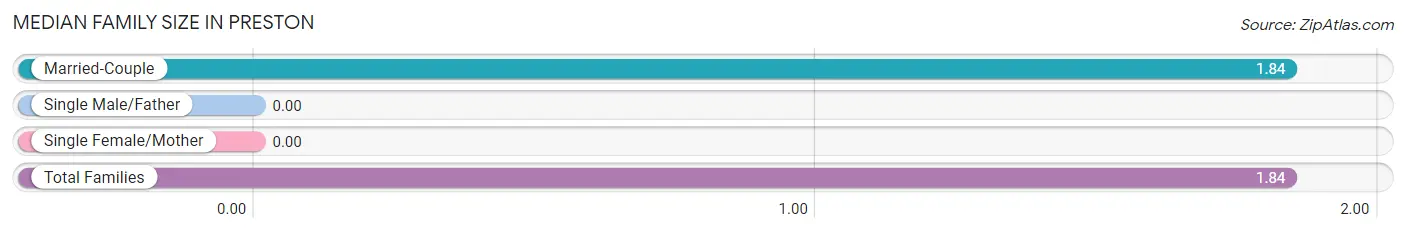
| Family Type | # Families | Family Size |
| Married-Couple | 19 (100.0%) | 1.84 |
| Single Male/Father | 0 (0.0%) | - |
| Single Female/Mother | 0 (0.0%) | - |
| Total Families | 19 (100.0%) | 1.84 |
Median Household Size in Preston
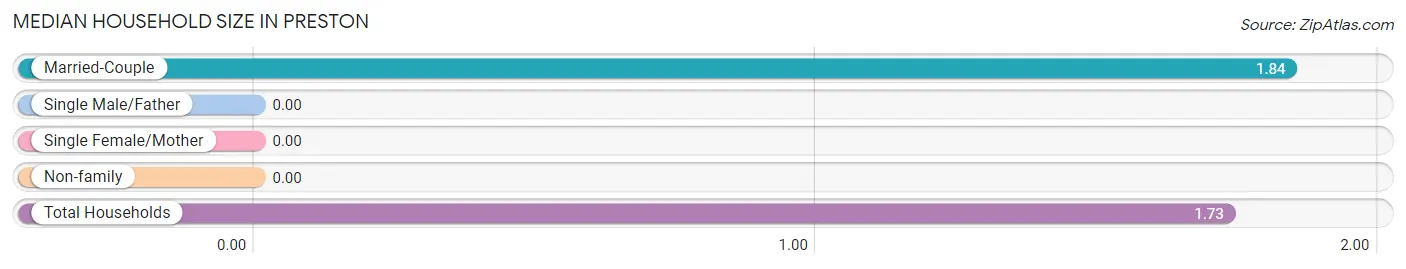
| Household Type | # Households | Household Size |
| Married-Couple | 19 (86.4%) | 1.84 |
| Single Male/Father | 0 (0.0%) | - |
| Single Female/Mother | 0 (0.0%) | - |
| Non-family | 3 (13.6%) | - |
| Total Households | 22 (100.0%) | 1.73 |
Household Size by Marriage Status in Preston
Out of a total of 22 households in Preston, 19 (86.4%) are family households, while 3 (13.6%) are nonfamily households. The most numerous type of family households are 2-person households, comprising 10, and the most common type of nonfamily households are 1-person households, comprising 3.
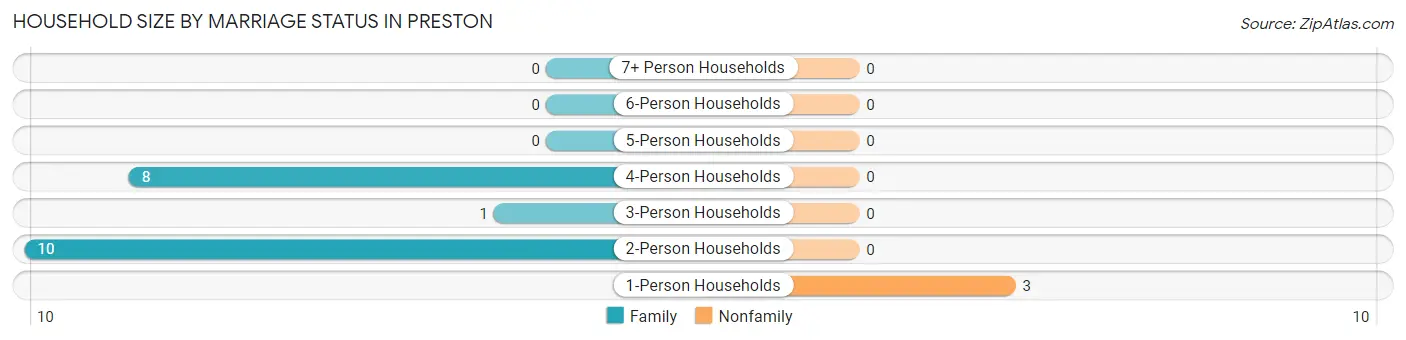
| Household Size | Family Households | Nonfamily Households |
| 1-Person Households | - | 3 (13.6%) |
| 2-Person Households | 10 (45.5%) | 0 (0.0%) |
| 3-Person Households | 1 (4.5%) | 0 (0.0%) |
| 4-Person Households | 8 (36.4%) | 0 (0.0%) |
| 5-Person Households | 0 (0.0%) | 0 (0.0%) |
| 6-Person Households | 0 (0.0%) | 0 (0.0%) |
| 7+ Person Households | 0 (0.0%) | 0 (0.0%) |
| Total | 19 (86.4%) | 3 (13.6%) |
Female Fertility in Preston
Fertility by Age in Preston
| Age Bracket | Women with Births | Births / 1,000 Women |
| 15 to 19 years | 0 (0.0%) | 0.0 |
| 20 to 34 years | 0 (0.0%) | 0.0 |
| 35 to 50 years | 0 (0.0%) | 0.0 |
| Total | 0 (0.0%) | 0.0 |
Fertility by Age by Marriage Status in Preston
| Age Bracket | Married | Unmarried |
| 15 to 19 years | 0 (0.0%) | 0 (0.0%) |
| 20 to 34 years | 0 (0.0%) | 0 (0.0%) |
| 35 to 50 years | 0 (0.0%) | 0 (0.0%) |
| Total | 0 (0.0%) | 0 (0.0%) |
Fertility by Education in Preston
| Educational Attainment | Women with Births | Births / 1,000 Women |
| Less than High School | 0 (0.0%) | 0.0 |
| High School Diploma | 0 (0.0%) | 0.0 |
| College or Associate's Degree | 0 (0.0%) | 0.0 |
| Bachelor's Degree | 0 (0.0%) | 0.0 |
| Graduate Degree | 0 (0.0%) | 0.0 |
| Total | 0 (0.0%) | 0.0 |
Fertility by Education by Marriage Status in Preston
| Educational Attainment | Married | Unmarried |
| Less than High School | 0 (0.0%) | 0 (0.0%) |
| High School Diploma | 0 (0.0%) | 0 (0.0%) |
| College or Associate's Degree | 0 (0.0%) | 0 (0.0%) |
| Bachelor's Degree | 0 (0.0%) | 0 (0.0%) |
| Graduate Degree | 0 (0.0%) | 0 (0.0%) |
| Total | 0 (0.0%) | 0 (0.0%) |
Employment Characteristics in Preston
Employment by Class of Employer in Preston
Among the 18 employed individuals in Preston, private company employees (9 | 50.0%), local government employees (8 | 44.4%), and self-employed (not incorporated) (1 | 5.6%) make up the most common classes of employment.
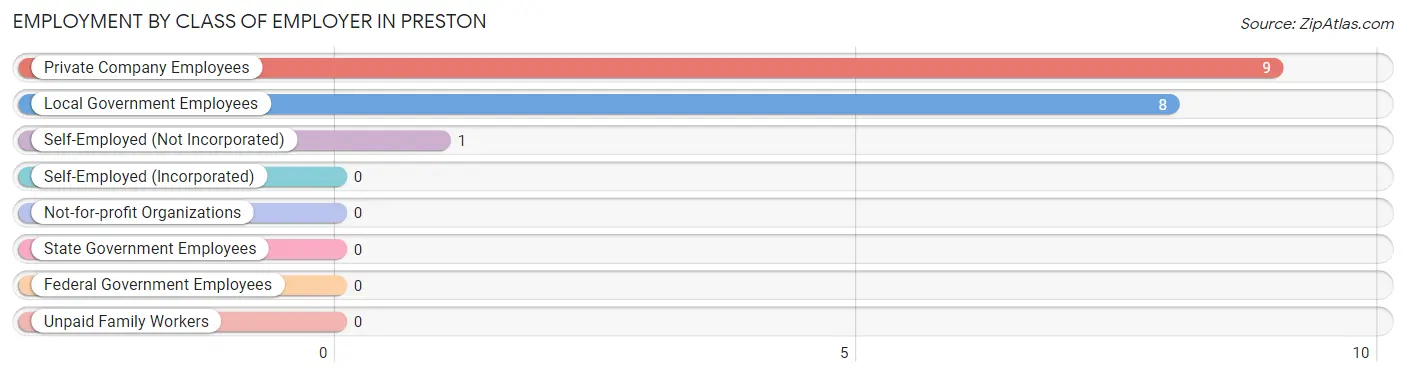
| Employer Class | # Employees | % Employees |
| Private Company Employees | 9 | 50.0% |
| Self-Employed (Incorporated) | 0 | 0.0% |
| Self-Employed (Not Incorporated) | 1 | 5.6% |
| Not-for-profit Organizations | 0 | 0.0% |
| Local Government Employees | 8 | 44.4% |
| State Government Employees | 0 | 0.0% |
| Federal Government Employees | 0 | 0.0% |
| Unpaid Family Workers | 0 | 0.0% |
| Total | 18 | 100.0% |
Employment Status by Age in Preston
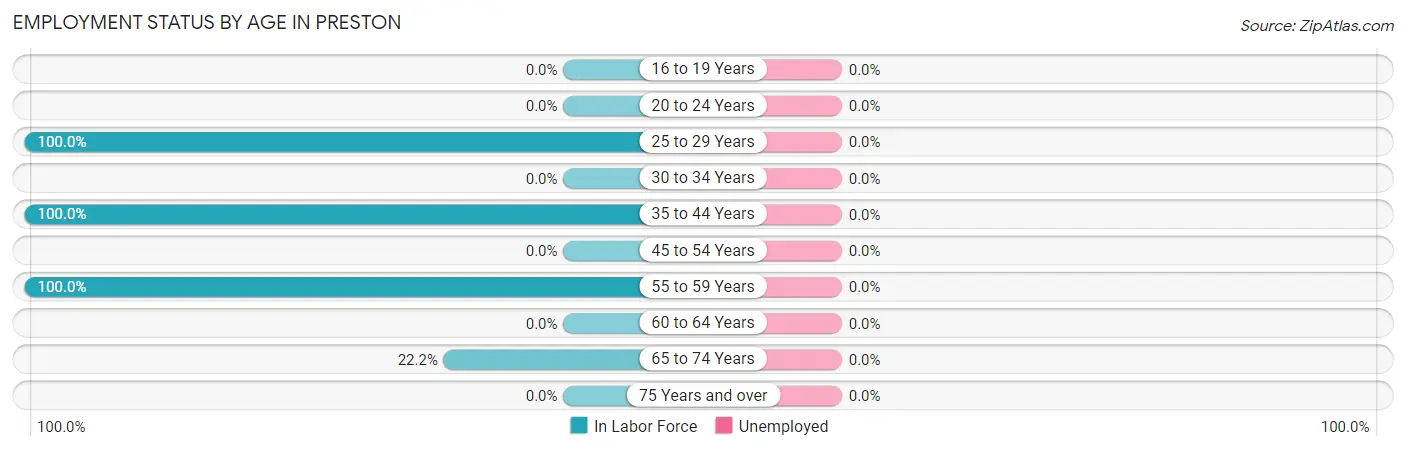
| Age Bracket | In Labor Force | Unemployed |
| 16 to 19 Years | 0 (0.0%) | 0 (0.0%) |
| 20 to 24 Years | 0 (0.0%) | 0 (0.0%) |
| 25 to 29 Years | 1 (100.0%) | 0 (0.0%) |
| 30 to 34 Years | 0 (0.0%) | 0 (0.0%) |
| 35 to 44 Years | 8 (100.0%) | 0 (0.0%) |
| 45 to 54 Years | 0 (0.0%) | 0 (0.0%) |
| 55 to 59 Years | 7 (100.0%) | 0 (0.0%) |
| 60 to 64 Years | 0 (0.0%) | 0 (0.0%) |
| 65 to 74 Years | 2 (22.2%) | 0 (0.0%) |
| 75 Years and over | 0 (0.0%) | 0 (0.0%) |
| Total | 18 (52.9%) | 0 (0.0%) |
Employment Status by Educational Attainment in Preston
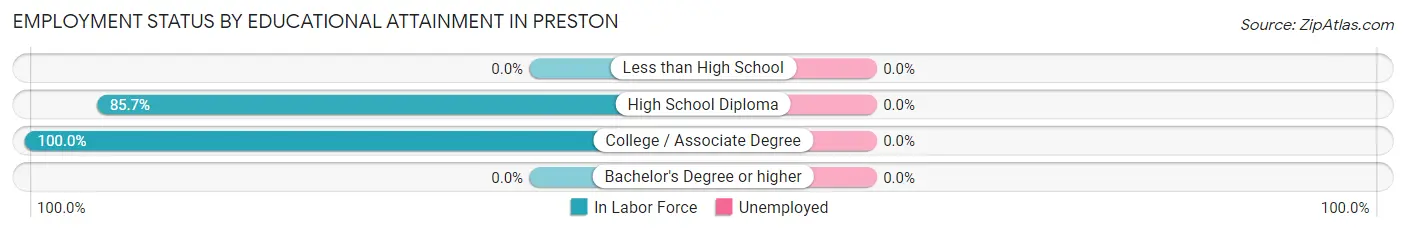
| Educational Attainment | In Labor Force | Unemployed |
| Less than High School | 0 (0.0%) | 0 (0.0%) |
| High School Diploma | 6 (85.7%) | 0 (0.0%) |
| College / Associate Degree | 10 (100.0%) | 0 (0.0%) |
| Bachelor's Degree or higher | 0 (0.0%) | 0 (0.0%) |
| Total | 16 (80.0%) | 0 (0.0%) |
Employment Occupations by Sex in Preston
Management, Business, Science and Arts Occupations
The most common Management, Business, Science and Arts occupations in Preston are Computers, Engineering & Science (8 | 44.4%), Computers & Mathematics (8 | 44.4%), and Management (1 | 5.6%).
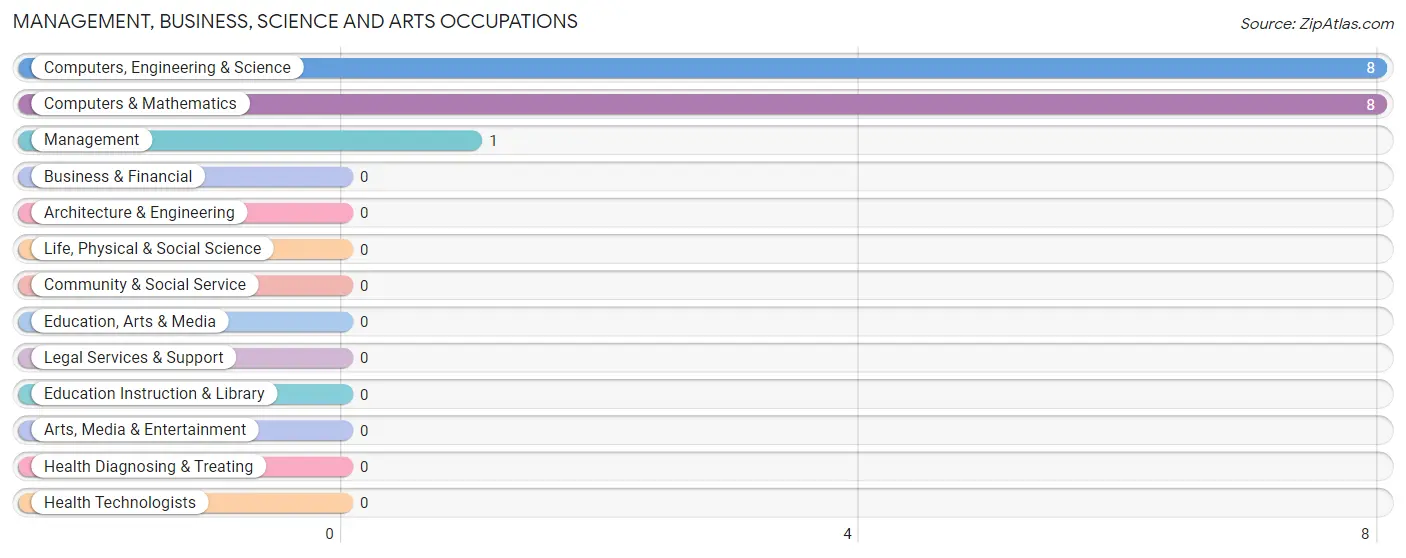
Management, Business, Science and Arts Occupations by Sex
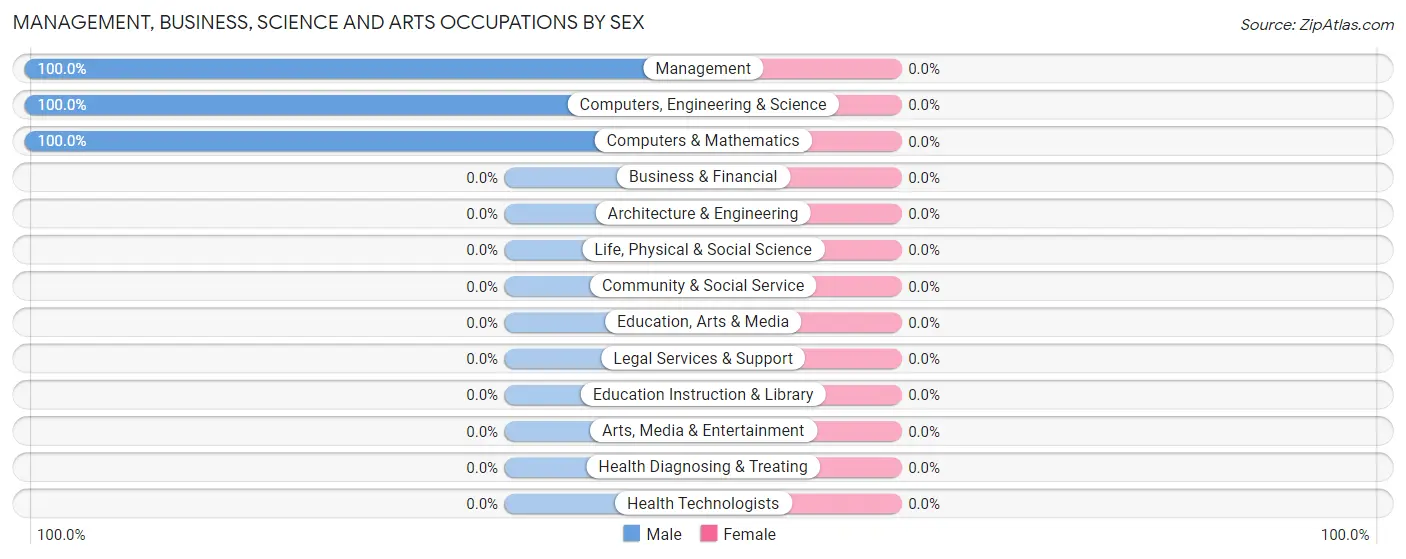
| Occupation | Male | Female |
| Management | 1 (100.0%) | 0 (0.0%) |
| Business & Financial | 0 (0.0%) | 0 (0.0%) |
| Computers, Engineering & Science | 8 (100.0%) | 0 (0.0%) |
| Computers & Mathematics | 8 (100.0%) | 0 (0.0%) |
| Architecture & Engineering | 0 (0.0%) | 0 (0.0%) |
| Life, Physical & Social Science | 0 (0.0%) | 0 (0.0%) |
| Community & Social Service | 0 (0.0%) | 0 (0.0%) |
| Education, Arts & Media | 0 (0.0%) | 0 (0.0%) |
| Legal Services & Support | 0 (0.0%) | 0 (0.0%) |
| Education Instruction & Library | 0 (0.0%) | 0 (0.0%) |
| Arts, Media & Entertainment | 0 (0.0%) | 0 (0.0%) |
| Health Diagnosing & Treating | 0 (0.0%) | 0 (0.0%) |
| Health Technologists | 0 (0.0%) | 0 (0.0%) |
| Total (Category) | 9 (100.0%) | 0 (0.0%) |
| Total (Overall) | 12 (66.7%) | 6 (33.3%) |
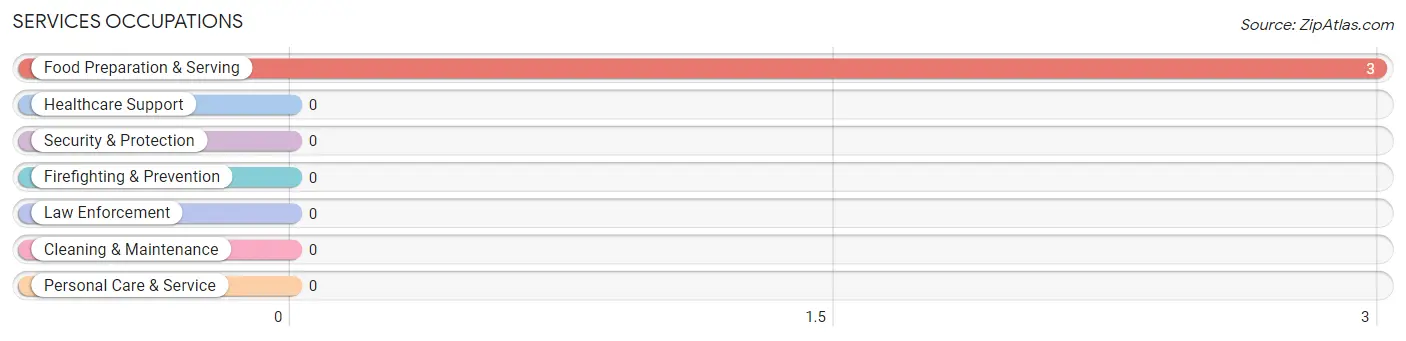
Services Occupations
The most common Services occupations in Preston are , and Food Preparation & Serving (3 | 16.7%).
Services Occupations by Sex
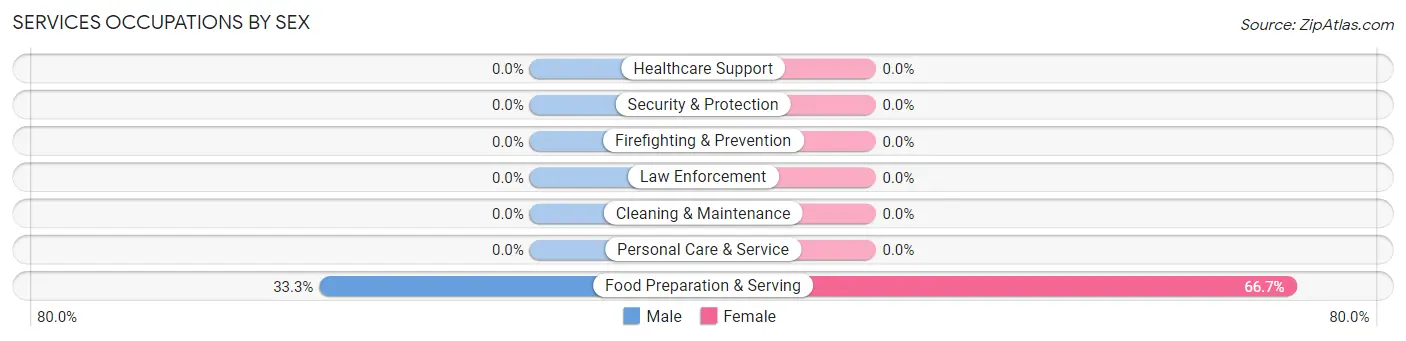
| Occupation | Male | Female |
| Healthcare Support | 0 (0.0%) | 0 (0.0%) |
| Security & Protection | 0 (0.0%) | 0 (0.0%) |
| Firefighting & Prevention | 0 (0.0%) | 0 (0.0%) |
| Law Enforcement | 0 (0.0%) | 0 (0.0%) |
| Food Preparation & Serving | 1 (33.3%) | 2 (66.7%) |
| Cleaning & Maintenance | 0 (0.0%) | 0 (0.0%) |
| Personal Care & Service | 0 (0.0%) | 0 (0.0%) |
| Total (Category) | 1 (33.3%) | 2 (66.7%) |
| Total (Overall) | 12 (66.7%) | 6 (33.3%) |
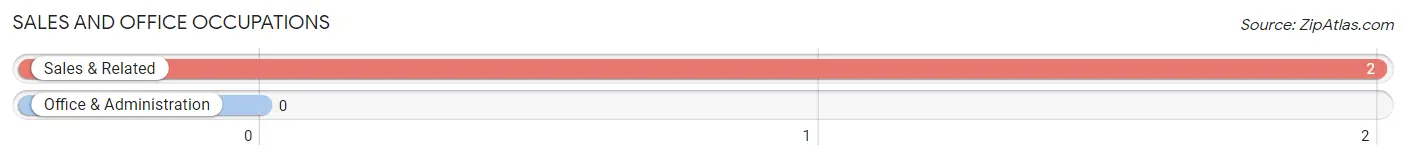
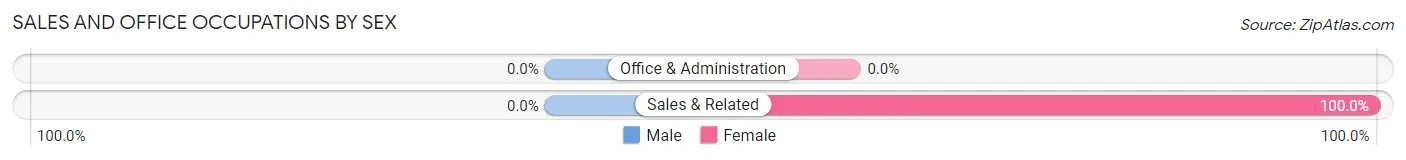
Sales and Office Occupations
The most common Sales and Office occupations in Preston are , and Sales & Related (2 | 11.1%).
Sales and Office Occupations by Sex
| Occupation | Male | Female |
| Sales & Related | 0 (0.0%) | 2 (100.0%) |
| Office & Administration | 0 (0.0%) | 0 (0.0%) |
| Total (Category) | 0 (0.0%) | 2 (100.0%) |
| Total (Overall) | 12 (66.7%) | 6 (33.3%) |
Natural Resources, Construction and Maintenance Occupations
The most common Natural Resources, Construction and Maintenance occupations in Preston are , and Installation, Maintenance & Repair (2 | 11.1%).
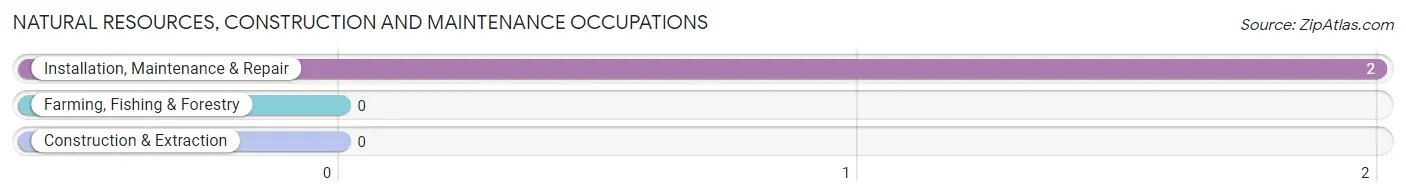
Natural Resources, Construction and Maintenance Occupations by Sex
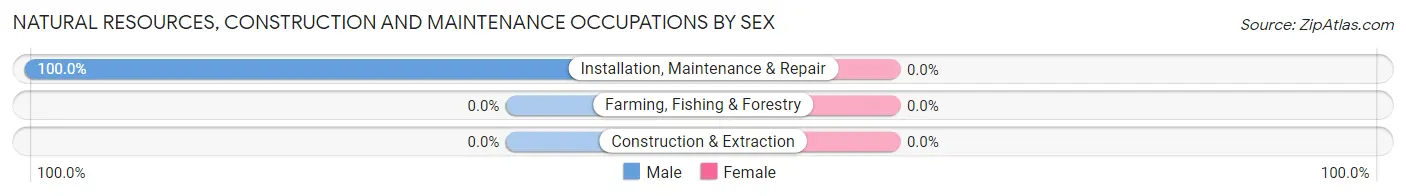
| Occupation | Male | Female |
| Farming, Fishing & Forestry | 0 (0.0%) | 0 (0.0%) |
| Construction & Extraction | 0 (0.0%) | 0 (0.0%) |
| Installation, Maintenance & Repair | 2 (100.0%) | 0 (0.0%) |
| Total (Category) | 2 (100.0%) | 0 (0.0%) |
| Total (Overall) | 12 (66.7%) | 6 (33.3%) |
Production, Transportation and Moving Occupations
The most common Production, Transportation and Moving occupations in Preston are , and Transportation (2 | 11.1%).
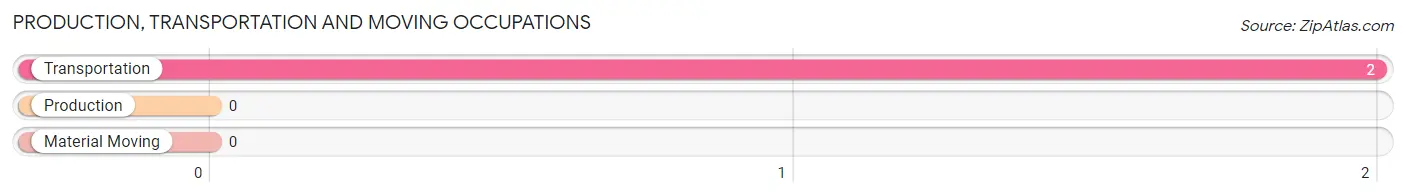
Production, Transportation and Moving Occupations by Sex
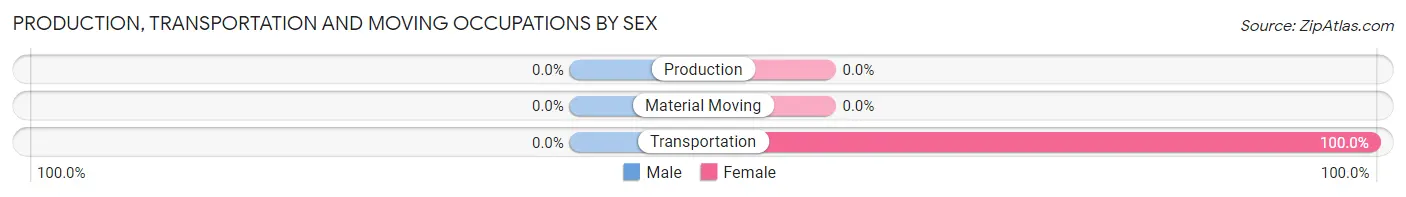
| Occupation | Male | Female |
| Production | 0 (0.0%) | 0 (0.0%) |
| Transportation | 0 (0.0%) | 2 (100.0%) |
| Material Moving | 0 (0.0%) | 0 (0.0%) |
| Total (Category) | 0 (0.0%) | 2 (100.0%) |
| Total (Overall) | 12 (66.7%) | 6 (33.3%) |
Employment Industries by Sex in Preston
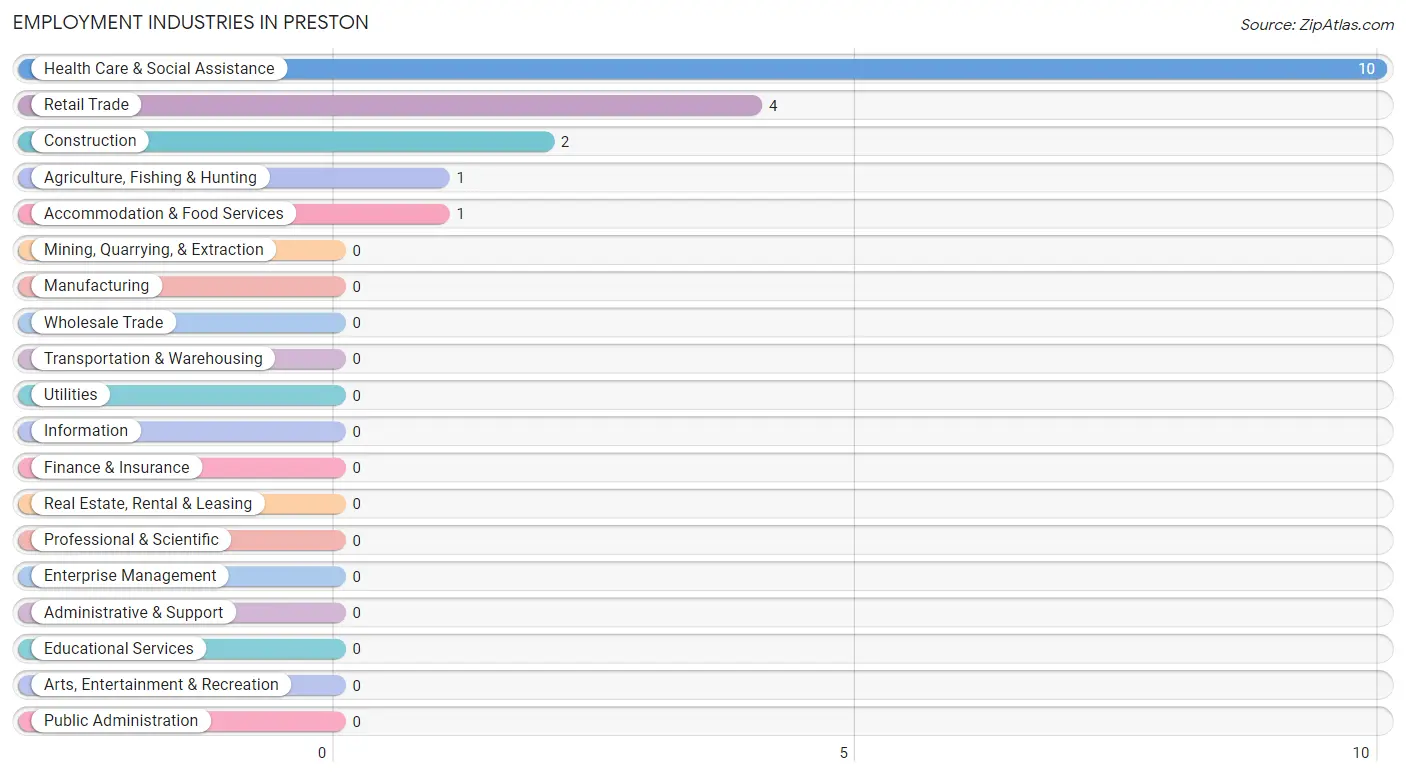
Employment Industries in Preston
The major employment industries in Preston include Health Care & Social Assistance (10 | 55.6%), Retail Trade (4 | 22.2%), Construction (2 | 11.1%), Agriculture, Fishing & Hunting (1 | 5.6%), and Accommodation & Food Services (1 | 5.6%).
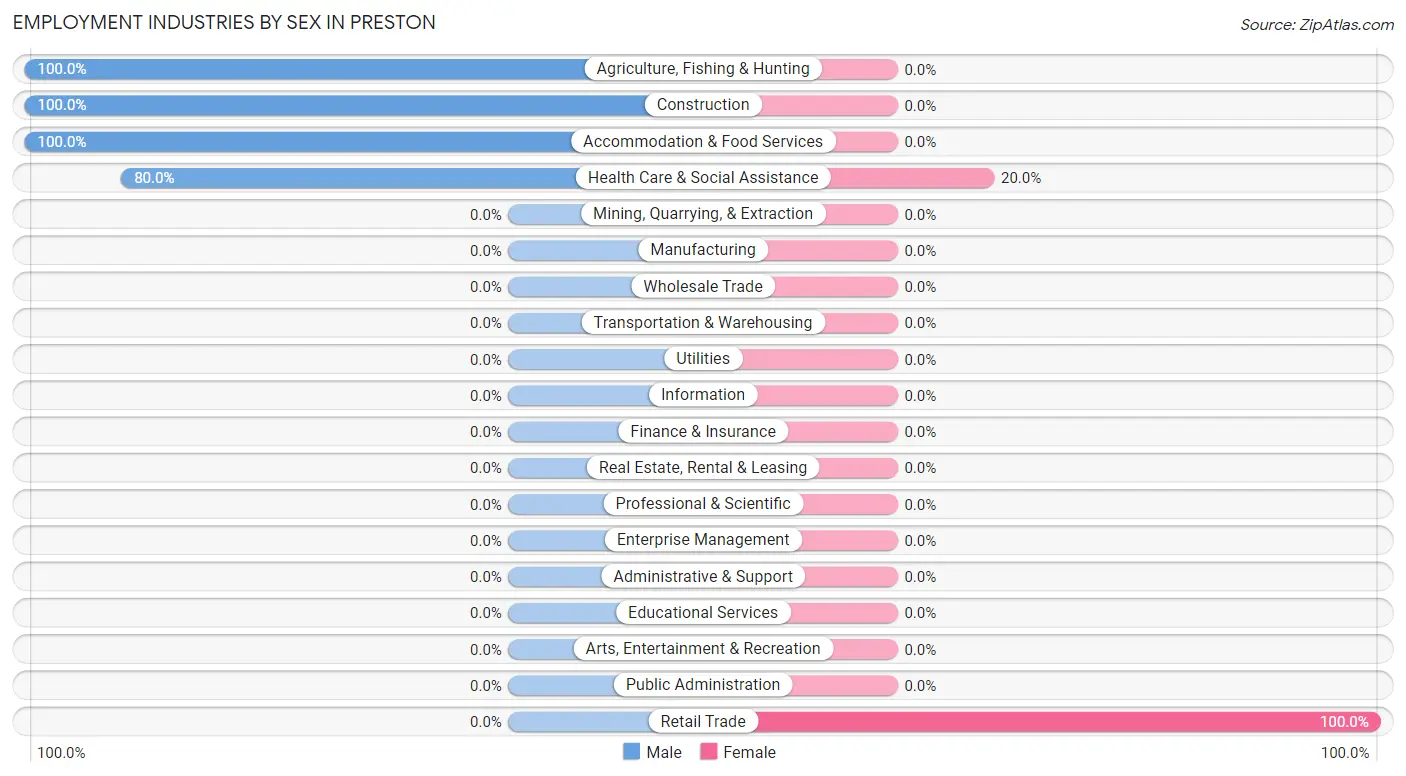
Employment Industries by Sex in Preston
The Preston industries that see more men than women are Agriculture, Fishing & Hunting (100.0%), Construction (100.0%), and Accommodation & Food Services (100.0%), whereas the industries that tend to have a higher number of women are Retail Trade (100.0%), and Health Care & Social Assistance (20.0%).
| Industry | Male | Female |
| Agriculture, Fishing & Hunting | 1 (100.0%) | 0 (0.0%) |
| Mining, Quarrying, & Extraction | 0 (0.0%) | 0 (0.0%) |
| Construction | 2 (100.0%) | 0 (0.0%) |
| Manufacturing | 0 (0.0%) | 0 (0.0%) |
| Wholesale Trade | 0 (0.0%) | 0 (0.0%) |
| Retail Trade | 0 (0.0%) | 4 (100.0%) |
| Transportation & Warehousing | 0 (0.0%) | 0 (0.0%) |
| Utilities | 0 (0.0%) | 0 (0.0%) |
| Information | 0 (0.0%) | 0 (0.0%) |
| Finance & Insurance | 0 (0.0%) | 0 (0.0%) |
| Real Estate, Rental & Leasing | 0 (0.0%) | 0 (0.0%) |
| Professional & Scientific | 0 (0.0%) | 0 (0.0%) |
| Enterprise Management | 0 (0.0%) | 0 (0.0%) |
| Administrative & Support | 0 (0.0%) | 0 (0.0%) |
| Educational Services | 0 (0.0%) | 0 (0.0%) |
| Health Care & Social Assistance | 8 (80.0%) | 2 (20.0%) |
| Arts, Entertainment & Recreation | 0 (0.0%) | 0 (0.0%) |
| Accommodation & Food Services | 1 (100.0%) | 0 (0.0%) |
| Public Administration | 0 (0.0%) | 0 (0.0%) |
| Total | 12 (66.7%) | 6 (33.3%) |
Education in Preston
School Enrollment in Preston
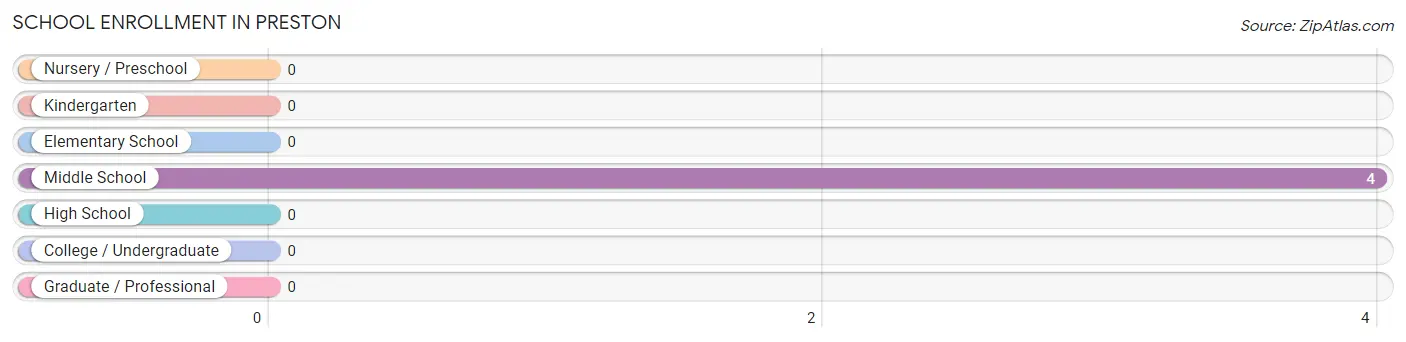
| School Level | # Students | % Students |
| Nursery / Preschool | 0 | 0.0% |
| Kindergarten | 0 | 0.0% |
| Elementary School | 0 | 0.0% |
| Middle School | 4 | 100.0% |
| High School | 0 | 0.0% |
| College / Undergraduate | 0 | 0.0% |
| Graduate / Professional | 0 | 0.0% |
| Total | 4 | 100.0% |
School Enrollment by Age by Funding Source in Preston
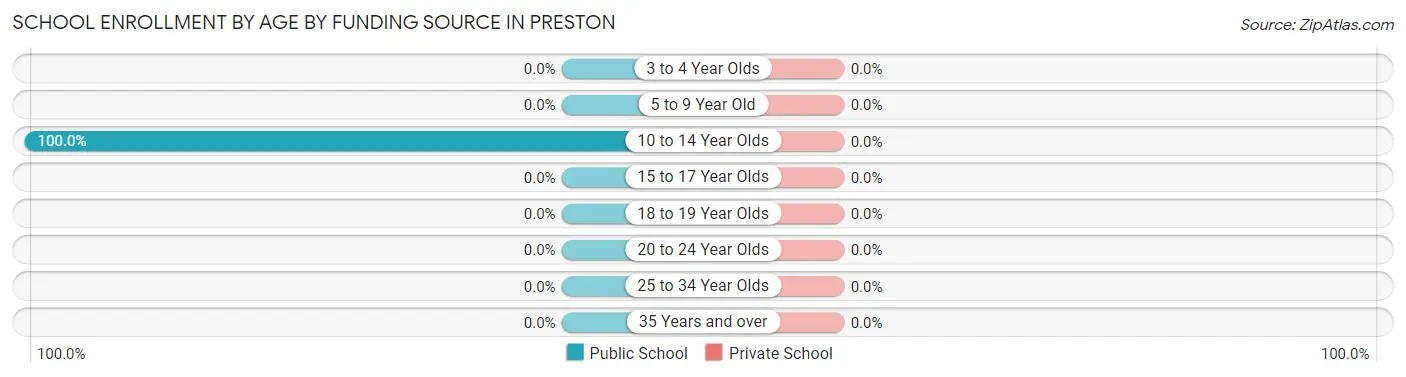
| Age Bracket | Public School | Private School |
| 3 to 4 Year Olds | 0 (0.0%) | 0 (0.0%) |
| 5 to 9 Year Old | 0 (0.0%) | 0 (0.0%) |
| 10 to 14 Year Olds | 4 (100.0%) | 0 (0.0%) |
| 15 to 17 Year Olds | 0 (0.0%) | 0 (0.0%) |
| 18 to 19 Year Olds | 0 (0.0%) | 0 (0.0%) |
| 20 to 24 Year Olds | 0 (0.0%) | 0 (0.0%) |
| 25 to 34 Year Olds | 0 (0.0%) | 0 (0.0%) |
| 35 Years and over | 0 (0.0%) | 0 (0.0%) |
| Total | 4 (100.0%) | 0 (0.0%) |
Educational Attainment by Field of Study in Preston
, and psychology (4 | 100.0%) are the most common fields of study among 4 individuals in Preston who have obtained a bachelor's degree or higher.
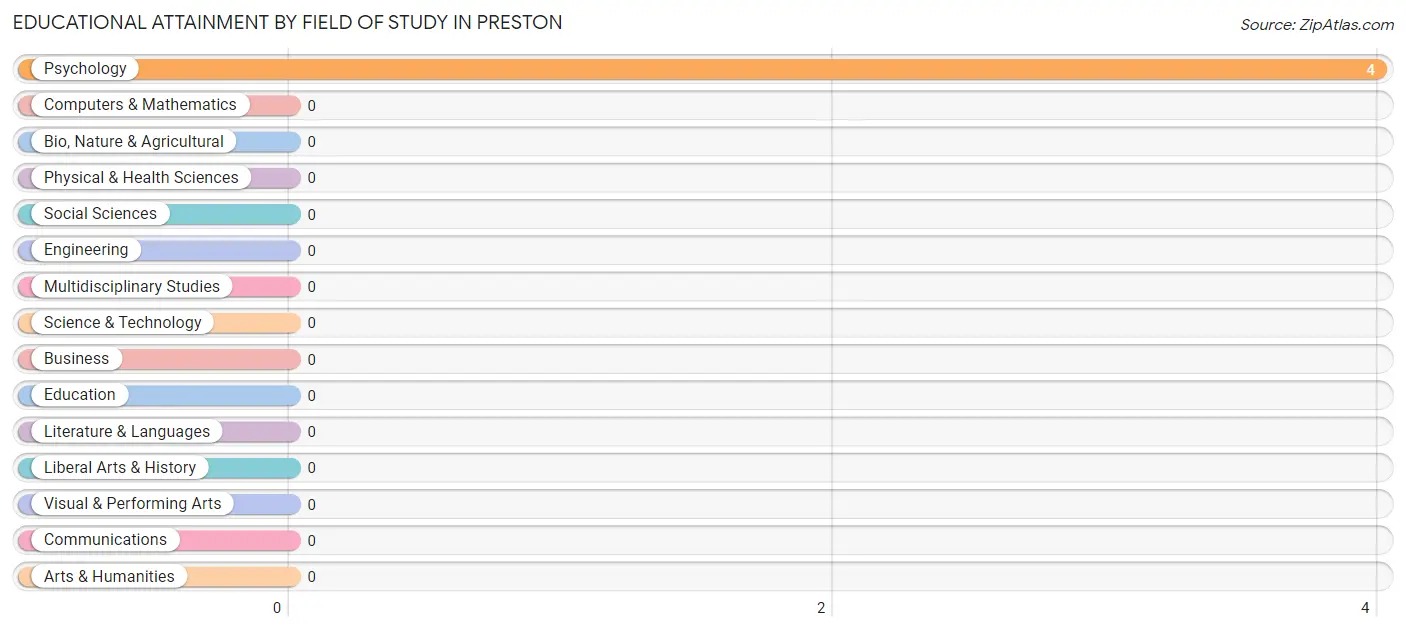
| Field of Study | # Graduates | % Graduates |
| Computers & Mathematics | 0 | 0.0% |
| Bio, Nature & Agricultural | 0 | 0.0% |
| Physical & Health Sciences | 0 | 0.0% |
| Psychology | 4 | 100.0% |
| Social Sciences | 0 | 0.0% |
| Engineering | 0 | 0.0% |
| Multidisciplinary Studies | 0 | 0.0% |
| Science & Technology | 0 | 0.0% |
| Business | 0 | 0.0% |
| Education | 0 | 0.0% |
| Literature & Languages | 0 | 0.0% |
| Liberal Arts & History | 0 | 0.0% |
| Visual & Performing Arts | 0 | 0.0% |
| Communications | 0 | 0.0% |
| Arts & Humanities | 0 | 0.0% |
| Total | 4 | 100.0% |
Transportation & Commute in Preston
Vehicle Availability by Sex in Preston
The most prevalent vehicle ownership categories in Preston are males with 2 vehicles (10, accounting for 83.3%) and females with 2 vehicles (2, making up 166.7%).
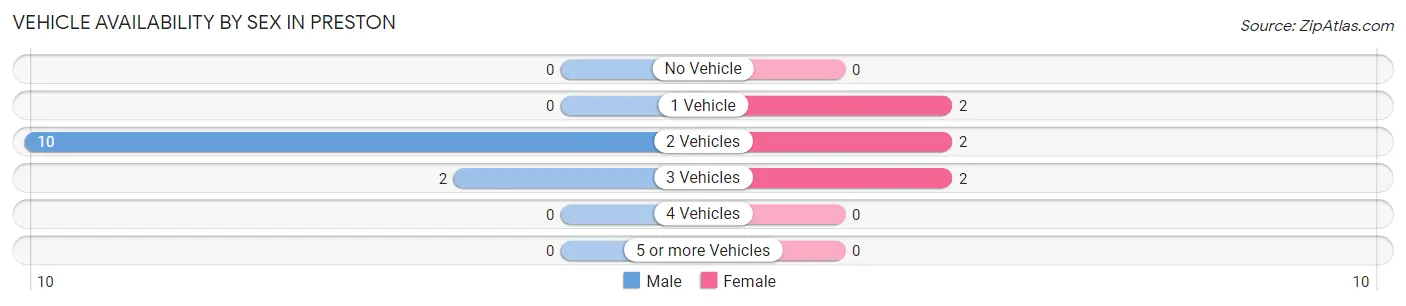
| Vehicles Available | Male | Female |
| No Vehicle | 0 (0.0%) | 0 (0.0%) |
| 1 Vehicle | 0 (0.0%) | 2 (33.3%) |
| 2 Vehicles | 10 (83.3%) | 2 (33.3%) |
| 3 Vehicles | 2 (16.7%) | 2 (33.3%) |
| 4 Vehicles | 0 (0.0%) | 0 (0.0%) |
| 5 or more Vehicles | 0 (0.0%) | 0 (0.0%) |
| Total | 12 (100.0%) | 6 (100.0%) |
Commute Time in Preston
The most frequently occuring commute durations in Preston are 10 to 14 minutes (12 commuters, 70.6%), 15 to 19 minutes (2 commuters, 11.8%), and 20 to 24 minutes (2 commuters, 11.8%).
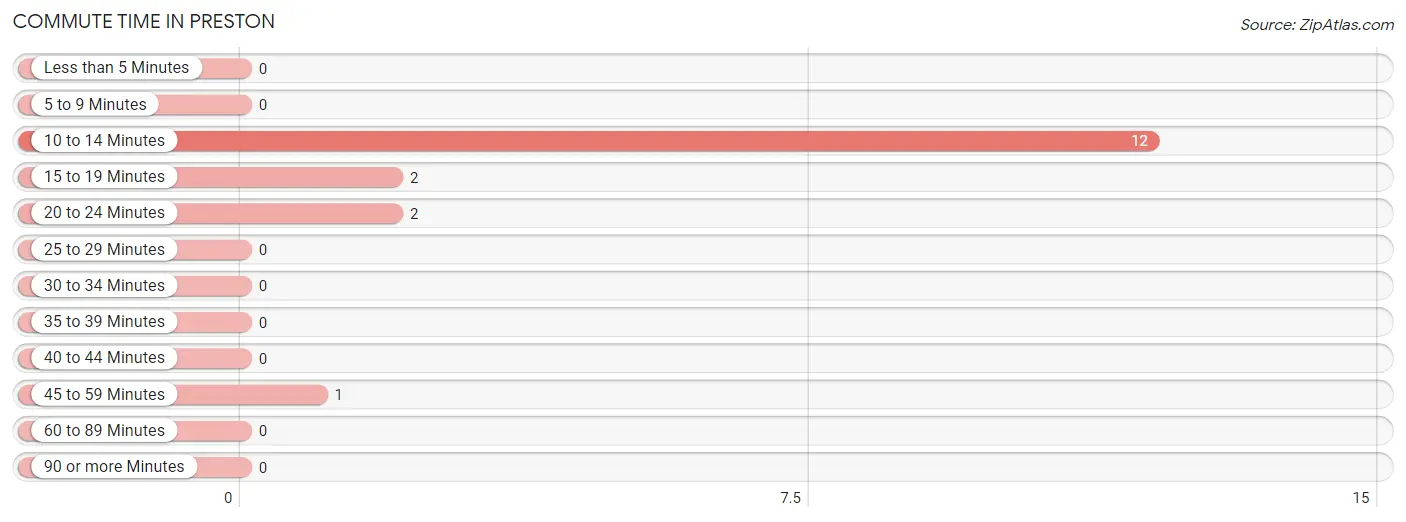
| Commute Time | # Commuters | % Commuters |
| Less than 5 Minutes | 0 | 0.0% |
| 5 to 9 Minutes | 0 | 0.0% |
| 10 to 14 Minutes | 12 | 70.6% |
| 15 to 19 Minutes | 2 | 11.8% |
| 20 to 24 Minutes | 2 | 11.8% |
| 25 to 29 Minutes | 0 | 0.0% |
| 30 to 34 Minutes | 0 | 0.0% |
| 35 to 39 Minutes | 0 | 0.0% |
| 40 to 44 Minutes | 0 | 0.0% |
| 45 to 59 Minutes | 1 | 5.9% |
| 60 to 89 Minutes | 0 | 0.0% |
| 90 or more Minutes | 0 | 0.0% |
Commute Time by Sex in Preston
The most common commute times in Preston are 10 to 14 minutes (10 commuters, 90.9%) for males and 10 to 14 minutes (2 commuters, 33.3%) for females.
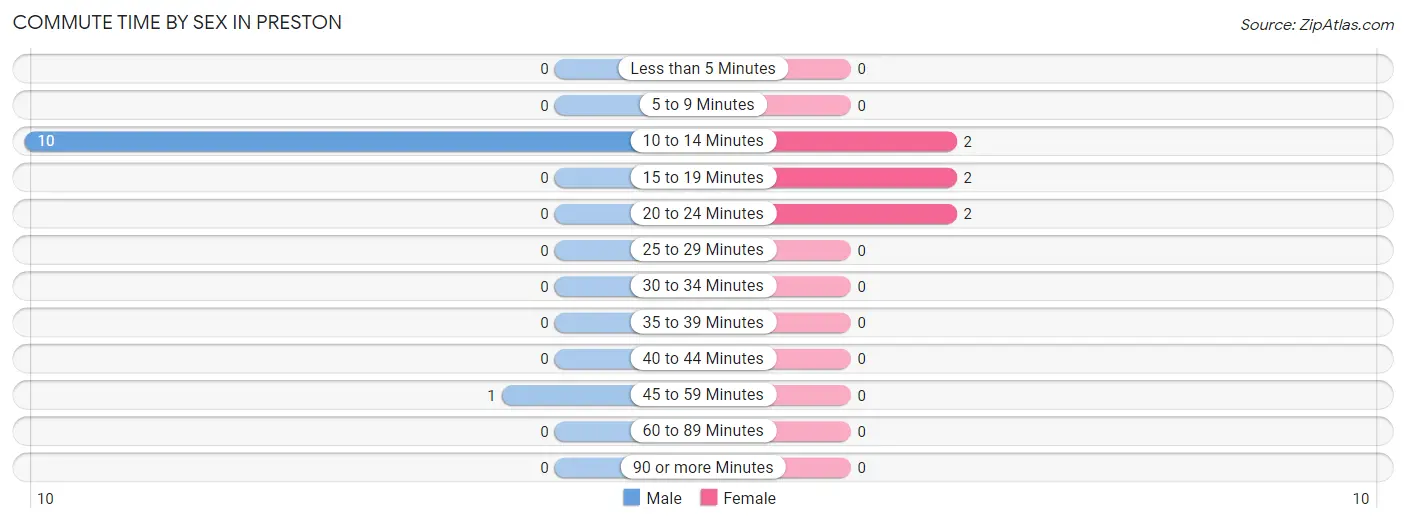
| Commute Time | Male | Female |
| Less than 5 Minutes | 0 (0.0%) | 0 (0.0%) |
| 5 to 9 Minutes | 0 (0.0%) | 0 (0.0%) |
| 10 to 14 Minutes | 10 (90.9%) | 2 (33.3%) |
| 15 to 19 Minutes | 0 (0.0%) | 2 (33.3%) |
| 20 to 24 Minutes | 0 (0.0%) | 2 (33.3%) |
| 25 to 29 Minutes | 0 (0.0%) | 0 (0.0%) |
| 30 to 34 Minutes | 0 (0.0%) | 0 (0.0%) |
| 35 to 39 Minutes | 0 (0.0%) | 0 (0.0%) |
| 40 to 44 Minutes | 0 (0.0%) | 0 (0.0%) |
| 45 to 59 Minutes | 1 (9.1%) | 0 (0.0%) |
| 60 to 89 Minutes | 0 (0.0%) | 0 (0.0%) |
| 90 or more Minutes | 0 (0.0%) | 0 (0.0%) |
Time of Departure to Work by Sex in Preston
The most frequent times of departure to work in Preston are 7:30 AM to 7:59 AM (10, 90.9%) for males and 6:30 AM to 6:59 AM (2, 33.3%) for females.
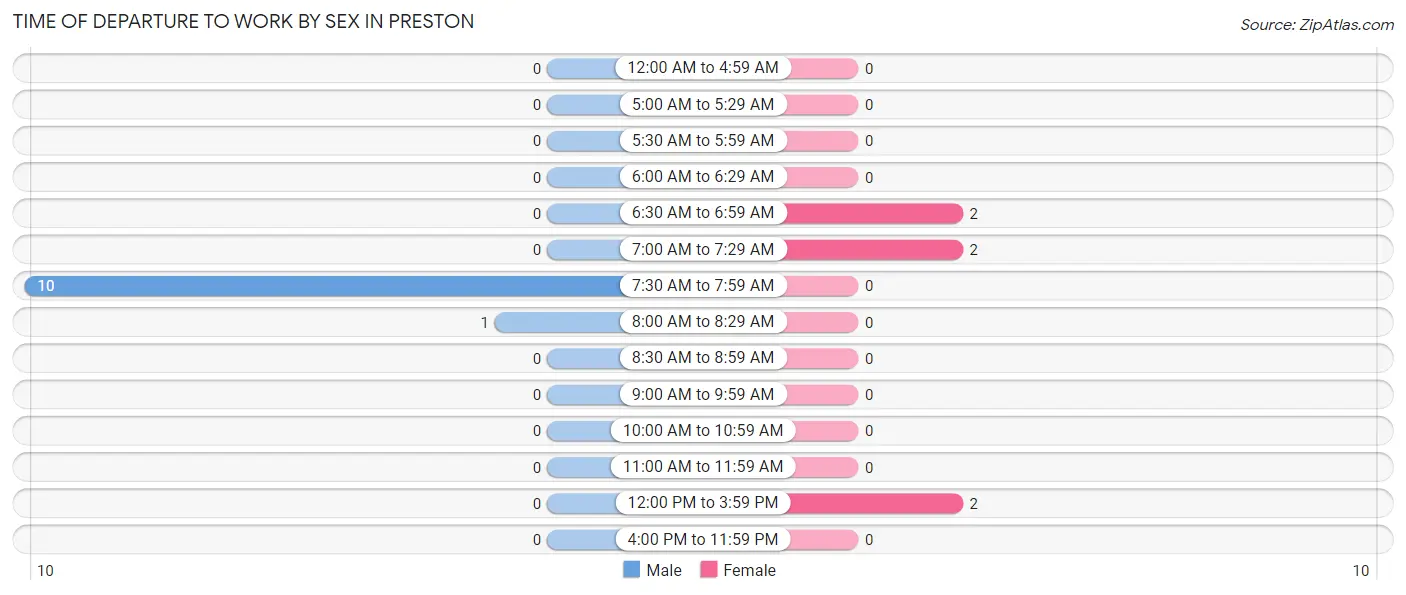
| Time of Departure | Male | Female |
| 12:00 AM to 4:59 AM | 0 (0.0%) | 0 (0.0%) |
| 5:00 AM to 5:29 AM | 0 (0.0%) | 0 (0.0%) |
| 5:30 AM to 5:59 AM | 0 (0.0%) | 0 (0.0%) |
| 6:00 AM to 6:29 AM | 0 (0.0%) | 0 (0.0%) |
| 6:30 AM to 6:59 AM | 0 (0.0%) | 2 (33.3%) |
| 7:00 AM to 7:29 AM | 0 (0.0%) | 2 (33.3%) |
| 7:30 AM to 7:59 AM | 10 (90.9%) | 0 (0.0%) |
| 8:00 AM to 8:29 AM | 1 (9.1%) | 0 (0.0%) |
| 8:30 AM to 8:59 AM | 0 (0.0%) | 0 (0.0%) |
| 9:00 AM to 9:59 AM | 0 (0.0%) | 0 (0.0%) |
| 10:00 AM to 10:59 AM | 0 (0.0%) | 0 (0.0%) |
| 11:00 AM to 11:59 AM | 0 (0.0%) | 0 (0.0%) |
| 12:00 PM to 3:59 PM | 0 (0.0%) | 2 (33.3%) |
| 4:00 PM to 11:59 PM | 0 (0.0%) | 0 (0.0%) |
| Total | 11 (100.0%) | 6 (100.0%) |
Housing Occupancy in Preston
Occupancy by Ownership in Preston
Of the total 22 dwellings in Preston, owner-occupied units account for 20 (90.9%), while renter-occupied units make up 2 (9.1%).
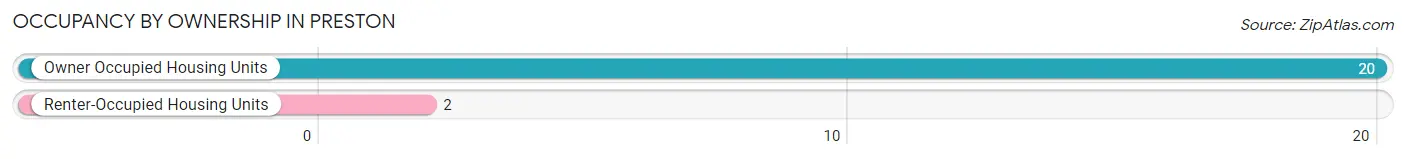
| Occupancy | # Housing Units | % Housing Units |
| Owner Occupied Housing Units | 20 | 90.9% |
| Renter-Occupied Housing Units | 2 | 9.1% |
| Total Occupied Housing Units | 22 | 100.0% |
Occupancy by Household Size in Preston
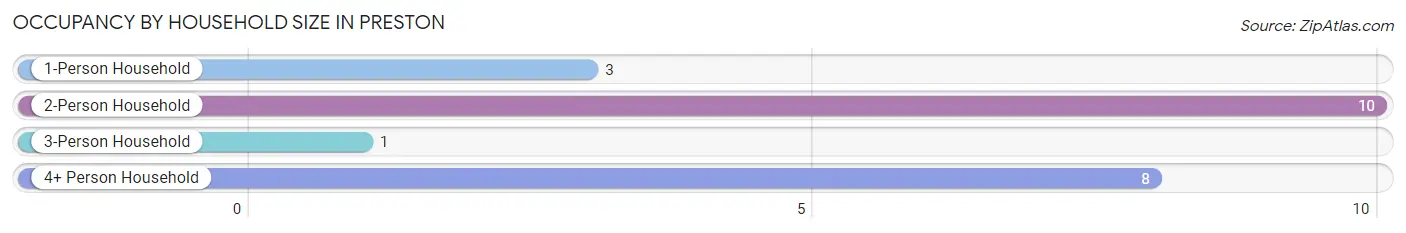
| Household Size | # Housing Units | % Housing Units |
| 1-Person Household | 3 | 13.6% |
| 2-Person Household | 10 | 45.5% |
| 3-Person Household | 1 | 4.5% |
| 4+ Person Household | 8 | 36.4% |
| Total Housing Units | 22 | 100.0% |
Occupancy by Ownership by Household Size in Preston
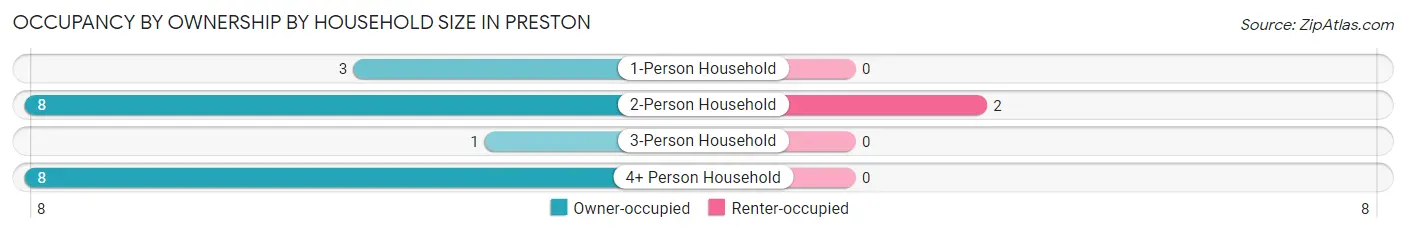
| Household Size | Owner-occupied | Renter-occupied |
| 1-Person Household | 3 (100.0%) | 0 (0.0%) |
| 2-Person Household | 8 (80.0%) | 2 (20.0%) |
| 3-Person Household | 1 (100.0%) | 0 (0.0%) |
| 4+ Person Household | 8 (100.0%) | 0 (0.0%) |
| Total Housing Units | 20 (90.9%) | 2 (9.1%) |
Occupancy by Educational Attainment in Preston
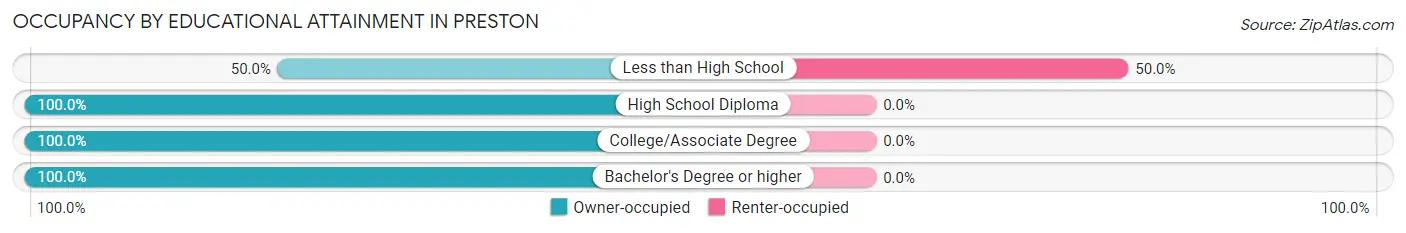
| Household Size | Owner-occupied | Renter-occupied |
| Less than High School | 2 (50.0%) | 2 (50.0%) |
| High School Diploma | 4 (100.0%) | 0 (0.0%) |
| College/Associate Degree | 10 (100.0%) | 0 (0.0%) |
| Bachelor's Degree or higher | 4 (100.0%) | 0 (0.0%) |
Occupancy by Age of Householder in Preston
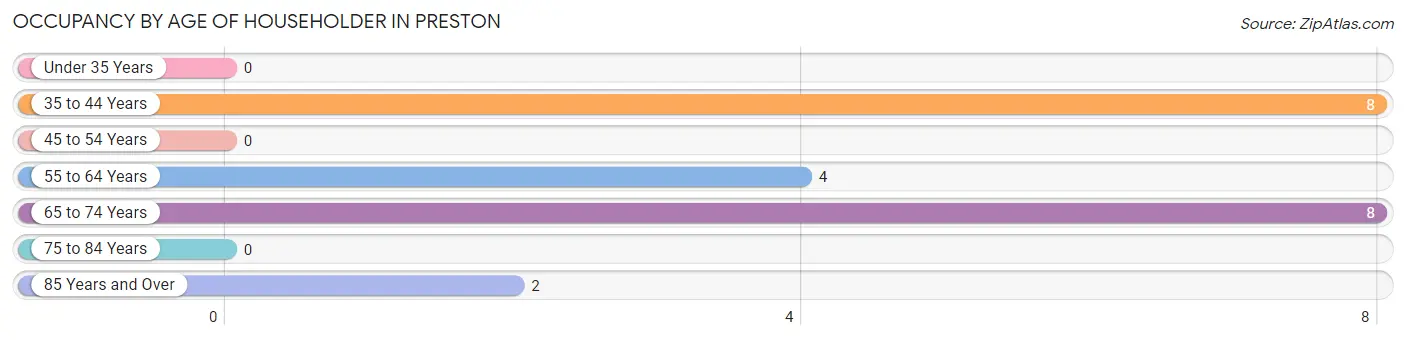
| Age Bracket | # Households | % Households |
| Under 35 Years | 0 | 0.0% |
| 35 to 44 Years | 8 | 36.4% |
| 45 to 54 Years | 0 | 0.0% |
| 55 to 64 Years | 4 | 18.2% |
| 65 to 74 Years | 8 | 36.4% |
| 75 to 84 Years | 0 | 0.0% |
| 85 Years and Over | 2 | 9.1% |
| Total | 22 | 100.0% |
Housing Finances in Preston
Median Income by Occupancy in Preston
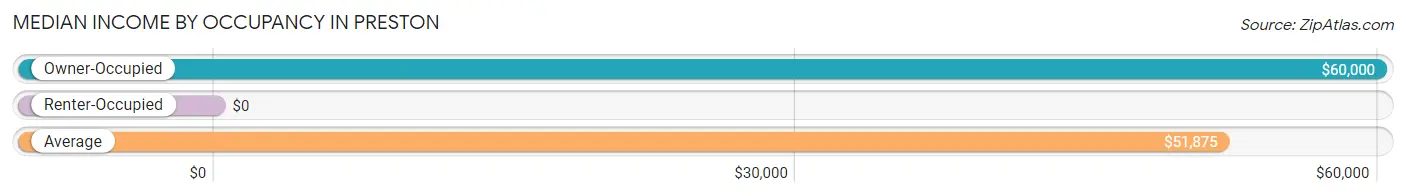
| Occupancy Type | # Households | Median Income |
| Owner-Occupied | 20 (90.9%) | $60,000 |
| Renter-Occupied | 2 (9.1%) | $0 |
| Average | 22 (100.0%) | $51,875 |
Occupancy by Householder Income Bracket in Preston
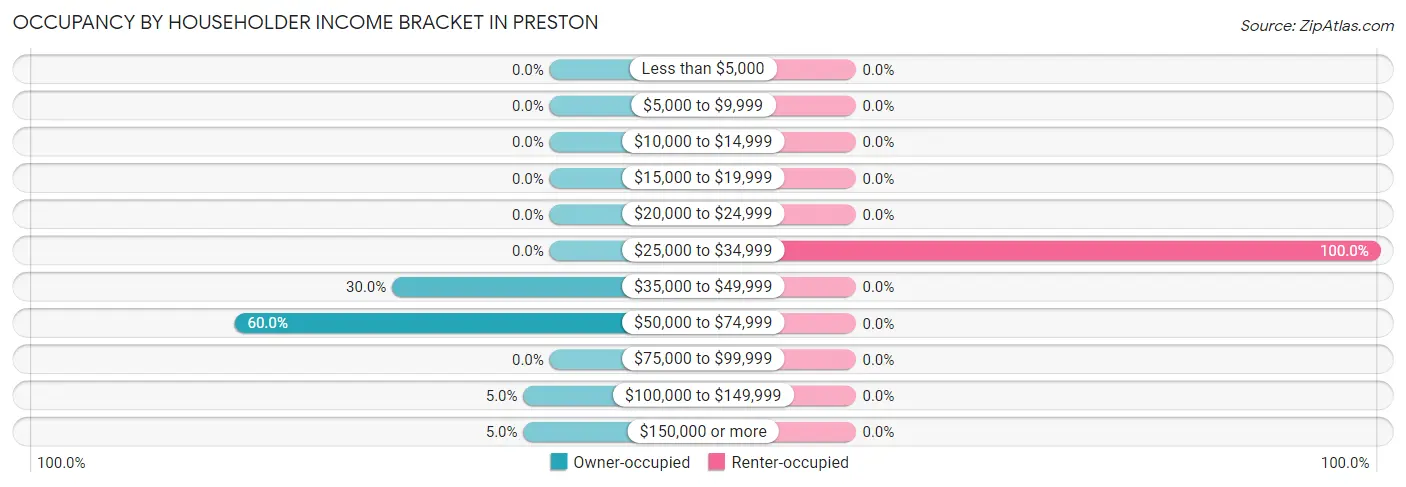
| Income Bracket | Owner-occupied | Renter-occupied |
| Less than $5,000 | 0 (0.0%) | 0 (0.0%) |
| $5,000 to $9,999 | 0 (0.0%) | 0 (0.0%) |
| $10,000 to $14,999 | 0 (0.0%) | 0 (0.0%) |
| $15,000 to $19,999 | 0 (0.0%) | 0 (0.0%) |
| $20,000 to $24,999 | 0 (0.0%) | 0 (0.0%) |
| $25,000 to $34,999 | 0 (0.0%) | 2 (100.0%) |
| $35,000 to $49,999 | 6 (30.0%) | 0 (0.0%) |
| $50,000 to $74,999 | 12 (60.0%) | 0 (0.0%) |
| $75,000 to $99,999 | 0 (0.0%) | 0 (0.0%) |
| $100,000 to $149,999 | 1 (5.0%) | 0 (0.0%) |
| $150,000 or more | 1 (5.0%) | 0 (0.0%) |
| Total | 20 (100.0%) | 2 (100.0%) |
Monthly Housing Cost Tiers in Preston
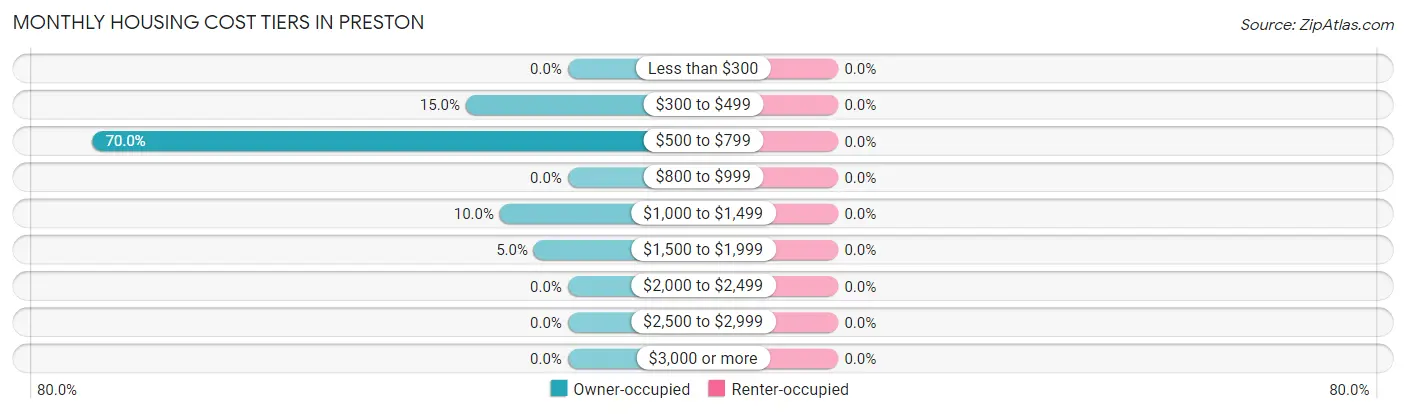
| Monthly Cost | Owner-occupied | Renter-occupied |
| Less than $300 | 0 (0.0%) | 0 (0.0%) |
| $300 to $499 | 3 (15.0%) | 0 (0.0%) |
| $500 to $799 | 14 (70.0%) | 0 (0.0%) |
| $800 to $999 | 0 (0.0%) | 0 (0.0%) |
| $1,000 to $1,499 | 2 (10.0%) | 0 (0.0%) |
| $1,500 to $1,999 | 1 (5.0%) | 0 (0.0%) |
| $2,000 to $2,499 | 0 (0.0%) | 0 (0.0%) |
| $2,500 to $2,999 | 0 (0.0%) | 0 (0.0%) |
| $3,000 or more | 0 (0.0%) | 0 (0.0%) |
| Total | 20 (100.0%) | 2 (100.0%) |
Physical Housing Characteristics in Preston
Housing Structures in Preston
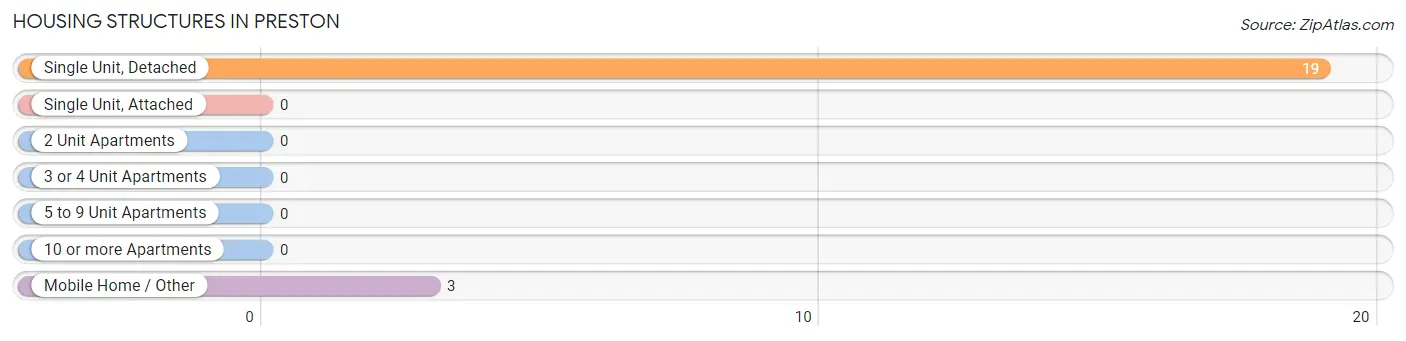
| Structure Type | # Housing Units | % Housing Units |
| Single Unit, Detached | 19 | 86.4% |
| Single Unit, Attached | 0 | 0.0% |
| 2 Unit Apartments | 0 | 0.0% |
| 3 or 4 Unit Apartments | 0 | 0.0% |
| 5 to 9 Unit Apartments | 0 | 0.0% |
| 10 or more Apartments | 0 | 0.0% |
| Mobile Home / Other | 3 | 13.6% |
| Total | 22 | 100.0% |
Housing Structures by Occupancy in Preston
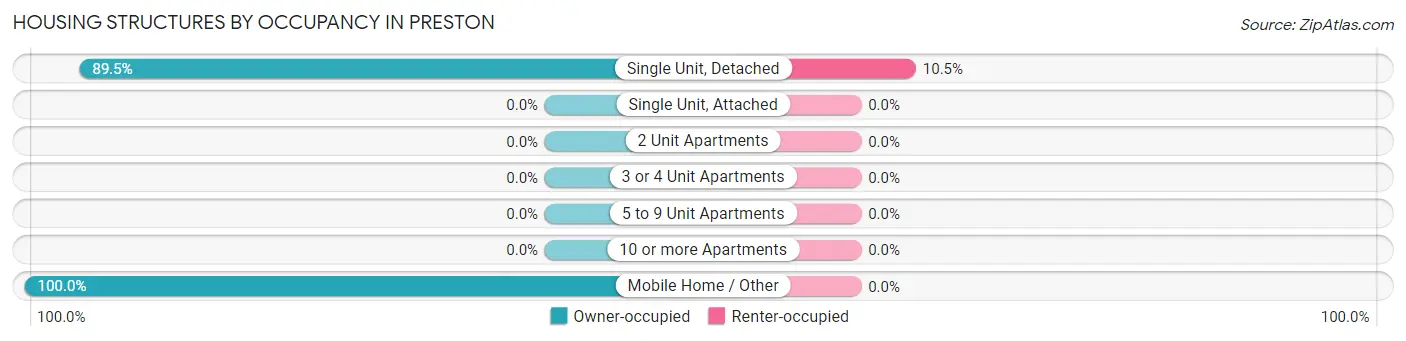
| Structure Type | Owner-occupied | Renter-occupied |
| Single Unit, Detached | 17 (89.5%) | 2 (10.5%) |
| Single Unit, Attached | 0 (0.0%) | 0 (0.0%) |
| 2 Unit Apartments | 0 (0.0%) | 0 (0.0%) |
| 3 or 4 Unit Apartments | 0 (0.0%) | 0 (0.0%) |
| 5 to 9 Unit Apartments | 0 (0.0%) | 0 (0.0%) |
| 10 or more Apartments | 0 (0.0%) | 0 (0.0%) |
| Mobile Home / Other | 3 (100.0%) | 0 (0.0%) |
| Total | 20 (90.9%) | 2 (9.1%) |
Housing Structures by Number of Rooms in Preston
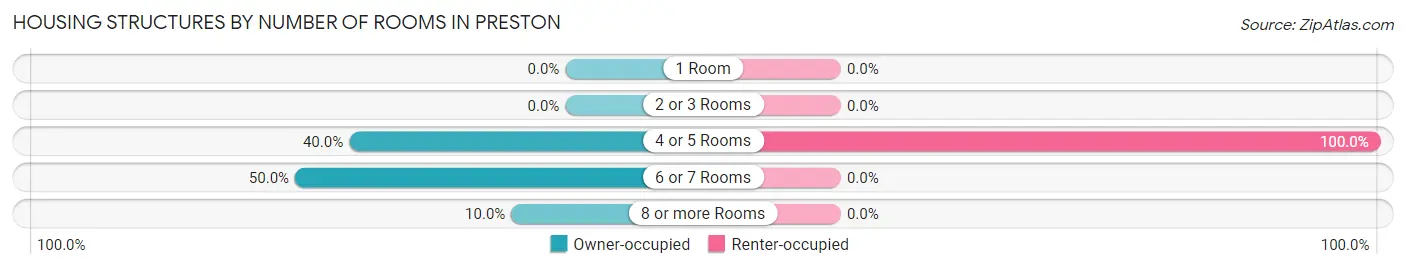
| Number of Rooms | Owner-occupied | Renter-occupied |
| 1 Room | 0 (0.0%) | 0 (0.0%) |
| 2 or 3 Rooms | 0 (0.0%) | 0 (0.0%) |
| 4 or 5 Rooms | 8 (40.0%) | 2 (100.0%) |
| 6 or 7 Rooms | 10 (50.0%) | 0 (0.0%) |
| 8 or more Rooms | 2 (10.0%) | 0 (0.0%) |
| Total | 20 (100.0%) | 2 (100.0%) |
Housing Structure by Heating Type in Preston
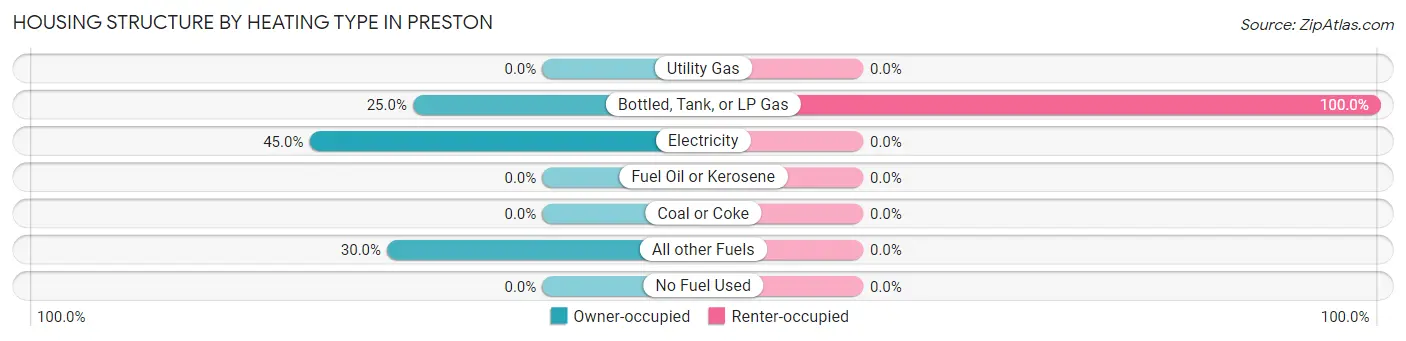
| Heating Type | Owner-occupied | Renter-occupied |
| Utility Gas | 0 (0.0%) | 0 (0.0%) |
| Bottled, Tank, or LP Gas | 5 (25.0%) | 2 (100.0%) |
| Electricity | 9 (45.0%) | 0 (0.0%) |
| Fuel Oil or Kerosene | 0 (0.0%) | 0 (0.0%) |
| Coal or Coke | 0 (0.0%) | 0 (0.0%) |
| All other Fuels | 6 (30.0%) | 0 (0.0%) |
| No Fuel Used | 0 (0.0%) | 0 (0.0%) |
| Total | 20 (100.0%) | 2 (100.0%) |
Household Vehicle Usage in Preston
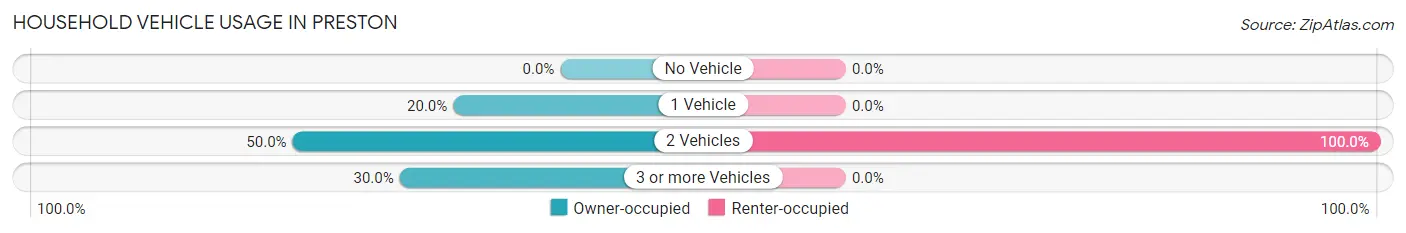
| Vehicles per Household | Owner-occupied | Renter-occupied |
| No Vehicle | 0 (0.0%) | 0 (0.0%) |
| 1 Vehicle | 4 (20.0%) | 0 (0.0%) |
| 2 Vehicles | 10 (50.0%) | 2 (100.0%) |
| 3 or more Vehicles | 6 (30.0%) | 0 (0.0%) |
| Total | 20 (100.0%) | 2 (100.0%) |
Real Estate & Mortgages in Preston
Real Estate and Mortgage Overview in Preston
| Characteristic | Without Mortgage | With Mortgage |
| Housing Units | 18 | 2 |
| Median Property Value | $46,400 | $0 |
| Median Household Income | $67,813 | $0 |
| Monthly Housing Costs | $550 | $0 |
| Real Estate Taxes | $1,250 | $0 |
Property Value by Mortgage Status in Preston
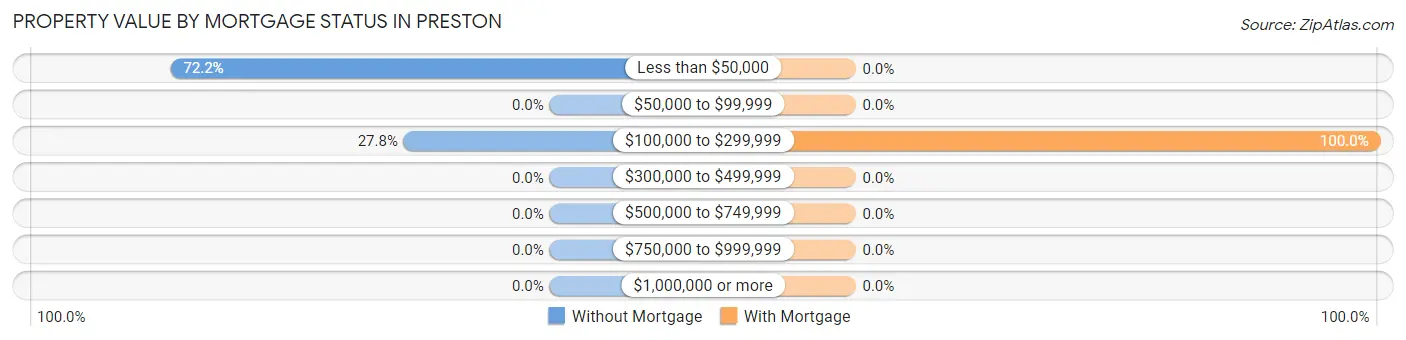
| Property Value | Without Mortgage | With Mortgage |
| Less than $50,000 | 13 (72.2%) | 0 (0.0%) |
| $50,000 to $99,999 | 0 (0.0%) | 0 (0.0%) |
| $100,000 to $299,999 | 5 (27.8%) | 2 (100.0%) |
| $300,000 to $499,999 | 0 (0.0%) | 0 (0.0%) |
| $500,000 to $749,999 | 0 (0.0%) | 0 (0.0%) |
| $750,000 to $999,999 | 0 (0.0%) | 0 (0.0%) |
| $1,000,000 or more | 0 (0.0%) | 0 (0.0%) |
| Total | 18 (100.0%) | 2 (100.0%) |
Household Income by Mortgage Status in Preston
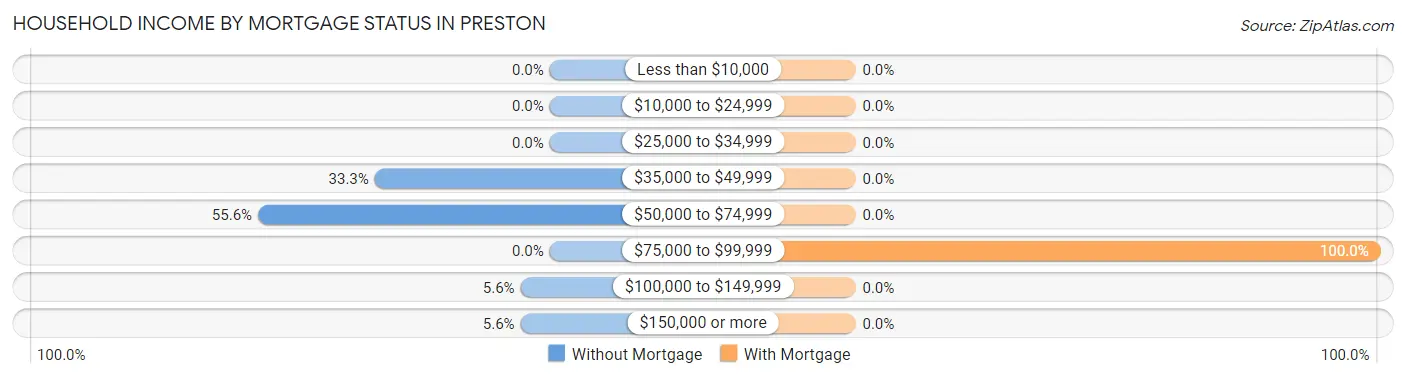
| Household Income | Without Mortgage | With Mortgage |
| Less than $10,000 | 0 (0.0%) | 0 (0.0%) |
| $10,000 to $24,999 | 0 (0.0%) | 0 (0.0%) |
| $25,000 to $34,999 | 0 (0.0%) | 0 (0.0%) |
| $35,000 to $49,999 | 6 (33.3%) | 0 (0.0%) |
| $50,000 to $74,999 | 10 (55.6%) | 0 (0.0%) |
| $75,000 to $99,999 | 0 (0.0%) | 2 (100.0%) |
| $100,000 to $149,999 | 1 (5.6%) | 0 (0.0%) |
| $150,000 or more | 1 (5.6%) | 0 (0.0%) |
| Total | 18 (100.0%) | 2 (100.0%) |
Property Value to Household Income Ratio in Preston
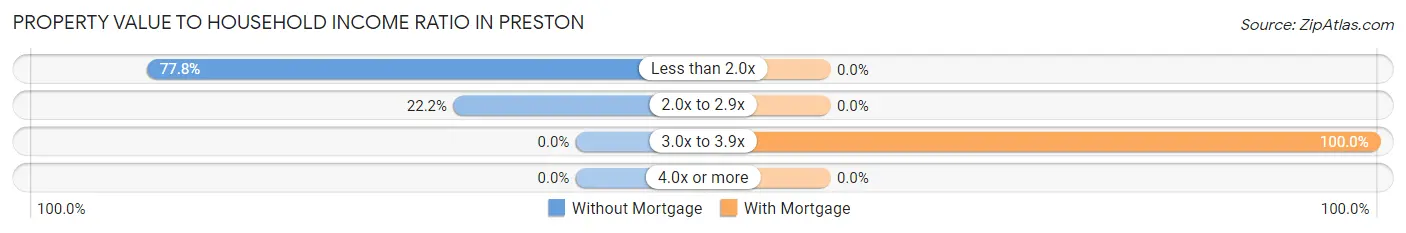
| Value-to-Income Ratio | Without Mortgage | With Mortgage |
| Less than 2.0x | 14 (77.8%) | 0 (0.0%) |
| 2.0x to 2.9x | 4 (22.2%) | 0 (0.0%) |
| 3.0x to 3.9x | 0 (0.0%) | 2 (100.0%) |
| 4.0x or more | 0 (0.0%) | 0 (0.0%) |
| Total | 18 (100.0%) | 2 (100.0%) |
Real Estate Taxes by Mortgage Status in Preston
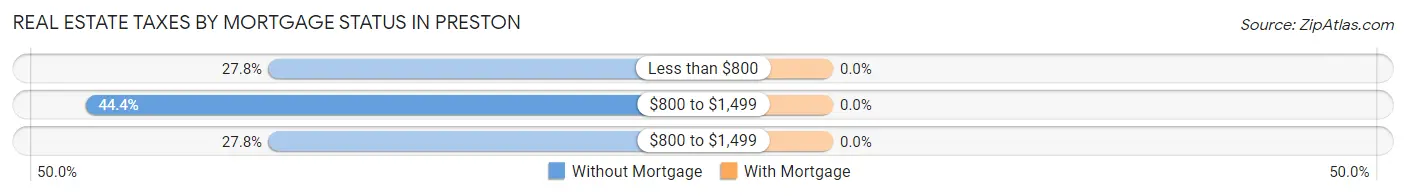
| Property Taxes | Without Mortgage | With Mortgage |
| Less than $800 | 5 (27.8%) | 0 (0.0%) |
| $800 to $1,499 | 8 (44.4%) | 0 (0.0%) |
| $800 to $1,499 | 5 (27.8%) | 0 (0.0%) |
| Total | 18 (100.0%) | 2 (100.0%) |
Health & Disability in Preston
Health Insurance Coverage by Age in Preston
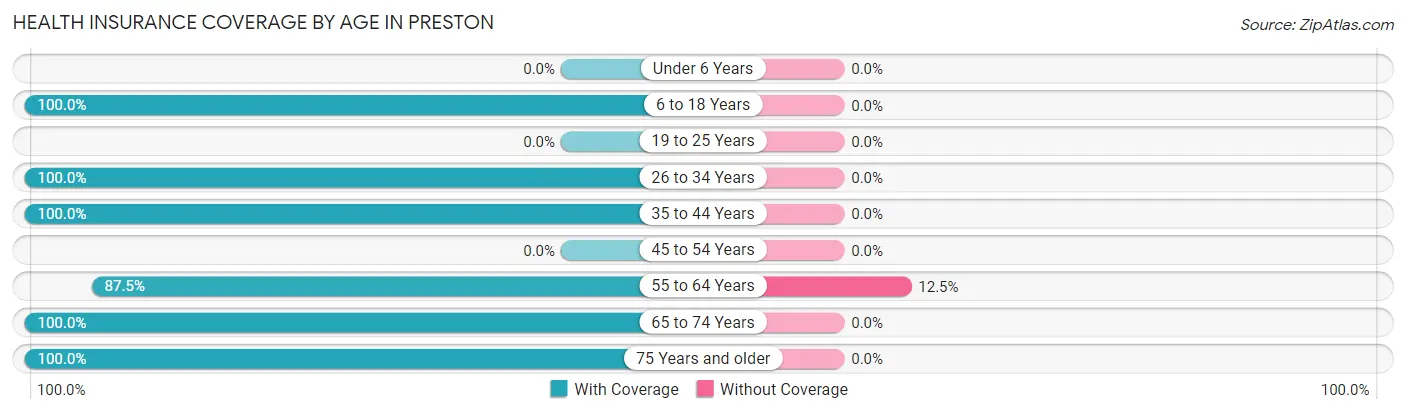
| Age Bracket | With Coverage | Without Coverage |
| Under 6 Years | 0 (0.0%) | 0 (0.0%) |
| 6 to 18 Years | 4 (100.0%) | 0 (0.0%) |
| 19 to 25 Years | 0 (0.0%) | 0 (0.0%) |
| 26 to 34 Years | 4 (100.0%) | 0 (0.0%) |
| 35 to 44 Years | 8 (100.0%) | 0 (0.0%) |
| 45 to 54 Years | 0 (0.0%) | 0 (0.0%) |
| 55 to 64 Years | 7 (87.5%) | 1 (12.5%) |
| 65 to 74 Years | 9 (100.0%) | 0 (0.0%) |
| 75 Years and older | 5 (100.0%) | 0 (0.0%) |
| Total | 37 (97.4%) | 1 (2.6%) |
Health Insurance Coverage by Citizenship Status in Preston
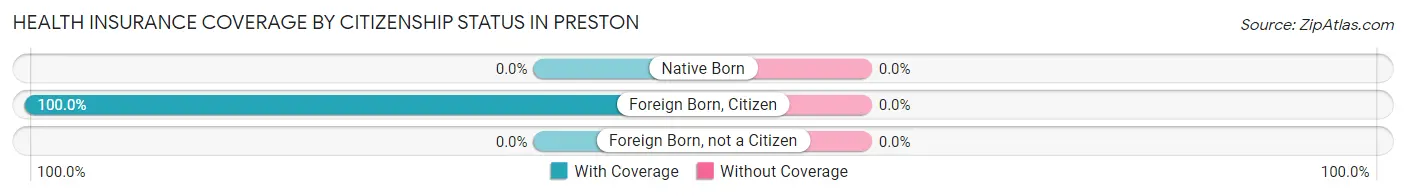
| Citizenship Status | With Coverage | Without Coverage |
| Native Born | 0 (0.0%) | 0 (0.0%) |
| Foreign Born, Citizen | 4 (100.0%) | 0 (0.0%) |
| Foreign Born, not a Citizen | 0 (0.0%) | 0 (0.0%) |
Health Insurance Coverage by Household Income in Preston
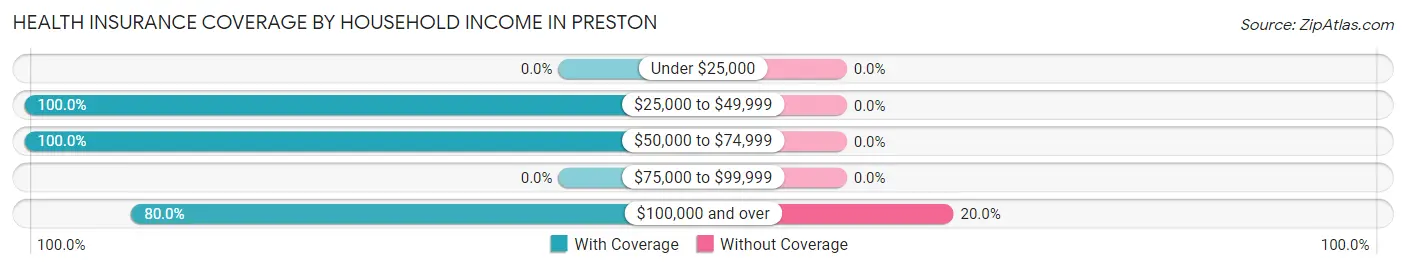
| Household Income | With Coverage | Without Coverage |
| Under $25,000 | 0 (0.0%) | 0 (0.0%) |
| $25,000 to $49,999 | 12 (100.0%) | 0 (0.0%) |
| $50,000 to $74,999 | 21 (100.0%) | 0 (0.0%) |
| $75,000 to $99,999 | 0 (0.0%) | 0 (0.0%) |
| $100,000 and over | 4 (80.0%) | 1 (20.0%) |
Public vs Private Health Insurance Coverage by Age in Preston
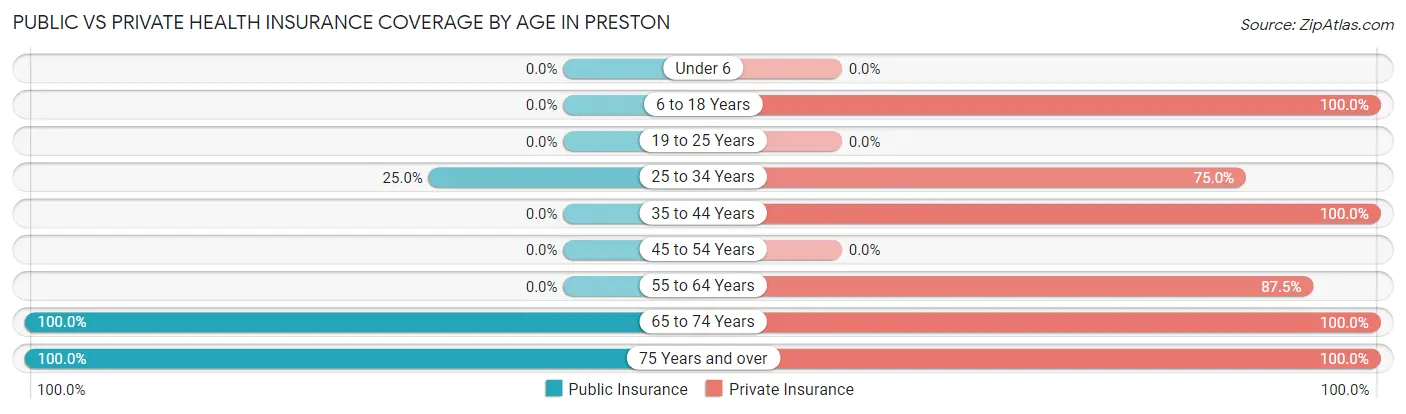
| Age Bracket | Public Insurance | Private Insurance |
| Under 6 | 0 (0.0%) | 0 (0.0%) |
| 6 to 18 Years | 0 (0.0%) | 4 (100.0%) |
| 19 to 25 Years | 0 (0.0%) | 0 (0.0%) |
| 25 to 34 Years | 1 (25.0%) | 3 (75.0%) |
| 35 to 44 Years | 0 (0.0%) | 8 (100.0%) |
| 45 to 54 Years | 0 (0.0%) | 0 (0.0%) |
| 55 to 64 Years | 0 (0.0%) | 7 (87.5%) |
| 65 to 74 Years | 9 (100.0%) | 9 (100.0%) |
| 75 Years and over | 5 (100.0%) | 5 (100.0%) |
| Total | 15 (39.5%) | 36 (94.7%) |
Disability Status by Sex by Age in Preston
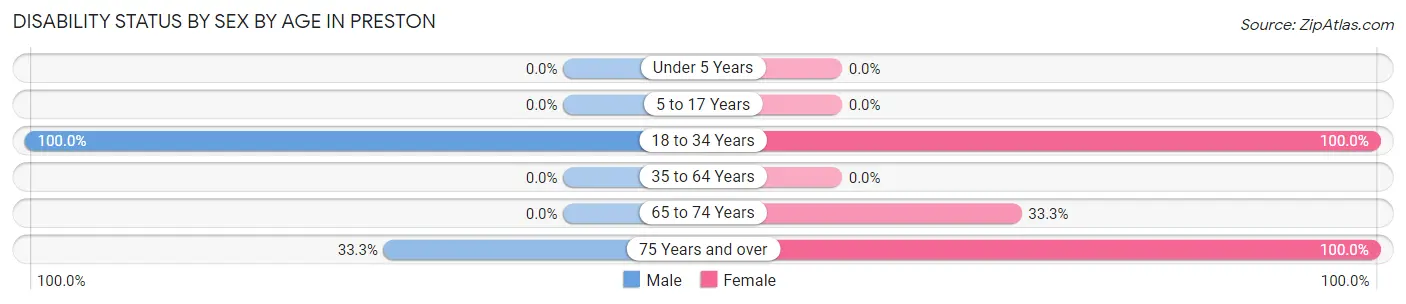
| Age Bracket | Male | Female |
| Under 5 Years | 0 (0.0%) | 0 (0.0%) |
| 5 to 17 Years | 0 (0.0%) | 0 (0.0%) |
| 18 to 34 Years | 1 (100.0%) | 3 (100.0%) |
| 35 to 64 Years | 0 (0.0%) | 0 (0.0%) |
| 65 to 74 Years | 0 (0.0%) | 2 (33.3%) |
| 75 Years and over | 1 (33.3%) | 2 (100.0%) |
Disability Class by Sex by Age in Preston
Disability Class: Hearing Difficulty
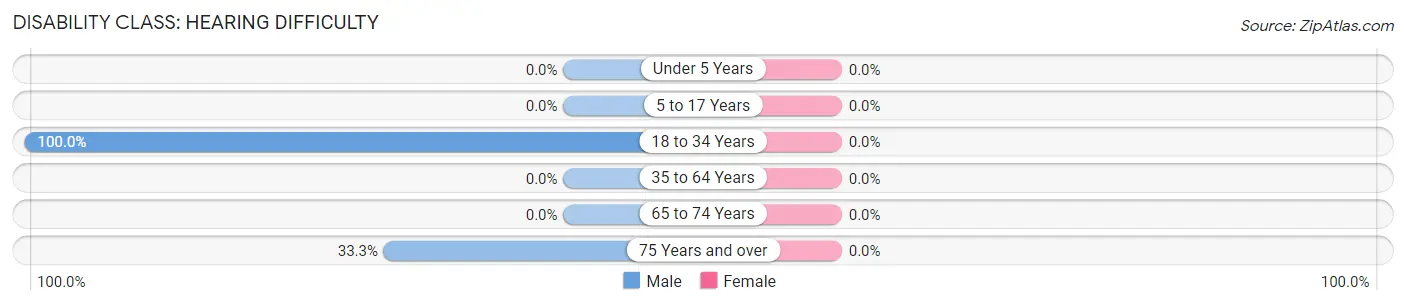
| Age Bracket | Male | Female |
| Under 5 Years | 0 (0.0%) | 0 (0.0%) |
| 5 to 17 Years | 0 (0.0%) | 0 (0.0%) |
| 18 to 34 Years | 1 (100.0%) | 0 (0.0%) |
| 35 to 64 Years | 0 (0.0%) | 0 (0.0%) |
| 65 to 74 Years | 0 (0.0%) | 0 (0.0%) |
| 75 Years and over | 1 (33.3%) | 0 (0.0%) |
Disability Class: Vision Difficulty
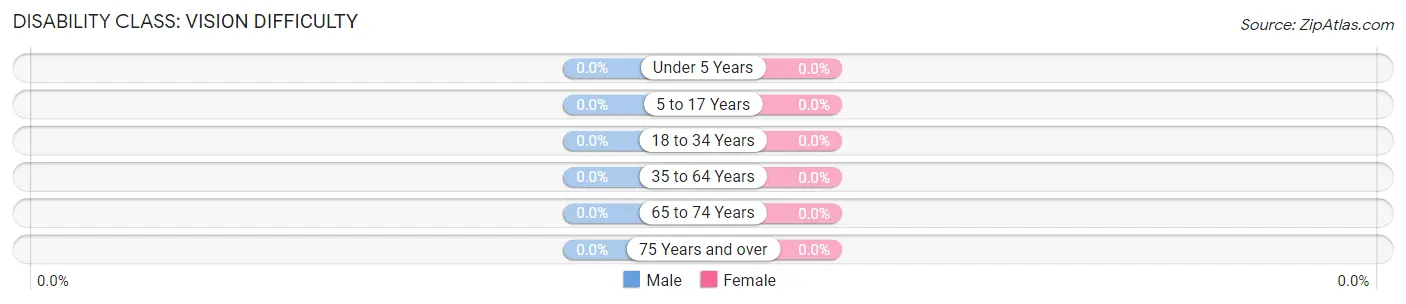
| Age Bracket | Male | Female |
| Under 5 Years | 0 (0.0%) | 0 (0.0%) |
| 5 to 17 Years | 0 (0.0%) | 0 (0.0%) |
| 18 to 34 Years | 0 (0.0%) | 0 (0.0%) |
| 35 to 64 Years | 0 (0.0%) | 0 (0.0%) |
| 65 to 74 Years | 0 (0.0%) | 0 (0.0%) |
| 75 Years and over | 0 (0.0%) | 0 (0.0%) |
Disability Class: Cognitive Difficulty
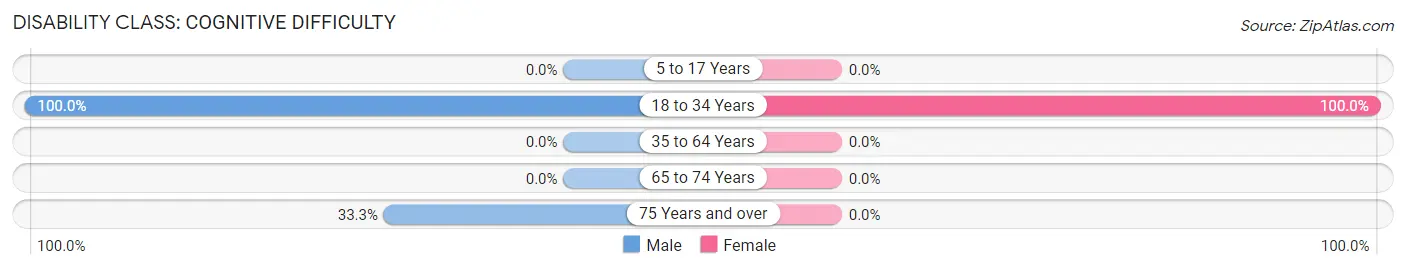
| Age Bracket | Male | Female |
| 5 to 17 Years | 0 (0.0%) | 0 (0.0%) |
| 18 to 34 Years | 1 (100.0%) | 3 (100.0%) |
| 35 to 64 Years | 0 (0.0%) | 0 (0.0%) |
| 65 to 74 Years | 0 (0.0%) | 0 (0.0%) |
| 75 Years and over | 1 (33.3%) | 0 (0.0%) |
Disability Class: Ambulatory Difficulty
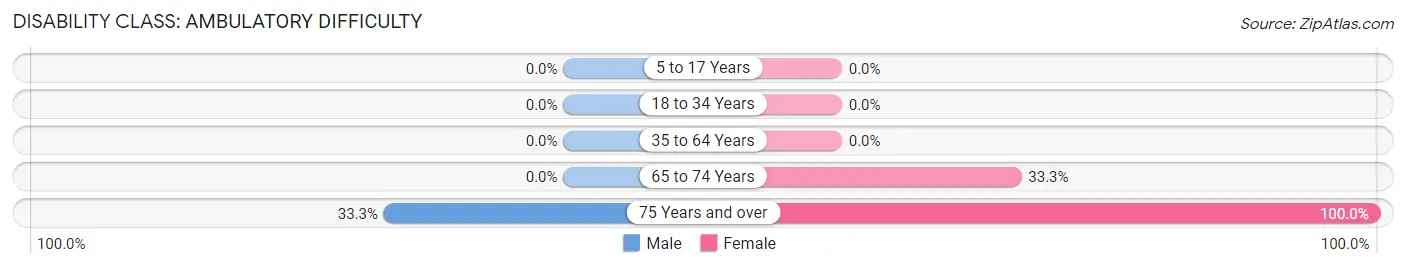
| Age Bracket | Male | Female |
| 5 to 17 Years | 0 (0.0%) | 0 (0.0%) |
| 18 to 34 Years | 0 (0.0%) | 0 (0.0%) |
| 35 to 64 Years | 0 (0.0%) | 0 (0.0%) |
| 65 to 74 Years | 0 (0.0%) | 2 (33.3%) |
| 75 Years and over | 1 (33.3%) | 2 (100.0%) |
Disability Class: Self-Care Difficulty
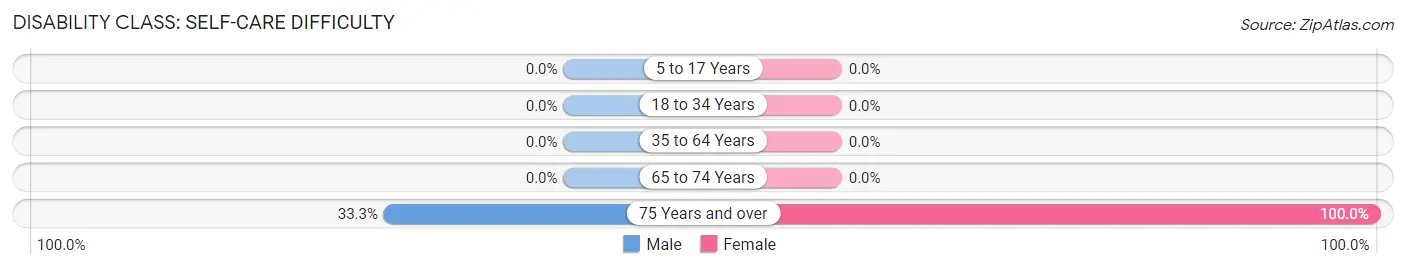
| Age Bracket | Male | Female |
| 5 to 17 Years | 0 (0.0%) | 0 (0.0%) |
| 18 to 34 Years | 0 (0.0%) | 0 (0.0%) |
| 35 to 64 Years | 0 (0.0%) | 0 (0.0%) |
| 65 to 74 Years | 0 (0.0%) | 0 (0.0%) |
| 75 Years and over | 1 (33.3%) | 2 (100.0%) |
Technology Access in Preston
Computing Device Access in Preston
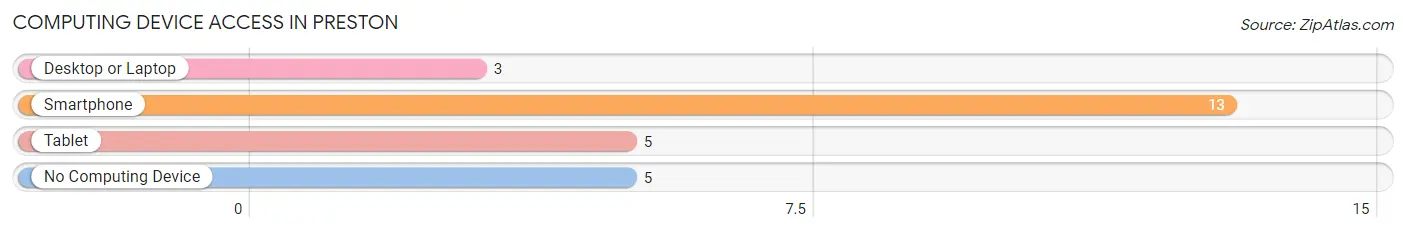
| Device Type | # Households | % Households |
| Desktop or Laptop | 3 | 13.6% |
| Smartphone | 13 | 59.1% |
| Tablet | 5 | 22.7% |
| No Computing Device | 5 | 22.7% |
| Total | 22 | 100.0% |
Internet Access in Preston
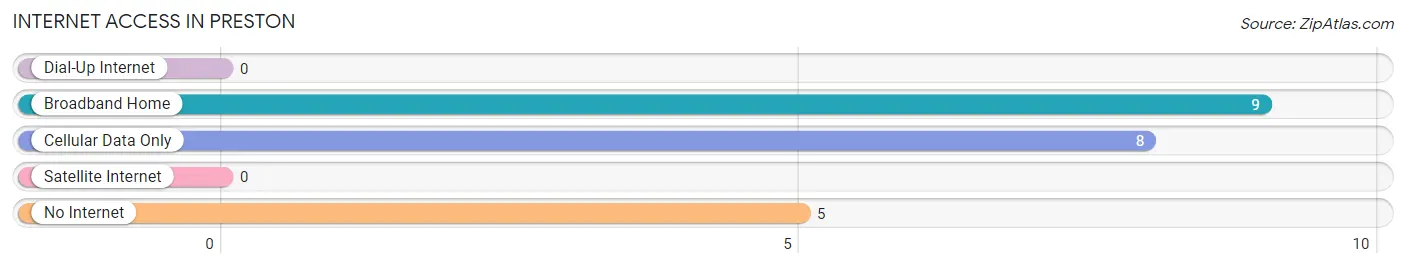
| Internet Type | # Households | % Households |
| Dial-Up Internet | 0 | 0.0% |
| Broadband Home | 9 | 40.9% |
| Cellular Data Only | 8 | 36.4% |
| Satellite Internet | 0 | 0.0% |
| No Internet | 5 | 22.7% |
| Total | 22 | 100.0% |
Preston Summary
Preston is a small town located in the northeast corner of Nebraska, in the United States. It is situated in the middle of the state, about 30 miles from the Iowa border. The town is located in the county of Antelope, and is part of the Norfolk Micropolitan Statistical Area. As of the 2010 census, the population of Preston was 545.
History
Preston was founded in 1871 by a group of settlers from the nearby town of Norfolk. The town was named after Preston, England, and was originally intended to be a farming community. The first settlers were mostly of German descent, and the town quickly grew to become a thriving agricultural center.
In 1873, the first school was built in Preston, and the town soon became a center of education. In 1876, the first church was built, and the town was officially incorporated in 1877.
In the late 19th century, Preston was a bustling town, with a population of over 1,000. The town was home to several businesses, including a bank, a hotel, a blacksmith, a livery stable, and a general store.
Geography
Preston is located in the northeast corner of Nebraska, in the United States. It is situated in the middle of the state, about 30 miles from the Iowa border. The town is located in the county of Antelope, and is part of the Norfolk Micropolitan Statistical Area.
The town is situated on the banks of the Elkhorn River, and is surrounded by rolling hills and farmland. The town is located at an elevation of 1,717 feet above sea level.
Economy
The economy of Preston is largely based on agriculture. The town is home to several farms, and the surrounding area is known for its production of corn, soybeans, and other crops.
In addition to agriculture, Preston is home to several small businesses, including a grocery store, a hardware store, and a restaurant. The town is also home to a few manufacturing companies, including a furniture factory and a plastics factory.
Demographics
As of the 2010 census, the population of Preston was 545. The town is predominantly white, with a small Hispanic population. The median household income is $41,250, and the median home value is $90,000.
The town is served by the Preston Public School District, which includes an elementary school, a middle school, and a high school. The town is also home to a branch of the University of Nebraska.
Conclusion
Preston is a small town located in the northeast corner of Nebraska, in the United States. It is situated in the middle of the state, about 30 miles from the Iowa border. The town is located in the county of Antelope, and is part of the Norfolk Micropolitan Statistical Area. As of the 2010 census, the population of Preston was 545. The town is predominantly white, with a small Hispanic population. The economy of Preston is largely based on agriculture, and the town is home to several small businesses. The town is served by the Preston Public School District, and is home to a branch of the University of Nebraska.
Common Questions
What is Per Capita Income in Preston?
Per Capita income in Preston is $33,805.
What is the Median Family Income in Preston?
Median Family Income in Preston is $51,875.
What is the Median Household income in Preston?
Median Household Income in Preston is $51,875.
What is Income or Wage Gap in Preston?
Income or Wage Gap in Preston is 62.5%.
Women in Preston earn 37.5 cents for every dollar earned by a man.
What is Inequality or Gini Index in Preston?
Inequality or Gini Index in Preston is 0.21.
What is the Total Population of Preston?
Total Population of Preston is 38.
What is the Total Male Population of Preston?
Total Male Population of Preston is 23.
What is the Total Female Population of Preston?
Total Female Population of Preston is 15.
What is the Ratio of Males per 100 Females in Preston?
There are 153.33 Males per 100 Females in Preston.
What is the Ratio of Females per 100 Males in Preston?
There are 65.22 Females per 100 Males in Preston.
What is the Median Population Age in Preston?
Median Population Age in Preston is 57.5 Years.
What is the Average Family Size in Preston
Average Family Size in Preston is 1.8 People.
What is the Average Household Size in Preston
Average Household Size in Preston is 1.7 People.
How Large is the Labor Force in Preston?
There are 18 People in the Labor Forcein in Preston.
What is the Percentage of People in the Labor Force in Preston?
52.9% of People are in the Labor Force in Preston.