Antreville, SC Map & Demographics
Antreville Map
Antreville Overview
$28,004
PER CAPITA INCOME
0.43
INEQUALITY / GINI INDEX
286
TOTAL POPULATION
112
MALE POPULATION
174
FEMALE POPULATION
64.37
MALES / 100 FEMALES
155.36
FEMALES / 100 MALES
57.9
MEDIAN AGE
2.6
AVG FAMILY SIZE
2.9
AVG HOUSEHOLD SIZE
76
LABOR FORCE [ PEOPLE ]
29.1%
PERCENT IN LABOR FORCE
Income in Antreville
Income Overview in Antreville
| Characteristic | Number | Measure |
| Per Capita Income | 286 | $28,004 |
| Median Family Income | 88 | $0 |
| Mean Family Income | 88 | $83,115 |
| Median Household Income | 96 | $0 |
| Mean Household Income | 96 | $76,189 |
| Income Deficit | 88 | $0 |
| Wage / Income Gap (%) | 286 | 0.00% |
| Wage / Income Gap ($) | 286 | 100.00¢ per $1 |
| Gini / Inequality Index | 286 | 0.43 |
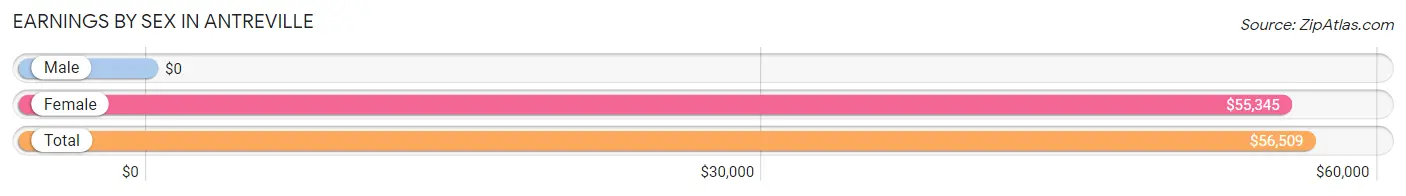
Earnings by Sex in Antreville
| Sex | Number | Average Earnings |
| Male | 27 (35.1%) | $0 |
| Female | 50 (64.9%) | $55,345 |
| Total | 77 (100.0%) | $56,509 |
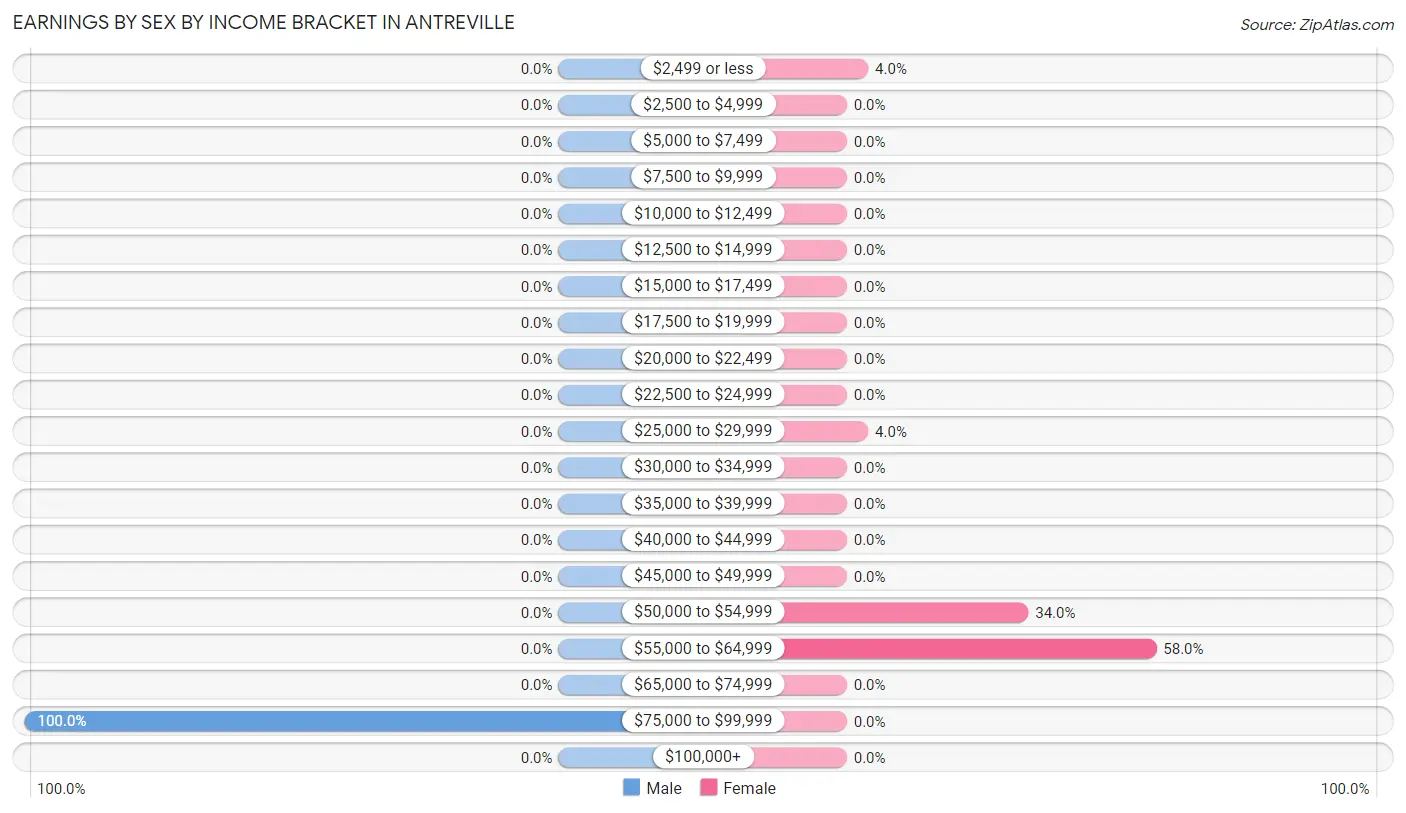
Earnings by Sex by Income Bracket in Antreville
The most common earnings brackets in Antreville are $75,000 to $99,999 for men (27 | 100.0%) and $55,000 to $64,999 for women (29 | 58.0%).
| Income | Male | Female |
| $2,499 or less | 0 (0.0%) | 2 (4.0%) |
| $2,500 to $4,999 | 0 (0.0%) | 0 (0.0%) |
| $5,000 to $7,499 | 0 (0.0%) | 0 (0.0%) |
| $7,500 to $9,999 | 0 (0.0%) | 0 (0.0%) |
| $10,000 to $12,499 | 0 (0.0%) | 0 (0.0%) |
| $12,500 to $14,999 | 0 (0.0%) | 0 (0.0%) |
| $15,000 to $17,499 | 0 (0.0%) | 0 (0.0%) |
| $17,500 to $19,999 | 0 (0.0%) | 0 (0.0%) |
| $20,000 to $22,499 | 0 (0.0%) | 0 (0.0%) |
| $22,500 to $24,999 | 0 (0.0%) | 0 (0.0%) |
| $25,000 to $29,999 | 0 (0.0%) | 2 (4.0%) |
| $30,000 to $34,999 | 0 (0.0%) | 0 (0.0%) |
| $35,000 to $39,999 | 0 (0.0%) | 0 (0.0%) |
| $40,000 to $44,999 | 0 (0.0%) | 0 (0.0%) |
| $45,000 to $49,999 | 0 (0.0%) | 0 (0.0%) |
| $50,000 to $54,999 | 0 (0.0%) | 17 (34.0%) |
| $55,000 to $64,999 | 0 (0.0%) | 29 (58.0%) |
| $65,000 to $74,999 | 0 (0.0%) | 0 (0.0%) |
| $75,000 to $99,999 | 27 (100.0%) | 0 (0.0%) |
| $100,000+ | 0 (0.0%) | 0 (0.0%) |
| Total | 27 (100.0%) | 50 (100.0%) |
Earnings by Sex by Educational Attainment in Antreville
| Educational Attainment | Male Income | Female Income |
| Less than High School | - | - |
| High School Diploma | - | - |
| College or Associate's Degree | - | - |
| Bachelor's Degree | - | - |
| Graduate Degree | - | - |
| Total | - | - |
Family Income in Antreville
Family Income Brackets in Antreville
According to the Antreville family income data, there are 40 families falling into the $100,000 to $149,999 income range, which is the most common income bracket and makes up 45.5% of all families.
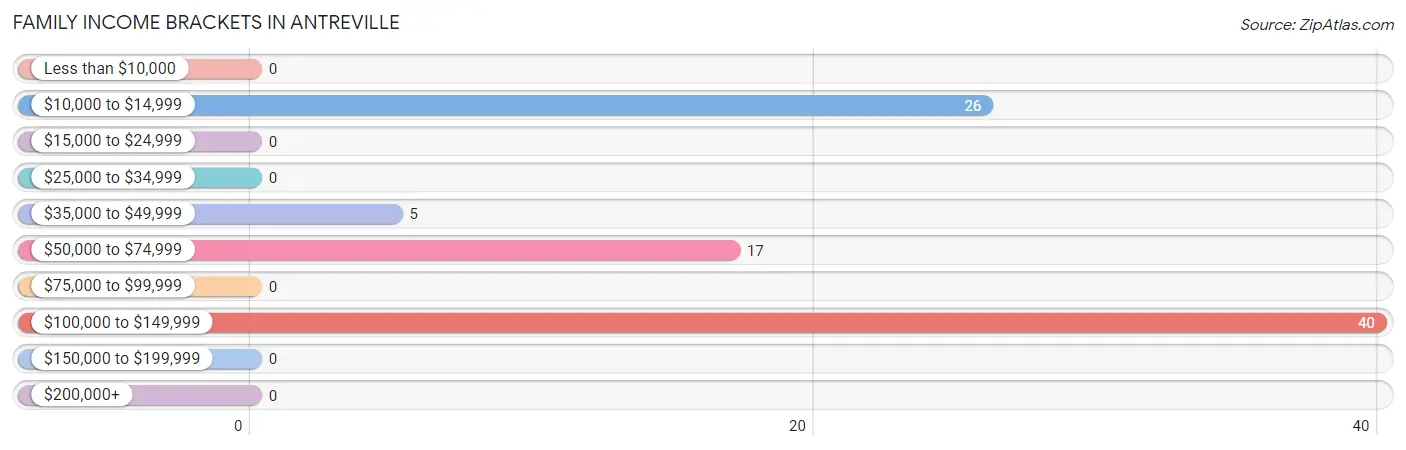
| Income Bracket | # Families | % Families |
| Less than $10,000 | 0 | 0.0% |
| $10,000 to $14,999 | 26 | 29.5% |
| $15,000 to $24,999 | 0 | 0.0% |
| $25,000 to $34,999 | 0 | 0.0% |
| $35,000 to $49,999 | 5 | 5.7% |
| $50,000 to $74,999 | 17 | 19.3% |
| $75,000 to $99,999 | 0 | 0.0% |
| $100,000 to $149,999 | 40 | 45.5% |
| $150,000 to $199,999 | 0 | 0.0% |
| $200,000+ | 0 | 0.0% |
Family Income by Famaliy Size in Antreville
| Income Bracket | # Families | Median Income |
| 2-Person Families | 67 (76.1%) | $0 |
| 3-Person Families | 21 (23.9%) | $0 |
| 4-Person Families | 0 (0.0%) | $0 |
| 5-Person Families | 0 (0.0%) | $0 |
| 6-Person Families | 0 (0.0%) | $0 |
| 7+ Person Families | 0 (0.0%) | $0 |
| Total | 88 (100.0%) | $0 |
Family Income by Number of Earners in Antreville
| Number of Earners | # Families | Median Income |
| No Earners | 44 (50.0%) | $0 |
| 1 Earner | 21 (23.9%) | $0 |
| 2 Earners | 23 (26.1%) | $0 |
| 3+ Earners | 0 (0.0%) | $0 |
| Total | 88 (100.0%) | $0 |
Household Income in Antreville
Household Income Brackets in Antreville
With 40 households falling in the category, the $100,000 to $149,999 income range is the most frequent in Antreville, accounting for 41.7% of all households.
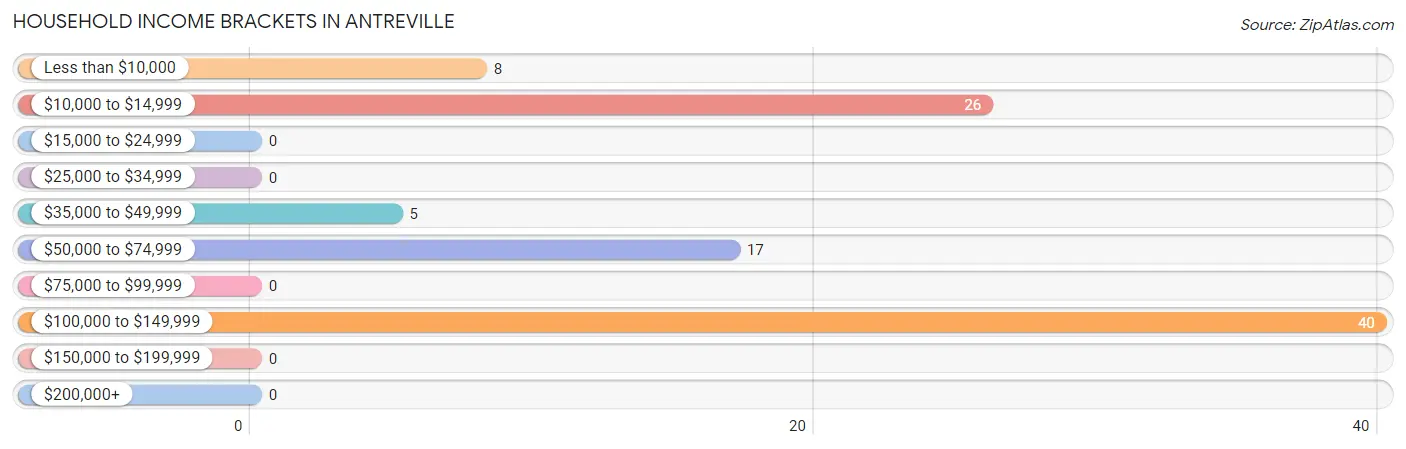
| Income Bracket | # Households | % Households |
| Less than $10,000 | 8 | 8.3% |
| $10,000 to $14,999 | 26 | 27.1% |
| $15,000 to $24,999 | 0 | 0.0% |
| $25,000 to $34,999 | 0 | 0.0% |
| $35,000 to $49,999 | 5 | 5.2% |
| $50,000 to $74,999 | 17 | 17.7% |
| $75,000 to $99,999 | 0 | 0.0% |
| $100,000 to $149,999 | 40 | 41.7% |
| $150,000 to $199,999 | 0 | 0.0% |
| $200,000+ | 0 | 0.0% |
Household Income by Householder Age in Antreville
The median household income in Antreville is $0, with the highest median household income of $143,804 found in the 45 to 64 years age bracket for the primary householder. A total of 48 households (50.0%) fall into this category.
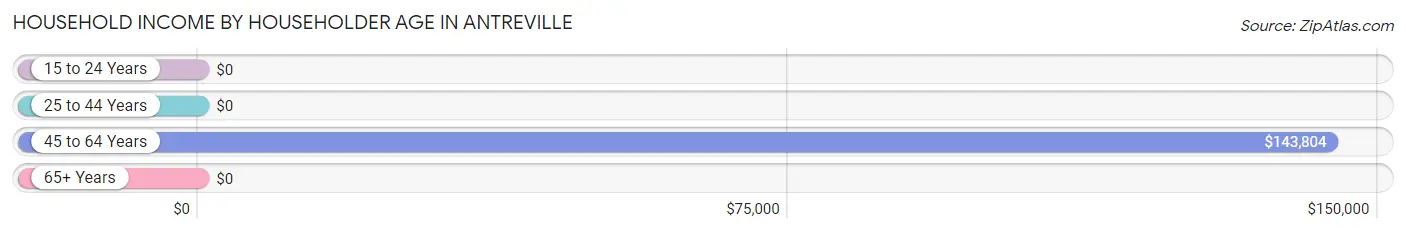
| Income Bracket | # Households | Median Income |
| 15 to 24 Years | 0 (0.0%) | $0 |
| 25 to 44 Years | 17 (17.7%) | $0 |
| 45 to 64 Years | 48 (50.0%) | $143,804 |
| 65+ Years | 31 (32.3%) | $0 |
| Total | 96 (100.0%) | $0 |
Poverty in Antreville
Income Below Poverty by Sex and Age in Antreville
With 40.2% poverty level for males and 31.6% for females among the residents of Antreville, 75 year old and over males and 55 to 64 year old females are the most vulnerable to poverty, with 18 males (78.3%) and 8 females (100.0%) in their respective age groups living below the poverty level.
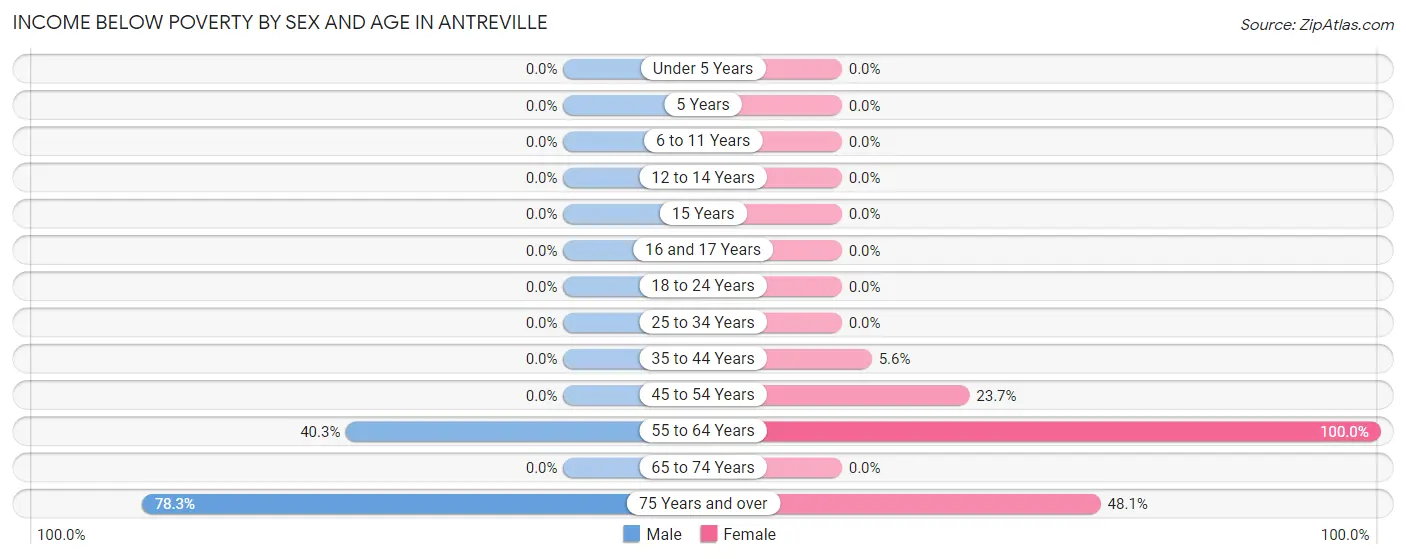
| Age Bracket | Male | Female |
| Under 5 Years | 0 (0.0%) | 0 (0.0%) |
| 5 Years | 0 (0.0%) | 0 (0.0%) |
| 6 to 11 Years | 0 (0.0%) | 0 (0.0%) |
| 12 to 14 Years | 0 (0.0%) | 0 (0.0%) |
| 15 Years | 0 (0.0%) | 0 (0.0%) |
| 16 and 17 Years | 0 (0.0%) | 0 (0.0%) |
| 18 to 24 Years | 0 (0.0%) | 0 (0.0%) |
| 25 to 34 Years | 0 (0.0%) | 0 (0.0%) |
| 35 to 44 Years | 0 (0.0%) | 1 (5.6%) |
| 45 to 54 Years | 0 (0.0%) | 9 (23.7%) |
| 55 to 64 Years | 27 (40.3%) | 8 (100.0%) |
| 65 to 74 Years | 0 (0.0%) | 0 (0.0%) |
| 75 Years and over | 18 (78.3%) | 37 (48.0%) |
| Total | 45 (40.2%) | 55 (31.6%) |
Income Above Poverty by Sex and Age in Antreville
According to the poverty statistics in Antreville, males aged 12 to 14 years and females aged 15 years are the age groups that are most secure financially, with 100.0% of males and 100.0% of females in these age groups living above the poverty line.
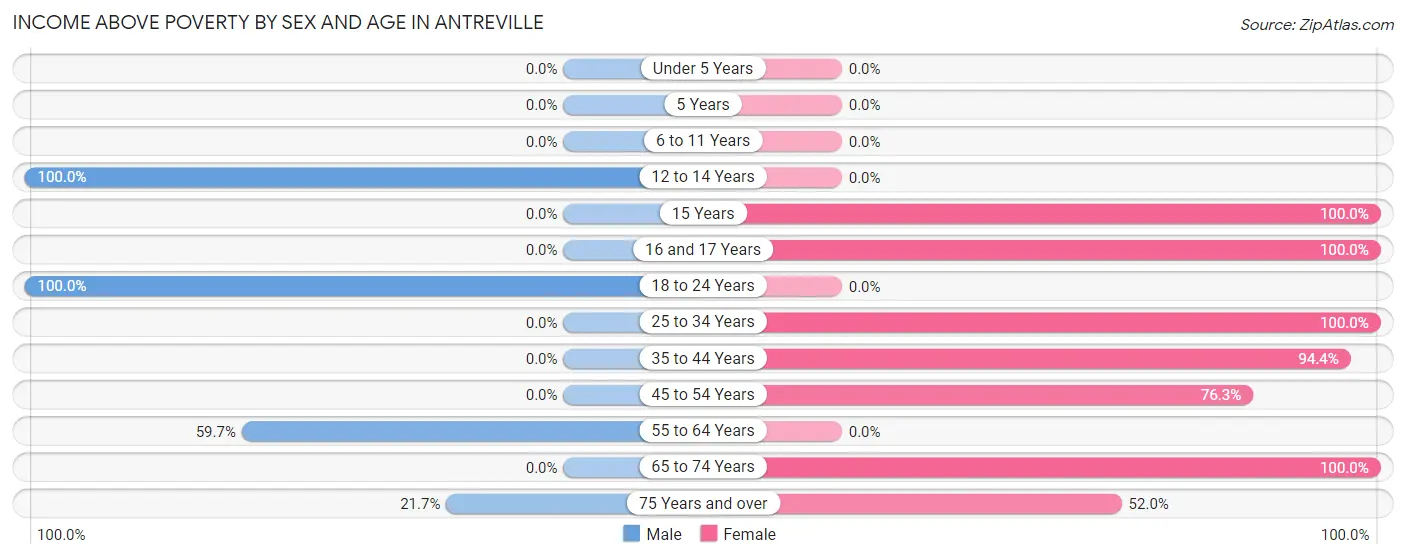
| Age Bracket | Male | Female |
| Under 5 Years | 0 (0.0%) | 0 (0.0%) |
| 5 Years | 0 (0.0%) | 0 (0.0%) |
| 6 to 11 Years | 0 (0.0%) | 0 (0.0%) |
| 12 to 14 Years | 14 (100.0%) | 0 (0.0%) |
| 15 Years | 0 (0.0%) | 11 (100.0%) |
| 16 and 17 Years | 0 (0.0%) | 19 (100.0%) |
| 18 to 24 Years | 8 (100.0%) | 0 (0.0%) |
| 25 to 34 Years | 0 (0.0%) | 2 (100.0%) |
| 35 to 44 Years | 0 (0.0%) | 17 (94.4%) |
| 45 to 54 Years | 0 (0.0%) | 29 (76.3%) |
| 55 to 64 Years | 40 (59.7%) | 0 (0.0%) |
| 65 to 74 Years | 0 (0.0%) | 1 (100.0%) |
| 75 Years and over | 5 (21.7%) | 40 (51.9%) |
| Total | 67 (59.8%) | 119 (68.4%) |
Income Below Poverty Among Married-Couple Families in Antreville
The poverty statistics for married-couple families in Antreville show that 48.1% or 26 of the total 54 families live below the poverty line. Families with no children have the highest poverty rate of 48.1%, comprising of 26 families. On the other hand, families with no children have the lowest poverty rate of 48.1%, which includes 26 families.
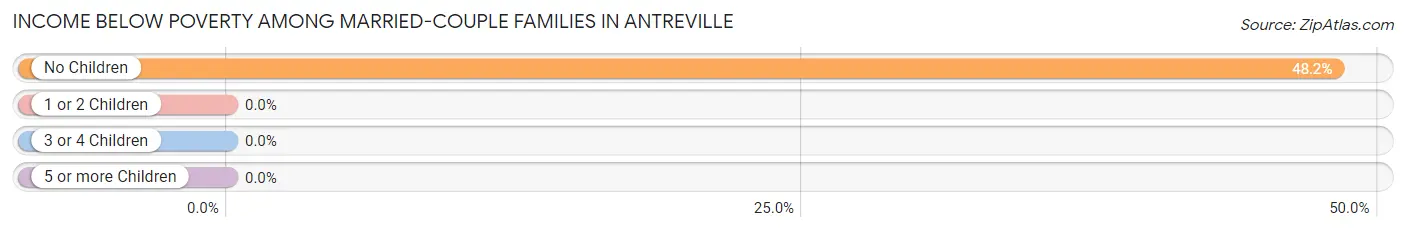
| Children | Above Poverty | Below Poverty |
| No Children | 28 (51.8%) | 26 (48.1%) |
| 1 or 2 Children | 0 (0.0%) | 0 (0.0%) |
| 3 or 4 Children | 0 (0.0%) | 0 (0.0%) |
| 5 or more Children | 0 (0.0%) | 0 (0.0%) |
| Total | 28 (51.8%) | 26 (48.1%) |
Income Below Poverty Among Single-Parent Households in Antreville
| Children | Single Father | Single Mother |
| No Children | 0 (0.0%) | 0 (0.0%) |
| 1 or 2 Children | 0 (0.0%) | 0 (0.0%) |
| 3 or 4 Children | 0 (0.0%) | 0 (0.0%) |
| 5 or more Children | 0 (0.0%) | 0 (0.0%) |
| Total | 0 (0.0%) | 0 (0.0%) |
Income Below Poverty Among Married-Couple vs Single-Parent Households in Antreville
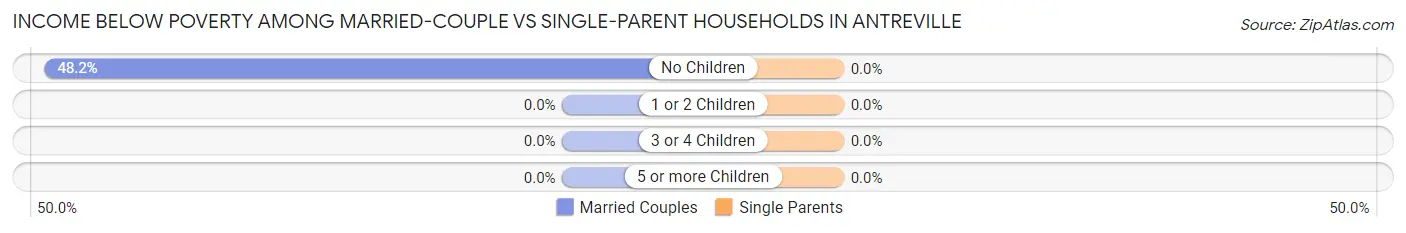
| Children | Married-Couple Families | Single-Parent Households |
| No Children | 26 (48.1%) | 0 (0.0%) |
| 1 or 2 Children | 0 (0.0%) | 0 (0.0%) |
| 3 or 4 Children | 0 (0.0%) | 0 (0.0%) |
| 5 or more Children | 0 (0.0%) | 0 (0.0%) |
| Total | 26 (48.1%) | 0 (0.0%) |
Race in Antreville
The most populous races in Antreville are White / Caucasian (282 | 98.6%), and Black / African American (4 | 1.4%).
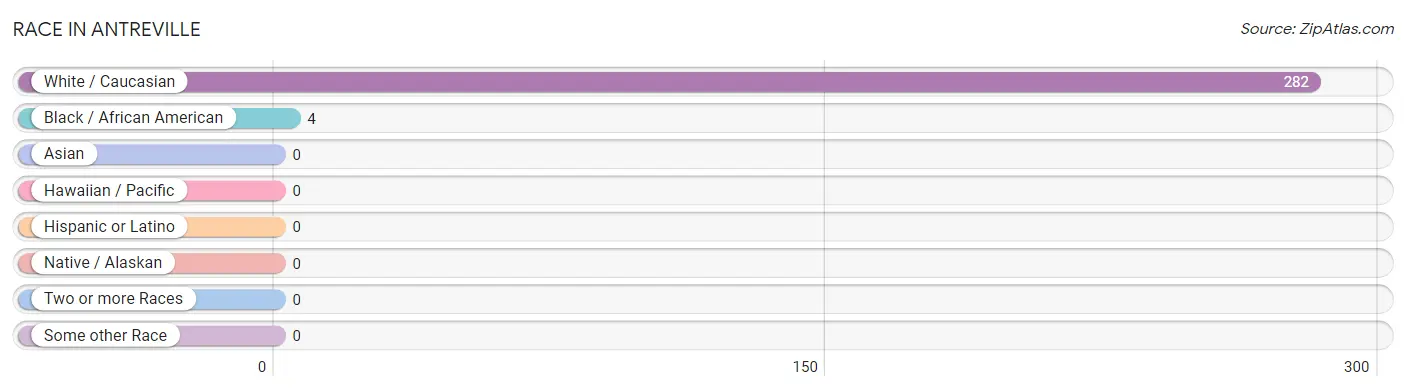
| Race | # Population | % Population |
| Asian | 0 | 0.0% |
| Black / African American | 4 | 1.4% |
| Hawaiian / Pacific | 0 | 0.0% |
| Hispanic or Latino | 0 | 0.0% |
| Native / Alaskan | 0 | 0.0% |
| White / Caucasian | 282 | 98.6% |
| Two or more Races | 0 | 0.0% |
| Some other Race | 0 | 0.0% |
| Total | 286 | 100.0% |
Ancestry in Antreville
The most populous ancestries reported in Antreville are English (107 | 37.4%), Irish (73 | 25.5%), American (72 | 25.2%), French (61 | 21.3%), and Greek (27 | 9.4%), together accounting for 118.9% of all Antreville residents.
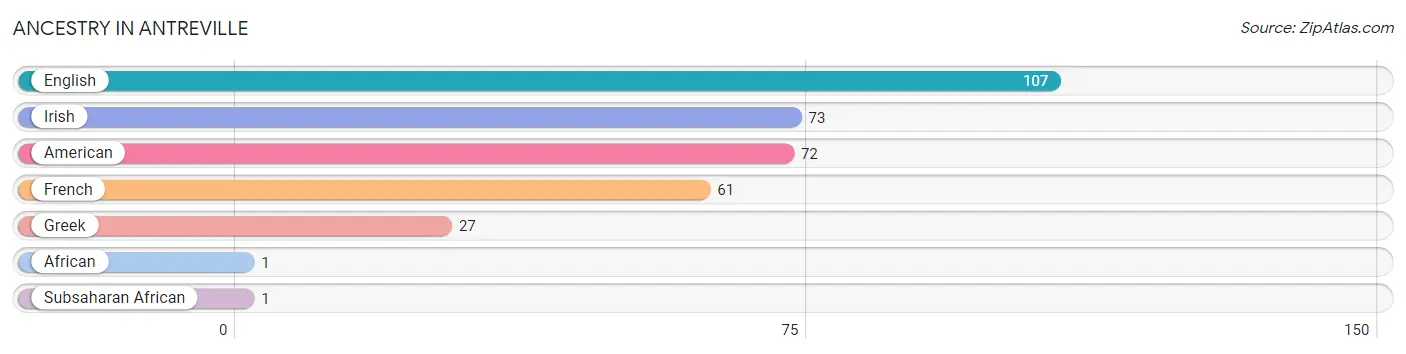
| Ancestry | # Population | % Population |
| African | 1 | 0.4% |
| American | 72 | 25.2% |
| English | 107 | 37.4% |
| French | 61 | 21.3% |
| Greek | 27 | 9.4% |
| Irish | 73 | 25.5% |
| Subsaharan African | 1 | 0.4% | View All 7 Rows |
Immigrants in Antreville
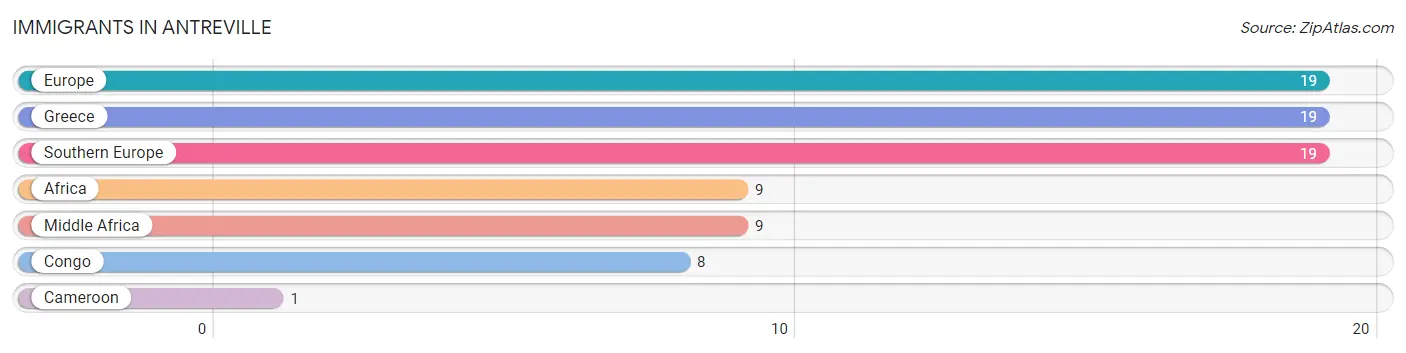
The most numerous immigrant groups reported in Antreville came from Europe (19 | 6.6%), Greece (19 | 6.6%), Southern Europe (19 | 6.6%), Africa (9 | 3.2%), and Middle Africa (9 | 3.2%), together accounting for 26.2% of all Antreville residents.
| Immigration Origin | # Population | % Population |
| Africa | 9 | 3.2% |
| Cameroon | 1 | 0.4% |
| Congo | 8 | 2.8% |
| Europe | 19 | 6.6% |
| Greece | 19 | 6.6% |
| Middle Africa | 9 | 3.2% |
| Southern Europe | 19 | 6.6% | View All 7 Rows |
Sex and Age in Antreville
Sex and Age in Antreville
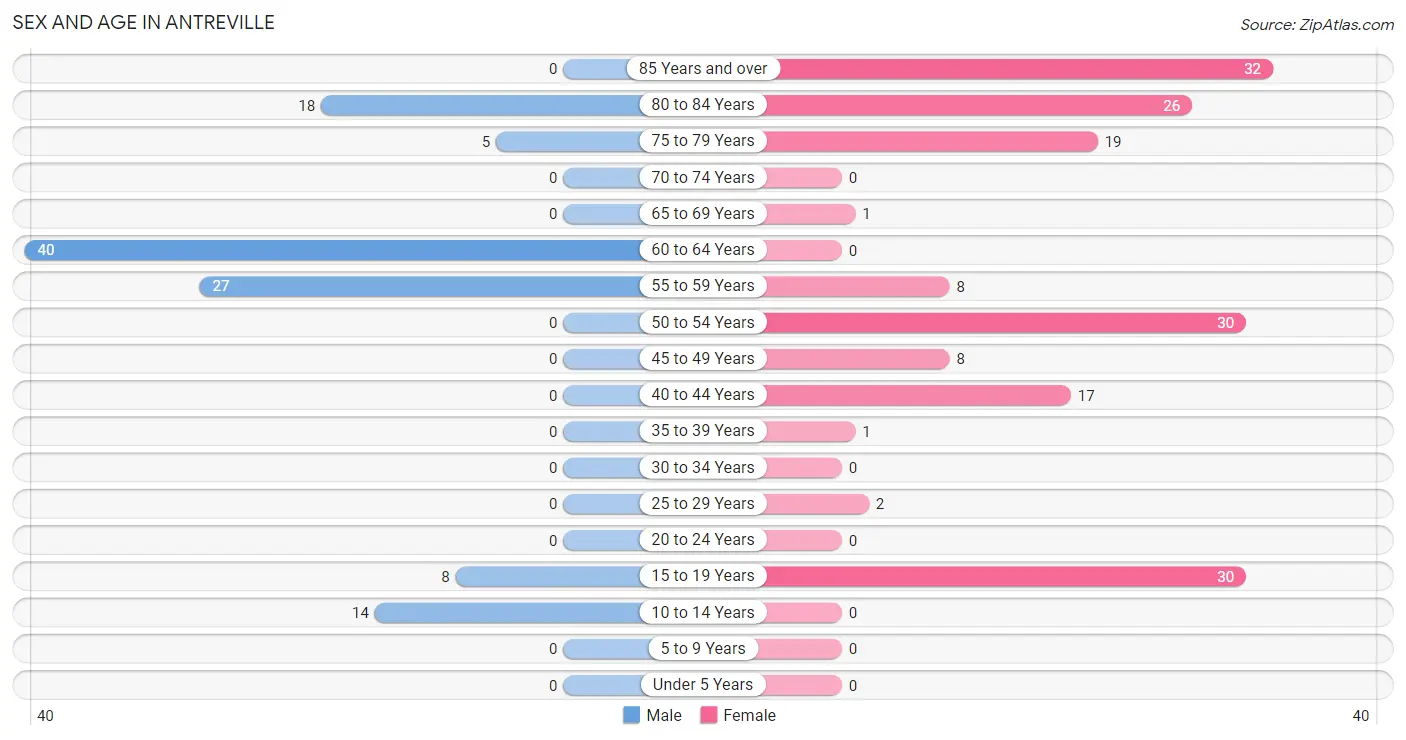
The most populous age groups in Antreville are 60 to 64 Years (40 | 35.7%) for men and 85 Years and over (32 | 18.4%) for women.
| Age Bracket | Male | Female |
| Under 5 Years | 0 (0.0%) | 0 (0.0%) |
| 5 to 9 Years | 0 (0.0%) | 0 (0.0%) |
| 10 to 14 Years | 14 (12.5%) | 0 (0.0%) |
| 15 to 19 Years | 8 (7.1%) | 30 (17.2%) |
| 20 to 24 Years | 0 (0.0%) | 0 (0.0%) |
| 25 to 29 Years | 0 (0.0%) | 2 (1.1%) |
| 30 to 34 Years | 0 (0.0%) | 0 (0.0%) |
| 35 to 39 Years | 0 (0.0%) | 1 (0.6%) |
| 40 to 44 Years | 0 (0.0%) | 17 (9.8%) |
| 45 to 49 Years | 0 (0.0%) | 8 (4.6%) |
| 50 to 54 Years | 0 (0.0%) | 30 (17.2%) |
| 55 to 59 Years | 27 (24.1%) | 8 (4.6%) |
| 60 to 64 Years | 40 (35.7%) | 0 (0.0%) |
| 65 to 69 Years | 0 (0.0%) | 1 (0.6%) |
| 70 to 74 Years | 0 (0.0%) | 0 (0.0%) |
| 75 to 79 Years | 5 (4.5%) | 19 (10.9%) |
| 80 to 84 Years | 18 (16.1%) | 26 (14.9%) |
| 85 Years and over | 0 (0.0%) | 32 (18.4%) |
| Total | 112 (100.0%) | 174 (100.0%) |
Families and Households in Antreville
Median Family Size in Antreville
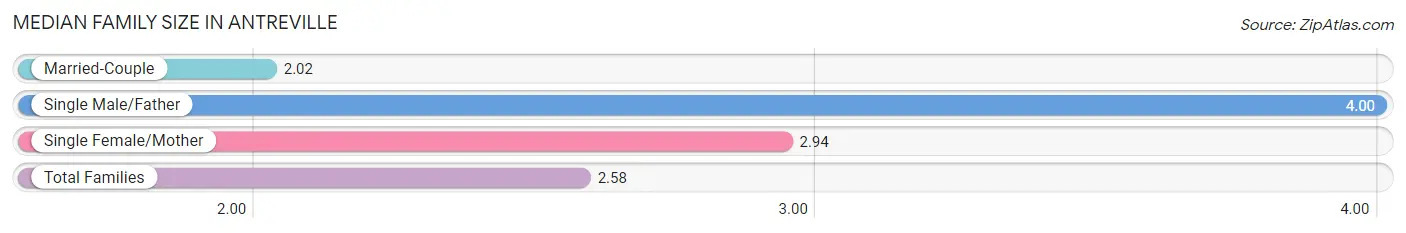
The median family size in Antreville is 2.58 persons per family, with single male/father families (17 | 19.3%) accounting for the largest median family size of 4 persons per family. On the other hand, married-couple families (54 | 61.4%) represent the smallest median family size with 2.02 persons per family.
| Family Type | # Families | Family Size |
| Married-Couple | 54 (61.4%) | 2.02 |
| Single Male/Father | 17 (19.3%) | 4.00 |
| Single Female/Mother | 17 (19.3%) | 2.94 |
| Total Families | 88 (100.0%) | 2.58 |
Median Household Size in Antreville
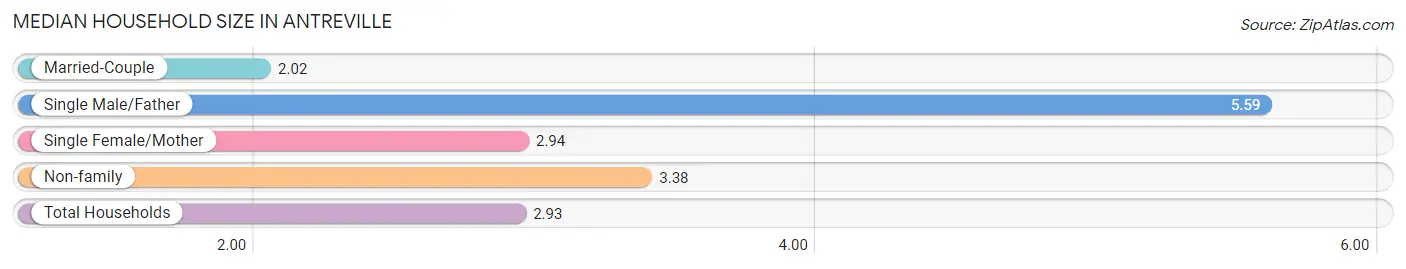
The median household size in Antreville is 2.93 persons per household, with single male/father households (17 | 17.7%) accounting for the largest median household size of 5.59 persons per household. married-couple households (54 | 56.2%) represent the smallest median household size with 2.02 persons per household.
| Household Type | # Households | Household Size |
| Married-Couple | 54 (56.2%) | 2.02 |
| Single Male/Father | 17 (17.7%) | 5.59 |
| Single Female/Mother | 17 (17.7%) | 2.94 |
| Non-family | 8 (8.3%) | 3.38 |
| Total Households | 96 (100.0%) | 2.93 |
Household Size by Marriage Status in Antreville
Out of a total of 96 households in Antreville, 88 (91.7%) are family households, while 8 (8.3%) are nonfamily households. The most numerous type of family households are 2-person households, comprising 54, and the most common type of nonfamily households are 3-person households, comprising 8.
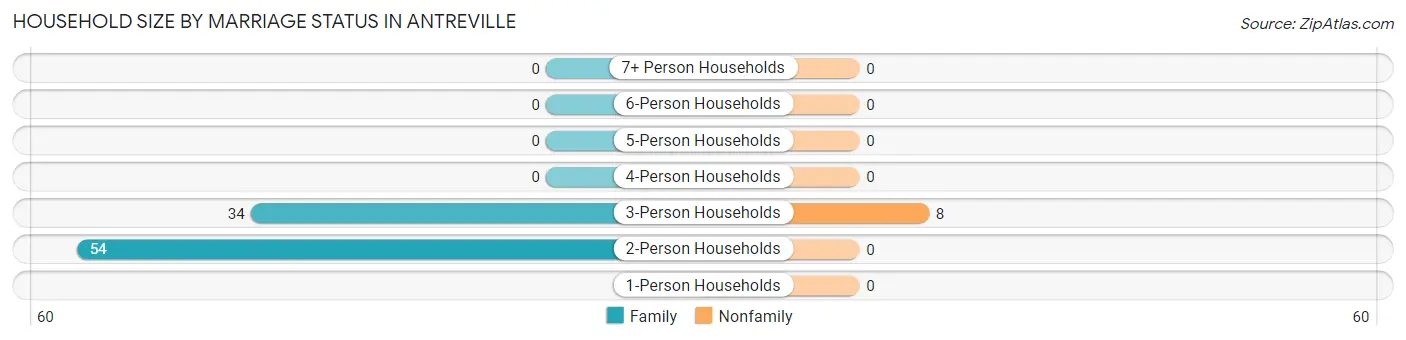
| Household Size | Family Households | Nonfamily Households |
| 1-Person Households | - | 0 (0.0%) |
| 2-Person Households | 54 (56.2%) | 0 (0.0%) |
| 3-Person Households | 34 (35.4%) | 8 (8.3%) |
| 4-Person Households | 0 (0.0%) | 0 (0.0%) |
| 5-Person Households | 0 (0.0%) | 0 (0.0%) |
| 6-Person Households | 0 (0.0%) | 0 (0.0%) |
| 7+ Person Households | 0 (0.0%) | 0 (0.0%) |
| Total | 88 (91.7%) | 8 (8.3%) |
Female Fertility in Antreville
Fertility by Age in Antreville
Average fertility rate in Antreville is 17.0 births per 1,000 women. Women in the age bracket of 35 to 50 years have the highest fertility rate with 37.0 births per 1,000 women. Women in the age bracket of 35 to 50 years acount for 100.0% of all women with births.
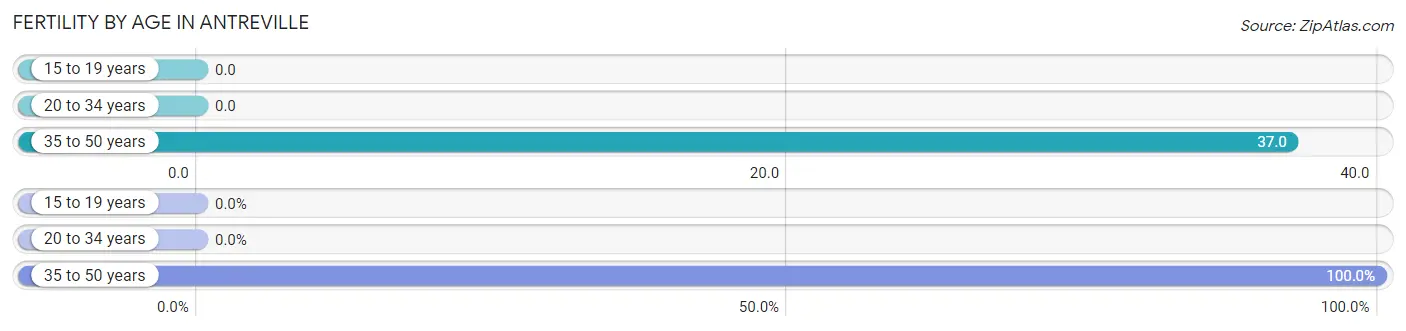
| Age Bracket | Women with Births | Births / 1,000 Women |
| 15 to 19 years | 0 (0.0%) | 0.0 |
| 20 to 34 years | 0 (0.0%) | 0.0 |
| 35 to 50 years | 1 (100.0%) | 37.0 |
| Total | 1 (100.0%) | 17.0 |
Fertility by Age by Marriage Status in Antreville
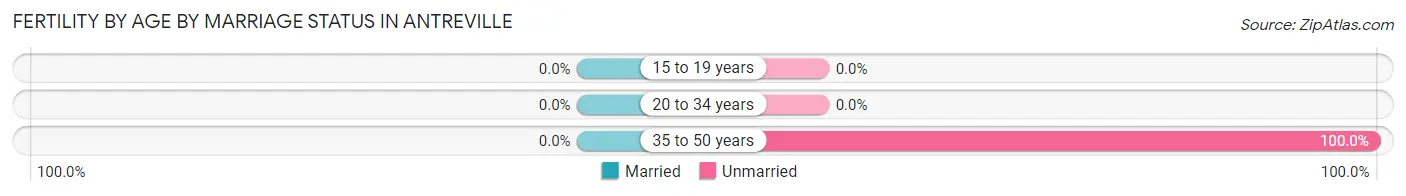
| Age Bracket | Married | Unmarried |
| 15 to 19 years | 0 (0.0%) | 0 (0.0%) |
| 20 to 34 years | 0 (0.0%) | 0 (0.0%) |
| 35 to 50 years | 0 (0.0%) | 1 (100.0%) |
| Total | 0 (0.0%) | 1 (100.0%) |
Fertility by Education in Antreville
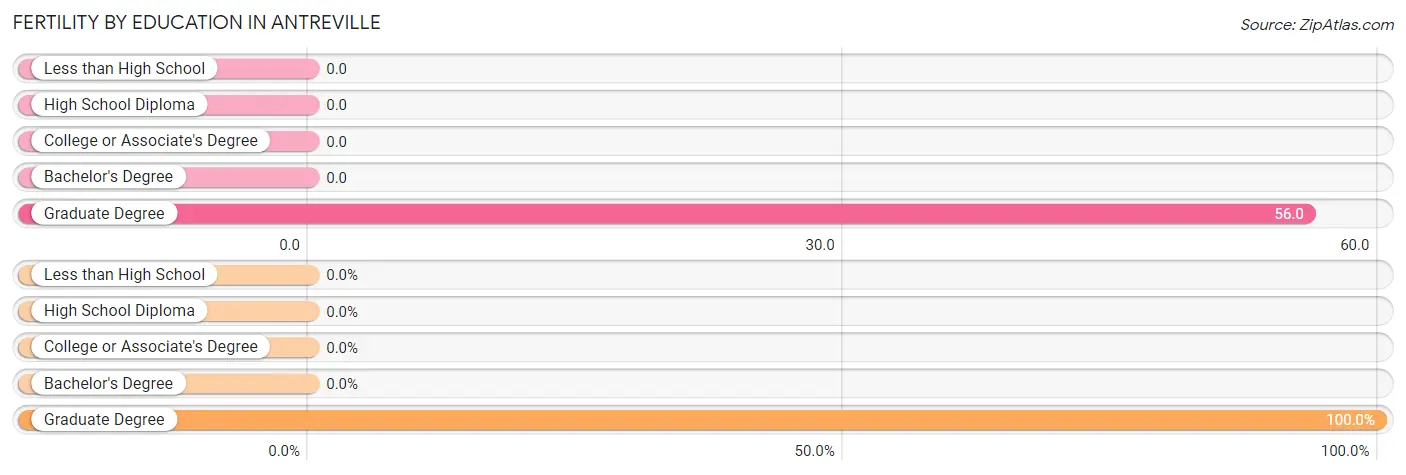
| Educational Attainment | Women with Births | Births / 1,000 Women |
| Less than High School | 0 (0.0%) | 0.0 |
| High School Diploma | 0 (0.0%) | 0.0 |
| College or Associate's Degree | 0 (0.0%) | 0.0 |
| Bachelor's Degree | 0 (0.0%) | 0.0 |
| Graduate Degree | 1 (100.0%) | 56.0 |
| Total | 1 (100.0%) | 17.0 |
Fertility by Education by Marriage Status in Antreville
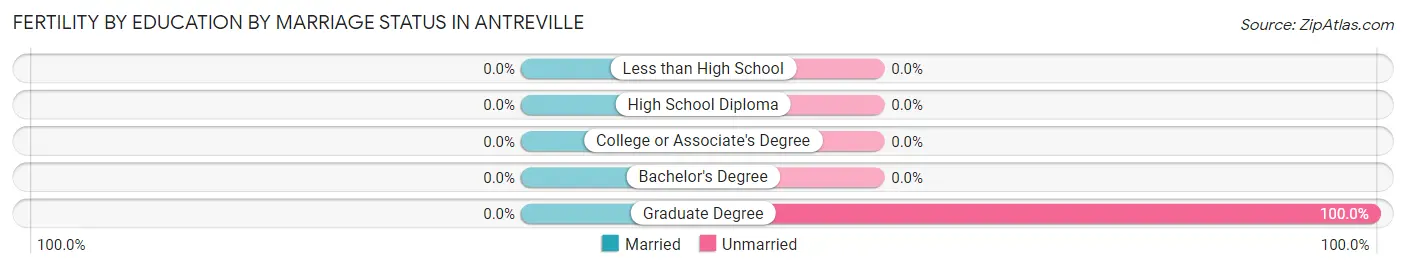
| Educational Attainment | Married | Unmarried |
| Less than High School | 0 (0.0%) | 0 (0.0%) |
| High School Diploma | 0 (0.0%) | 0 (0.0%) |
| College or Associate's Degree | 0 (0.0%) | 0 (0.0%) |
| Bachelor's Degree | 0 (0.0%) | 0 (0.0%) |
| Graduate Degree | 0 (0.0%) | 1 (100.0%) |
| Total | 0 (0.0%) | 1 (100.0%) |
Employment Characteristics in Antreville
Employment by Class of Employer in Antreville
Among the 76 employed individuals in Antreville, private company employees (57 | 75.0%), local government employees (17 | 22.4%), and not-for-profit organizations (2 | 2.6%) make up the most common classes of employment.
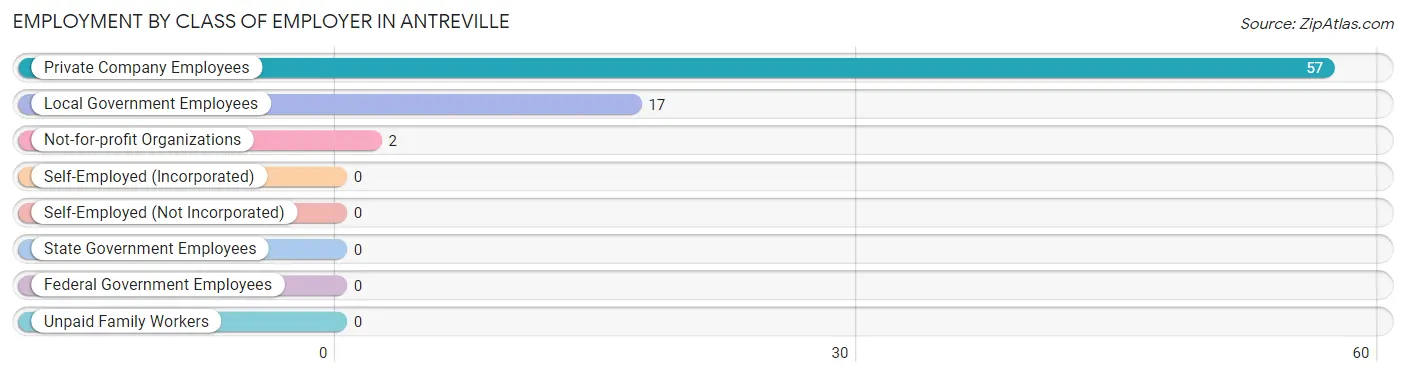
| Employer Class | # Employees | % Employees |
| Private Company Employees | 57 | 75.0% |
| Self-Employed (Incorporated) | 0 | 0.0% |
| Self-Employed (Not Incorporated) | 0 | 0.0% |
| Not-for-profit Organizations | 2 | 2.6% |
| Local Government Employees | 17 | 22.4% |
| State Government Employees | 0 | 0.0% |
| Federal Government Employees | 0 | 0.0% |
| Unpaid Family Workers | 0 | 0.0% |
| Total | 76 | 100.0% |
Employment Status by Age in Antreville
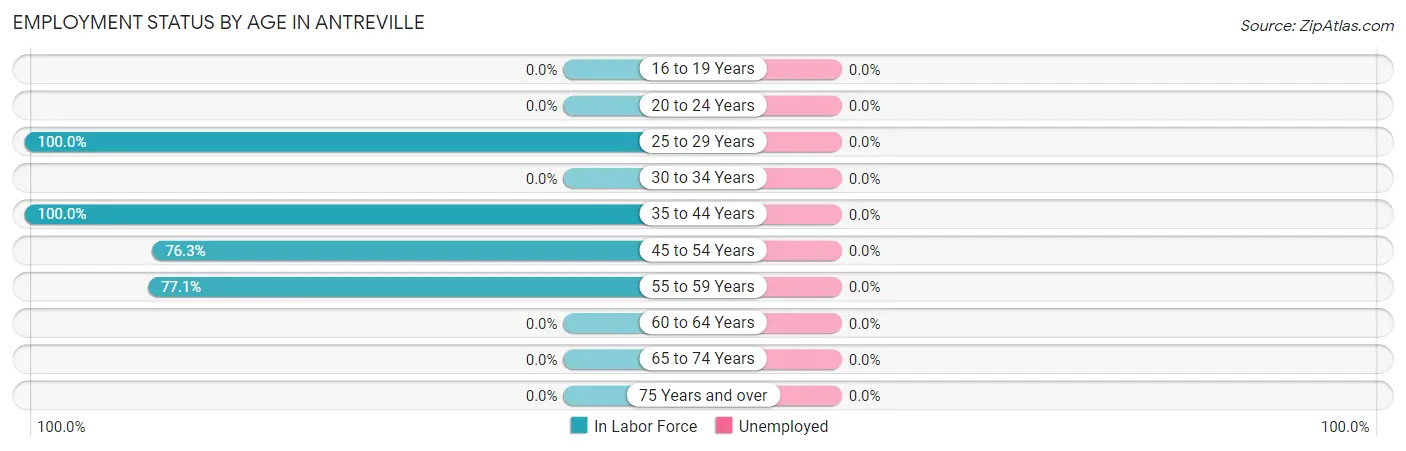
| Age Bracket | In Labor Force | Unemployed |
| 16 to 19 Years | 0 (0.0%) | 0 (0.0%) |
| 20 to 24 Years | 0 (0.0%) | 0 (0.0%) |
| 25 to 29 Years | 2 (100.0%) | 0 (0.0%) |
| 30 to 34 Years | 0 (0.0%) | 0 (0.0%) |
| 35 to 44 Years | 18 (100.0%) | 0 (0.0%) |
| 45 to 54 Years | 29 (76.3%) | 0 (0.0%) |
| 55 to 59 Years | 27 (77.1%) | 0 (0.0%) |
| 60 to 64 Years | 0 (0.0%) | 0 (0.0%) |
| 65 to 74 Years | 0 (0.0%) | 0 (0.0%) |
| 75 Years and over | 0 (0.0%) | 0 (0.0%) |
| Total | 76 (29.1%) | 0 (0.0%) |
Employment Status by Educational Attainment in Antreville
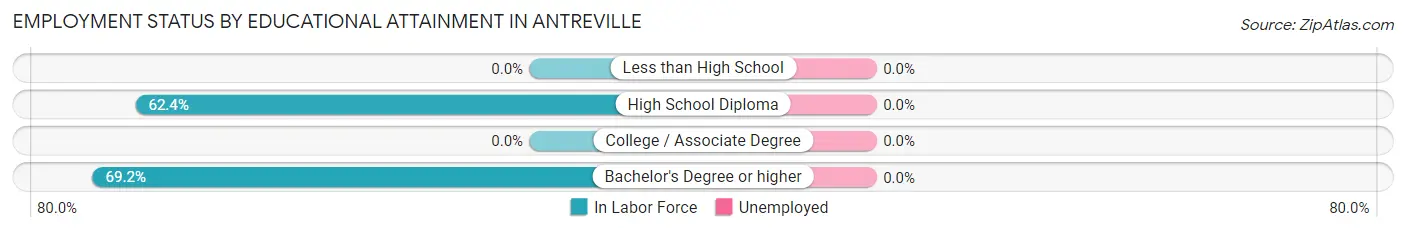
| Educational Attainment | In Labor Force | Unemployed |
| Less than High School | 0 (0.0%) | 0 (0.0%) |
| High School Diploma | 58 (62.4%) | 0 (0.0%) |
| College / Associate Degree | 0 (0.0%) | 0 (0.0%) |
| Bachelor's Degree or higher | 18 (69.2%) | 0 (0.0%) |
| Total | 76 (57.1%) | 0 (0.0%) |
Employment Occupations by Sex in Antreville
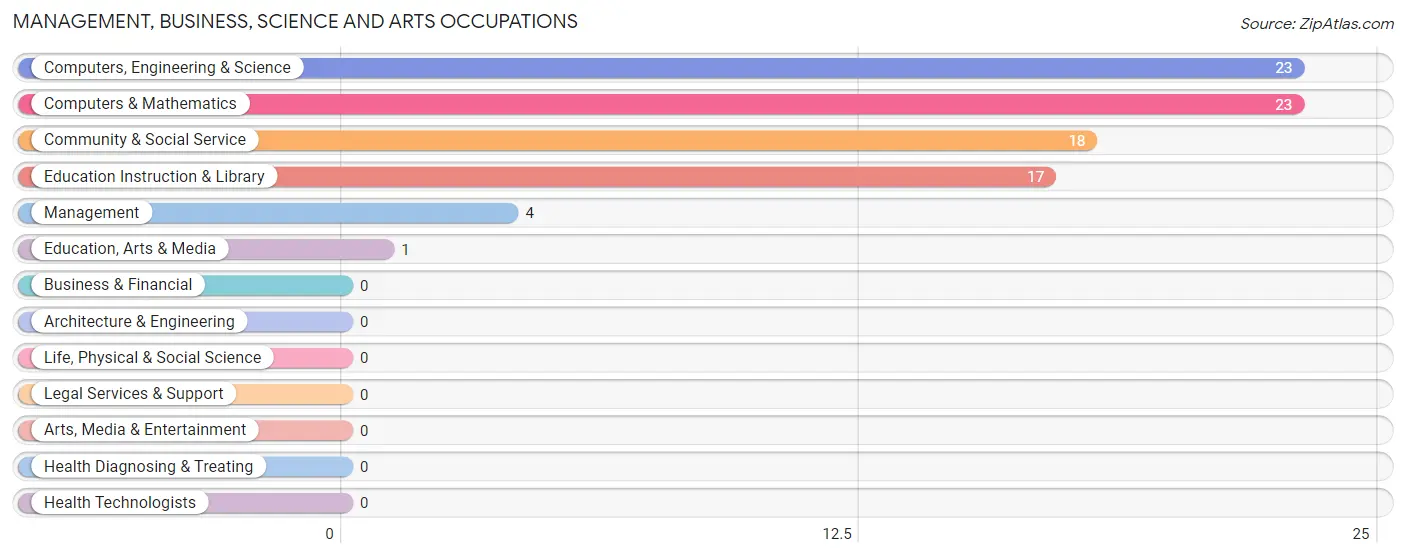
Management, Business, Science and Arts Occupations
The most common Management, Business, Science and Arts occupations in Antreville are Computers, Engineering & Science (23 | 30.3%), Computers & Mathematics (23 | 30.3%), Community & Social Service (18 | 23.7%), Education Instruction & Library (17 | 22.4%), and Management (4 | 5.3%).
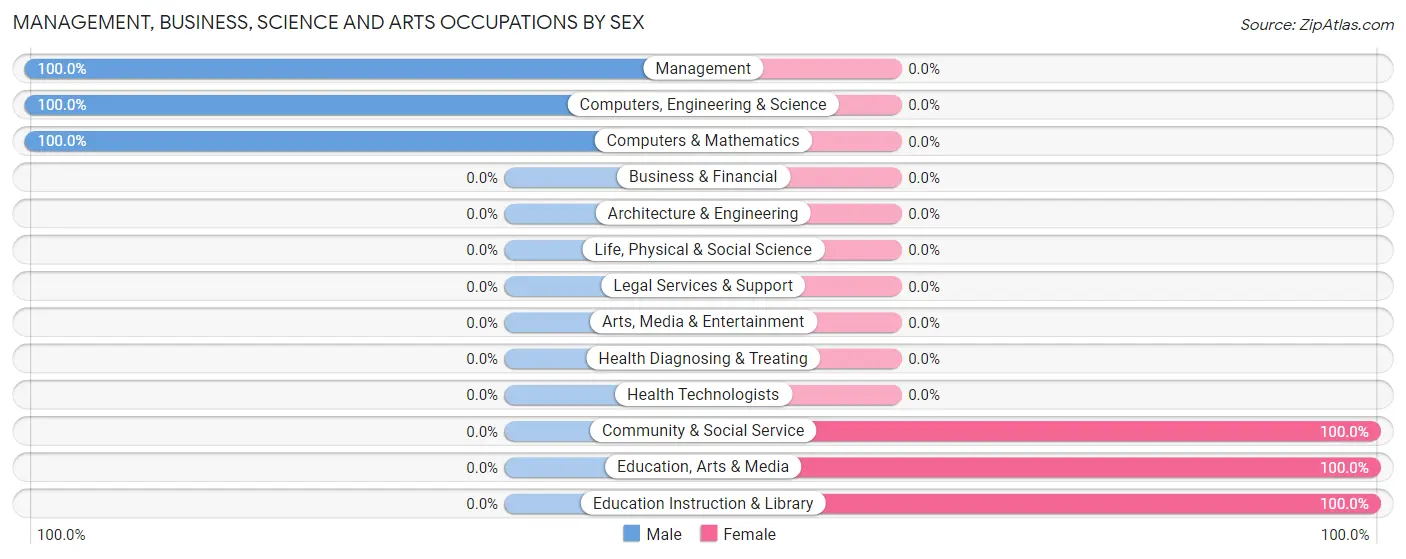
Management, Business, Science and Arts Occupations by Sex
Within the Management, Business, Science and Arts occupations in Antreville, the most male-oriented occupations are Management (100.0%), Computers, Engineering & Science (100.0%), and Computers & Mathematics (100.0%), while the most female-oriented occupations are Community & Social Service (100.0%), Education, Arts & Media (100.0%), and Education Instruction & Library (100.0%).
| Occupation | Male | Female |
| Management | 4 (100.0%) | 0 (0.0%) |
| Business & Financial | 0 (0.0%) | 0 (0.0%) |
| Computers, Engineering & Science | 23 (100.0%) | 0 (0.0%) |
| Computers & Mathematics | 23 (100.0%) | 0 (0.0%) |
| Architecture & Engineering | 0 (0.0%) | 0 (0.0%) |
| Life, Physical & Social Science | 0 (0.0%) | 0 (0.0%) |
| Community & Social Service | 0 (0.0%) | 18 (100.0%) |
| Education, Arts & Media | 0 (0.0%) | 1 (100.0%) |
| Legal Services & Support | 0 (0.0%) | 0 (0.0%) |
| Education Instruction & Library | 0 (0.0%) | 17 (100.0%) |
| Arts, Media & Entertainment | 0 (0.0%) | 0 (0.0%) |
| Health Diagnosing & Treating | 0 (0.0%) | 0 (0.0%) |
| Health Technologists | 0 (0.0%) | 0 (0.0%) |
| Total (Category) | 27 (60.0%) | 18 (40.0%) |
| Total (Overall) | 27 (35.5%) | 49 (64.5%) |
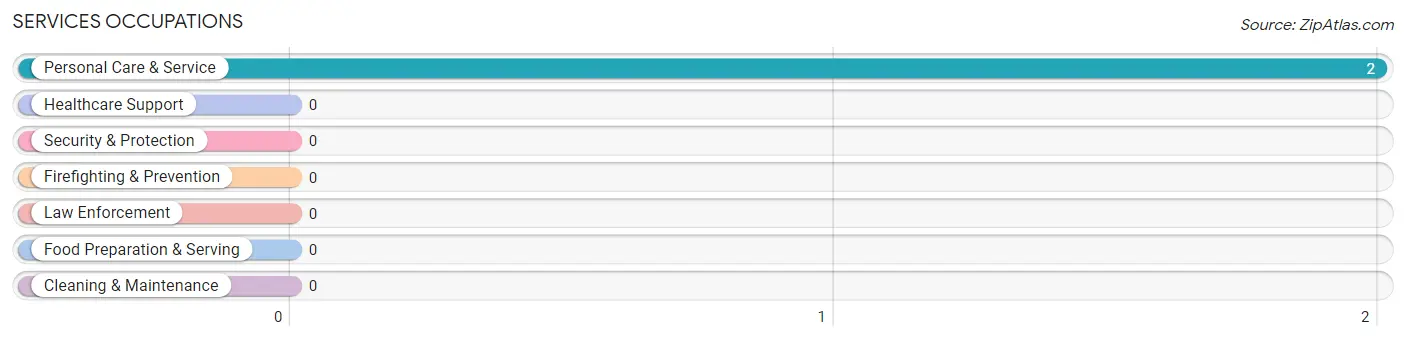
Services Occupations
The most common Services occupations in Antreville are , and Personal Care & Service (2 | 2.6%).
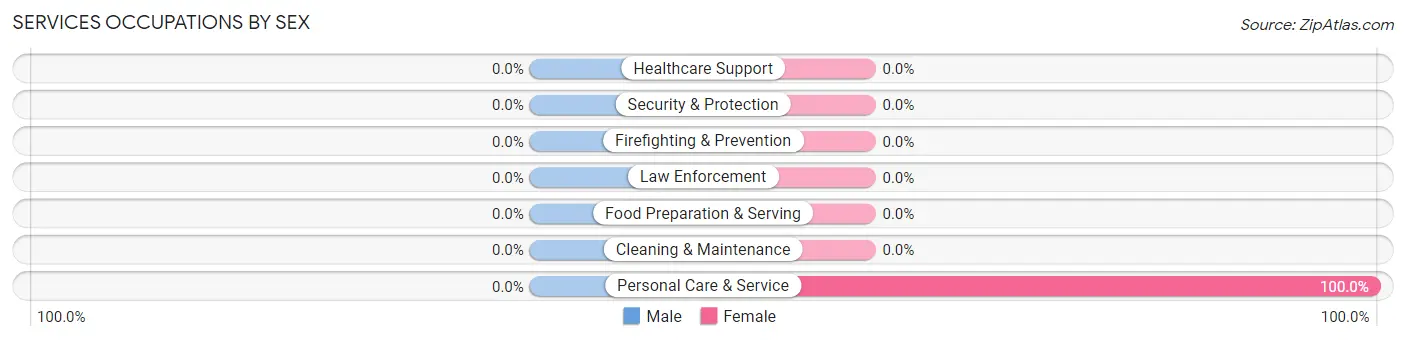
Services Occupations by Sex
| Occupation | Male | Female |
| Healthcare Support | 0 (0.0%) | 0 (0.0%) |
| Security & Protection | 0 (0.0%) | 0 (0.0%) |
| Firefighting & Prevention | 0 (0.0%) | 0 (0.0%) |
| Law Enforcement | 0 (0.0%) | 0 (0.0%) |
| Food Preparation & Serving | 0 (0.0%) | 0 (0.0%) |
| Cleaning & Maintenance | 0 (0.0%) | 0 (0.0%) |
| Personal Care & Service | 0 (0.0%) | 2 (100.0%) |
| Total (Category) | 0 (0.0%) | 2 (100.0%) |
| Total (Overall) | 27 (35.5%) | 49 (64.5%) |
Sales and Office Occupations
The most common Sales and Office occupations in Antreville are , and Sales & Related (29 | 38.2%).
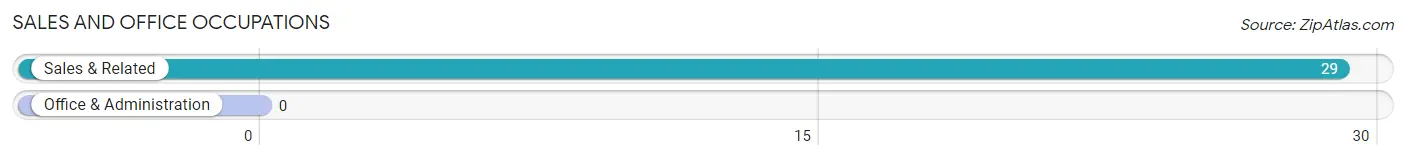
Sales and Office Occupations by Sex
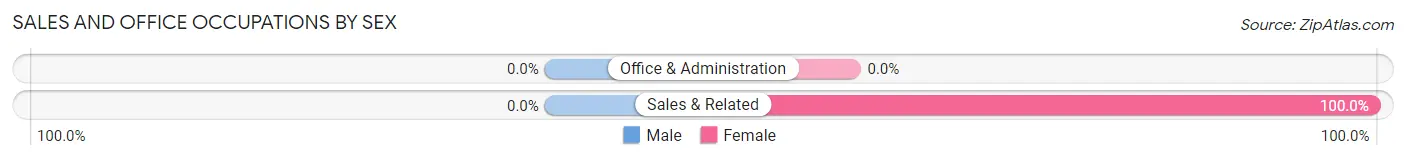
| Occupation | Male | Female |
| Sales & Related | 0 (0.0%) | 29 (100.0%) |
| Office & Administration | 0 (0.0%) | 0 (0.0%) |
| Total (Category) | 0 (0.0%) | 29 (100.0%) |
| Total (Overall) | 27 (35.5%) | 49 (64.5%) |
Natural Resources, Construction and Maintenance Occupations
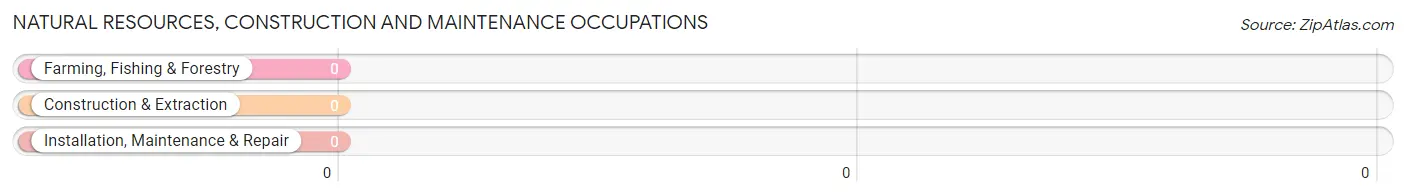
Natural Resources, Construction and Maintenance Occupations by Sex
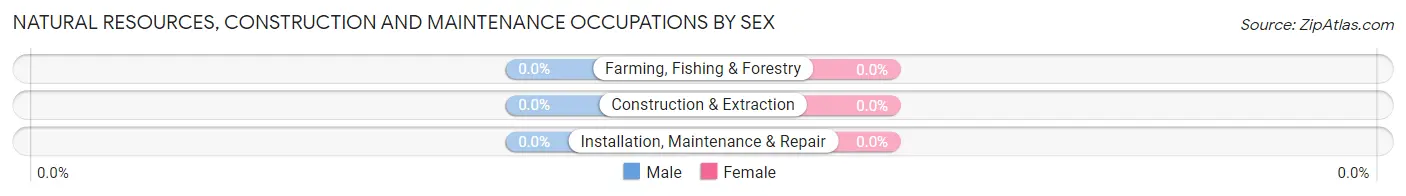
| Occupation | Male | Female |
| Farming, Fishing & Forestry | 0 (0.0%) | 0 (0.0%) |
| Construction & Extraction | 0 (0.0%) | 0 (0.0%) |
| Installation, Maintenance & Repair | 0 (0.0%) | 0 (0.0%) |
| Total (Category) | 0 (0.0%) | 0 (0.0%) |
| Total (Overall) | 27 (35.5%) | 49 (64.5%) |
Production, Transportation and Moving Occupations
Production, Transportation and Moving Occupations by Sex
| Occupation | Male | Female |
| Production | 0 (0.0%) | 0 (0.0%) |
| Transportation | 0 (0.0%) | 0 (0.0%) |
| Material Moving | 0 (0.0%) | 0 (0.0%) |
| Total (Category) | 0 (0.0%) | 0 (0.0%) |
| Total (Overall) | 27 (35.5%) | 49 (64.5%) |
Employment Industries by Sex in Antreville
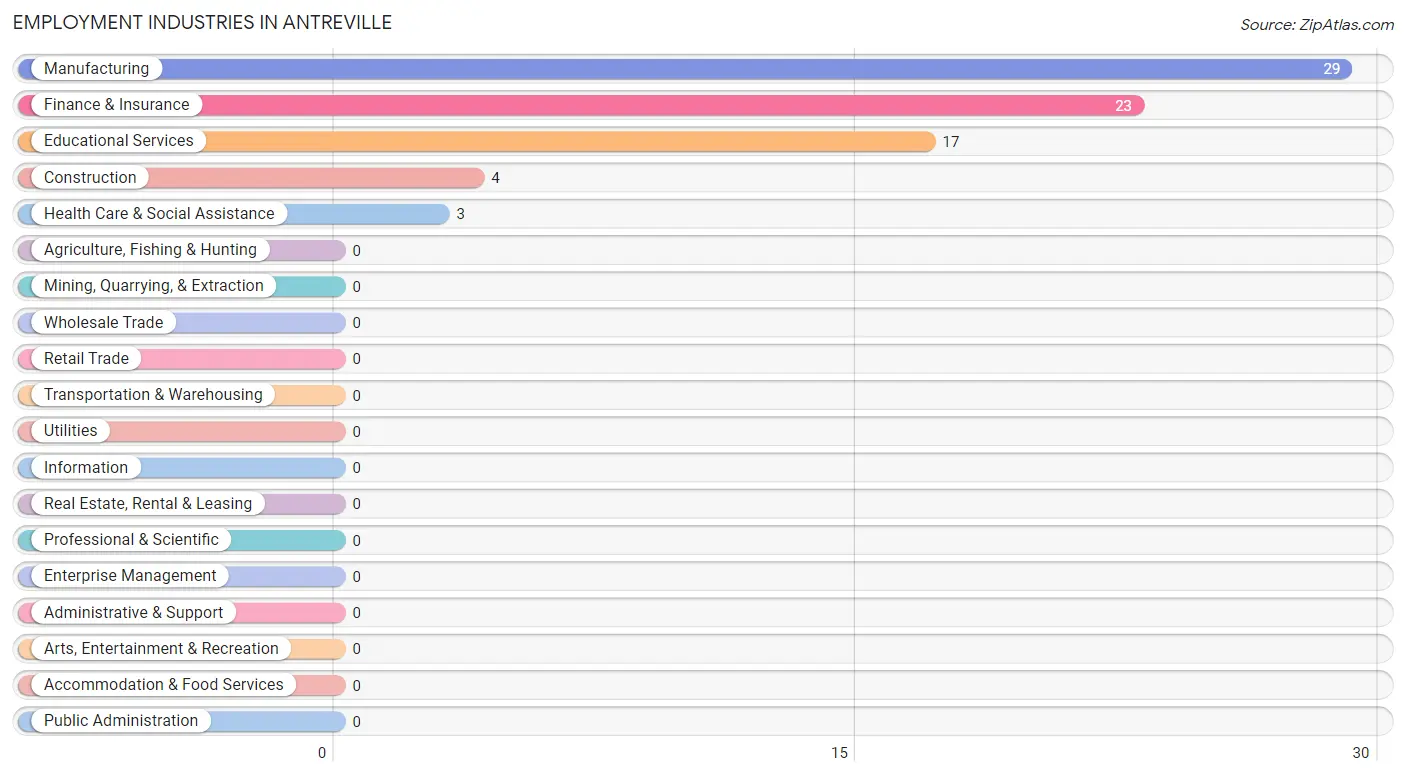
Employment Industries in Antreville
The major employment industries in Antreville include Manufacturing (29 | 38.2%), Finance & Insurance (23 | 30.3%), Educational Services (17 | 22.4%), Construction (4 | 5.3%), and Health Care & Social Assistance (3 | 4.0%).
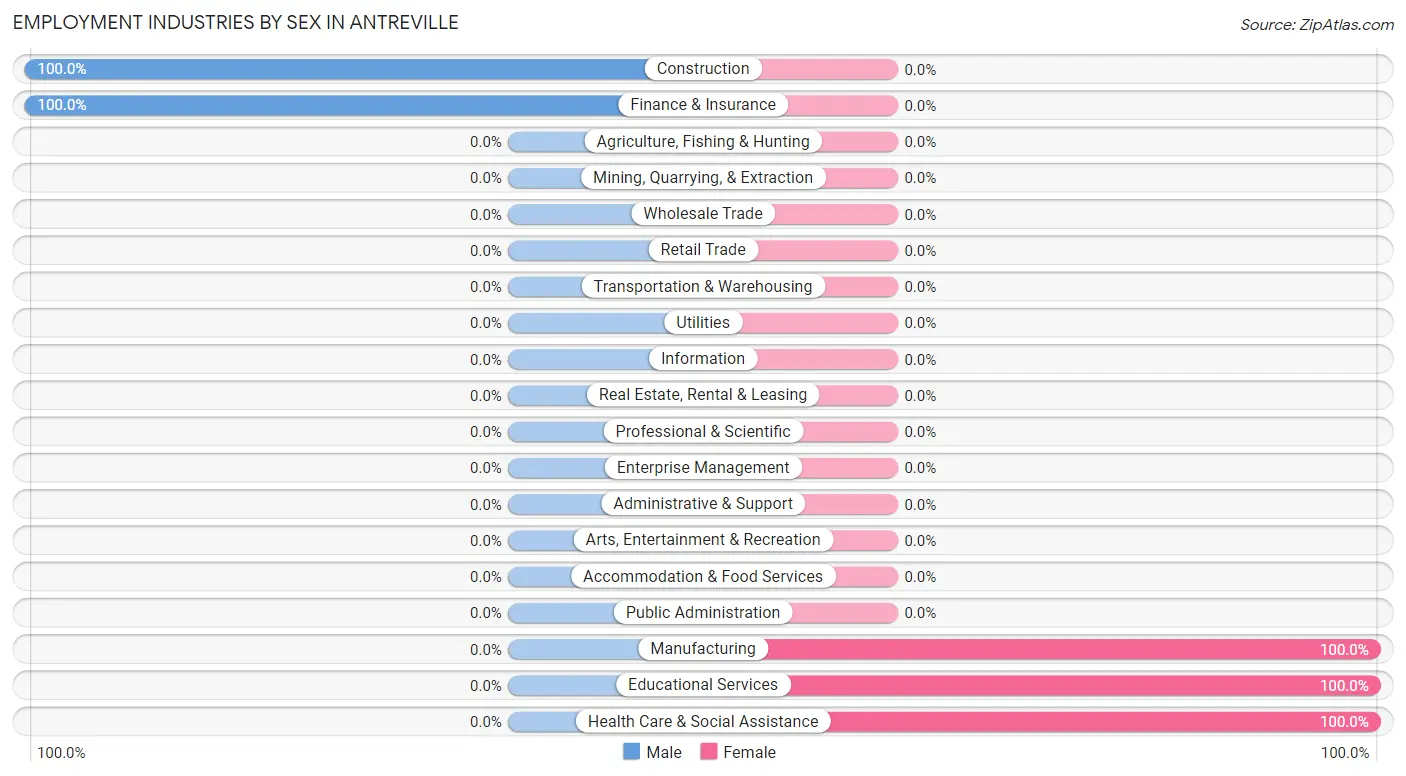
Employment Industries by Sex in Antreville
The Antreville industries that see more men than women are Construction (100.0%), and Finance & Insurance (100.0%), whereas the industries that tend to have a higher number of women are Manufacturing (100.0%), Educational Services (100.0%), and Health Care & Social Assistance (100.0%).
| Industry | Male | Female |
| Agriculture, Fishing & Hunting | 0 (0.0%) | 0 (0.0%) |
| Mining, Quarrying, & Extraction | 0 (0.0%) | 0 (0.0%) |
| Construction | 4 (100.0%) | 0 (0.0%) |
| Manufacturing | 0 (0.0%) | 29 (100.0%) |
| Wholesale Trade | 0 (0.0%) | 0 (0.0%) |
| Retail Trade | 0 (0.0%) | 0 (0.0%) |
| Transportation & Warehousing | 0 (0.0%) | 0 (0.0%) |
| Utilities | 0 (0.0%) | 0 (0.0%) |
| Information | 0 (0.0%) | 0 (0.0%) |
| Finance & Insurance | 23 (100.0%) | 0 (0.0%) |
| Real Estate, Rental & Leasing | 0 (0.0%) | 0 (0.0%) |
| Professional & Scientific | 0 (0.0%) | 0 (0.0%) |
| Enterprise Management | 0 (0.0%) | 0 (0.0%) |
| Administrative & Support | 0 (0.0%) | 0 (0.0%) |
| Educational Services | 0 (0.0%) | 17 (100.0%) |
| Health Care & Social Assistance | 0 (0.0%) | 3 (100.0%) |
| Arts, Entertainment & Recreation | 0 (0.0%) | 0 (0.0%) |
| Accommodation & Food Services | 0 (0.0%) | 0 (0.0%) |
| Public Administration | 0 (0.0%) | 0 (0.0%) |
| Total | 27 (35.5%) | 49 (64.5%) |
Education in Antreville
School Enrollment in Antreville
The most common levels of schooling among the 52 students in Antreville are high school (30 | 57.7%), middle school (14 | 26.9%), and college / undergraduate (8 | 15.4%).
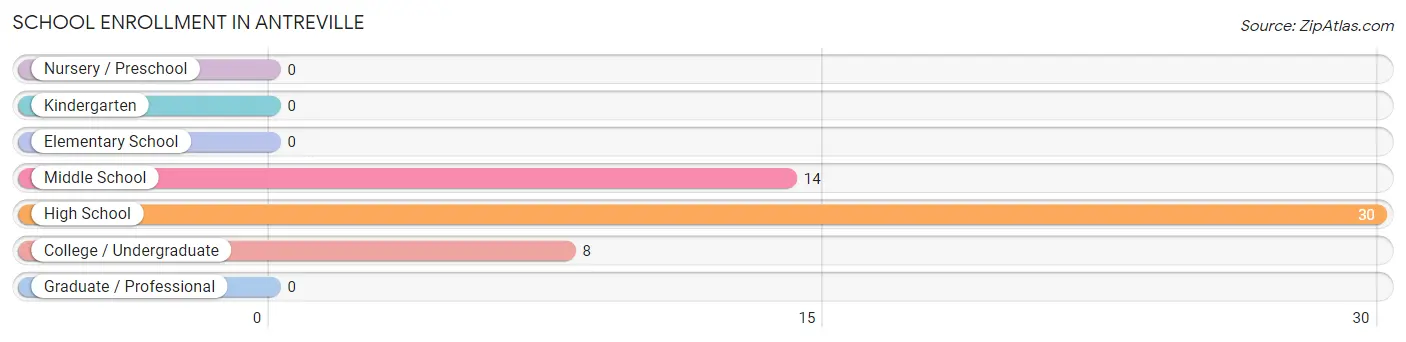
| School Level | # Students | % Students |
| Nursery / Preschool | 0 | 0.0% |
| Kindergarten | 0 | 0.0% |
| Elementary School | 0 | 0.0% |
| Middle School | 14 | 26.9% |
| High School | 30 | 57.7% |
| College / Undergraduate | 8 | 15.4% |
| Graduate / Professional | 0 | 0.0% |
| Total | 52 | 100.0% |
School Enrollment by Age by Funding Source in Antreville
Out of a total of 52 students who are enrolled in schools in Antreville, 8 (15.4%) attend a private institution, while the remaining 44 (84.6%) are enrolled in public schools. The age group of 18 to 19 year olds has the highest likelihood of being enrolled in private schools, with 8 (100.0% in the age bracket) enrolled. Conversely, the age group of 10 to 14 year olds has the lowest likelihood of being enrolled in a private school, with 14 (100.0% in the age bracket) attending a public institution.
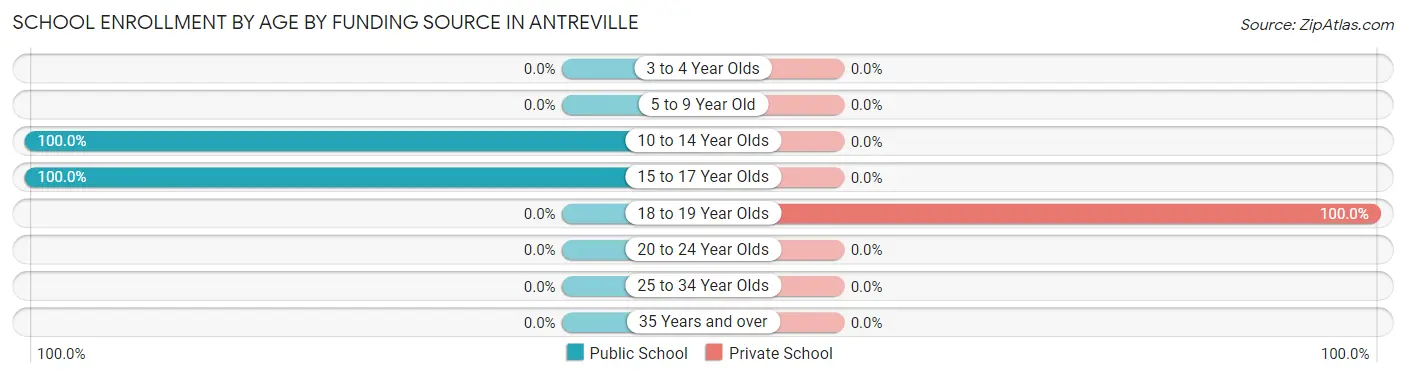
| Age Bracket | Public School | Private School |
| 3 to 4 Year Olds | 0 (0.0%) | 0 (0.0%) |
| 5 to 9 Year Old | 0 (0.0%) | 0 (0.0%) |
| 10 to 14 Year Olds | 14 (100.0%) | 0 (0.0%) |
| 15 to 17 Year Olds | 30 (100.0%) | 0 (0.0%) |
| 18 to 19 Year Olds | 0 (0.0%) | 8 (100.0%) |
| 20 to 24 Year Olds | 0 (0.0%) | 0 (0.0%) |
| 25 to 34 Year Olds | 0 (0.0%) | 0 (0.0%) |
| 35 Years and over | 0 (0.0%) | 0 (0.0%) |
| Total | 44 (84.6%) | 8 (15.4%) |
Educational Attainment by Field of Study in Antreville
Psychology (17 | 46.0%), liberal arts & history (11 | 29.7%), science & technology (8 | 21.6%), and social sciences (1 | 2.7%) are the most common fields of study among 37 individuals in Antreville who have obtained a bachelor's degree or higher.
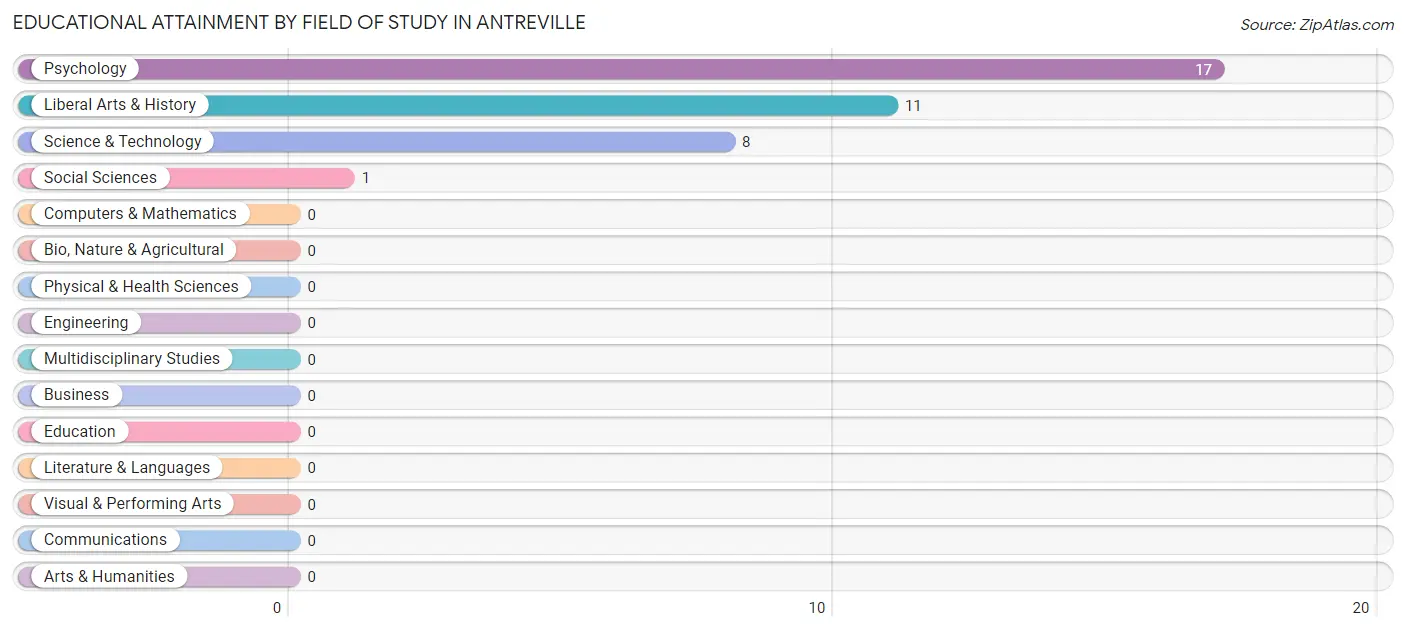
| Field of Study | # Graduates | % Graduates |
| Computers & Mathematics | 0 | 0.0% |
| Bio, Nature & Agricultural | 0 | 0.0% |
| Physical & Health Sciences | 0 | 0.0% |
| Psychology | 17 | 46.0% |
| Social Sciences | 1 | 2.7% |
| Engineering | 0 | 0.0% |
| Multidisciplinary Studies | 0 | 0.0% |
| Science & Technology | 8 | 21.6% |
| Business | 0 | 0.0% |
| Education | 0 | 0.0% |
| Literature & Languages | 0 | 0.0% |
| Liberal Arts & History | 11 | 29.7% |
| Visual & Performing Arts | 0 | 0.0% |
| Communications | 0 | 0.0% |
| Arts & Humanities | 0 | 0.0% |
| Total | 37 | 100.0% |
Transportation & Commute in Antreville
Vehicle Availability by Sex in Antreville
The most prevalent vehicle ownership categories in Antreville are males with 2 vehicles (23, accounting for 85.2%) and females with 2 vehicles (46, making up 50.0%).
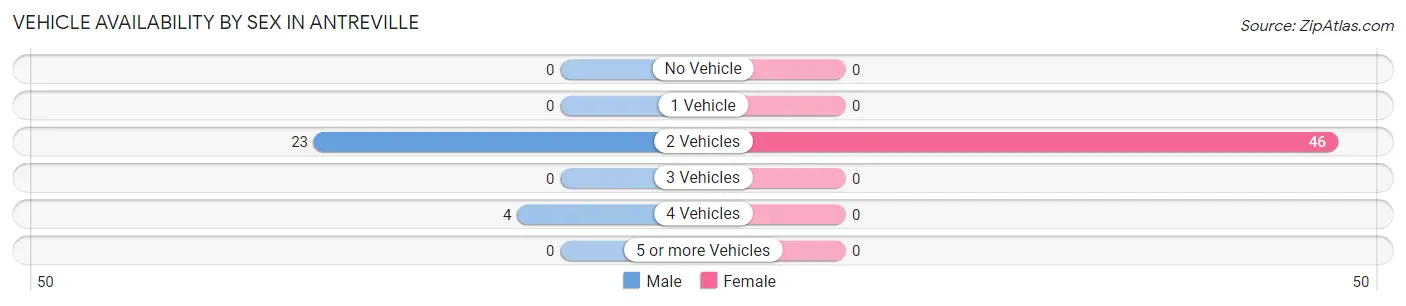
| Vehicles Available | Male | Female |
| No Vehicle | 0 (0.0%) | 0 (0.0%) |
| 1 Vehicle | 0 (0.0%) | 0 (0.0%) |
| 2 Vehicles | 23 (85.2%) | 46 (100.0%) |
| 3 Vehicles | 0 (0.0%) | 0 (0.0%) |
| 4 Vehicles | 4 (14.8%) | 0 (0.0%) |
| 5 or more Vehicles | 0 (0.0%) | 0 (0.0%) |
| Total | 27 (100.0%) | 46 (100.0%) |
Commute Time in Antreville
The most frequently occuring commute durations in Antreville are 25 to 29 minutes (46 commuters, 60.5%), less than 5 minutes (25 commuters, 32.9%), and 35 to 39 minutes (4 commuters, 5.3%).
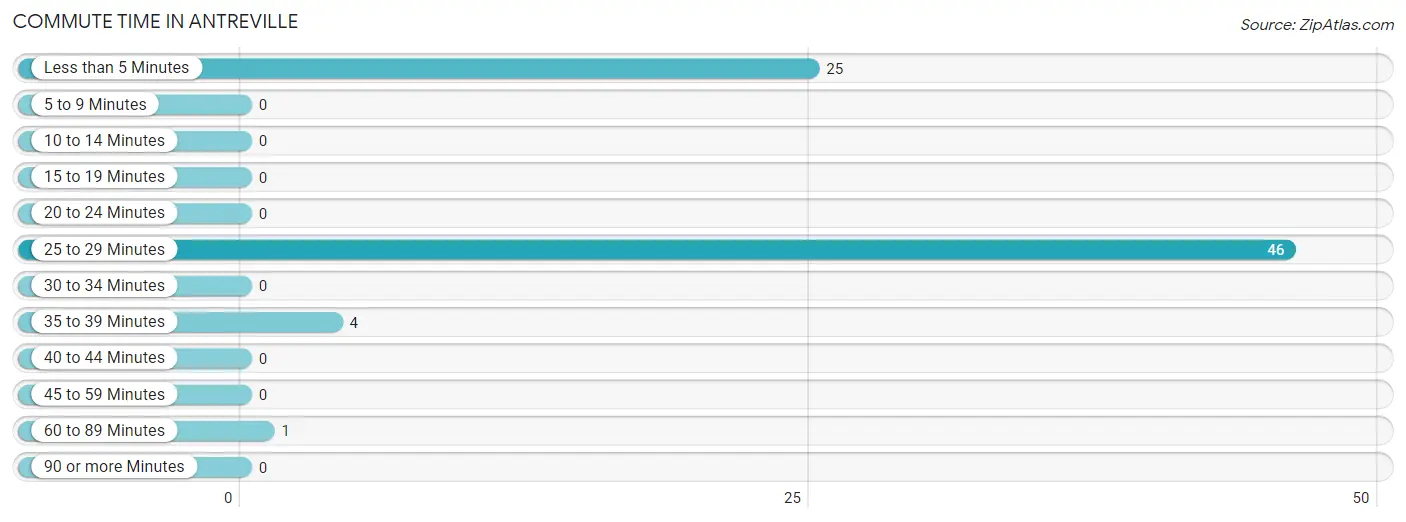
| Commute Time | # Commuters | % Commuters |
| Less than 5 Minutes | 25 | 32.9% |
| 5 to 9 Minutes | 0 | 0.0% |
| 10 to 14 Minutes | 0 | 0.0% |
| 15 to 19 Minutes | 0 | 0.0% |
| 20 to 24 Minutes | 0 | 0.0% |
| 25 to 29 Minutes | 46 | 60.5% |
| 30 to 34 Minutes | 0 | 0.0% |
| 35 to 39 Minutes | 4 | 5.3% |
| 40 to 44 Minutes | 0 | 0.0% |
| 45 to 59 Minutes | 0 | 0.0% |
| 60 to 89 Minutes | 1 | 1.3% |
| 90 or more Minutes | 0 | 0.0% |
Commute Time by Sex in Antreville
The most common commute times in Antreville are less than 5 minutes (23 commuters, 85.2%) for males and 25 to 29 minutes (46 commuters, 93.9%) for females.
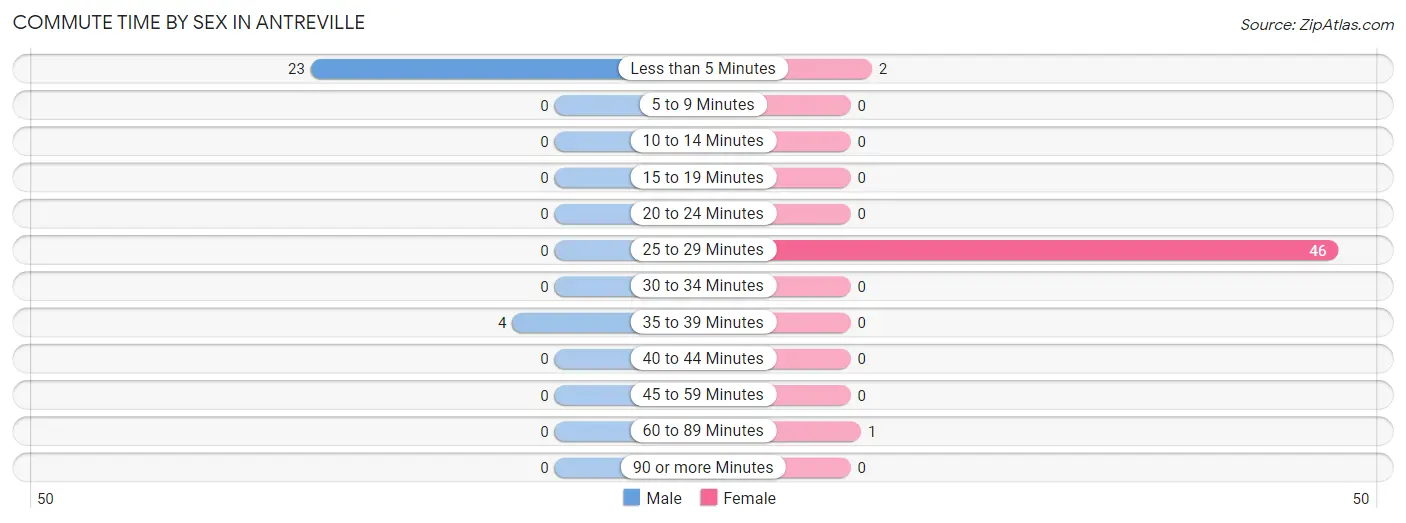
| Commute Time | Male | Female |
| Less than 5 Minutes | 23 (85.2%) | 2 (4.1%) |
| 5 to 9 Minutes | 0 (0.0%) | 0 (0.0%) |
| 10 to 14 Minutes | 0 (0.0%) | 0 (0.0%) |
| 15 to 19 Minutes | 0 (0.0%) | 0 (0.0%) |
| 20 to 24 Minutes | 0 (0.0%) | 0 (0.0%) |
| 25 to 29 Minutes | 0 (0.0%) | 46 (93.9%) |
| 30 to 34 Minutes | 0 (0.0%) | 0 (0.0%) |
| 35 to 39 Minutes | 4 (14.8%) | 0 (0.0%) |
| 40 to 44 Minutes | 0 (0.0%) | 0 (0.0%) |
| 45 to 59 Minutes | 0 (0.0%) | 0 (0.0%) |
| 60 to 89 Minutes | 0 (0.0%) | 1 (2.0%) |
| 90 or more Minutes | 0 (0.0%) | 0 (0.0%) |
Time of Departure to Work by Sex in Antreville
The most frequent times of departure to work in Antreville are 8:30 AM to 8:59 AM (23, 85.2%) for males and 7:30 AM to 7:59 AM (29, 59.2%) for females.
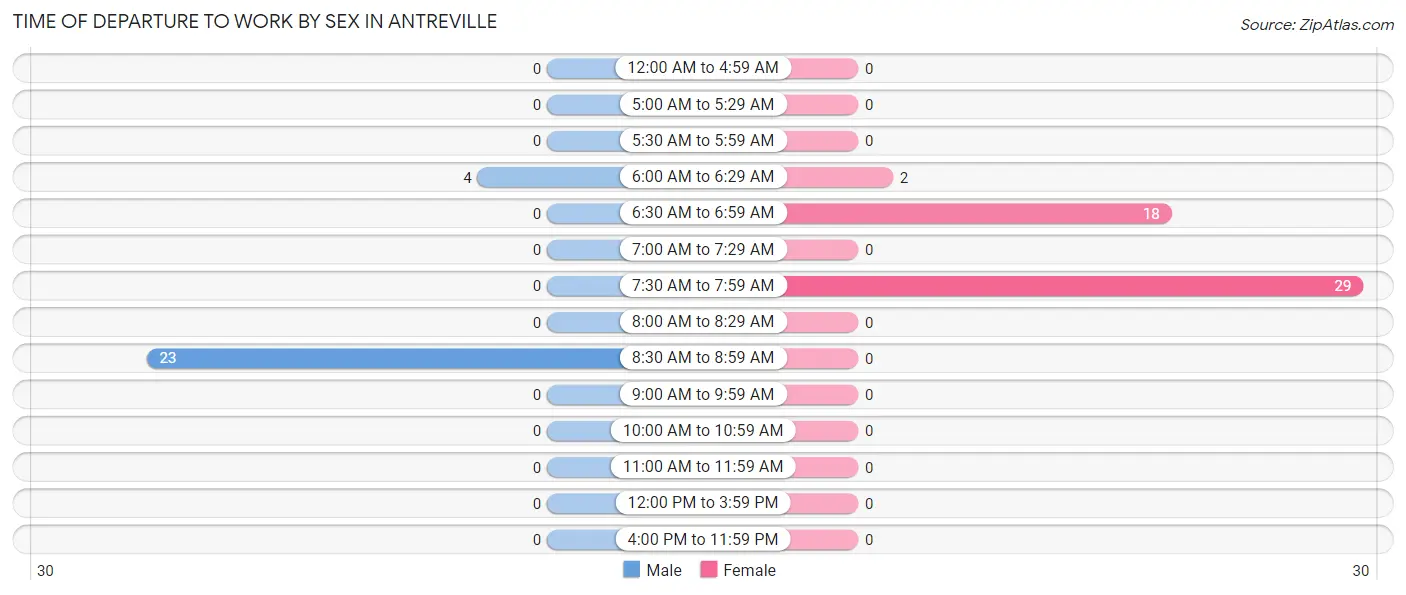
| Time of Departure | Male | Female |
| 12:00 AM to 4:59 AM | 0 (0.0%) | 0 (0.0%) |
| 5:00 AM to 5:29 AM | 0 (0.0%) | 0 (0.0%) |
| 5:30 AM to 5:59 AM | 0 (0.0%) | 0 (0.0%) |
| 6:00 AM to 6:29 AM | 4 (14.8%) | 2 (4.1%) |
| 6:30 AM to 6:59 AM | 0 (0.0%) | 18 (36.7%) |
| 7:00 AM to 7:29 AM | 0 (0.0%) | 0 (0.0%) |
| 7:30 AM to 7:59 AM | 0 (0.0%) | 29 (59.2%) |
| 8:00 AM to 8:29 AM | 0 (0.0%) | 0 (0.0%) |
| 8:30 AM to 8:59 AM | 23 (85.2%) | 0 (0.0%) |
| 9:00 AM to 9:59 AM | 0 (0.0%) | 0 (0.0%) |
| 10:00 AM to 10:59 AM | 0 (0.0%) | 0 (0.0%) |
| 11:00 AM to 11:59 AM | 0 (0.0%) | 0 (0.0%) |
| 12:00 PM to 3:59 PM | 0 (0.0%) | 0 (0.0%) |
| 4:00 PM to 11:59 PM | 0 (0.0%) | 0 (0.0%) |
| Total | 27 (100.0%) | 49 (100.0%) |
Housing Occupancy in Antreville
Occupancy by Ownership in Antreville
Of the total 96 dwellings in Antreville, owner-occupied units account for 96 (100.0%), while renter-occupied units make up 0 (0.0%).
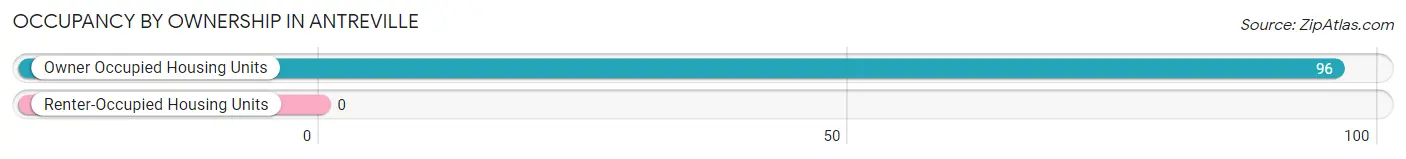
| Occupancy | # Housing Units | % Housing Units |
| Owner Occupied Housing Units | 96 | 100.0% |
| Renter-Occupied Housing Units | 0 | 0.0% |
| Total Occupied Housing Units | 96 | 100.0% |
Occupancy by Household Size in Antreville
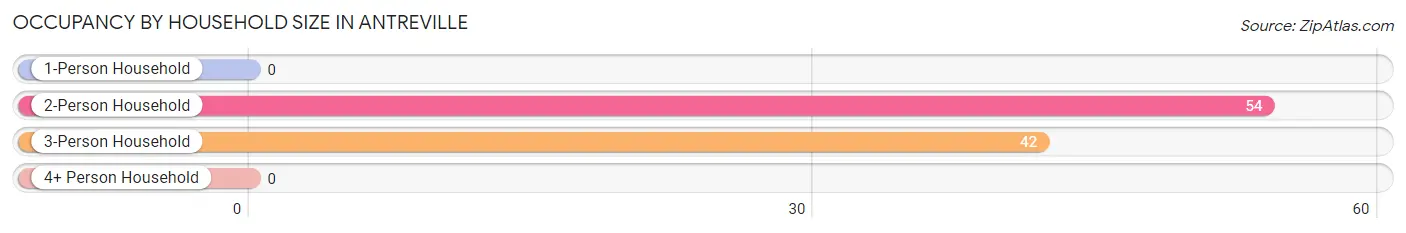
| Household Size | # Housing Units | % Housing Units |
| 1-Person Household | 0 | 0.0% |
| 2-Person Household | 54 | 56.2% |
| 3-Person Household | 42 | 43.8% |
| 4+ Person Household | 0 | 0.0% |
| Total Housing Units | 96 | 100.0% |
Occupancy by Ownership by Household Size in Antreville
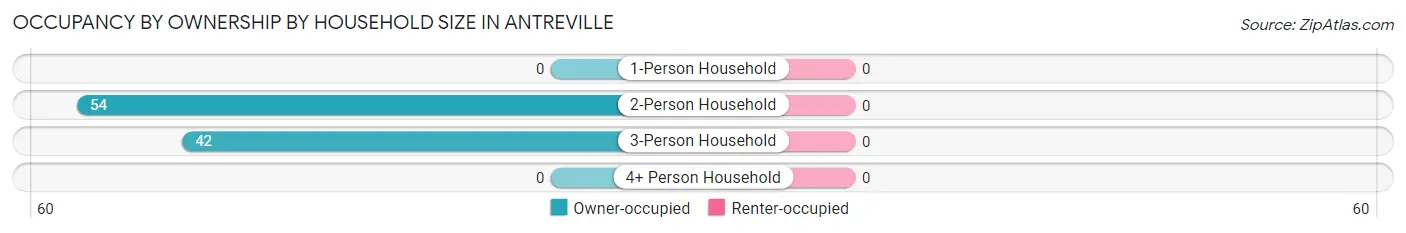
| Household Size | Owner-occupied | Renter-occupied |
| 1-Person Household | 0 (0.0%) | 0 (0.0%) |
| 2-Person Household | 54 (100.0%) | 0 (0.0%) |
| 3-Person Household | 42 (100.0%) | 0 (0.0%) |
| 4+ Person Household | 0 (0.0%) | 0 (0.0%) |
| Total Housing Units | 96 (100.0%) | 0 (0.0%) |
Occupancy by Educational Attainment in Antreville
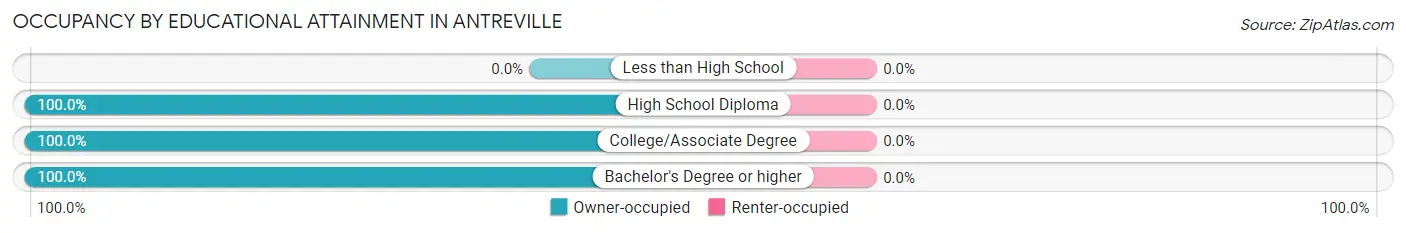
| Household Size | Owner-occupied | Renter-occupied |
| Less than High School | 0 (0.0%) | 0 (0.0%) |
| High School Diploma | 32 (100.0%) | 0 (0.0%) |
| College/Associate Degree | 39 (100.0%) | 0 (0.0%) |
| Bachelor's Degree or higher | 25 (100.0%) | 0 (0.0%) |
Occupancy by Age of Householder in Antreville
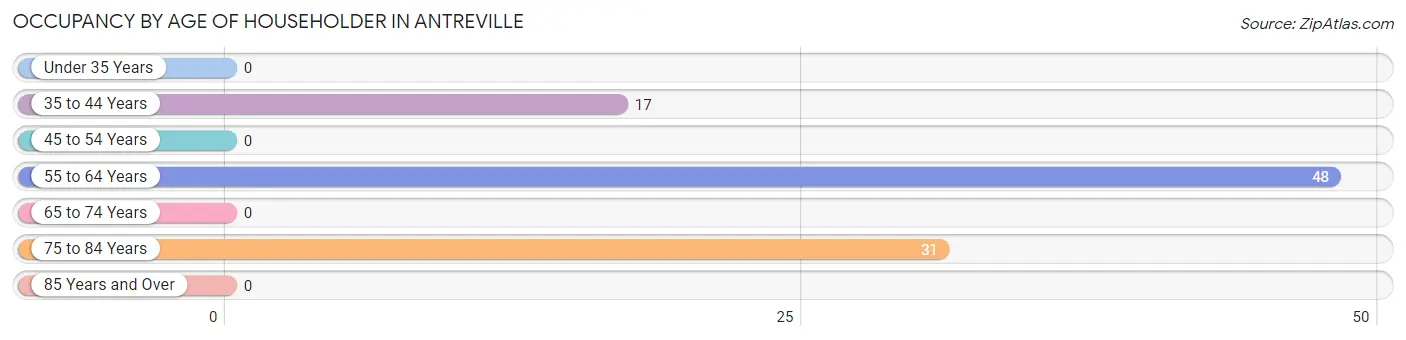
| Age Bracket | # Households | % Households |
| Under 35 Years | 0 | 0.0% |
| 35 to 44 Years | 17 | 17.7% |
| 45 to 54 Years | 0 | 0.0% |
| 55 to 64 Years | 48 | 50.0% |
| 65 to 74 Years | 0 | 0.0% |
| 75 to 84 Years | 31 | 32.3% |
| 85 Years and Over | 0 | 0.0% |
| Total | 96 | 100.0% |
Housing Finances in Antreville
Median Income by Occupancy in Antreville
| Occupancy Type | # Households | Median Income |
| Owner-Occupied | 96 (100.0%) | $0 |
| Renter-Occupied | 0 (0.0%) | $0 |
| Average | 96 (100.0%) | $0 |
Occupancy by Householder Income Bracket in Antreville
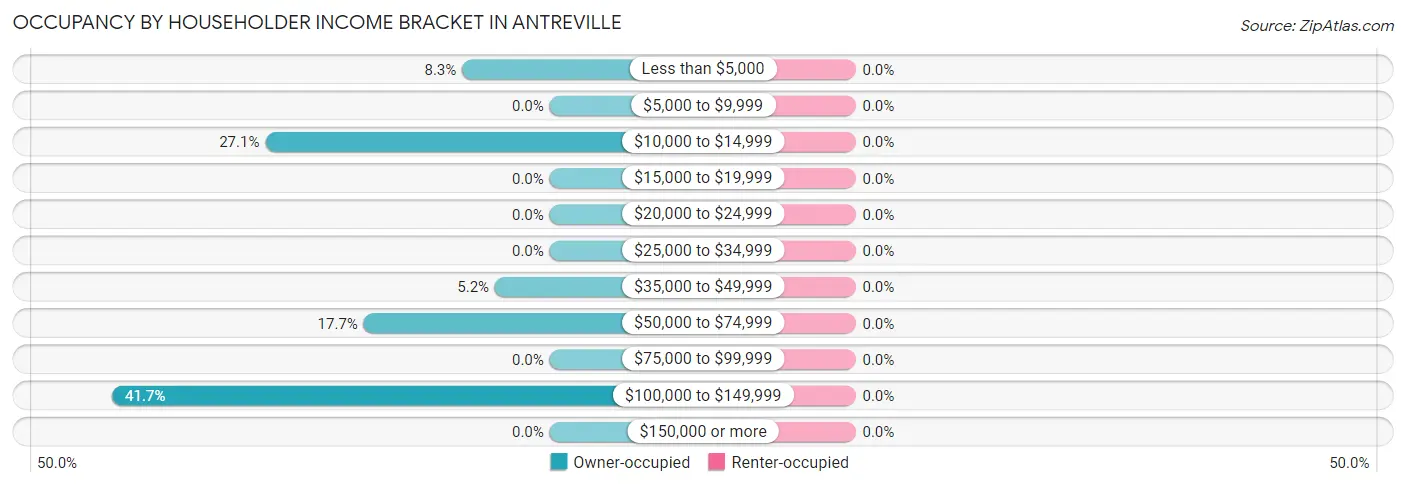
| Income Bracket | Owner-occupied | Renter-occupied |
| Less than $5,000 | 8 (8.3%) | 0 (0.0%) |
| $5,000 to $9,999 | 0 (0.0%) | 0 (0.0%) |
| $10,000 to $14,999 | 26 (27.1%) | 0 (0.0%) |
| $15,000 to $19,999 | 0 (0.0%) | 0 (0.0%) |
| $20,000 to $24,999 | 0 (0.0%) | 0 (0.0%) |
| $25,000 to $34,999 | 0 (0.0%) | 0 (0.0%) |
| $35,000 to $49,999 | 5 (5.2%) | 0 (0.0%) |
| $50,000 to $74,999 | 17 (17.7%) | 0 (0.0%) |
| $75,000 to $99,999 | 0 (0.0%) | 0 (0.0%) |
| $100,000 to $149,999 | 40 (41.7%) | 0 (0.0%) |
| $150,000 or more | 0 (0.0%) | 0 (0.0%) |
| Total | 96 (100.0%) | 0 (0.0%) |
Monthly Housing Cost Tiers in Antreville
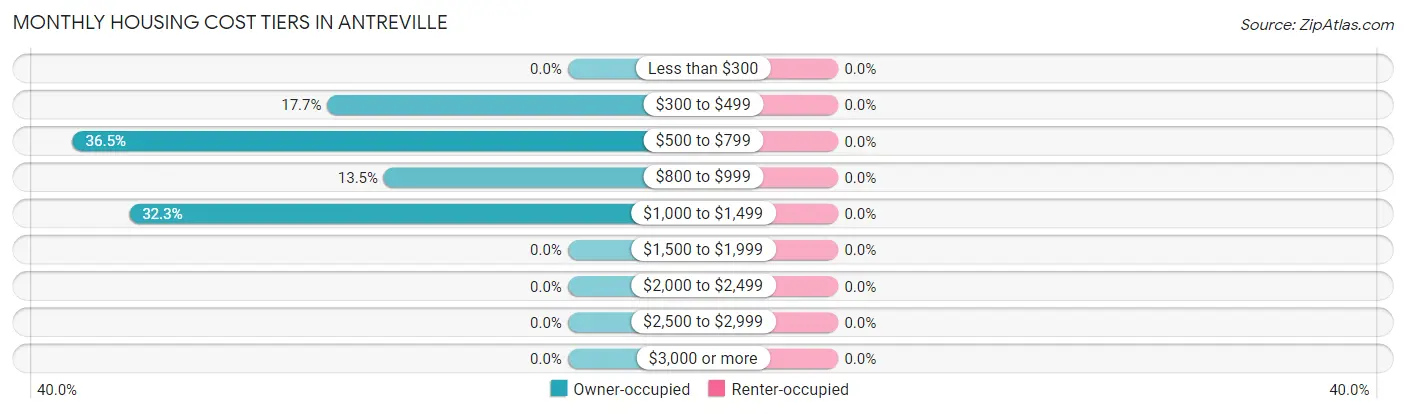
| Monthly Cost | Owner-occupied | Renter-occupied |
| Less than $300 | 0 (0.0%) | 0 (0.0%) |
| $300 to $499 | 17 (17.7%) | 0 (0.0%) |
| $500 to $799 | 35 (36.5%) | 0 (0.0%) |
| $800 to $999 | 13 (13.5%) | 0 (0.0%) |
| $1,000 to $1,499 | 31 (32.3%) | 0 (0.0%) |
| $1,500 to $1,999 | 0 (0.0%) | 0 (0.0%) |
| $2,000 to $2,499 | 0 (0.0%) | 0 (0.0%) |
| $2,500 to $2,999 | 0 (0.0%) | 0 (0.0%) |
| $3,000 or more | 0 (0.0%) | 0 (0.0%) |
| Total | 96 (100.0%) | 0 (0.0%) |
Physical Housing Characteristics in Antreville
Housing Structures in Antreville
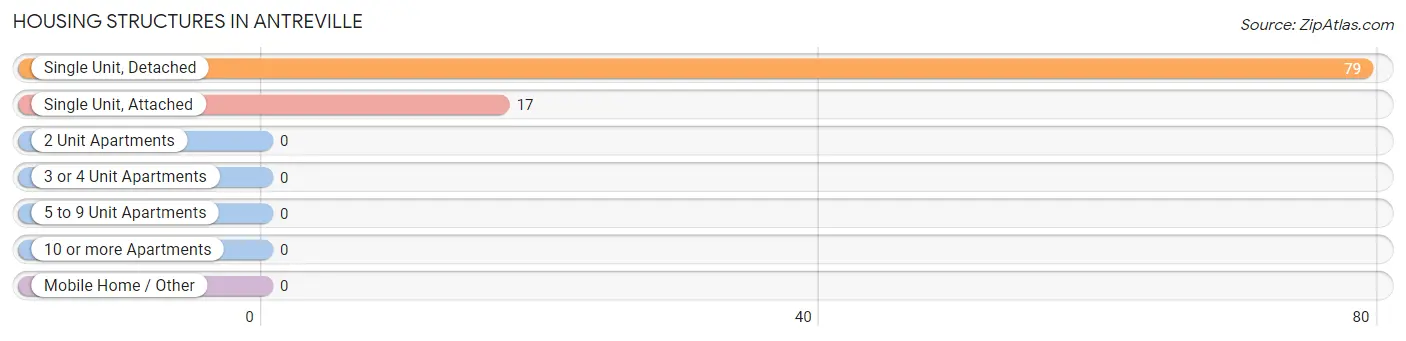
| Structure Type | # Housing Units | % Housing Units |
| Single Unit, Detached | 79 | 82.3% |
| Single Unit, Attached | 17 | 17.7% |
| 2 Unit Apartments | 0 | 0.0% |
| 3 or 4 Unit Apartments | 0 | 0.0% |
| 5 to 9 Unit Apartments | 0 | 0.0% |
| 10 or more Apartments | 0 | 0.0% |
| Mobile Home / Other | 0 | 0.0% |
| Total | 96 | 100.0% |
Housing Structures by Occupancy in Antreville
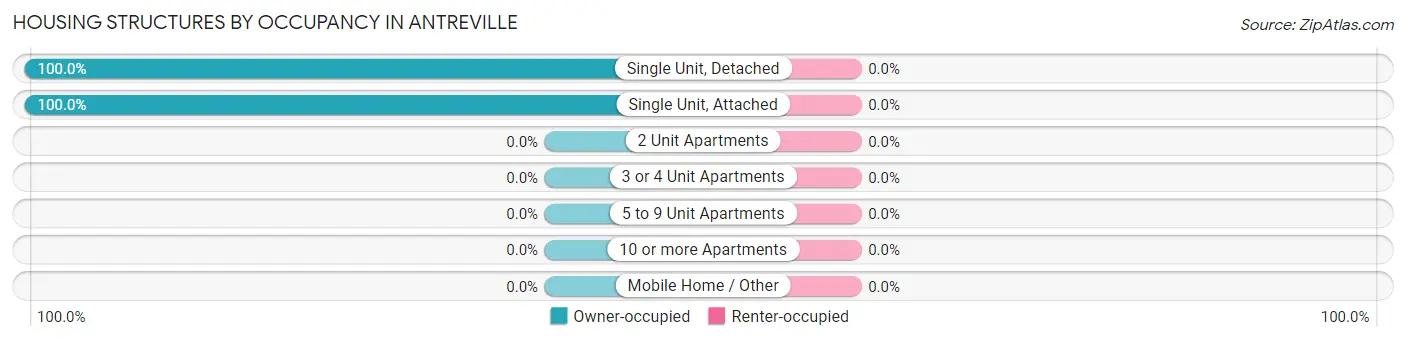
| Structure Type | Owner-occupied | Renter-occupied |
| Single Unit, Detached | 79 (100.0%) | 0 (0.0%) |
| Single Unit, Attached | 17 (100.0%) | 0 (0.0%) |
| 2 Unit Apartments | 0 (0.0%) | 0 (0.0%) |
| 3 or 4 Unit Apartments | 0 (0.0%) | 0 (0.0%) |
| 5 to 9 Unit Apartments | 0 (0.0%) | 0 (0.0%) |
| 10 or more Apartments | 0 (0.0%) | 0 (0.0%) |
| Mobile Home / Other | 0 (0.0%) | 0 (0.0%) |
| Total | 96 (100.0%) | 0 (0.0%) |
Housing Structures by Number of Rooms in Antreville
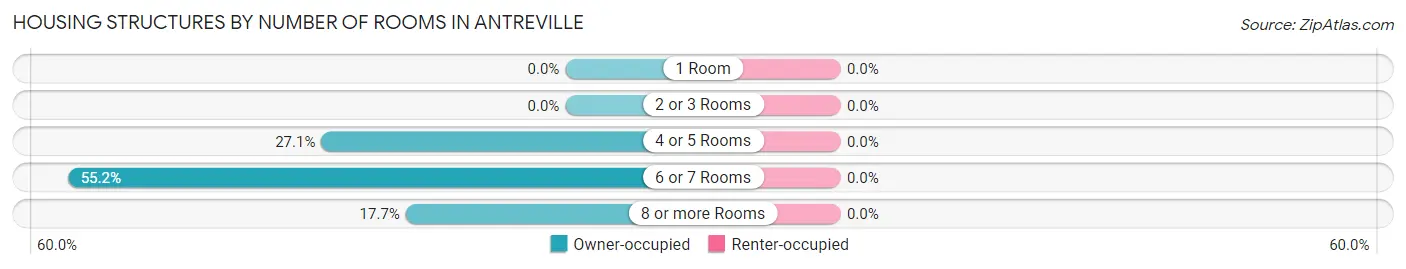
| Number of Rooms | Owner-occupied | Renter-occupied |
| 1 Room | 0 (0.0%) | 0 (0.0%) |
| 2 or 3 Rooms | 0 (0.0%) | 0 (0.0%) |
| 4 or 5 Rooms | 26 (27.1%) | 0 (0.0%) |
| 6 or 7 Rooms | 53 (55.2%) | 0 (0.0%) |
| 8 or more Rooms | 17 (17.7%) | 0 (0.0%) |
| Total | 96 (100.0%) | 0 (0.0%) |
Housing Structure by Heating Type in Antreville
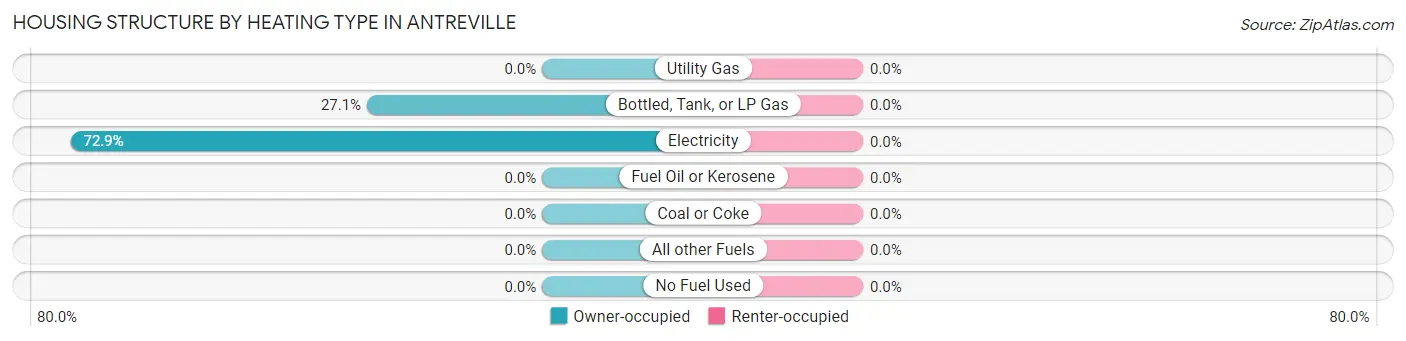
| Heating Type | Owner-occupied | Renter-occupied |
| Utility Gas | 0 (0.0%) | 0 (0.0%) |
| Bottled, Tank, or LP Gas | 26 (27.1%) | 0 (0.0%) |
| Electricity | 70 (72.9%) | 0 (0.0%) |
| Fuel Oil or Kerosene | 0 (0.0%) | 0 (0.0%) |
| Coal or Coke | 0 (0.0%) | 0 (0.0%) |
| All other Fuels | 0 (0.0%) | 0 (0.0%) |
| No Fuel Used | 0 (0.0%) | 0 (0.0%) |
| Total | 96 (100.0%) | 0 (0.0%) |
Household Vehicle Usage in Antreville
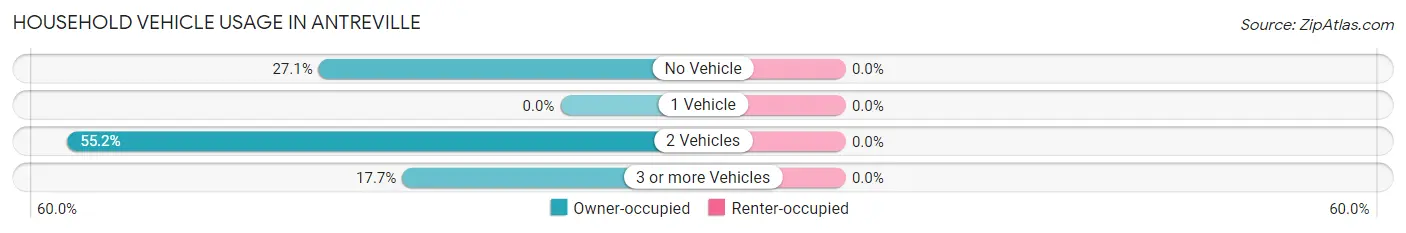
| Vehicles per Household | Owner-occupied | Renter-occupied |
| No Vehicle | 26 (27.1%) | 0 (0.0%) |
| 1 Vehicle | 0 (0.0%) | 0 (0.0%) |
| 2 Vehicles | 53 (55.2%) | 0 (0.0%) |
| 3 or more Vehicles | 17 (17.7%) | 0 (0.0%) |
| Total | 96 (100.0%) | 0 (0.0%) |
Real Estate & Mortgages in Antreville
Real Estate and Mortgage Overview in Antreville
| Characteristic | Without Mortgage | With Mortgage |
| Housing Units | 73 | 23 |
| Median Property Value | - | - |
| Median Household Income | - | - |
| Monthly Housing Costs | $565 | $0 |
| Real Estate Taxes | - | - |
Property Value by Mortgage Status in Antreville
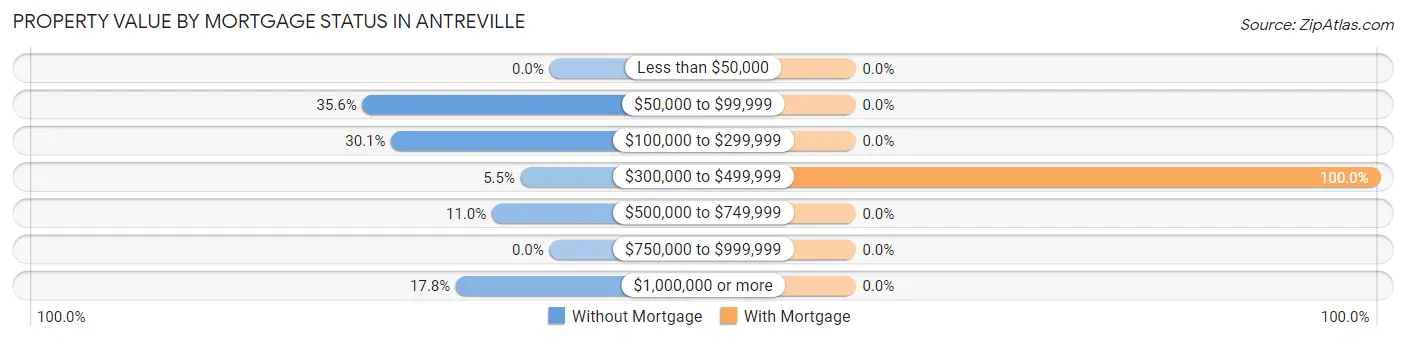
| Property Value | Without Mortgage | With Mortgage |
| Less than $50,000 | 0 (0.0%) | 0 (0.0%) |
| $50,000 to $99,999 | 26 (35.6%) | 0 (0.0%) |
| $100,000 to $299,999 | 22 (30.1%) | 0 (0.0%) |
| $300,000 to $499,999 | 4 (5.5%) | 23 (100.0%) |
| $500,000 to $749,999 | 8 (11.0%) | 0 (0.0%) |
| $750,000 to $999,999 | 0 (0.0%) | 0 (0.0%) |
| $1,000,000 or more | 13 (17.8%) | 0 (0.0%) |
| Total | 73 (100.0%) | 23 (100.0%) |
Household Income by Mortgage Status in Antreville
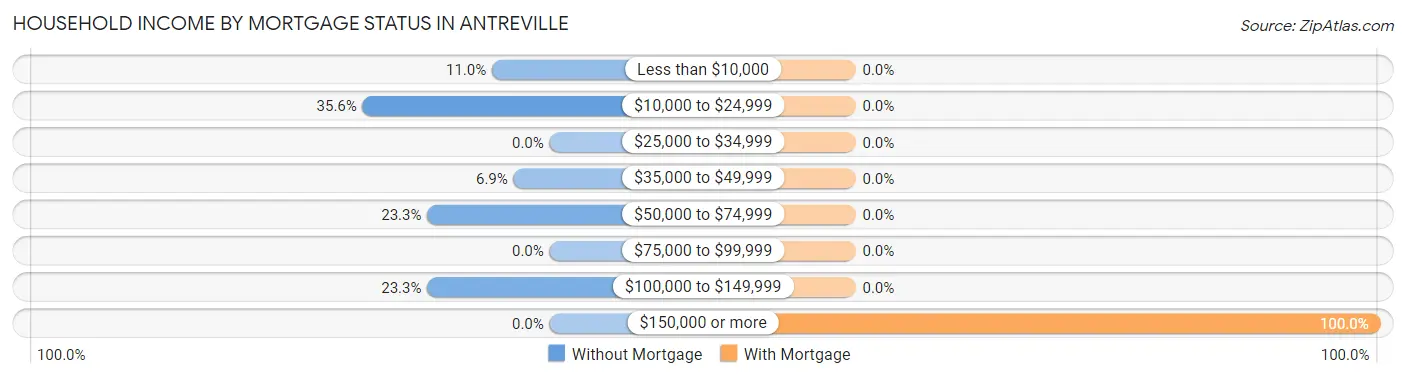
| Household Income | Without Mortgage | With Mortgage |
| Less than $10,000 | 8 (11.0%) | 0 (0.0%) |
| $10,000 to $24,999 | 26 (35.6%) | 0 (0.0%) |
| $25,000 to $34,999 | 0 (0.0%) | 0 (0.0%) |
| $35,000 to $49,999 | 5 (6.9%) | 0 (0.0%) |
| $50,000 to $74,999 | 17 (23.3%) | 0 (0.0%) |
| $75,000 to $99,999 | 0 (0.0%) | 0 (0.0%) |
| $100,000 to $149,999 | 17 (23.3%) | 0 (0.0%) |
| $150,000 or more | 0 (0.0%) | 23 (100.0%) |
| Total | 73 (100.0%) | 23 (100.0%) |
Property Value to Household Income Ratio in Antreville
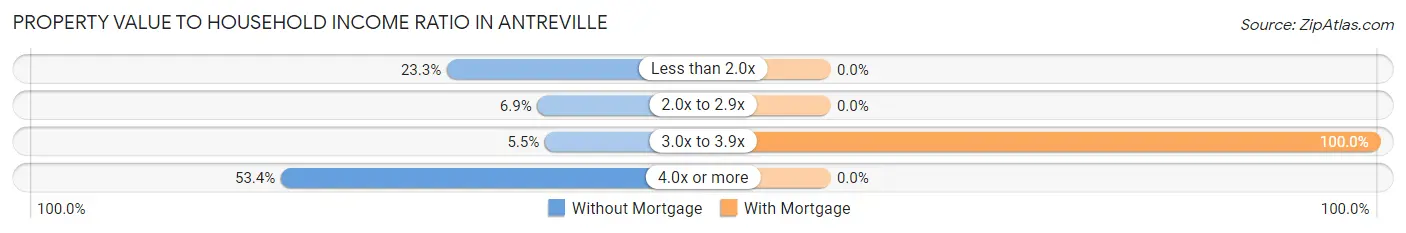
| Value-to-Income Ratio | Without Mortgage | With Mortgage |
| Less than 2.0x | 17 (23.3%) | 0 (0.0%) |
| 2.0x to 2.9x | 5 (6.9%) | 0 (0.0%) |
| 3.0x to 3.9x | 4 (5.5%) | 23 (100.0%) |
| 4.0x or more | 39 (53.4%) | 0 (0.0%) |
| Total | 73 (100.0%) | 23 (100.0%) |
Real Estate Taxes by Mortgage Status in Antreville
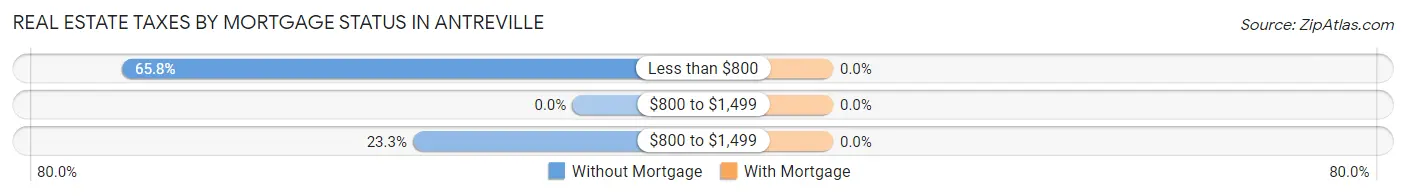
| Property Taxes | Without Mortgage | With Mortgage |
| Less than $800 | 48 (65.7%) | 0 (0.0%) |
| $800 to $1,499 | 0 (0.0%) | 0 (0.0%) |
| $800 to $1,499 | 17 (23.3%) | 0 (0.0%) |
| Total | 73 (100.0%) | 23 (100.0%) |
Health & Disability in Antreville
Health Insurance Coverage by Age in Antreville
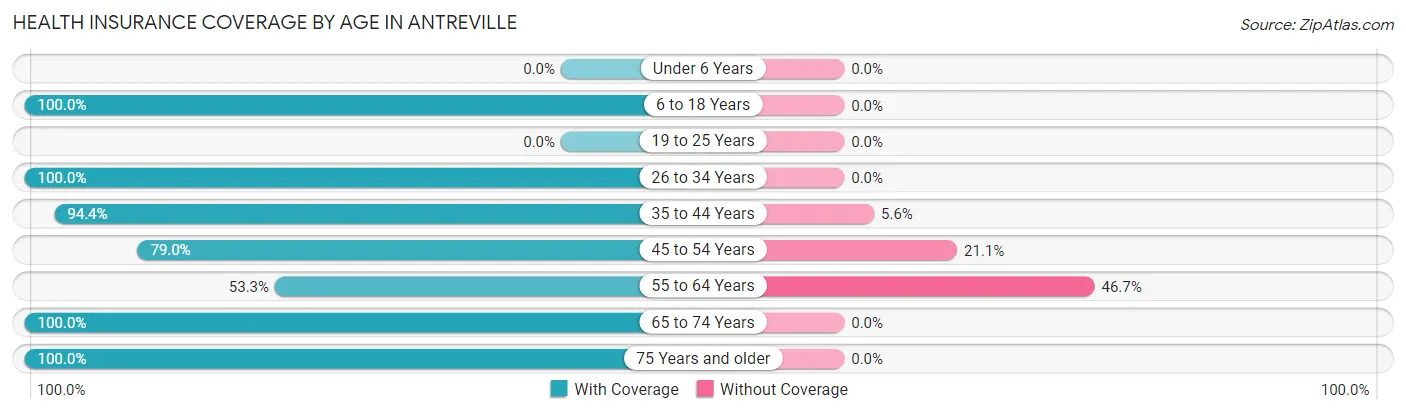
| Age Bracket | With Coverage | Without Coverage |
| Under 6 Years | 0 (0.0%) | 0 (0.0%) |
| 6 to 18 Years | 52 (100.0%) | 0 (0.0%) |
| 19 to 25 Years | 0 (0.0%) | 0 (0.0%) |
| 26 to 34 Years | 2 (100.0%) | 0 (0.0%) |
| 35 to 44 Years | 17 (94.4%) | 1 (5.6%) |
| 45 to 54 Years | 30 (78.9%) | 8 (21.0%) |
| 55 to 64 Years | 40 (53.3%) | 35 (46.7%) |
| 65 to 74 Years | 1 (100.0%) | 0 (0.0%) |
| 75 Years and older | 100 (100.0%) | 0 (0.0%) |
| Total | 242 (84.6%) | 44 (15.4%) |
Health Insurance Coverage by Citizenship Status in Antreville
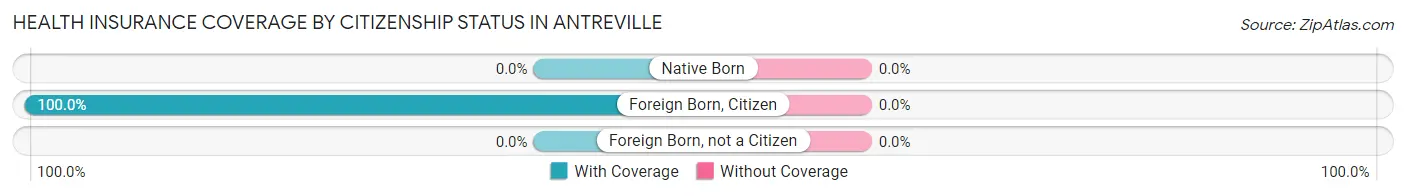
| Citizenship Status | With Coverage | Without Coverage |
| Native Born | 0 (0.0%) | 0 (0.0%) |
| Foreign Born, Citizen | 52 (100.0%) | 0 (0.0%) |
| Foreign Born, not a Citizen | 0 (0.0%) | 0 (0.0%) |
Health Insurance Coverage by Household Income in Antreville
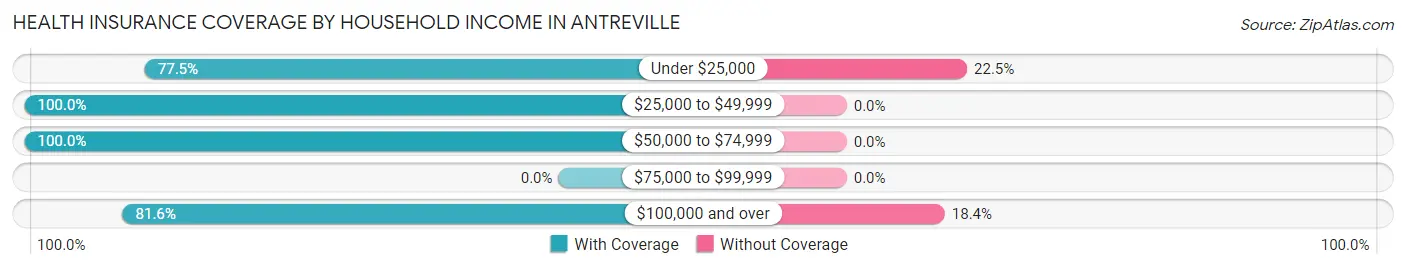
| Household Income | With Coverage | Without Coverage |
| Under $25,000 | 55 (77.5%) | 16 (22.5%) |
| $25,000 to $49,999 | 13 (100.0%) | 0 (0.0%) |
| $50,000 to $74,999 | 50 (100.0%) | 0 (0.0%) |
| $75,000 to $99,999 | 0 (0.0%) | 0 (0.0%) |
| $100,000 and over | 120 (81.6%) | 27 (18.4%) |
Public vs Private Health Insurance Coverage by Age in Antreville
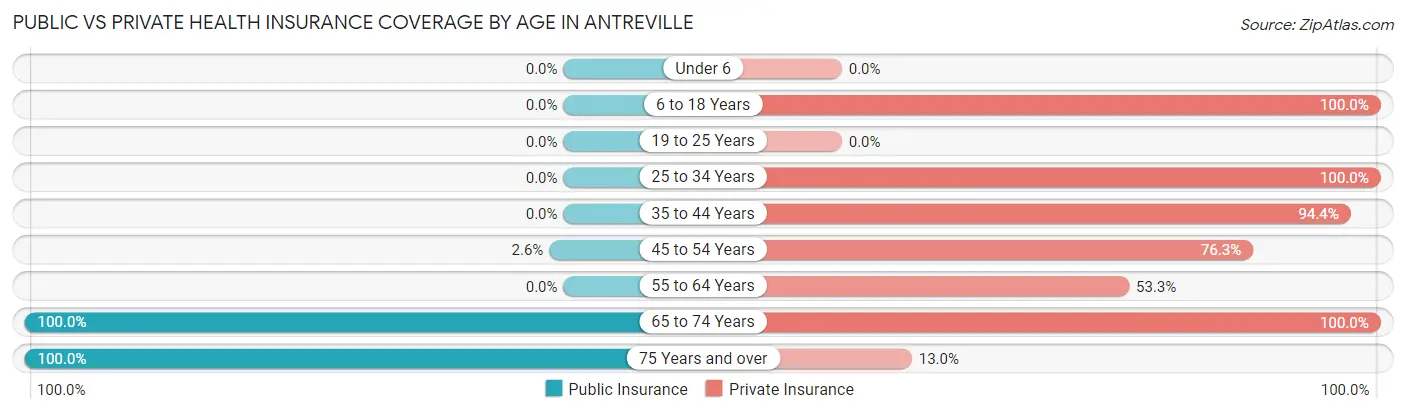
| Age Bracket | Public Insurance | Private Insurance |
| Under 6 | 0 (0.0%) | 0 (0.0%) |
| 6 to 18 Years | 0 (0.0%) | 52 (100.0%) |
| 19 to 25 Years | 0 (0.0%) | 0 (0.0%) |
| 25 to 34 Years | 0 (0.0%) | 2 (100.0%) |
| 35 to 44 Years | 0 (0.0%) | 17 (94.4%) |
| 45 to 54 Years | 1 (2.6%) | 29 (76.3%) |
| 55 to 64 Years | 0 (0.0%) | 40 (53.3%) |
| 65 to 74 Years | 1 (100.0%) | 1 (100.0%) |
| 75 Years and over | 100 (100.0%) | 13 (13.0%) |
| Total | 102 (35.7%) | 154 (53.8%) |
Disability Status by Sex by Age in Antreville
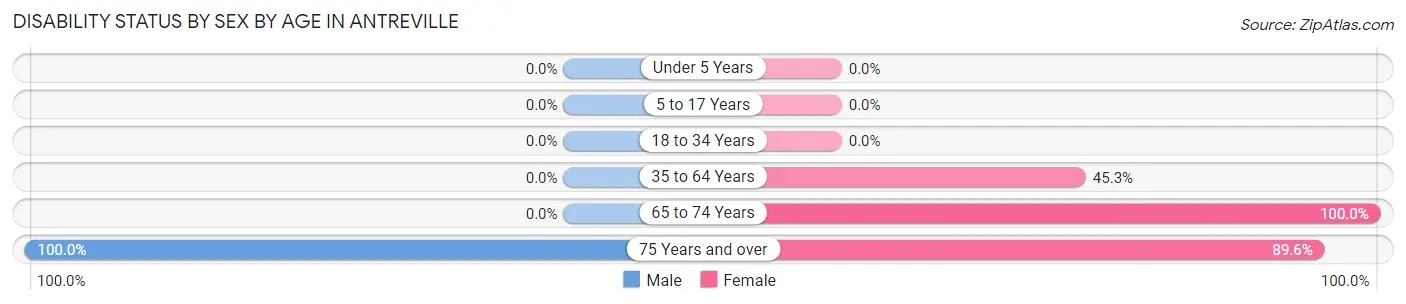
| Age Bracket | Male | Female |
| Under 5 Years | 0 (0.0%) | 0 (0.0%) |
| 5 to 17 Years | 0 (0.0%) | 0 (0.0%) |
| 18 to 34 Years | 0 (0.0%) | 0 (0.0%) |
| 35 to 64 Years | 0 (0.0%) | 29 (45.3%) |
| 65 to 74 Years | 0 (0.0%) | 1 (100.0%) |
| 75 Years and over | 23 (100.0%) | 69 (89.6%) |
Disability Class by Sex by Age in Antreville
Disability Class: Hearing Difficulty

| Age Bracket | Male | Female |
| Under 5 Years | 0 (0.0%) | 0 (0.0%) |
| 5 to 17 Years | 0 (0.0%) | 0 (0.0%) |
| 18 to 34 Years | 0 (0.0%) | 0 (0.0%) |
| 35 to 64 Years | 0 (0.0%) | 0 (0.0%) |
| 65 to 74 Years | 0 (0.0%) | 0 (0.0%) |
| 75 Years and over | 23 (100.0%) | 26 (33.8%) |
Disability Class: Vision Difficulty
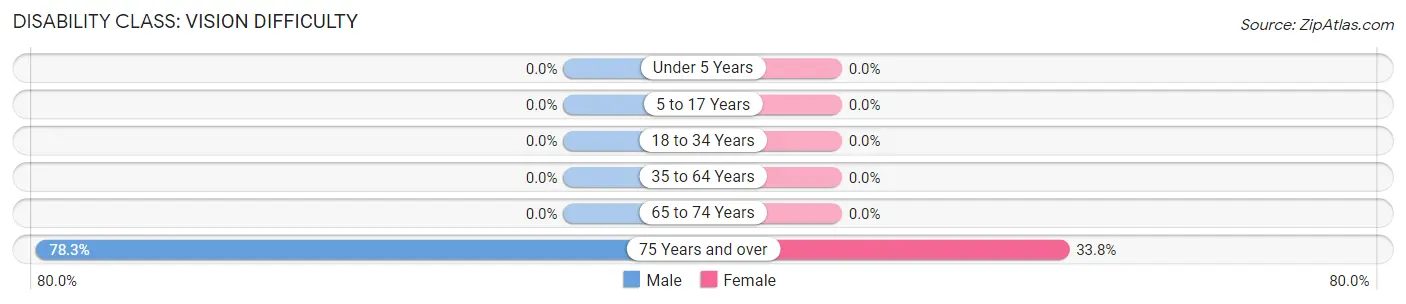
| Age Bracket | Male | Female |
| Under 5 Years | 0 (0.0%) | 0 (0.0%) |
| 5 to 17 Years | 0 (0.0%) | 0 (0.0%) |
| 18 to 34 Years | 0 (0.0%) | 0 (0.0%) |
| 35 to 64 Years | 0 (0.0%) | 0 (0.0%) |
| 65 to 74 Years | 0 (0.0%) | 0 (0.0%) |
| 75 Years and over | 18 (78.3%) | 26 (33.8%) |
Disability Class: Cognitive Difficulty
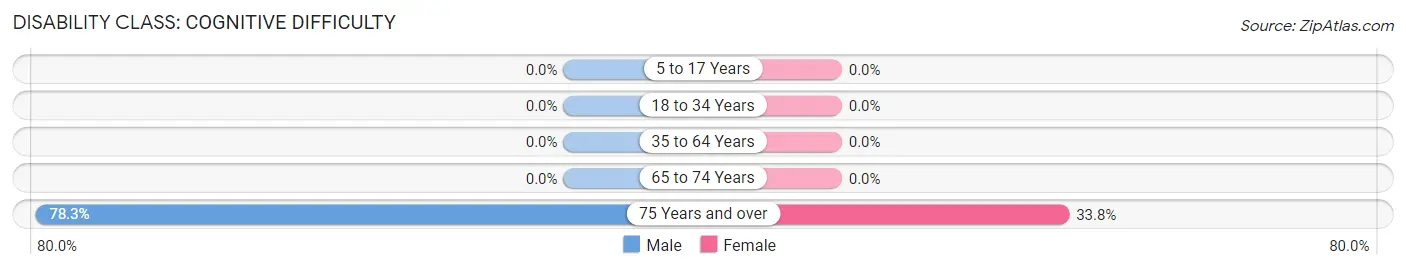
| Age Bracket | Male | Female |
| 5 to 17 Years | 0 (0.0%) | 0 (0.0%) |
| 18 to 34 Years | 0 (0.0%) | 0 (0.0%) |
| 35 to 64 Years | 0 (0.0%) | 0 (0.0%) |
| 65 to 74 Years | 0 (0.0%) | 0 (0.0%) |
| 75 Years and over | 18 (78.3%) | 26 (33.8%) |
Disability Class: Ambulatory Difficulty
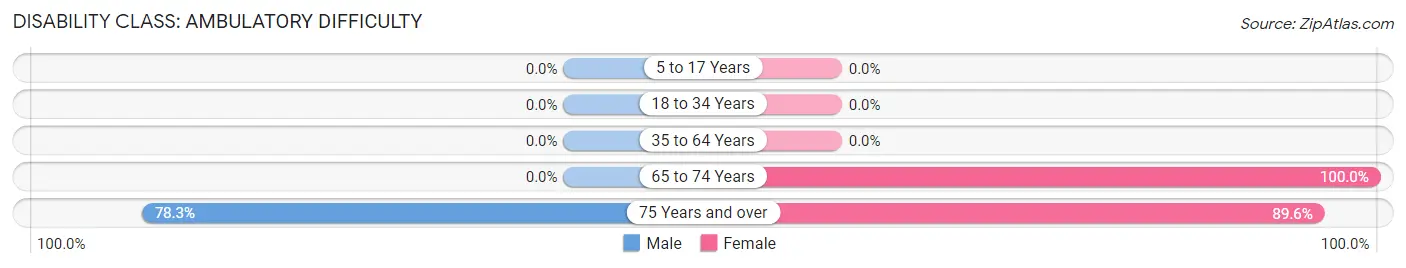
| Age Bracket | Male | Female |
| 5 to 17 Years | 0 (0.0%) | 0 (0.0%) |
| 18 to 34 Years | 0 (0.0%) | 0 (0.0%) |
| 35 to 64 Years | 0 (0.0%) | 0 (0.0%) |
| 65 to 74 Years | 0 (0.0%) | 1 (100.0%) |
| 75 Years and over | 18 (78.3%) | 69 (89.6%) |
Disability Class: Self-Care Difficulty
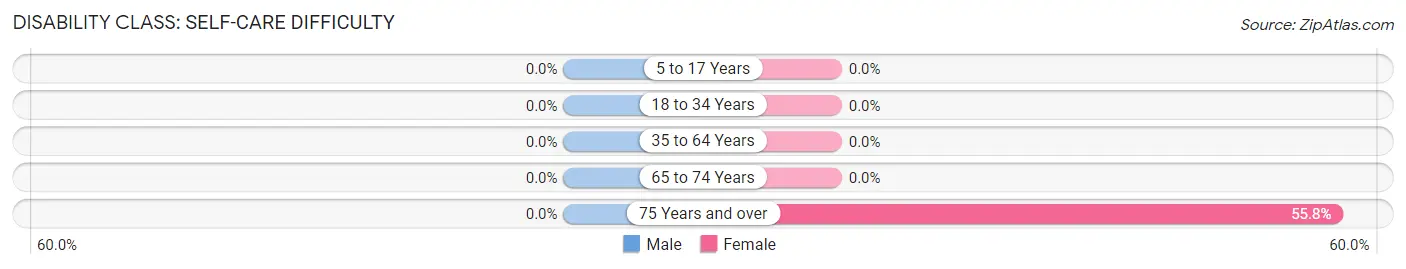
| Age Bracket | Male | Female |
| 5 to 17 Years | 0 (0.0%) | 0 (0.0%) |
| 18 to 34 Years | 0 (0.0%) | 0 (0.0%) |
| 35 to 64 Years | 0 (0.0%) | 0 (0.0%) |
| 65 to 74 Years | 0 (0.0%) | 0 (0.0%) |
| 75 Years and over | 0 (0.0%) | 43 (55.8%) |
Technology Access in Antreville
Computing Device Access in Antreville
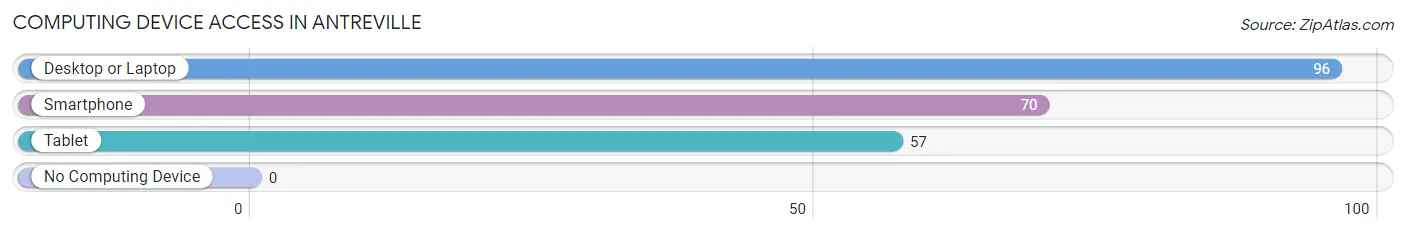
| Device Type | # Households | % Households |
| Desktop or Laptop | 96 | 100.0% |
| Smartphone | 70 | 72.9% |
| Tablet | 57 | 59.4% |
| No Computing Device | 0 | 0.0% |
| Total | 96 | 100.0% |
Internet Access in Antreville
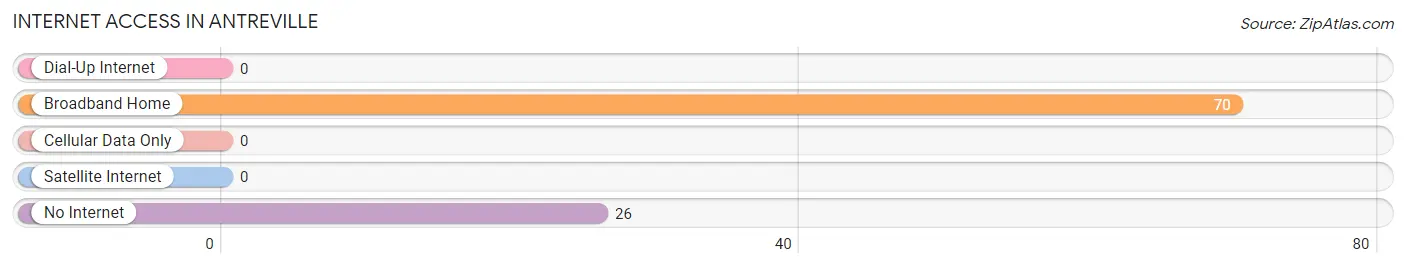
| Internet Type | # Households | % Households |
| Dial-Up Internet | 0 | 0.0% |
| Broadband Home | 70 | 72.9% |
| Cellular Data Only | 0 | 0.0% |
| Satellite Internet | 0 | 0.0% |
| No Internet | 26 | 27.1% |
| Total | 96 | 100.0% |
Antreville Summary
Antreville is a small unincorporated community located in Abbeville County, South Carolina. It is situated along the banks of the Saluda River, approximately 10 miles south of the county seat of Abbeville. The community is home to a population of approximately 500 people, and is known for its rural charm and small-town atmosphere.
History
The area that is now Antreville was first settled in the late 1700s by a group of French Huguenots who had migrated from France to the Carolinas. The settlement was originally known as “Antreville”, which is derived from the French word “antre”, meaning “cave”. The settlers named the area after the many caves that were located in the area.
In the early 1800s, the area was home to a thriving cotton industry, and the town was home to several cotton mills. The town was also home to a number of churches, including the Antreville Presbyterian Church, which was founded in 1820.
In the late 1800s, the town was home to a number of businesses, including a general store, a blacksmith shop, a grist mill, and a sawmill. The town also had a post office, which was established in 1891.
Geography
Antreville is located in the Piedmont region of South Carolina, approximately 10 miles south of the county seat of Abbeville. The town is situated along the banks of the Saluda River, and is surrounded by rolling hills and forests. The town is located at an elevation of approximately 500 feet above sea level.
The climate in Antreville is generally mild, with temperatures ranging from the mid-50s in the winter to the mid-80s in the summer. The area receives an average of 48 inches of precipitation per year, with most of the precipitation occurring in the spring and summer months.
Economy
The economy of Antreville is largely based on agriculture. The town is home to several farms, which produce a variety of crops, including corn, soybeans, and cotton. The town is also home to a number of small businesses, including a general store, a hardware store, and a restaurant.
Demographics
As of the 2010 census, the population of Antreville was 498. The racial makeup of the town was 97.2% White, 0.8% African American, 0.2% Native American, 0.2% Asian, and 1.6% from other races. The median household income in Antreville was $31,250, and the median age was 44.
Conclusion
Antreville is a small unincorporated community located in Abbeville County, South Carolina. It is situated along the banks of the Saluda River, and is home to a population of approximately 500 people. The town has a rich history, and is known for its rural charm and small-town atmosphere. The economy of Antreville is largely based on agriculture, and the town is home to several small businesses. The population of Antreville is predominantly White, with a median household income of $31,250 and a median age of 44.
Common Questions
What is Per Capita Income in Antreville?
Per Capita income in Antreville is $28,004.
What is Inequality or Gini Index in Antreville?
Inequality or Gini Index in Antreville is 0.43.
What is the Total Population of Antreville?
Total Population of Antreville is 286.
What is the Total Male Population of Antreville?
Total Male Population of Antreville is 112.
What is the Total Female Population of Antreville?
Total Female Population of Antreville is 174.
What is the Ratio of Males per 100 Females in Antreville?
There are 64.37 Males per 100 Females in Antreville.
What is the Ratio of Females per 100 Males in Antreville?
There are 155.36 Females per 100 Males in Antreville.
What is the Median Population Age in Antreville?
Median Population Age in Antreville is 57.9 Years.
What is the Average Family Size in Antreville
Average Family Size in Antreville is 2.6 People.
What is the Average Household Size in Antreville
Average Household Size in Antreville is 2.9 People.
How Large is the Labor Force in Antreville?
There are 76 People in the Labor Forcein in Antreville.
What is the Percentage of People in the Labor Force in Antreville?
29.1% of People are in the Labor Force in Antreville.