Maysville, CO Map & Demographics
Maysville Map
Maysville Overview
$29,223
PER CAPITA INCOME
95.6%
WAGE / INCOME GAP [ % ]
4.4¢/ $1
WAGE / INCOME GAP [ $ ]
0.65
INEQUALITY / GINI INDEX
168
TOTAL POPULATION
80
MALE POPULATION
88
FEMALE POPULATION
90.91
MALES / 100 FEMALES
110.00
FEMALES / 100 MALES
57.5
MEDIAN AGE
1.7
AVG FAMILY SIZE
1.5
AVG HOUSEHOLD SIZE
101
LABOR FORCE [ PEOPLE ]
67.3%
PERCENT IN LABOR FORCE
Income in Maysville
Income Overview in Maysville
| Characteristic | Number | Measure |
| Per Capita Income | 168 | $29,223 |
| Median Family Income | 83 | $0 |
| Mean Family Income | 83 | $58,808 |
| Median Household Income | 109 | $0 |
| Mean Household Income | 109 | $54,083 |
| Income Deficit | 83 | $0 |
| Wage / Income Gap (%) | 168 | 95.58% |
| Wage / Income Gap ($) | 168 | 4.42¢ per $1 |
| Gini / Inequality Index | 168 | 0.65 |
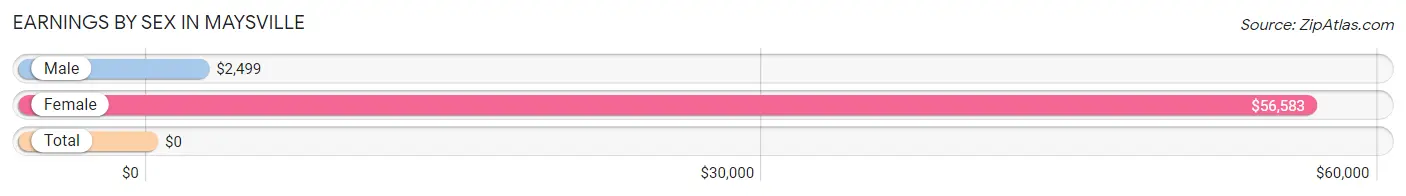
Earnings by Sex in Maysville
| Sex | Number | Average Earnings |
| Male | 56 (55.4%) | $2,499 |
| Female | 45 (44.6%) | $56,583 |
| Total | 101 (100.0%) | $0 |
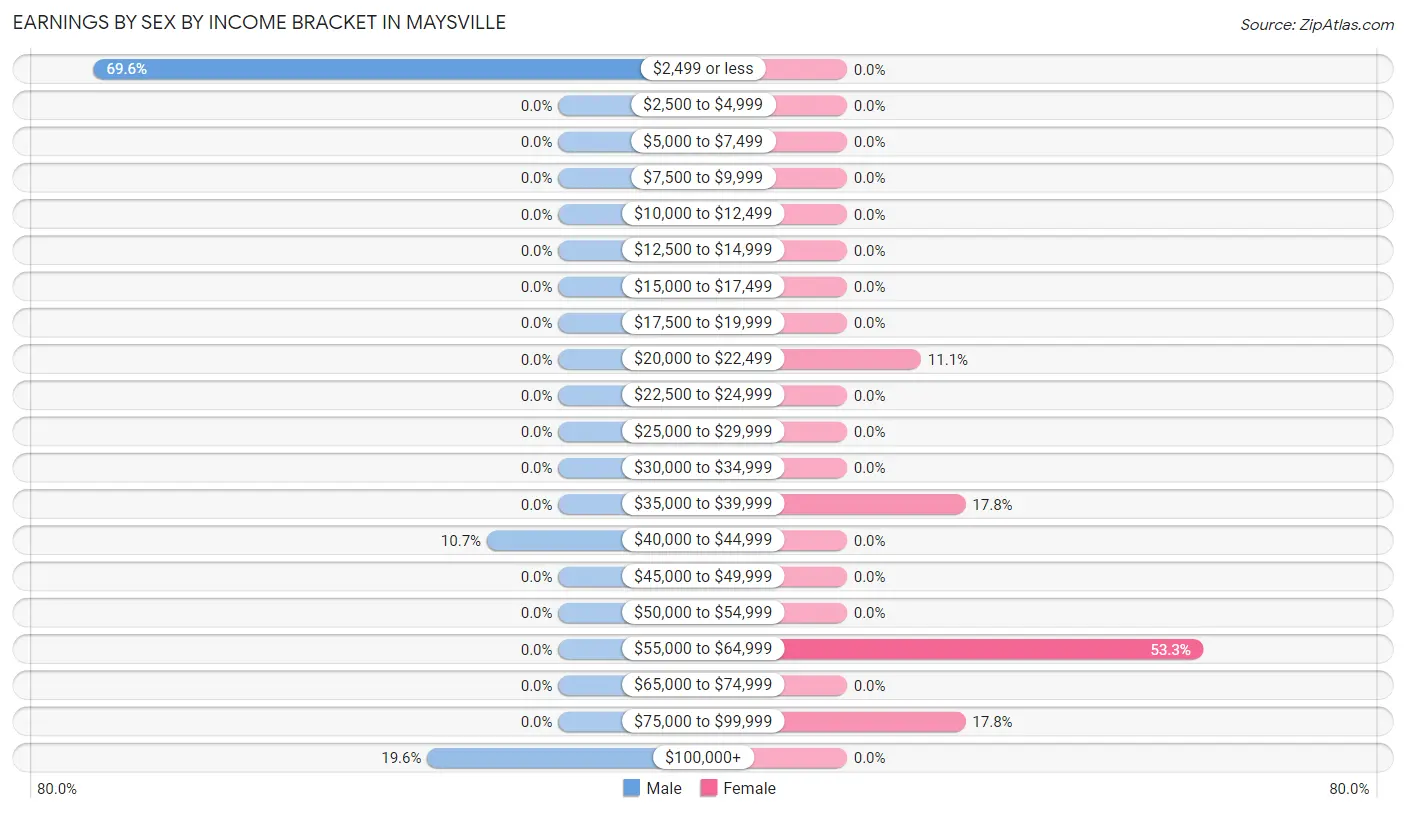
Earnings by Sex by Income Bracket in Maysville
The most common earnings brackets in Maysville are $2,499 or less for men (39 | 69.6%) and $55,000 to $64,999 for women (24 | 53.3%).
| Income | Male | Female |
| $2,499 or less | 39 (69.6%) | 0 (0.0%) |
| $2,500 to $4,999 | 0 (0.0%) | 0 (0.0%) |
| $5,000 to $7,499 | 0 (0.0%) | 0 (0.0%) |
| $7,500 to $9,999 | 0 (0.0%) | 0 (0.0%) |
| $10,000 to $12,499 | 0 (0.0%) | 0 (0.0%) |
| $12,500 to $14,999 | 0 (0.0%) | 0 (0.0%) |
| $15,000 to $17,499 | 0 (0.0%) | 0 (0.0%) |
| $17,500 to $19,999 | 0 (0.0%) | 0 (0.0%) |
| $20,000 to $22,499 | 0 (0.0%) | 5 (11.1%) |
| $22,500 to $24,999 | 0 (0.0%) | 0 (0.0%) |
| $25,000 to $29,999 | 0 (0.0%) | 0 (0.0%) |
| $30,000 to $34,999 | 0 (0.0%) | 0 (0.0%) |
| $35,000 to $39,999 | 0 (0.0%) | 8 (17.8%) |
| $40,000 to $44,999 | 6 (10.7%) | 0 (0.0%) |
| $45,000 to $49,999 | 0 (0.0%) | 0 (0.0%) |
| $50,000 to $54,999 | 0 (0.0%) | 0 (0.0%) |
| $55,000 to $64,999 | 0 (0.0%) | 24 (53.3%) |
| $65,000 to $74,999 | 0 (0.0%) | 0 (0.0%) |
| $75,000 to $99,999 | 0 (0.0%) | 8 (17.8%) |
| $100,000+ | 11 (19.6%) | 0 (0.0%) |
| Total | 56 (100.0%) | 45 (100.0%) |
Earnings by Sex by Educational Attainment in Maysville
| Educational Attainment | Male Income | Female Income |
| Less than High School | - | - |
| High School Diploma | - | - |
| College or Associate's Degree | - | - |
| Bachelor's Degree | - | - |
| Graduate Degree | - | - |
| Total | $2,499 | $56,583 |
Family Income in Maysville
Family Income Brackets in Maysville
According to the Maysville family income data, there are 39 families falling into the less than $10,000 income range, which is the most common income bracket and makes up 47.0% of all families.
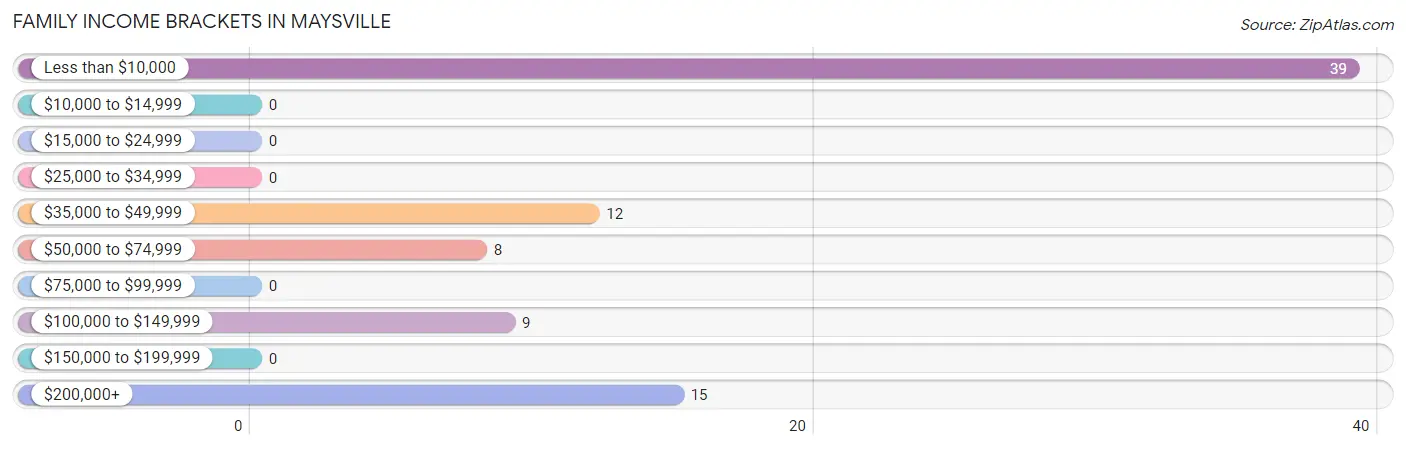
| Income Bracket | # Families | % Families |
| Less than $10,000 | 39 | 47.0% |
| $10,000 to $14,999 | 0 | 0.0% |
| $15,000 to $24,999 | 0 | 0.0% |
| $25,000 to $34,999 | 0 | 0.0% |
| $35,000 to $49,999 | 12 | 14.5% |
| $50,000 to $74,999 | 8 | 9.6% |
| $75,000 to $99,999 | 0 | 0.0% |
| $100,000 to $149,999 | 9 | 10.8% |
| $150,000 to $199,999 | 0 | 0.0% |
| $200,000+ | 15 | 18.1% |
Family Income by Famaliy Size in Maysville
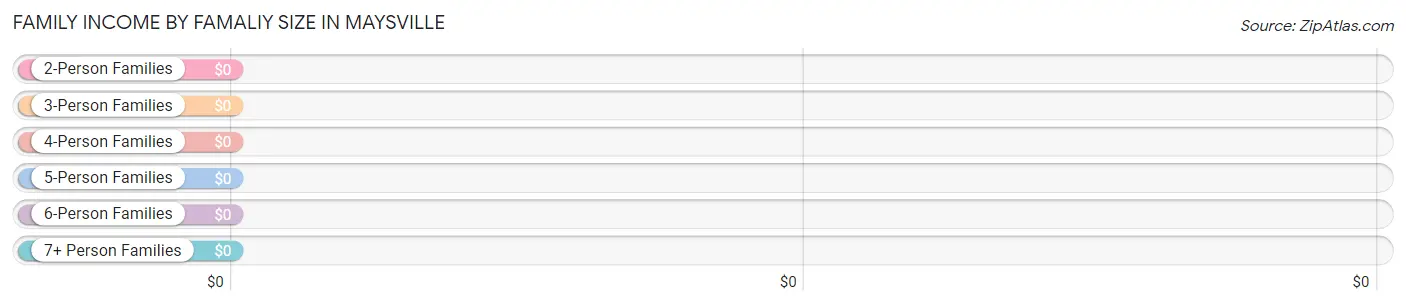
| Income Bracket | # Families | Median Income |
| 2-Person Families | 35 (42.2%) | $0 |
| 3-Person Families | 39 (47.0%) | $0 |
| 4-Person Families | 9 (10.8%) | $0 |
| 5-Person Families | 0 (0.0%) | $0 |
| 6-Person Families | 0 (0.0%) | $0 |
| 7+ Person Families | 0 (0.0%) | $0 |
| Total | 83 (100.0%) | $0 |
Family Income by Number of Earners in Maysville
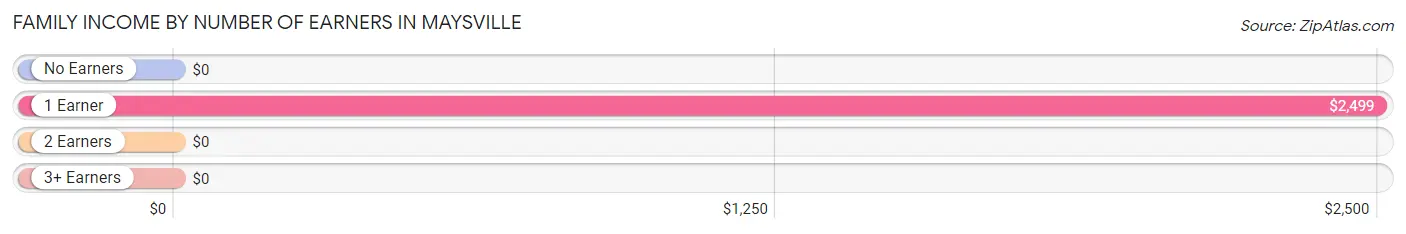
| Number of Earners | # Families | Median Income |
| No Earners | 0 (0.0%) | $0 |
| 1 Earner | 59 (71.1%) | $2,499 |
| 2 Earners | 24 (28.9%) | $0 |
| 3+ Earners | 0 (0.0%) | $0 |
| Total | 83 (100.0%) | $0 |
Household Income in Maysville
Household Income Brackets in Maysville
With 39 households falling in the category, the less than $10,000 income range is the most frequent in Maysville, accounting for 35.8% of all households.
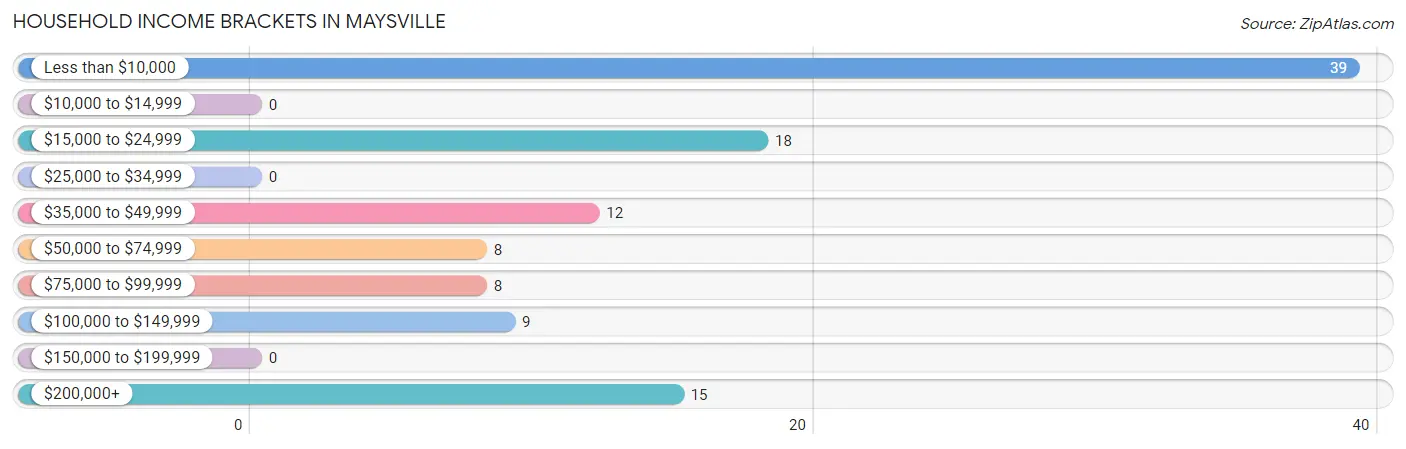
| Income Bracket | # Households | % Households |
| Less than $10,000 | 39 | 35.8% |
| $10,000 to $14,999 | 0 | 0.0% |
| $15,000 to $24,999 | 18 | 16.5% |
| $25,000 to $34,999 | 0 | 0.0% |
| $35,000 to $49,999 | 12 | 11.0% |
| $50,000 to $74,999 | 8 | 7.3% |
| $75,000 to $99,999 | 8 | 7.3% |
| $100,000 to $149,999 | 9 | 8.3% |
| $150,000 to $199,999 | 0 | 0.0% |
| $200,000+ | 15 | 13.8% |
Household Income by Householder Age in Maysville
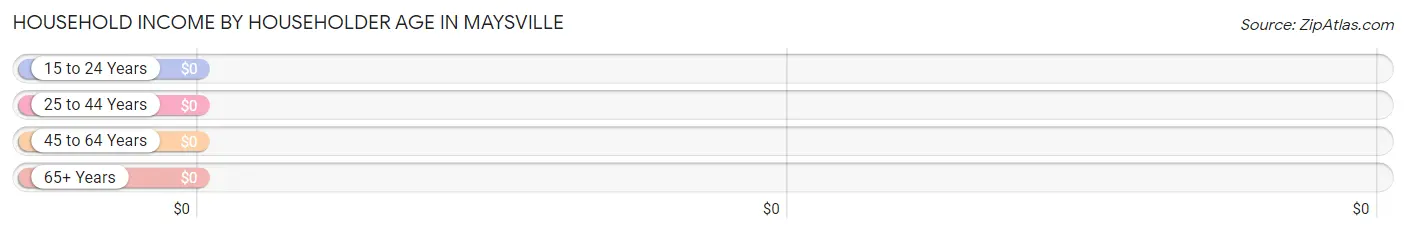
| Income Bracket | # Households | Median Income |
| 15 to 24 Years | 0 (0.0%) | $0 |
| 25 to 44 Years | 48 (44.0%) | $0 |
| 45 to 64 Years | 23 (21.1%) | $0 |
| 65+ Years | 38 (34.9%) | $0 |
| Total | 109 (100.0%) | $0 |
Poverty in Maysville
Income Below Poverty by Sex and Age in Maysville
With 58.8% poverty level for males and 3.4% for females among the residents of Maysville, 25 to 34 year old males and 55 to 64 year old females are the most vulnerable to poverty, with 39 males (100.0%) and 3 females (16.7%) in their respective age groups living below the poverty level.
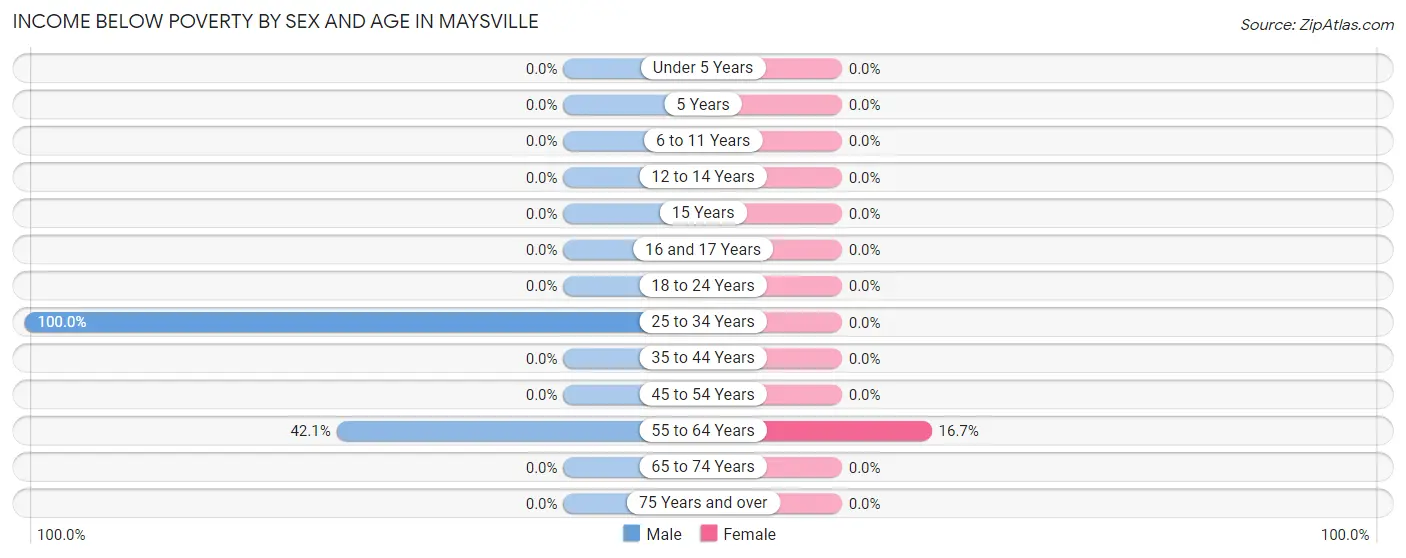
| Age Bracket | Male | Female |
| Under 5 Years | 0 (0.0%) | 0 (0.0%) |
| 5 Years | 0 (0.0%) | 0 (0.0%) |
| 6 to 11 Years | 0 (0.0%) | 0 (0.0%) |
| 12 to 14 Years | 0 (0.0%) | 0 (0.0%) |
| 15 Years | 0 (0.0%) | 0 (0.0%) |
| 16 and 17 Years | 0 (0.0%) | 0 (0.0%) |
| 18 to 24 Years | 0 (0.0%) | 0 (0.0%) |
| 25 to 34 Years | 39 (100.0%) | 0 (0.0%) |
| 35 to 44 Years | 0 (0.0%) | 0 (0.0%) |
| 45 to 54 Years | 0 (0.0%) | 0 (0.0%) |
| 55 to 64 Years | 8 (42.1%) | 3 (16.7%) |
| 65 to 74 Years | 0 (0.0%) | 0 (0.0%) |
| 75 Years and over | 0 (0.0%) | 0 (0.0%) |
| Total | 47 (58.8%) | 3 (3.4%) |
Income Above Poverty by Sex and Age in Maysville
According to the poverty statistics in Maysville, males aged 5 years and females aged under 5 years are the age groups that are most secure financially, with 100.0% of males and 100.0% of females in these age groups living above the poverty line.
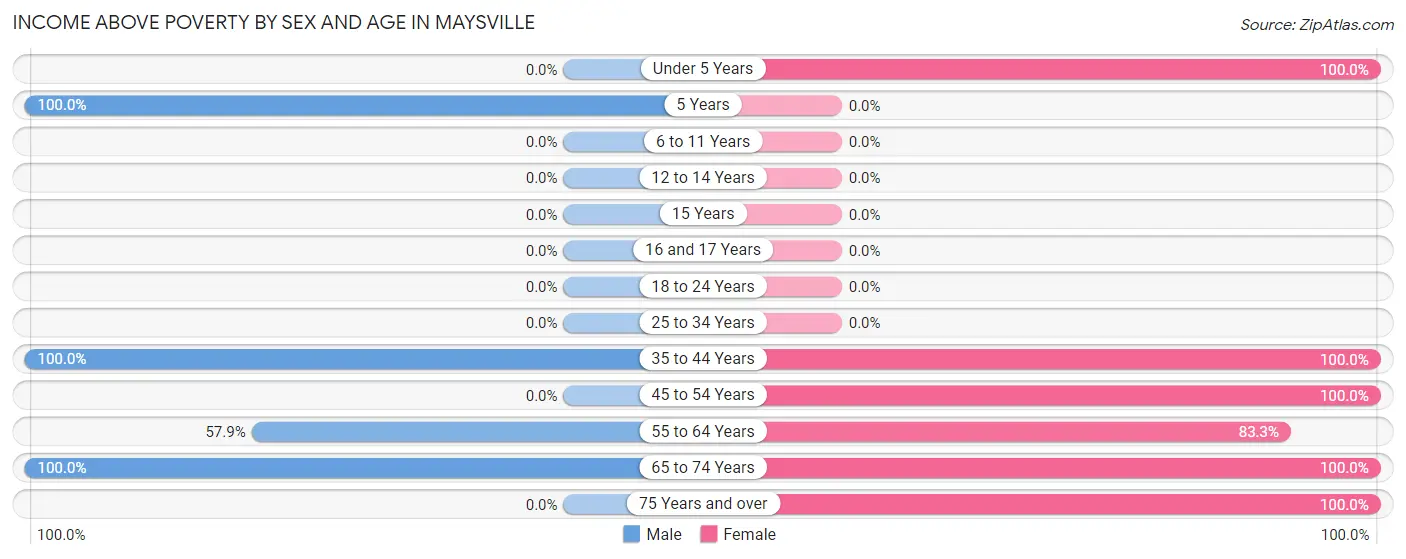
| Age Bracket | Male | Female |
| Under 5 Years | 0 (0.0%) | 10 (100.0%) |
| 5 Years | 8 (100.0%) | 0 (0.0%) |
| 6 to 11 Years | 0 (0.0%) | 0 (0.0%) |
| 12 to 14 Years | 0 (0.0%) | 0 (0.0%) |
| 15 Years | 0 (0.0%) | 0 (0.0%) |
| 16 and 17 Years | 0 (0.0%) | 0 (0.0%) |
| 18 to 24 Years | 0 (0.0%) | 0 (0.0%) |
| 25 to 34 Years | 0 (0.0%) | 0 (0.0%) |
| 35 to 44 Years | 6 (100.0%) | 9 (100.0%) |
| 45 to 54 Years | 0 (0.0%) | 8 (100.0%) |
| 55 to 64 Years | 11 (57.9%) | 15 (83.3%) |
| 65 to 74 Years | 8 (100.0%) | 31 (100.0%) |
| 75 Years and over | 0 (0.0%) | 12 (100.0%) |
| Total | 33 (41.2%) | 85 (96.6%) |
Income Below Poverty Among Married-Couple Families in Maysville
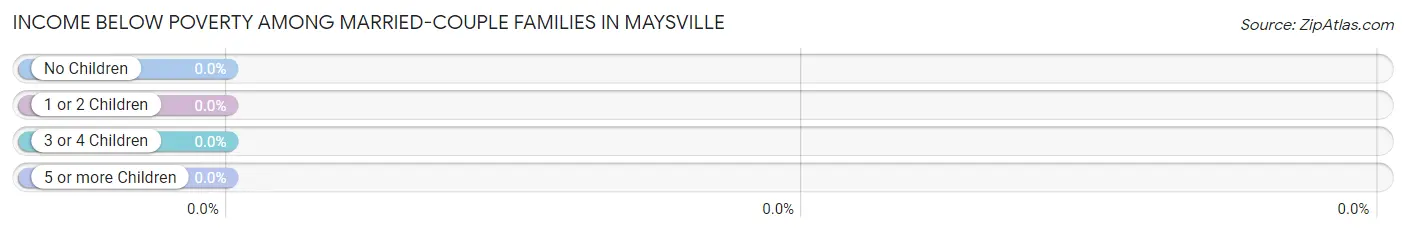
| Children | Above Poverty | Below Poverty |
| No Children | 23 (100.0%) | 0 (0.0%) |
| 1 or 2 Children | 9 (100.0%) | 0 (0.0%) |
| 3 or 4 Children | 0 (0.0%) | 0 (0.0%) |
| 5 or more Children | 0 (0.0%) | 0 (0.0%) |
| Total | 32 (100.0%) | 0 (0.0%) |
Income Below Poverty Among Single-Parent Households in Maysville
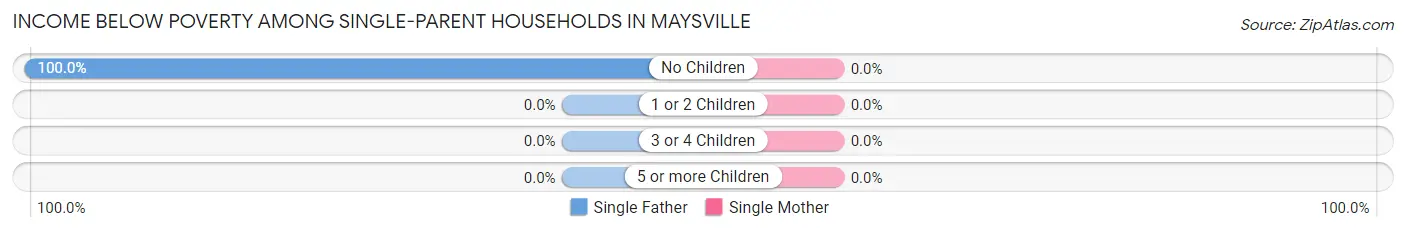
| Children | Single Father | Single Mother |
| No Children | 39 (100.0%) | 0 (0.0%) |
| 1 or 2 Children | 0 (0.0%) | 0 (0.0%) |
| 3 or 4 Children | 0 (0.0%) | 0 (0.0%) |
| 5 or more Children | 0 (0.0%) | 0 (0.0%) |
| Total | 39 (100.0%) | 0 (0.0%) |
Income Below Poverty Among Married-Couple vs Single-Parent Households in Maysville
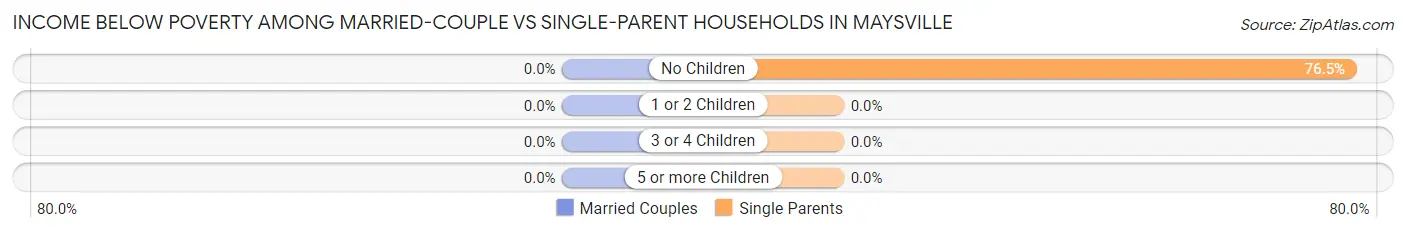
| Children | Married-Couple Families | Single-Parent Households |
| No Children | 0 (0.0%) | 39 (76.5%) |
| 1 or 2 Children | 0 (0.0%) | 0 (0.0%) |
| 3 or 4 Children | 0 (0.0%) | 0 (0.0%) |
| 5 or more Children | 0 (0.0%) | 0 (0.0%) |
| Total | 0 (0.0%) | 39 (76.5%) |
Race in Maysville
The most populous races in Maysville are White / Caucasian (121 | 72.0%), Hispanic or Latino (47 | 28.0%), and Some other Race (39 | 23.2%).
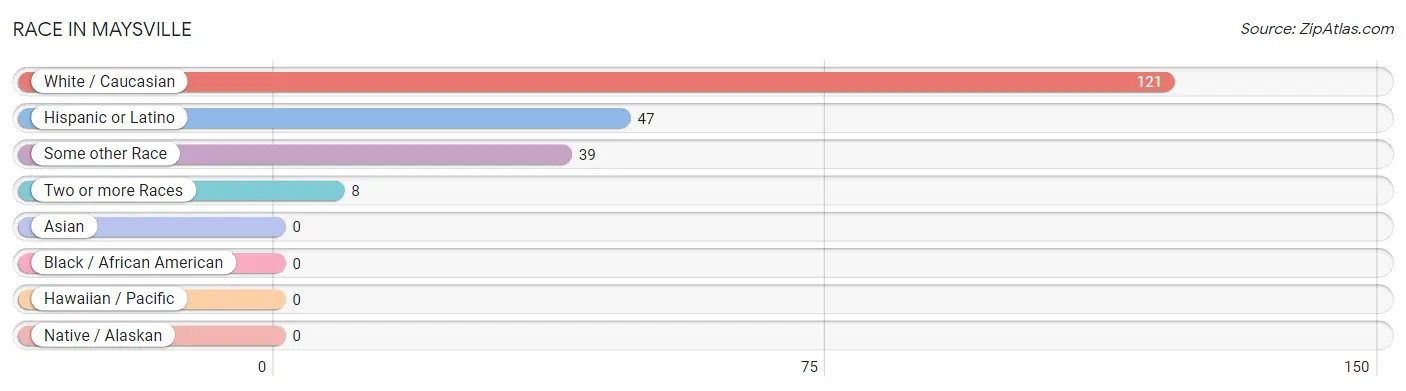
| Race | # Population | % Population |
| Asian | 0 | 0.0% |
| Black / African American | 0 | 0.0% |
| Hawaiian / Pacific | 0 | 0.0% |
| Hispanic or Latino | 47 | 28.0% |
| Native / Alaskan | 0 | 0.0% |
| White / Caucasian | 121 | 72.0% |
| Two or more Races | 8 | 4.8% |
| Some other Race | 39 | 23.2% |
| Total | 168 | 100.0% |
Ancestry in Maysville
The most populous ancestries reported in Maysville are German (73 | 43.4%), Scotch-Irish (44 | 26.2%), South American (39 | 23.2%), Belgian (15 | 8.9%), and Polish (12 | 7.1%), together accounting for 108.9% of all Maysville residents.
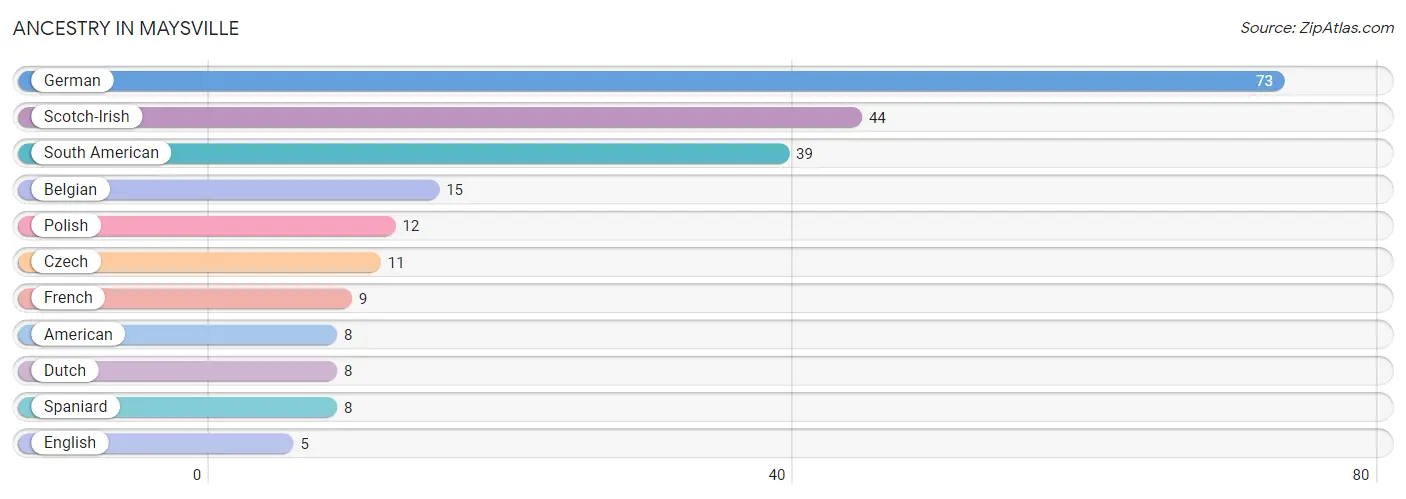
| Ancestry | # Population | % Population |
| American | 8 | 4.8% |
| Belgian | 15 | 8.9% |
| Czech | 11 | 6.6% |
| Dutch | 8 | 4.8% |
| English | 5 | 3.0% |
| French | 9 | 5.4% |
| German | 73 | 43.4% |
| Polish | 12 | 7.1% |
| Scotch-Irish | 44 | 26.2% |
| South American | 39 | 23.2% |
| Spaniard | 8 | 4.8% | View All 11 Rows |
Immigrants in Maysville

| Immigration Origin | # Population | % Population | View All 0 Rows |
Sex and Age in Maysville
Sex and Age in Maysville
The most populous age groups in Maysville are 30 to 34 Years (39 | 48.7%) for men and 55 to 59 Years (18 | 20.4%) for women.
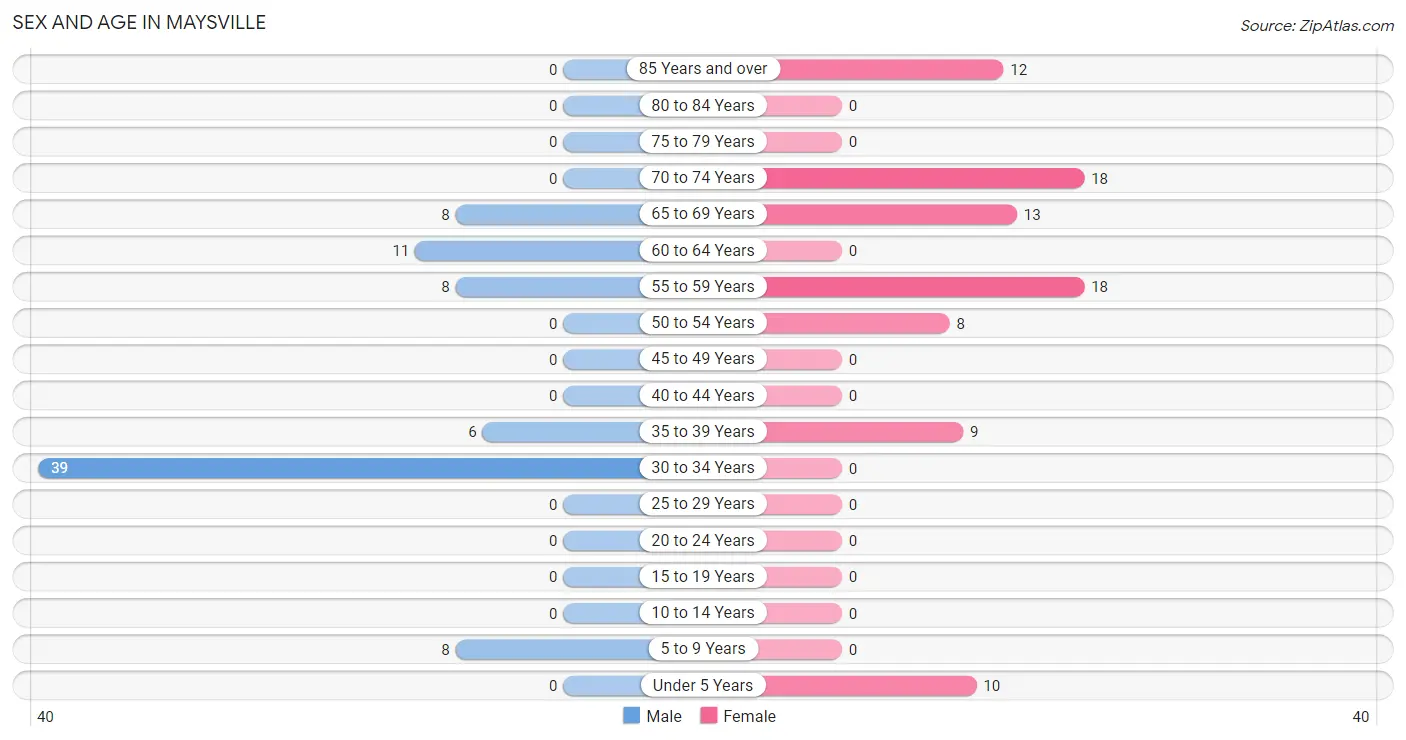
| Age Bracket | Male | Female |
| Under 5 Years | 0 (0.0%) | 10 (11.4%) |
| 5 to 9 Years | 8 (10.0%) | 0 (0.0%) |
| 10 to 14 Years | 0 (0.0%) | 0 (0.0%) |
| 15 to 19 Years | 0 (0.0%) | 0 (0.0%) |
| 20 to 24 Years | 0 (0.0%) | 0 (0.0%) |
| 25 to 29 Years | 0 (0.0%) | 0 (0.0%) |
| 30 to 34 Years | 39 (48.7%) | 0 (0.0%) |
| 35 to 39 Years | 6 (7.5%) | 9 (10.2%) |
| 40 to 44 Years | 0 (0.0%) | 0 (0.0%) |
| 45 to 49 Years | 0 (0.0%) | 0 (0.0%) |
| 50 to 54 Years | 0 (0.0%) | 8 (9.1%) |
| 55 to 59 Years | 8 (10.0%) | 18 (20.4%) |
| 60 to 64 Years | 11 (13.8%) | 0 (0.0%) |
| 65 to 69 Years | 8 (10.0%) | 13 (14.8%) |
| 70 to 74 Years | 0 (0.0%) | 18 (20.4%) |
| 75 to 79 Years | 0 (0.0%) | 0 (0.0%) |
| 80 to 84 Years | 0 (0.0%) | 0 (0.0%) |
| 85 Years and over | 0 (0.0%) | 12 (13.6%) |
| Total | 80 (100.0%) | 88 (100.0%) |
Families and Households in Maysville
Median Family Size in Maysville
The median family size in Maysville is 1.71 persons per family, with married-couple families (32 | 38.6%) accounting for the largest median family size of 2.34 persons per family. On the other hand, single male/father families (39 | 47.0%) represent the smallest median family size with 1.28 persons per family.
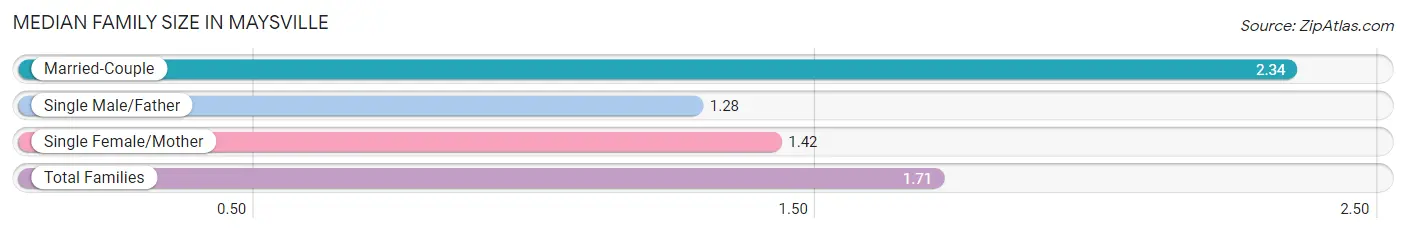
| Family Type | # Families | Family Size |
| Married-Couple | 32 (38.6%) | 2.34 |
| Single Male/Father | 39 (47.0%) | 1.28 |
| Single Female/Mother | 12 (14.5%) | 1.42 |
| Total Families | 83 (100.0%) | 1.71 |
Median Household Size in Maysville
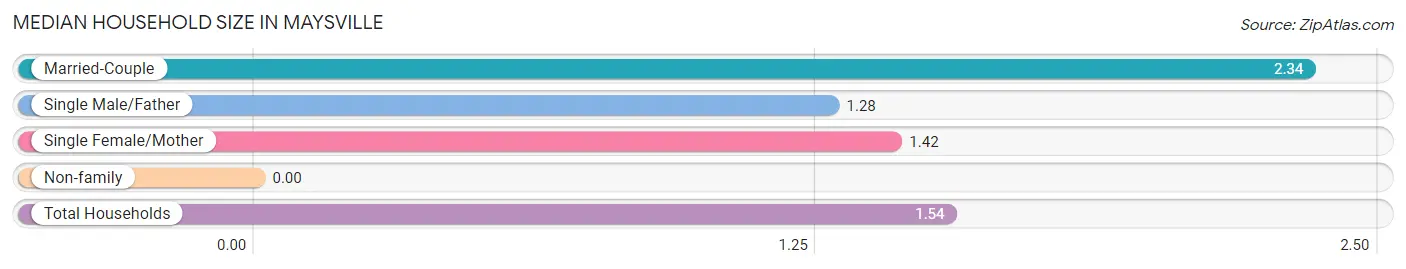
| Household Type | # Households | Household Size |
| Married-Couple | 32 (29.4%) | 2.34 |
| Single Male/Father | 39 (35.8%) | 1.28 |
| Single Female/Mother | 12 (11.0%) | 1.42 |
| Non-family | 26 (23.8%) | - |
| Total Households | 109 (100.0%) | 1.54 |
Household Size by Marriage Status in Maysville
Out of a total of 109 households in Maysville, 83 (76.1%) are family households, while 26 (23.8%) are nonfamily households. The most numerous type of family households are 3-person households, comprising 39, and the most common type of nonfamily households are 1-person households, comprising 26.
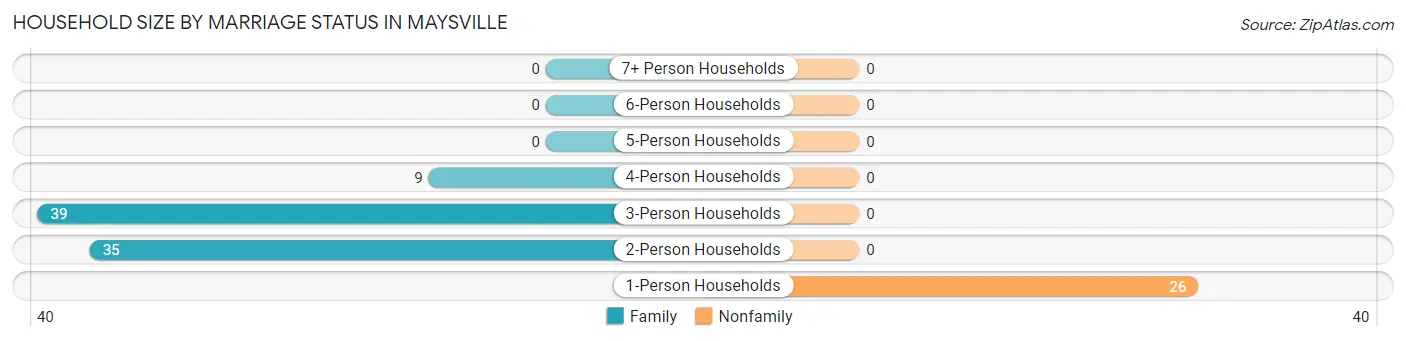
| Household Size | Family Households | Nonfamily Households |
| 1-Person Households | - | 26 (23.8%) |
| 2-Person Households | 35 (32.1%) | 0 (0.0%) |
| 3-Person Households | 39 (35.8%) | 0 (0.0%) |
| 4-Person Households | 9 (8.3%) | 0 (0.0%) |
| 5-Person Households | 0 (0.0%) | 0 (0.0%) |
| 6-Person Households | 0 (0.0%) | 0 (0.0%) |
| 7+ Person Households | 0 (0.0%) | 0 (0.0%) |
| Total | 83 (76.1%) | 26 (23.8%) |
Female Fertility in Maysville
Fertility by Age in Maysville
| Age Bracket | Women with Births | Births / 1,000 Women |
| 15 to 19 years | 0 (0.0%) | 0.0 |
| 20 to 34 years | 0 (0.0%) | 0.0 |
| 35 to 50 years | 0 (0.0%) | 0.0 |
| Total | 0 (0.0%) | 0.0 |
Fertility by Age by Marriage Status in Maysville
| Age Bracket | Married | Unmarried |
| 15 to 19 years | 0 (0.0%) | 0 (0.0%) |
| 20 to 34 years | 0 (0.0%) | 0 (0.0%) |
| 35 to 50 years | 0 (0.0%) | 0 (0.0%) |
| Total | 0 (0.0%) | 0 (0.0%) |
Fertility by Education in Maysville
| Educational Attainment | Women with Births | Births / 1,000 Women |
| Less than High School | 0 (0.0%) | 0.0 |
| High School Diploma | 0 (0.0%) | 0.0 |
| College or Associate's Degree | 0 (0.0%) | 0.0 |
| Bachelor's Degree | 0 (0.0%) | 0.0 |
| Graduate Degree | 0 (0.0%) | 0.0 |
| Total | 0 (0.0%) | 0.0 |
Fertility by Education by Marriage Status in Maysville
| Educational Attainment | Married | Unmarried |
| Less than High School | 0 (0.0%) | 0 (0.0%) |
| High School Diploma | 0 (0.0%) | 0 (0.0%) |
| College or Associate's Degree | 0 (0.0%) | 0 (0.0%) |
| Bachelor's Degree | 0 (0.0%) | 0 (0.0%) |
| Graduate Degree | 0 (0.0%) | 0 (0.0%) |
| Total | 0 (0.0%) | 0 (0.0%) |
Employment Characteristics in Maysville
Employment by Class of Employer in Maysville
Among the 101 employed individuals in Maysville, self-employed (not incorporated) (45 | 44.6%), private company employees (27 | 26.7%), and self-employed (incorporated) (15 | 14.8%) make up the most common classes of employment.
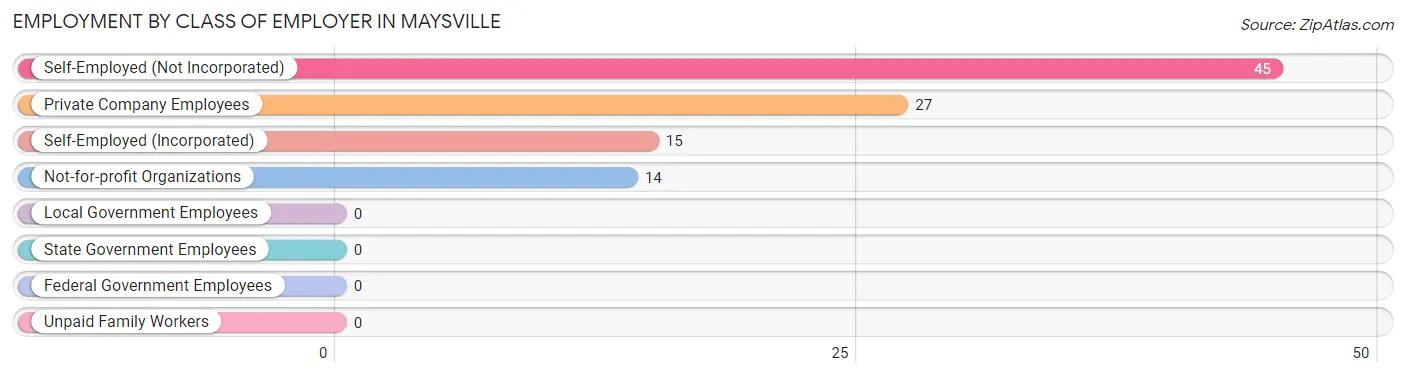
| Employer Class | # Employees | % Employees |
| Private Company Employees | 27 | 26.7% |
| Self-Employed (Incorporated) | 15 | 14.8% |
| Self-Employed (Not Incorporated) | 45 | 44.6% |
| Not-for-profit Organizations | 14 | 13.9% |
| Local Government Employees | 0 | 0.0% |
| State Government Employees | 0 | 0.0% |
| Federal Government Employees | 0 | 0.0% |
| Unpaid Family Workers | 0 | 0.0% |
| Total | 101 | 100.0% |
Employment Status by Age in Maysville
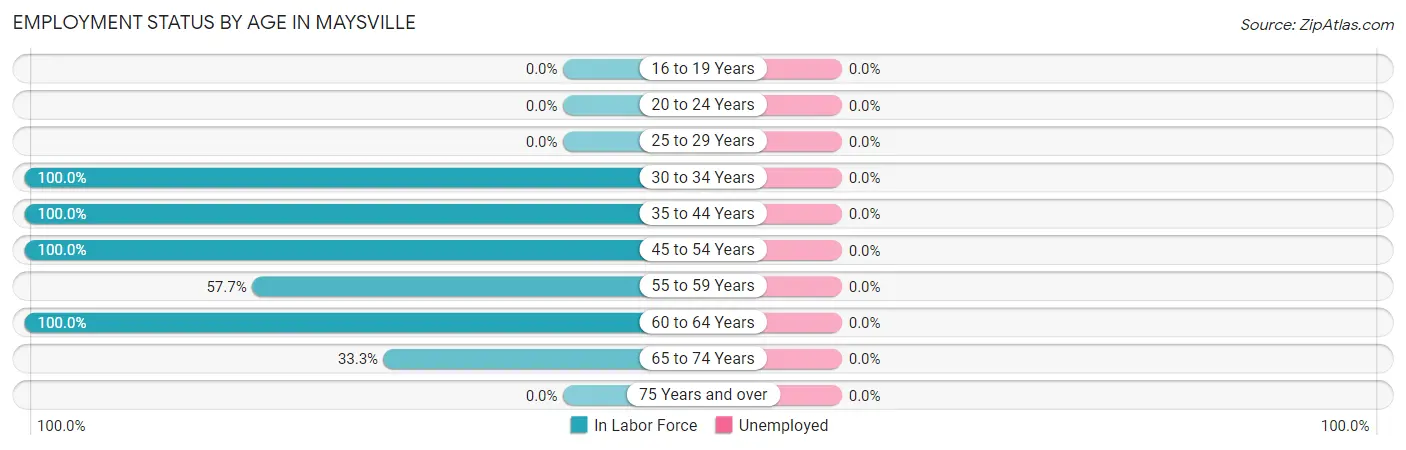
| Age Bracket | In Labor Force | Unemployed |
| 16 to 19 Years | 0 (0.0%) | 0 (0.0%) |
| 20 to 24 Years | 0 (0.0%) | 0 (0.0%) |
| 25 to 29 Years | 0 (0.0%) | 0 (0.0%) |
| 30 to 34 Years | 39 (100.0%) | 0 (0.0%) |
| 35 to 44 Years | 15 (100.0%) | 0 (0.0%) |
| 45 to 54 Years | 8 (100.0%) | 0 (0.0%) |
| 55 to 59 Years | 15 (57.7%) | 0 (0.0%) |
| 60 to 64 Years | 11 (100.0%) | 0 (0.0%) |
| 65 to 74 Years | 13 (33.3%) | 0 (0.0%) |
| 75 Years and over | 0 (0.0%) | 0 (0.0%) |
| Total | 101 (67.3%) | 0 (0.0%) |
Employment Status by Educational Attainment in Maysville
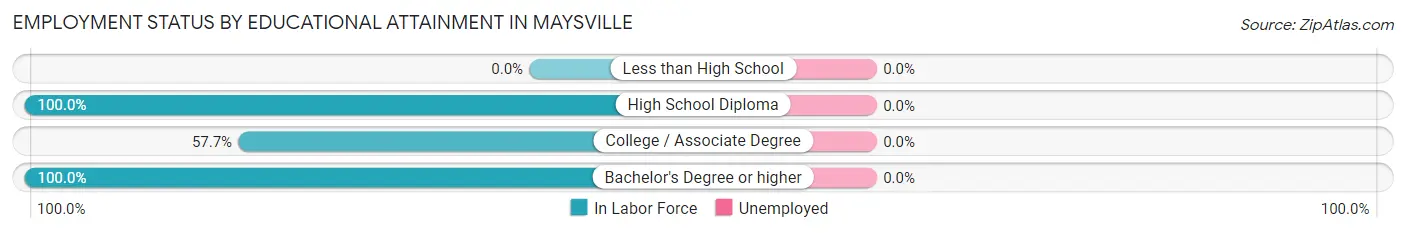
| Educational Attainment | In Labor Force | Unemployed |
| Less than High School | 0 (0.0%) | 0 (0.0%) |
| High School Diploma | 6 (100.0%) | 0 (0.0%) |
| College / Associate Degree | 15 (57.7%) | 0 (0.0%) |
| Bachelor's Degree or higher | 67 (100.0%) | 0 (0.0%) |
| Total | 88 (88.9%) | 0 (0.0%) |
Employment Occupations by Sex in Maysville
Management, Business, Science and Arts Occupations
The most common Management, Business, Science and Arts occupations in Maysville are Computers, Engineering & Science (39 | 38.6%), Computers & Mathematics (39 | 38.6%), Health Diagnosing & Treating (25 | 24.7%), Management (17 | 16.8%), and Health Technologists (17 | 16.8%).
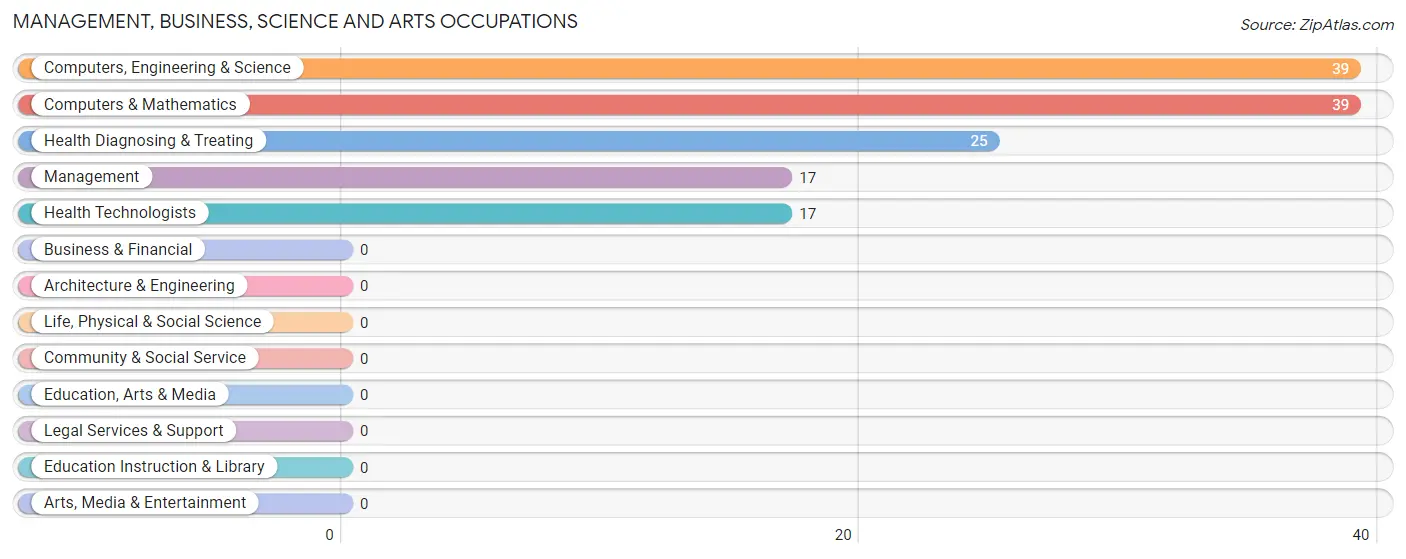
Management, Business, Science and Arts Occupations by Sex
Within the Management, Business, Science and Arts occupations in Maysville, the most male-oriented occupations are Management (100.0%), Computers, Engineering & Science (100.0%), and Computers & Mathematics (100.0%), while the most female-oriented occupations are Health Diagnosing & Treating (100.0%), and Health Technologists (100.0%).
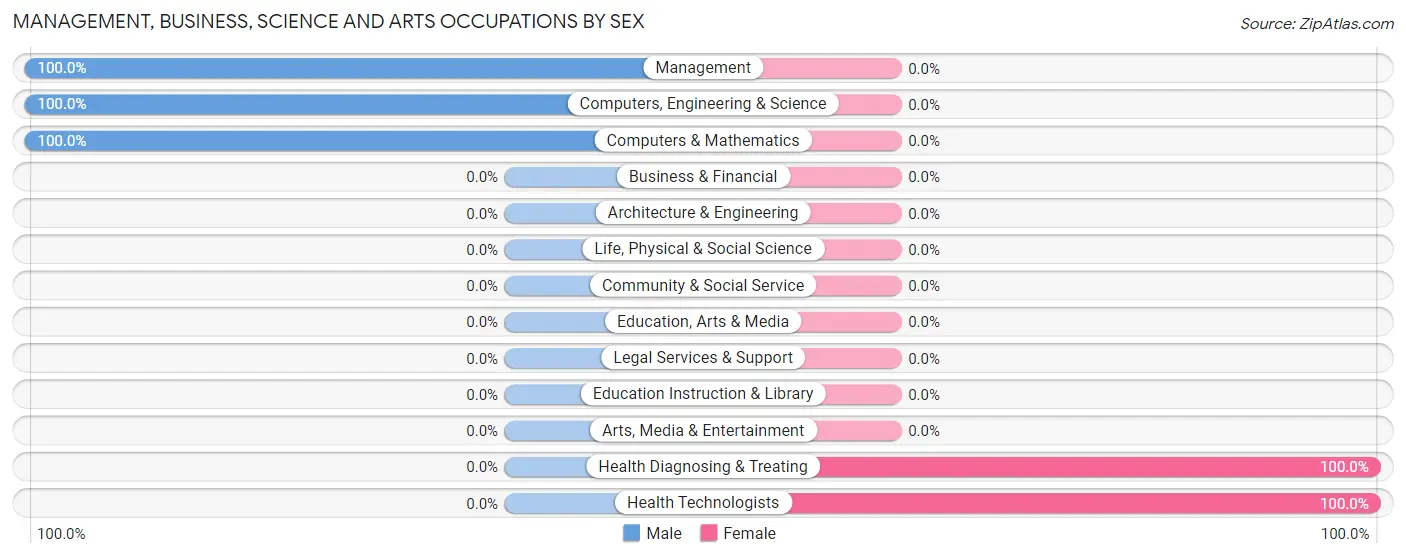
| Occupation | Male | Female |
| Management | 17 (100.0%) | 0 (0.0%) |
| Business & Financial | 0 (0.0%) | 0 (0.0%) |
| Computers, Engineering & Science | 39 (100.0%) | 0 (0.0%) |
| Computers & Mathematics | 39 (100.0%) | 0 (0.0%) |
| Architecture & Engineering | 0 (0.0%) | 0 (0.0%) |
| Life, Physical & Social Science | 0 (0.0%) | 0 (0.0%) |
| Community & Social Service | 0 (0.0%) | 0 (0.0%) |
| Education, Arts & Media | 0 (0.0%) | 0 (0.0%) |
| Legal Services & Support | 0 (0.0%) | 0 (0.0%) |
| Education Instruction & Library | 0 (0.0%) | 0 (0.0%) |
| Arts, Media & Entertainment | 0 (0.0%) | 0 (0.0%) |
| Health Diagnosing & Treating | 0 (0.0%) | 25 (100.0%) |
| Health Technologists | 0 (0.0%) | 17 (100.0%) |
| Total (Category) | 56 (69.1%) | 25 (30.9%) |
| Total (Overall) | 56 (55.4%) | 45 (44.6%) |
Services Occupations
Services Occupations by Sex
| Occupation | Male | Female |
| Healthcare Support | 0 (0.0%) | 0 (0.0%) |
| Security & Protection | 0 (0.0%) | 0 (0.0%) |
| Firefighting & Prevention | 0 (0.0%) | 0 (0.0%) |
| Law Enforcement | 0 (0.0%) | 0 (0.0%) |
| Food Preparation & Serving | 0 (0.0%) | 0 (0.0%) |
| Cleaning & Maintenance | 0 (0.0%) | 0 (0.0%) |
| Personal Care & Service | 0 (0.0%) | 0 (0.0%) |
| Total (Category) | 0 (0.0%) | 0 (0.0%) |
| Total (Overall) | 56 (55.4%) | 45 (44.6%) |
Sales and Office Occupations
The most common Sales and Office occupations in Maysville are Sales & Related (15 | 14.8%), and Office & Administration (5 | 5.0%).
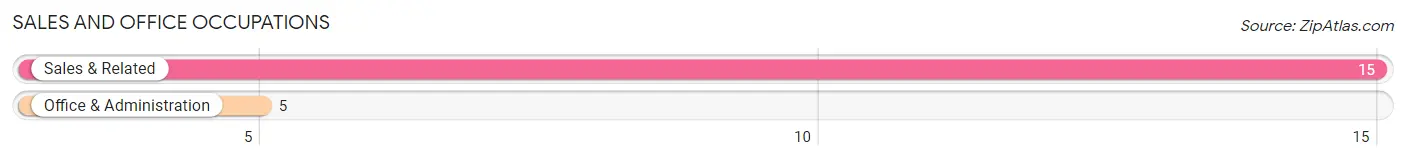
Sales and Office Occupations by Sex
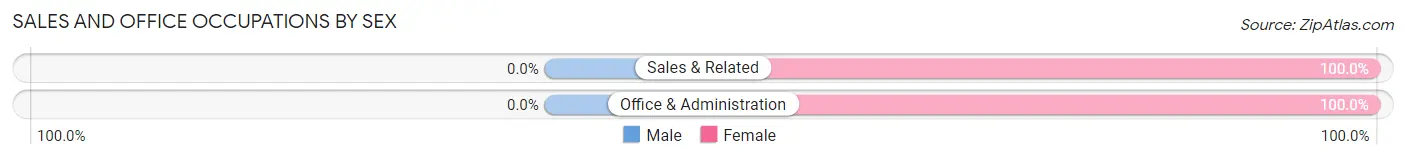
| Occupation | Male | Female |
| Sales & Related | 0 (0.0%) | 15 (100.0%) |
| Office & Administration | 0 (0.0%) | 5 (100.0%) |
| Total (Category) | 0 (0.0%) | 20 (100.0%) |
| Total (Overall) | 56 (55.4%) | 45 (44.6%) |
Natural Resources, Construction and Maintenance Occupations

Natural Resources, Construction and Maintenance Occupations by Sex
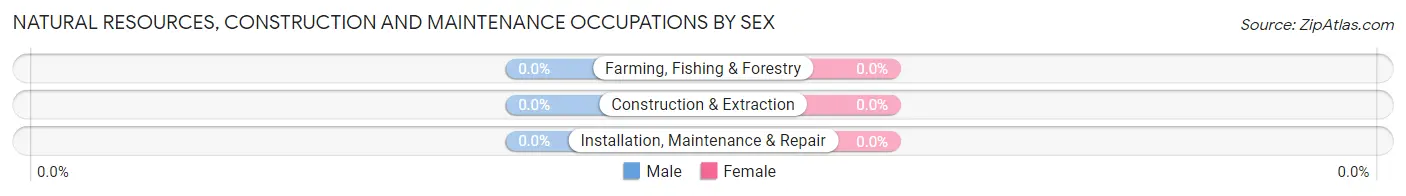
| Occupation | Male | Female |
| Farming, Fishing & Forestry | 0 (0.0%) | 0 (0.0%) |
| Construction & Extraction | 0 (0.0%) | 0 (0.0%) |
| Installation, Maintenance & Repair | 0 (0.0%) | 0 (0.0%) |
| Total (Category) | 0 (0.0%) | 0 (0.0%) |
| Total (Overall) | 56 (55.4%) | 45 (44.6%) |
Production, Transportation and Moving Occupations
Production, Transportation and Moving Occupations by Sex
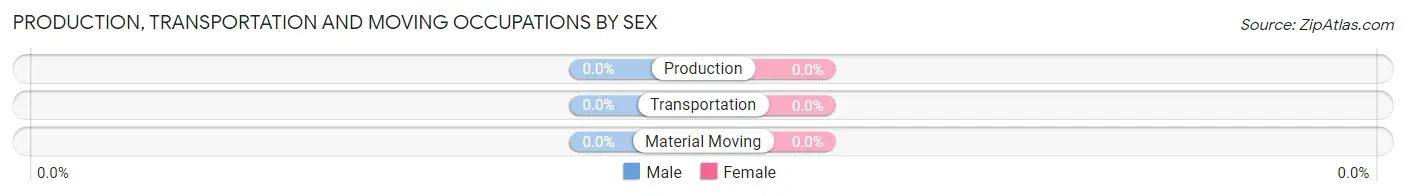
| Occupation | Male | Female |
| Production | 0 (0.0%) | 0 (0.0%) |
| Transportation | 0 (0.0%) | 0 (0.0%) |
| Material Moving | 0 (0.0%) | 0 (0.0%) |
| Total (Category) | 0 (0.0%) | 0 (0.0%) |
| Total (Overall) | 56 (55.4%) | 45 (44.6%) |
Employment Industries by Sex in Maysville
Employment Industries in Maysville
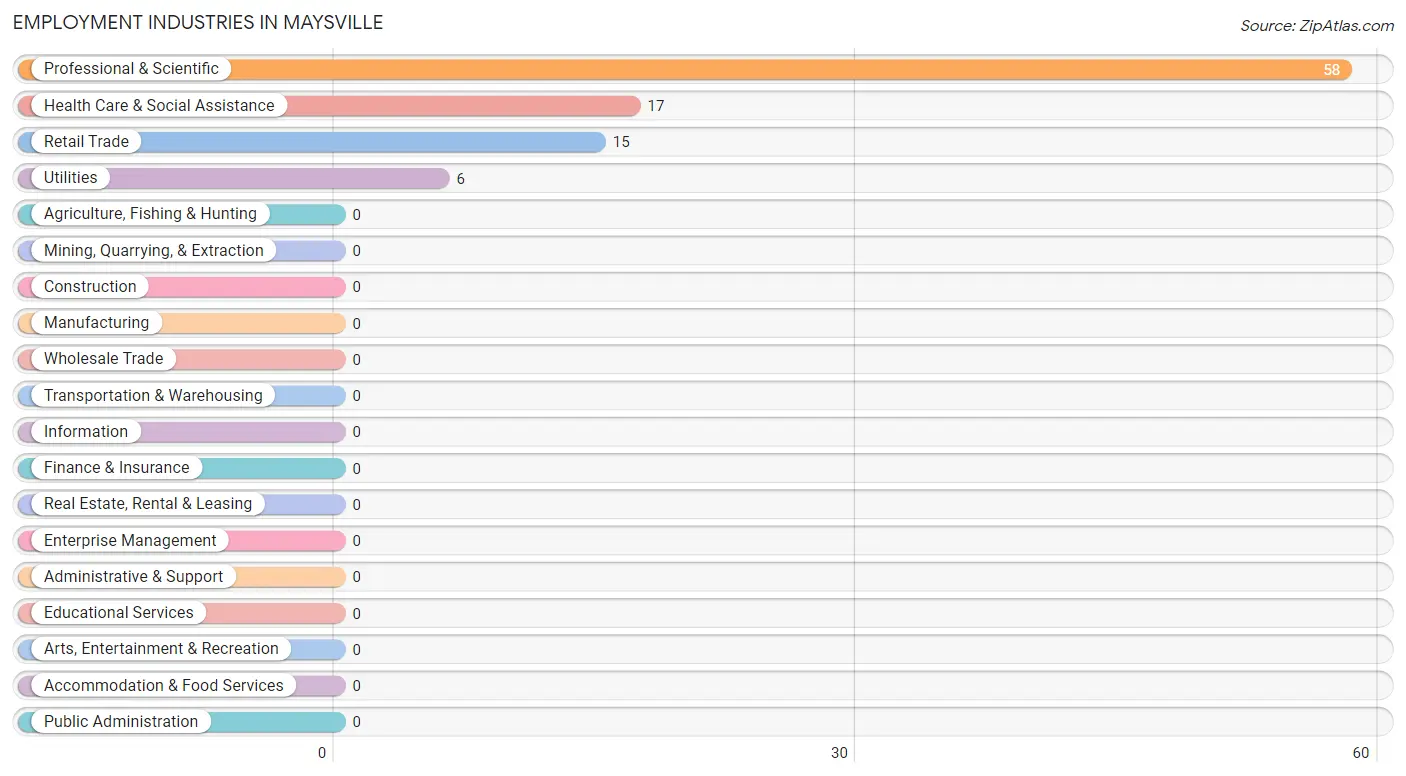
The major employment industries in Maysville include Professional & Scientific (58 | 57.4%), Health Care & Social Assistance (17 | 16.8%), Retail Trade (15 | 14.8%), and Utilities (6 | 5.9%).
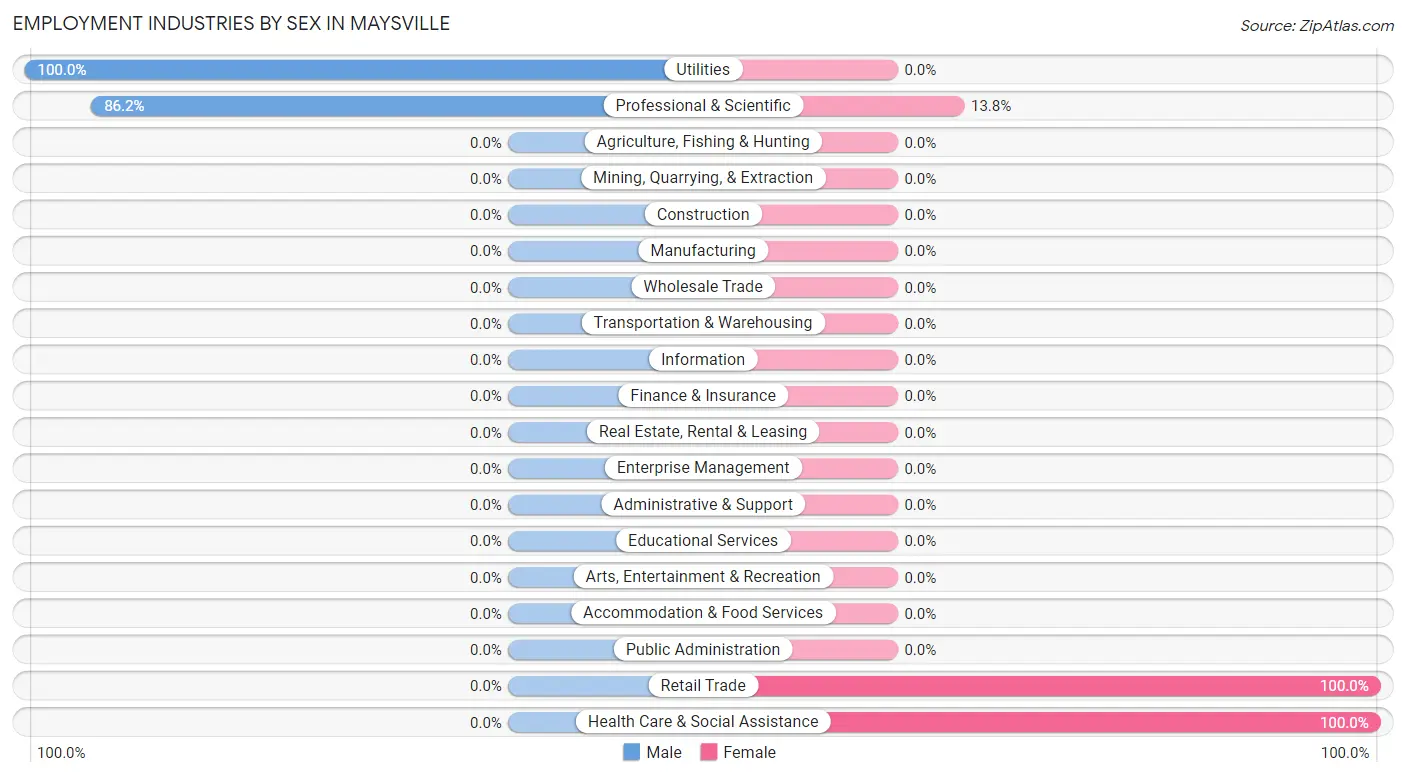
Employment Industries by Sex in Maysville
The Maysville industries that see more men than women are Utilities (100.0%), and Professional & Scientific (86.2%), whereas the industries that tend to have a higher number of women are Retail Trade (100.0%), Health Care & Social Assistance (100.0%), and Professional & Scientific (13.8%).
| Industry | Male | Female |
| Agriculture, Fishing & Hunting | 0 (0.0%) | 0 (0.0%) |
| Mining, Quarrying, & Extraction | 0 (0.0%) | 0 (0.0%) |
| Construction | 0 (0.0%) | 0 (0.0%) |
| Manufacturing | 0 (0.0%) | 0 (0.0%) |
| Wholesale Trade | 0 (0.0%) | 0 (0.0%) |
| Retail Trade | 0 (0.0%) | 15 (100.0%) |
| Transportation & Warehousing | 0 (0.0%) | 0 (0.0%) |
| Utilities | 6 (100.0%) | 0 (0.0%) |
| Information | 0 (0.0%) | 0 (0.0%) |
| Finance & Insurance | 0 (0.0%) | 0 (0.0%) |
| Real Estate, Rental & Leasing | 0 (0.0%) | 0 (0.0%) |
| Professional & Scientific | 50 (86.2%) | 8 (13.8%) |
| Enterprise Management | 0 (0.0%) | 0 (0.0%) |
| Administrative & Support | 0 (0.0%) | 0 (0.0%) |
| Educational Services | 0 (0.0%) | 0 (0.0%) |
| Health Care & Social Assistance | 0 (0.0%) | 17 (100.0%) |
| Arts, Entertainment & Recreation | 0 (0.0%) | 0 (0.0%) |
| Accommodation & Food Services | 0 (0.0%) | 0 (0.0%) |
| Public Administration | 0 (0.0%) | 0 (0.0%) |
| Total | 56 (55.4%) | 45 (44.6%) |
Education in Maysville
School Enrollment in Maysville
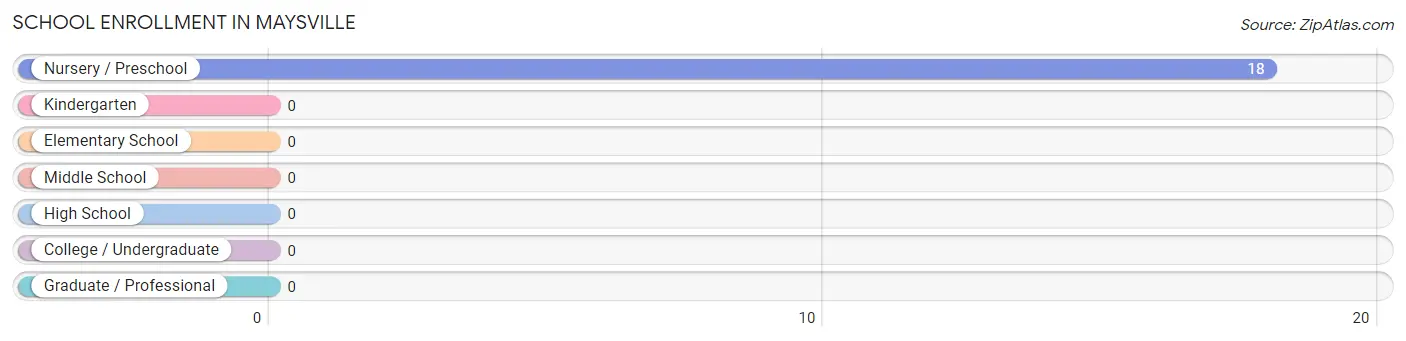
| School Level | # Students | % Students |
| Nursery / Preschool | 18 | 100.0% |
| Kindergarten | 0 | 0.0% |
| Elementary School | 0 | 0.0% |
| Middle School | 0 | 0.0% |
| High School | 0 | 0.0% |
| College / Undergraduate | 0 | 0.0% |
| Graduate / Professional | 0 | 0.0% |
| Total | 18 | 100.0% |
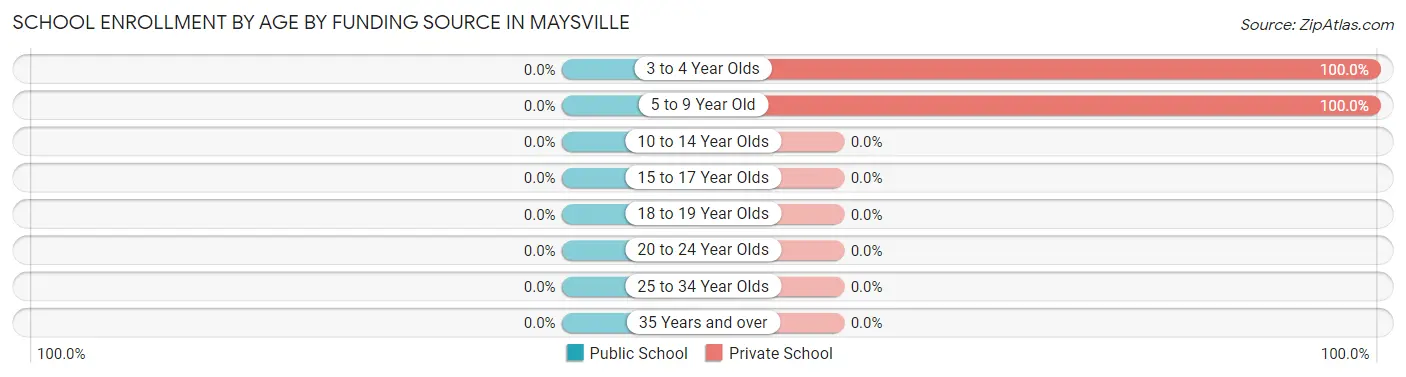
School Enrollment by Age by Funding Source in Maysville
| Age Bracket | Public School | Private School |
| 3 to 4 Year Olds | 0 (0.0%) | 10 (100.0%) |
| 5 to 9 Year Old | 0 (0.0%) | 8 (100.0%) |
| 10 to 14 Year Olds | 0 (0.0%) | 0 (0.0%) |
| 15 to 17 Year Olds | 0 (0.0%) | 0 (0.0%) |
| 18 to 19 Year Olds | 0 (0.0%) | 0 (0.0%) |
| 20 to 24 Year Olds | 0 (0.0%) | 0 (0.0%) |
| 25 to 34 Year Olds | 0 (0.0%) | 0 (0.0%) |
| 35 Years and over | 0 (0.0%) | 0 (0.0%) |
| Total | 0 (0.0%) | 18 (100.0%) |
Educational Attainment by Field of Study in Maysville
Communications (48 | 32.7%), literature & languages (39 | 26.5%), science & technology (18 | 12.2%), bio, nature & agricultural (17 | 11.6%), and business (11 | 7.5%) are the most common fields of study among 147 individuals in Maysville who have obtained a bachelor's degree or higher.
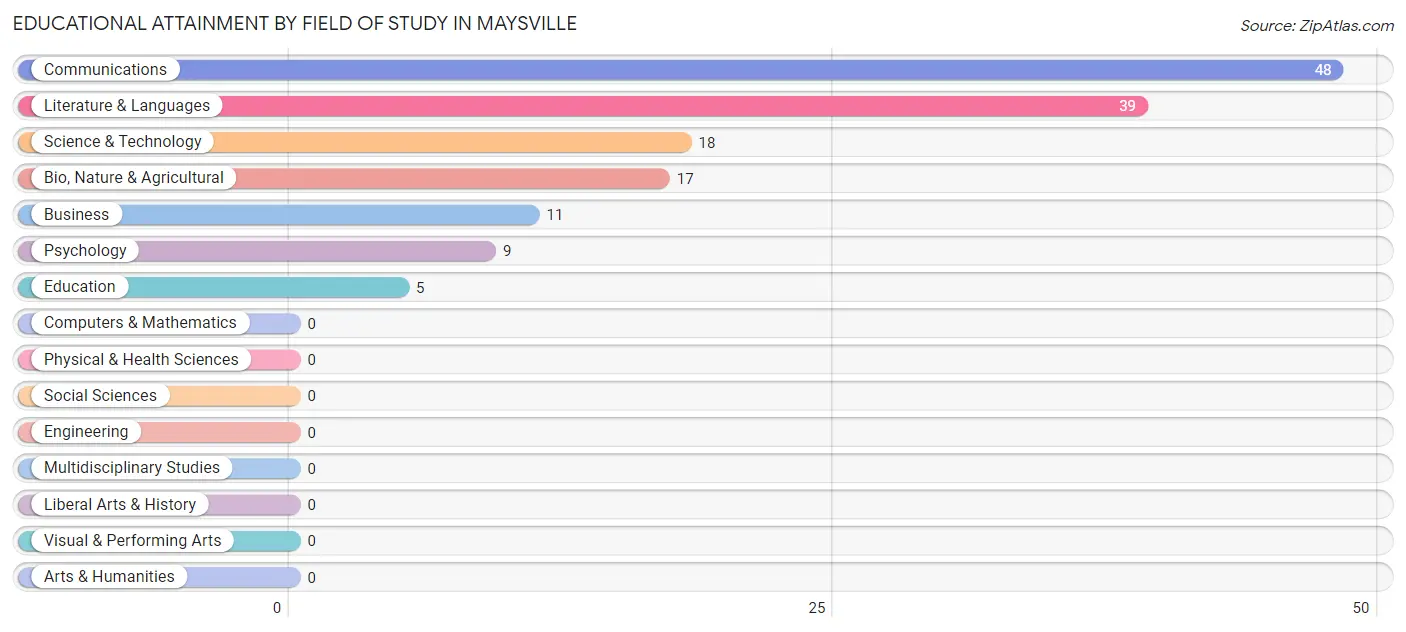
| Field of Study | # Graduates | % Graduates |
| Computers & Mathematics | 0 | 0.0% |
| Bio, Nature & Agricultural | 17 | 11.6% |
| Physical & Health Sciences | 0 | 0.0% |
| Psychology | 9 | 6.1% |
| Social Sciences | 0 | 0.0% |
| Engineering | 0 | 0.0% |
| Multidisciplinary Studies | 0 | 0.0% |
| Science & Technology | 18 | 12.2% |
| Business | 11 | 7.5% |
| Education | 5 | 3.4% |
| Literature & Languages | 39 | 26.5% |
| Liberal Arts & History | 0 | 0.0% |
| Visual & Performing Arts | 0 | 0.0% |
| Communications | 48 | 32.7% |
| Arts & Humanities | 0 | 0.0% |
| Total | 147 | 100.0% |
Transportation & Commute in Maysville
Vehicle Availability by Sex in Maysville
The most prevalent vehicle ownership categories in Maysville are males with 4 vehicles (39, accounting for 69.6%) and females with 4 vehicles (0, making up 86.7%).
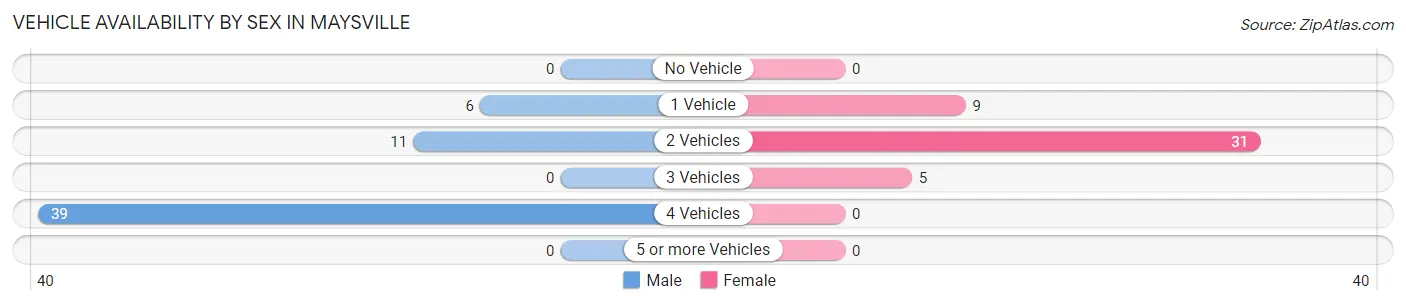
| Vehicles Available | Male | Female |
| No Vehicle | 0 (0.0%) | 0 (0.0%) |
| 1 Vehicle | 6 (10.7%) | 9 (20.0%) |
| 2 Vehicles | 11 (19.6%) | 31 (68.9%) |
| 3 Vehicles | 0 (0.0%) | 5 (11.1%) |
| 4 Vehicles | 39 (69.6%) | 0 (0.0%) |
| 5 or more Vehicles | 0 (0.0%) | 0 (0.0%) |
| Total | 56 (100.0%) | 45 (100.0%) |
Commute Time in Maysville
The most frequently occuring commute durations in Maysville are 20 to 24 minutes (20 commuters, 47.6%), 10 to 14 minutes (8 commuters, 19.1%), and 45 to 59 minutes (8 commuters, 19.1%).
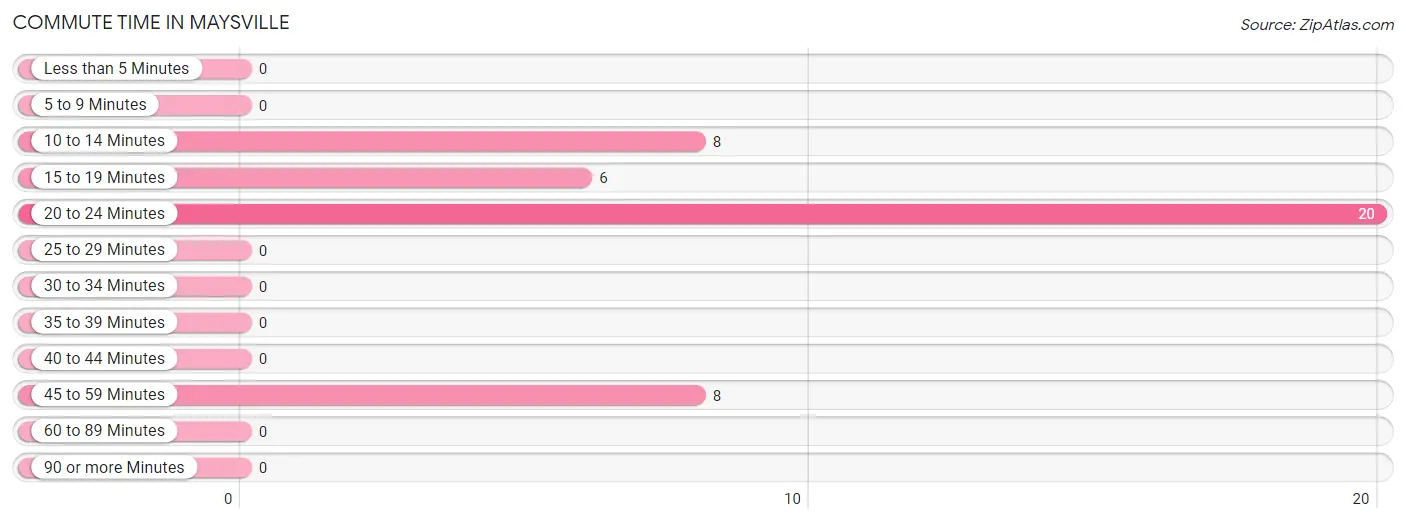
| Commute Time | # Commuters | % Commuters |
| Less than 5 Minutes | 0 | 0.0% |
| 5 to 9 Minutes | 0 | 0.0% |
| 10 to 14 Minutes | 8 | 19.1% |
| 15 to 19 Minutes | 6 | 14.3% |
| 20 to 24 Minutes | 20 | 47.6% |
| 25 to 29 Minutes | 0 | 0.0% |
| 30 to 34 Minutes | 0 | 0.0% |
| 35 to 39 Minutes | 0 | 0.0% |
| 40 to 44 Minutes | 0 | 0.0% |
| 45 to 59 Minutes | 8 | 19.1% |
| 60 to 89 Minutes | 0 | 0.0% |
| 90 or more Minutes | 0 | 0.0% |
Commute Time by Sex in Maysville
The most common commute times in Maysville are 15 to 19 minutes (6 commuters, 100.0%) for males and 20 to 24 minutes (20 commuters, 55.6%) for females.
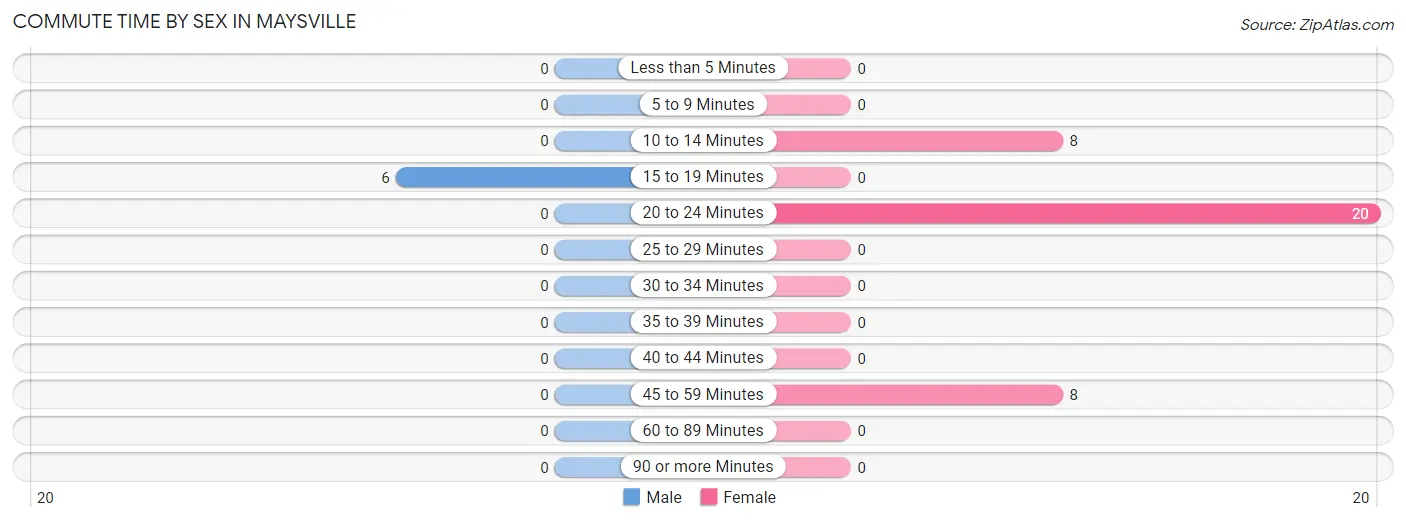
| Commute Time | Male | Female |
| Less than 5 Minutes | 0 (0.0%) | 0 (0.0%) |
| 5 to 9 Minutes | 0 (0.0%) | 0 (0.0%) |
| 10 to 14 Minutes | 0 (0.0%) | 8 (22.2%) |
| 15 to 19 Minutes | 6 (100.0%) | 0 (0.0%) |
| 20 to 24 Minutes | 0 (0.0%) | 20 (55.6%) |
| 25 to 29 Minutes | 0 (0.0%) | 0 (0.0%) |
| 30 to 34 Minutes | 0 (0.0%) | 0 (0.0%) |
| 35 to 39 Minutes | 0 (0.0%) | 0 (0.0%) |
| 40 to 44 Minutes | 0 (0.0%) | 0 (0.0%) |
| 45 to 59 Minutes | 0 (0.0%) | 8 (22.2%) |
| 60 to 89 Minutes | 0 (0.0%) | 0 (0.0%) |
| 90 or more Minutes | 0 (0.0%) | 0 (0.0%) |
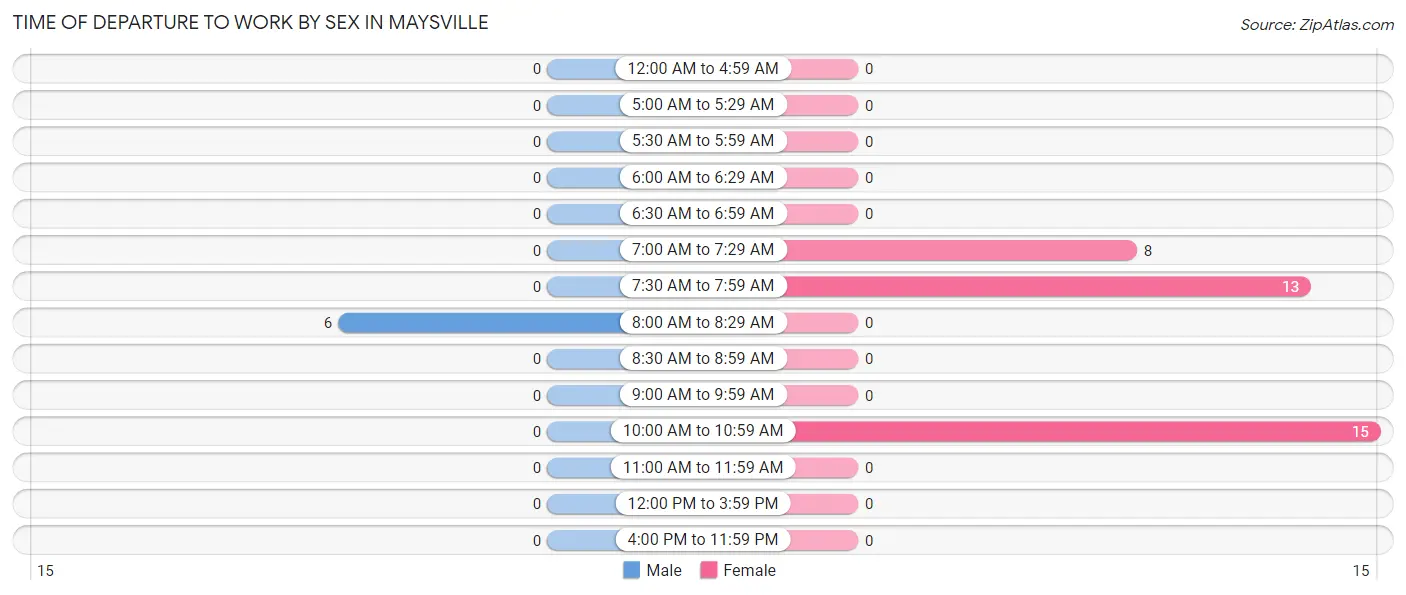
Time of Departure to Work by Sex in Maysville
The most frequent times of departure to work in Maysville are 8:00 AM to 8:29 AM (6, 100.0%) for males and 10:00 AM to 10:59 AM (15, 41.7%) for females.
| Time of Departure | Male | Female |
| 12:00 AM to 4:59 AM | 0 (0.0%) | 0 (0.0%) |
| 5:00 AM to 5:29 AM | 0 (0.0%) | 0 (0.0%) |
| 5:30 AM to 5:59 AM | 0 (0.0%) | 0 (0.0%) |
| 6:00 AM to 6:29 AM | 0 (0.0%) | 0 (0.0%) |
| 6:30 AM to 6:59 AM | 0 (0.0%) | 0 (0.0%) |
| 7:00 AM to 7:29 AM | 0 (0.0%) | 8 (22.2%) |
| 7:30 AM to 7:59 AM | 0 (0.0%) | 13 (36.1%) |
| 8:00 AM to 8:29 AM | 6 (100.0%) | 0 (0.0%) |
| 8:30 AM to 8:59 AM | 0 (0.0%) | 0 (0.0%) |
| 9:00 AM to 9:59 AM | 0 (0.0%) | 0 (0.0%) |
| 10:00 AM to 10:59 AM | 0 (0.0%) | 15 (41.7%) |
| 11:00 AM to 11:59 AM | 0 (0.0%) | 0 (0.0%) |
| 12:00 PM to 3:59 PM | 0 (0.0%) | 0 (0.0%) |
| 4:00 PM to 11:59 PM | 0 (0.0%) | 0 (0.0%) |
| Total | 6 (100.0%) | 36 (100.0%) |
Housing Occupancy in Maysville
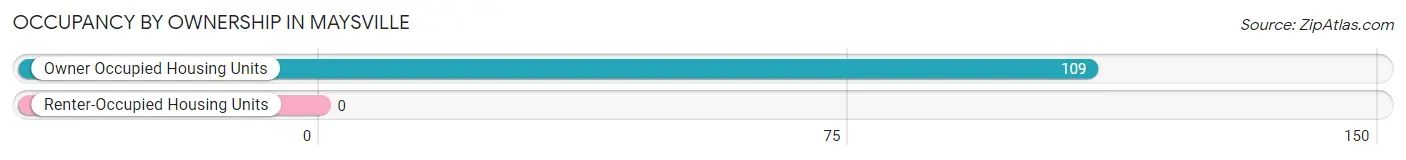
Occupancy by Ownership in Maysville
Of the total 109 dwellings in Maysville, owner-occupied units account for 109 (100.0%), while renter-occupied units make up 0 (0.0%).
| Occupancy | # Housing Units | % Housing Units |
| Owner Occupied Housing Units | 109 | 100.0% |
| Renter-Occupied Housing Units | 0 | 0.0% |
| Total Occupied Housing Units | 109 | 100.0% |
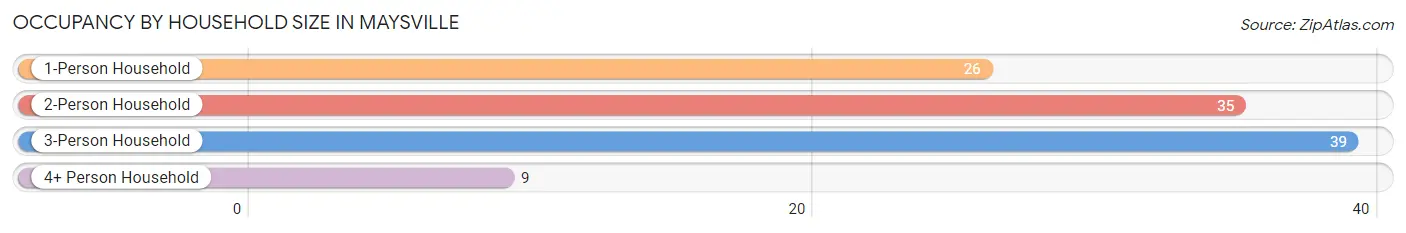
Occupancy by Household Size in Maysville
| Household Size | # Housing Units | % Housing Units |
| 1-Person Household | 26 | 23.8% |
| 2-Person Household | 35 | 32.1% |
| 3-Person Household | 39 | 35.8% |
| 4+ Person Household | 9 | 8.3% |
| Total Housing Units | 109 | 100.0% |
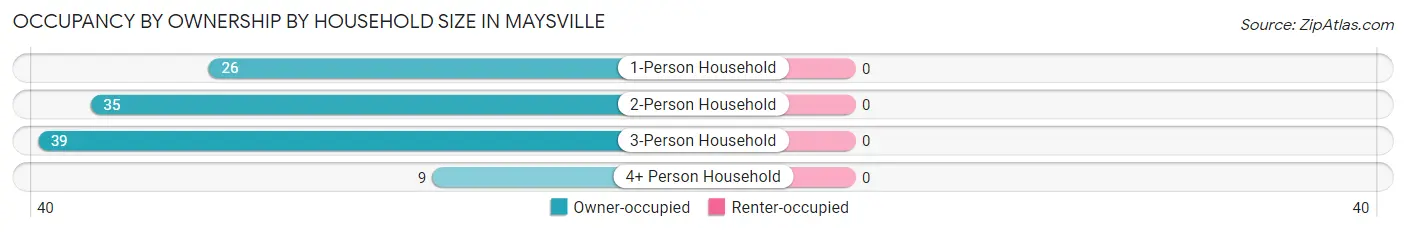
Occupancy by Ownership by Household Size in Maysville
| Household Size | Owner-occupied | Renter-occupied |
| 1-Person Household | 26 (100.0%) | 0 (0.0%) |
| 2-Person Household | 35 (100.0%) | 0 (0.0%) |
| 3-Person Household | 39 (100.0%) | 0 (0.0%) |
| 4+ Person Household | 9 (100.0%) | 0 (0.0%) |
| Total Housing Units | 109 (100.0%) | 0 (0.0%) |
Occupancy by Educational Attainment in Maysville
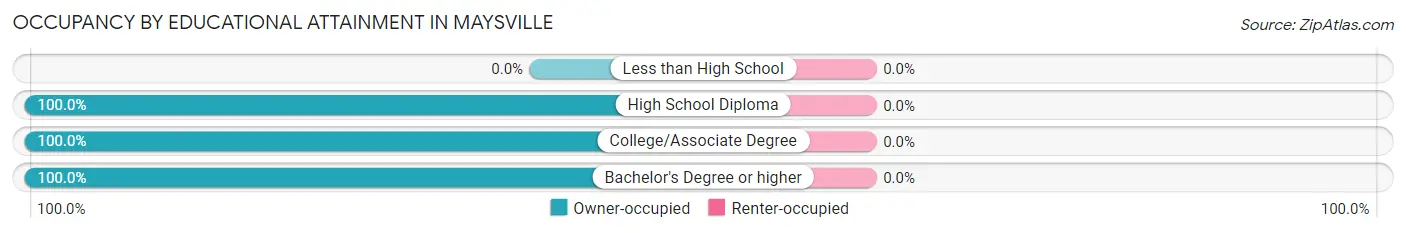
| Household Size | Owner-occupied | Renter-occupied |
| Less than High School | 0 (0.0%) | 0 (0.0%) |
| High School Diploma | 12 (100.0%) | 0 (0.0%) |
| College/Associate Degree | 23 (100.0%) | 0 (0.0%) |
| Bachelor's Degree or higher | 74 (100.0%) | 0 (0.0%) |
Occupancy by Age of Householder in Maysville
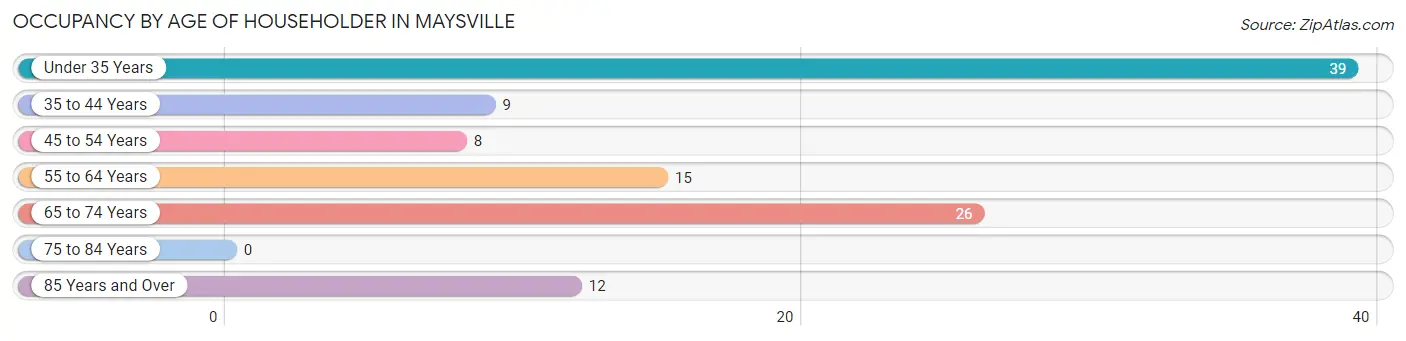
| Age Bracket | # Households | % Households |
| Under 35 Years | 39 | 35.8% |
| 35 to 44 Years | 9 | 8.3% |
| 45 to 54 Years | 8 | 7.3% |
| 55 to 64 Years | 15 | 13.8% |
| 65 to 74 Years | 26 | 23.8% |
| 75 to 84 Years | 0 | 0.0% |
| 85 Years and Over | 12 | 11.0% |
| Total | 109 | 100.0% |
Housing Finances in Maysville
Median Income by Occupancy in Maysville
| Occupancy Type | # Households | Median Income |
| Owner-Occupied | 109 (100.0%) | $0 |
| Renter-Occupied | 0 (0.0%) | $0 |
| Average | 109 (100.0%) | $0 |
Occupancy by Householder Income Bracket in Maysville
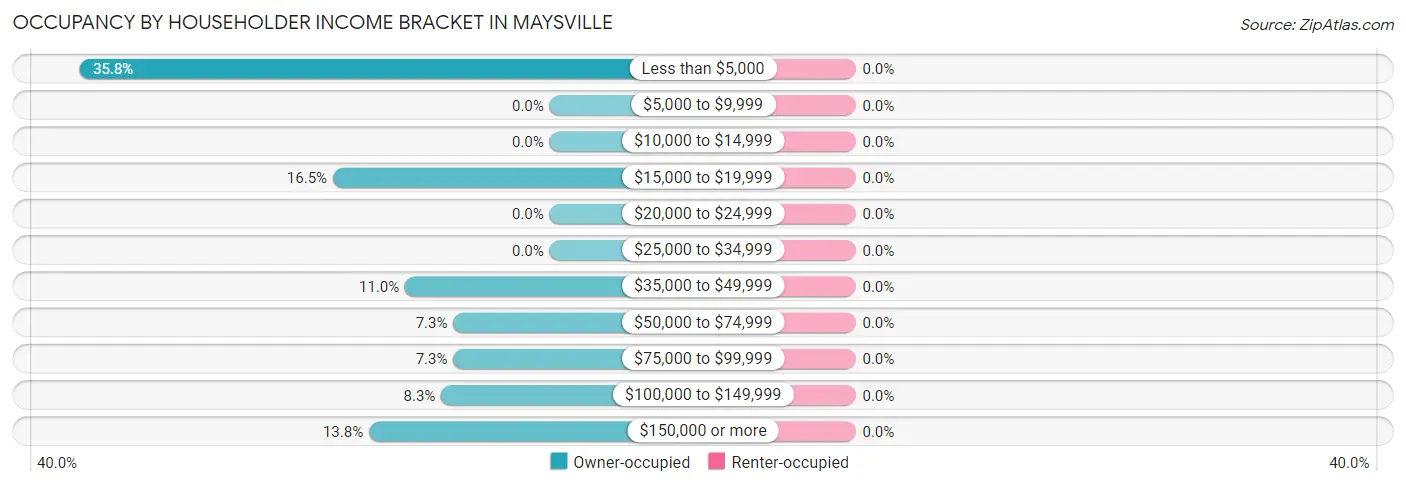
| Income Bracket | Owner-occupied | Renter-occupied |
| Less than $5,000 | 39 (35.8%) | 0 (0.0%) |
| $5,000 to $9,999 | 0 (0.0%) | 0 (0.0%) |
| $10,000 to $14,999 | 0 (0.0%) | 0 (0.0%) |
| $15,000 to $19,999 | 18 (16.5%) | 0 (0.0%) |
| $20,000 to $24,999 | 0 (0.0%) | 0 (0.0%) |
| $25,000 to $34,999 | 0 (0.0%) | 0 (0.0%) |
| $35,000 to $49,999 | 12 (11.0%) | 0 (0.0%) |
| $50,000 to $74,999 | 8 (7.3%) | 0 (0.0%) |
| $75,000 to $99,999 | 8 (7.3%) | 0 (0.0%) |
| $100,000 to $149,999 | 9 (8.3%) | 0 (0.0%) |
| $150,000 or more | 15 (13.8%) | 0 (0.0%) |
| Total | 109 (100.0%) | 0 (0.0%) |
Monthly Housing Cost Tiers in Maysville
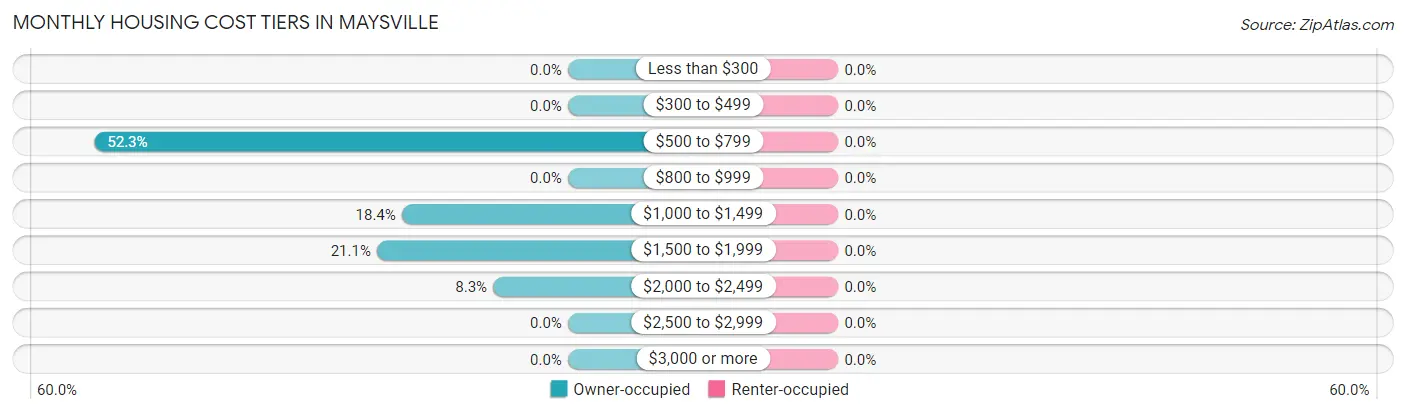
| Monthly Cost | Owner-occupied | Renter-occupied |
| Less than $300 | 0 (0.0%) | 0 (0.0%) |
| $300 to $499 | 0 (0.0%) | 0 (0.0%) |
| $500 to $799 | 57 (52.3%) | 0 (0.0%) |
| $800 to $999 | 0 (0.0%) | 0 (0.0%) |
| $1,000 to $1,499 | 20 (18.3%) | 0 (0.0%) |
| $1,500 to $1,999 | 23 (21.1%) | 0 (0.0%) |
| $2,000 to $2,499 | 9 (8.3%) | 0 (0.0%) |
| $2,500 to $2,999 | 0 (0.0%) | 0 (0.0%) |
| $3,000 or more | 0 (0.0%) | 0 (0.0%) |
| Total | 109 (100.0%) | 0 (0.0%) |
Physical Housing Characteristics in Maysville
Housing Structures in Maysville
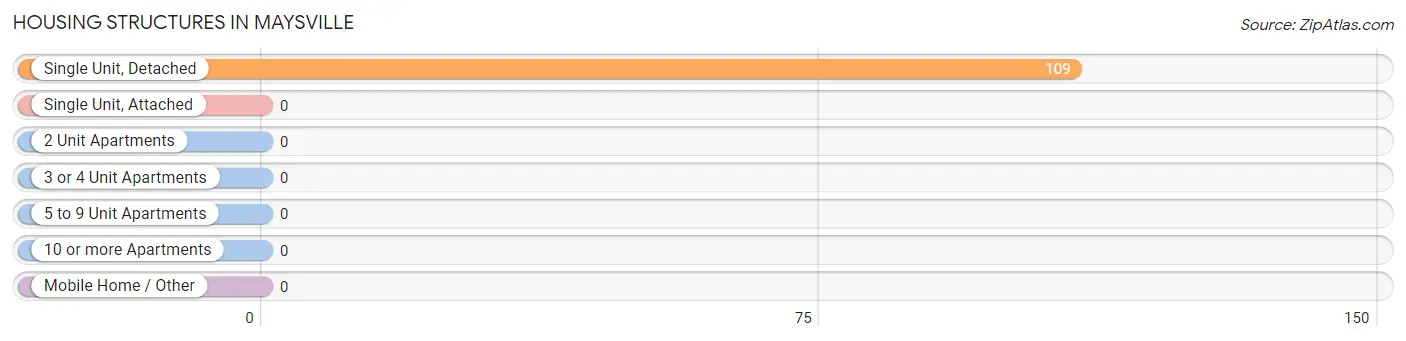
| Structure Type | # Housing Units | % Housing Units |
| Single Unit, Detached | 109 | 100.0% |
| Single Unit, Attached | 0 | 0.0% |
| 2 Unit Apartments | 0 | 0.0% |
| 3 or 4 Unit Apartments | 0 | 0.0% |
| 5 to 9 Unit Apartments | 0 | 0.0% |
| 10 or more Apartments | 0 | 0.0% |
| Mobile Home / Other | 0 | 0.0% |
| Total | 109 | 100.0% |
Housing Structures by Occupancy in Maysville
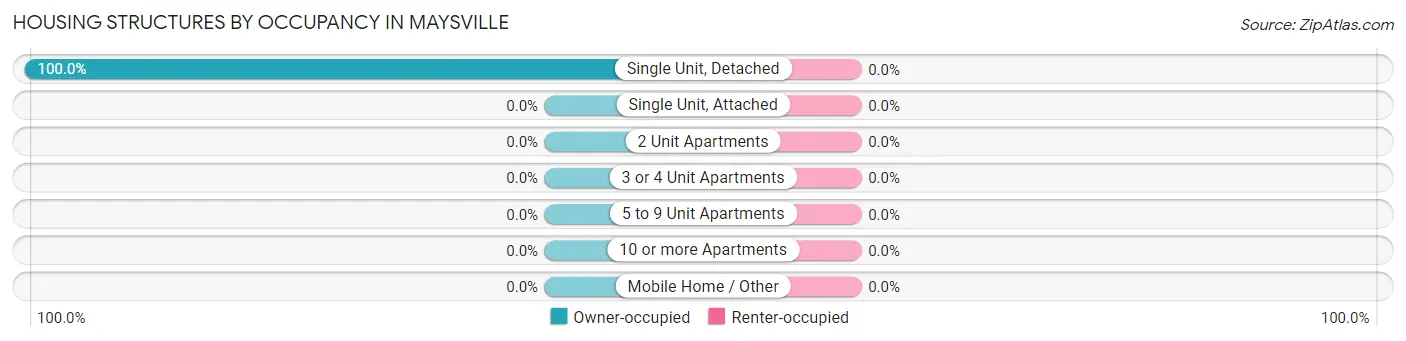
| Structure Type | Owner-occupied | Renter-occupied |
| Single Unit, Detached | 109 (100.0%) | 0 (0.0%) |
| Single Unit, Attached | 0 (0.0%) | 0 (0.0%) |
| 2 Unit Apartments | 0 (0.0%) | 0 (0.0%) |
| 3 or 4 Unit Apartments | 0 (0.0%) | 0 (0.0%) |
| 5 to 9 Unit Apartments | 0 (0.0%) | 0 (0.0%) |
| 10 or more Apartments | 0 (0.0%) | 0 (0.0%) |
| Mobile Home / Other | 0 (0.0%) | 0 (0.0%) |
| Total | 109 (100.0%) | 0 (0.0%) |
Housing Structures by Number of Rooms in Maysville
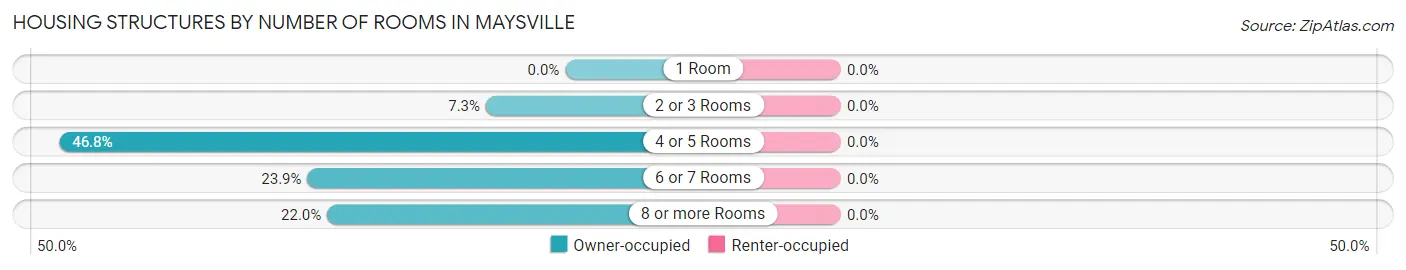
| Number of Rooms | Owner-occupied | Renter-occupied |
| 1 Room | 0 (0.0%) | 0 (0.0%) |
| 2 or 3 Rooms | 8 (7.3%) | 0 (0.0%) |
| 4 or 5 Rooms | 51 (46.8%) | 0 (0.0%) |
| 6 or 7 Rooms | 26 (23.8%) | 0 (0.0%) |
| 8 or more Rooms | 24 (22.0%) | 0 (0.0%) |
| Total | 109 (100.0%) | 0 (0.0%) |
Housing Structure by Heating Type in Maysville
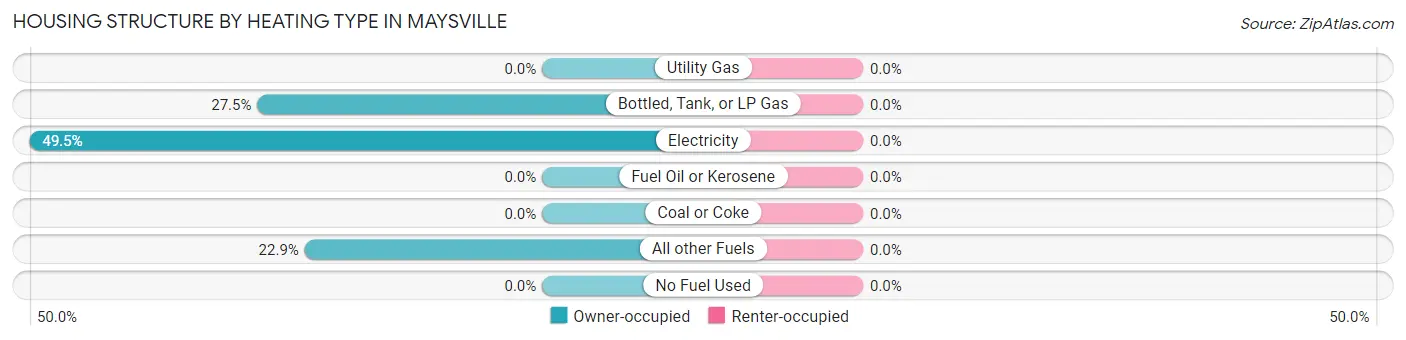
| Heating Type | Owner-occupied | Renter-occupied |
| Utility Gas | 0 (0.0%) | 0 (0.0%) |
| Bottled, Tank, or LP Gas | 30 (27.5%) | 0 (0.0%) |
| Electricity | 54 (49.5%) | 0 (0.0%) |
| Fuel Oil or Kerosene | 0 (0.0%) | 0 (0.0%) |
| Coal or Coke | 0 (0.0%) | 0 (0.0%) |
| All other Fuels | 25 (22.9%) | 0 (0.0%) |
| No Fuel Used | 0 (0.0%) | 0 (0.0%) |
| Total | 109 (100.0%) | 0 (0.0%) |
Household Vehicle Usage in Maysville
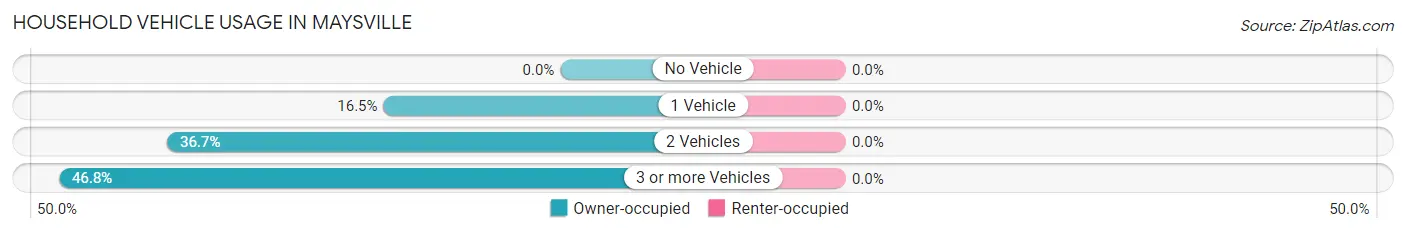
| Vehicles per Household | Owner-occupied | Renter-occupied |
| No Vehicle | 0 (0.0%) | 0 (0.0%) |
| 1 Vehicle | 18 (16.5%) | 0 (0.0%) |
| 2 Vehicles | 40 (36.7%) | 0 (0.0%) |
| 3 or more Vehicles | 51 (46.8%) | 0 (0.0%) |
| Total | 109 (100.0%) | 0 (0.0%) |
Real Estate & Mortgages in Maysville
Real Estate and Mortgage Overview in Maysville
| Characteristic | Without Mortgage | With Mortgage |
| Housing Units | 51 | 58 |
| Median Property Value | - | - |
| Median Household Income | - | - |
| Monthly Housing Costs | - | - |
| Real Estate Taxes | - | - |
Property Value by Mortgage Status in Maysville
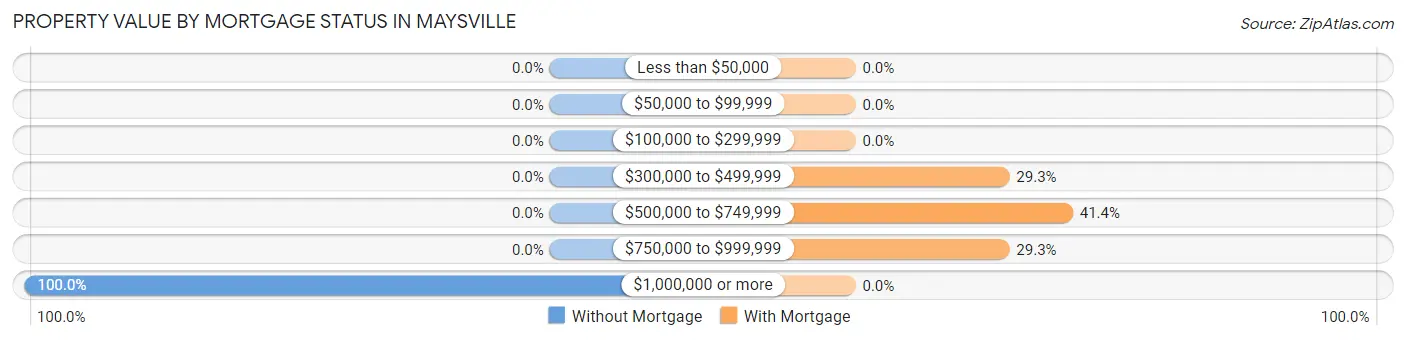
| Property Value | Without Mortgage | With Mortgage |
| Less than $50,000 | 0 (0.0%) | 0 (0.0%) |
| $50,000 to $99,999 | 0 (0.0%) | 0 (0.0%) |
| $100,000 to $299,999 | 0 (0.0%) | 0 (0.0%) |
| $300,000 to $499,999 | 0 (0.0%) | 17 (29.3%) |
| $500,000 to $749,999 | 0 (0.0%) | 24 (41.4%) |
| $750,000 to $999,999 | 0 (0.0%) | 17 (29.3%) |
| $1,000,000 or more | 51 (100.0%) | 0 (0.0%) |
| Total | 51 (100.0%) | 58 (100.0%) |
Household Income by Mortgage Status in Maysville
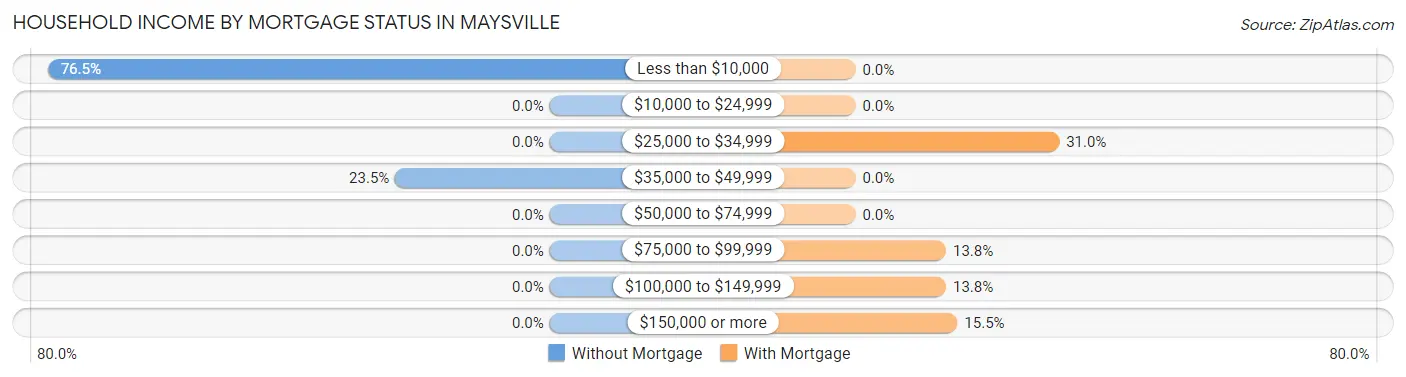
| Household Income | Without Mortgage | With Mortgage |
| Less than $10,000 | 39 (76.5%) | 0 (0.0%) |
| $10,000 to $24,999 | 0 (0.0%) | 0 (0.0%) |
| $25,000 to $34,999 | 0 (0.0%) | 18 (31.0%) |
| $35,000 to $49,999 | 12 (23.5%) | 0 (0.0%) |
| $50,000 to $74,999 | 0 (0.0%) | 0 (0.0%) |
| $75,000 to $99,999 | 0 (0.0%) | 8 (13.8%) |
| $100,000 to $149,999 | 0 (0.0%) | 8 (13.8%) |
| $150,000 or more | 0 (0.0%) | 9 (15.5%) |
| Total | 51 (100.0%) | 58 (100.0%) |
Property Value to Household Income Ratio in Maysville
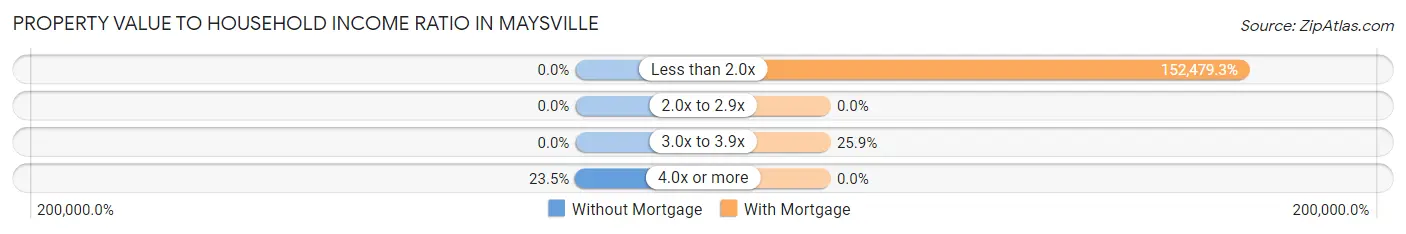
| Value-to-Income Ratio | Without Mortgage | With Mortgage |
| Less than 2.0x | 0 (0.0%) | 88,438 (152,479.3%) |
| 2.0x to 2.9x | 0 (0.0%) | 0 (0.0%) |
| 3.0x to 3.9x | 0 (0.0%) | 15 (25.9%) |
| 4.0x or more | 12 (23.5%) | 0 (0.0%) |
| Total | 51 (100.0%) | 58 (100.0%) |
Real Estate Taxes by Mortgage Status in Maysville
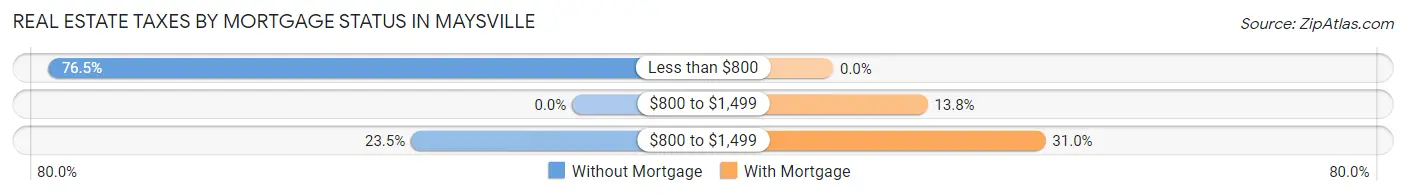
| Property Taxes | Without Mortgage | With Mortgage |
| Less than $800 | 39 (76.5%) | 0 (0.0%) |
| $800 to $1,499 | 0 (0.0%) | 8 (13.8%) |
| $800 to $1,499 | 12 (23.5%) | 18 (31.0%) |
| Total | 51 (100.0%) | 58 (100.0%) |
Health & Disability in Maysville
Health Insurance Coverage by Age in Maysville
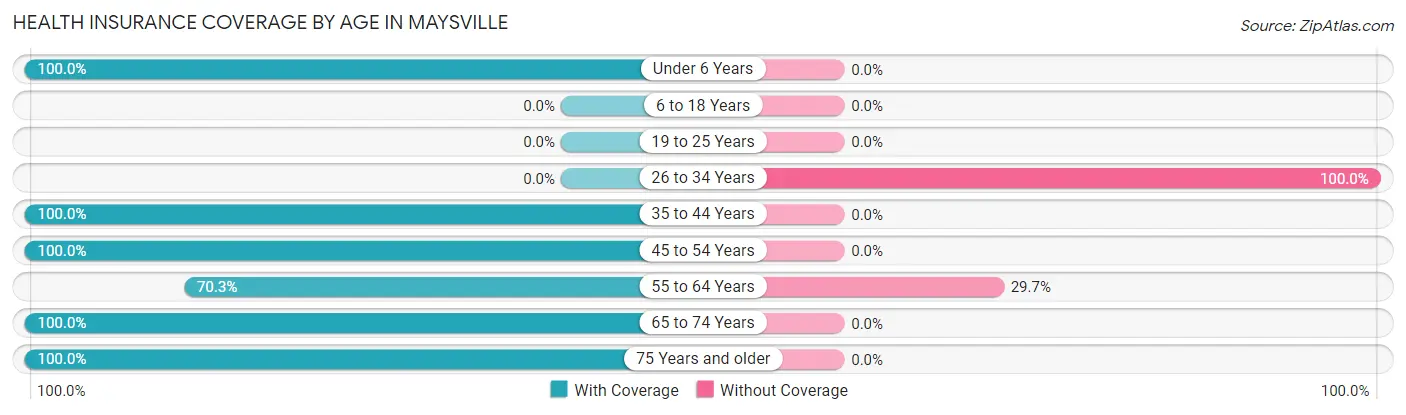
| Age Bracket | With Coverage | Without Coverage |
| Under 6 Years | 18 (100.0%) | 0 (0.0%) |
| 6 to 18 Years | 0 (0.0%) | 0 (0.0%) |
| 19 to 25 Years | 0 (0.0%) | 0 (0.0%) |
| 26 to 34 Years | 0 (0.0%) | 39 (100.0%) |
| 35 to 44 Years | 15 (100.0%) | 0 (0.0%) |
| 45 to 54 Years | 8 (100.0%) | 0 (0.0%) |
| 55 to 64 Years | 26 (70.3%) | 11 (29.7%) |
| 65 to 74 Years | 39 (100.0%) | 0 (0.0%) |
| 75 Years and older | 12 (100.0%) | 0 (0.0%) |
| Total | 118 (70.2%) | 50 (29.8%) |
Health Insurance Coverage by Citizenship Status in Maysville
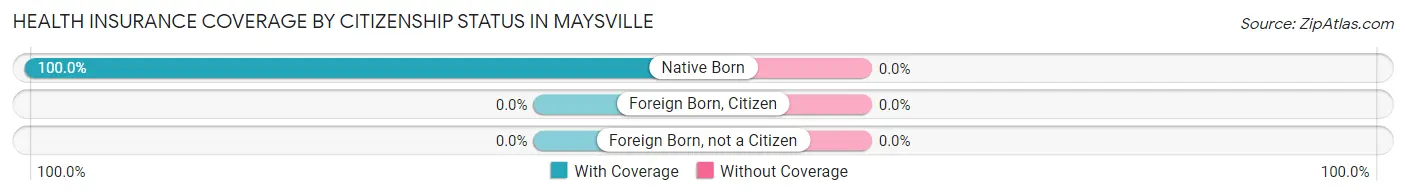
| Citizenship Status | With Coverage | Without Coverage |
| Native Born | 18 (100.0%) | 0 (0.0%) |
| Foreign Born, Citizen | 0 (0.0%) | 0 (0.0%) |
| Foreign Born, not a Citizen | 0 (0.0%) | 0 (0.0%) |
Health Insurance Coverage by Household Income in Maysville
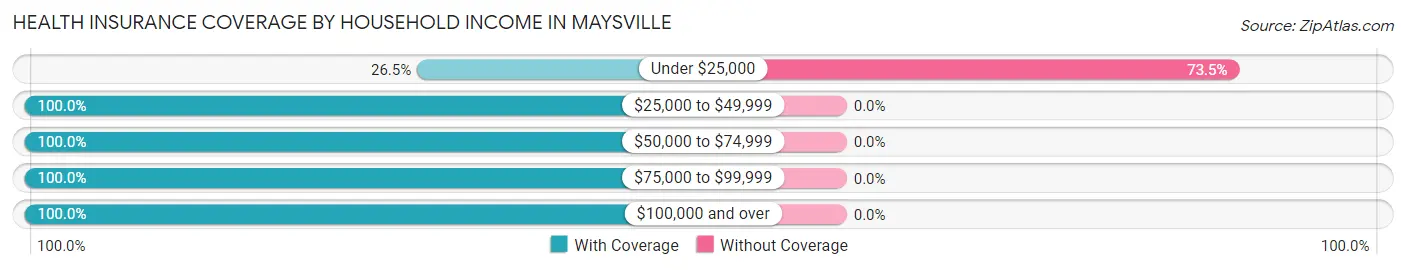
| Household Income | With Coverage | Without Coverage |
| Under $25,000 | 18 (26.5%) | 50 (73.5%) |
| $25,000 to $49,999 | 17 (100.0%) | 0 (0.0%) |
| $50,000 to $74,999 | 16 (100.0%) | 0 (0.0%) |
| $75,000 to $99,999 | 8 (100.0%) | 0 (0.0%) |
| $100,000 and over | 59 (100.0%) | 0 (0.0%) |
Public vs Private Health Insurance Coverage by Age in Maysville
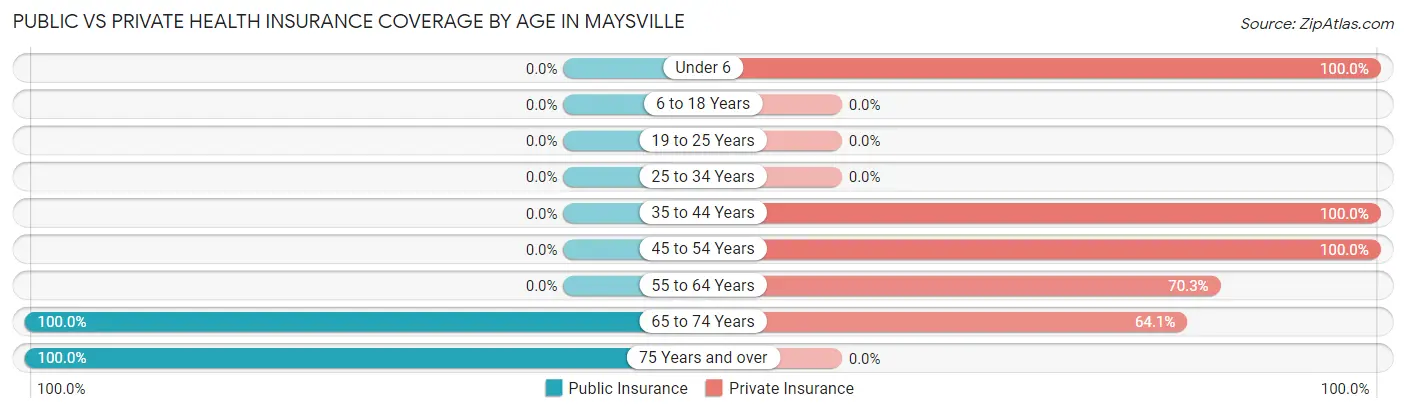
| Age Bracket | Public Insurance | Private Insurance |
| Under 6 | 0 (0.0%) | 18 (100.0%) |
| 6 to 18 Years | 0 (0.0%) | 0 (0.0%) |
| 19 to 25 Years | 0 (0.0%) | 0 (0.0%) |
| 25 to 34 Years | 0 (0.0%) | 0 (0.0%) |
| 35 to 44 Years | 0 (0.0%) | 15 (100.0%) |
| 45 to 54 Years | 0 (0.0%) | 8 (100.0%) |
| 55 to 64 Years | 0 (0.0%) | 26 (70.3%) |
| 65 to 74 Years | 39 (100.0%) | 25 (64.1%) |
| 75 Years and over | 12 (100.0%) | 0 (0.0%) |
| Total | 51 (30.4%) | 92 (54.8%) |
Disability Status by Sex by Age in Maysville
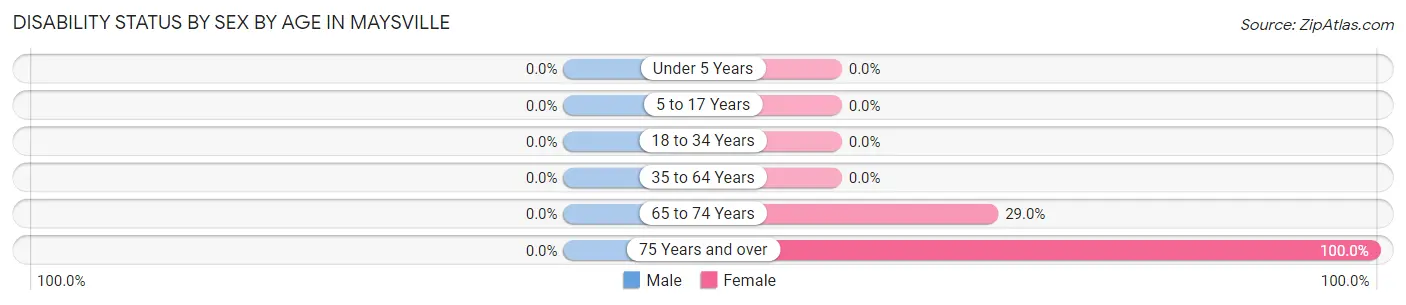
| Age Bracket | Male | Female |
| Under 5 Years | 0 (0.0%) | 0 (0.0%) |
| 5 to 17 Years | 0 (0.0%) | 0 (0.0%) |
| 18 to 34 Years | 0 (0.0%) | 0 (0.0%) |
| 35 to 64 Years | 0 (0.0%) | 0 (0.0%) |
| 65 to 74 Years | 0 (0.0%) | 9 (29.0%) |
| 75 Years and over | 0 (0.0%) | 12 (100.0%) |
Disability Class by Sex by Age in Maysville
Disability Class: Hearing Difficulty
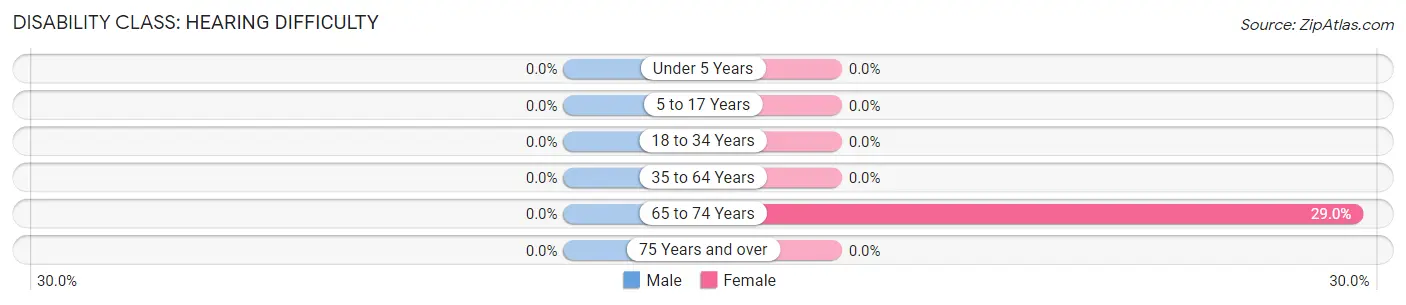
| Age Bracket | Male | Female |
| Under 5 Years | 0 (0.0%) | 0 (0.0%) |
| 5 to 17 Years | 0 (0.0%) | 0 (0.0%) |
| 18 to 34 Years | 0 (0.0%) | 0 (0.0%) |
| 35 to 64 Years | 0 (0.0%) | 0 (0.0%) |
| 65 to 74 Years | 0 (0.0%) | 9 (29.0%) |
| 75 Years and over | 0 (0.0%) | 0 (0.0%) |
Disability Class: Vision Difficulty
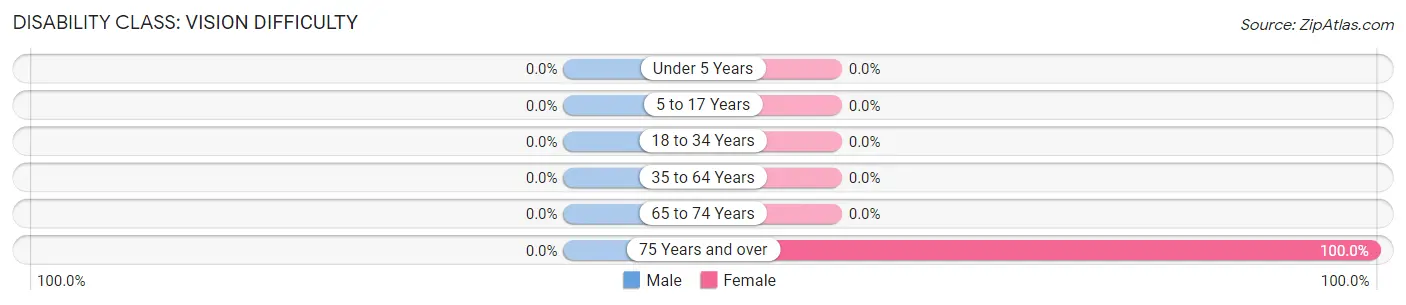
| Age Bracket | Male | Female |
| Under 5 Years | 0 (0.0%) | 0 (0.0%) |
| 5 to 17 Years | 0 (0.0%) | 0 (0.0%) |
| 18 to 34 Years | 0 (0.0%) | 0 (0.0%) |
| 35 to 64 Years | 0 (0.0%) | 0 (0.0%) |
| 65 to 74 Years | 0 (0.0%) | 0 (0.0%) |
| 75 Years and over | 0 (0.0%) | 12 (100.0%) |
Disability Class: Cognitive Difficulty
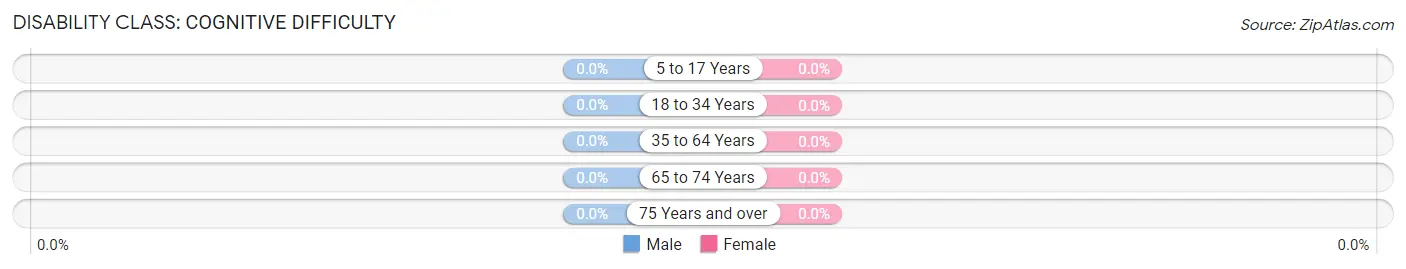
| Age Bracket | Male | Female |
| 5 to 17 Years | 0 (0.0%) | 0 (0.0%) |
| 18 to 34 Years | 0 (0.0%) | 0 (0.0%) |
| 35 to 64 Years | 0 (0.0%) | 0 (0.0%) |
| 65 to 74 Years | 0 (0.0%) | 0 (0.0%) |
| 75 Years and over | 0 (0.0%) | 0 (0.0%) |
Disability Class: Ambulatory Difficulty
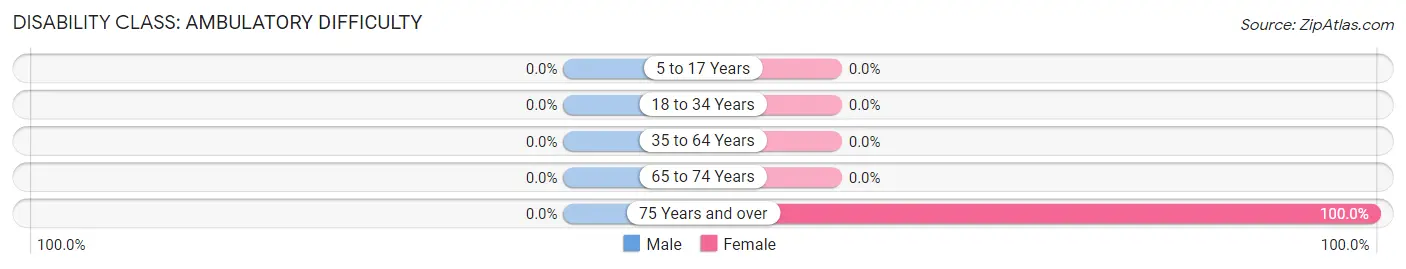
| Age Bracket | Male | Female |
| 5 to 17 Years | 0 (0.0%) | 0 (0.0%) |
| 18 to 34 Years | 0 (0.0%) | 0 (0.0%) |
| 35 to 64 Years | 0 (0.0%) | 0 (0.0%) |
| 65 to 74 Years | 0 (0.0%) | 0 (0.0%) |
| 75 Years and over | 0 (0.0%) | 12 (100.0%) |
Disability Class: Self-Care Difficulty
| Age Bracket | Male | Female |
| 5 to 17 Years | 0 (0.0%) | 0 (0.0%) |
| 18 to 34 Years | 0 (0.0%) | 0 (0.0%) |
| 35 to 64 Years | 0 (0.0%) | 0 (0.0%) |
| 65 to 74 Years | 0 (0.0%) | 0 (0.0%) |
| 75 Years and over | 0 (0.0%) | 0 (0.0%) |
Technology Access in Maysville
Computing Device Access in Maysville
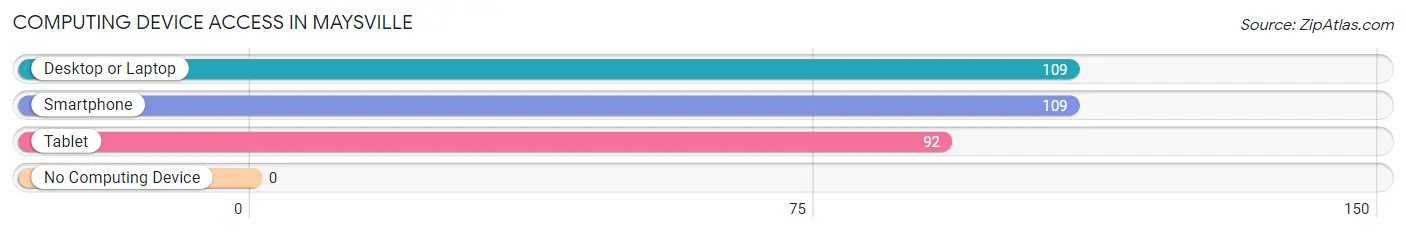
| Device Type | # Households | % Households |
| Desktop or Laptop | 109 | 100.0% |
| Smartphone | 109 | 100.0% |
| Tablet | 92 | 84.4% |
| No Computing Device | 0 | 0.0% |
| Total | 109 | 100.0% |
Internet Access in Maysville
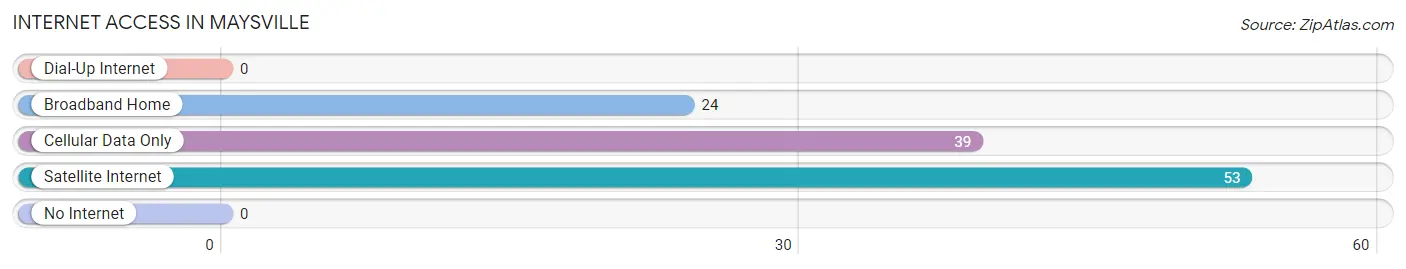
| Internet Type | # Households | % Households |
| Dial-Up Internet | 0 | 0.0% |
| Broadband Home | 24 | 22.0% |
| Cellular Data Only | 39 | 35.8% |
| Satellite Internet | 53 | 48.6% |
| No Internet | 0 | 0.0% |
| Total | 109 | 100.0% |
Maysville Summary
Maysville is a small town located in the state of Colorado, in the United States. It is situated in the foothills of the Rocky Mountains, about 25 miles northwest of Denver. The town was founded in 1872 and has a population of approximately 1,000 people.
History
Maysville was founded in 1872 by a group of settlers from the Midwest. The town was named after the first settler, William May, who had come to the area in search of gold. The town quickly grew and by the late 1800s, it had become a bustling mining town. The town was also home to a number of saloons, hotels, and other businesses.
In the early 1900s, the town began to decline as the gold rush ended and the mines closed. However, the town was able to survive due to its location near Denver and the nearby railroad. The town was also able to attract new businesses, such as a sawmill and a brick factory.
In the 1950s, the town began to experience a resurgence as the nearby ski resorts began to attract tourists. The town was also able to attract new businesses, such as a ski shop and a restaurant.
Geography
Maysville is located in the foothills of the Rocky Mountains, about 25 miles northwest of Denver. The town is situated at an elevation of 6,500 feet and is surrounded by mountains and forests. The town is located in a valley, which is surrounded by the Arapaho National Forest.
The town is located in a semi-arid climate, with hot summers and cold winters. The average annual temperature is around 50 degrees Fahrenheit. The town receives an average of 16 inches of precipitation per year.
Economy
Maysville’s economy is largely based on tourism. The town is home to a number of ski resorts, which attract visitors from all over the world. The town is also home to a number of restaurants, shops, and other businesses.
The town is also home to a number of manufacturing businesses, such as a sawmill and a brick factory. The town is also home to a number of small farms, which produce a variety of crops, such as hay, wheat, and corn.
Demographics
As of the 2010 census, the population of Maysville was 1,000 people. The town is predominantly white, with about 95% of the population being Caucasian. The town also has a small Hispanic population, with about 5% of the population being of Hispanic or Latino origin.
The median household income in Maysville is around $50,000 per year. The town has a low unemployment rate, with only about 4% of the population being unemployed. The town also has a low poverty rate, with only about 8% of the population living below the poverty line.
Common Questions
What is Per Capita Income in Maysville?
Per Capita income in Maysville is $29,223.
What is Income or Wage Gap in Maysville?
Income or Wage Gap in Maysville is 95.6%.
Women in Maysville earn 4.4 cents for every dollar earned by a man.
What is Inequality or Gini Index in Maysville?
Inequality or Gini Index in Maysville is 0.65.
What is the Total Population of Maysville?
Total Population of Maysville is 168.
What is the Total Male Population of Maysville?
Total Male Population of Maysville is 80.
What is the Total Female Population of Maysville?
Total Female Population of Maysville is 88.
What is the Ratio of Males per 100 Females in Maysville?
There are 90.91 Males per 100 Females in Maysville.
What is the Ratio of Females per 100 Males in Maysville?
There are 110.00 Females per 100 Males in Maysville.
What is the Median Population Age in Maysville?
Median Population Age in Maysville is 57.5 Years.
What is the Average Family Size in Maysville
Average Family Size in Maysville is 1.7 People.
What is the Average Household Size in Maysville
Average Household Size in Maysville is 1.5 People.
How Large is the Labor Force in Maysville?
There are 101 People in the Labor Forcein in Maysville.
What is the Percentage of People in the Labor Force in Maysville?
67.3% of People are in the Labor Force in Maysville.