Nickerson, NE Map & Demographics
Nickerson Map
Nickerson Overview
$31,192
PER CAPITA INCOME
$145,099
AVG FAMILY INCOME
57.3%
WAGE / INCOME GAP [ % ]
42.7¢/ $1
WAGE / INCOME GAP [ $ ]
0.32
INEQUALITY / GINI INDEX
542
TOTAL POPULATION
387
MALE POPULATION
155
FEMALE POPULATION
249.68
MALES / 100 FEMALES
40.05
FEMALES / 100 MALES
25.0
MEDIAN AGE
3.2
AVG FAMILY SIZE
3.0
AVG HOUSEHOLD SIZE
283
LABOR FORCE [ PEOPLE ]
64.3%
PERCENT IN LABOR FORCE
3.9%
UNEMPLOYMENT RATE
Nickerson Zip Codes
Income in Nickerson
Income Overview in Nickerson
| Characteristic | Number | Measure |
| Per Capita Income | 542 | $31,192 |
| Median Family Income | 148 | $145,099 |
| Mean Family Income | 148 | $101,003 |
| Median Household Income | 182 | $0 |
| Mean Household Income | 182 | $91,985 |
| Income Deficit | 148 | $0 |
| Wage / Income Gap (%) | 542 | 57.31% |
| Wage / Income Gap ($) | 542 | 42.69¢ per $1 |
| Gini / Inequality Index | 542 | 0.32 |
Earnings by Sex in Nickerson
Average Earnings in Nickerson are $45,668, $46,220 for men and $19,732 for women, a difference of 57.3%.
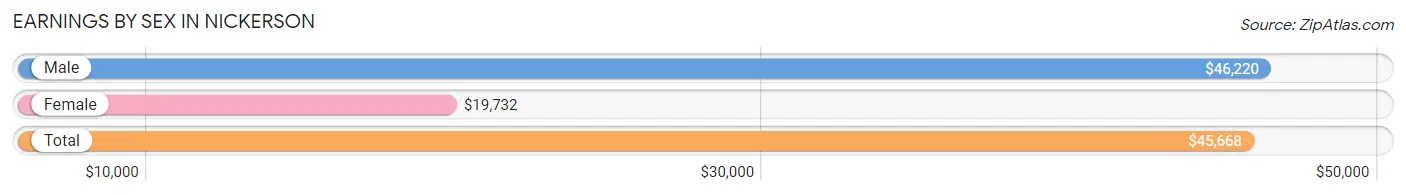
| Sex | Number | Average Earnings |
| Male | 288 (82.5%) | $46,220 |
| Female | 61 (17.5%) | $19,732 |
| Total | 349 (100.0%) | $45,668 |
Earnings by Sex by Income Bracket in Nickerson
The most common earnings brackets in Nickerson are $75,000 to $99,999 for men (88 | 30.6%) and $17,500 to $19,999 for women (14 | 23.0%).
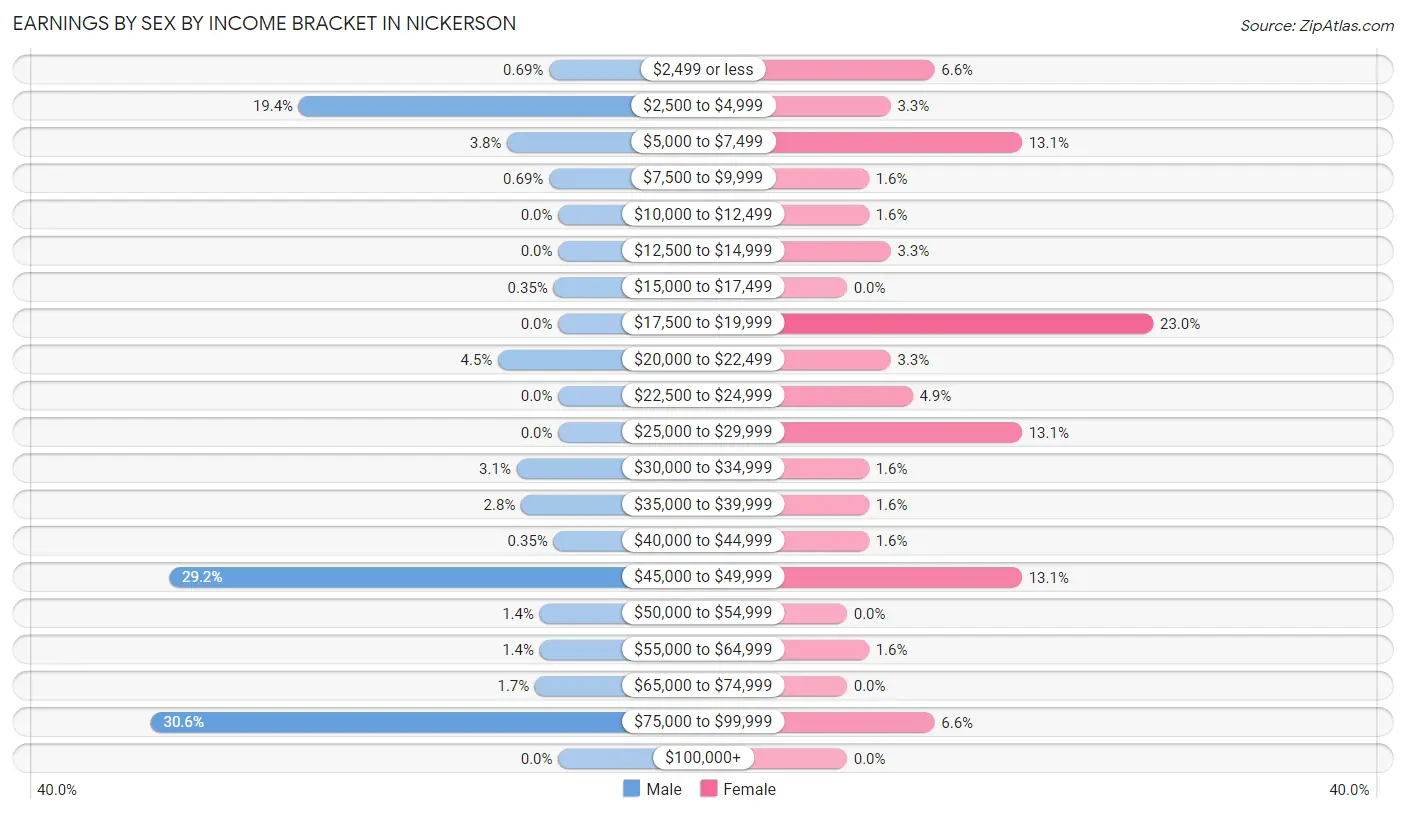
| Income | Male | Female |
| $2,499 or less | 2 (0.7%) | 4 (6.6%) |
| $2,500 to $4,999 | 56 (19.4%) | 2 (3.3%) |
| $5,000 to $7,499 | 11 (3.8%) | 8 (13.1%) |
| $7,500 to $9,999 | 2 (0.7%) | 1 (1.6%) |
| $10,000 to $12,499 | 0 (0.0%) | 1 (1.6%) |
| $12,500 to $14,999 | 0 (0.0%) | 2 (3.3%) |
| $15,000 to $17,499 | 1 (0.4%) | 0 (0.0%) |
| $17,500 to $19,999 | 0 (0.0%) | 14 (23.0%) |
| $20,000 to $22,499 | 13 (4.5%) | 2 (3.3%) |
| $22,500 to $24,999 | 0 (0.0%) | 3 (4.9%) |
| $25,000 to $29,999 | 0 (0.0%) | 8 (13.1%) |
| $30,000 to $34,999 | 9 (3.1%) | 1 (1.6%) |
| $35,000 to $39,999 | 8 (2.8%) | 1 (1.6%) |
| $40,000 to $44,999 | 1 (0.4%) | 1 (1.6%) |
| $45,000 to $49,999 | 84 (29.2%) | 8 (13.1%) |
| $50,000 to $54,999 | 4 (1.4%) | 0 (0.0%) |
| $55,000 to $64,999 | 4 (1.4%) | 1 (1.6%) |
| $65,000 to $74,999 | 5 (1.7%) | 0 (0.0%) |
| $75,000 to $99,999 | 88 (30.6%) | 4 (6.6%) |
| $100,000+ | 0 (0.0%) | 0 (0.0%) |
| Total | 288 (100.0%) | 61 (100.0%) |
Earnings by Sex by Educational Attainment in Nickerson
Average earnings in Nickerson are $92,582 for men and $20,625 for women, a difference of 77.7%. Men with an educational attainment of less than high school enjoy the highest average annual earnings of $93,487, while those with high school diploma education earn the least with $32,750. Women with an educational attainment of less than high school earn the most with the average annual earnings of $45,625, while those with college or associate's degree education have the smallest earnings of $19,318.
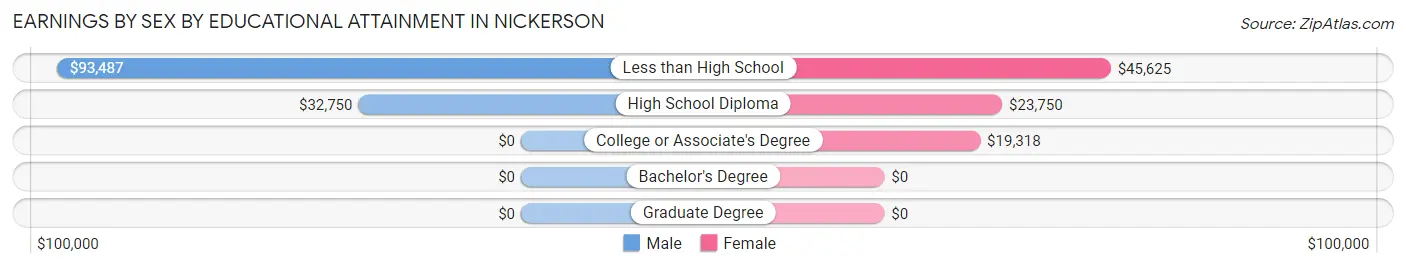
| Educational Attainment | Male Income | Female Income |
| Less than High School | $93,487 | $45,625 |
| High School Diploma | $32,750 | $23,750 |
| College or Associate's Degree | - | - |
| Bachelor's Degree | - | - |
| Graduate Degree | - | - |
| Total | $92,582 | $20,625 |
Family Income in Nickerson
Family Income Brackets in Nickerson
According to the Nickerson family income data, there are 84 families falling into the $100,000 to $149,999 income range, which is the most common income bracket and makes up 56.8% of all families.
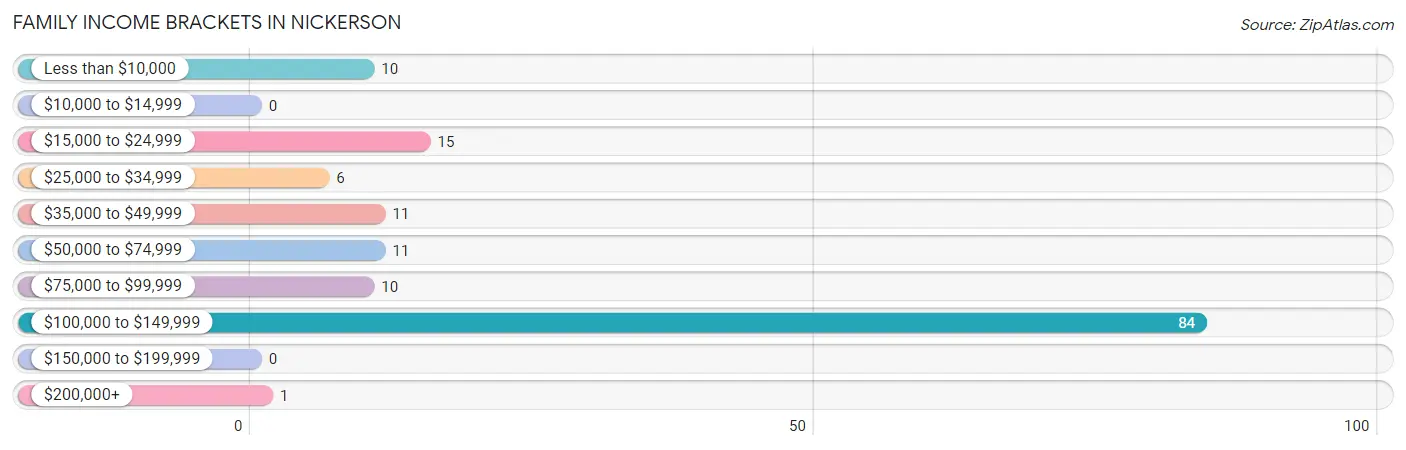
| Income Bracket | # Families | % Families |
| Less than $10,000 | 10 | 6.8% |
| $10,000 to $14,999 | 0 | 0.0% |
| $15,000 to $24,999 | 15 | 10.1% |
| $25,000 to $34,999 | 6 | 4.1% |
| $35,000 to $49,999 | 11 | 7.4% |
| $50,000 to $74,999 | 11 | 7.4% |
| $75,000 to $99,999 | 10 | 6.8% |
| $100,000 to $149,999 | 84 | 56.8% |
| $150,000 to $199,999 | 0 | 0.0% |
| $200,000+ | 1 | 0.7% |
Family Income by Famaliy Size in Nickerson
4-person families (85 | 57.4%) account for the highest median family income in Nickerson with $146,102 per family, while 4-person families (85 | 57.4%) have the highest median income of $36,526 per family member.
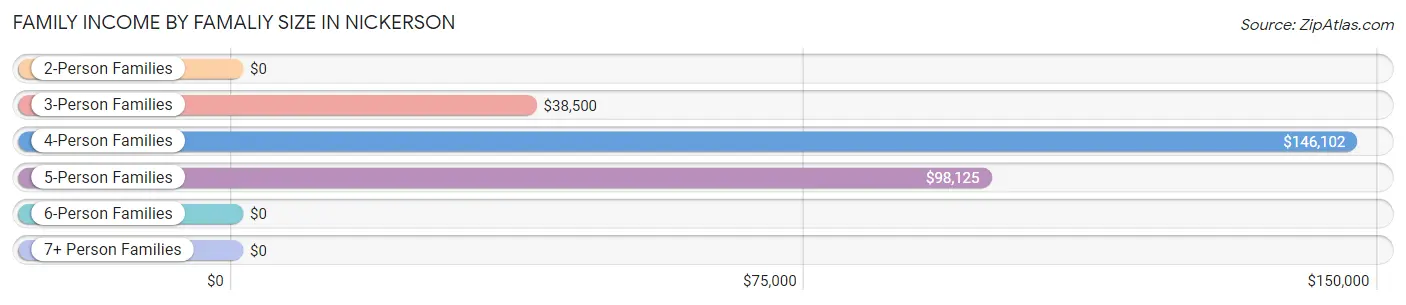
| Income Bracket | # Families | Median Income |
| 2-Person Families | 33 (22.3%) | $0 |
| 3-Person Families | 8 (5.4%) | $38,500 |
| 4-Person Families | 85 (57.4%) | $146,102 |
| 5-Person Families | 11 (7.4%) | $98,125 |
| 6-Person Families | 11 (7.4%) | $0 |
| 7+ Person Families | 0 (0.0%) | $0 |
| Total | 148 (100.0%) | $145,099 |
Family Income by Number of Earners in Nickerson
The median family income in Nickerson is $145,099, with families comprising 3+ earners (79) having the highest median family income of $146,201, while families with 1 earner (39) have the lowest median family income of $22,386, accounting for 53.4% and 26.4% of families, respectively.
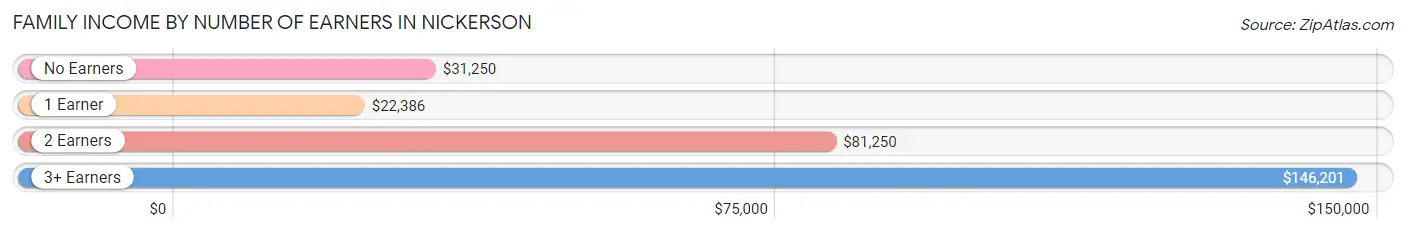
| Number of Earners | # Families | Median Income |
| No Earners | 6 (4.1%) | $31,250 |
| 1 Earner | 39 (26.4%) | $22,386 |
| 2 Earners | 24 (16.2%) | $81,250 |
| 3+ Earners | 79 (53.4%) | $146,201 |
| Total | 148 (100.0%) | $145,099 |
Household Income in Nickerson
Household Income Brackets in Nickerson
With 85 households falling in the category, the $100,000 to $149,999 income range is the most frequent in Nickerson, accounting for 46.7% of all households.
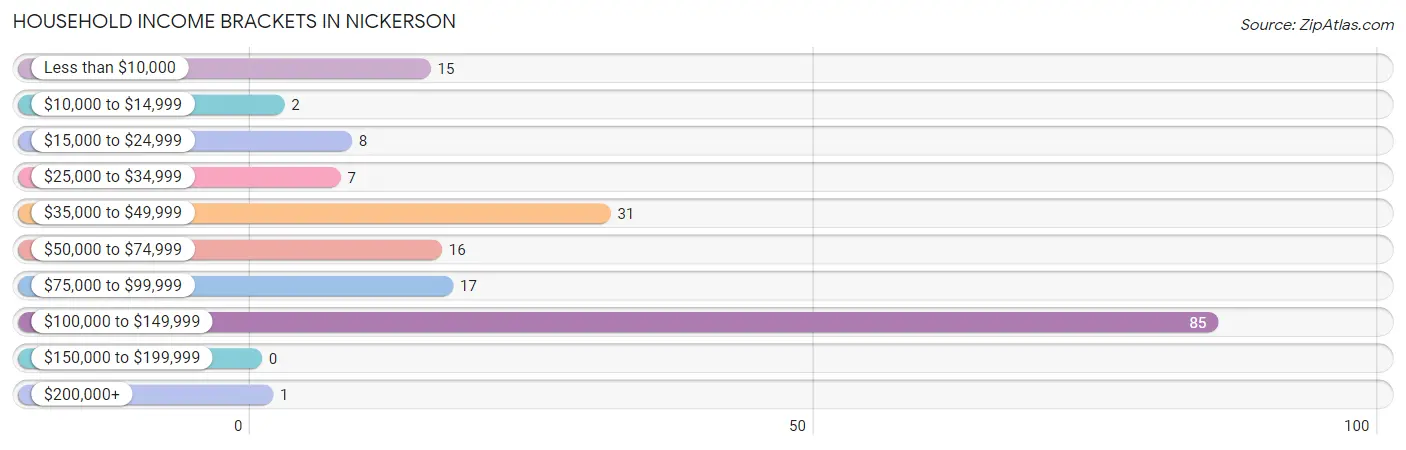
| Income Bracket | # Households | % Households |
| Less than $10,000 | 15 | 8.2% |
| $10,000 to $14,999 | 2 | 1.1% |
| $15,000 to $24,999 | 8 | 4.4% |
| $25,000 to $34,999 | 7 | 3.8% |
| $35,000 to $49,999 | 31 | 17.0% |
| $50,000 to $74,999 | 16 | 8.8% |
| $75,000 to $99,999 | 17 | 9.3% |
| $100,000 to $149,999 | 85 | 46.7% |
| $150,000 to $199,999 | 0 | 0.0% |
| $200,000+ | 1 | 0.5% |
Household Income by Householder Age in Nickerson
The median household income in Nickerson is $0, with the highest median household income of $145,724 found in the 45 to 64 years age bracket for the primary householder. A total of 110 households (60.4%) fall into this category. Meanwhile, the 15 to 24 years age bracket for the primary householder has the lowest median household income of $0, with 9 households (5.0%) in this group.
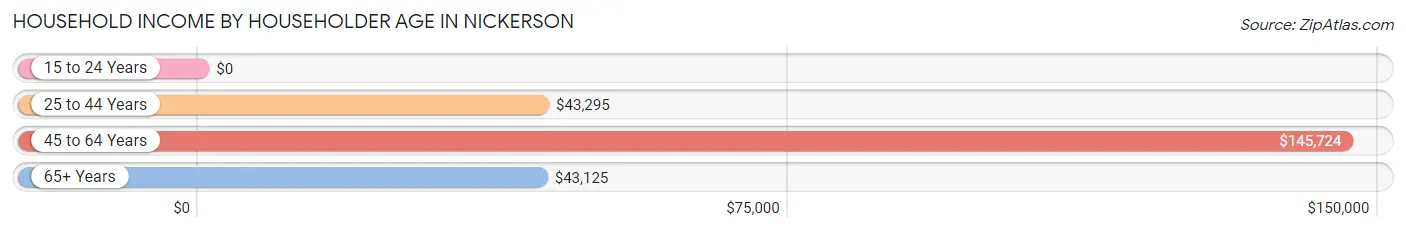
| Income Bracket | # Households | Median Income |
| 15 to 24 Years | 9 (5.0%) | $0 |
| 25 to 44 Years | 47 (25.8%) | $43,295 |
| 45 to 64 Years | 110 (60.4%) | $145,724 |
| 65+ Years | 16 (8.8%) | $43,125 |
| Total | 182 (100.0%) | $0 |
Poverty in Nickerson
Income Below Poverty by Sex and Age in Nickerson
With 15.8% poverty level for males and 29.2% for females among the residents of Nickerson, 6 to 11 year old males and 6 to 11 year old females are the most vulnerable to poverty, with 2 males (66.7%) and 9 females (81.8%) in their respective age groups living below the poverty level.
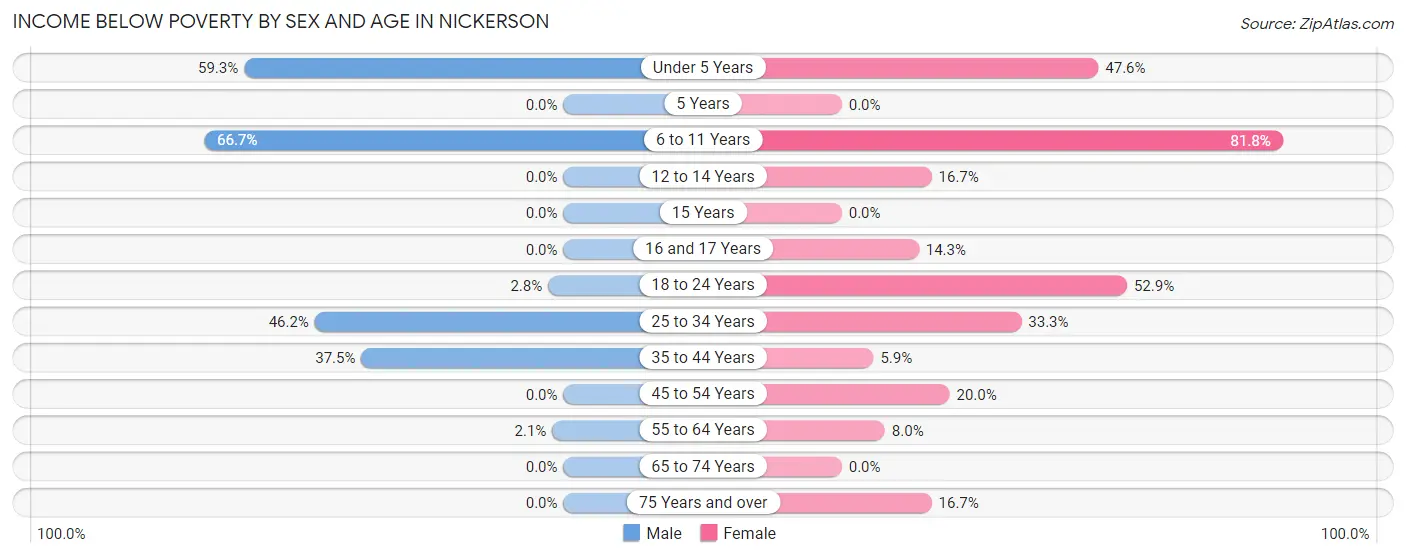
| Age Bracket | Male | Female |
| Under 5 Years | 32 (59.3%) | 10 (47.6%) |
| 5 Years | 0 (0.0%) | 0 (0.0%) |
| 6 to 11 Years | 2 (66.7%) | 9 (81.8%) |
| 12 to 14 Years | 0 (0.0%) | 1 (16.7%) |
| 15 Years | 0 (0.0%) | 0 (0.0%) |
| 16 and 17 Years | 0 (0.0%) | 1 (14.3%) |
| 18 to 24 Years | 4 (2.8%) | 9 (52.9%) |
| 25 to 34 Years | 12 (46.2%) | 7 (33.3%) |
| 35 to 44 Years | 9 (37.5%) | 1 (5.9%) |
| 45 to 54 Years | 0 (0.0%) | 4 (20.0%) |
| 55 to 64 Years | 2 (2.1%) | 2 (8.0%) |
| 65 to 74 Years | 0 (0.0%) | 0 (0.0%) |
| 75 Years and over | 0 (0.0%) | 1 (16.7%) |
| Total | 61 (15.8%) | 45 (29.2%) |
Income Above Poverty by Sex and Age in Nickerson
According to the poverty statistics in Nickerson, males aged 12 to 14 years and females aged 15 years are the age groups that are most secure financially, with 100.0% of males and 100.0% of females in these age groups living above the poverty line.
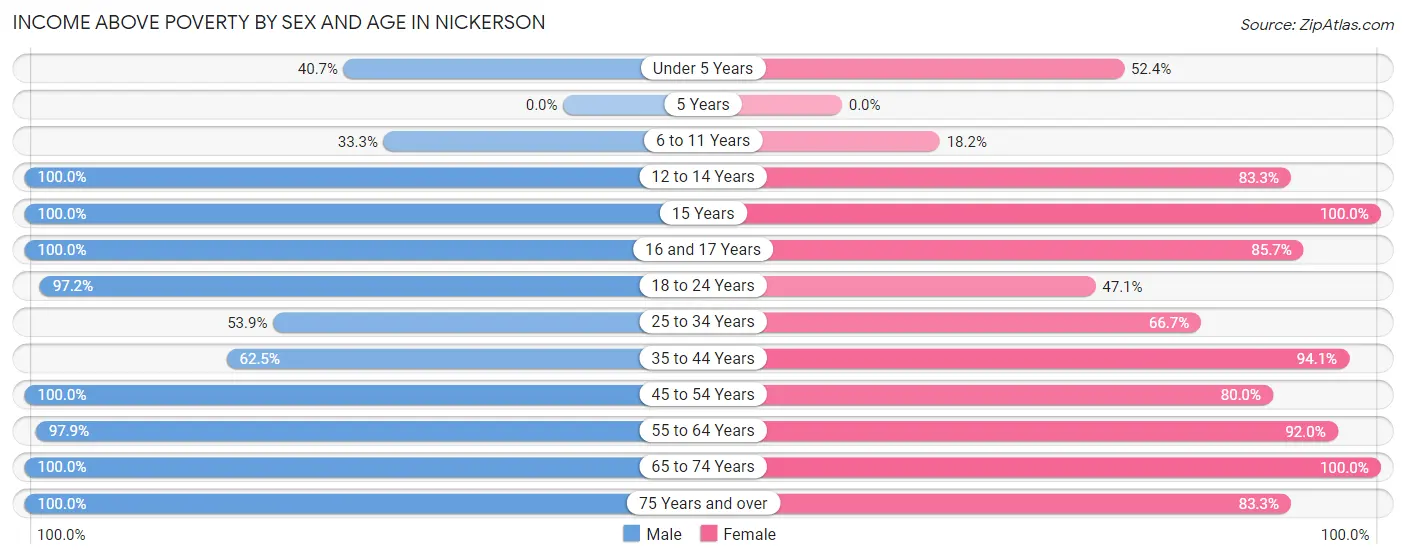
| Age Bracket | Male | Female |
| Under 5 Years | 22 (40.7%) | 11 (52.4%) |
| 5 Years | 0 (0.0%) | 0 (0.0%) |
| 6 to 11 Years | 1 (33.3%) | 2 (18.2%) |
| 12 to 14 Years | 3 (100.0%) | 5 (83.3%) |
| 15 Years | 2 (100.0%) | 1 (100.0%) |
| 16 and 17 Years | 6 (100.0%) | 6 (85.7%) |
| 18 to 24 Years | 137 (97.2%) | 8 (47.1%) |
| 25 to 34 Years | 14 (53.8%) | 14 (66.7%) |
| 35 to 44 Years | 15 (62.5%) | 16 (94.1%) |
| 45 to 54 Years | 18 (100.0%) | 16 (80.0%) |
| 55 to 64 Years | 94 (97.9%) | 23 (92.0%) |
| 65 to 74 Years | 6 (100.0%) | 2 (100.0%) |
| 75 Years and over | 8 (100.0%) | 5 (83.3%) |
| Total | 326 (84.2%) | 109 (70.8%) |
Income Below Poverty Among Married-Couple Families in Nickerson
The poverty statistics for married-couple families in Nickerson show that 1.8% or 2 of the total 112 families live below the poverty line. Families with 1 or 2 children have the highest poverty rate of 7.1%, comprising of 1 families. On the other hand, families with 3 or 4 children have the lowest poverty rate of 0.0%, which includes 0 families.

| Children | Above Poverty | Below Poverty |
| No Children | 89 (98.9%) | 1 (1.1%) |
| 1 or 2 Children | 13 (92.9%) | 1 (7.1%) |
| 3 or 4 Children | 8 (100.0%) | 0 (0.0%) |
| 5 or more Children | 0 (0.0%) | 0 (0.0%) |
| Total | 110 (98.2%) | 2 (1.8%) |
Income Below Poverty Among Single-Parent Households in Nickerson
According to the poverty data in Nickerson, 61.9% or 13 single-father households and 46.7% or 7 single-mother households are living below the poverty line. Among single-father households, those with 3 or 4 children have the highest poverty rate, with 2 households (100.0%) experiencing poverty. Likewise, among single-mother households, those with 1 or 2 children have the highest poverty rate, with 7 households (77.8%) falling below the poverty line.
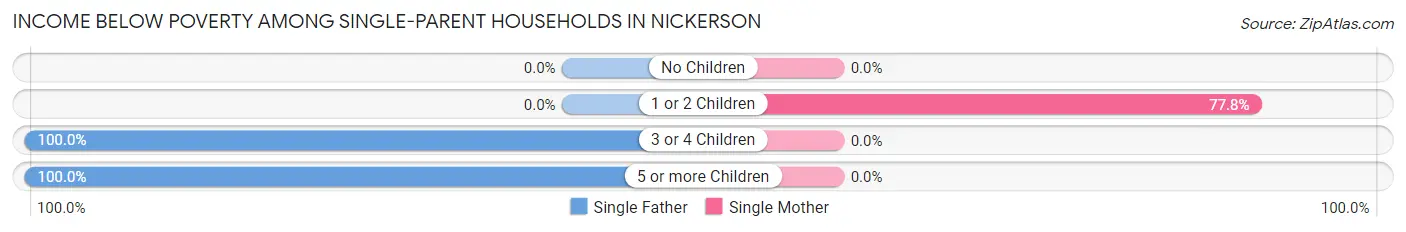
| Children | Single Father | Single Mother |
| No Children | 0 (0.0%) | 0 (0.0%) |
| 1 or 2 Children | 0 (0.0%) | 7 (77.8%) |
| 3 or 4 Children | 2 (100.0%) | 0 (0.0%) |
| 5 or more Children | 11 (100.0%) | 0 (0.0%) |
| Total | 13 (61.9%) | 7 (46.7%) |
Income Below Poverty Among Married-Couple vs Single-Parent Households in Nickerson
The poverty data for Nickerson shows that 2 of the married-couple family households (1.8%) and 20 of the single-parent households (55.6%) are living below the poverty level. Within the married-couple family households, those with 1 or 2 children have the highest poverty rate, with 1 households (7.1%) falling below the poverty line. Among the single-parent households, those with 5 or more children have the highest poverty rate, with 11 household (100.0%) living below poverty.
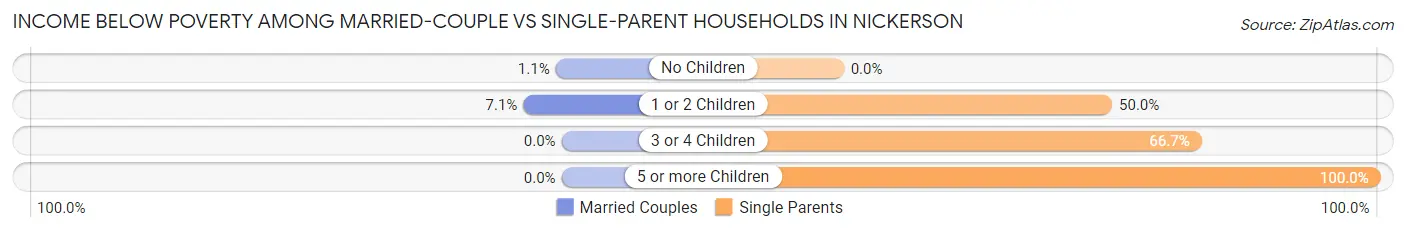
| Children | Married-Couple Families | Single-Parent Households |
| No Children | 1 (1.1%) | 0 (0.0%) |
| 1 or 2 Children | 1 (7.1%) | 7 (50.0%) |
| 3 or 4 Children | 0 (0.0%) | 2 (66.7%) |
| 5 or more Children | 0 (0.0%) | 11 (100.0%) |
| Total | 2 (1.8%) | 20 (55.6%) |
Race in Nickerson
The most populous races in Nickerson are White / Caucasian (284 | 52.4%), Hispanic or Latino (278 | 51.3%), and Two or more Races (246 | 45.4%).
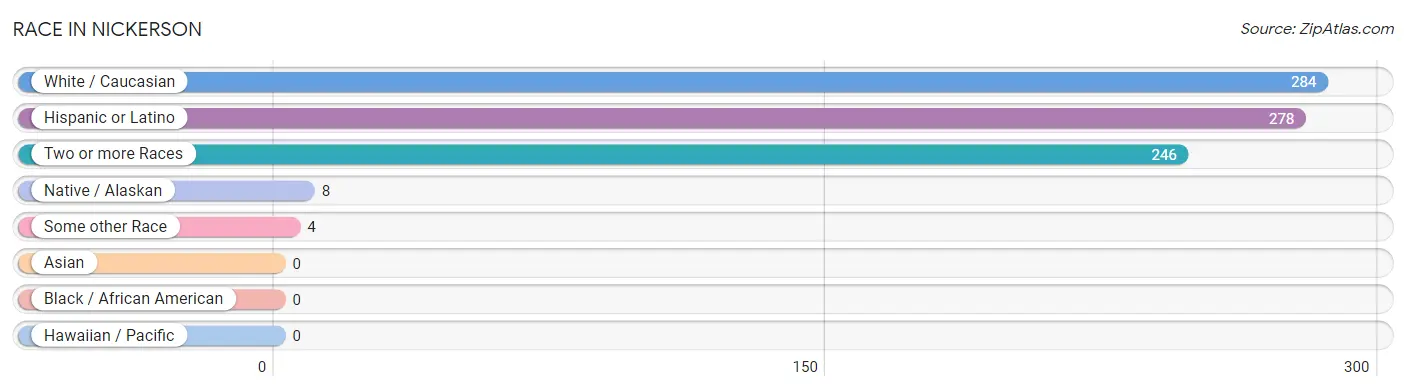
| Race | # Population | % Population |
| Asian | 0 | 0.0% |
| Black / African American | 0 | 0.0% |
| Hawaiian / Pacific | 0 | 0.0% |
| Hispanic or Latino | 278 | 51.3% |
| Native / Alaskan | 8 | 1.5% |
| White / Caucasian | 284 | 52.4% |
| Two or more Races | 246 | 45.4% |
| Some other Race | 4 | 0.7% |
| Total | 542 | 100.0% |
Ancestry in Nickerson
The most populous ancestries reported in Nickerson are Mexican (274 | 50.5%), German (61 | 11.3%), Czech (45 | 8.3%), Danish (26 | 4.8%), and Irish (21 | 3.9%), together accounting for 78.8% of all Nickerson residents.
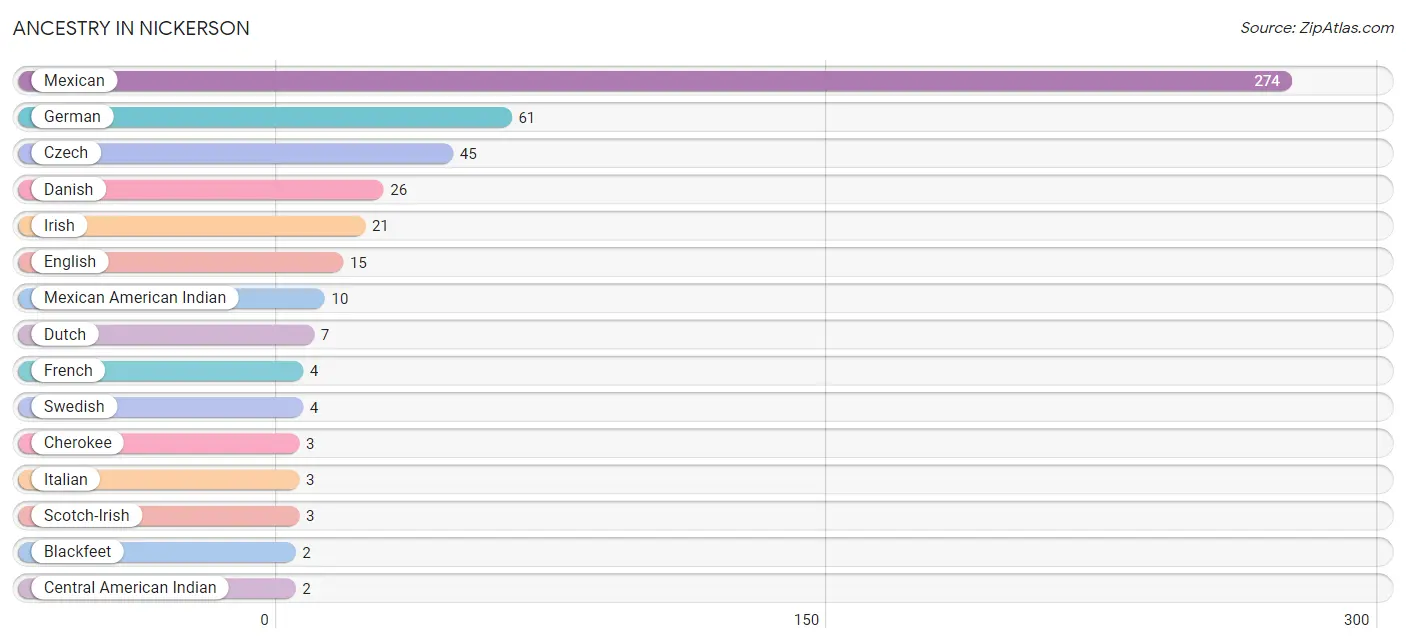
| Ancestry | # Population | % Population |
| Blackfeet | 2 | 0.4% |
| Central American Indian | 2 | 0.4% |
| Cherokee | 3 | 0.5% |
| Czech | 45 | 8.3% |
| Danish | 26 | 4.8% |
| Dutch | 7 | 1.3% |
| English | 15 | 2.8% |
| European | 2 | 0.4% |
| French | 4 | 0.7% |
| German | 61 | 11.3% |
| Irish | 21 | 3.9% |
| Italian | 3 | 0.5% |
| Mexican | 274 | 50.5% |
| Mexican American Indian | 10 | 1.8% |
| Polish | 2 | 0.4% |
| Scotch-Irish | 3 | 0.5% |
| Scottish | 2 | 0.4% |
| Sioux | 1 | 0.2% |
| Spaniard | 2 | 0.4% |
| Swedish | 4 | 0.7% | View All 20 Rows |
Immigrants in Nickerson
The most numerous immigrant groups reported in Nickerson came from Central America (116 | 21.4%), Latin America (116 | 21.4%), and Mexico (116 | 21.4%), together accounting for 64.2% of all Nickerson residents.
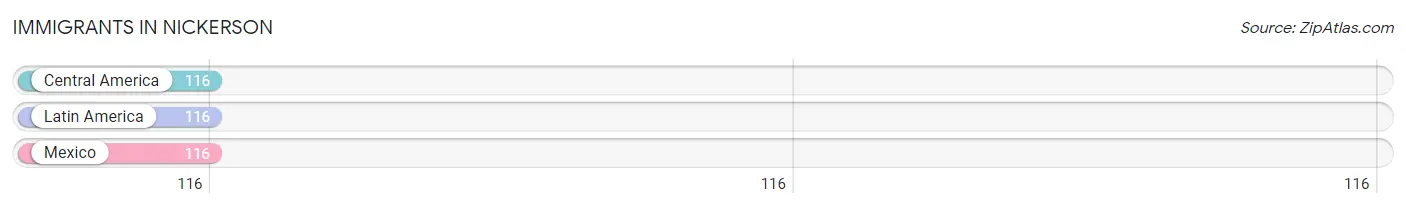
| Immigration Origin | # Population | % Population |
| Central America | 116 | 21.4% |
| Latin America | 116 | 21.4% |
| Mexico | 116 | 21.4% | View All 3 Rows |
Sex and Age in Nickerson
Sex and Age in Nickerson
The most populous age groups in Nickerson are 20 to 24 Years (137 | 35.4%) for men and 55 to 59 Years (22 | 14.2%) for women.
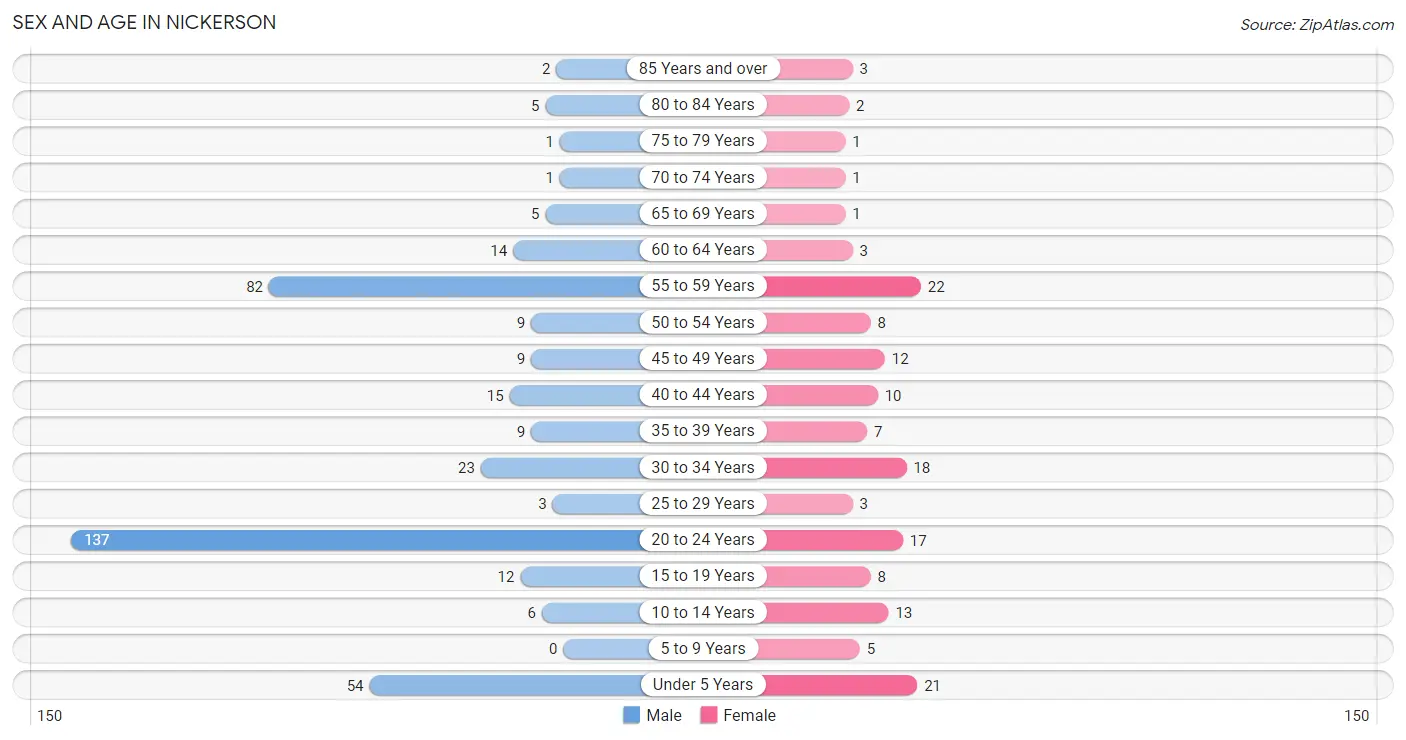
| Age Bracket | Male | Female |
| Under 5 Years | 54 (14.0%) | 21 (13.6%) |
| 5 to 9 Years | 0 (0.0%) | 5 (3.2%) |
| 10 to 14 Years | 6 (1.5%) | 13 (8.4%) |
| 15 to 19 Years | 12 (3.1%) | 8 (5.2%) |
| 20 to 24 Years | 137 (35.4%) | 17 (11.0%) |
| 25 to 29 Years | 3 (0.8%) | 3 (1.9%) |
| 30 to 34 Years | 23 (5.9%) | 18 (11.6%) |
| 35 to 39 Years | 9 (2.3%) | 7 (4.5%) |
| 40 to 44 Years | 15 (3.9%) | 10 (6.5%) |
| 45 to 49 Years | 9 (2.3%) | 12 (7.7%) |
| 50 to 54 Years | 9 (2.3%) | 8 (5.2%) |
| 55 to 59 Years | 82 (21.2%) | 22 (14.2%) |
| 60 to 64 Years | 14 (3.6%) | 3 (1.9%) |
| 65 to 69 Years | 5 (1.3%) | 1 (0.6%) |
| 70 to 74 Years | 1 (0.3%) | 1 (0.6%) |
| 75 to 79 Years | 1 (0.3%) | 1 (0.6%) |
| 80 to 84 Years | 5 (1.3%) | 2 (1.3%) |
| 85 Years and over | 2 (0.5%) | 3 (1.9%) |
| Total | 387 (100.0%) | 155 (100.0%) |
Families and Households in Nickerson
Median Family Size in Nickerson
The median family size in Nickerson is 3.17 persons per family, with single male/father families (21 | 14.2%) accounting for the largest median family size of 3.81 persons per family. On the other hand, single female/mother families (15 | 10.1%) represent the smallest median family size with 2.40 persons per family.
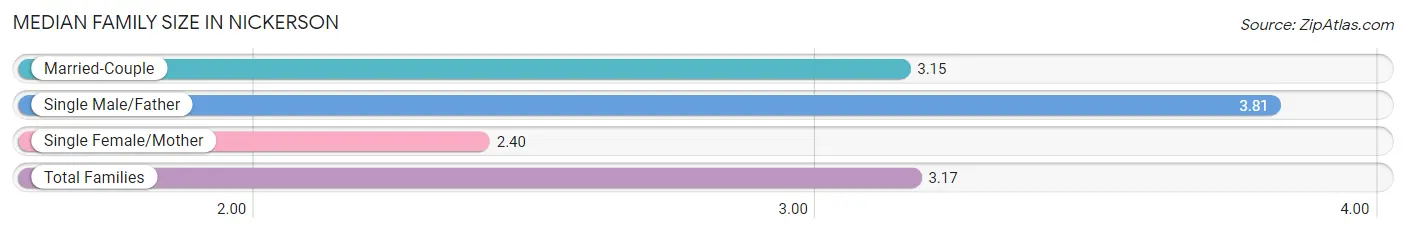
| Family Type | # Families | Family Size |
| Married-Couple | 112 (75.7%) | 3.15 |
| Single Male/Father | 21 (14.2%) | 3.81 |
| Single Female/Mother | 15 (10.1%) | 2.40 |
| Total Families | 148 (100.0%) | 3.17 |
Median Household Size in Nickerson
The median household size in Nickerson is 2.98 persons per household, with single male/father households (21 | 11.5%) accounting for the largest median household size of 4.67 persons per household. non-family households (34 | 18.7%) represent the smallest median household size with 1.50 persons per household.
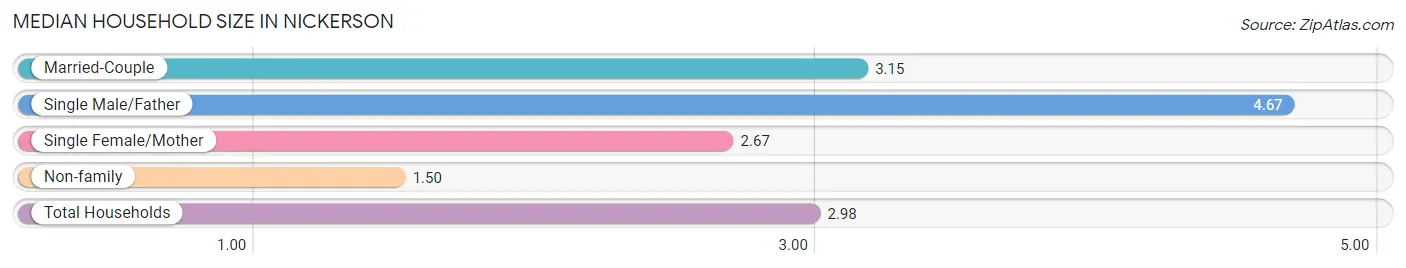
| Household Type | # Households | Household Size |
| Married-Couple | 112 (61.5%) | 3.15 |
| Single Male/Father | 21 (11.5%) | 4.67 |
| Single Female/Mother | 15 (8.2%) | 2.67 |
| Non-family | 34 (18.7%) | 1.50 |
| Total Households | 182 (100.0%) | 2.98 |
Household Size by Marriage Status in Nickerson
Out of a total of 182 households in Nickerson, 148 (81.3%) are family households, while 34 (18.7%) are nonfamily households. The most numerous type of family households are 4-person households, comprising 82, and the most common type of nonfamily households are 1-person households, comprising 25.
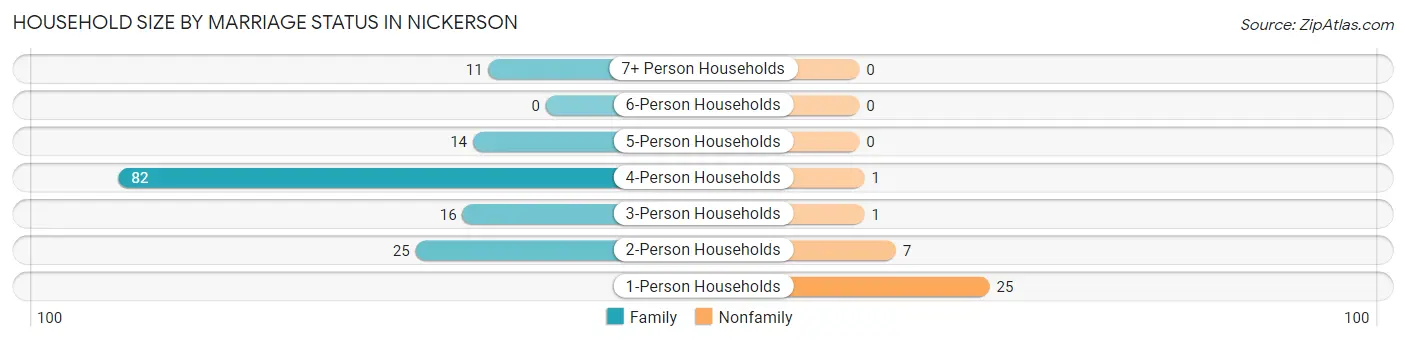
| Household Size | Family Households | Nonfamily Households |
| 1-Person Households | - | 25 (13.7%) |
| 2-Person Households | 25 (13.7%) | 7 (3.8%) |
| 3-Person Households | 16 (8.8%) | 1 (0.5%) |
| 4-Person Households | 82 (45.1%) | 1 (0.5%) |
| 5-Person Households | 14 (7.7%) | 0 (0.0%) |
| 6-Person Households | 0 (0.0%) | 0 (0.0%) |
| 7+ Person Households | 11 (6.0%) | 0 (0.0%) |
| Total | 148 (81.3%) | 34 (18.7%) |
Female Fertility in Nickerson
Fertility by Age in Nickerson
Average fertility rate in Nickerson is 53.0 births per 1,000 women. Women in the age bracket of 35 to 50 years have the highest fertility rate with 133.0 births per 1,000 women. Women in the age bracket of 35 to 50 years acount for 100.0% of all women with births.
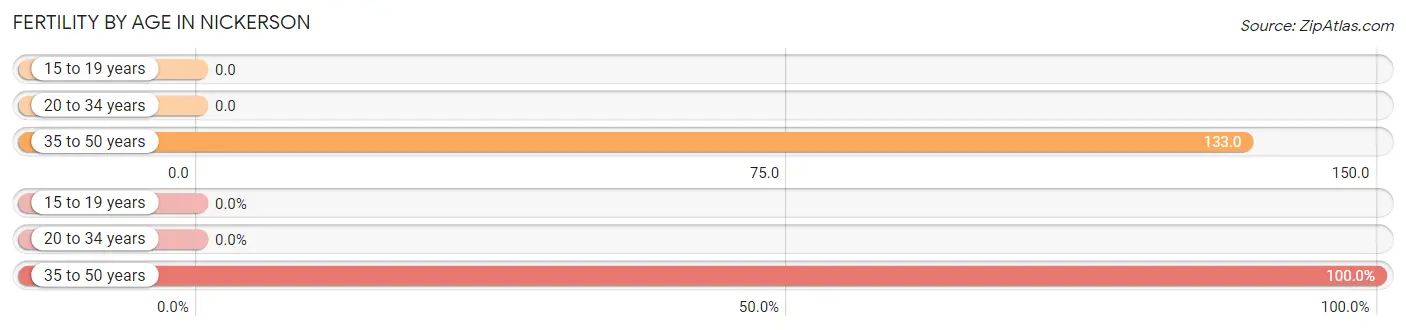
| Age Bracket | Women with Births | Births / 1,000 Women |
| 15 to 19 years | 0 (0.0%) | 0.0 |
| 20 to 34 years | 0 (0.0%) | 0.0 |
| 35 to 50 years | 4 (100.0%) | 133.0 |
| Total | 4 (100.0%) | 53.0 |
Fertility by Age by Marriage Status in Nickerson
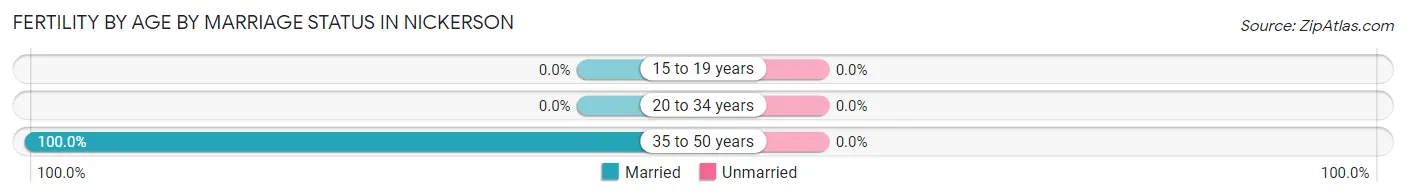
| Age Bracket | Married | Unmarried |
| 15 to 19 years | 0 (0.0%) | 0 (0.0%) |
| 20 to 34 years | 0 (0.0%) | 0 (0.0%) |
| 35 to 50 years | 4 (100.0%) | 0 (0.0%) |
| Total | 4 (100.0%) | 0 (0.0%) |
Fertility by Education in Nickerson
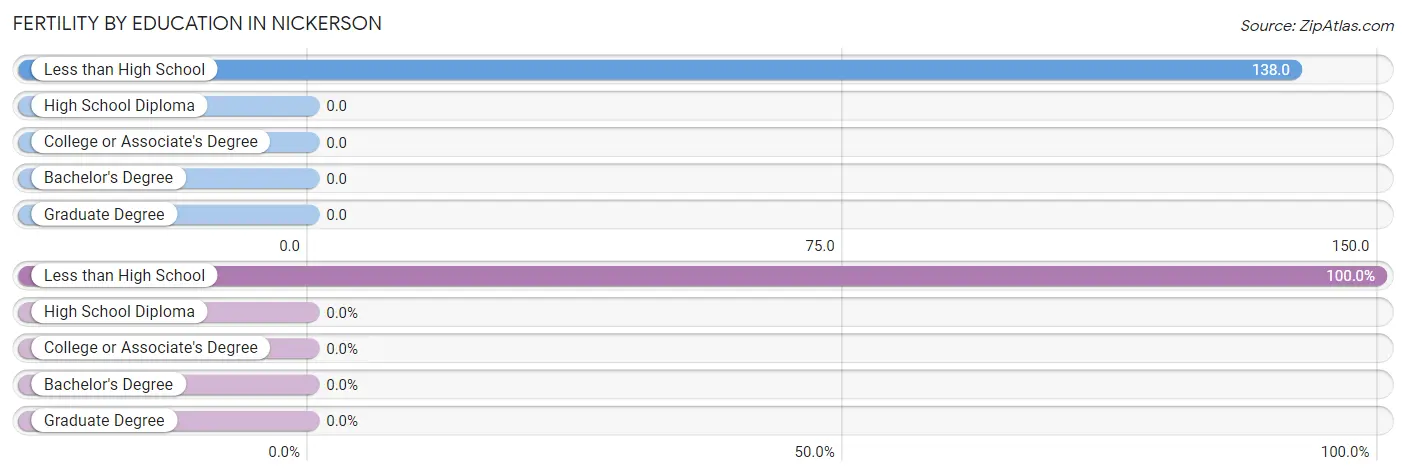
| Educational Attainment | Women with Births | Births / 1,000 Women |
| Less than High School | 4 (100.0%) | 138.0 |
| High School Diploma | 0 (0.0%) | 0.0 |
| College or Associate's Degree | 0 (0.0%) | 0.0 |
| Bachelor's Degree | 0 (0.0%) | 0.0 |
| Graduate Degree | 0 (0.0%) | 0.0 |
| Total | 4 (100.0%) | 53.0 |
Fertility by Education by Marriage Status in Nickerson
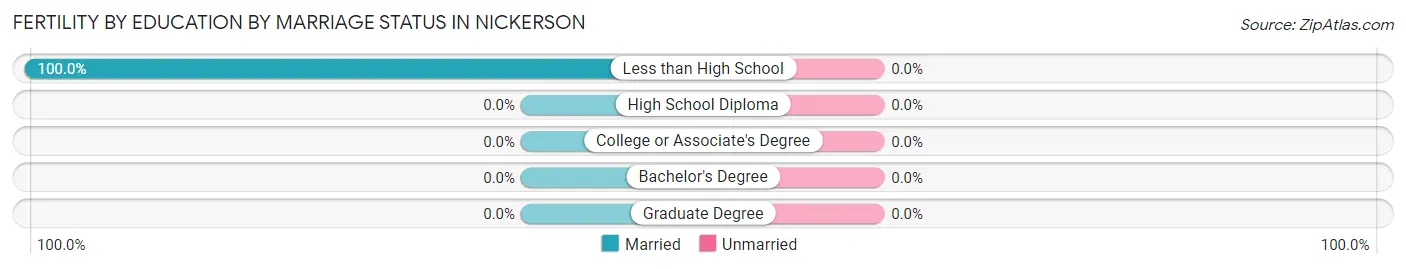
| Educational Attainment | Married | Unmarried |
| Less than High School | 4 (100.0%) | 0 (0.0%) |
| High School Diploma | 0 (0.0%) | 0 (0.0%) |
| College or Associate's Degree | 0 (0.0%) | 0 (0.0%) |
| Bachelor's Degree | 0 (0.0%) | 0 (0.0%) |
| Graduate Degree | 0 (0.0%) | 0 (0.0%) |
| Total | 4 (100.0%) | 0 (0.0%) |
Employment Characteristics in Nickerson
Employment by Class of Employer in Nickerson
Among the 270 employed individuals in Nickerson, private company employees (265 | 98.2%), not-for-profit organizations (3 | 1.1%), and self-employed (incorporated) (2 | 0.7%) make up the most common classes of employment.

| Employer Class | # Employees | % Employees |
| Private Company Employees | 265 | 98.2% |
| Self-Employed (Incorporated) | 2 | 0.7% |
| Self-Employed (Not Incorporated) | 0 | 0.0% |
| Not-for-profit Organizations | 3 | 1.1% |
| Local Government Employees | 0 | 0.0% |
| State Government Employees | 0 | 0.0% |
| Federal Government Employees | 0 | 0.0% |
| Unpaid Family Workers | 0 | 0.0% |
| Total | 270 | 100.0% |
Employment Status by Age in Nickerson
According to the labor force statistics for Nickerson, out of the total population over 16 years of age (440), 64.3% or 283 individuals are in the labor force, with 3.9% or 11 of them unemployed. The age group with the highest labor force participation rate is 30 to 34 years, with 78.0% or 32 individuals in the labor force. Within the labor force, the 35 to 44 years age range has the highest percentage of unemployed individuals, with 16.7% or 5 of them being unemployed.
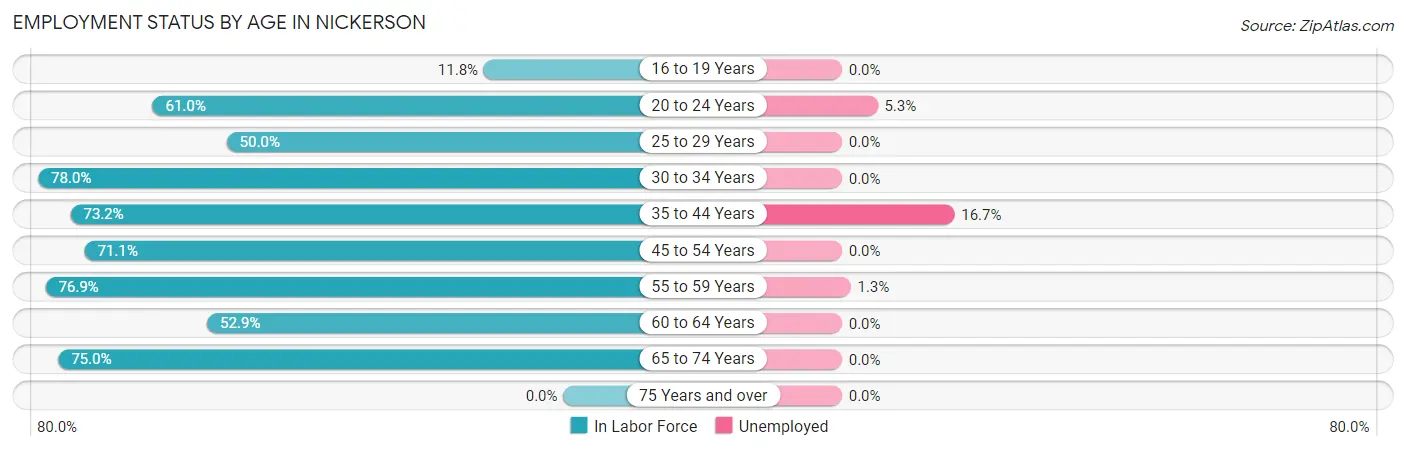
| Age Bracket | In Labor Force | Unemployed |
| 16 to 19 Years | 2 (11.8%) | 0 (0.0%) |
| 20 to 24 Years | 94 (61.0%) | 5 (5.3%) |
| 25 to 29 Years | 3 (50.0%) | 0 (0.0%) |
| 30 to 34 Years | 32 (78.0%) | 0 (0.0%) |
| 35 to 44 Years | 30 (73.2%) | 5 (16.7%) |
| 45 to 54 Years | 27 (71.1%) | 0 (0.0%) |
| 55 to 59 Years | 80 (76.9%) | 1 (1.3%) |
| 60 to 64 Years | 9 (52.9%) | 0 (0.0%) |
| 65 to 74 Years | 6 (75.0%) | 0 (0.0%) |
| 75 Years and over | 0 (0.0%) | 0 (0.0%) |
| Total | 283 (64.3%) | 11 (3.9%) |
Employment Status by Educational Attainment in Nickerson
According to labor force statistics for Nickerson, 73.3% of individuals (181) out of the total population between 25 and 64 years of age (247) are in the labor force, with 3.3% or 6 of them being unemployed. The group with the highest labor force participation rate are those with the educational attainment of bachelor's degree or higher, with 80.0% or 4 individuals in the labor force. Within the labor force, individuals with high school diploma education have the highest percentage of unemployment, with 11.4% or 5 of them being unemployed.
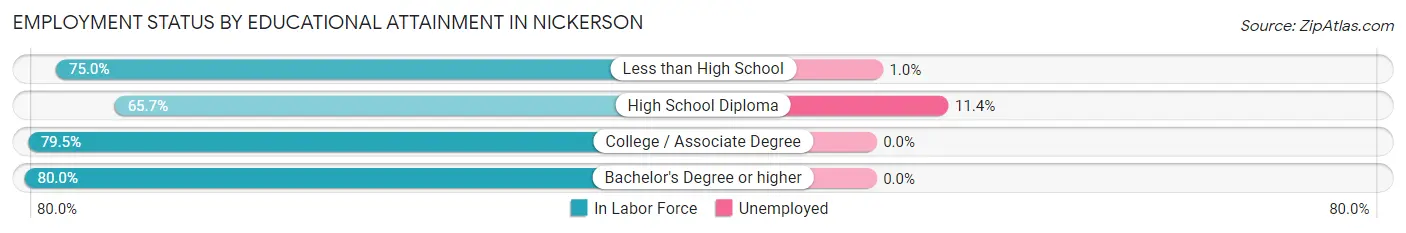
| Educational Attainment | In Labor Force | Unemployed |
| Less than High School | 102 (75.0%) | 1 (1.0%) |
| High School Diploma | 44 (65.7%) | 8 (11.4%) |
| College / Associate Degree | 31 (79.5%) | 0 (0.0%) |
| Bachelor's Degree or higher | 4 (80.0%) | 0 (0.0%) |
| Total | 181 (73.3%) | 8 (3.3%) |
Employment Occupations by Sex in Nickerson
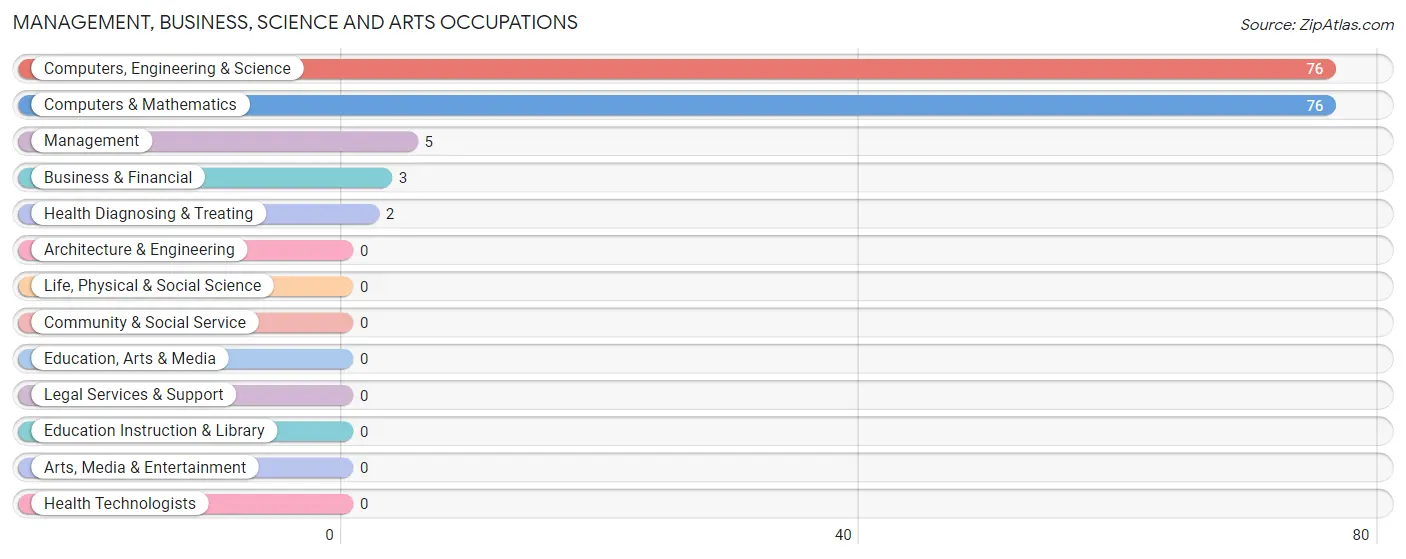
Management, Business, Science and Arts Occupations
The most common Management, Business, Science and Arts occupations in Nickerson are Computers, Engineering & Science (76 | 27.9%), Computers & Mathematics (76 | 27.9%), Management (5 | 1.8%), Business & Financial (3 | 1.1%), and Health Diagnosing & Treating (2 | 0.7%).
Management, Business, Science and Arts Occupations by Sex
Within the Management, Business, Science and Arts occupations in Nickerson, the most male-oriented occupations are Computers, Engineering & Science (100.0%), Computers & Mathematics (100.0%), and Health Diagnosing & Treating (100.0%), while the most female-oriented occupations are Management (60.0%), and Business & Financial (33.3%).
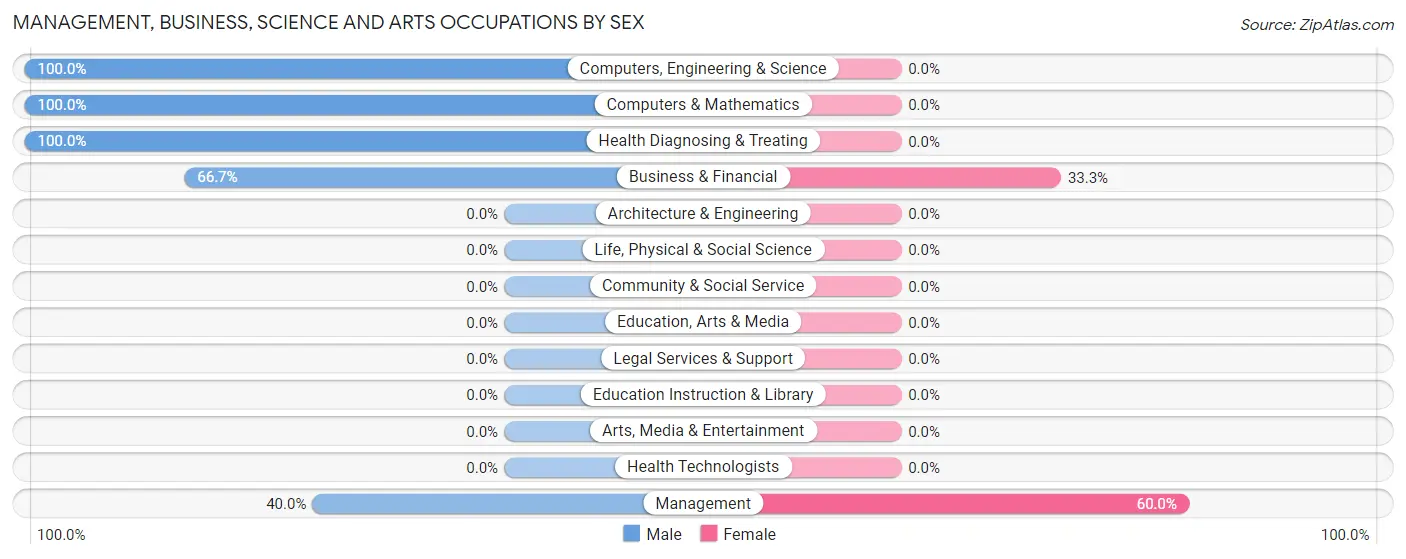
| Occupation | Male | Female |
| Management | 2 (40.0%) | 3 (60.0%) |
| Business & Financial | 2 (66.7%) | 1 (33.3%) |
| Computers, Engineering & Science | 76 (100.0%) | 0 (0.0%) |
| Computers & Mathematics | 76 (100.0%) | 0 (0.0%) |
| Architecture & Engineering | 0 (0.0%) | 0 (0.0%) |
| Life, Physical & Social Science | 0 (0.0%) | 0 (0.0%) |
| Community & Social Service | 0 (0.0%) | 0 (0.0%) |
| Education, Arts & Media | 0 (0.0%) | 0 (0.0%) |
| Legal Services & Support | 0 (0.0%) | 0 (0.0%) |
| Education Instruction & Library | 0 (0.0%) | 0 (0.0%) |
| Arts, Media & Entertainment | 0 (0.0%) | 0 (0.0%) |
| Health Diagnosing & Treating | 2 (100.0%) | 0 (0.0%) |
| Health Technologists | 0 (0.0%) | 0 (0.0%) |
| Total (Category) | 82 (95.4%) | 4 (4.6%) |
| Total (Overall) | 222 (81.6%) | 50 (18.4%) |
Services Occupations
The most common Services occupations in Nickerson are Cleaning & Maintenance (7 | 2.6%), Security & Protection (5 | 1.8%), Firefighting & Prevention (5 | 1.8%), Food Preparation & Serving (4 | 1.5%), and Personal Care & Service (1 | 0.4%).
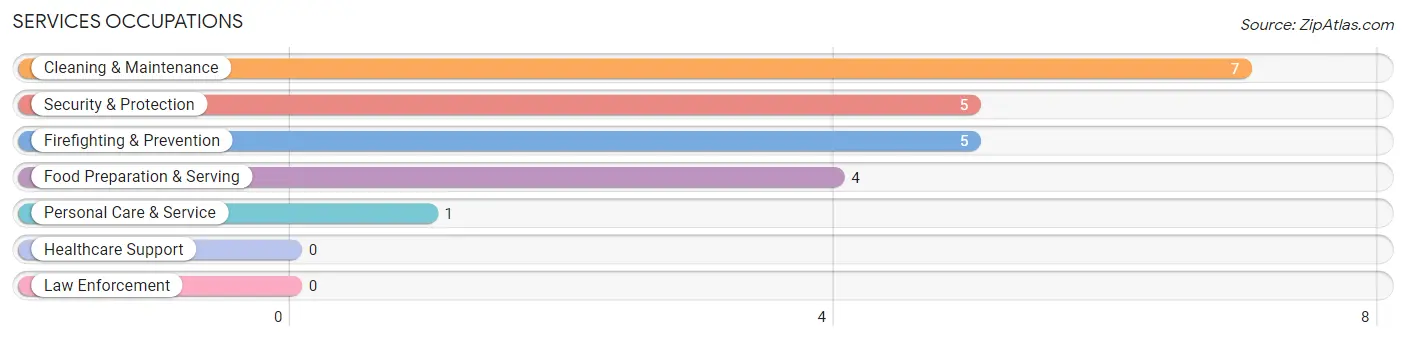
Services Occupations by Sex
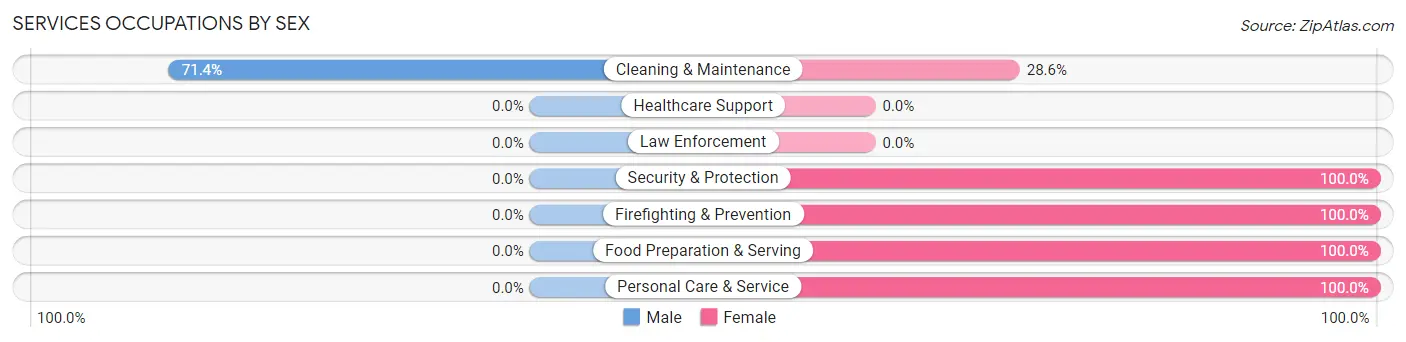
| Occupation | Male | Female |
| Healthcare Support | 0 (0.0%) | 0 (0.0%) |
| Security & Protection | 0 (0.0%) | 5 (100.0%) |
| Firefighting & Prevention | 0 (0.0%) | 5 (100.0%) |
| Law Enforcement | 0 (0.0%) | 0 (0.0%) |
| Food Preparation & Serving | 0 (0.0%) | 4 (100.0%) |
| Cleaning & Maintenance | 5 (71.4%) | 2 (28.6%) |
| Personal Care & Service | 0 (0.0%) | 1 (100.0%) |
| Total (Category) | 5 (29.4%) | 12 (70.6%) |
| Total (Overall) | 222 (81.6%) | 50 (18.4%) |
Sales and Office Occupations
The most common Sales and Office occupations in Nickerson are Sales & Related (22 | 8.1%), and Office & Administration (7 | 2.6%).
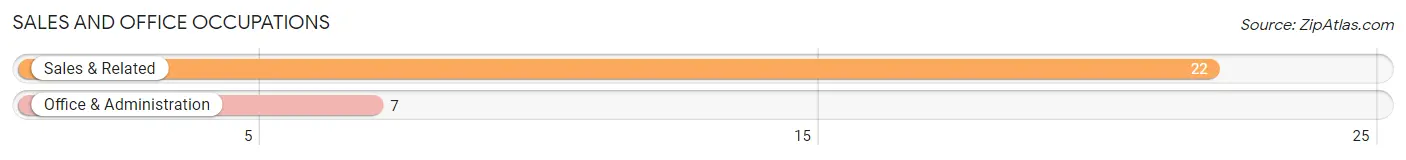
Sales and Office Occupations by Sex
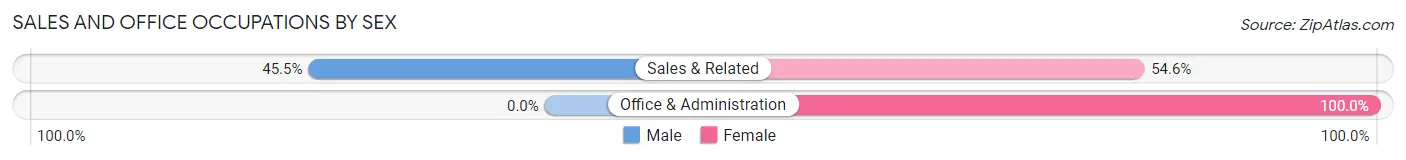
| Occupation | Male | Female |
| Sales & Related | 10 (45.5%) | 12 (54.5%) |
| Office & Administration | 0 (0.0%) | 7 (100.0%) |
| Total (Category) | 10 (34.5%) | 19 (65.5%) |
| Total (Overall) | 222 (81.6%) | 50 (18.4%) |
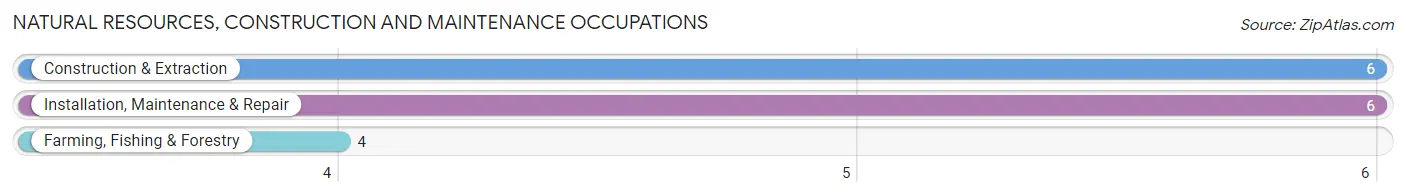
Natural Resources, Construction and Maintenance Occupations
The most common Natural Resources, Construction and Maintenance occupations in Nickerson are Construction & Extraction (6 | 2.2%), Installation, Maintenance & Repair (6 | 2.2%), and Farming, Fishing & Forestry (4 | 1.5%).
Natural Resources, Construction and Maintenance Occupations by Sex
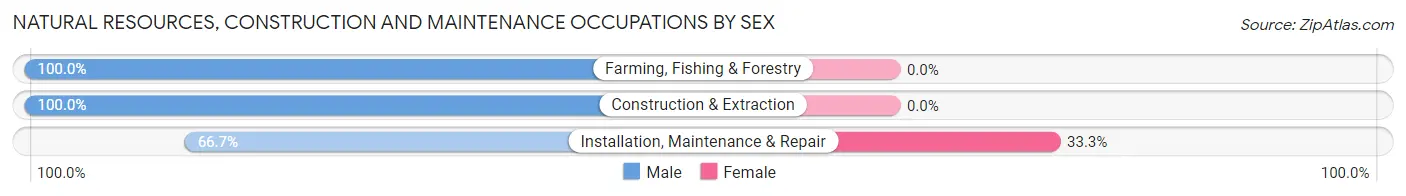
| Occupation | Male | Female |
| Farming, Fishing & Forestry | 4 (100.0%) | 0 (0.0%) |
| Construction & Extraction | 6 (100.0%) | 0 (0.0%) |
| Installation, Maintenance & Repair | 4 (66.7%) | 2 (33.3%) |
| Total (Category) | 14 (87.5%) | 2 (12.5%) |
| Total (Overall) | 222 (81.6%) | 50 (18.4%) |
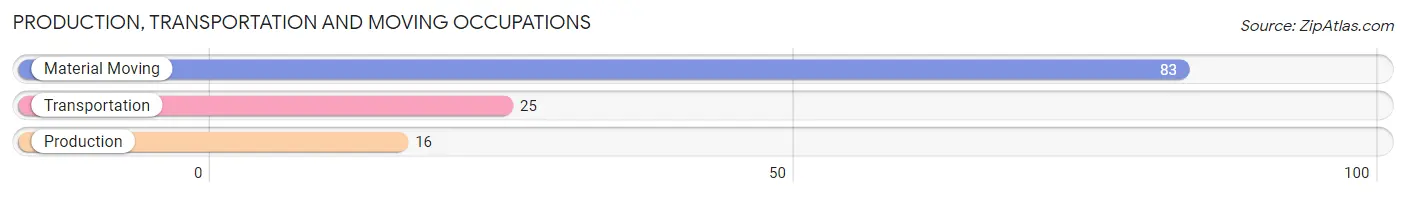
Production, Transportation and Moving Occupations
The most common Production, Transportation and Moving occupations in Nickerson are Material Moving (83 | 30.5%), Transportation (25 | 9.2%), and Production (16 | 5.9%).
Production, Transportation and Moving Occupations by Sex
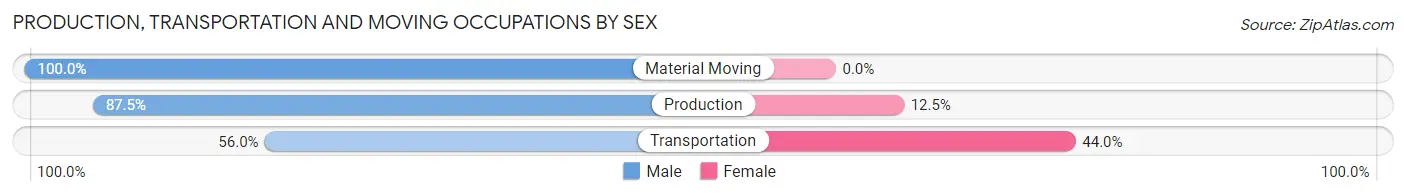
| Occupation | Male | Female |
| Production | 14 (87.5%) | 2 (12.5%) |
| Transportation | 14 (56.0%) | 11 (44.0%) |
| Material Moving | 83 (100.0%) | 0 (0.0%) |
| Total (Category) | 111 (89.5%) | 13 (10.5%) |
| Total (Overall) | 222 (81.6%) | 50 (18.4%) |
Employment Industries by Sex in Nickerson
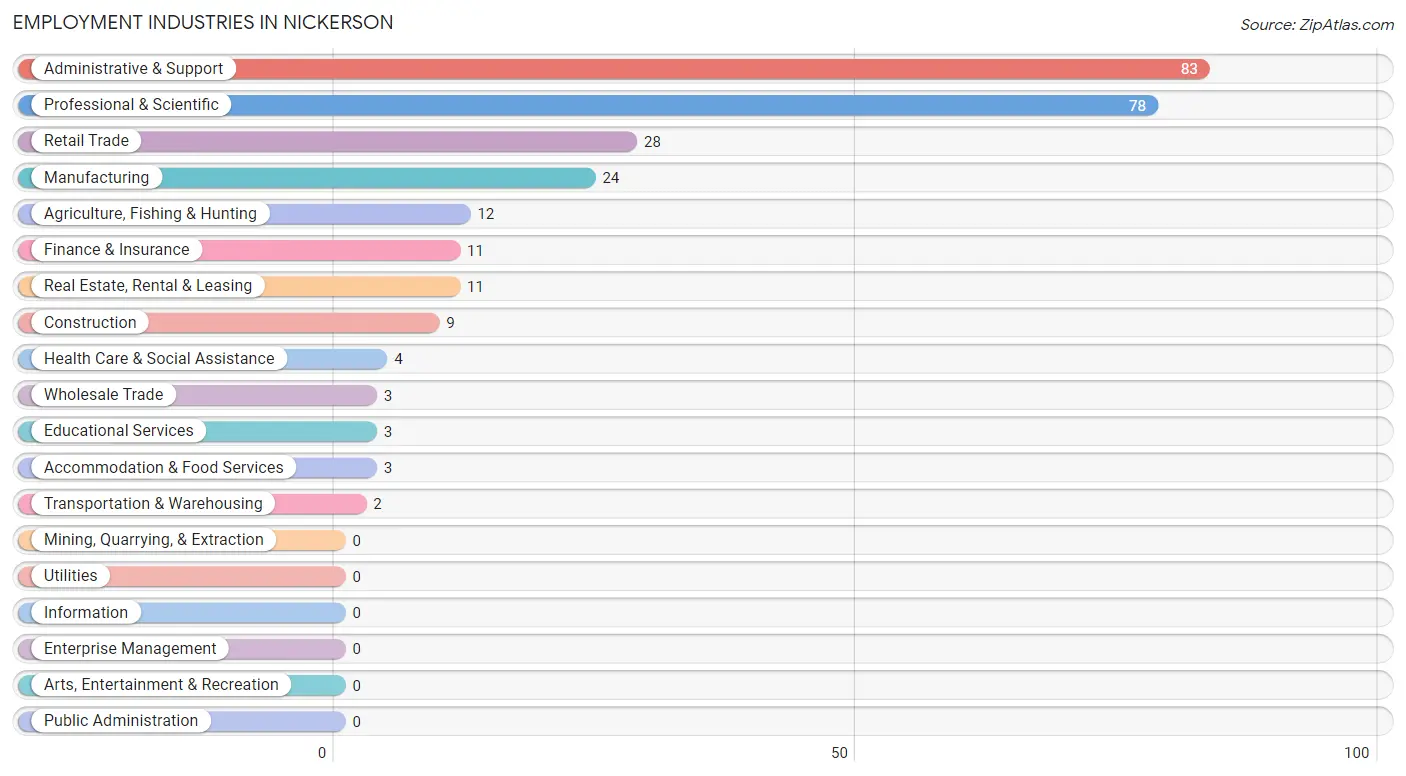
Employment Industries in Nickerson
The major employment industries in Nickerson include Administrative & Support (83 | 30.5%), Professional & Scientific (78 | 28.7%), Retail Trade (28 | 10.3%), Manufacturing (24 | 8.8%), and Agriculture, Fishing & Hunting (12 | 4.4%).
Employment Industries by Sex in Nickerson
The Nickerson industries that see more men than women are Construction (100.0%), Real Estate, Rental & Leasing (100.0%), and Professional & Scientific (97.4%), whereas the industries that tend to have a higher number of women are Transportation & Warehousing (100.0%), Retail Trade (67.9%), and Accommodation & Food Services (66.7%).
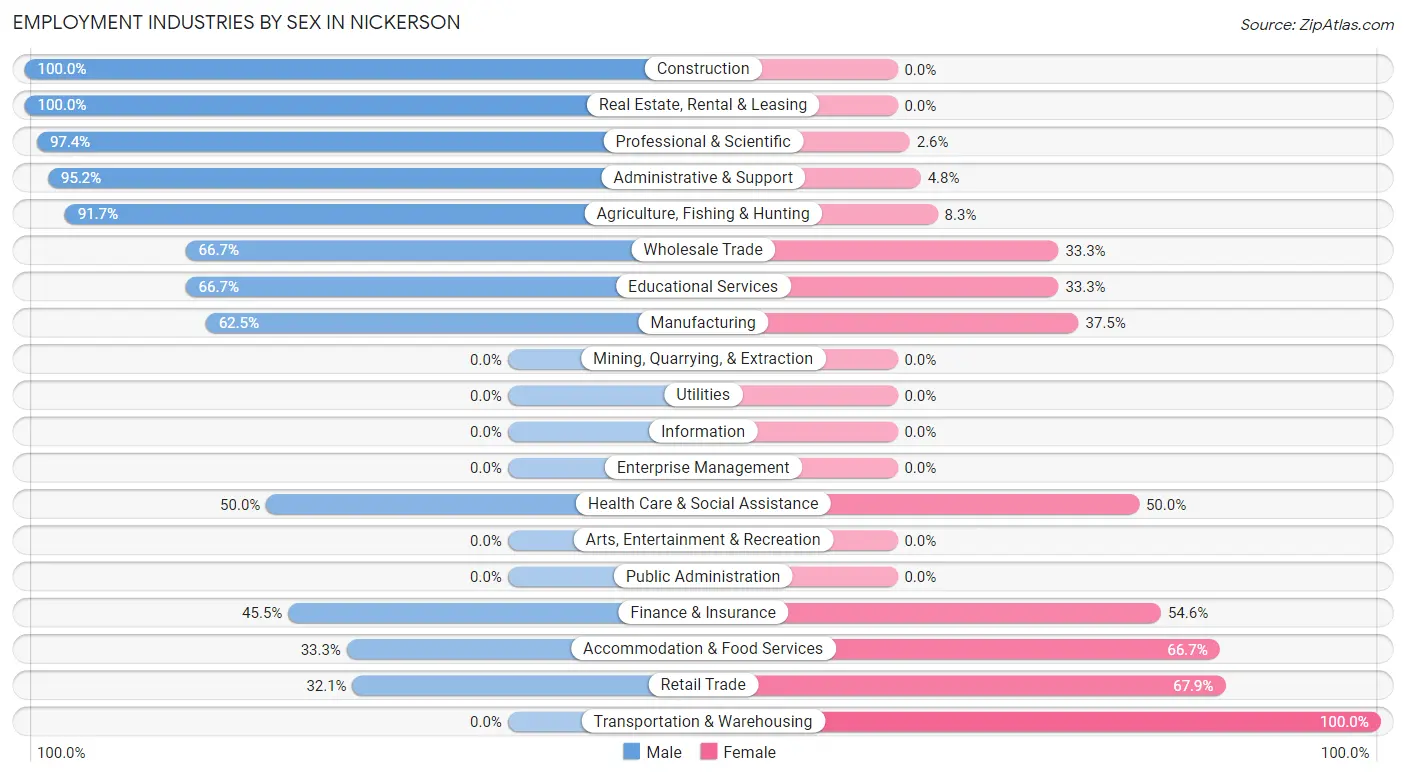
| Industry | Male | Female |
| Agriculture, Fishing & Hunting | 11 (91.7%) | 1 (8.3%) |
| Mining, Quarrying, & Extraction | 0 (0.0%) | 0 (0.0%) |
| Construction | 9 (100.0%) | 0 (0.0%) |
| Manufacturing | 15 (62.5%) | 9 (37.5%) |
| Wholesale Trade | 2 (66.7%) | 1 (33.3%) |
| Retail Trade | 9 (32.1%) | 19 (67.9%) |
| Transportation & Warehousing | 0 (0.0%) | 2 (100.0%) |
| Utilities | 0 (0.0%) | 0 (0.0%) |
| Information | 0 (0.0%) | 0 (0.0%) |
| Finance & Insurance | 5 (45.5%) | 6 (54.5%) |
| Real Estate, Rental & Leasing | 11 (100.0%) | 0 (0.0%) |
| Professional & Scientific | 76 (97.4%) | 2 (2.6%) |
| Enterprise Management | 0 (0.0%) | 0 (0.0%) |
| Administrative & Support | 79 (95.2%) | 4 (4.8%) |
| Educational Services | 2 (66.7%) | 1 (33.3%) |
| Health Care & Social Assistance | 2 (50.0%) | 2 (50.0%) |
| Arts, Entertainment & Recreation | 0 (0.0%) | 0 (0.0%) |
| Accommodation & Food Services | 1 (33.3%) | 2 (66.7%) |
| Public Administration | 0 (0.0%) | 0 (0.0%) |
| Total | 222 (81.6%) | 50 (18.4%) |
Education in Nickerson
School Enrollment in Nickerson
The most common levels of schooling among the 114 students in Nickerson are college / undergraduate (50 | 43.9%), high school (26 | 22.8%), and nursery / preschool (17 | 14.9%).
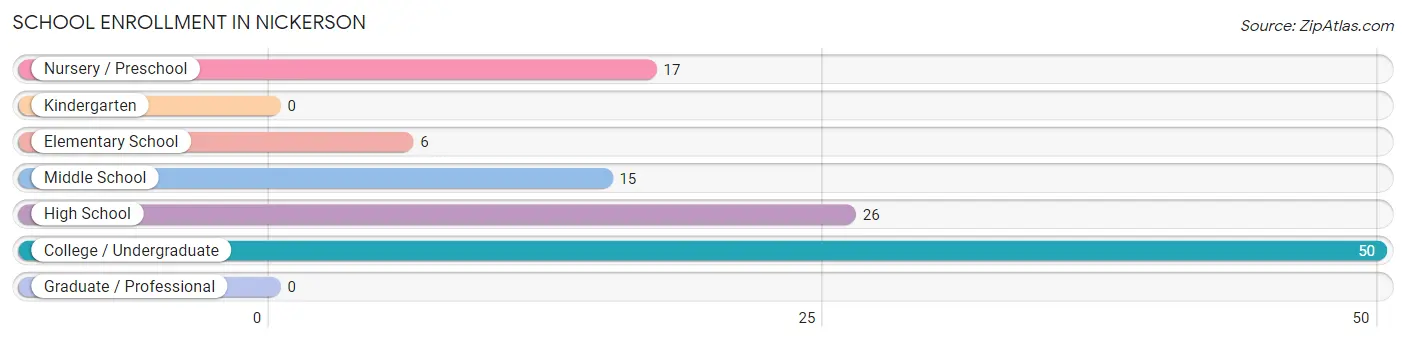
| School Level | # Students | % Students |
| Nursery / Preschool | 17 | 14.9% |
| Kindergarten | 0 | 0.0% |
| Elementary School | 6 | 5.3% |
| Middle School | 15 | 13.2% |
| High School | 26 | 22.8% |
| College / Undergraduate | 50 | 43.9% |
| Graduate / Professional | 0 | 0.0% |
| Total | 114 | 100.0% |
School Enrollment by Age by Funding Source in Nickerson
Out of a total of 114 students who are enrolled in schools in Nickerson, 6 (5.3%) attend a private institution, while the remaining 108 (94.7%) are enrolled in public schools. The age group of 25 to 34 year olds has the highest likelihood of being enrolled in private schools, with 1 (100.0% in the age bracket) enrolled. Conversely, the age group of 5 to 9 year old has the lowest likelihood of being enrolled in a private school, with 5 (100.0% in the age bracket) attending a public institution.
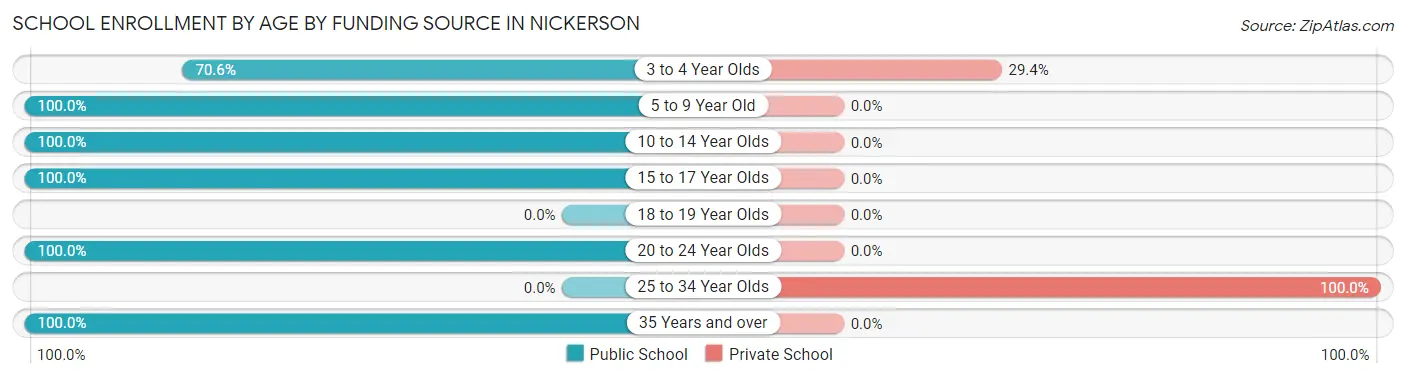
| Age Bracket | Public School | Private School |
| 3 to 4 Year Olds | 12 (70.6%) | 5 (29.4%) |
| 5 to 9 Year Old | 5 (100.0%) | 0 (0.0%) |
| 10 to 14 Year Olds | 16 (100.0%) | 0 (0.0%) |
| 15 to 17 Year Olds | 16 (100.0%) | 0 (0.0%) |
| 18 to 19 Year Olds | 0 (0.0%) | 0 (0.0%) |
| 20 to 24 Year Olds | 55 (100.0%) | 0 (0.0%) |
| 25 to 34 Year Olds | 0 (0.0%) | 1 (100.0%) |
| 35 Years and over | 4 (100.0%) | 0 (0.0%) |
| Total | 108 (94.7%) | 6 (5.3%) |
Educational Attainment by Field of Study in Nickerson
Education (3 | 60.0%), business (1 | 20.0%), and arts & humanities (1 | 20.0%) are the most common fields of study among 5 individuals in Nickerson who have obtained a bachelor's degree or higher.
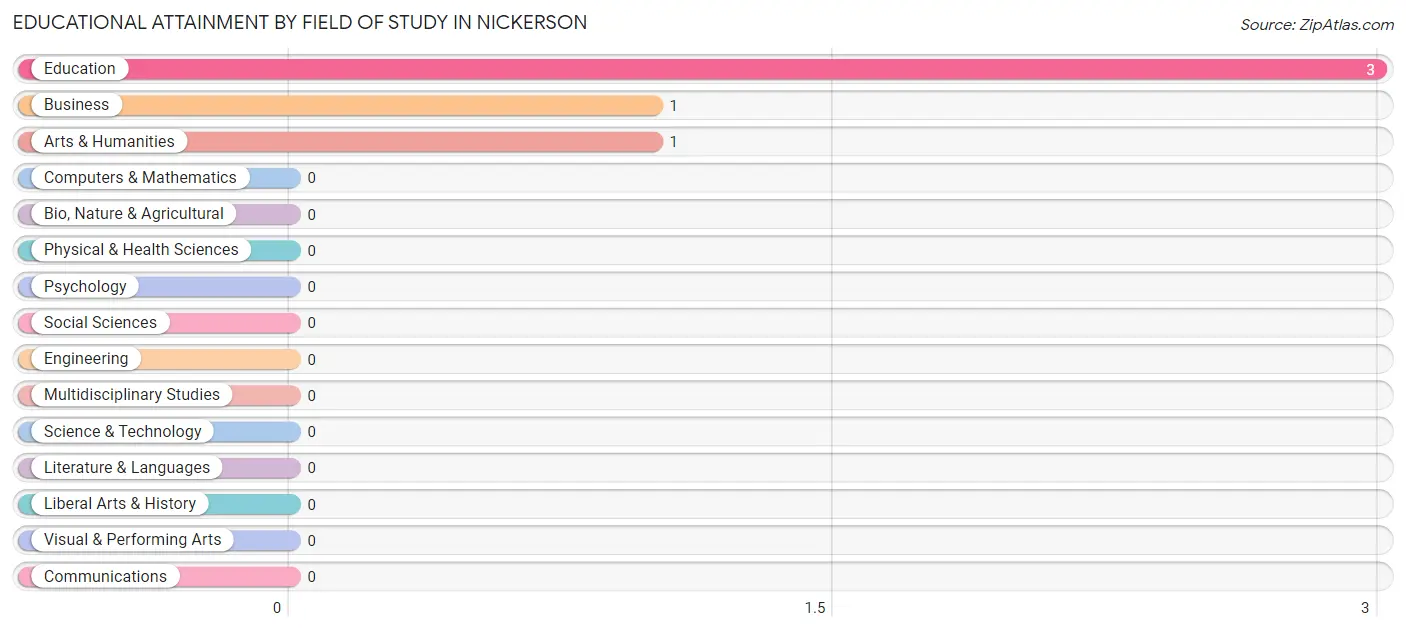
| Field of Study | # Graduates | % Graduates |
| Computers & Mathematics | 0 | 0.0% |
| Bio, Nature & Agricultural | 0 | 0.0% |
| Physical & Health Sciences | 0 | 0.0% |
| Psychology | 0 | 0.0% |
| Social Sciences | 0 | 0.0% |
| Engineering | 0 | 0.0% |
| Multidisciplinary Studies | 0 | 0.0% |
| Science & Technology | 0 | 0.0% |
| Business | 1 | 20.0% |
| Education | 3 | 60.0% |
| Literature & Languages | 0 | 0.0% |
| Liberal Arts & History | 0 | 0.0% |
| Visual & Performing Arts | 0 | 0.0% |
| Communications | 0 | 0.0% |
| Arts & Humanities | 1 | 20.0% |
| Total | 5 | 100.0% |
Transportation & Commute in Nickerson
Vehicle Availability by Sex in Nickerson
The most prevalent vehicle ownership categories in Nickerson are males with 5 or more vehicles (152, accounting for 68.8%) and females with 5 or more vehicles (2, making up 310.2%).
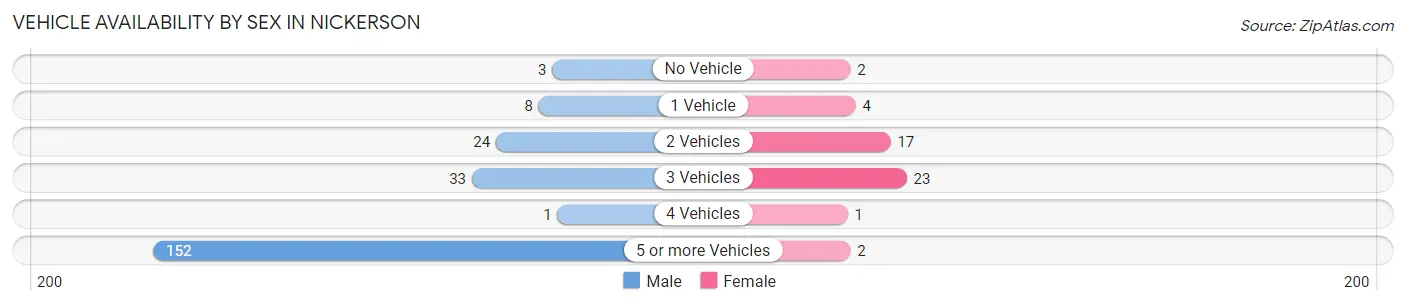
| Vehicles Available | Male | Female |
| No Vehicle | 3 (1.4%) | 2 (4.1%) |
| 1 Vehicle | 8 (3.6%) | 4 (8.2%) |
| 2 Vehicles | 24 (10.9%) | 17 (34.7%) |
| 3 Vehicles | 33 (14.9%) | 23 (46.9%) |
| 4 Vehicles | 1 (0.4%) | 1 (2.0%) |
| 5 or more Vehicles | 152 (68.8%) | 2 (4.1%) |
| Total | 221 (100.0%) | 49 (100.0%) |
Commute Time in Nickerson
The most frequently occuring commute durations in Nickerson are 60 to 89 minutes (81 commuters, 30.2%), 45 to 59 minutes (80 commuters, 29.8%), and 20 to 24 minutes (25 commuters, 9.3%).
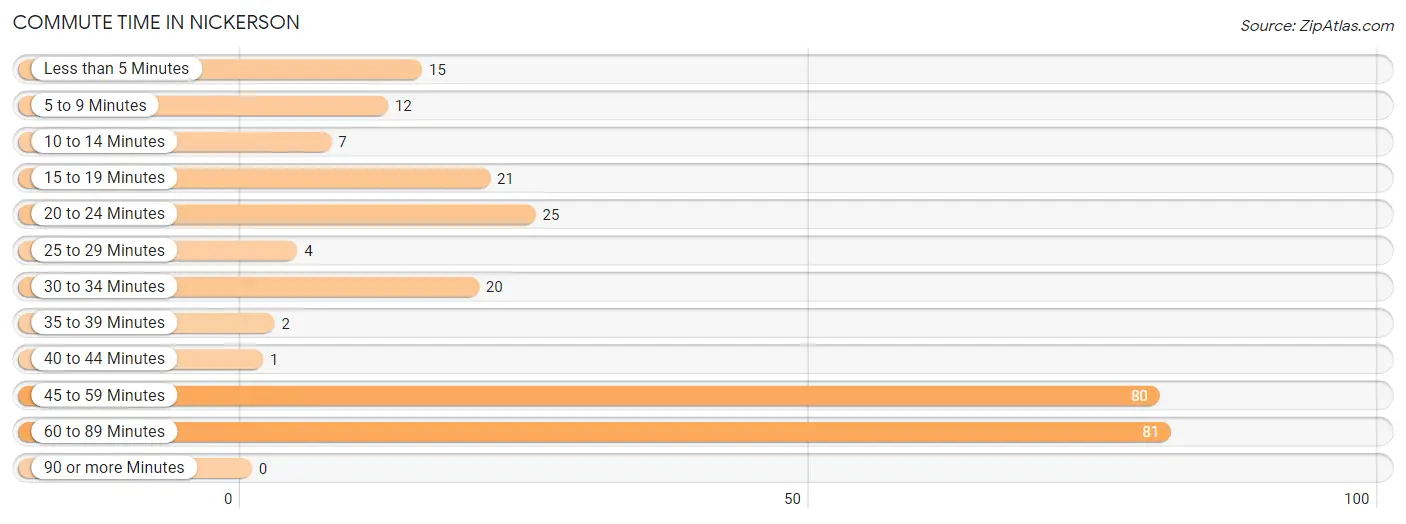
| Commute Time | # Commuters | % Commuters |
| Less than 5 Minutes | 15 | 5.6% |
| 5 to 9 Minutes | 12 | 4.5% |
| 10 to 14 Minutes | 7 | 2.6% |
| 15 to 19 Minutes | 21 | 7.8% |
| 20 to 24 Minutes | 25 | 9.3% |
| 25 to 29 Minutes | 4 | 1.5% |
| 30 to 34 Minutes | 20 | 7.5% |
| 35 to 39 Minutes | 2 | 0.7% |
| 40 to 44 Minutes | 1 | 0.4% |
| 45 to 59 Minutes | 80 | 29.8% |
| 60 to 89 Minutes | 81 | 30.2% |
| 90 or more Minutes | 0 | 0.0% |
Commute Time by Sex in Nickerson
The most common commute times in Nickerson are 60 to 89 minutes (81 commuters, 36.8%) for males and 30 to 34 minutes (18 commuters, 37.5%) for females.
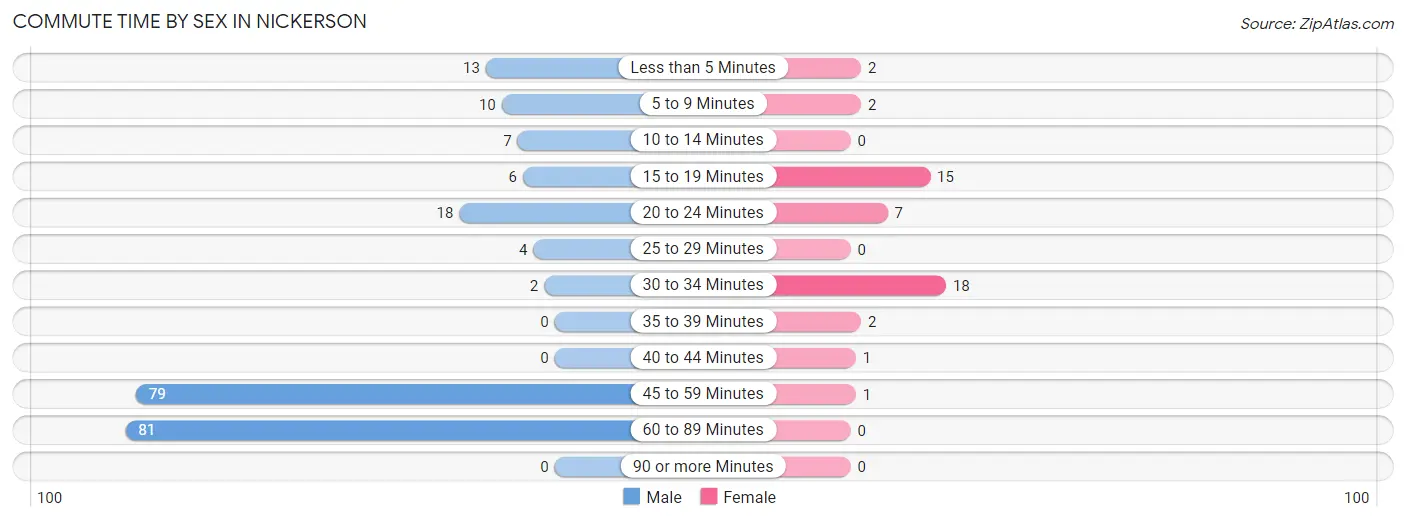
| Commute Time | Male | Female |
| Less than 5 Minutes | 13 (5.9%) | 2 (4.2%) |
| 5 to 9 Minutes | 10 (4.5%) | 2 (4.2%) |
| 10 to 14 Minutes | 7 (3.2%) | 0 (0.0%) |
| 15 to 19 Minutes | 6 (2.7%) | 15 (31.2%) |
| 20 to 24 Minutes | 18 (8.2%) | 7 (14.6%) |
| 25 to 29 Minutes | 4 (1.8%) | 0 (0.0%) |
| 30 to 34 Minutes | 2 (0.9%) | 18 (37.5%) |
| 35 to 39 Minutes | 0 (0.0%) | 2 (4.2%) |
| 40 to 44 Minutes | 0 (0.0%) | 1 (2.1%) |
| 45 to 59 Minutes | 79 (35.9%) | 1 (2.1%) |
| 60 to 89 Minutes | 81 (36.8%) | 0 (0.0%) |
| 90 or more Minutes | 0 (0.0%) | 0 (0.0%) |
Time of Departure to Work by Sex in Nickerson
The most frequent times of departure to work in Nickerson are 4:00 PM to 11:59 PM (80, 36.4%) for males and 5:00 AM to 5:29 AM (12, 25.0%) for females.
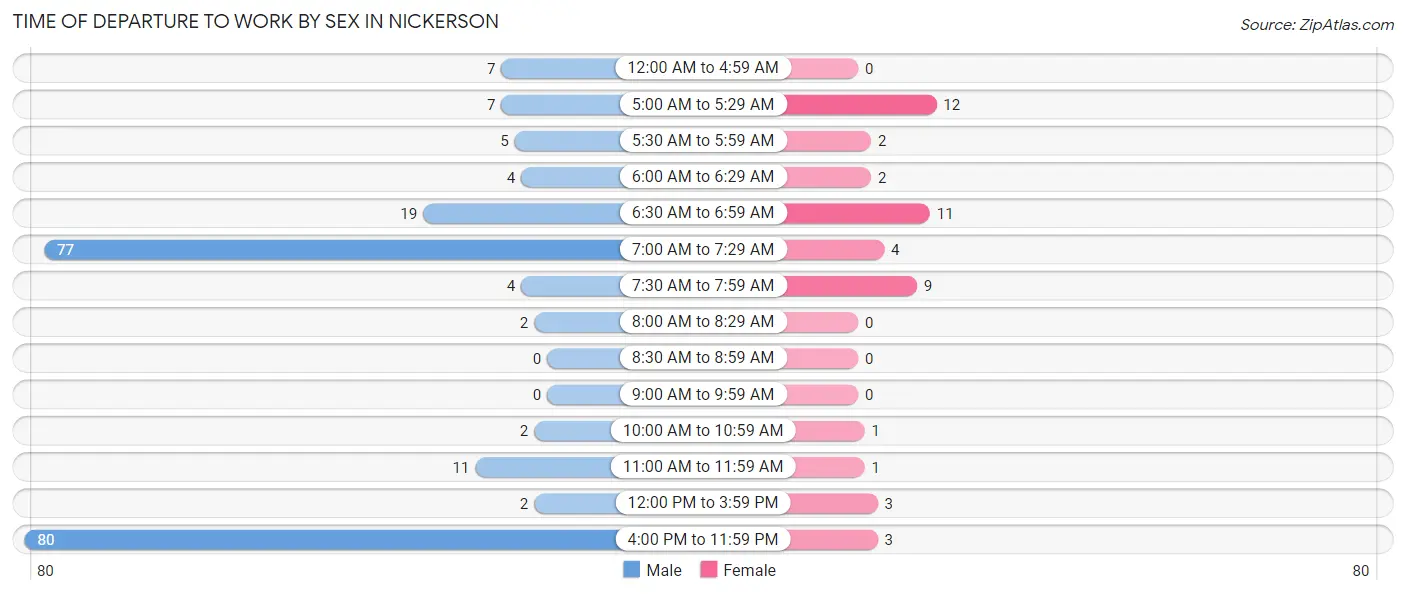
| Time of Departure | Male | Female |
| 12:00 AM to 4:59 AM | 7 (3.2%) | 0 (0.0%) |
| 5:00 AM to 5:29 AM | 7 (3.2%) | 12 (25.0%) |
| 5:30 AM to 5:59 AM | 5 (2.3%) | 2 (4.2%) |
| 6:00 AM to 6:29 AM | 4 (1.8%) | 2 (4.2%) |
| 6:30 AM to 6:59 AM | 19 (8.6%) | 11 (22.9%) |
| 7:00 AM to 7:29 AM | 77 (35.0%) | 4 (8.3%) |
| 7:30 AM to 7:59 AM | 4 (1.8%) | 9 (18.8%) |
| 8:00 AM to 8:29 AM | 2 (0.9%) | 0 (0.0%) |
| 8:30 AM to 8:59 AM | 0 (0.0%) | 0 (0.0%) |
| 9:00 AM to 9:59 AM | 0 (0.0%) | 0 (0.0%) |
| 10:00 AM to 10:59 AM | 2 (0.9%) | 1 (2.1%) |
| 11:00 AM to 11:59 AM | 11 (5.0%) | 1 (2.1%) |
| 12:00 PM to 3:59 PM | 2 (0.9%) | 3 (6.2%) |
| 4:00 PM to 11:59 PM | 80 (36.4%) | 3 (6.2%) |
| Total | 220 (100.0%) | 48 (100.0%) |
Housing Occupancy in Nickerson
Occupancy by Ownership in Nickerson
Of the total 182 dwellings in Nickerson, owner-occupied units account for 150 (82.4%), while renter-occupied units make up 32 (17.6%).
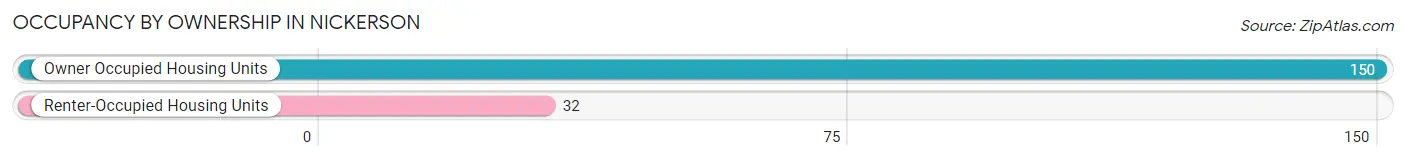
| Occupancy | # Housing Units | % Housing Units |
| Owner Occupied Housing Units | 150 | 82.4% |
| Renter-Occupied Housing Units | 32 | 17.6% |
| Total Occupied Housing Units | 182 | 100.0% |
Occupancy by Household Size in Nickerson
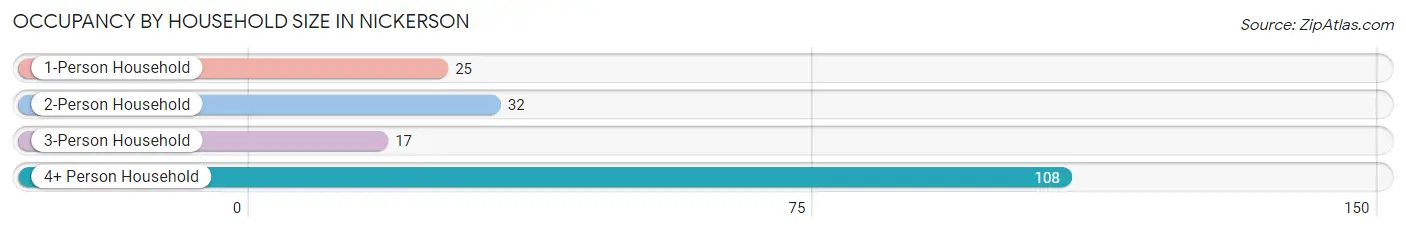
| Household Size | # Housing Units | % Housing Units |
| 1-Person Household | 25 | 13.7% |
| 2-Person Household | 32 | 17.6% |
| 3-Person Household | 17 | 9.3% |
| 4+ Person Household | 108 | 59.3% |
| Total Housing Units | 182 | 100.0% |
Occupancy by Ownership by Household Size in Nickerson
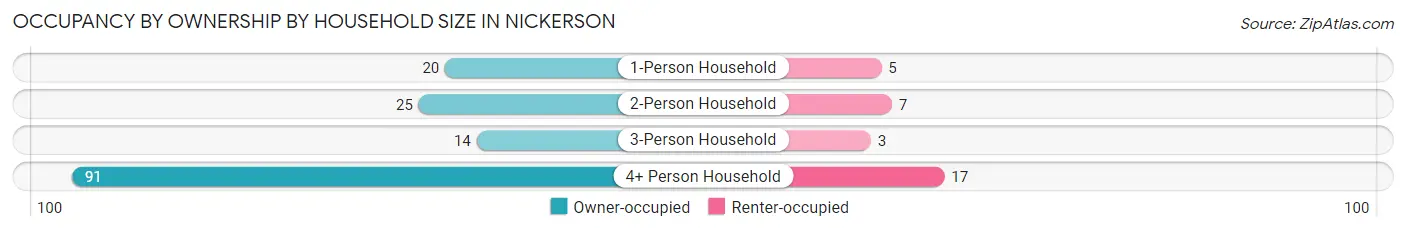
| Household Size | Owner-occupied | Renter-occupied |
| 1-Person Household | 20 (80.0%) | 5 (20.0%) |
| 2-Person Household | 25 (78.1%) | 7 (21.9%) |
| 3-Person Household | 14 (82.4%) | 3 (17.6%) |
| 4+ Person Household | 91 (84.3%) | 17 (15.7%) |
| Total Housing Units | 150 (82.4%) | 32 (17.6%) |
Occupancy by Educational Attainment in Nickerson
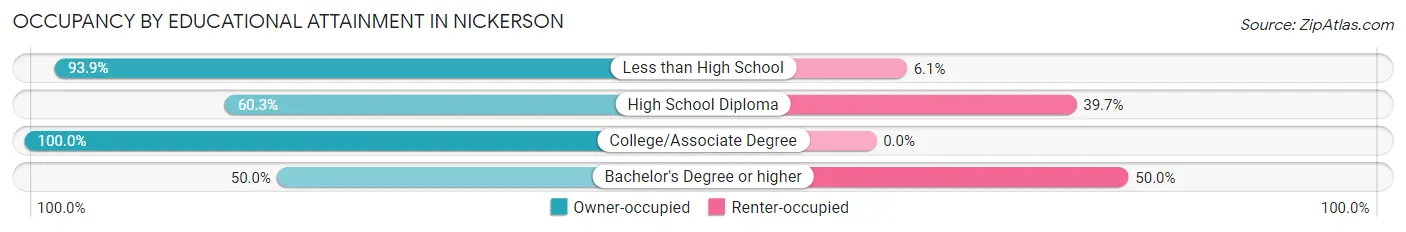
| Household Size | Owner-occupied | Renter-occupied |
| Less than High School | 93 (93.9%) | 6 (6.1%) |
| High School Diploma | 38 (60.3%) | 25 (39.7%) |
| College/Associate Degree | 18 (100.0%) | 0 (0.0%) |
| Bachelor's Degree or higher | 1 (50.0%) | 1 (50.0%) |
Occupancy by Age of Householder in Nickerson
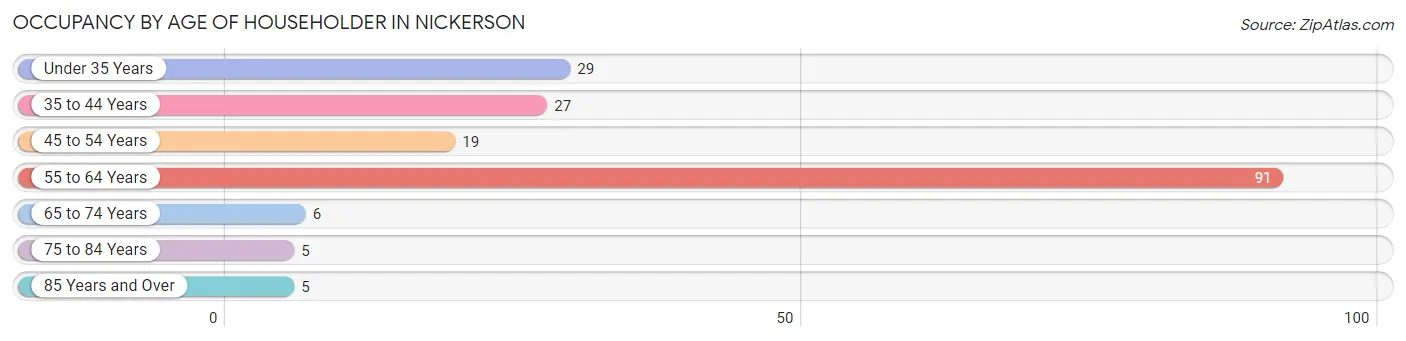
| Age Bracket | # Households | % Households |
| Under 35 Years | 29 | 15.9% |
| 35 to 44 Years | 27 | 14.8% |
| 45 to 54 Years | 19 | 10.4% |
| 55 to 64 Years | 91 | 50.0% |
| 65 to 74 Years | 6 | 3.3% |
| 75 to 84 Years | 5 | 2.8% |
| 85 Years and Over | 5 | 2.8% |
| Total | 182 | 100.0% |
Housing Finances in Nickerson
Median Income by Occupancy in Nickerson
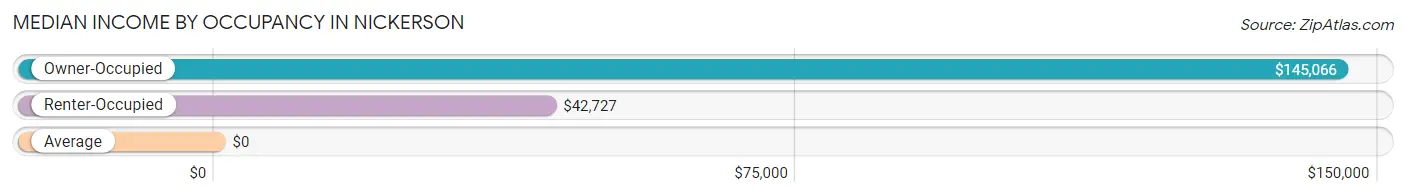
| Occupancy Type | # Households | Median Income |
| Owner-Occupied | 150 (82.4%) | $145,066 |
| Renter-Occupied | 32 (17.6%) | $42,727 |
| Average | 182 (100.0%) | $0 |
Occupancy by Householder Income Bracket in Nickerson
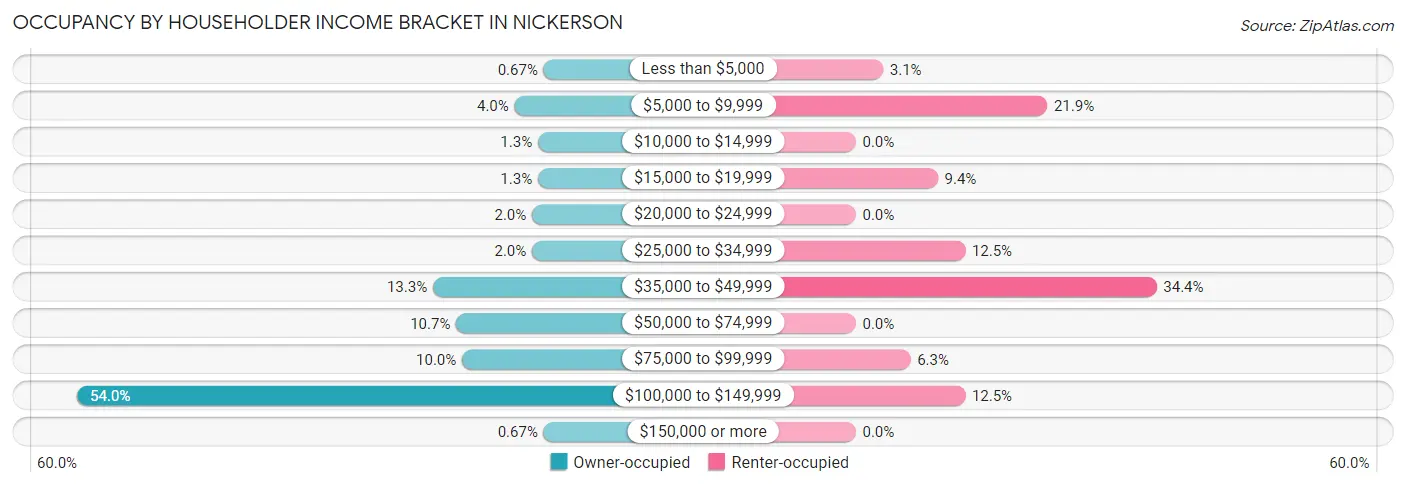
| Income Bracket | Owner-occupied | Renter-occupied |
| Less than $5,000 | 1 (0.7%) | 1 (3.1%) |
| $5,000 to $9,999 | 6 (4.0%) | 7 (21.9%) |
| $10,000 to $14,999 | 2 (1.3%) | 0 (0.0%) |
| $15,000 to $19,999 | 2 (1.3%) | 3 (9.4%) |
| $20,000 to $24,999 | 3 (2.0%) | 0 (0.0%) |
| $25,000 to $34,999 | 3 (2.0%) | 4 (12.5%) |
| $35,000 to $49,999 | 20 (13.3%) | 11 (34.4%) |
| $50,000 to $74,999 | 16 (10.7%) | 0 (0.0%) |
| $75,000 to $99,999 | 15 (10.0%) | 2 (6.2%) |
| $100,000 to $149,999 | 81 (54.0%) | 4 (12.5%) |
| $150,000 or more | 1 (0.7%) | 0 (0.0%) |
| Total | 150 (100.0%) | 32 (100.0%) |
Monthly Housing Cost Tiers in Nickerson
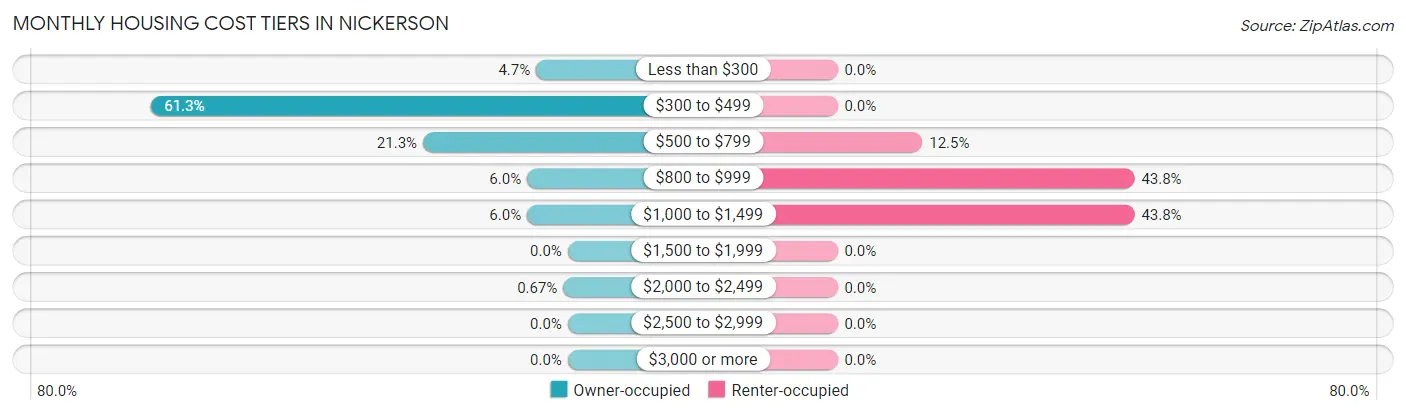
| Monthly Cost | Owner-occupied | Renter-occupied |
| Less than $300 | 7 (4.7%) | 0 (0.0%) |
| $300 to $499 | 92 (61.3%) | 0 (0.0%) |
| $500 to $799 | 32 (21.3%) | 4 (12.5%) |
| $800 to $999 | 9 (6.0%) | 14 (43.8%) |
| $1,000 to $1,499 | 9 (6.0%) | 14 (43.8%) |
| $1,500 to $1,999 | 0 (0.0%) | 0 (0.0%) |
| $2,000 to $2,499 | 1 (0.7%) | 0 (0.0%) |
| $2,500 to $2,999 | 0 (0.0%) | 0 (0.0%) |
| $3,000 or more | 0 (0.0%) | 0 (0.0%) |
| Total | 150 (100.0%) | 32 (100.0%) |
Physical Housing Characteristics in Nickerson
Housing Structures in Nickerson
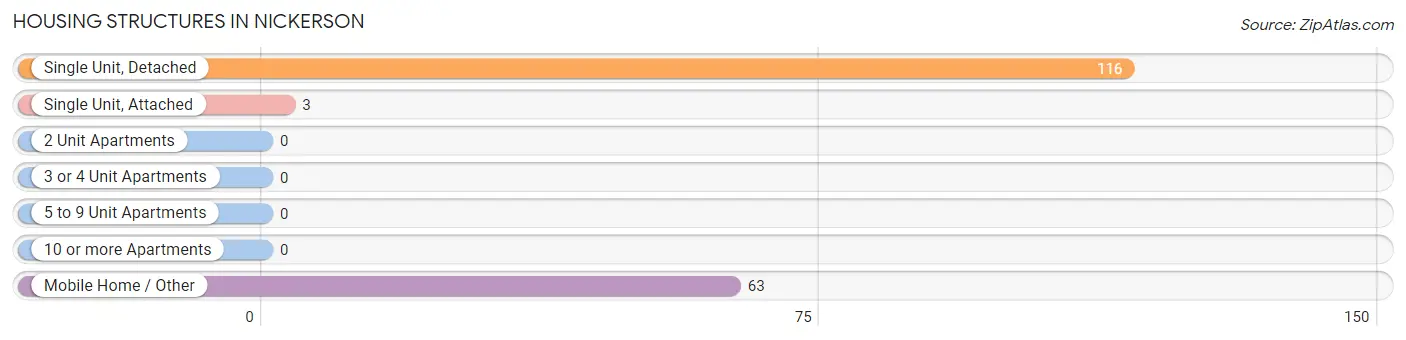
| Structure Type | # Housing Units | % Housing Units |
| Single Unit, Detached | 116 | 63.7% |
| Single Unit, Attached | 3 | 1.7% |
| 2 Unit Apartments | 0 | 0.0% |
| 3 or 4 Unit Apartments | 0 | 0.0% |
| 5 to 9 Unit Apartments | 0 | 0.0% |
| 10 or more Apartments | 0 | 0.0% |
| Mobile Home / Other | 63 | 34.6% |
| Total | 182 | 100.0% |
Housing Structures by Occupancy in Nickerson
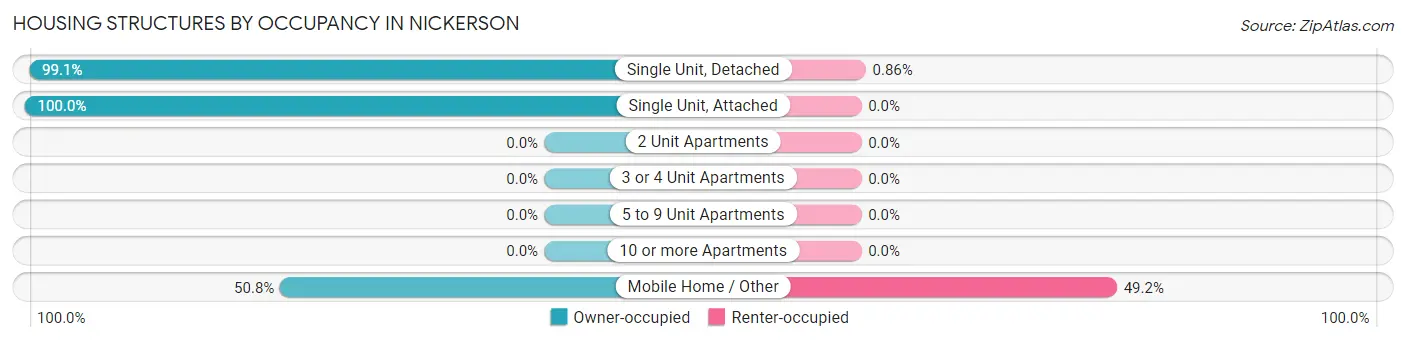
| Structure Type | Owner-occupied | Renter-occupied |
| Single Unit, Detached | 115 (99.1%) | 1 (0.9%) |
| Single Unit, Attached | 3 (100.0%) | 0 (0.0%) |
| 2 Unit Apartments | 0 (0.0%) | 0 (0.0%) |
| 3 or 4 Unit Apartments | 0 (0.0%) | 0 (0.0%) |
| 5 to 9 Unit Apartments | 0 (0.0%) | 0 (0.0%) |
| 10 or more Apartments | 0 (0.0%) | 0 (0.0%) |
| Mobile Home / Other | 32 (50.8%) | 31 (49.2%) |
| Total | 150 (82.4%) | 32 (17.6%) |
Housing Structures by Number of Rooms in Nickerson
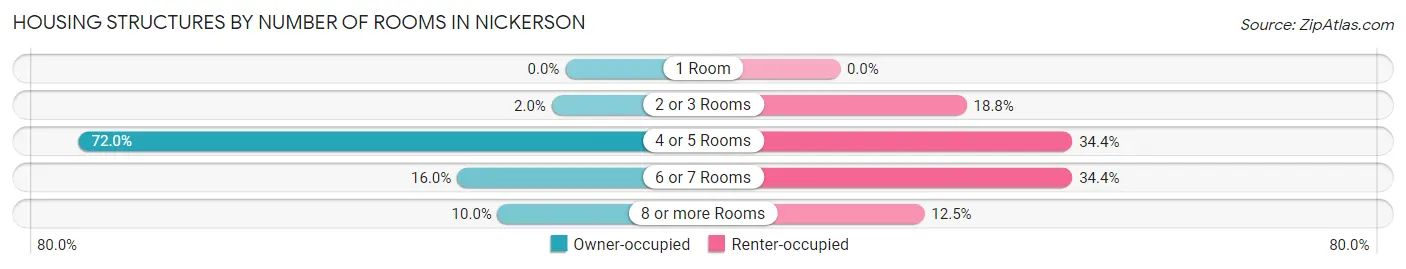
| Number of Rooms | Owner-occupied | Renter-occupied |
| 1 Room | 0 (0.0%) | 0 (0.0%) |
| 2 or 3 Rooms | 3 (2.0%) | 6 (18.8%) |
| 4 or 5 Rooms | 108 (72.0%) | 11 (34.4%) |
| 6 or 7 Rooms | 24 (16.0%) | 11 (34.4%) |
| 8 or more Rooms | 15 (10.0%) | 4 (12.5%) |
| Total | 150 (100.0%) | 32 (100.0%) |
Housing Structure by Heating Type in Nickerson
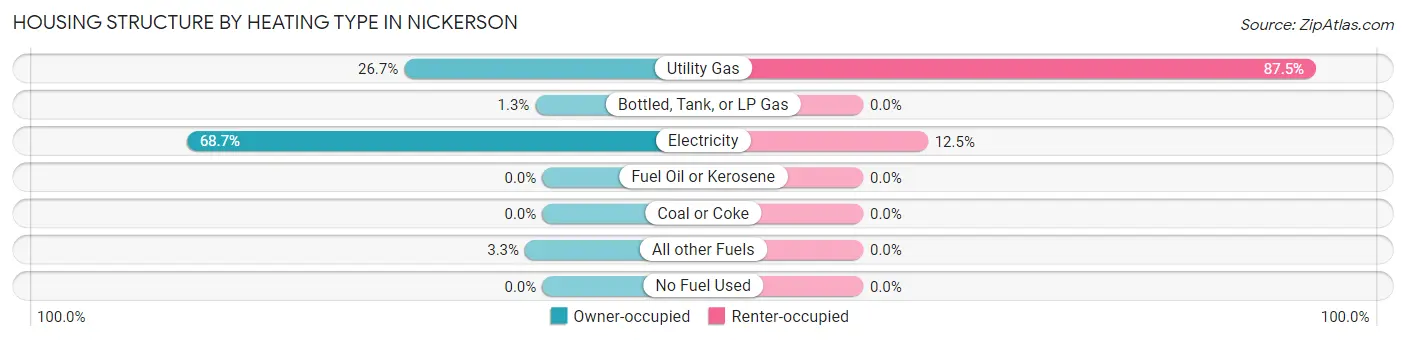
| Heating Type | Owner-occupied | Renter-occupied |
| Utility Gas | 40 (26.7%) | 28 (87.5%) |
| Bottled, Tank, or LP Gas | 2 (1.3%) | 0 (0.0%) |
| Electricity | 103 (68.7%) | 4 (12.5%) |
| Fuel Oil or Kerosene | 0 (0.0%) | 0 (0.0%) |
| Coal or Coke | 0 (0.0%) | 0 (0.0%) |
| All other Fuels | 5 (3.3%) | 0 (0.0%) |
| No Fuel Used | 0 (0.0%) | 0 (0.0%) |
| Total | 150 (100.0%) | 32 (100.0%) |
Household Vehicle Usage in Nickerson
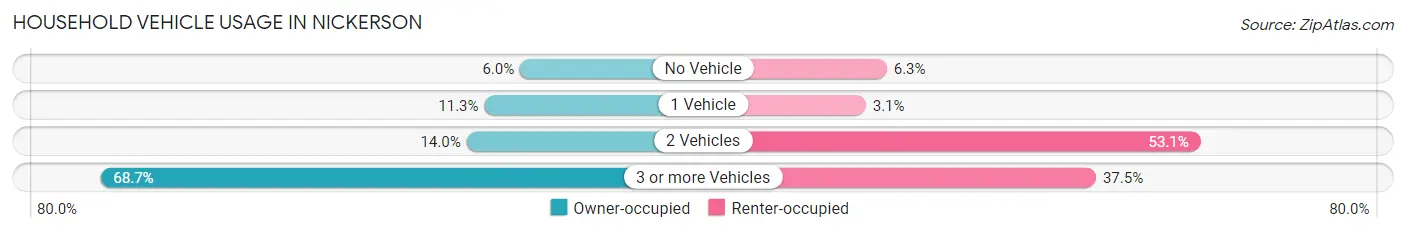
| Vehicles per Household | Owner-occupied | Renter-occupied |
| No Vehicle | 9 (6.0%) | 2 (6.2%) |
| 1 Vehicle | 17 (11.3%) | 1 (3.1%) |
| 2 Vehicles | 21 (14.0%) | 17 (53.1%) |
| 3 or more Vehicles | 103 (68.7%) | 12 (37.5%) |
| Total | 150 (100.0%) | 32 (100.0%) |
Real Estate & Mortgages in Nickerson
Real Estate and Mortgage Overview in Nickerson
| Characteristic | Without Mortgage | With Mortgage |
| Housing Units | 117 | 33 |
| Median Property Value | $65,000 | $0 |
| Median Household Income | $145,576 | $1 |
| Monthly Housing Costs | $330 | $0 |
| Real Estate Taxes | $1,222 | $6 |
Property Value by Mortgage Status in Nickerson
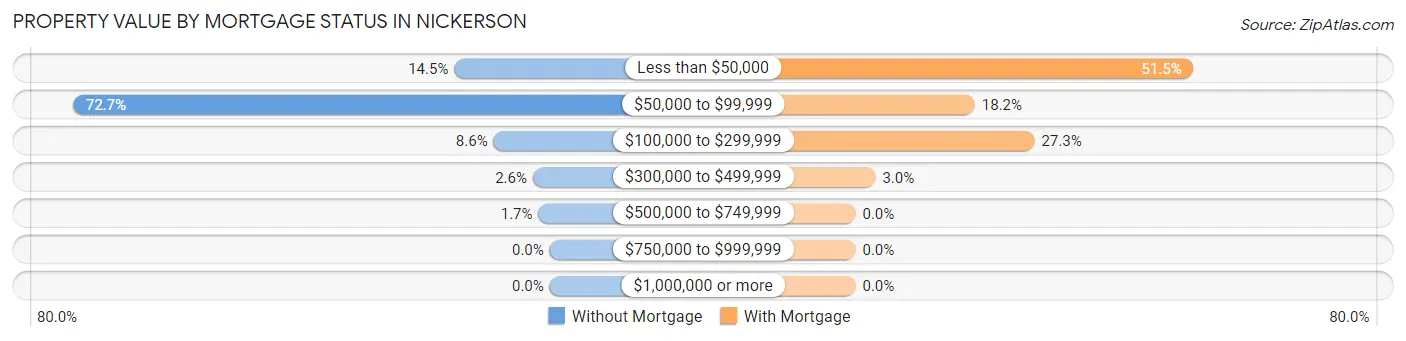
| Property Value | Without Mortgage | With Mortgage |
| Less than $50,000 | 17 (14.5%) | 17 (51.5%) |
| $50,000 to $99,999 | 85 (72.7%) | 6 (18.2%) |
| $100,000 to $299,999 | 10 (8.6%) | 9 (27.3%) |
| $300,000 to $499,999 | 3 (2.6%) | 1 (3.0%) |
| $500,000 to $749,999 | 2 (1.7%) | 0 (0.0%) |
| $750,000 to $999,999 | 0 (0.0%) | 0 (0.0%) |
| $1,000,000 or more | 0 (0.0%) | 0 (0.0%) |
| Total | 117 (100.0%) | 33 (100.0%) |
Household Income by Mortgage Status in Nickerson
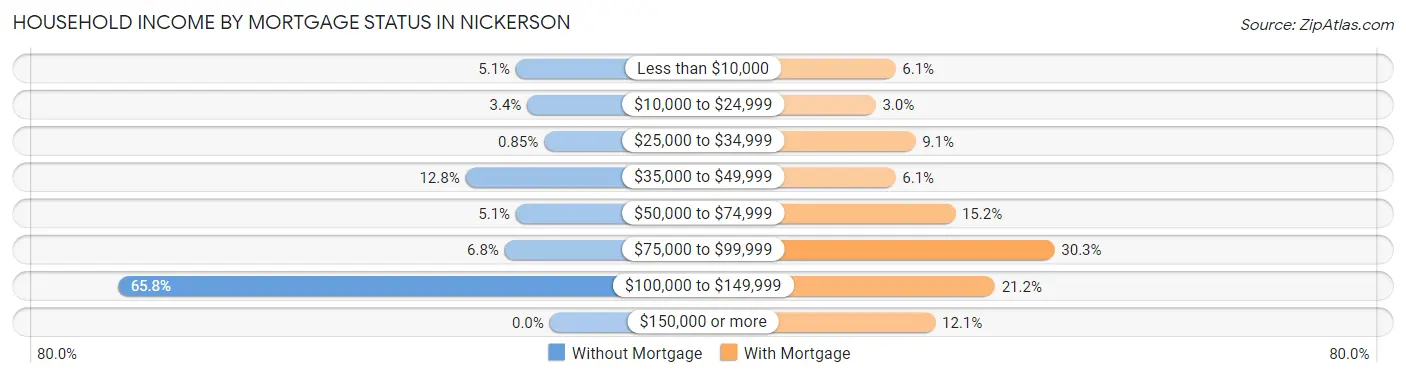
| Household Income | Without Mortgage | With Mortgage |
| Less than $10,000 | 6 (5.1%) | 2 (6.1%) |
| $10,000 to $24,999 | 4 (3.4%) | 1 (3.0%) |
| $25,000 to $34,999 | 1 (0.9%) | 3 (9.1%) |
| $35,000 to $49,999 | 15 (12.8%) | 2 (6.1%) |
| $50,000 to $74,999 | 6 (5.1%) | 5 (15.1%) |
| $75,000 to $99,999 | 8 (6.8%) | 10 (30.3%) |
| $100,000 to $149,999 | 77 (65.8%) | 7 (21.2%) |
| $150,000 or more | 0 (0.0%) | 4 (12.1%) |
| Total | 117 (100.0%) | 33 (100.0%) |
Property Value to Household Income Ratio in Nickerson
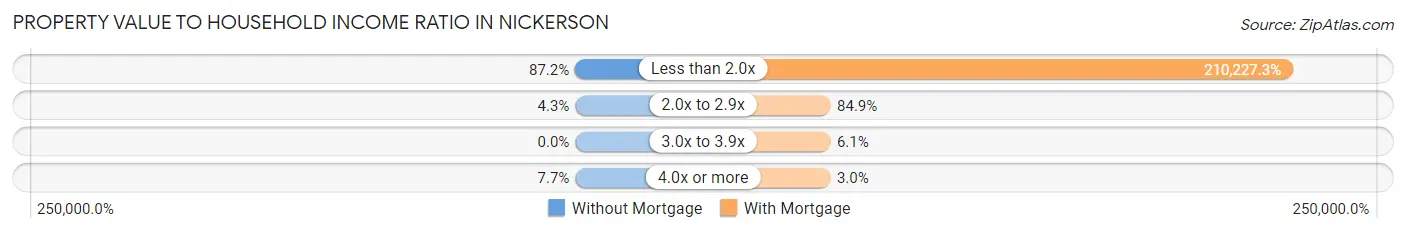
| Value-to-Income Ratio | Without Mortgage | With Mortgage |
| Less than 2.0x | 102 (87.2%) | 69,375 (210,227.3%) |
| 2.0x to 2.9x | 5 (4.3%) | 28 (84.9%) |
| 3.0x to 3.9x | 0 (0.0%) | 2 (6.1%) |
| 4.0x or more | 9 (7.7%) | 1 (3.0%) |
| Total | 117 (100.0%) | 33 (100.0%) |
Real Estate Taxes by Mortgage Status in Nickerson
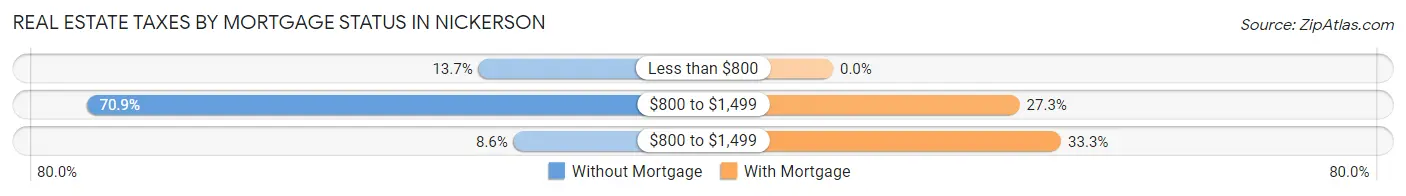
| Property Taxes | Without Mortgage | With Mortgage |
| Less than $800 | 16 (13.7%) | 0 (0.0%) |
| $800 to $1,499 | 83 (70.9%) | 9 (27.3%) |
| $800 to $1,499 | 10 (8.6%) | 11 (33.3%) |
| Total | 117 (100.0%) | 33 (100.0%) |
Health & Disability in Nickerson
Health Insurance Coverage by Age in Nickerson
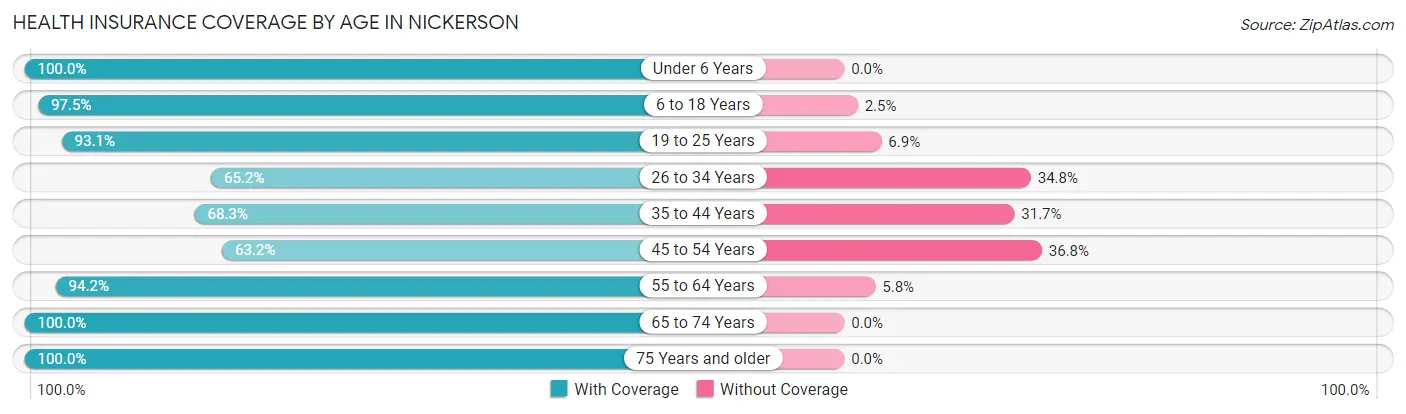
| Age Bracket | With Coverage | Without Coverage |
| Under 6 Years | 75 (100.0%) | 0 (0.0%) |
| 6 to 18 Years | 39 (97.5%) | 1 (2.5%) |
| 19 to 25 Years | 148 (93.1%) | 11 (6.9%) |
| 26 to 34 Years | 30 (65.2%) | 16 (34.8%) |
| 35 to 44 Years | 28 (68.3%) | 13 (31.7%) |
| 45 to 54 Years | 24 (63.2%) | 14 (36.8%) |
| 55 to 64 Years | 114 (94.2%) | 7 (5.8%) |
| 65 to 74 Years | 8 (100.0%) | 0 (0.0%) |
| 75 Years and older | 14 (100.0%) | 0 (0.0%) |
| Total | 480 (88.6%) | 62 (11.4%) |
Health Insurance Coverage by Citizenship Status in Nickerson
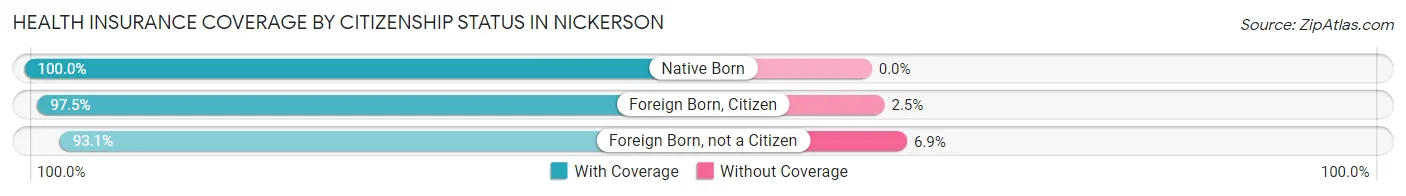
| Citizenship Status | With Coverage | Without Coverage |
| Native Born | 75 (100.0%) | 0 (0.0%) |
| Foreign Born, Citizen | 39 (97.5%) | 1 (2.5%) |
| Foreign Born, not a Citizen | 148 (93.1%) | 11 (6.9%) |
Health Insurance Coverage by Household Income in Nickerson
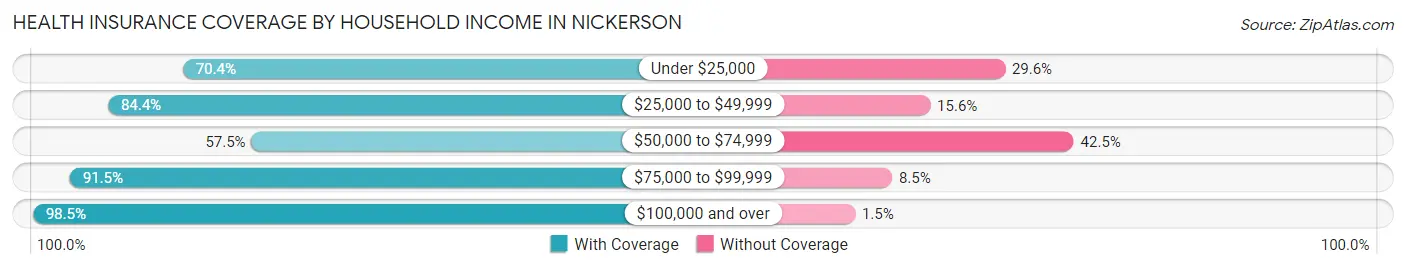
| Household Income | With Coverage | Without Coverage |
| Under $25,000 | 38 (70.4%) | 16 (29.6%) |
| $25,000 to $49,999 | 108 (84.4%) | 20 (15.6%) |
| $50,000 to $74,999 | 23 (57.5%) | 17 (42.5%) |
| $75,000 to $99,999 | 54 (91.5%) | 5 (8.5%) |
| $100,000 and over | 257 (98.5%) | 4 (1.5%) |
Public vs Private Health Insurance Coverage by Age in Nickerson
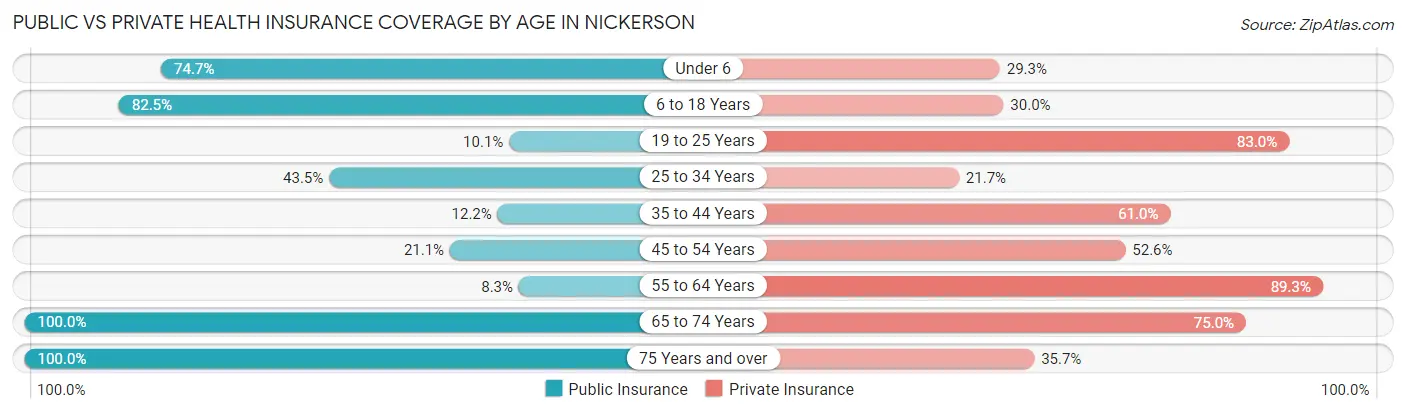
| Age Bracket | Public Insurance | Private Insurance |
| Under 6 | 56 (74.7%) | 22 (29.3%) |
| 6 to 18 Years | 33 (82.5%) | 12 (30.0%) |
| 19 to 25 Years | 16 (10.1%) | 132 (83.0%) |
| 25 to 34 Years | 20 (43.5%) | 10 (21.7%) |
| 35 to 44 Years | 5 (12.2%) | 25 (61.0%) |
| 45 to 54 Years | 8 (21.0%) | 20 (52.6%) |
| 55 to 64 Years | 10 (8.3%) | 108 (89.3%) |
| 65 to 74 Years | 8 (100.0%) | 6 (75.0%) |
| 75 Years and over | 14 (100.0%) | 5 (35.7%) |
| Total | 170 (31.4%) | 340 (62.7%) |
Disability Status by Sex by Age in Nickerson
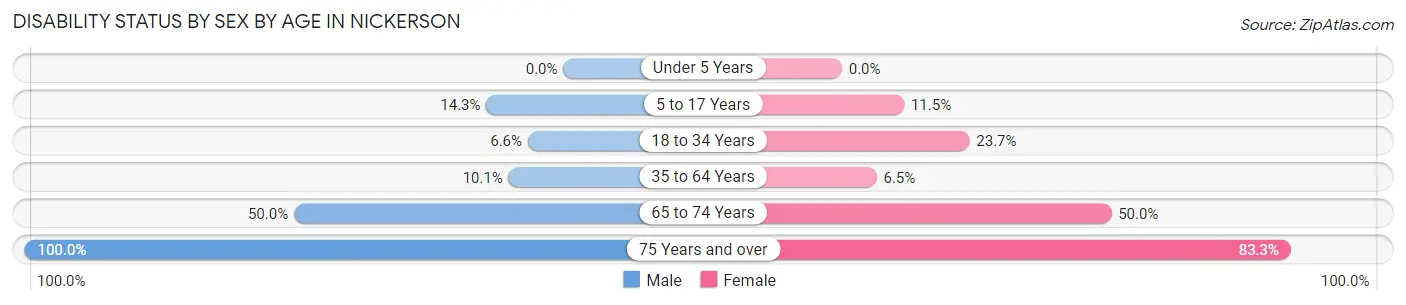
| Age Bracket | Male | Female |
| Under 5 Years | 0 (0.0%) | 0 (0.0%) |
| 5 to 17 Years | 2 (14.3%) | 3 (11.5%) |
| 18 to 34 Years | 11 (6.6%) | 9 (23.7%) |
| 35 to 64 Years | 14 (10.1%) | 4 (6.5%) |
| 65 to 74 Years | 3 (50.0%) | 1 (50.0%) |
| 75 Years and over | 8 (100.0%) | 5 (83.3%) |
Disability Class by Sex by Age in Nickerson
Disability Class: Hearing Difficulty
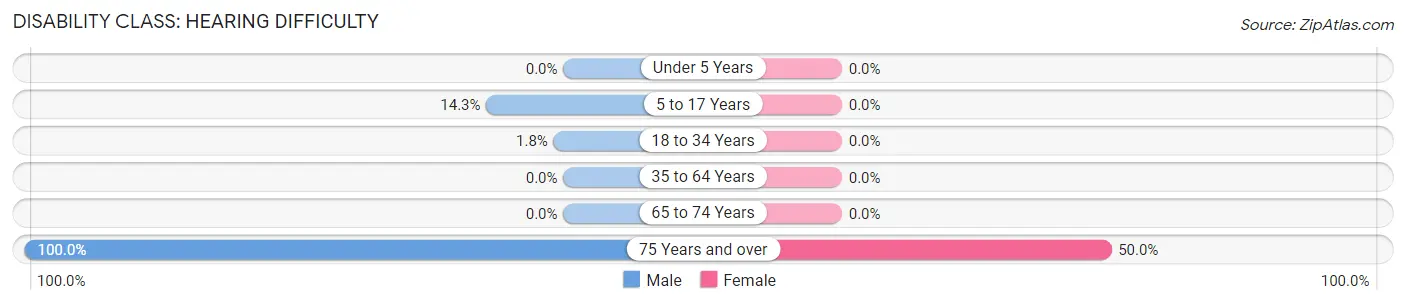
| Age Bracket | Male | Female |
| Under 5 Years | 0 (0.0%) | 0 (0.0%) |
| 5 to 17 Years | 2 (14.3%) | 0 (0.0%) |
| 18 to 34 Years | 3 (1.8%) | 0 (0.0%) |
| 35 to 64 Years | 0 (0.0%) | 0 (0.0%) |
| 65 to 74 Years | 0 (0.0%) | 0 (0.0%) |
| 75 Years and over | 8 (100.0%) | 3 (50.0%) |
Disability Class: Vision Difficulty
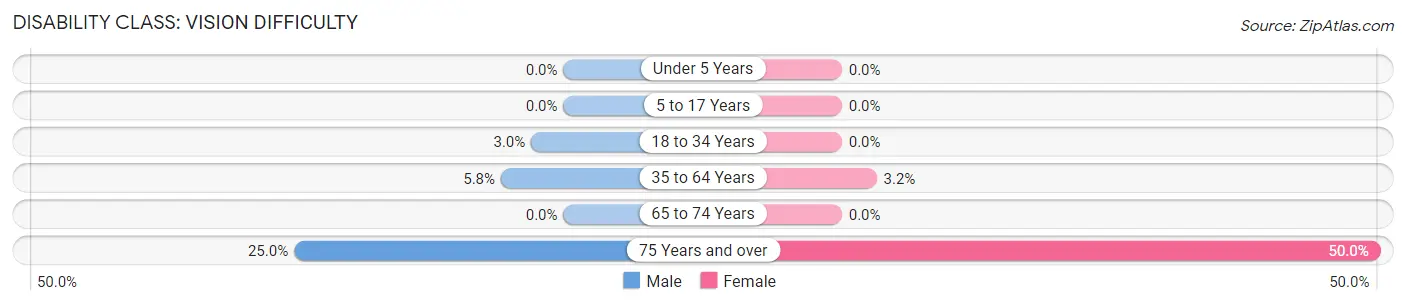
| Age Bracket | Male | Female |
| Under 5 Years | 0 (0.0%) | 0 (0.0%) |
| 5 to 17 Years | 0 (0.0%) | 0 (0.0%) |
| 18 to 34 Years | 5 (3.0%) | 0 (0.0%) |
| 35 to 64 Years | 8 (5.8%) | 2 (3.2%) |
| 65 to 74 Years | 0 (0.0%) | 0 (0.0%) |
| 75 Years and over | 2 (25.0%) | 3 (50.0%) |
Disability Class: Cognitive Difficulty
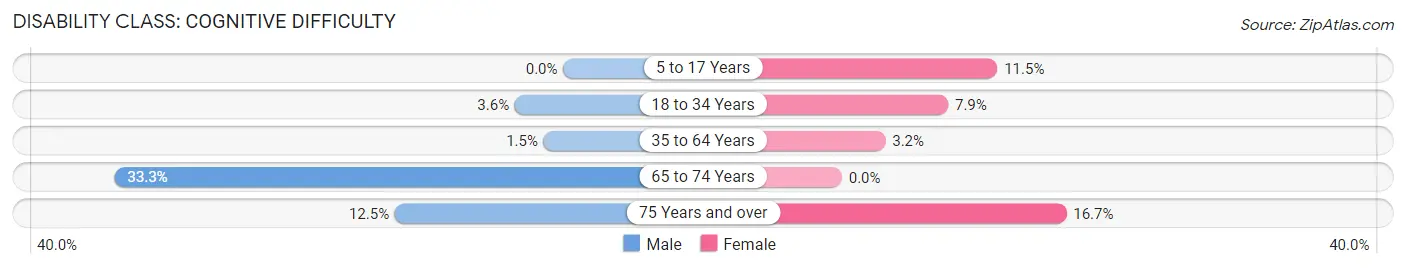
| Age Bracket | Male | Female |
| 5 to 17 Years | 0 (0.0%) | 3 (11.5%) |
| 18 to 34 Years | 6 (3.6%) | 3 (7.9%) |
| 35 to 64 Years | 2 (1.5%) | 2 (3.2%) |
| 65 to 74 Years | 2 (33.3%) | 0 (0.0%) |
| 75 Years and over | 1 (12.5%) | 1 (16.7%) |
Disability Class: Ambulatory Difficulty
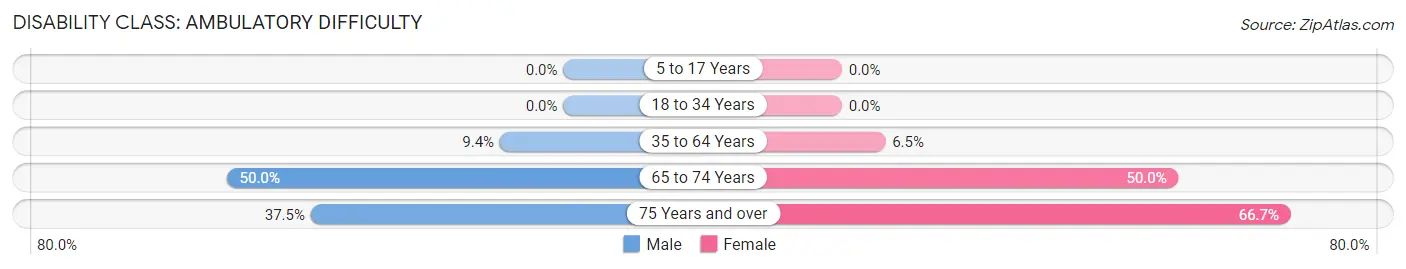
| Age Bracket | Male | Female |
| 5 to 17 Years | 0 (0.0%) | 0 (0.0%) |
| 18 to 34 Years | 0 (0.0%) | 0 (0.0%) |
| 35 to 64 Years | 13 (9.4%) | 4 (6.5%) |
| 65 to 74 Years | 3 (50.0%) | 1 (50.0%) |
| 75 Years and over | 3 (37.5%) | 4 (66.7%) |
Disability Class: Self-Care Difficulty
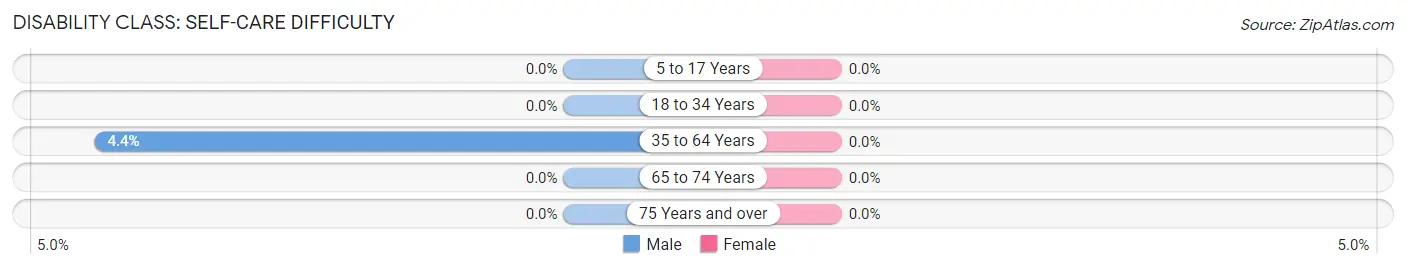
| Age Bracket | Male | Female |
| 5 to 17 Years | 0 (0.0%) | 0 (0.0%) |
| 18 to 34 Years | 0 (0.0%) | 0 (0.0%) |
| 35 to 64 Years | 6 (4.3%) | 0 (0.0%) |
| 65 to 74 Years | 0 (0.0%) | 0 (0.0%) |
| 75 Years and over | 0 (0.0%) | 0 (0.0%) |
Technology Access in Nickerson
Computing Device Access in Nickerson
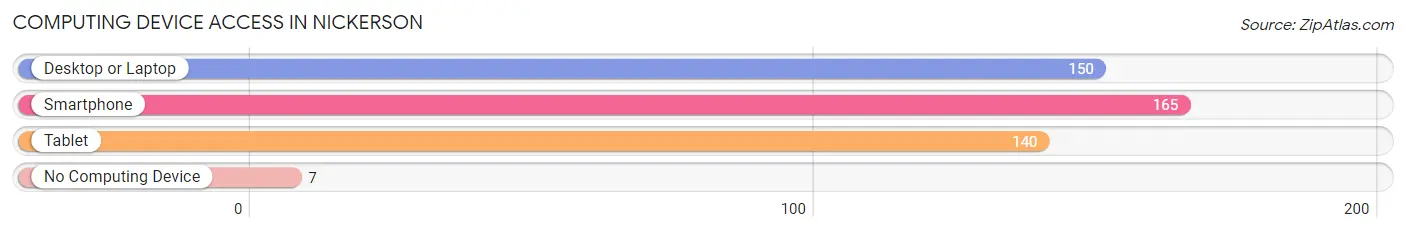
| Device Type | # Households | % Households |
| Desktop or Laptop | 150 | 82.4% |
| Smartphone | 165 | 90.7% |
| Tablet | 140 | 76.9% |
| No Computing Device | 7 | 3.8% |
| Total | 182 | 100.0% |
Internet Access in Nickerson
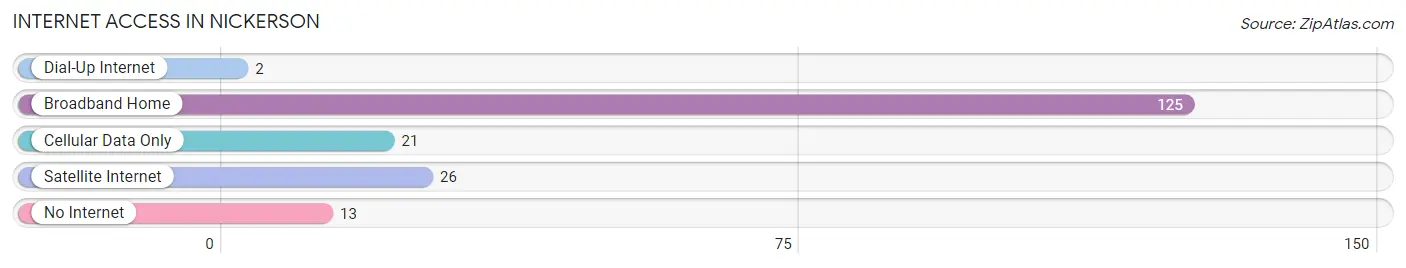
| Internet Type | # Households | % Households |
| Dial-Up Internet | 2 | 1.1% |
| Broadband Home | 125 | 68.7% |
| Cellular Data Only | 21 | 11.5% |
| Satellite Internet | 26 | 14.3% |
| No Internet | 13 | 7.1% |
| Total | 182 | 100.0% |
Nickerson Summary
Nickerson, Nebraska is a small town located in Dodge County, Nebraska. It is situated on the banks of the Platte River, about 25 miles northwest of Omaha. The town was founded in 1871 and has a population of approximately 1,000 people.
Nickerson is a rural community with a strong agricultural heritage. The town is home to a variety of farms, including corn, soybeans, wheat, and alfalfa. The town also has a few small businesses, including a grocery store, a hardware store, and a few restaurants.
Geographically, Nickerson is located in the eastern part of the state, near the Platte River. The town is surrounded by rolling hills and farmland, and is located about 25 miles from Omaha. The town is also close to the Missouri River, which provides a great opportunity for fishing and other recreational activities.
The economy of Nickerson is largely based on agriculture. The town is home to a variety of farms, including corn, soybeans, wheat, and alfalfa. The town also has a few small businesses, including a grocery store, a hardware store, and a few restaurants. The town is also home to a few manufacturing companies, including a furniture factory and a plastics factory.
Demographically, Nickerson is a predominantly white town. According to the 2010 census, the town had a population of 1,000 people, with 97.7% of the population being white. The town also has a small Hispanic population, with 2.3% of the population being Hispanic. The town also has a small African American population, with 0.1% of the population being African American.
Nickerson is a small town with a strong agricultural heritage. The town is home to a variety of farms, including corn, soybeans, wheat, and alfalfa. The town also has a few small businesses, including a grocery store, a hardware store, and a few restaurants. The town is also home to a few manufacturing companies, including a furniture factory and a plastics factory. The town is also close to the Missouri River, which provides a great opportunity for fishing and other recreational activities. The town has a predominantly white population, with 97.7% of the population being white. The town also has a small Hispanic population, with 2.3% of the population being Hispanic, and a small African American population, with 0.1% of the population being African American. Nickerson is a great place to live and work, and is a great example of a small town with a strong agricultural heritage.
Common Questions
What is Per Capita Income in Nickerson?
Per Capita income in Nickerson is $31,192.
What is the Median Family Income in Nickerson?
Median Family Income in Nickerson is $145,099.
What is Income or Wage Gap in Nickerson?
Income or Wage Gap in Nickerson is 57.3%.
Women in Nickerson earn 42.7 cents for every dollar earned by a man.
What is Inequality or Gini Index in Nickerson?
Inequality or Gini Index in Nickerson is 0.32.
What is the Total Population of Nickerson?
Total Population of Nickerson is 542.
What is the Total Male Population of Nickerson?
Total Male Population of Nickerson is 387.
What is the Total Female Population of Nickerson?
Total Female Population of Nickerson is 155.
What is the Ratio of Males per 100 Females in Nickerson?
There are 249.68 Males per 100 Females in Nickerson.
What is the Ratio of Females per 100 Males in Nickerson?
There are 40.05 Females per 100 Males in Nickerson.
What is the Median Population Age in Nickerson?
Median Population Age in Nickerson is 25.0 Years.
What is the Average Family Size in Nickerson
Average Family Size in Nickerson is 3.2 People.
What is the Average Household Size in Nickerson
Average Household Size in Nickerson is 3.0 People.
How Large is the Labor Force in Nickerson?
There are 283 People in the Labor Forcein in Nickerson.
What is the Percentage of People in the Labor Force in Nickerson?
64.3% of People are in the Labor Force in Nickerson.
What is the Unemployment Rate in Nickerson?
Unemployment Rate in Nickerson is 3.9%.