Clam Lake, WI Map & Demographics
Clam Lake Map
Clam Lake Overview
$35,361
PER CAPITA INCOME
$68,824
AVG FAMILY INCOME
$68,787
AVG HOUSEHOLD INCOME
0.10
INEQUALITY / GINI INDEX
49
TOTAL POPULATION
9
MALE POPULATION
40
FEMALE POPULATION
22.50
MALES / 100 FEMALES
444.44
FEMALES / 100 MALES
73.4
MEDIAN AGE
1.1
AVG FAMILY SIZE
1.1
AVG HOUSEHOLD SIZE
4
LABOR FORCE [ PEOPLE ]
8.2%
PERCENT IN LABOR FORCE
Clam Lake Zip Codes
Clam Lake Area Codes
Income in Clam Lake
Income Overview in Clam Lake
Per Capita Income in Clam Lake is $35,361, while median incomes of families and households are $68,824 and $68,787 respectively.
| Characteristic | Number | Measure |
| Per Capita Income | 49 | $35,361 |
| Median Family Income | 42 | $68,824 |
| Mean Family Income | 42 | $72,400 |
| Median Household Income | 43 | $68,787 |
| Mean Household Income | 43 | $71,688 |
| Income Deficit | 42 | $0 |
| Wage / Income Gap (%) | 49 | 0.00% |
| Wage / Income Gap ($) | 49 | 100.00¢ per $1 |
| Gini / Inequality Index | 49 | 0.10 |
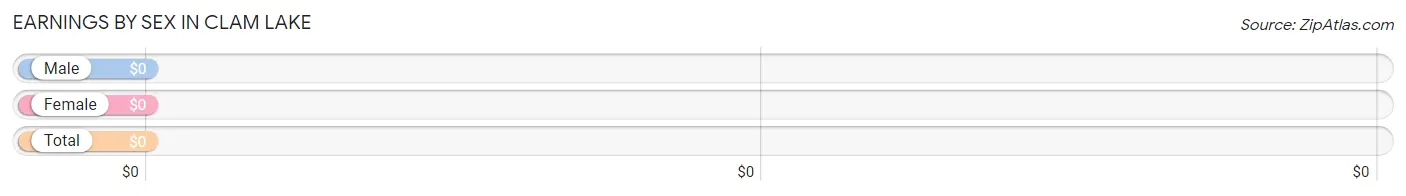
Earnings by Sex in Clam Lake
| Sex | Number | Average Earnings |
| Male | 3 (60.0%) | $0 |
| Female | 2 (40.0%) | $0 |
| Total | 5 (100.0%) | $0 |
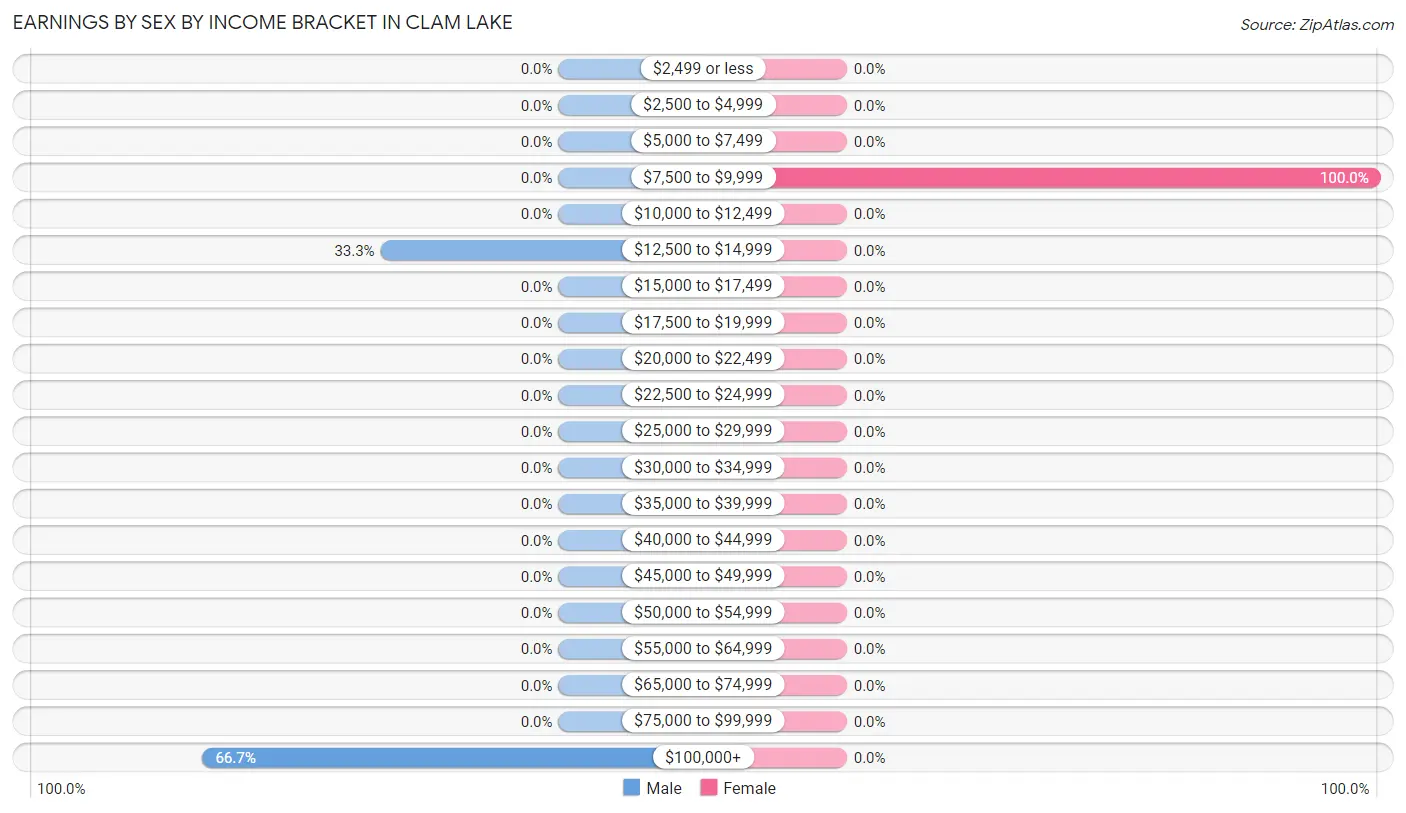
Earnings by Sex by Income Bracket in Clam Lake
The most common earnings brackets in Clam Lake are $100,000+ for men (2 | 66.7%) and $7,500 to $9,999 for women (2 | 100.0%).
| Income | Male | Female |
| $2,499 or less | 0 (0.0%) | 0 (0.0%) |
| $2,500 to $4,999 | 0 (0.0%) | 0 (0.0%) |
| $5,000 to $7,499 | 0 (0.0%) | 0 (0.0%) |
| $7,500 to $9,999 | 0 (0.0%) | 2 (100.0%) |
| $10,000 to $12,499 | 0 (0.0%) | 0 (0.0%) |
| $12,500 to $14,999 | 1 (33.3%) | 0 (0.0%) |
| $15,000 to $17,499 | 0 (0.0%) | 0 (0.0%) |
| $17,500 to $19,999 | 0 (0.0%) | 0 (0.0%) |
| $20,000 to $22,499 | 0 (0.0%) | 0 (0.0%) |
| $22,500 to $24,999 | 0 (0.0%) | 0 (0.0%) |
| $25,000 to $29,999 | 0 (0.0%) | 0 (0.0%) |
| $30,000 to $34,999 | 0 (0.0%) | 0 (0.0%) |
| $35,000 to $39,999 | 0 (0.0%) | 0 (0.0%) |
| $40,000 to $44,999 | 0 (0.0%) | 0 (0.0%) |
| $45,000 to $49,999 | 0 (0.0%) | 0 (0.0%) |
| $50,000 to $54,999 | 0 (0.0%) | 0 (0.0%) |
| $55,000 to $64,999 | 0 (0.0%) | 0 (0.0%) |
| $65,000 to $74,999 | 0 (0.0%) | 0 (0.0%) |
| $75,000 to $99,999 | 0 (0.0%) | 0 (0.0%) |
| $100,000+ | 2 (66.7%) | 0 (0.0%) |
| Total | 3 (100.0%) | 2 (100.0%) |
Earnings by Sex by Educational Attainment in Clam Lake
| Educational Attainment | Male Income | Female Income |
| Less than High School | - | - |
| High School Diploma | - | - |
| College or Associate's Degree | - | - |
| Bachelor's Degree | - | - |
| Graduate Degree | - | - |
| Total | - | - |
Family Income in Clam Lake
Family Income Brackets in Clam Lake
According to the Clam Lake family income data, there are 35 families falling into the $50,000 to $74,999 income range, which is the most common income bracket and makes up 83.3% of all families.
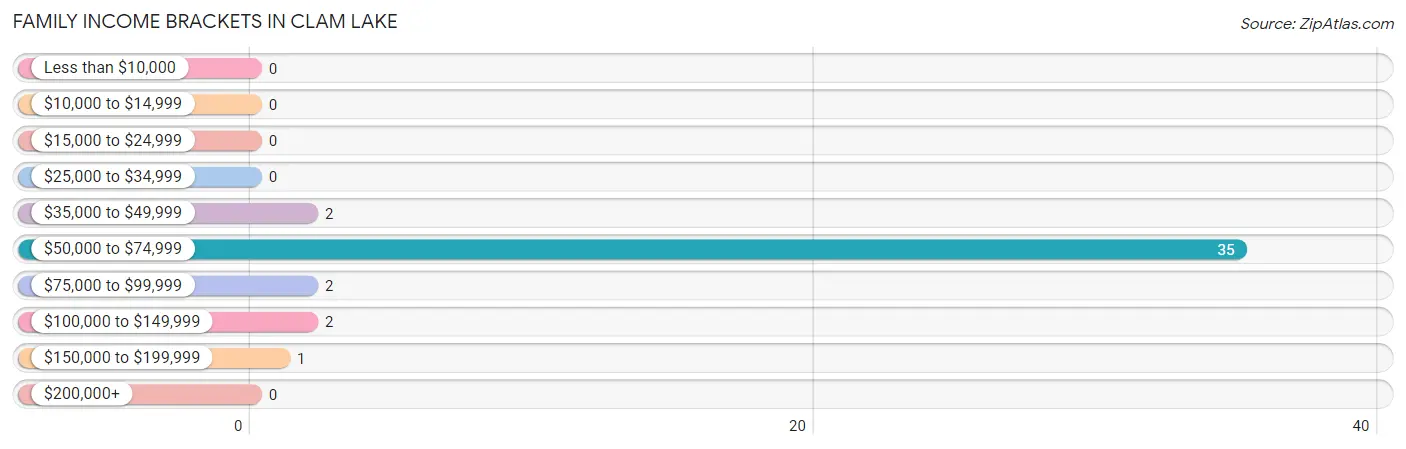
| Income Bracket | # Families | % Families |
| Less than $10,000 | 0 | 0.0% |
| $10,000 to $14,999 | 0 | 0.0% |
| $15,000 to $24,999 | 0 | 0.0% |
| $25,000 to $34,999 | 0 | 0.0% |
| $35,000 to $49,999 | 2 | 4.8% |
| $50,000 to $74,999 | 35 | 83.3% |
| $75,000 to $99,999 | 2 | 4.8% |
| $100,000 to $149,999 | 2 | 4.8% |
| $150,000 to $199,999 | 1 | 2.4% |
| $200,000+ | 0 | 0.0% |
Family Income by Famaliy Size in Clam Lake
2-person families (42 | 100.0%) account for the highest median family income in Clam Lake with $68,824 per family, while 2-person families (42 | 100.0%) have the highest median income of $34,412 per family member.
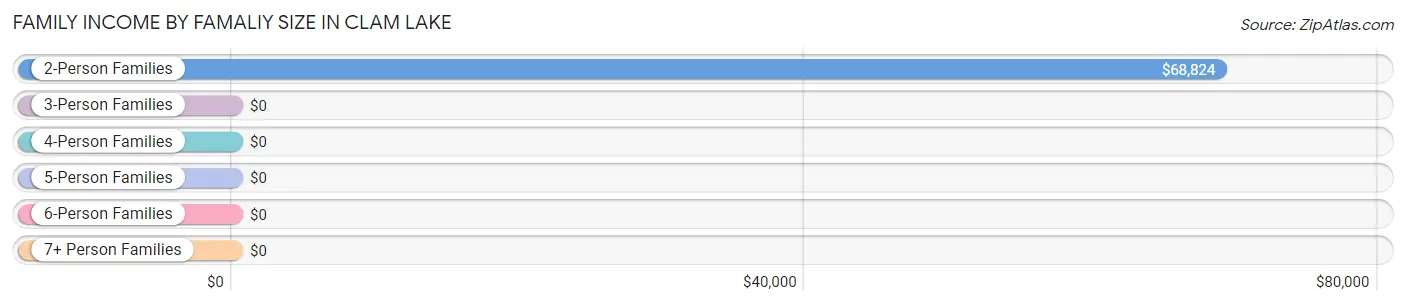
| Income Bracket | # Families | Median Income |
| 2-Person Families | 42 (100.0%) | $68,824 |
| 3-Person Families | 0 (0.0%) | $0 |
| 4-Person Families | 0 (0.0%) | $0 |
| 5-Person Families | 0 (0.0%) | $0 |
| 6-Person Families | 0 (0.0%) | $0 |
| 7+ Person Families | 0 (0.0%) | $0 |
| Total | 42 (100.0%) | $68,824 |
Family Income by Number of Earners in Clam Lake
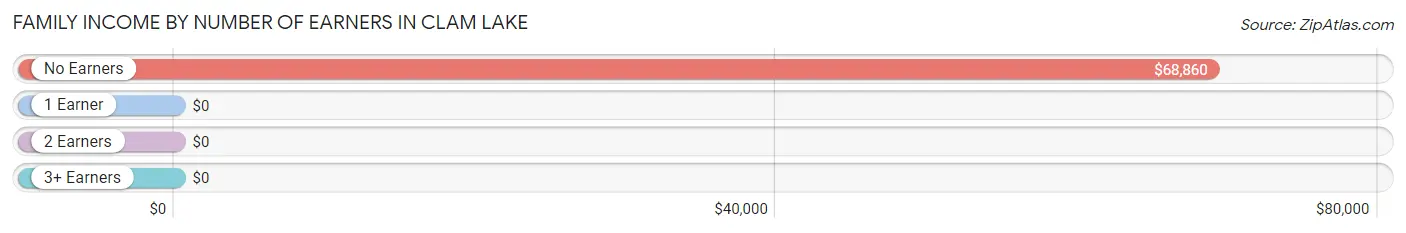
| Number of Earners | # Families | Median Income |
| No Earners | 37 (88.1%) | $68,860 |
| 1 Earner | 5 (11.9%) | $0 |
| 2 Earners | 0 (0.0%) | $0 |
| 3+ Earners | 0 (0.0%) | $0 |
| Total | 42 (100.0%) | $68,824 |
Household Income in Clam Lake
Household Income Brackets in Clam Lake
With 35 households falling in the category, the $50,000 to $74,999 income range is the most frequent in Clam Lake, accounting for 81.4% of all households.
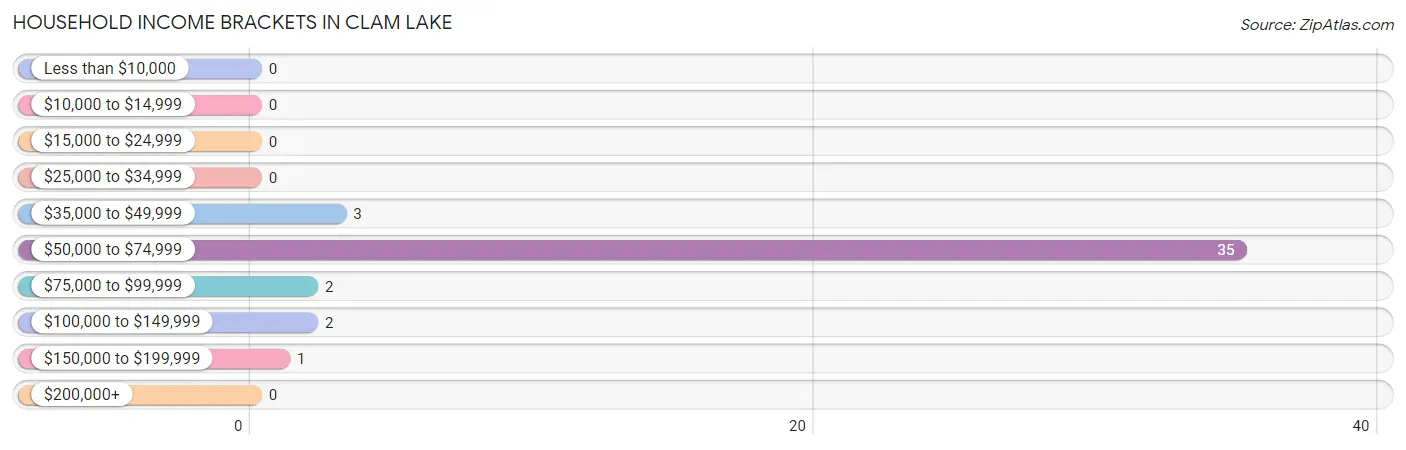
| Income Bracket | # Households | % Households |
| Less than $10,000 | 0 | 0.0% |
| $10,000 to $14,999 | 0 | 0.0% |
| $15,000 to $24,999 | 0 | 0.0% |
| $25,000 to $34,999 | 0 | 0.0% |
| $35,000 to $49,999 | 3 | 7.0% |
| $50,000 to $74,999 | 35 | 81.4% |
| $75,000 to $99,999 | 2 | 4.7% |
| $100,000 to $149,999 | 2 | 4.7% |
| $150,000 to $199,999 | 1 | 2.3% |
| $200,000+ | 0 | 0.0% |
Household Income by Householder Age in Clam Lake
The median household income in Clam Lake is $68,787, with the highest median household income of $68,824 found in the 65+ years age bracket for the primary householder. A total of 40 households (93.0%) fall into this category.
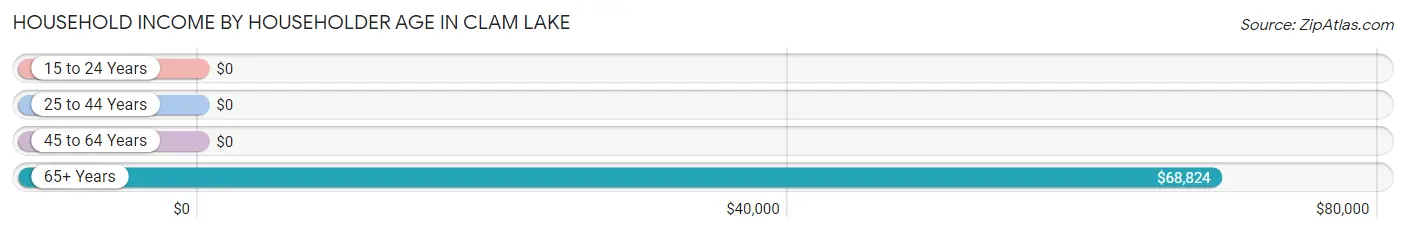
| Income Bracket | # Households | Median Income |
| 15 to 24 Years | 0 (0.0%) | $0 |
| 25 to 44 Years | 0 (0.0%) | $0 |
| 45 to 64 Years | 3 (7.0%) | $0 |
| 65+ Years | 40 (93.0%) | $68,824 |
| Total | 43 (100.0%) | $68,787 |
Poverty in Clam Lake
Income Below Poverty by Sex and Age in Clam Lake
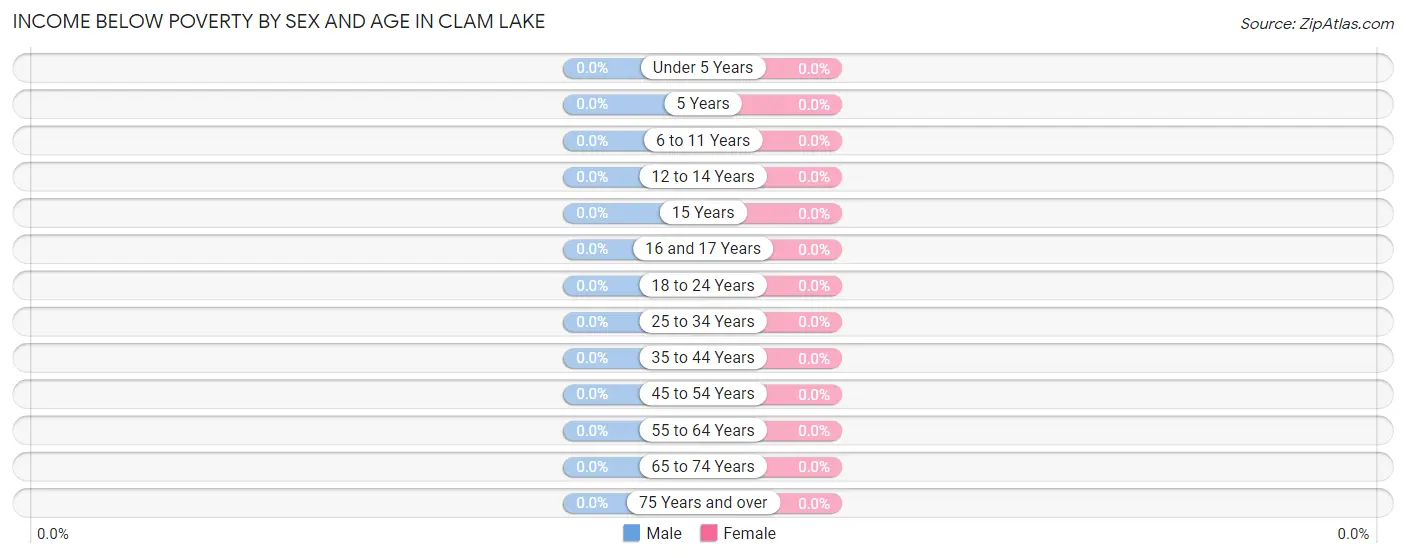
| Age Bracket | Male | Female |
| Under 5 Years | 0 (0.0%) | 0 (0.0%) |
| 5 Years | 0 (0.0%) | 0 (0.0%) |
| 6 to 11 Years | 0 (0.0%) | 0 (0.0%) |
| 12 to 14 Years | 0 (0.0%) | 0 (0.0%) |
| 15 Years | 0 (0.0%) | 0 (0.0%) |
| 16 and 17 Years | 0 (0.0%) | 0 (0.0%) |
| 18 to 24 Years | 0 (0.0%) | 0 (0.0%) |
| 25 to 34 Years | 0 (0.0%) | 0 (0.0%) |
| 35 to 44 Years | 0 (0.0%) | 0 (0.0%) |
| 45 to 54 Years | 0 (0.0%) | 0 (0.0%) |
| 55 to 64 Years | 0 (0.0%) | 0 (0.0%) |
| 65 to 74 Years | 0 (0.0%) | 0 (0.0%) |
| 75 Years and over | 0 (0.0%) | 0 (0.0%) |
| Total | 0 (0.0%) | 0 (0.0%) |
Income Above Poverty by Sex and Age in Clam Lake
According to the poverty statistics in Clam Lake, males aged 55 to 64 years and females aged 55 to 64 years are the age groups that are most secure financially, with 100.0% of males and 100.0% of females in these age groups living above the poverty line.
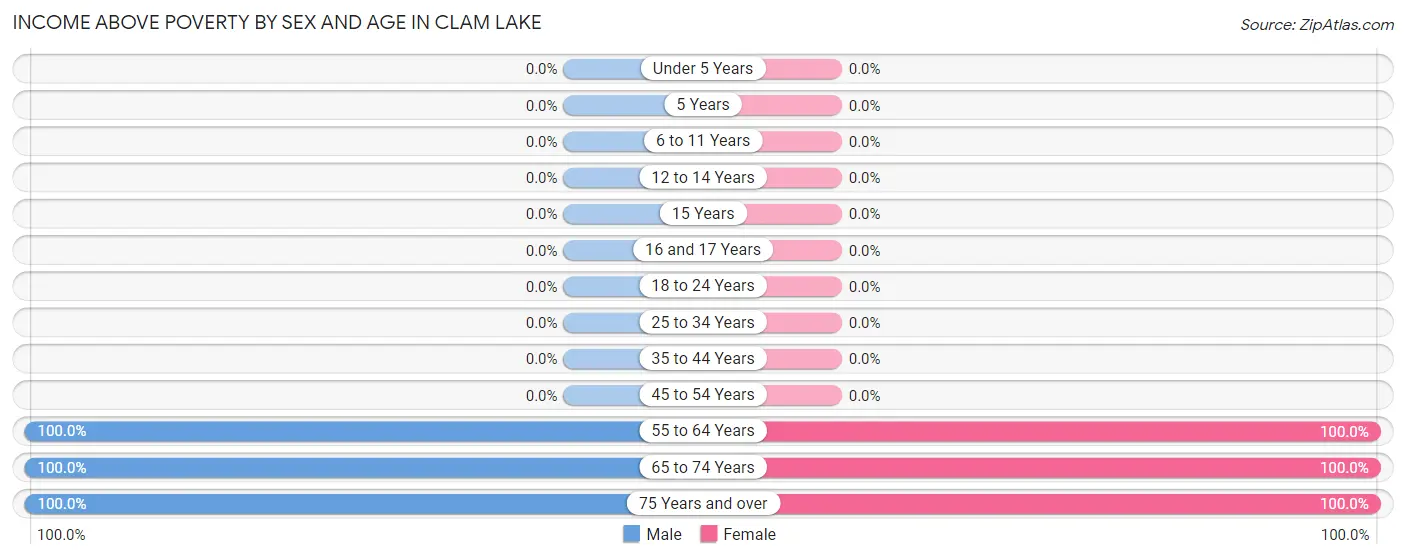
| Age Bracket | Male | Female |
| Under 5 Years | 0 (0.0%) | 0 (0.0%) |
| 5 Years | 0 (0.0%) | 0 (0.0%) |
| 6 to 11 Years | 0 (0.0%) | 0 (0.0%) |
| 12 to 14 Years | 0 (0.0%) | 0 (0.0%) |
| 15 Years | 0 (0.0%) | 0 (0.0%) |
| 16 and 17 Years | 0 (0.0%) | 0 (0.0%) |
| 18 to 24 Years | 0 (0.0%) | 0 (0.0%) |
| 25 to 34 Years | 0 (0.0%) | 0 (0.0%) |
| 35 to 44 Years | 0 (0.0%) | 0 (0.0%) |
| 45 to 54 Years | 0 (0.0%) | 0 (0.0%) |
| 55 to 64 Years | 1 (100.0%) | 3 (100.0%) |
| 65 to 74 Years | 7 (100.0%) | 36 (100.0%) |
| 75 Years and over | 1 (100.0%) | 1 (100.0%) |
| Total | 9 (100.0%) | 40 (100.0%) |
Income Below Poverty Among Married-Couple Families in Clam Lake
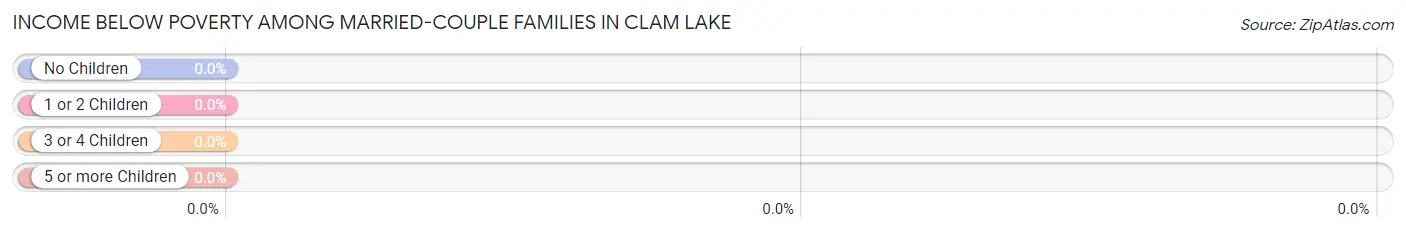
| Children | Above Poverty | Below Poverty |
| No Children | 40 (100.0%) | 0 (0.0%) |
| 1 or 2 Children | 0 (0.0%) | 0 (0.0%) |
| 3 or 4 Children | 0 (0.0%) | 0 (0.0%) |
| 5 or more Children | 0 (0.0%) | 0 (0.0%) |
| Total | 40 (100.0%) | 0 (0.0%) |
Income Below Poverty Among Single-Parent Households in Clam Lake
| Children | Single Father | Single Mother |
| No Children | 0 (0.0%) | 0 (0.0%) |
| 1 or 2 Children | 0 (0.0%) | 0 (0.0%) |
| 3 or 4 Children | 0 (0.0%) | 0 (0.0%) |
| 5 or more Children | 0 (0.0%) | 0 (0.0%) |
| Total | 0 (0.0%) | 0 (0.0%) |
Income Below Poverty Among Married-Couple vs Single-Parent Households in Clam Lake
| Children | Married-Couple Families | Single-Parent Households |
| No Children | 0 (0.0%) | 0 (0.0%) |
| 1 or 2 Children | 0 (0.0%) | 0 (0.0%) |
| 3 or 4 Children | 0 (0.0%) | 0 (0.0%) |
| 5 or more Children | 0 (0.0%) | 0 (0.0%) |
| Total | 0 (0.0%) | 0 (0.0%) |
Race in Clam Lake
The most populous races in Clam Lake are , and White / Caucasian (49 | 100.0%).
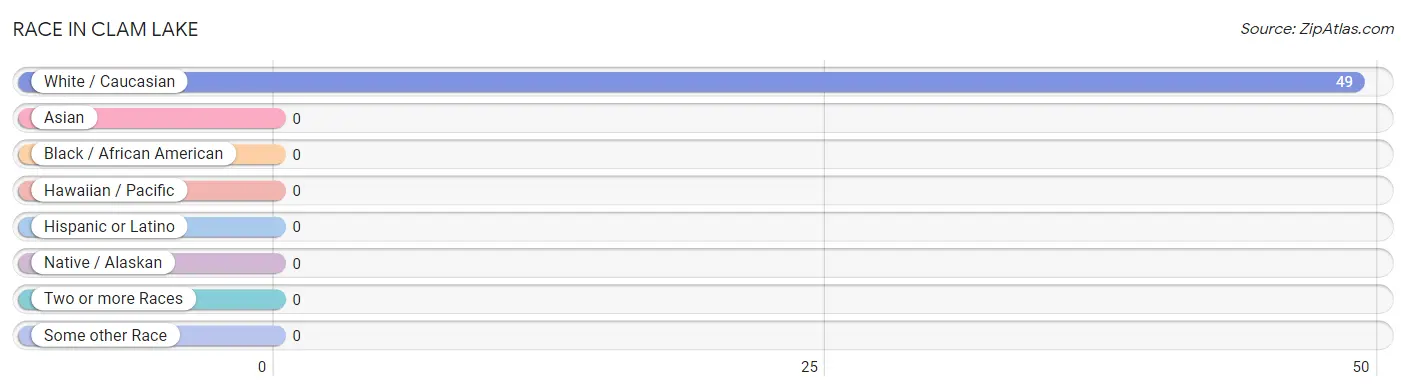
| Race | # Population | % Population |
| Asian | 0 | 0.0% |
| Black / African American | 0 | 0.0% |
| Hawaiian / Pacific | 0 | 0.0% |
| Hispanic or Latino | 0 | 0.0% |
| Native / Alaskan | 0 | 0.0% |
| White / Caucasian | 49 | 100.0% |
| Two or more Races | 0 | 0.0% |
| Some other Race | 0 | 0.0% |
| Total | 49 | 100.0% |
Ancestry in Clam Lake
The most populous ancestries reported in Clam Lake are German (41 | 83.7%), Irish (34 | 69.4%), Dutch (3 | 6.1%), French (3 | 6.1%), and Czech (2 | 4.1%), together accounting for 169.4% of all Clam Lake residents.
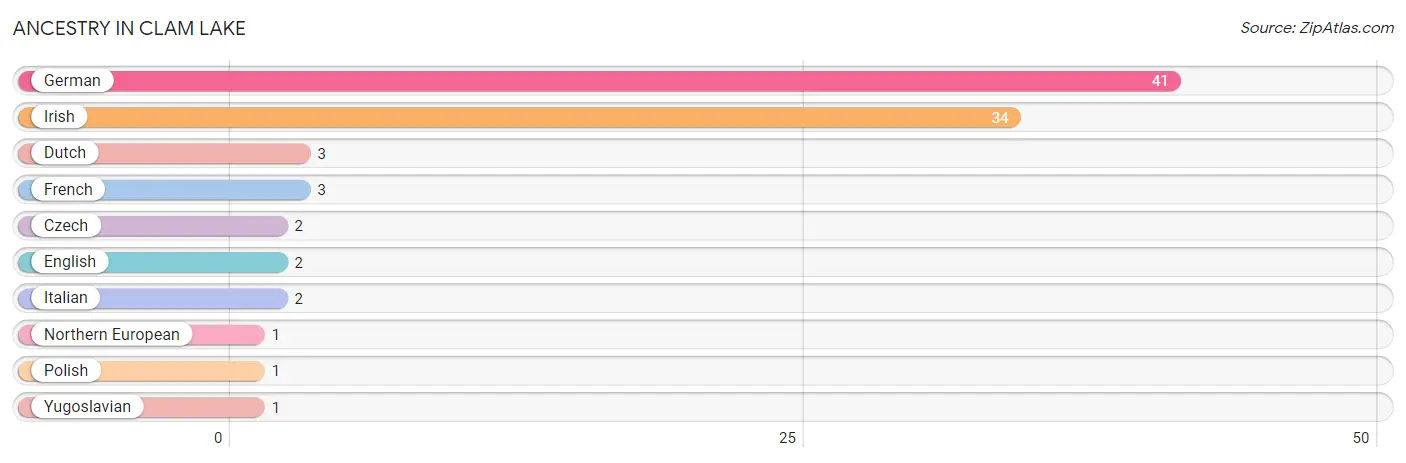
| Ancestry | # Population | % Population |
| Czech | 2 | 4.1% |
| Dutch | 3 | 6.1% |
| English | 2 | 4.1% |
| French | 3 | 6.1% |
| German | 41 | 83.7% |
| Irish | 34 | 69.4% |
| Italian | 2 | 4.1% |
| Northern European | 1 | 2.0% |
| Polish | 1 | 2.0% |
| Yugoslavian | 1 | 2.0% | View All 10 Rows |
Immigrants in Clam Lake

| Immigration Origin | # Population | % Population | View All 0 Rows |
Sex and Age in Clam Lake
Sex and Age in Clam Lake
The most populous age groups in Clam Lake are 70 to 74 Years (4 | 44.4%) for men and 70 to 74 Years (36 | 90.0%) for women.
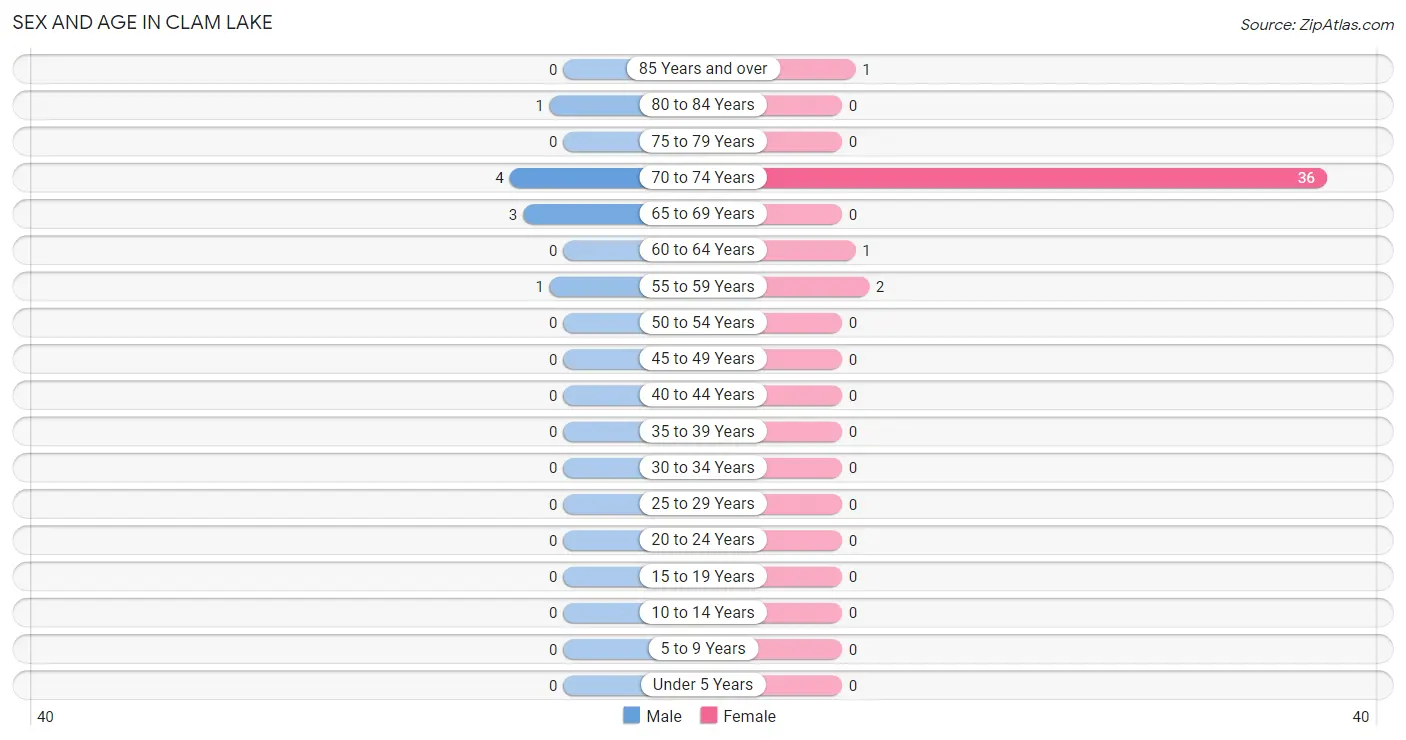
| Age Bracket | Male | Female |
| Under 5 Years | 0 (0.0%) | 0 (0.0%) |
| 5 to 9 Years | 0 (0.0%) | 0 (0.0%) |
| 10 to 14 Years | 0 (0.0%) | 0 (0.0%) |
| 15 to 19 Years | 0 (0.0%) | 0 (0.0%) |
| 20 to 24 Years | 0 (0.0%) | 0 (0.0%) |
| 25 to 29 Years | 0 (0.0%) | 0 (0.0%) |
| 30 to 34 Years | 0 (0.0%) | 0 (0.0%) |
| 35 to 39 Years | 0 (0.0%) | 0 (0.0%) |
| 40 to 44 Years | 0 (0.0%) | 0 (0.0%) |
| 45 to 49 Years | 0 (0.0%) | 0 (0.0%) |
| 50 to 54 Years | 0 (0.0%) | 0 (0.0%) |
| 55 to 59 Years | 1 (11.1%) | 2 (5.0%) |
| 60 to 64 Years | 0 (0.0%) | 1 (2.5%) |
| 65 to 69 Years | 3 (33.3%) | 0 (0.0%) |
| 70 to 74 Years | 4 (44.4%) | 36 (90.0%) |
| 75 to 79 Years | 0 (0.0%) | 0 (0.0%) |
| 80 to 84 Years | 1 (11.1%) | 0 (0.0%) |
| 85 Years and over | 0 (0.0%) | 1 (2.5%) |
| Total | 9 (100.0%) | 40 (100.0%) |
Families and Households in Clam Lake
Median Family Size in Clam Lake
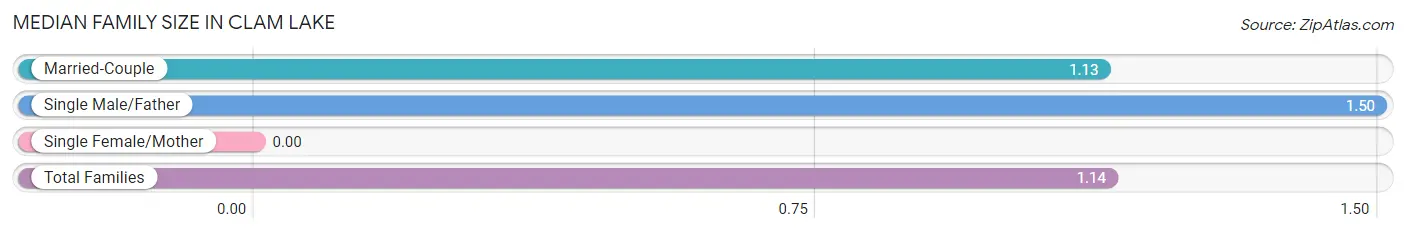
| Family Type | # Families | Family Size |
| Married-Couple | 40 (95.2%) | 1.13 |
| Single Male/Father | 2 (4.8%) | 1.50 |
| Single Female/Mother | 0 (0.0%) | - |
| Total Families | 42 (100.0%) | 1.14 |
Median Household Size in Clam Lake
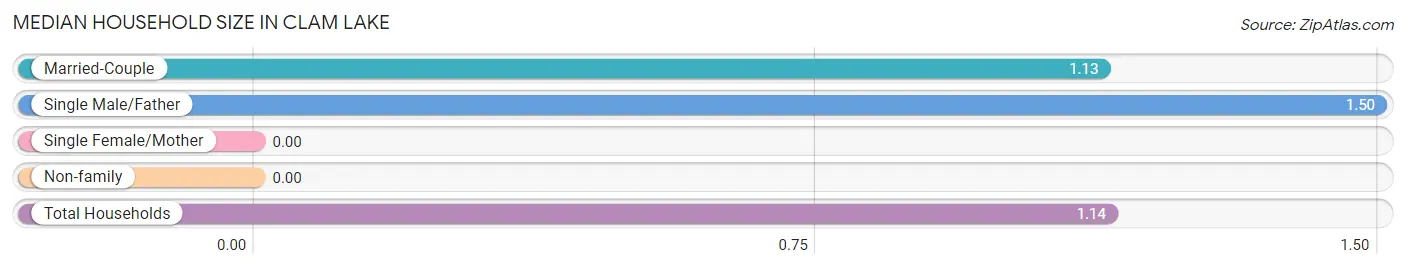
| Household Type | # Households | Household Size |
| Married-Couple | 40 (93.0%) | 1.13 |
| Single Male/Father | 2 (4.6%) | 1.50 |
| Single Female/Mother | 0 (0.0%) | - |
| Non-family | 1 (2.3%) | - |
| Total Households | 43 (100.0%) | 1.14 |
Household Size by Marriage Status in Clam Lake
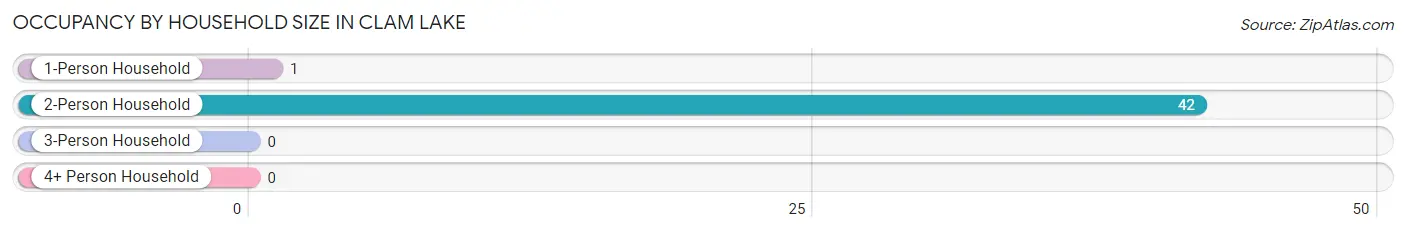
Out of a total of 43 households in Clam Lake, 42 (97.7%) are family households, while 1 (2.3%) are nonfamily households. The most numerous type of family households are 2-person households, comprising 42, and the most common type of nonfamily households are 1-person households, comprising 1.
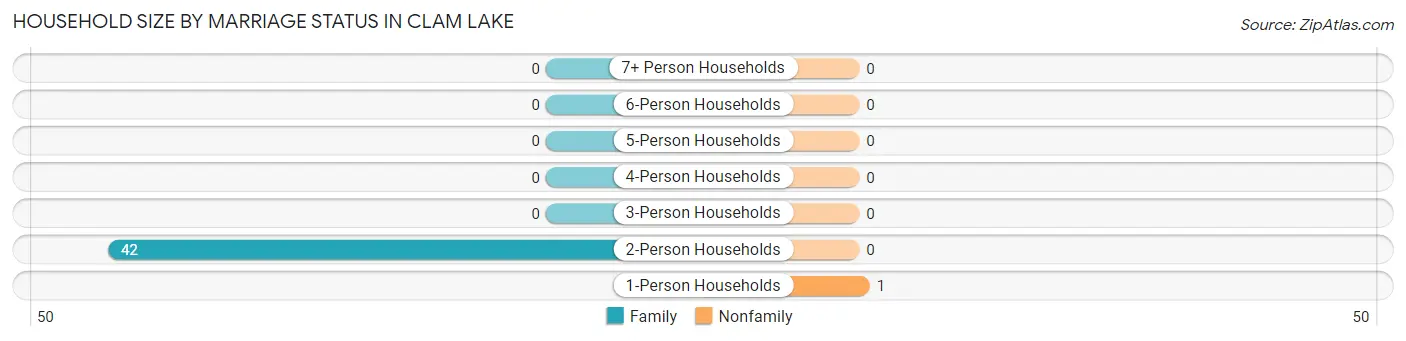
| Household Size | Family Households | Nonfamily Households |
| 1-Person Households | - | 1 (2.3%) |
| 2-Person Households | 42 (97.7%) | 0 (0.0%) |
| 3-Person Households | 0 (0.0%) | 0 (0.0%) |
| 4-Person Households | 0 (0.0%) | 0 (0.0%) |
| 5-Person Households | 0 (0.0%) | 0 (0.0%) |
| 6-Person Households | 0 (0.0%) | 0 (0.0%) |
| 7+ Person Households | 0 (0.0%) | 0 (0.0%) |
| Total | 42 (97.7%) | 1 (2.3%) |
Female Fertility in Clam Lake
Fertility by Age in Clam Lake
| Age Bracket | Women with Births | Births / 1,000 Women |
| 15 to 19 years | 0 (0.0%) | 0.0 |
| 20 to 34 years | 0 (0.0%) | 0.0 |
| 35 to 50 years | 0 (0.0%) | 0.0 |
| Total | 0 (0.0%) | 0.0 |
Fertility by Age by Marriage Status in Clam Lake
| Age Bracket | Married | Unmarried |
| 15 to 19 years | 0 (0.0%) | 0 (0.0%) |
| 20 to 34 years | 0 (0.0%) | 0 (0.0%) |
| 35 to 50 years | 0 (0.0%) | 0 (0.0%) |
| Total | 0 (0.0%) | 0 (0.0%) |
Fertility by Education in Clam Lake
| Educational Attainment | Women with Births | Births / 1,000 Women |
| Less than High School | 0 (0.0%) | 0.0 |
| High School Diploma | 0 (0.0%) | 0.0 |
| College or Associate's Degree | 0 (0.0%) | 0.0 |
| Bachelor's Degree | 0 (0.0%) | 0.0 |
| Graduate Degree | 0 (0.0%) | 0.0 |
| Total | 0 (0.0%) | 0.0 |
Fertility by Education by Marriage Status in Clam Lake
| Educational Attainment | Married | Unmarried |
| Less than High School | 0 (0.0%) | 0 (0.0%) |
| High School Diploma | 0 (0.0%) | 0 (0.0%) |
| College or Associate's Degree | 0 (0.0%) | 0 (0.0%) |
| Bachelor's Degree | 0 (0.0%) | 0 (0.0%) |
| Graduate Degree | 0 (0.0%) | 0 (0.0%) |
| Total | 0 (0.0%) | 0 (0.0%) |
Employment Characteristics in Clam Lake
Employment by Class of Employer in Clam Lake
Among the 4 employed individuals in Clam Lake, private company employees (2 | 50.0%), and not-for-profit organizations (2 | 50.0%) make up the most common classes of employment.
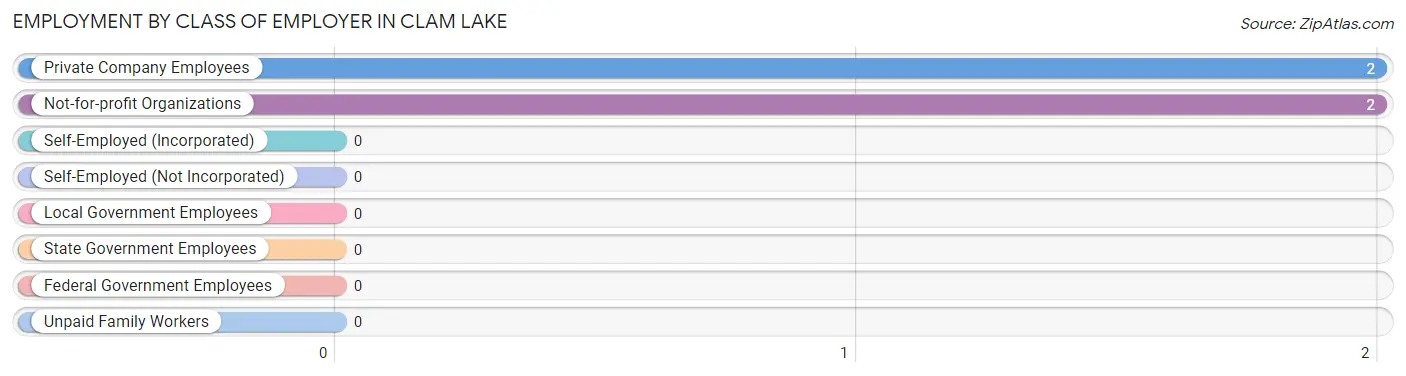
| Employer Class | # Employees | % Employees |
| Private Company Employees | 2 | 50.0% |
| Self-Employed (Incorporated) | 0 | 0.0% |
| Self-Employed (Not Incorporated) | 0 | 0.0% |
| Not-for-profit Organizations | 2 | 50.0% |
| Local Government Employees | 0 | 0.0% |
| State Government Employees | 0 | 0.0% |
| Federal Government Employees | 0 | 0.0% |
| Unpaid Family Workers | 0 | 0.0% |
| Total | 4 | 100.0% |
Employment Status by Age in Clam Lake
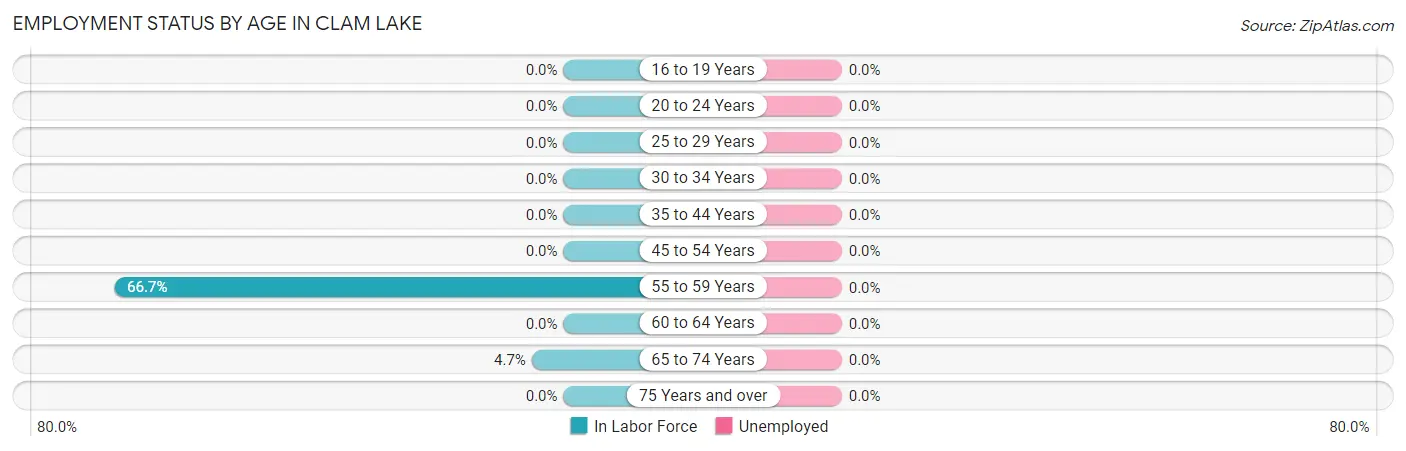
| Age Bracket | In Labor Force | Unemployed |
| 16 to 19 Years | 0 (0.0%) | 0 (0.0%) |
| 20 to 24 Years | 0 (0.0%) | 0 (0.0%) |
| 25 to 29 Years | 0 (0.0%) | 0 (0.0%) |
| 30 to 34 Years | 0 (0.0%) | 0 (0.0%) |
| 35 to 44 Years | 0 (0.0%) | 0 (0.0%) |
| 45 to 54 Years | 0 (0.0%) | 0 (0.0%) |
| 55 to 59 Years | 2 (66.7%) | 0 (0.0%) |
| 60 to 64 Years | 0 (0.0%) | 0 (0.0%) |
| 65 to 74 Years | 2 (4.7%) | 0 (0.0%) |
| 75 Years and over | 0 (0.0%) | 0 (0.0%) |
| Total | 4 (8.2%) | 0 (0.0%) |
Employment Status by Educational Attainment in Clam Lake
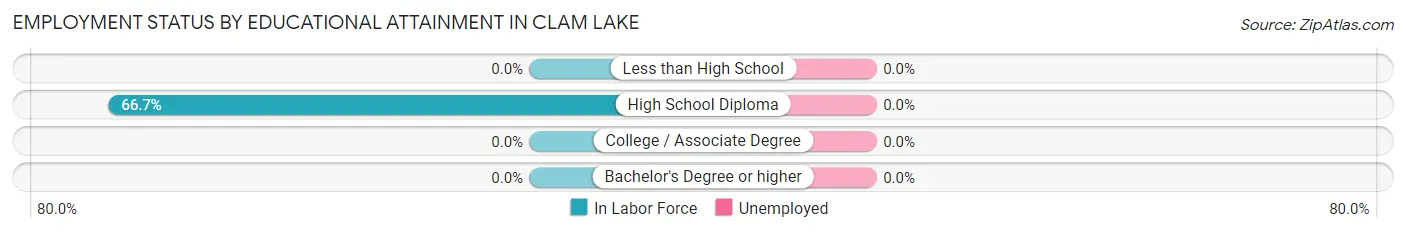
| Educational Attainment | In Labor Force | Unemployed |
| Less than High School | 0 (0.0%) | 0 (0.0%) |
| High School Diploma | 2 (66.7%) | 0 (0.0%) |
| College / Associate Degree | 0 (0.0%) | 0 (0.0%) |
| Bachelor's Degree or higher | 0 (0.0%) | 0 (0.0%) |
| Total | 2 (50.0%) | 0 (0.0%) |
Employment Occupations by Sex in Clam Lake
Management, Business, Science and Arts Occupations
The most common Management, Business, Science and Arts occupations in Clam Lake are Computers, Engineering & Science (2 | 50.0%), and Computers & Mathematics (2 | 50.0%).
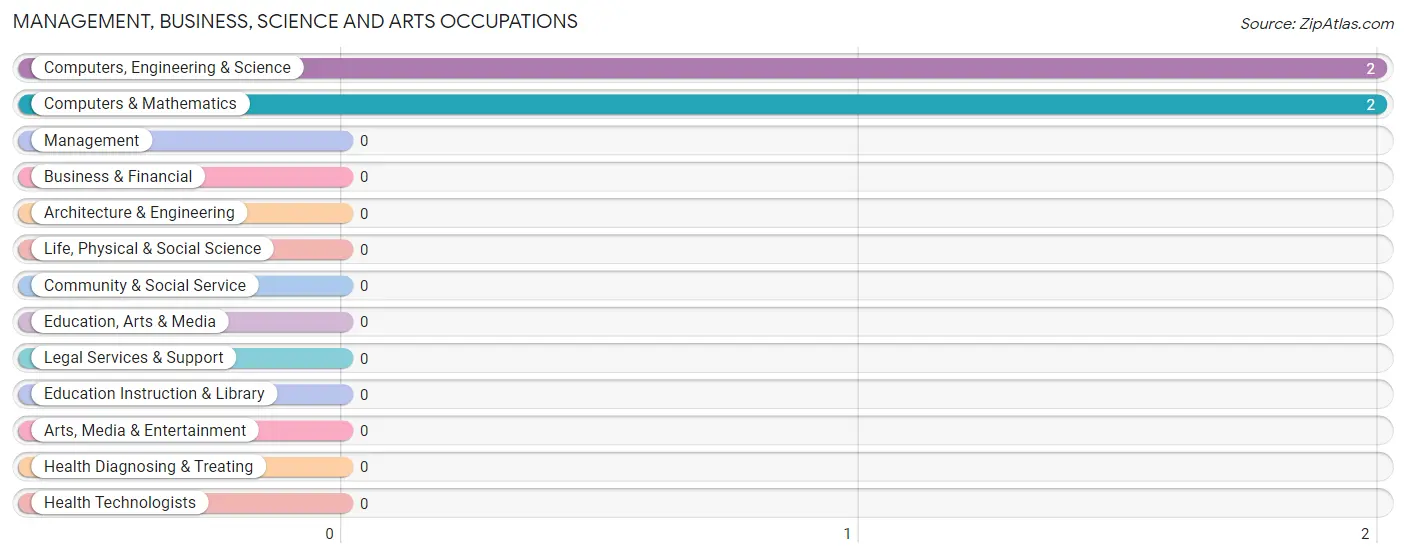
Management, Business, Science and Arts Occupations by Sex
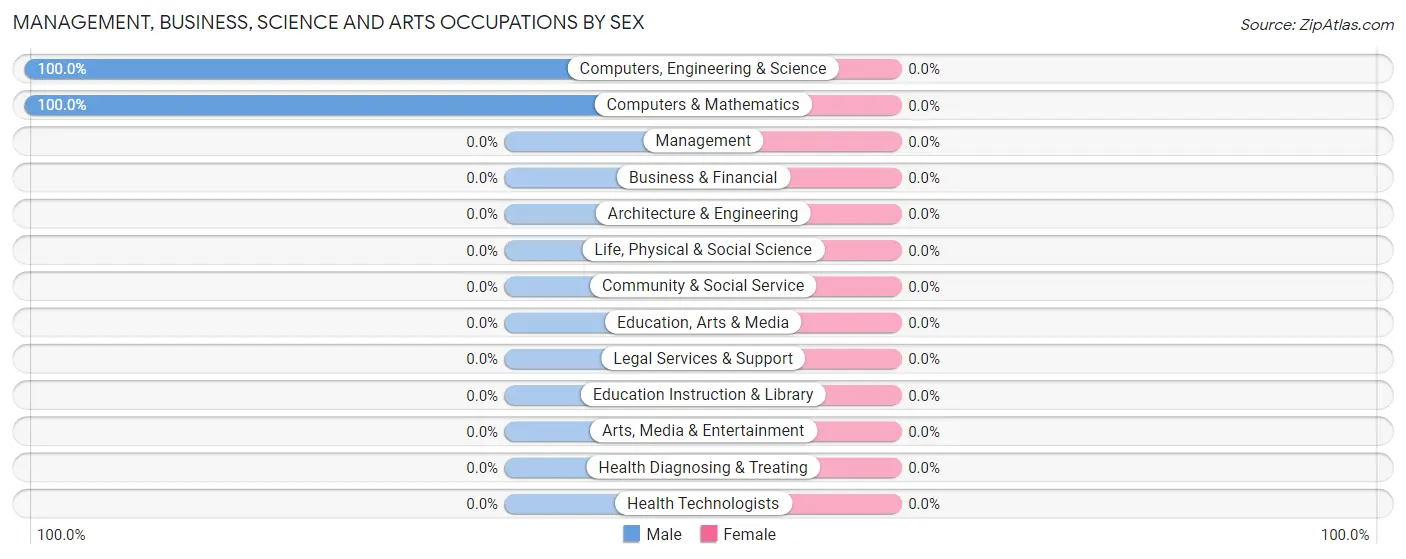
| Occupation | Male | Female |
| Management | 0 (0.0%) | 0 (0.0%) |
| Business & Financial | 0 (0.0%) | 0 (0.0%) |
| Computers, Engineering & Science | 2 (100.0%) | 0 (0.0%) |
| Computers & Mathematics | 2 (100.0%) | 0 (0.0%) |
| Architecture & Engineering | 0 (0.0%) | 0 (0.0%) |
| Life, Physical & Social Science | 0 (0.0%) | 0 (0.0%) |
| Community & Social Service | 0 (0.0%) | 0 (0.0%) |
| Education, Arts & Media | 0 (0.0%) | 0 (0.0%) |
| Legal Services & Support | 0 (0.0%) | 0 (0.0%) |
| Education Instruction & Library | 0 (0.0%) | 0 (0.0%) |
| Arts, Media & Entertainment | 0 (0.0%) | 0 (0.0%) |
| Health Diagnosing & Treating | 0 (0.0%) | 0 (0.0%) |
| Health Technologists | 0 (0.0%) | 0 (0.0%) |
| Total (Category) | 2 (100.0%) | 0 (0.0%) |
| Total (Overall) | 2 (50.0%) | 2 (50.0%) |
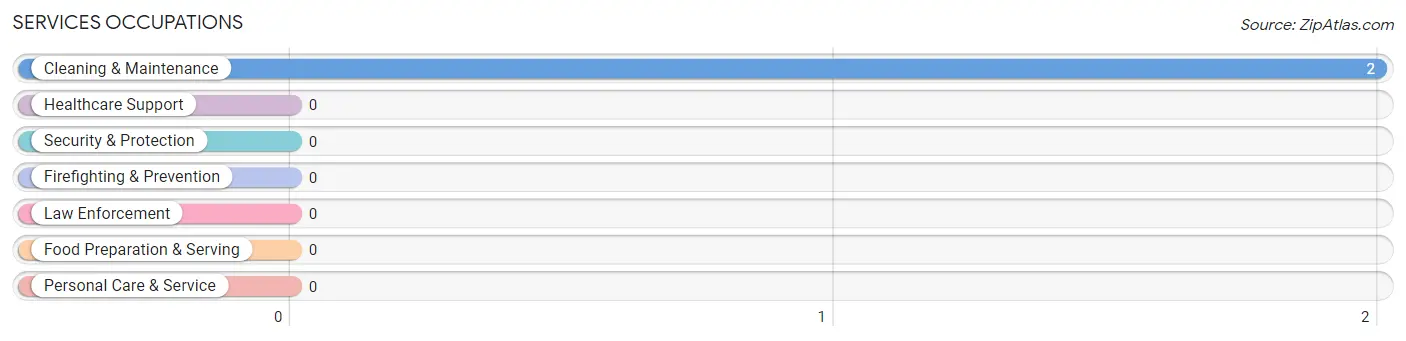
Services Occupations
The most common Services occupations in Clam Lake are , and Cleaning & Maintenance (2 | 50.0%).
Services Occupations by Sex
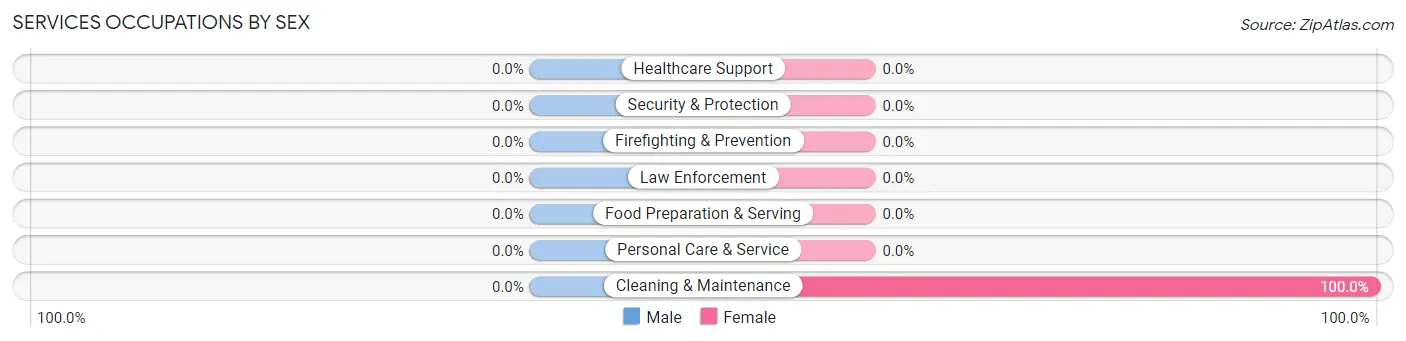
| Occupation | Male | Female |
| Healthcare Support | 0 (0.0%) | 0 (0.0%) |
| Security & Protection | 0 (0.0%) | 0 (0.0%) |
| Firefighting & Prevention | 0 (0.0%) | 0 (0.0%) |
| Law Enforcement | 0 (0.0%) | 0 (0.0%) |
| Food Preparation & Serving | 0 (0.0%) | 0 (0.0%) |
| Cleaning & Maintenance | 0 (0.0%) | 2 (100.0%) |
| Personal Care & Service | 0 (0.0%) | 0 (0.0%) |
| Total (Category) | 0 (0.0%) | 2 (100.0%) |
| Total (Overall) | 2 (50.0%) | 2 (50.0%) |
Sales and Office Occupations
Sales and Office Occupations by Sex
| Occupation | Male | Female |
| Sales & Related | 0 (0.0%) | 0 (0.0%) |
| Office & Administration | 0 (0.0%) | 0 (0.0%) |
| Total (Category) | 0 (0.0%) | 0 (0.0%) |
| Total (Overall) | 2 (50.0%) | 2 (50.0%) |
Natural Resources, Construction and Maintenance Occupations
Natural Resources, Construction and Maintenance Occupations by Sex
| Occupation | Male | Female |
| Farming, Fishing & Forestry | 0 (0.0%) | 0 (0.0%) |
| Construction & Extraction | 0 (0.0%) | 0 (0.0%) |
| Installation, Maintenance & Repair | 0 (0.0%) | 0 (0.0%) |
| Total (Category) | 0 (0.0%) | 0 (0.0%) |
| Total (Overall) | 2 (50.0%) | 2 (50.0%) |
Production, Transportation and Moving Occupations
Production, Transportation and Moving Occupations by Sex
| Occupation | Male | Female |
| Production | 0 (0.0%) | 0 (0.0%) |
| Transportation | 0 (0.0%) | 0 (0.0%) |
| Material Moving | 0 (0.0%) | 0 (0.0%) |
| Total (Category) | 0 (0.0%) | 0 (0.0%) |
| Total (Overall) | 2 (50.0%) | 2 (50.0%) |
Employment Industries by Sex in Clam Lake
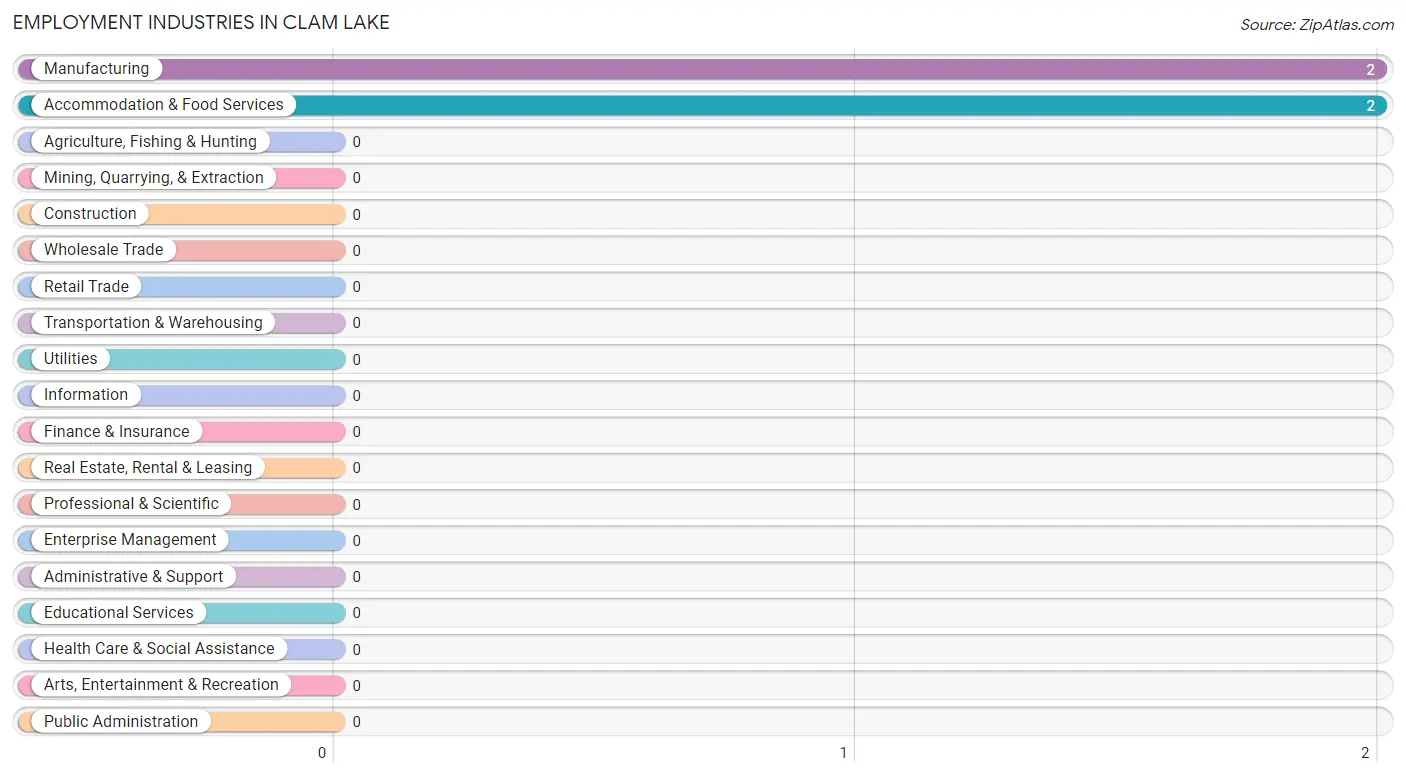
Employment Industries in Clam Lake
The major employment industries in Clam Lake include Manufacturing (2 | 50.0%), and Accommodation & Food Services (2 | 50.0%).
Employment Industries by Sex in Clam Lake
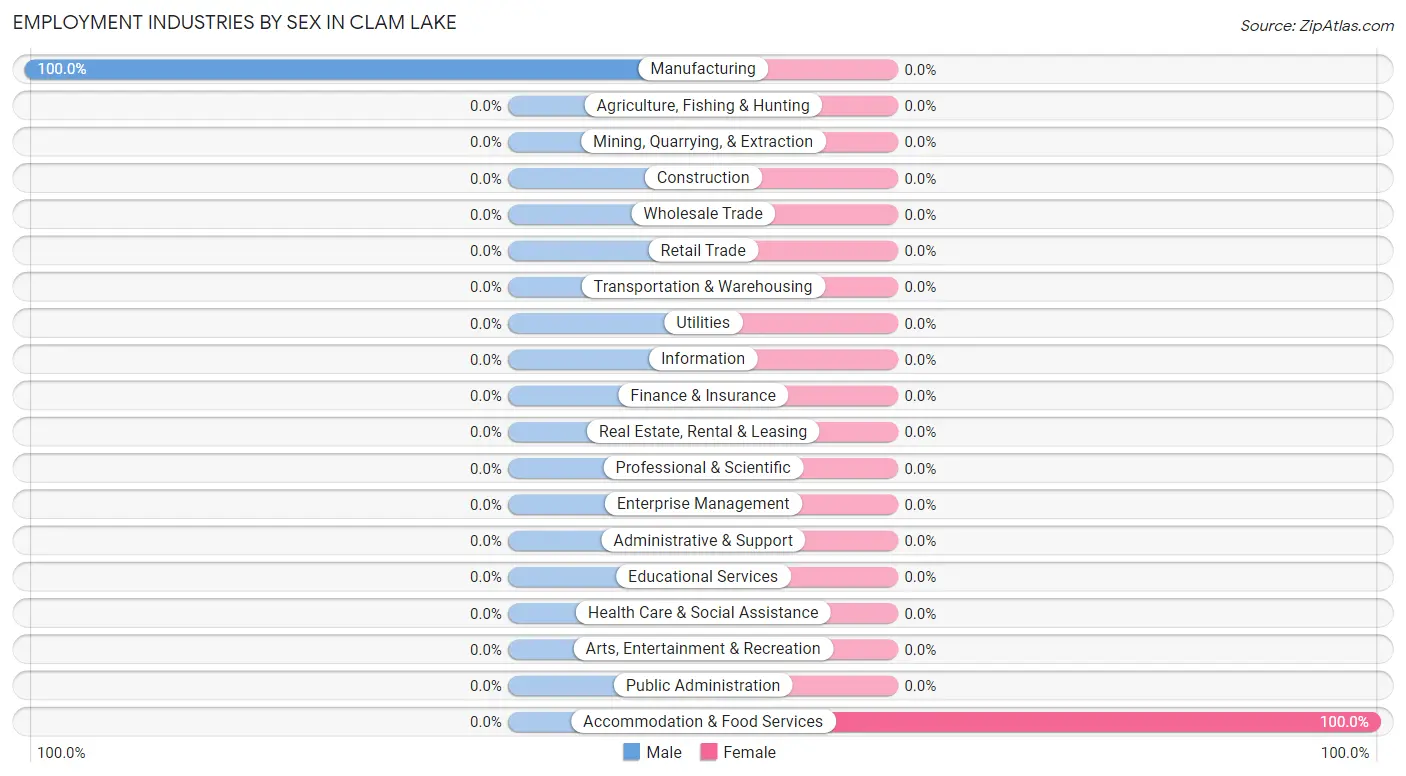
| Industry | Male | Female |
| Agriculture, Fishing & Hunting | 0 (0.0%) | 0 (0.0%) |
| Mining, Quarrying, & Extraction | 0 (0.0%) | 0 (0.0%) |
| Construction | 0 (0.0%) | 0 (0.0%) |
| Manufacturing | 2 (100.0%) | 0 (0.0%) |
| Wholesale Trade | 0 (0.0%) | 0 (0.0%) |
| Retail Trade | 0 (0.0%) | 0 (0.0%) |
| Transportation & Warehousing | 0 (0.0%) | 0 (0.0%) |
| Utilities | 0 (0.0%) | 0 (0.0%) |
| Information | 0 (0.0%) | 0 (0.0%) |
| Finance & Insurance | 0 (0.0%) | 0 (0.0%) |
| Real Estate, Rental & Leasing | 0 (0.0%) | 0 (0.0%) |
| Professional & Scientific | 0 (0.0%) | 0 (0.0%) |
| Enterprise Management | 0 (0.0%) | 0 (0.0%) |
| Administrative & Support | 0 (0.0%) | 0 (0.0%) |
| Educational Services | 0 (0.0%) | 0 (0.0%) |
| Health Care & Social Assistance | 0 (0.0%) | 0 (0.0%) |
| Arts, Entertainment & Recreation | 0 (0.0%) | 0 (0.0%) |
| Accommodation & Food Services | 0 (0.0%) | 2 (100.0%) |
| Public Administration | 0 (0.0%) | 0 (0.0%) |
| Total | 2 (50.0%) | 2 (50.0%) |
Education in Clam Lake
School Enrollment in Clam Lake
| School Level | # Students | % Students |
| Nursery / Preschool | 0 | 0.0% |
| Kindergarten | 0 | 0.0% |
| Elementary School | 0 | 0.0% |
| Middle School | 0 | 0.0% |
| High School | 0 | 0.0% |
| College / Undergraduate | 0 | 0.0% |
| Graduate / Professional | 0 | 0.0% |
| Total | 0 | 0.0% |
School Enrollment by Age by Funding Source in Clam Lake
| Age Bracket | Public School | Private School |
| 3 to 4 Year Olds | 0 (0.0%) | 0 (0.0%) |
| 5 to 9 Year Old | 0 (0.0%) | 0 (0.0%) |
| 10 to 14 Year Olds | 0 (0.0%) | 0 (0.0%) |
| 15 to 17 Year Olds | 0 (0.0%) | 0 (0.0%) |
| 18 to 19 Year Olds | 0 (0.0%) | 0 (0.0%) |
| 20 to 24 Year Olds | 0 (0.0%) | 0 (0.0%) |
| 25 to 34 Year Olds | 0 (0.0%) | 0 (0.0%) |
| 35 Years and over | 0 (0.0%) | 0 (0.0%) |
| Total | 0 (0.0%) | 0 (0.0%) |
Educational Attainment by Field of Study in Clam Lake
Physical & health sciences (5 | 62.5%), computers & mathematics (2 | 25.0%), and bio, nature & agricultural (1 | 12.5%) are the most common fields of study among 8 individuals in Clam Lake who have obtained a bachelor's degree or higher.
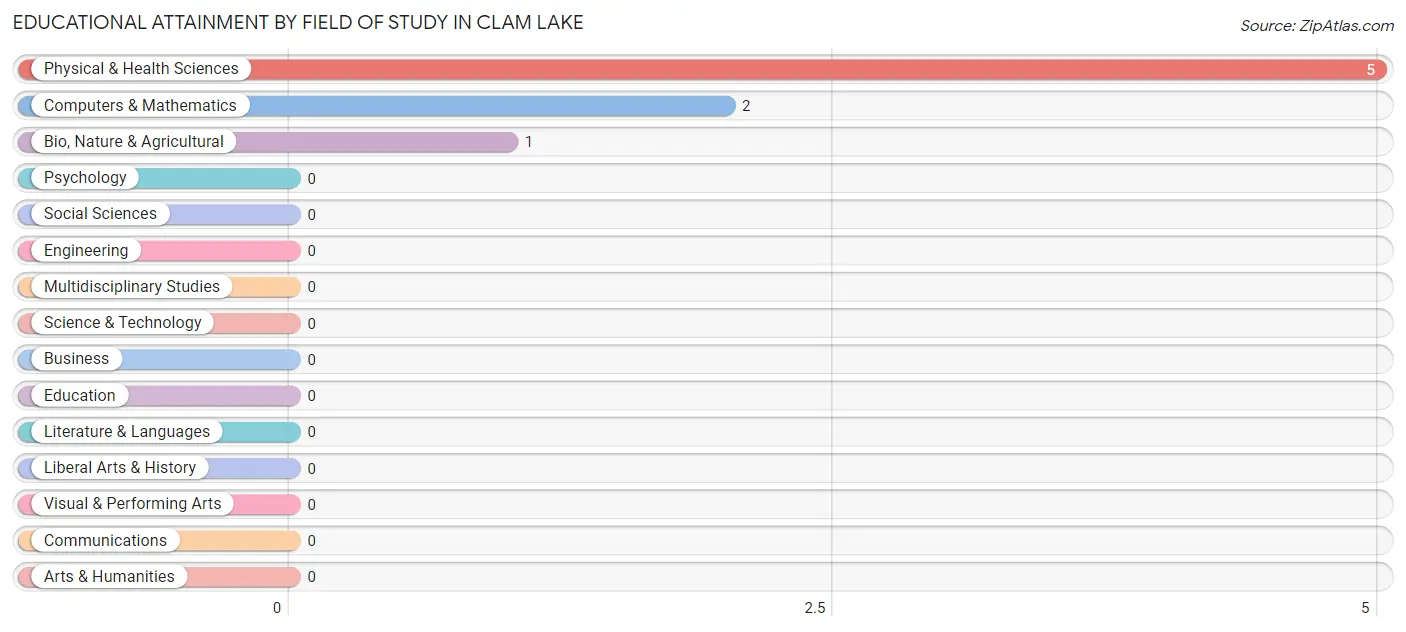
| Field of Study | # Graduates | % Graduates |
| Computers & Mathematics | 2 | 25.0% |
| Bio, Nature & Agricultural | 1 | 12.5% |
| Physical & Health Sciences | 5 | 62.5% |
| Psychology | 0 | 0.0% |
| Social Sciences | 0 | 0.0% |
| Engineering | 0 | 0.0% |
| Multidisciplinary Studies | 0 | 0.0% |
| Science & Technology | 0 | 0.0% |
| Business | 0 | 0.0% |
| Education | 0 | 0.0% |
| Literature & Languages | 0 | 0.0% |
| Liberal Arts & History | 0 | 0.0% |
| Visual & Performing Arts | 0 | 0.0% |
| Communications | 0 | 0.0% |
| Arts & Humanities | 0 | 0.0% |
| Total | 8 | 100.0% |
Transportation & Commute in Clam Lake
Vehicle Availability by Sex in Clam Lake
The most prevalent vehicle ownership categories in Clam Lake are males with 1 vehicle (2, accounting for 100.0%) and females with 1 vehicle (0, making up 100.0%).
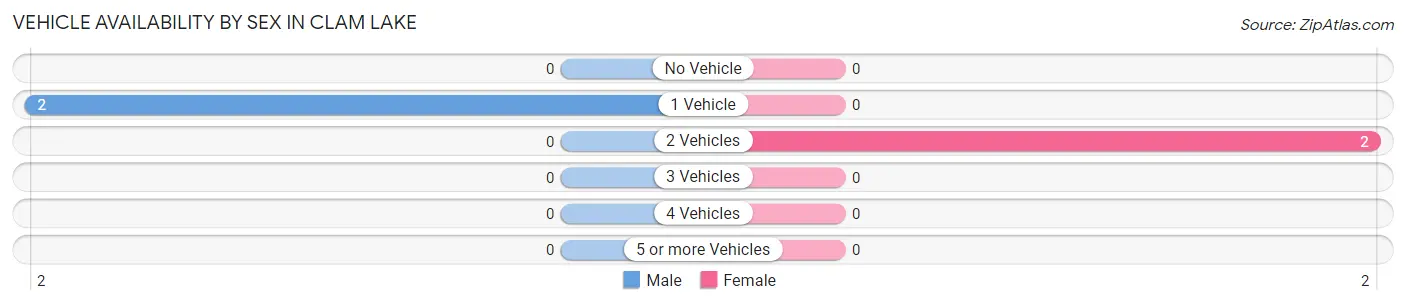
| Vehicles Available | Male | Female |
| No Vehicle | 0 (0.0%) | 0 (0.0%) |
| 1 Vehicle | 2 (100.0%) | 0 (0.0%) |
| 2 Vehicles | 0 (0.0%) | 2 (100.0%) |
| 3 Vehicles | 0 (0.0%) | 0 (0.0%) |
| 4 Vehicles | 0 (0.0%) | 0 (0.0%) |
| 5 or more Vehicles | 0 (0.0%) | 0 (0.0%) |
| Total | 2 (100.0%) | 2 (100.0%) |
Commute Time in Clam Lake
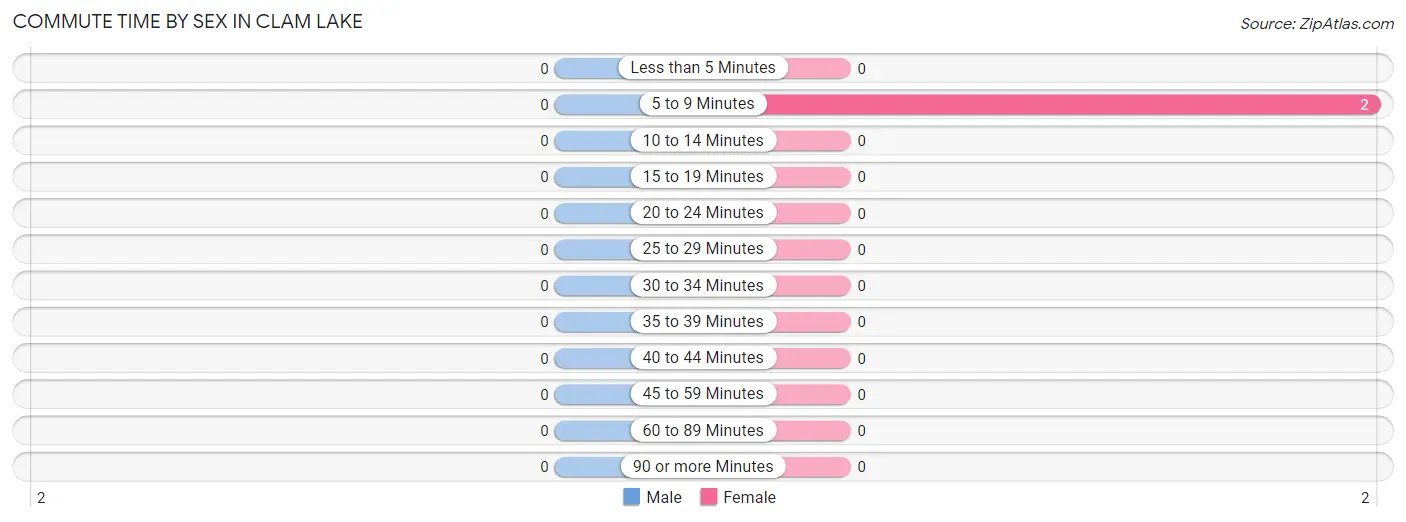
The most frequently occuring commute durations in Clam Lake are 5 to 9 minutes (2 commuters, 100.0%), less than 5 minutes (0 commuters, 0.0%), and 10 to 14 minutes (0 commuters, 0.0%).
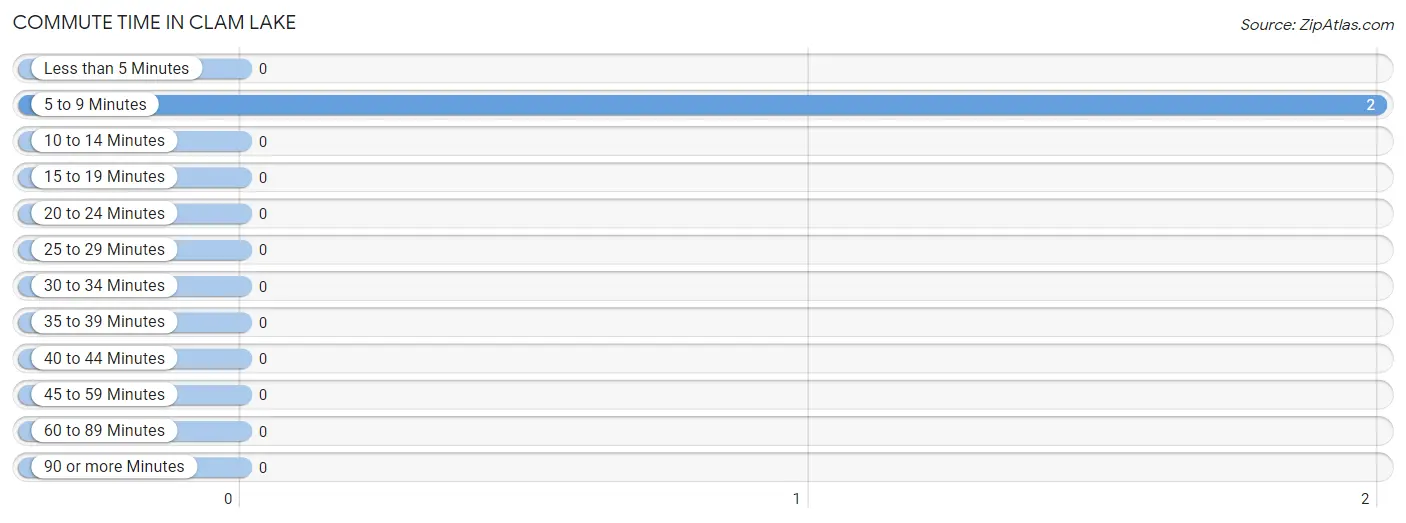
| Commute Time | # Commuters | % Commuters |
| Less than 5 Minutes | 0 | 0.0% |
| 5 to 9 Minutes | 2 | 100.0% |
| 10 to 14 Minutes | 0 | 0.0% |
| 15 to 19 Minutes | 0 | 0.0% |
| 20 to 24 Minutes | 0 | 0.0% |
| 25 to 29 Minutes | 0 | 0.0% |
| 30 to 34 Minutes | 0 | 0.0% |
| 35 to 39 Minutes | 0 | 0.0% |
| 40 to 44 Minutes | 0 | 0.0% |
| 45 to 59 Minutes | 0 | 0.0% |
| 60 to 89 Minutes | 0 | 0.0% |
| 90 or more Minutes | 0 | 0.0% |
Commute Time by Sex in Clam Lake
| Commute Time | Male | Female |
| Less than 5 Minutes | 0 (0.0%) | 0 (0.0%) |
| 5 to 9 Minutes | 0 (0.0%) | 2 (100.0%) |
| 10 to 14 Minutes | 0 (0.0%) | 0 (0.0%) |
| 15 to 19 Minutes | 0 (0.0%) | 0 (0.0%) |
| 20 to 24 Minutes | 0 (0.0%) | 0 (0.0%) |
| 25 to 29 Minutes | 0 (0.0%) | 0 (0.0%) |
| 30 to 34 Minutes | 0 (0.0%) | 0 (0.0%) |
| 35 to 39 Minutes | 0 (0.0%) | 0 (0.0%) |
| 40 to 44 Minutes | 0 (0.0%) | 0 (0.0%) |
| 45 to 59 Minutes | 0 (0.0%) | 0 (0.0%) |
| 60 to 89 Minutes | 0 (0.0%) | 0 (0.0%) |
| 90 or more Minutes | 0 (0.0%) | 0 (0.0%) |
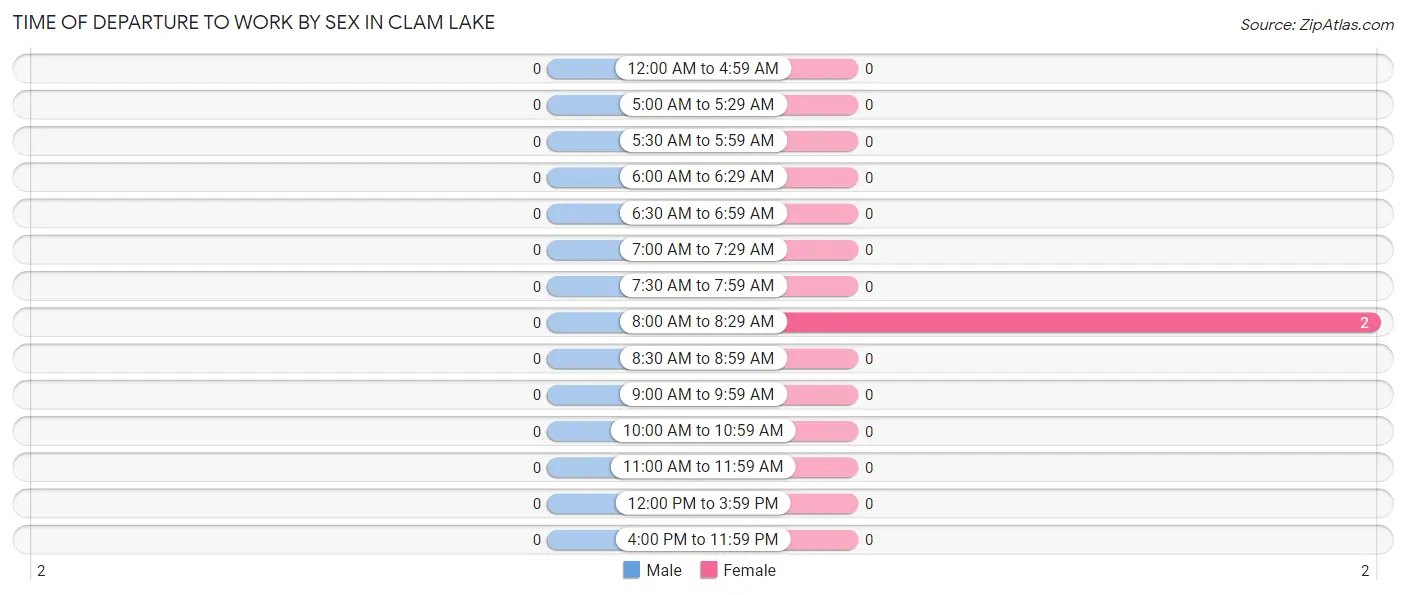
Time of Departure to Work by Sex in Clam Lake
| Time of Departure | Male | Female |
| 12:00 AM to 4:59 AM | 0 (0.0%) | 0 (0.0%) |
| 5:00 AM to 5:29 AM | 0 (0.0%) | 0 (0.0%) |
| 5:30 AM to 5:59 AM | 0 (0.0%) | 0 (0.0%) |
| 6:00 AM to 6:29 AM | 0 (0.0%) | 0 (0.0%) |
| 6:30 AM to 6:59 AM | 0 (0.0%) | 0 (0.0%) |
| 7:00 AM to 7:29 AM | 0 (0.0%) | 0 (0.0%) |
| 7:30 AM to 7:59 AM | 0 (0.0%) | 0 (0.0%) |
| 8:00 AM to 8:29 AM | 0 (0.0%) | 2 (100.0%) |
| 8:30 AM to 8:59 AM | 0 (0.0%) | 0 (0.0%) |
| 9:00 AM to 9:59 AM | 0 (0.0%) | 0 (0.0%) |
| 10:00 AM to 10:59 AM | 0 (0.0%) | 0 (0.0%) |
| 11:00 AM to 11:59 AM | 0 (0.0%) | 0 (0.0%) |
| 12:00 PM to 3:59 PM | 0 (0.0%) | 0 (0.0%) |
| 4:00 PM to 11:59 PM | 0 (0.0%) | 0 (0.0%) |
| Total | 0 (0.0%) | 2 (100.0%) |
Housing Occupancy in Clam Lake
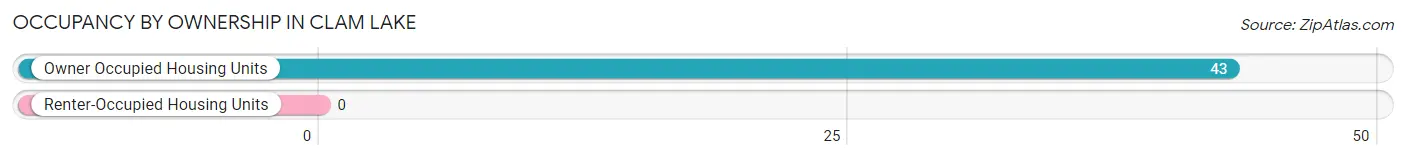
Occupancy by Ownership in Clam Lake
Of the total 43 dwellings in Clam Lake, owner-occupied units account for 43 (100.0%), while renter-occupied units make up 0 (0.0%).
| Occupancy | # Housing Units | % Housing Units |
| Owner Occupied Housing Units | 43 | 100.0% |
| Renter-Occupied Housing Units | 0 | 0.0% |
| Total Occupied Housing Units | 43 | 100.0% |
Occupancy by Household Size in Clam Lake
| Household Size | # Housing Units | % Housing Units |
| 1-Person Household | 1 | 2.3% |
| 2-Person Household | 42 | 97.7% |
| 3-Person Household | 0 | 0.0% |
| 4+ Person Household | 0 | 0.0% |
| Total Housing Units | 43 | 100.0% |
Occupancy by Ownership by Household Size in Clam Lake
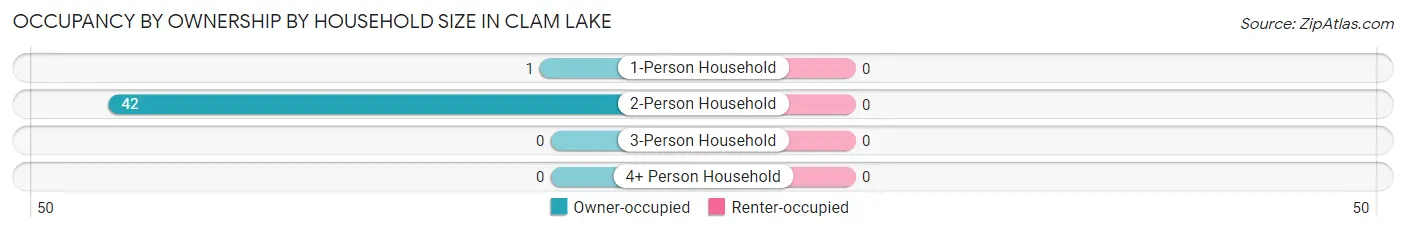
| Household Size | Owner-occupied | Renter-occupied |
| 1-Person Household | 1 (100.0%) | 0 (0.0%) |
| 2-Person Household | 42 (100.0%) | 0 (0.0%) |
| 3-Person Household | 0 (0.0%) | 0 (0.0%) |
| 4+ Person Household | 0 (0.0%) | 0 (0.0%) |
| Total Housing Units | 43 (100.0%) | 0 (0.0%) |
Occupancy by Educational Attainment in Clam Lake
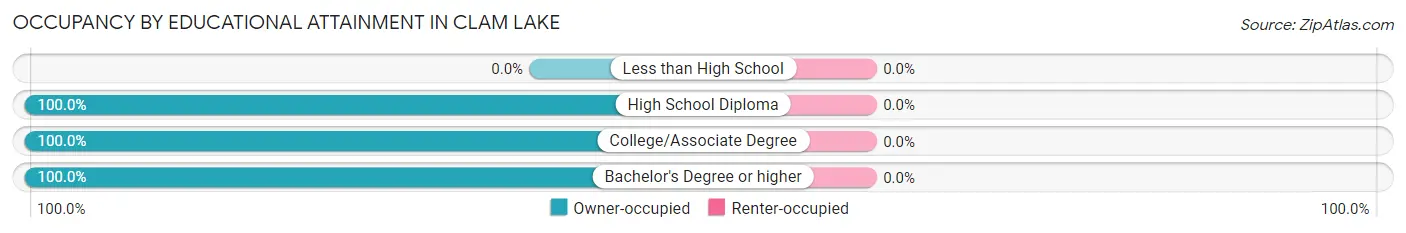
| Household Size | Owner-occupied | Renter-occupied |
| Less than High School | 0 (0.0%) | 0 (0.0%) |
| High School Diploma | 3 (100.0%) | 0 (0.0%) |
| College/Associate Degree | 35 (100.0%) | 0 (0.0%) |
| Bachelor's Degree or higher | 5 (100.0%) | 0 (0.0%) |
Occupancy by Age of Householder in Clam Lake
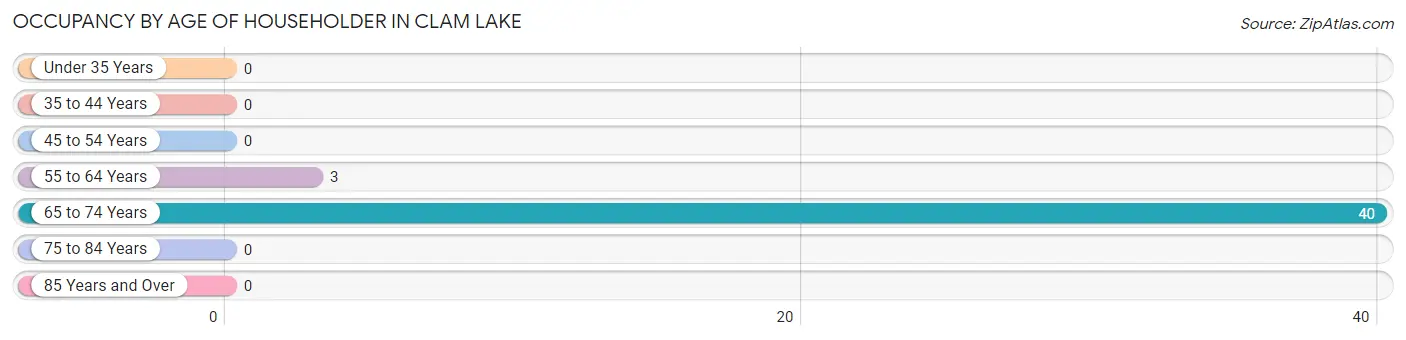
| Age Bracket | # Households | % Households |
| Under 35 Years | 0 | 0.0% |
| 35 to 44 Years | 0 | 0.0% |
| 45 to 54 Years | 0 | 0.0% |
| 55 to 64 Years | 3 | 7.0% |
| 65 to 74 Years | 40 | 93.0% |
| 75 to 84 Years | 0 | 0.0% |
| 85 Years and Over | 0 | 0.0% |
| Total | 43 | 100.0% |
Housing Finances in Clam Lake
Median Income by Occupancy in Clam Lake
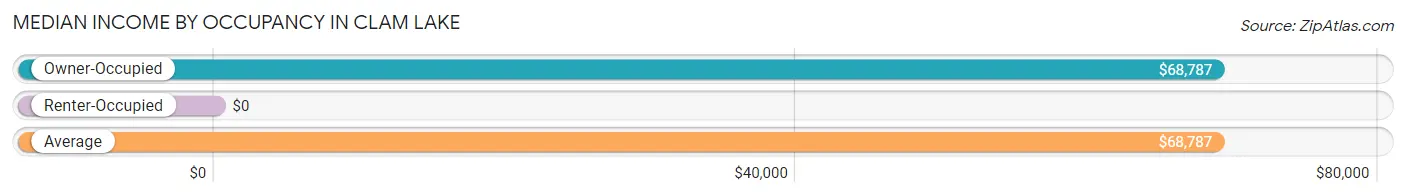
| Occupancy Type | # Households | Median Income |
| Owner-Occupied | 43 (100.0%) | $68,787 |
| Renter-Occupied | 0 (0.0%) | $0 |
| Average | 43 (100.0%) | $68,787 |
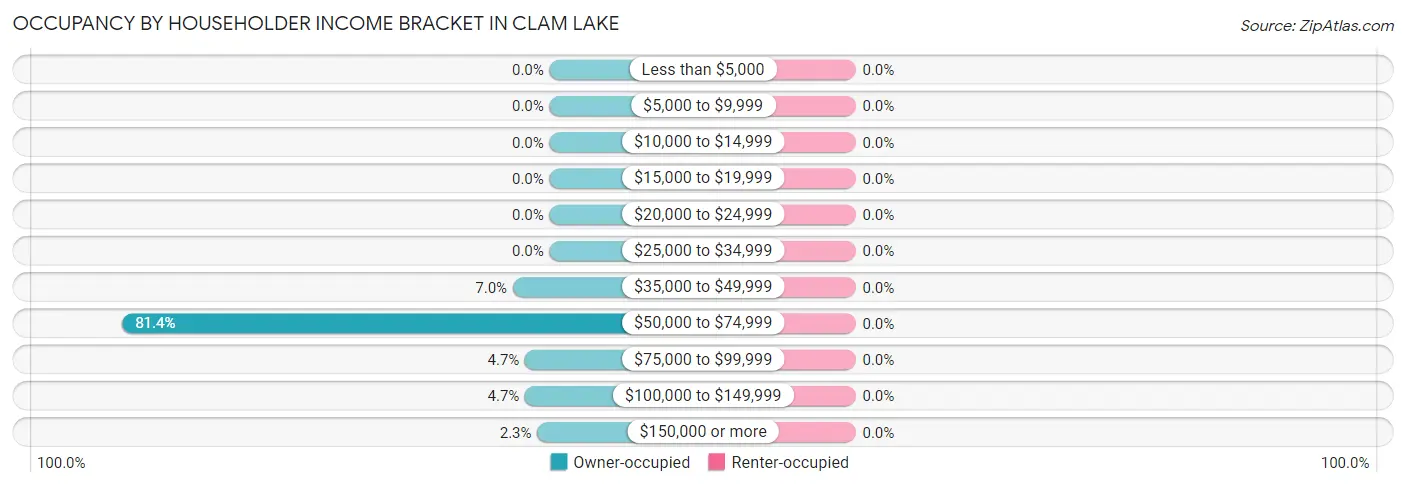
Occupancy by Householder Income Bracket in Clam Lake
| Income Bracket | Owner-occupied | Renter-occupied |
| Less than $5,000 | 0 (0.0%) | 0 (0.0%) |
| $5,000 to $9,999 | 0 (0.0%) | 0 (0.0%) |
| $10,000 to $14,999 | 0 (0.0%) | 0 (0.0%) |
| $15,000 to $19,999 | 0 (0.0%) | 0 (0.0%) |
| $20,000 to $24,999 | 0 (0.0%) | 0 (0.0%) |
| $25,000 to $34,999 | 0 (0.0%) | 0 (0.0%) |
| $35,000 to $49,999 | 3 (7.0%) | 0 (0.0%) |
| $50,000 to $74,999 | 35 (81.4%) | 0 (0.0%) |
| $75,000 to $99,999 | 2 (4.6%) | 0 (0.0%) |
| $100,000 to $149,999 | 2 (4.6%) | 0 (0.0%) |
| $150,000 or more | 1 (2.3%) | 0 (0.0%) |
| Total | 43 (100.0%) | 0 (0.0%) |
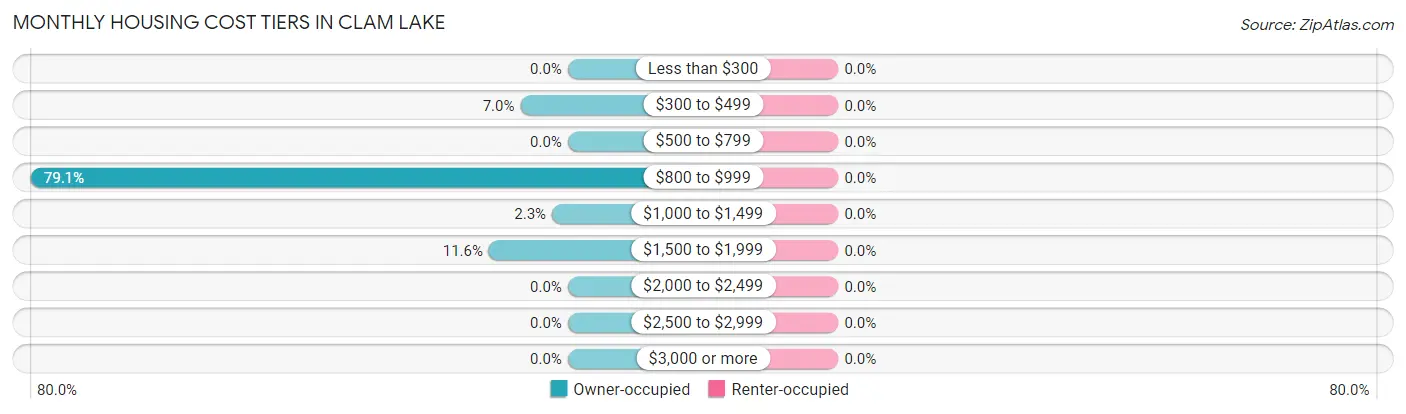
Monthly Housing Cost Tiers in Clam Lake
| Monthly Cost | Owner-occupied | Renter-occupied |
| Less than $300 | 0 (0.0%) | 0 (0.0%) |
| $300 to $499 | 3 (7.0%) | 0 (0.0%) |
| $500 to $799 | 0 (0.0%) | 0 (0.0%) |
| $800 to $999 | 34 (79.1%) | 0 (0.0%) |
| $1,000 to $1,499 | 1 (2.3%) | 0 (0.0%) |
| $1,500 to $1,999 | 5 (11.6%) | 0 (0.0%) |
| $2,000 to $2,499 | 0 (0.0%) | 0 (0.0%) |
| $2,500 to $2,999 | 0 (0.0%) | 0 (0.0%) |
| $3,000 or more | 0 (0.0%) | 0 (0.0%) |
| Total | 43 (100.0%) | 0 (0.0%) |
Physical Housing Characteristics in Clam Lake
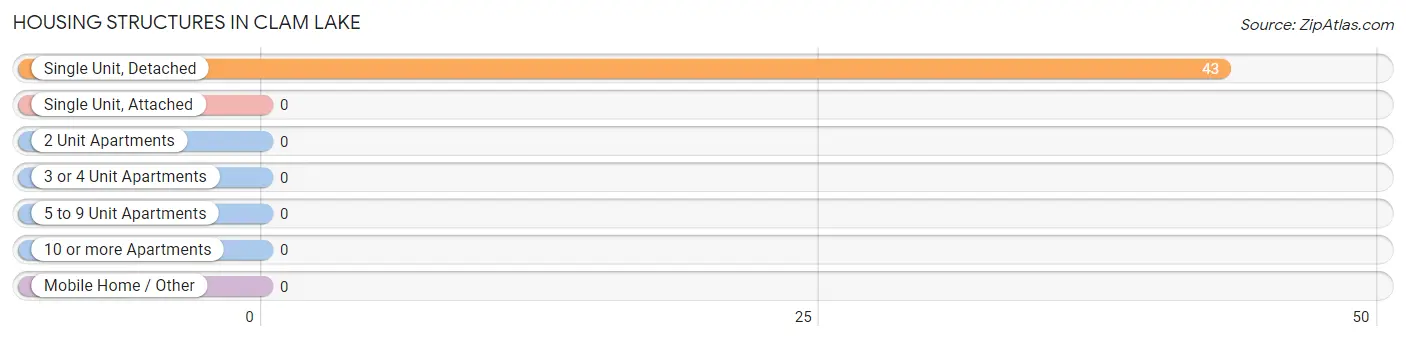
Housing Structures in Clam Lake
| Structure Type | # Housing Units | % Housing Units |
| Single Unit, Detached | 43 | 100.0% |
| Single Unit, Attached | 0 | 0.0% |
| 2 Unit Apartments | 0 | 0.0% |
| 3 or 4 Unit Apartments | 0 | 0.0% |
| 5 to 9 Unit Apartments | 0 | 0.0% |
| 10 or more Apartments | 0 | 0.0% |
| Mobile Home / Other | 0 | 0.0% |
| Total | 43 | 100.0% |
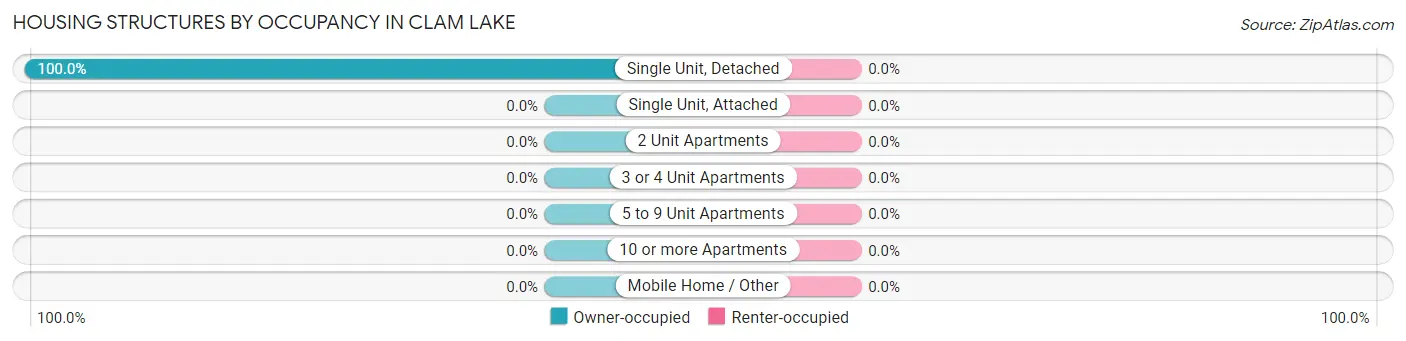
Housing Structures by Occupancy in Clam Lake
| Structure Type | Owner-occupied | Renter-occupied |
| Single Unit, Detached | 43 (100.0%) | 0 (0.0%) |
| Single Unit, Attached | 0 (0.0%) | 0 (0.0%) |
| 2 Unit Apartments | 0 (0.0%) | 0 (0.0%) |
| 3 or 4 Unit Apartments | 0 (0.0%) | 0 (0.0%) |
| 5 to 9 Unit Apartments | 0 (0.0%) | 0 (0.0%) |
| 10 or more Apartments | 0 (0.0%) | 0 (0.0%) |
| Mobile Home / Other | 0 (0.0%) | 0 (0.0%) |
| Total | 43 (100.0%) | 0 (0.0%) |
Housing Structures by Number of Rooms in Clam Lake
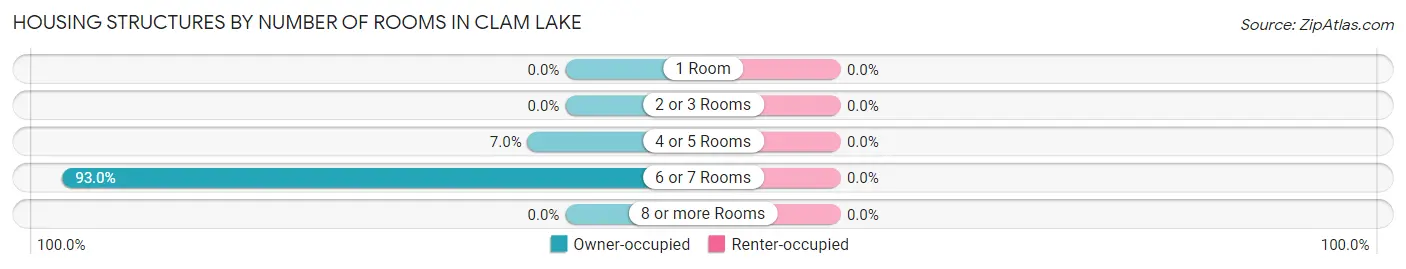
| Number of Rooms | Owner-occupied | Renter-occupied |
| 1 Room | 0 (0.0%) | 0 (0.0%) |
| 2 or 3 Rooms | 0 (0.0%) | 0 (0.0%) |
| 4 or 5 Rooms | 3 (7.0%) | 0 (0.0%) |
| 6 or 7 Rooms | 40 (93.0%) | 0 (0.0%) |
| 8 or more Rooms | 0 (0.0%) | 0 (0.0%) |
| Total | 43 (100.0%) | 0 (0.0%) |
Housing Structure by Heating Type in Clam Lake
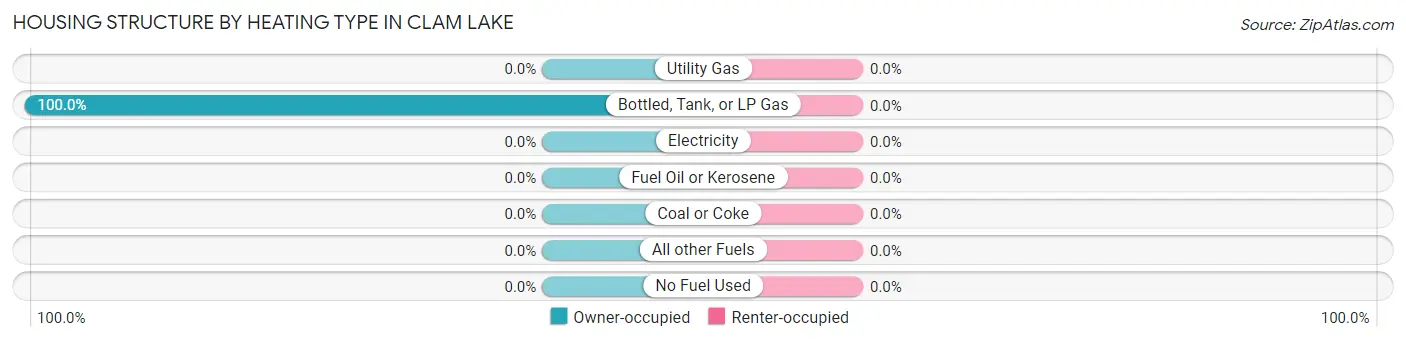
| Heating Type | Owner-occupied | Renter-occupied |
| Utility Gas | 0 (0.0%) | 0 (0.0%) |
| Bottled, Tank, or LP Gas | 43 (100.0%) | 0 (0.0%) |
| Electricity | 0 (0.0%) | 0 (0.0%) |
| Fuel Oil or Kerosene | 0 (0.0%) | 0 (0.0%) |
| Coal or Coke | 0 (0.0%) | 0 (0.0%) |
| All other Fuels | 0 (0.0%) | 0 (0.0%) |
| No Fuel Used | 0 (0.0%) | 0 (0.0%) |
| Total | 43 (100.0%) | 0 (0.0%) |
Household Vehicle Usage in Clam Lake
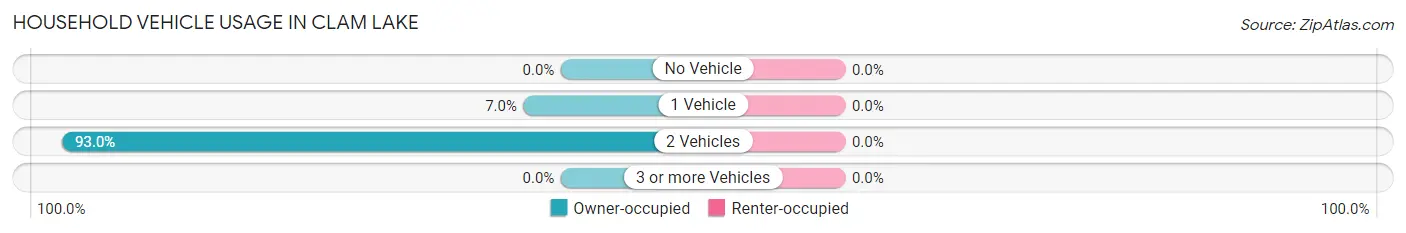
| Vehicles per Household | Owner-occupied | Renter-occupied |
| No Vehicle | 0 (0.0%) | 0 (0.0%) |
| 1 Vehicle | 3 (7.0%) | 0 (0.0%) |
| 2 Vehicles | 40 (93.0%) | 0 (0.0%) |
| 3 or more Vehicles | 0 (0.0%) | 0 (0.0%) |
| Total | 43 (100.0%) | 0 (0.0%) |
Real Estate & Mortgages in Clam Lake
Real Estate and Mortgage Overview in Clam Lake
| Characteristic | Without Mortgage | With Mortgage |
| Housing Units | 38 | 5 |
| Median Property Value | $344,100 | $350,000 |
| Median Household Income | $68,824 | $0 |
| Monthly Housing Costs | $847 | $0 |
| Real Estate Taxes | $4,471 | $0 |
Property Value by Mortgage Status in Clam Lake
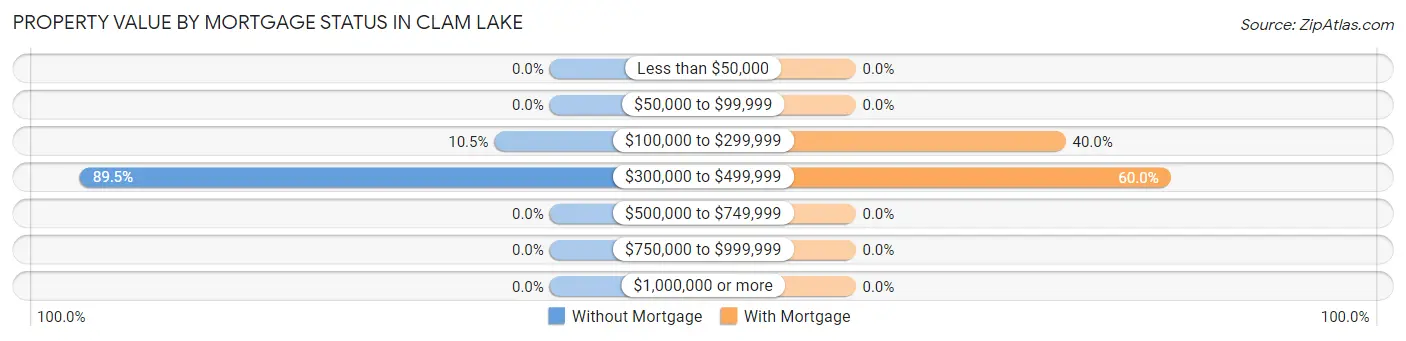
| Property Value | Without Mortgage | With Mortgage |
| Less than $50,000 | 0 (0.0%) | 0 (0.0%) |
| $50,000 to $99,999 | 0 (0.0%) | 0 (0.0%) |
| $100,000 to $299,999 | 4 (10.5%) | 2 (40.0%) |
| $300,000 to $499,999 | 34 (89.5%) | 3 (60.0%) |
| $500,000 to $749,999 | 0 (0.0%) | 0 (0.0%) |
| $750,000 to $999,999 | 0 (0.0%) | 0 (0.0%) |
| $1,000,000 or more | 0 (0.0%) | 0 (0.0%) |
| Total | 38 (100.0%) | 5 (100.0%) |
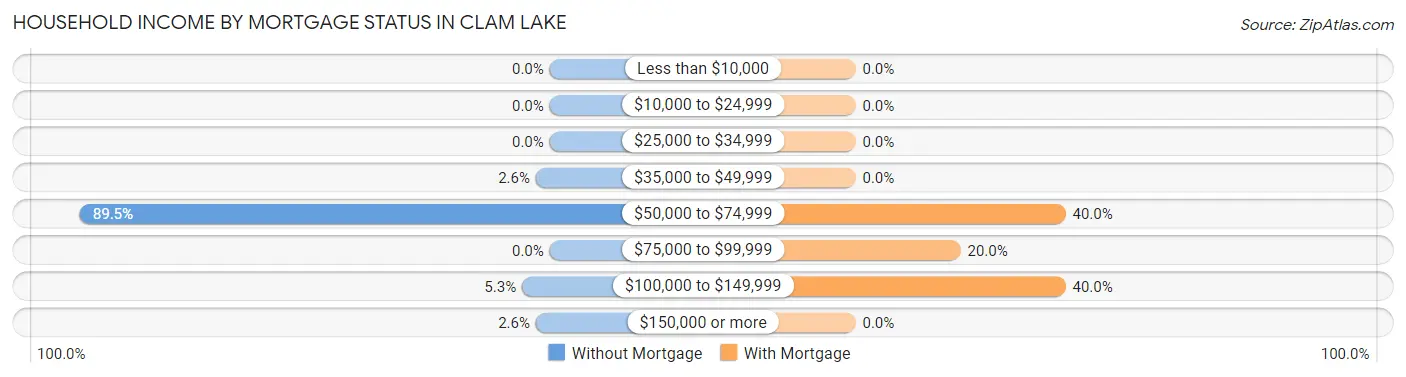
Household Income by Mortgage Status in Clam Lake
| Household Income | Without Mortgage | With Mortgage |
| Less than $10,000 | 0 (0.0%) | 0 (0.0%) |
| $10,000 to $24,999 | 0 (0.0%) | 0 (0.0%) |
| $25,000 to $34,999 | 0 (0.0%) | 0 (0.0%) |
| $35,000 to $49,999 | 1 (2.6%) | 0 (0.0%) |
| $50,000 to $74,999 | 34 (89.5%) | 2 (40.0%) |
| $75,000 to $99,999 | 0 (0.0%) | 1 (20.0%) |
| $100,000 to $149,999 | 2 (5.3%) | 2 (40.0%) |
| $150,000 or more | 1 (2.6%) | 0 (0.0%) |
| Total | 38 (100.0%) | 5 (100.0%) |
Property Value to Household Income Ratio in Clam Lake
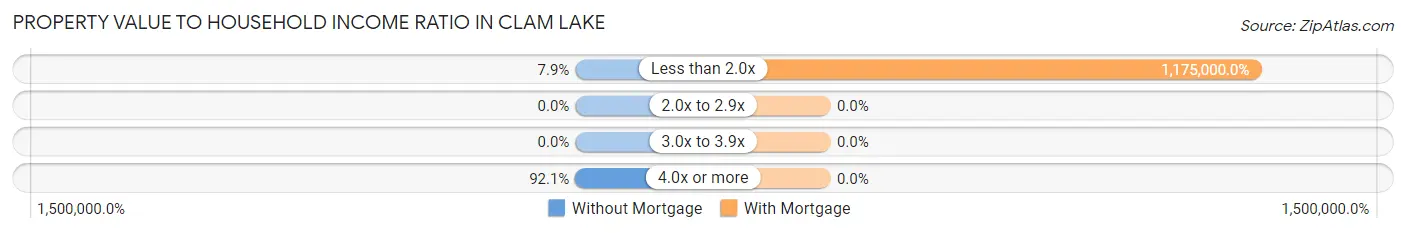
| Value-to-Income Ratio | Without Mortgage | With Mortgage |
| Less than 2.0x | 3 (7.9%) | 58,750 (1,175,000.0%) |
| 2.0x to 2.9x | 0 (0.0%) | 0 (0.0%) |
| 3.0x to 3.9x | 0 (0.0%) | 0 (0.0%) |
| 4.0x or more | 35 (92.1%) | 0 (0.0%) |
| Total | 38 (100.0%) | 5 (100.0%) |
Real Estate Taxes by Mortgage Status in Clam Lake
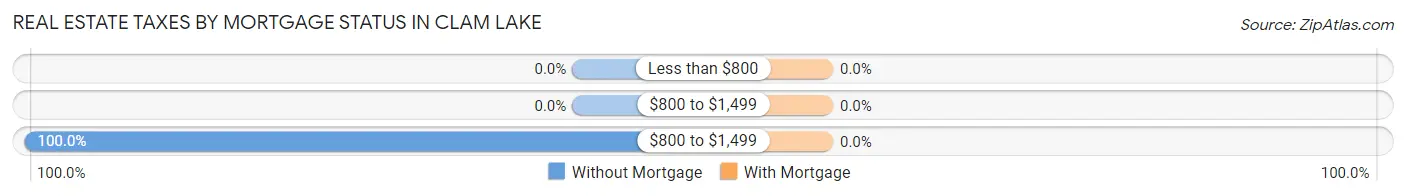
| Property Taxes | Without Mortgage | With Mortgage |
| Less than $800 | 0 (0.0%) | 0 (0.0%) |
| $800 to $1,499 | 0 (0.0%) | 0 (0.0%) |
| $800 to $1,499 | 38 (100.0%) | 0 (0.0%) |
| Total | 38 (100.0%) | 5 (100.0%) |
Health & Disability in Clam Lake
Health Insurance Coverage by Age in Clam Lake
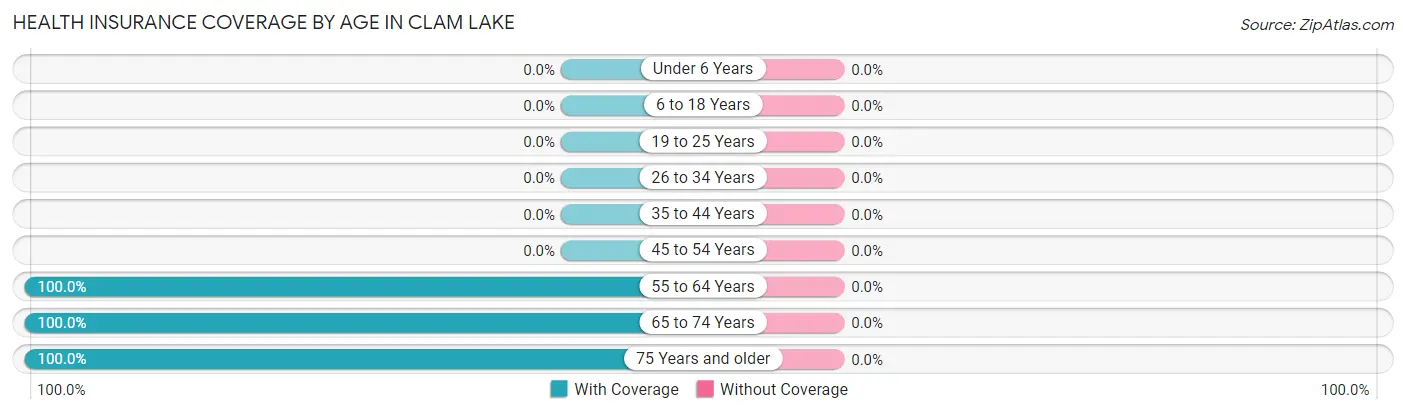
| Age Bracket | With Coverage | Without Coverage |
| Under 6 Years | 0 (0.0%) | 0 (0.0%) |
| 6 to 18 Years | 0 (0.0%) | 0 (0.0%) |
| 19 to 25 Years | 0 (0.0%) | 0 (0.0%) |
| 26 to 34 Years | 0 (0.0%) | 0 (0.0%) |
| 35 to 44 Years | 0 (0.0%) | 0 (0.0%) |
| 45 to 54 Years | 0 (0.0%) | 0 (0.0%) |
| 55 to 64 Years | 4 (100.0%) | 0 (0.0%) |
| 65 to 74 Years | 43 (100.0%) | 0 (0.0%) |
| 75 Years and older | 2 (100.0%) | 0 (0.0%) |
| Total | 49 (100.0%) | 0 (0.0%) |
Health Insurance Coverage by Citizenship Status in Clam Lake
| Citizenship Status | With Coverage | Without Coverage |
| Native Born | 0 (0.0%) | 0 (0.0%) |
| Foreign Born, Citizen | 0 (0.0%) | 0 (0.0%) |
| Foreign Born, not a Citizen | 0 (0.0%) | 0 (0.0%) |
Health Insurance Coverage by Household Income in Clam Lake
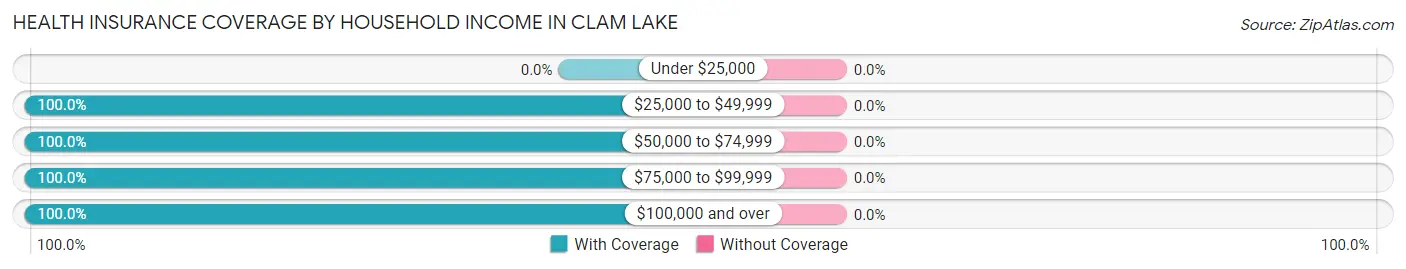
| Household Income | With Coverage | Without Coverage |
| Under $25,000 | 0 (0.0%) | 0 (0.0%) |
| $25,000 to $49,999 | 4 (100.0%) | 0 (0.0%) |
| $50,000 to $74,999 | 37 (100.0%) | 0 (0.0%) |
| $75,000 to $99,999 | 3 (100.0%) | 0 (0.0%) |
| $100,000 and over | 5 (100.0%) | 0 (0.0%) |
Public vs Private Health Insurance Coverage by Age in Clam Lake
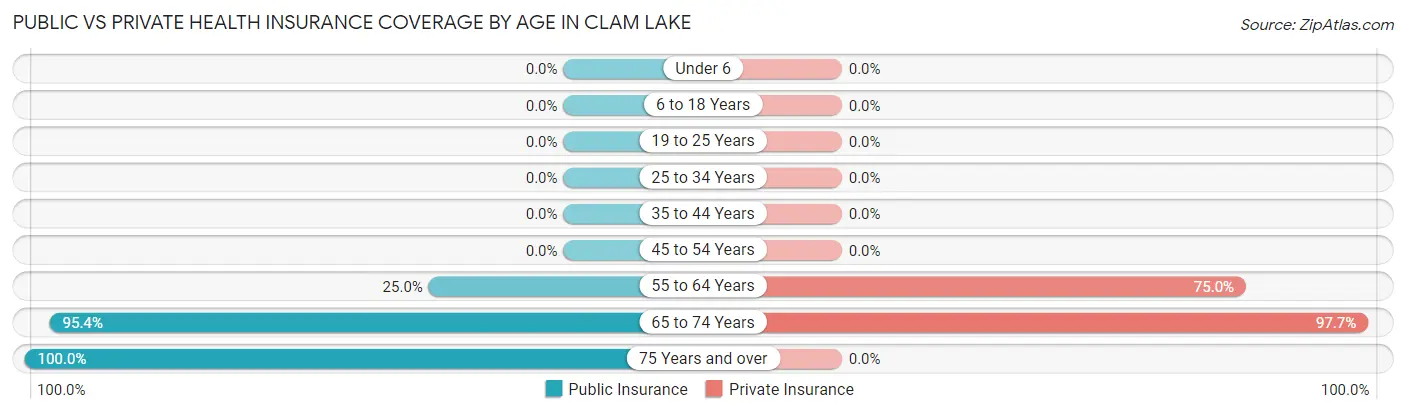
| Age Bracket | Public Insurance | Private Insurance |
| Under 6 | 0 (0.0%) | 0 (0.0%) |
| 6 to 18 Years | 0 (0.0%) | 0 (0.0%) |
| 19 to 25 Years | 0 (0.0%) | 0 (0.0%) |
| 25 to 34 Years | 0 (0.0%) | 0 (0.0%) |
| 35 to 44 Years | 0 (0.0%) | 0 (0.0%) |
| 45 to 54 Years | 0 (0.0%) | 0 (0.0%) |
| 55 to 64 Years | 1 (25.0%) | 3 (75.0%) |
| 65 to 74 Years | 41 (95.4%) | 42 (97.7%) |
| 75 Years and over | 2 (100.0%) | 0 (0.0%) |
| Total | 44 (89.8%) | 45 (91.8%) |
Disability Status by Sex by Age in Clam Lake
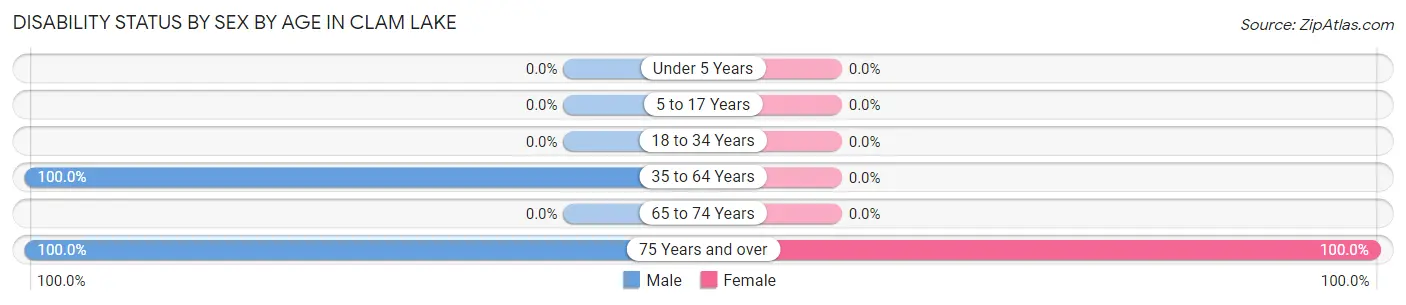
| Age Bracket | Male | Female |
| Under 5 Years | 0 (0.0%) | 0 (0.0%) |
| 5 to 17 Years | 0 (0.0%) | 0 (0.0%) |
| 18 to 34 Years | 0 (0.0%) | 0 (0.0%) |
| 35 to 64 Years | 1 (100.0%) | 0 (0.0%) |
| 65 to 74 Years | 0 (0.0%) | 0 (0.0%) |
| 75 Years and over | 1 (100.0%) | 1 (100.0%) |
Disability Class by Sex by Age in Clam Lake
Disability Class: Hearing Difficulty
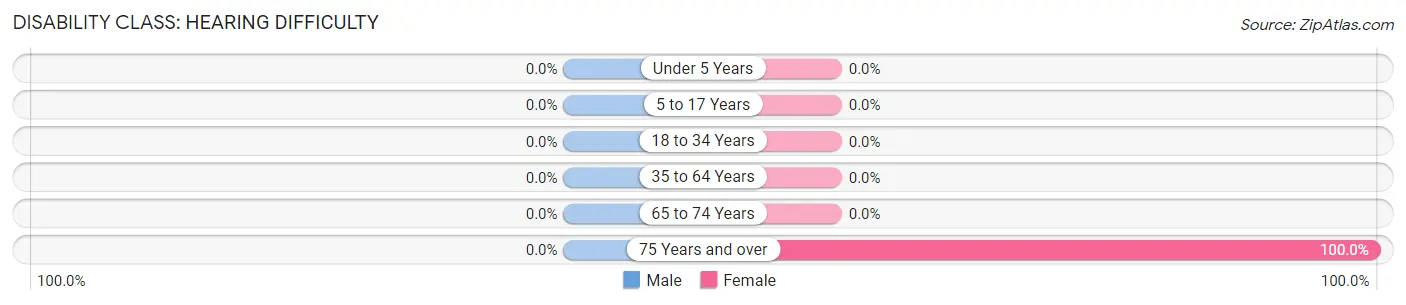
| Age Bracket | Male | Female |
| Under 5 Years | 0 (0.0%) | 0 (0.0%) |
| 5 to 17 Years | 0 (0.0%) | 0 (0.0%) |
| 18 to 34 Years | 0 (0.0%) | 0 (0.0%) |
| 35 to 64 Years | 0 (0.0%) | 0 (0.0%) |
| 65 to 74 Years | 0 (0.0%) | 0 (0.0%) |
| 75 Years and over | 0 (0.0%) | 1 (100.0%) |
Disability Class: Vision Difficulty
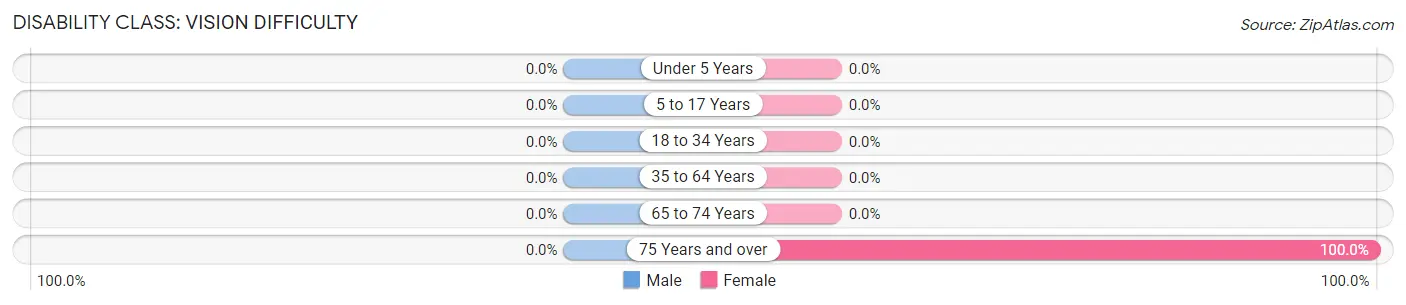
| Age Bracket | Male | Female |
| Under 5 Years | 0 (0.0%) | 0 (0.0%) |
| 5 to 17 Years | 0 (0.0%) | 0 (0.0%) |
| 18 to 34 Years | 0 (0.0%) | 0 (0.0%) |
| 35 to 64 Years | 0 (0.0%) | 0 (0.0%) |
| 65 to 74 Years | 0 (0.0%) | 0 (0.0%) |
| 75 Years and over | 0 (0.0%) | 1 (100.0%) |
Disability Class: Cognitive Difficulty
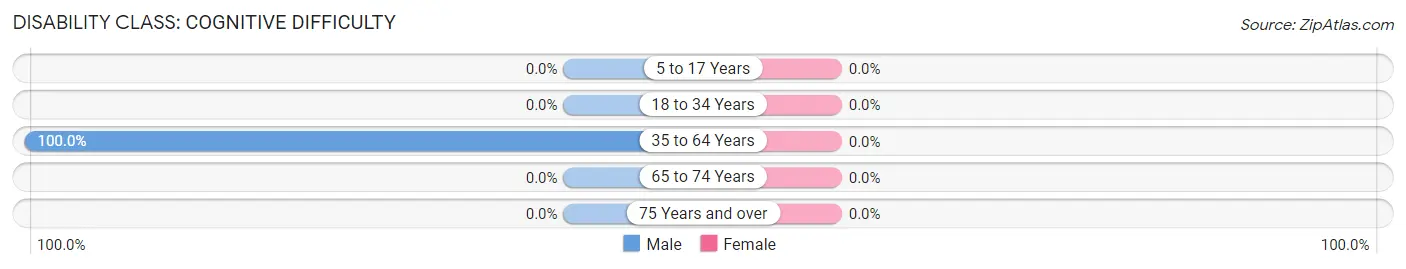
| Age Bracket | Male | Female |
| 5 to 17 Years | 0 (0.0%) | 0 (0.0%) |
| 18 to 34 Years | 0 (0.0%) | 0 (0.0%) |
| 35 to 64 Years | 1 (100.0%) | 0 (0.0%) |
| 65 to 74 Years | 0 (0.0%) | 0 (0.0%) |
| 75 Years and over | 0 (0.0%) | 0 (0.0%) |
Disability Class: Ambulatory Difficulty
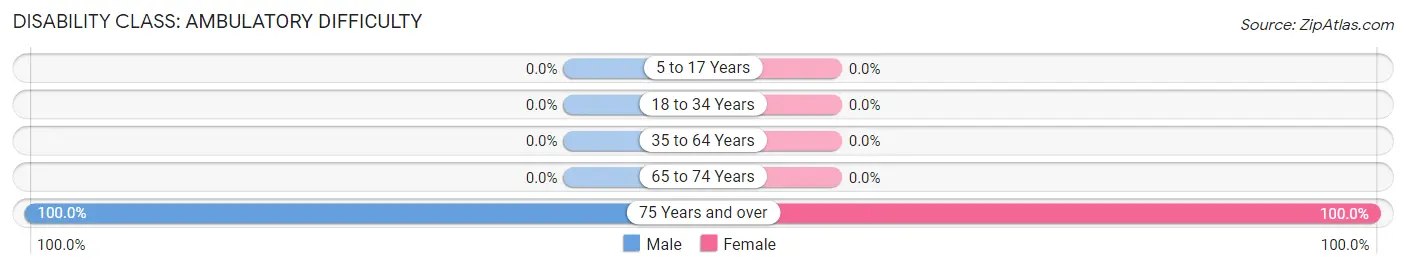
| Age Bracket | Male | Female |
| 5 to 17 Years | 0 (0.0%) | 0 (0.0%) |
| 18 to 34 Years | 0 (0.0%) | 0 (0.0%) |
| 35 to 64 Years | 0 (0.0%) | 0 (0.0%) |
| 65 to 74 Years | 0 (0.0%) | 0 (0.0%) |
| 75 Years and over | 1 (100.0%) | 1 (100.0%) |
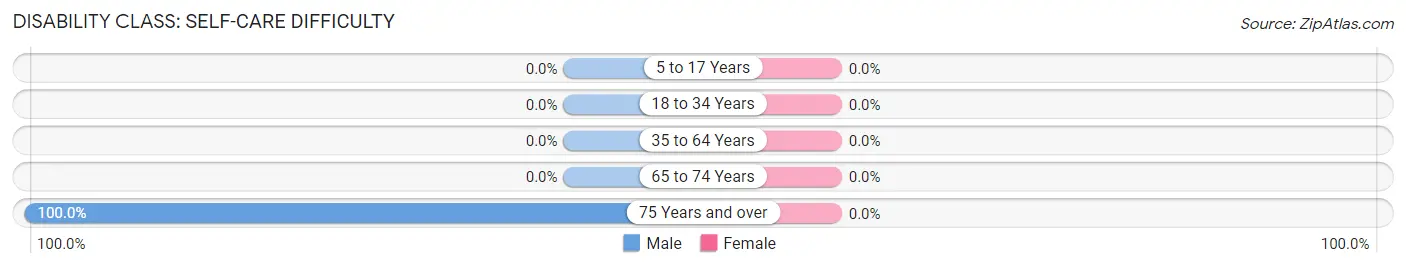
Disability Class: Self-Care Difficulty
| Age Bracket | Male | Female |
| 5 to 17 Years | 0 (0.0%) | 0 (0.0%) |
| 18 to 34 Years | 0 (0.0%) | 0 (0.0%) |
| 35 to 64 Years | 0 (0.0%) | 0 (0.0%) |
| 65 to 74 Years | 0 (0.0%) | 0 (0.0%) |
| 75 Years and over | 1 (100.0%) | 0 (0.0%) |
Technology Access in Clam Lake
Computing Device Access in Clam Lake
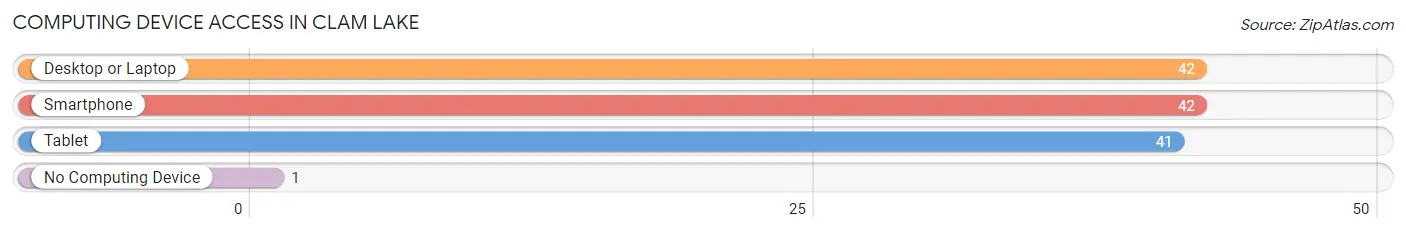
| Device Type | # Households | % Households |
| Desktop or Laptop | 42 | 97.7% |
| Smartphone | 42 | 97.7% |
| Tablet | 41 | 95.4% |
| No Computing Device | 1 | 2.3% |
| Total | 43 | 100.0% |
Internet Access in Clam Lake
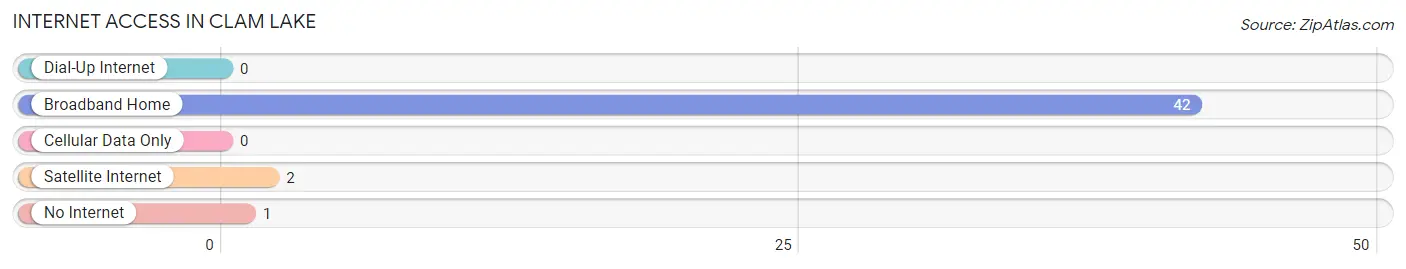
| Internet Type | # Households | % Households |
| Dial-Up Internet | 0 | 0.0% |
| Broadband Home | 42 | 97.7% |
| Cellular Data Only | 0 | 0.0% |
| Satellite Internet | 2 | 4.6% |
| No Internet | 1 | 2.3% |
| Total | 43 | 100.0% |
Clam Lake Summary
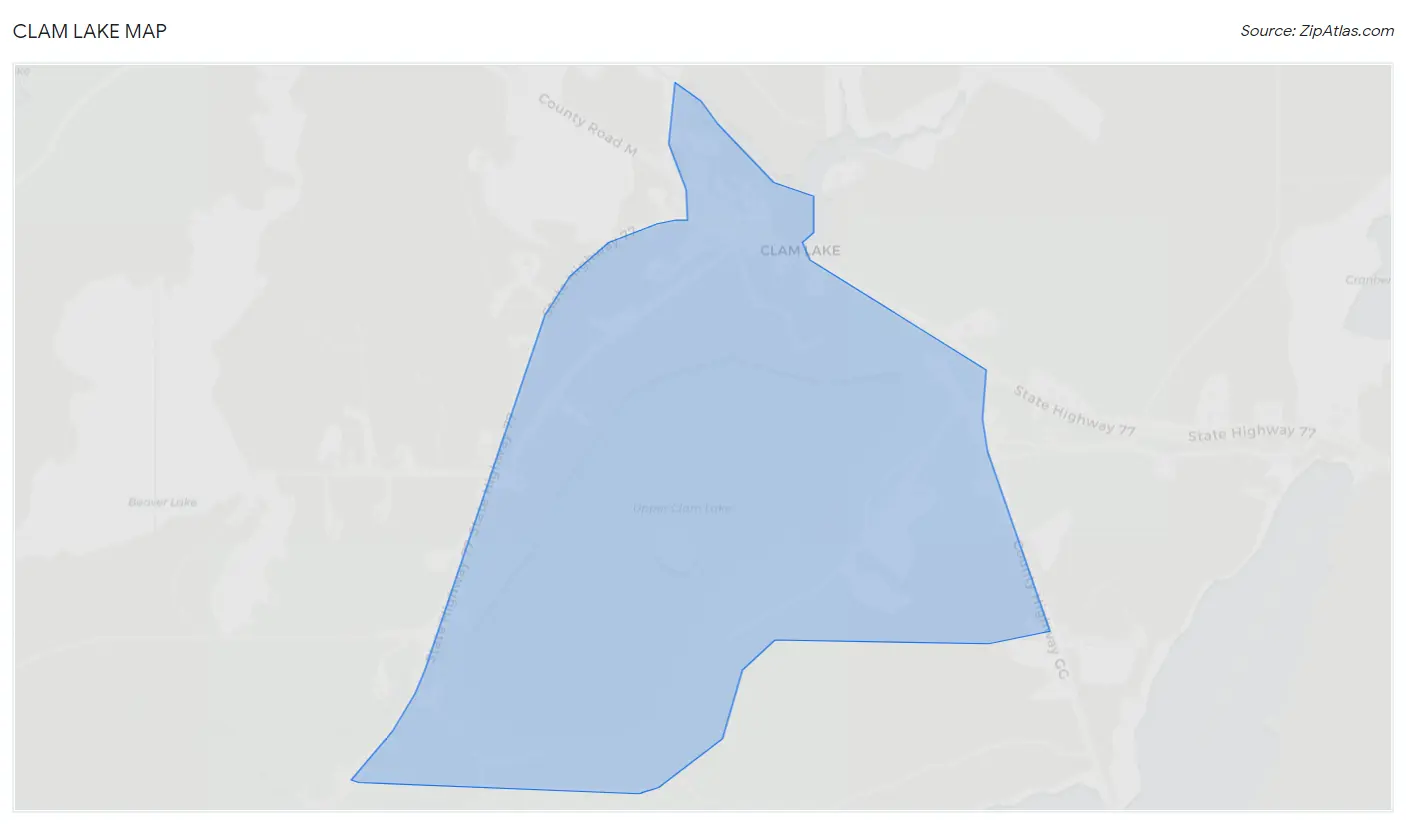
Clam Lake, Wisconsin is a small unincorporated community located in the northern part of the state in Bayfield County. It is situated on the shore of Clam Lake, a large lake that is part of the Chequamegon-Nicolet National Forest. The area is known for its natural beauty and outdoor recreation opportunities, and is home to a variety of wildlife.
History
The area around Clam Lake has been inhabited for thousands of years by the Ojibwe people. The first European settlers arrived in the area in the late 1800s, and the community of Clam Lake was officially established in 1891. The town was named after the lake, which was named by the Ojibwe for the abundance of clams in the lake.
In the early 1900s, the area around Clam Lake was a popular destination for logging and fishing. The town was also home to a number of resorts, which attracted visitors from all over the Midwest. In the 1950s, the area began to transition from a logging and fishing economy to a tourism-based economy.
Geography
Clam Lake is located in the northern part of Wisconsin, in Bayfield County. It is situated on the shore of Clam Lake, a large lake that is part of the Chequamegon-Nicolet National Forest. The area is known for its natural beauty and outdoor recreation opportunities, and is home to a variety of wildlife.
The town of Clam Lake is located at the intersection of Wisconsin State Highway 77 and County Road C. It is approximately 25 miles north of Hayward, Wisconsin and 40 miles south of Ashland, Wisconsin.
Economy
The economy of Clam Lake is largely based on tourism. The area is known for its natural beauty and outdoor recreation opportunities, and is home to a variety of wildlife. The town is home to a number of resorts, campgrounds, and other tourist attractions.
In addition to tourism, the town is also home to a number of small businesses, including restaurants, stores, and other services. The town is also home to a number of logging and timber companies, which are important to the local economy.
Demographics
As of the 2010 census, the population of Clam Lake was 545. The racial makeup of the town was 97.3% White, 0.2% African American, 0.2% Native American, 0.4% Asian, 0.2% from other races, and 1.7% from two or more races. Hispanic or Latino of any race were 0.7% of the population.
The median household income in Clam Lake was $41,250, and the median family income was $48,750. The per capita income for the town was $20,945. About 10.3% of families and 13.2% of the population were below the poverty line, including 16.7% of those under age 18 and 8.3% of those age 65 or over.
Common Questions
What is Per Capita Income in Clam Lake?
Per Capita income in Clam Lake is $35,361.
What is the Median Family Income in Clam Lake?
Median Family Income in Clam Lake is $68,824.
What is the Median Household income in Clam Lake?
Median Household Income in Clam Lake is $68,787.
What is Inequality or Gini Index in Clam Lake?
Inequality or Gini Index in Clam Lake is 0.10.
What is the Total Population of Clam Lake?
Total Population of Clam Lake is 49.
What is the Total Male Population of Clam Lake?
Total Male Population of Clam Lake is 9.
What is the Total Female Population of Clam Lake?
Total Female Population of Clam Lake is 40.
What is the Ratio of Males per 100 Females in Clam Lake?
There are 22.50 Males per 100 Females in Clam Lake.
What is the Ratio of Females per 100 Males in Clam Lake?
There are 444.44 Females per 100 Males in Clam Lake.
What is the Median Population Age in Clam Lake?
Median Population Age in Clam Lake is 73.4 Years.
What is the Average Family Size in Clam Lake
Average Family Size in Clam Lake is 1.1 People.
What is the Average Household Size in Clam Lake
Average Household Size in Clam Lake is 1.1 People.
How Large is the Labor Force in Clam Lake?
There are 4 People in the Labor Forcein in Clam Lake.
What is the Percentage of People in the Labor Force in Clam Lake?
8.2% of People are in the Labor Force in Clam Lake.