Manter, KS Map & Demographics
Manter Map
Manter Overview
$30,958
PER CAPITA INCOME
$61,397
AVG FAMILY INCOME
$60,662
AVG HOUSEHOLD INCOME
13.0%
WAGE / INCOME GAP [ % ]
87.0¢/ $1
WAGE / INCOME GAP [ $ ]
0.24
INEQUALITY / GINI INDEX
190
TOTAL POPULATION
76
MALE POPULATION
114
FEMALE POPULATION
66.67
MALES / 100 FEMALES
150.00
FEMALES / 100 MALES
58.6
MEDIAN AGE
3.9
AVG FAMILY SIZE
3.2
AVG HOUSEHOLD SIZE
72
LABOR FORCE [ PEOPLE ]
46.2%
PERCENT IN LABOR FORCE
2.8%
UNEMPLOYMENT RATE
Manter Zip Codes
Manter Area Codes
Income in Manter
Income Overview in Manter
Per Capita Income in Manter is $30,958, while median incomes of families and households are $61,397 and $60,662 respectively.
| Characteristic | Number | Measure |
| Per Capita Income | 190 | $30,958 |
| Median Family Income | 35 | $61,397 |
| Mean Family Income | 35 | $66,797 |
| Median Household Income | 59 | $60,662 |
| Mean Household Income | 59 | $66,527 |
| Income Deficit | 35 | $0 |
| Wage / Income Gap (%) | 190 | 12.96% |
| Wage / Income Gap ($) | 190 | 87.04¢ per $1 |
| Gini / Inequality Index | 190 | 0.24 |
Earnings by Sex in Manter
Average Earnings in Manter are $46,875, $53,750 for men and $46,786 for women, a difference of 13.0%.
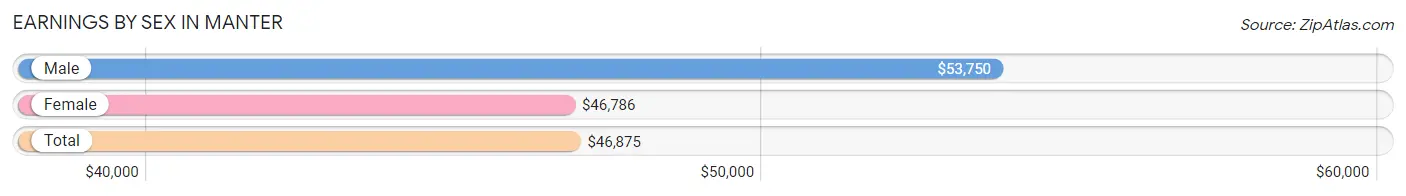
| Sex | Number | Average Earnings |
| Male | 22 (30.6%) | $53,750 |
| Female | 50 (69.4%) | $46,786 |
| Total | 72 (100.0%) | $46,875 |
Earnings by Sex by Income Bracket in Manter
The most common earnings brackets in Manter are $2,499 or less for men (7 | 31.8%) and $50,000 to $54,999 for women (21 | 42.0%).
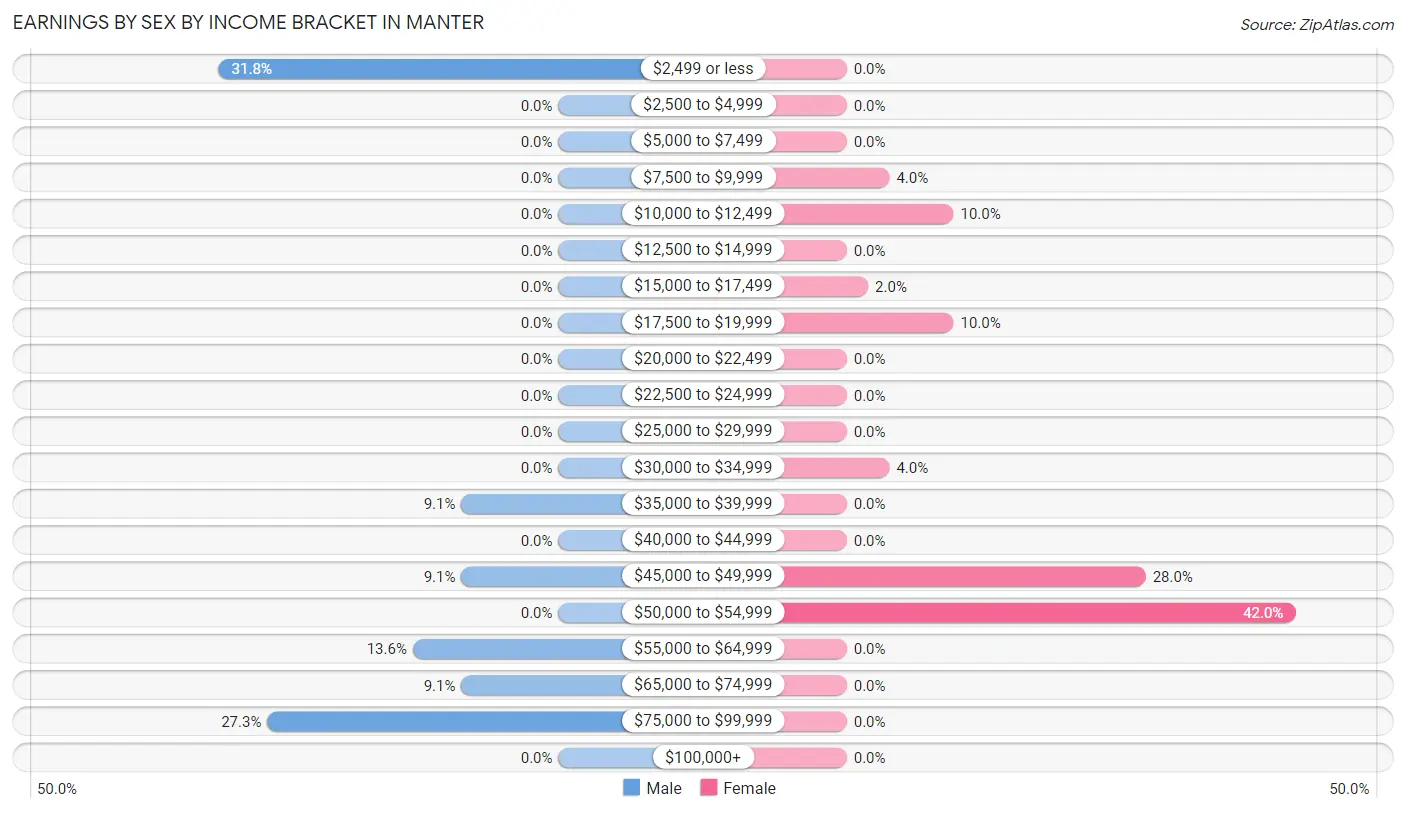
| Income | Male | Female |
| $2,499 or less | 7 (31.8%) | 0 (0.0%) |
| $2,500 to $4,999 | 0 (0.0%) | 0 (0.0%) |
| $5,000 to $7,499 | 0 (0.0%) | 0 (0.0%) |
| $7,500 to $9,999 | 0 (0.0%) | 2 (4.0%) |
| $10,000 to $12,499 | 0 (0.0%) | 5 (10.0%) |
| $12,500 to $14,999 | 0 (0.0%) | 0 (0.0%) |
| $15,000 to $17,499 | 0 (0.0%) | 1 (2.0%) |
| $17,500 to $19,999 | 0 (0.0%) | 5 (10.0%) |
| $20,000 to $22,499 | 0 (0.0%) | 0 (0.0%) |
| $22,500 to $24,999 | 0 (0.0%) | 0 (0.0%) |
| $25,000 to $29,999 | 0 (0.0%) | 0 (0.0%) |
| $30,000 to $34,999 | 0 (0.0%) | 2 (4.0%) |
| $35,000 to $39,999 | 2 (9.1%) | 0 (0.0%) |
| $40,000 to $44,999 | 0 (0.0%) | 0 (0.0%) |
| $45,000 to $49,999 | 2 (9.1%) | 14 (28.0%) |
| $50,000 to $54,999 | 0 (0.0%) | 21 (42.0%) |
| $55,000 to $64,999 | 3 (13.6%) | 0 (0.0%) |
| $65,000 to $74,999 | 2 (9.1%) | 0 (0.0%) |
| $75,000 to $99,999 | 6 (27.3%) | 0 (0.0%) |
| $100,000+ | 0 (0.0%) | 0 (0.0%) |
| Total | 22 (100.0%) | 50 (100.0%) |
Earnings by Sex by Educational Attainment in Manter
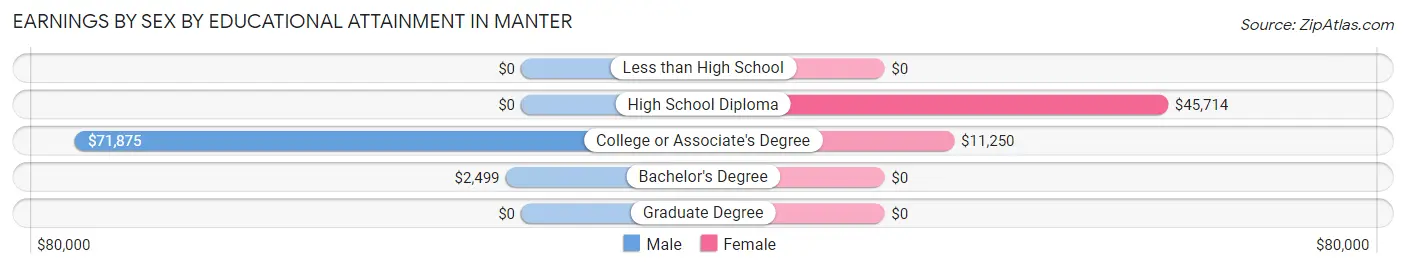
| Educational Attainment | Male Income | Female Income |
| Less than High School | - | - |
| High School Diploma | - | - |
| College or Associate's Degree | $71,875 | $11,250 |
| Bachelor's Degree | $2,499 | $0 |
| Graduate Degree | - | - |
| Total | $53,750 | $0 |
Family Income in Manter
Family Income Brackets in Manter
According to the Manter family income data, there are 17 families falling into the $50,000 to $74,999 income range, which is the most common income bracket and makes up 48.6% of all families.
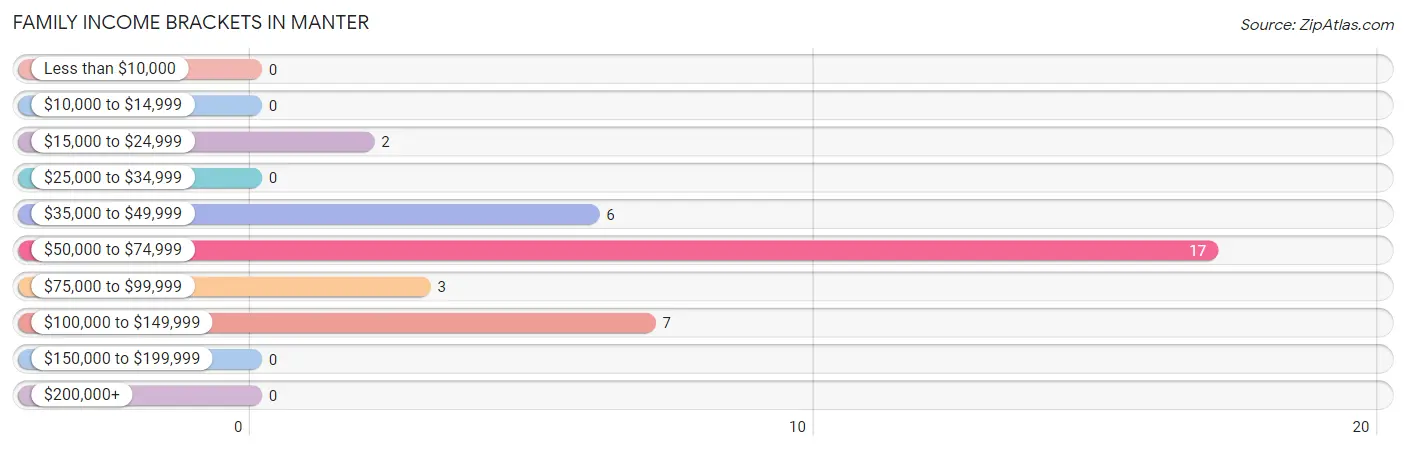
| Income Bracket | # Families | % Families |
| Less than $10,000 | 0 | 0.0% |
| $10,000 to $14,999 | 0 | 0.0% |
| $15,000 to $24,999 | 2 | 5.7% |
| $25,000 to $34,999 | 0 | 0.0% |
| $35,000 to $49,999 | 6 | 17.1% |
| $50,000 to $74,999 | 17 | 48.6% |
| $75,000 to $99,999 | 3 | 8.6% |
| $100,000 to $149,999 | 7 | 20.0% |
| $150,000 to $199,999 | 0 | 0.0% |
| $200,000+ | 0 | 0.0% |
Family Income by Famaliy Size in Manter
2-person families (24 | 68.6%) account for the highest median family income in Manter with $61,333 per family, while 2-person families (24 | 68.6%) have the highest median income of $30,666 per family member.
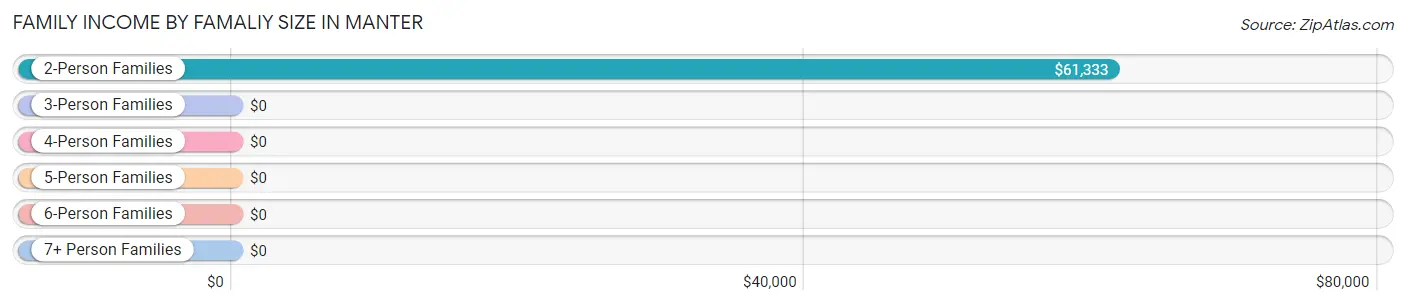
| Income Bracket | # Families | Median Income |
| 2-Person Families | 24 (68.6%) | $61,333 |
| 3-Person Families | 2 (5.7%) | $0 |
| 4-Person Families | 7 (20.0%) | $0 |
| 5-Person Families | 0 (0.0%) | $0 |
| 6-Person Families | 0 (0.0%) | $0 |
| 7+ Person Families | 2 (5.7%) | $0 |
| Total | 35 (100.0%) | $61,397 |
Family Income by Number of Earners in Manter
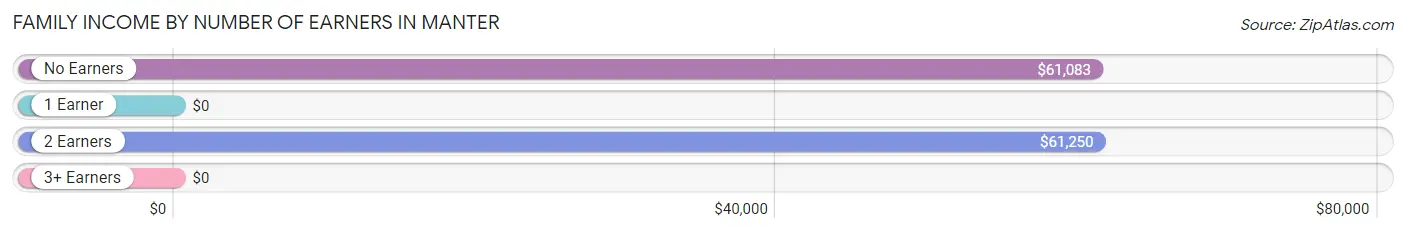
| Number of Earners | # Families | Median Income |
| No Earners | 21 (60.0%) | $61,083 |
| 1 Earner | 3 (8.6%) | $0 |
| 2 Earners | 6 (17.1%) | $61,250 |
| 3+ Earners | 5 (14.3%) | $0 |
| Total | 35 (100.0%) | $61,397 |
Household Income in Manter
Household Income Brackets in Manter
With 22 households falling in the category, the $35,000 to $49,999 income range is the most frequent in Manter, accounting for 37.3% of all households.
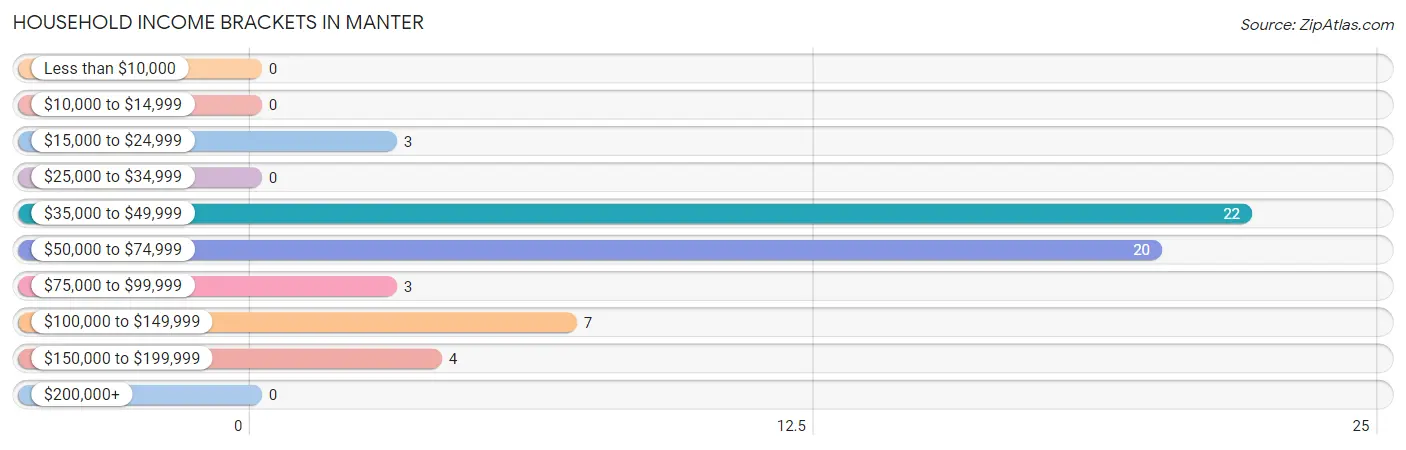
| Income Bracket | # Households | % Households |
| Less than $10,000 | 0 | 0.0% |
| $10,000 to $14,999 | 0 | 0.0% |
| $15,000 to $24,999 | 3 | 5.1% |
| $25,000 to $34,999 | 0 | 0.0% |
| $35,000 to $49,999 | 22 | 37.3% |
| $50,000 to $74,999 | 20 | 33.9% |
| $75,000 to $99,999 | 3 | 5.1% |
| $100,000 to $149,999 | 7 | 11.9% |
| $150,000 to $199,999 | 4 | 6.8% |
| $200,000+ | 0 | 0.0% |
Household Income by Householder Age in Manter
The median household income in Manter is $60,662, with the highest median household income of $111,000 found in the 45 to 64 years age bracket for the primary householder. A total of 14 households (23.7%) fall into this category.
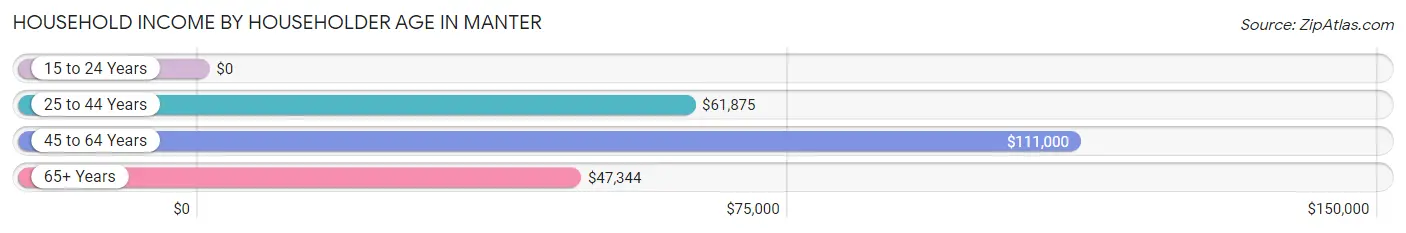
| Income Bracket | # Households | Median Income |
| 15 to 24 Years | 0 (0.0%) | $0 |
| 25 to 44 Years | 7 (11.9%) | $61,875 |
| 45 to 64 Years | 14 (23.7%) | $111,000 |
| 65+ Years | 38 (64.4%) | $47,344 |
| Total | 59 (100.0%) | $60,662 |
Poverty in Manter
Income Below Poverty by Sex and Age in Manter
With 6.6% poverty level for males and 18.4% for females among the residents of Manter, 12 to 14 year old males and 5 year old females are the most vulnerable to poverty, with 3 males (100.0%) and 5 females (100.0%) in their respective age groups living below the poverty level.
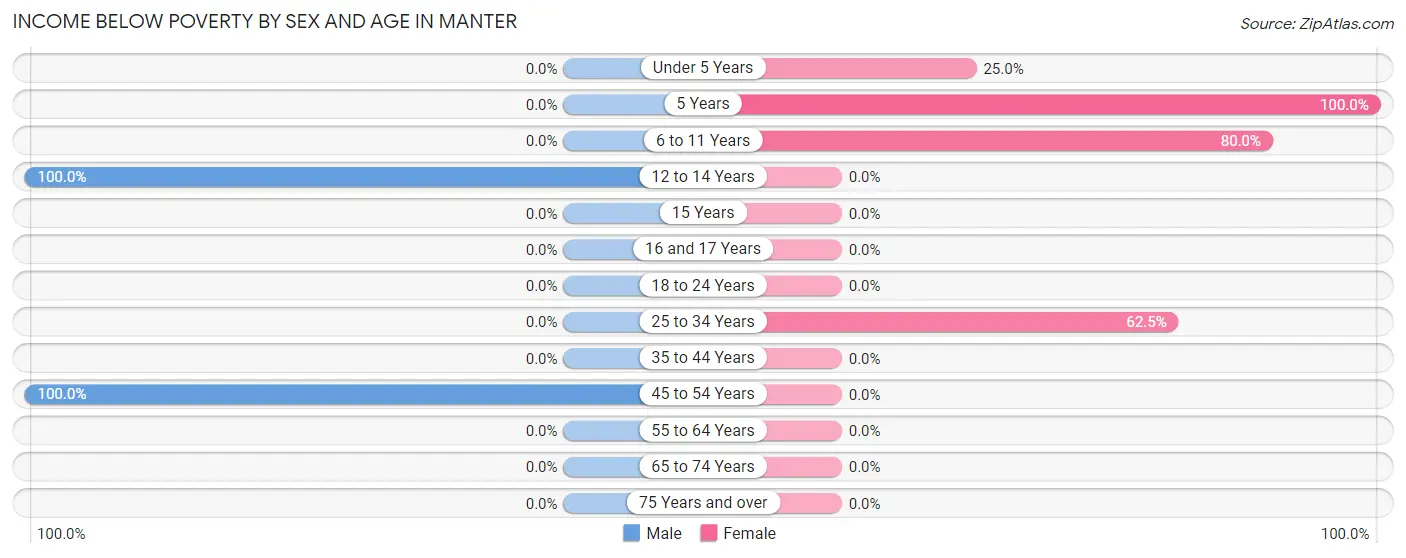
| Age Bracket | Male | Female |
| Under 5 Years | 0 (0.0%) | 3 (25.0%) |
| 5 Years | 0 (0.0%) | 5 (100.0%) |
| 6 to 11 Years | 0 (0.0%) | 8 (80.0%) |
| 12 to 14 Years | 3 (100.0%) | 0 (0.0%) |
| 15 Years | 0 (0.0%) | 0 (0.0%) |
| 16 and 17 Years | 0 (0.0%) | 0 (0.0%) |
| 18 to 24 Years | 0 (0.0%) | 0 (0.0%) |
| 25 to 34 Years | 0 (0.0%) | 5 (62.5%) |
| 35 to 44 Years | 0 (0.0%) | 0 (0.0%) |
| 45 to 54 Years | 2 (100.0%) | 0 (0.0%) |
| 55 to 64 Years | 0 (0.0%) | 0 (0.0%) |
| 65 to 74 Years | 0 (0.0%) | 0 (0.0%) |
| 75 Years and over | 0 (0.0%) | 0 (0.0%) |
| Total | 5 (6.6%) | 21 (18.4%) |
Income Above Poverty by Sex and Age in Manter
According to the poverty statistics in Manter, males aged under 5 years and females aged 18 to 24 years are the age groups that are most secure financially, with 100.0% of males and 100.0% of females in these age groups living above the poverty line.
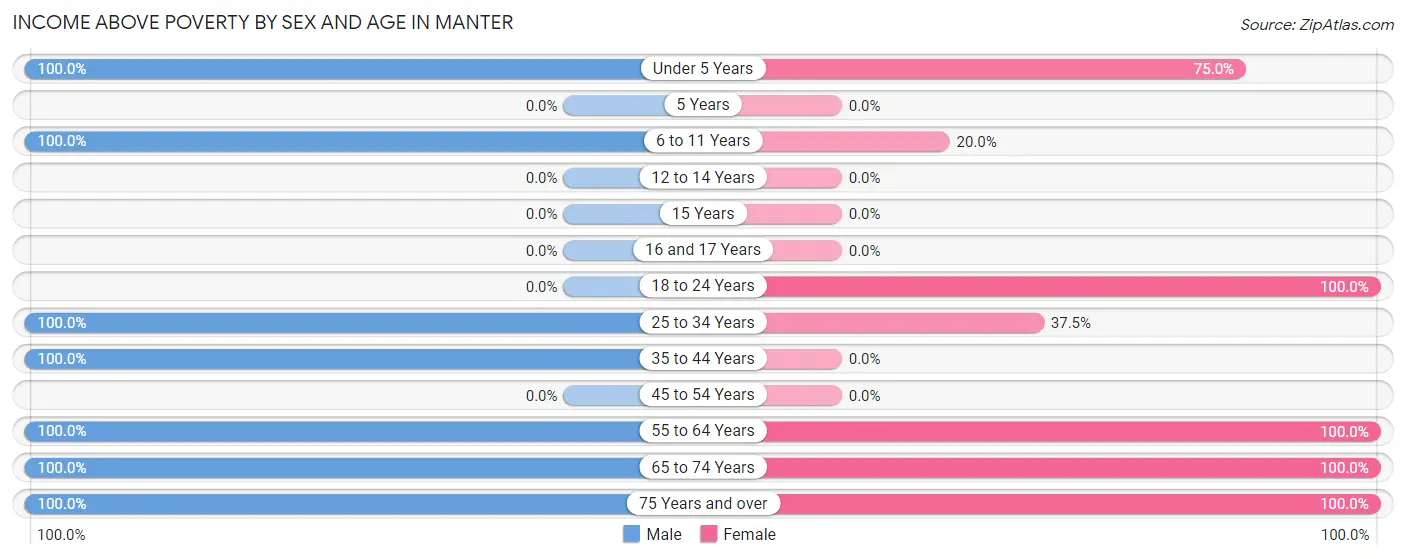
| Age Bracket | Male | Female |
| Under 5 Years | 2 (100.0%) | 9 (75.0%) |
| 5 Years | 0 (0.0%) | 0 (0.0%) |
| 6 to 11 Years | 2 (100.0%) | 2 (20.0%) |
| 12 to 14 Years | 0 (0.0%) | 0 (0.0%) |
| 15 Years | 0 (0.0%) | 0 (0.0%) |
| 16 and 17 Years | 0 (0.0%) | 0 (0.0%) |
| 18 to 24 Years | 0 (0.0%) | 21 (100.0%) |
| 25 to 34 Years | 6 (100.0%) | 3 (37.5%) |
| 35 to 44 Years | 1 (100.0%) | 0 (0.0%) |
| 45 to 54 Years | 0 (0.0%) | 0 (0.0%) |
| 55 to 64 Years | 15 (100.0%) | 22 (100.0%) |
| 65 to 74 Years | 26 (100.0%) | 18 (100.0%) |
| 75 Years and over | 19 (100.0%) | 18 (100.0%) |
| Total | 71 (93.4%) | 93 (81.6%) |
Income Below Poverty Among Married-Couple Families in Manter
The poverty statistics for married-couple families in Manter show that 5.7% or 2 of the total 35 families live below the poverty line. Families with 5 or more children have the highest poverty rate of 100.0%, comprising of 2 families. On the other hand, families with no children have the lowest poverty rate of 0.0%, which includes 0 families.
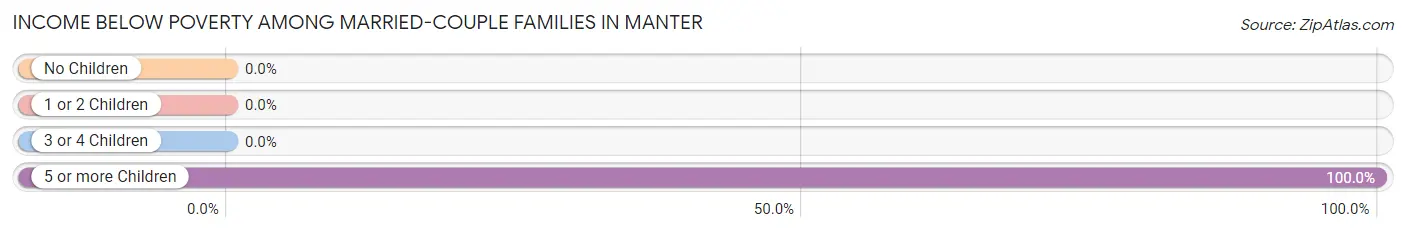
| Children | Above Poverty | Below Poverty |
| No Children | 24 (100.0%) | 0 (0.0%) |
| 1 or 2 Children | 9 (100.0%) | 0 (0.0%) |
| 3 or 4 Children | 0 (0.0%) | 0 (0.0%) |
| 5 or more Children | 0 (0.0%) | 2 (100.0%) |
| Total | 33 (94.3%) | 2 (5.7%) |
Income Below Poverty Among Single-Parent Households in Manter
| Children | Single Father | Single Mother |
| No Children | 0 (0.0%) | 0 (0.0%) |
| 1 or 2 Children | 0 (0.0%) | 0 (0.0%) |
| 3 or 4 Children | 0 (0.0%) | 0 (0.0%) |
| 5 or more Children | 0 (0.0%) | 0 (0.0%) |
| Total | 0 (0.0%) | 0 (0.0%) |
Income Below Poverty Among Married-Couple vs Single-Parent Households in Manter
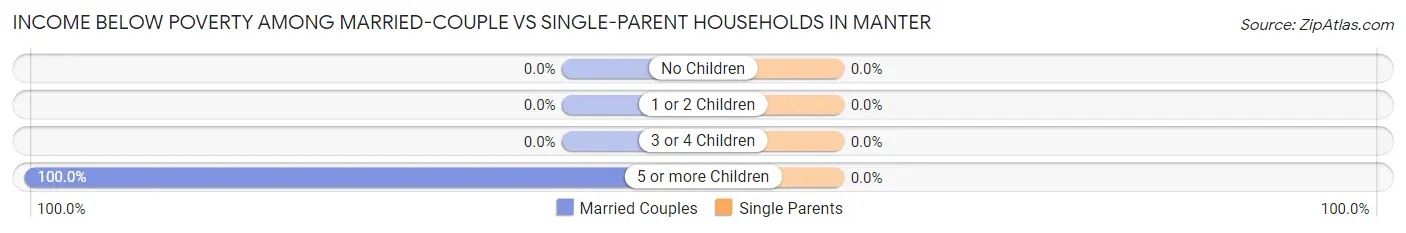
| Children | Married-Couple Families | Single-Parent Households |
| No Children | 0 (0.0%) | 0 (0.0%) |
| 1 or 2 Children | 0 (0.0%) | 0 (0.0%) |
| 3 or 4 Children | 0 (0.0%) | 0 (0.0%) |
| 5 or more Children | 2 (100.0%) | 0 (0.0%) |
| Total | 2 (5.7%) | 0 (0.0%) |
Race in Manter
The most populous races in Manter are White / Caucasian (163 | 85.8%), Hispanic or Latino (71 | 37.4%), and Two or more Races (21 | 11.1%).
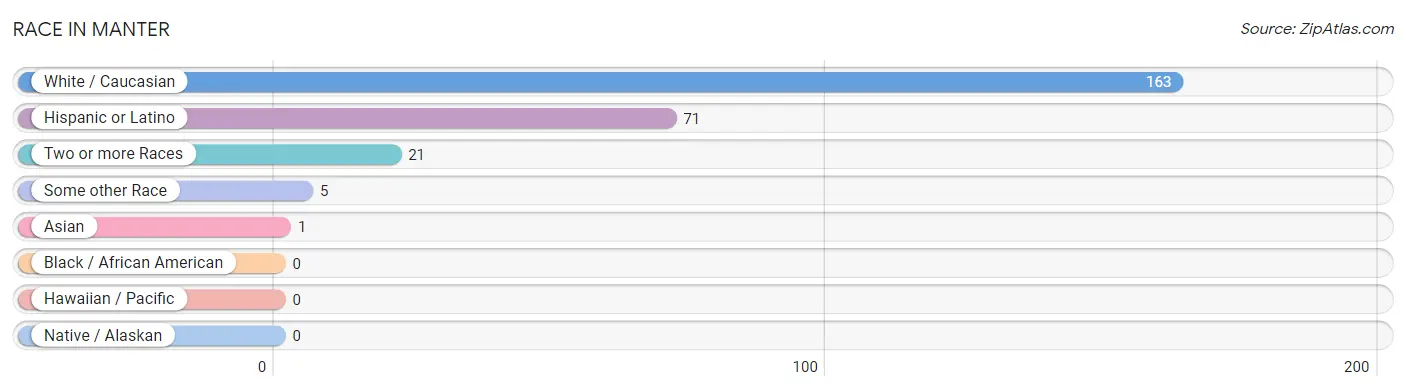
| Race | # Population | % Population |
| Asian | 1 | 0.5% |
| Black / African American | 0 | 0.0% |
| Hawaiian / Pacific | 0 | 0.0% |
| Hispanic or Latino | 71 | 37.4% |
| Native / Alaskan | 0 | 0.0% |
| White / Caucasian | 163 | 85.8% |
| Two or more Races | 21 | 11.1% |
| Some other Race | 5 | 2.6% |
| Total | 190 | 100.0% |
Ancestry in Manter
The most populous ancestries reported in Manter are Mexican (71 | 37.4%), German (65 | 34.2%), English (23 | 12.1%), American (2 | 1.1%), and French (1 | 0.5%), together accounting for 85.3% of all Manter residents.
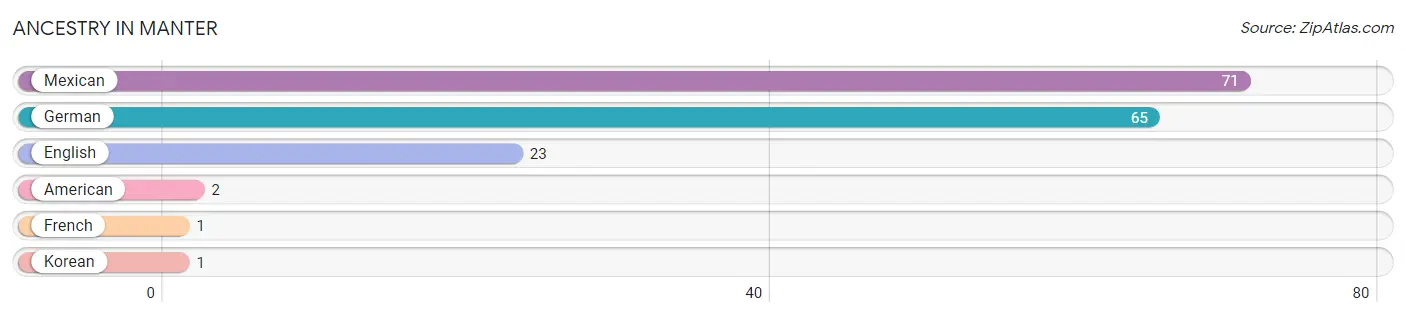
| Ancestry | # Population | % Population |
| American | 2 | 1.1% |
| English | 23 | 12.1% |
| French | 1 | 0.5% |
| German | 65 | 34.2% |
| Korean | 1 | 0.5% |
| Mexican | 71 | 37.4% | View All 6 Rows |
Immigrants in Manter
The most numerous immigrant groups reported in Manter came from Europe (16 | 8.4%), Germany (16 | 8.4%), Western Europe (16 | 8.4%), Central America (5 | 2.6%), and Latin America (5 | 2.6%), together accounting for 30.5% of all Manter residents.
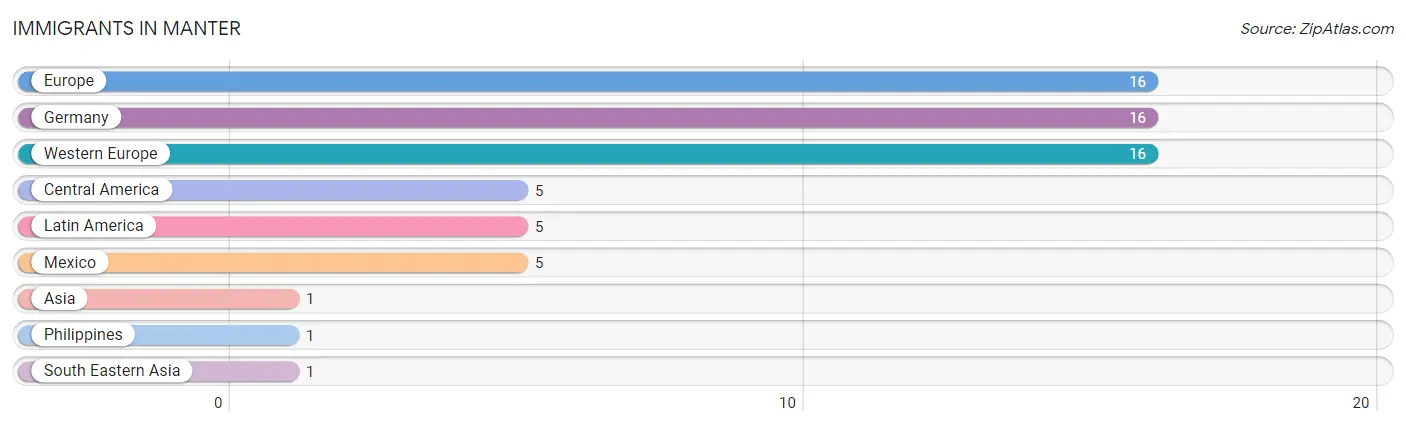
| Immigration Origin | # Population | % Population |
| Asia | 1 | 0.5% |
| Central America | 5 | 2.6% |
| Europe | 16 | 8.4% |
| Germany | 16 | 8.4% |
| Latin America | 5 | 2.6% |
| Mexico | 5 | 2.6% |
| Philippines | 1 | 0.5% |
| South Eastern Asia | 1 | 0.5% |
| Western Europe | 16 | 8.4% | View All 9 Rows |
Sex and Age in Manter
Sex and Age in Manter
The most populous age groups in Manter are 70 to 74 Years (23 | 30.3%) for men and 20 to 24 Years (21 | 18.4%) for women.
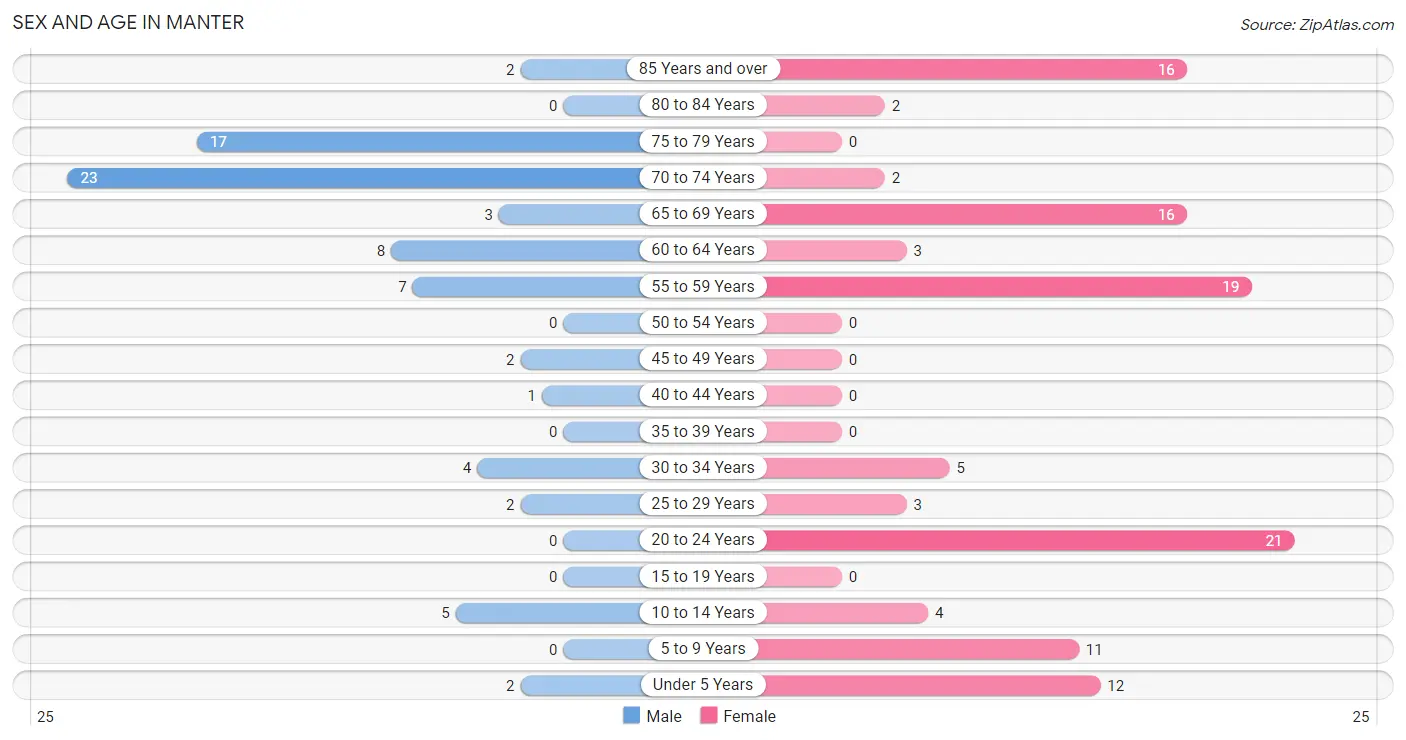
| Age Bracket | Male | Female |
| Under 5 Years | 2 (2.6%) | 12 (10.5%) |
| 5 to 9 Years | 0 (0.0%) | 11 (9.7%) |
| 10 to 14 Years | 5 (6.6%) | 4 (3.5%) |
| 15 to 19 Years | 0 (0.0%) | 0 (0.0%) |
| 20 to 24 Years | 0 (0.0%) | 21 (18.4%) |
| 25 to 29 Years | 2 (2.6%) | 3 (2.6%) |
| 30 to 34 Years | 4 (5.3%) | 5 (4.4%) |
| 35 to 39 Years | 0 (0.0%) | 0 (0.0%) |
| 40 to 44 Years | 1 (1.3%) | 0 (0.0%) |
| 45 to 49 Years | 2 (2.6%) | 0 (0.0%) |
| 50 to 54 Years | 0 (0.0%) | 0 (0.0%) |
| 55 to 59 Years | 7 (9.2%) | 19 (16.7%) |
| 60 to 64 Years | 8 (10.5%) | 3 (2.6%) |
| 65 to 69 Years | 3 (4.0%) | 16 (14.0%) |
| 70 to 74 Years | 23 (30.3%) | 2 (1.8%) |
| 75 to 79 Years | 17 (22.4%) | 0 (0.0%) |
| 80 to 84 Years | 0 (0.0%) | 2 (1.8%) |
| 85 Years and over | 2 (2.6%) | 16 (14.0%) |
| Total | 76 (100.0%) | 114 (100.0%) |
Families and Households in Manter
Median Family Size in Manter
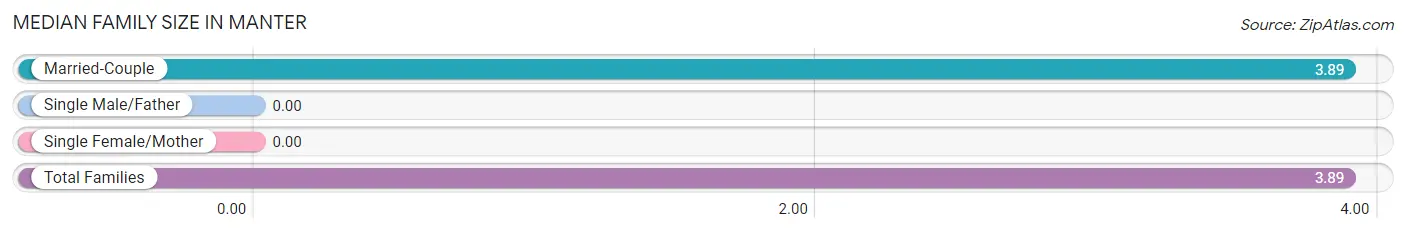
| Family Type | # Families | Family Size |
| Married-Couple | 35 (100.0%) | 3.89 |
| Single Male/Father | 0 (0.0%) | - |
| Single Female/Mother | 0 (0.0%) | - |
| Total Families | 35 (100.0%) | 3.89 |
Median Household Size in Manter
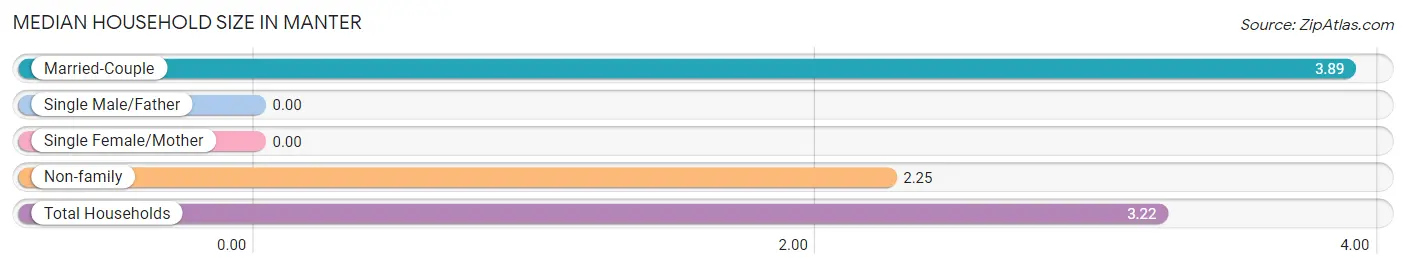
| Household Type | # Households | Household Size |
| Married-Couple | 35 (59.3%) | 3.89 |
| Single Male/Father | 0 (0.0%) | - |
| Single Female/Mother | 0 (0.0%) | - |
| Non-family | 24 (40.7%) | 2.25 |
| Total Households | 59 (100.0%) | 3.22 |
Household Size by Marriage Status in Manter
Out of a total of 59 households in Manter, 35 (59.3%) are family households, while 24 (40.7%) are nonfamily households. The most numerous type of family households are 2-person households, comprising 24, and the most common type of nonfamily households are 1-person households, comprising 20.
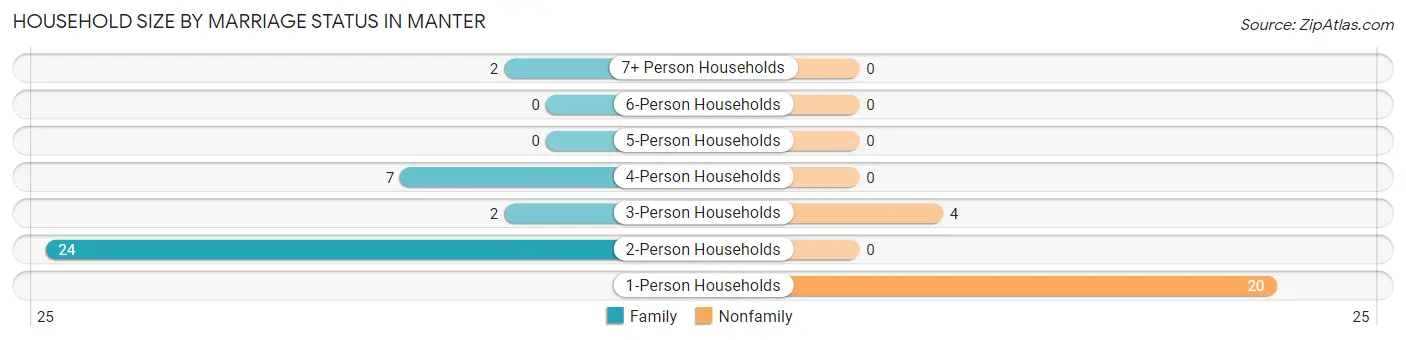
| Household Size | Family Households | Nonfamily Households |
| 1-Person Households | - | 20 (33.9%) |
| 2-Person Households | 24 (40.7%) | 0 (0.0%) |
| 3-Person Households | 2 (3.4%) | 4 (6.8%) |
| 4-Person Households | 7 (11.9%) | 0 (0.0%) |
| 5-Person Households | 0 (0.0%) | 0 (0.0%) |
| 6-Person Households | 0 (0.0%) | 0 (0.0%) |
| 7+ Person Households | 2 (3.4%) | 0 (0.0%) |
| Total | 35 (59.3%) | 24 (40.7%) |
Female Fertility in Manter
Fertility by Age in Manter
| Age Bracket | Women with Births | Births / 1,000 Women |
| 15 to 19 years | 0 (0.0%) | 0.0 |
| 20 to 34 years | 0 (0.0%) | 0.0 |
| 35 to 50 years | 0 (0.0%) | 0.0 |
| Total | 0 (0.0%) | 0.0 |
Fertility by Age by Marriage Status in Manter
| Age Bracket | Married | Unmarried |
| 15 to 19 years | 0 (0.0%) | 0 (0.0%) |
| 20 to 34 years | 0 (0.0%) | 0 (0.0%) |
| 35 to 50 years | 0 (0.0%) | 0 (0.0%) |
| Total | 0 (0.0%) | 0 (0.0%) |
Fertility by Education in Manter
| Educational Attainment | Women with Births | Births / 1,000 Women |
| Less than High School | 0 (0.0%) | 0.0 |
| High School Diploma | 0 (0.0%) | 0.0 |
| College or Associate's Degree | 0 (0.0%) | 0.0 |
| Bachelor's Degree | 0 (0.0%) | 0.0 |
| Graduate Degree | 0 (0.0%) | 0.0 |
| Total | 0 (0.0%) | 0.0 |
Fertility by Education by Marriage Status in Manter
| Educational Attainment | Married | Unmarried |
| Less than High School | 0 (0.0%) | 0 (0.0%) |
| High School Diploma | 0 (0.0%) | 0 (0.0%) |
| College or Associate's Degree | 0 (0.0%) | 0 (0.0%) |
| Bachelor's Degree | 0 (0.0%) | 0 (0.0%) |
| Graduate Degree | 0 (0.0%) | 0 (0.0%) |
| Total | 0 (0.0%) | 0 (0.0%) |
Employment Characteristics in Manter
Employment by Class of Employer in Manter
Among the 70 employed individuals in Manter, local government employees (31 | 44.3%), private company employees (26 | 37.1%), and self-employed (not incorporated) (7 | 10.0%) make up the most common classes of employment.
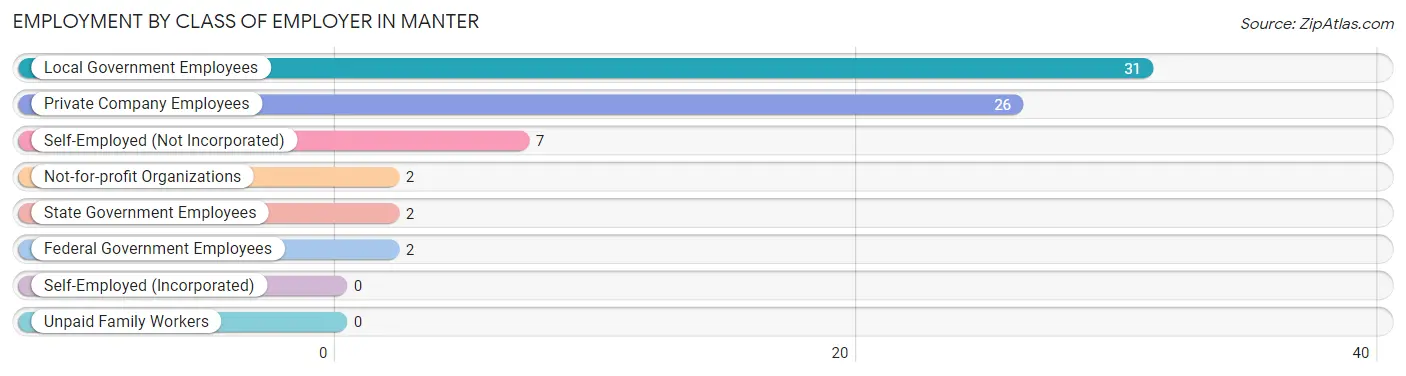
| Employer Class | # Employees | % Employees |
| Private Company Employees | 26 | 37.1% |
| Self-Employed (Incorporated) | 0 | 0.0% |
| Self-Employed (Not Incorporated) | 7 | 10.0% |
| Not-for-profit Organizations | 2 | 2.9% |
| Local Government Employees | 31 | 44.3% |
| State Government Employees | 2 | 2.9% |
| Federal Government Employees | 2 | 2.9% |
| Unpaid Family Workers | 0 | 0.0% |
| Total | 70 | 100.0% |
Employment Status by Age in Manter
According to the labor force statistics for Manter, out of the total population over 16 years of age (156), 46.2% or 72 individuals are in the labor force, with 2.8% or 2 of them unemployed. The age group with the highest labor force participation rate is 20 to 24 years, with 100.0% or 21 individuals in the labor force. Within the labor force, the 30 to 34 years age range has the highest percentage of unemployed individuals, with 22.2% or 2 of them being unemployed.
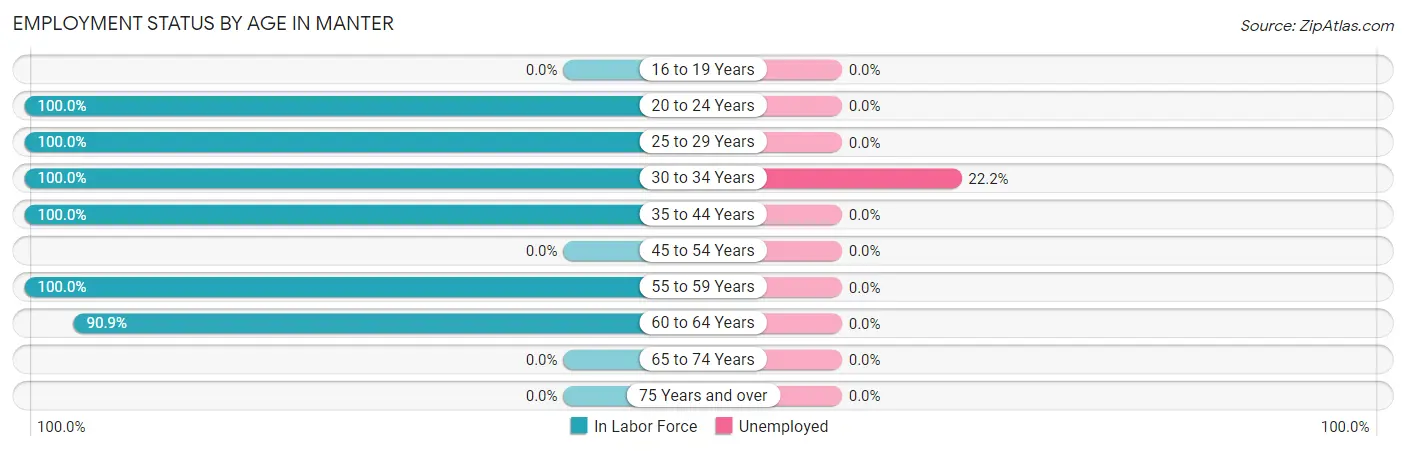
| Age Bracket | In Labor Force | Unemployed |
| 16 to 19 Years | 0 (0.0%) | 0 (0.0%) |
| 20 to 24 Years | 21 (100.0%) | 0 (0.0%) |
| 25 to 29 Years | 5 (100.0%) | 0 (0.0%) |
| 30 to 34 Years | 9 (100.0%) | 2 (22.2%) |
| 35 to 44 Years | 1 (100.0%) | 0 (0.0%) |
| 45 to 54 Years | 0 (0.0%) | 0 (0.0%) |
| 55 to 59 Years | 26 (100.0%) | 0 (0.0%) |
| 60 to 64 Years | 10 (90.9%) | 0 (0.0%) |
| 65 to 74 Years | 0 (0.0%) | 0 (0.0%) |
| 75 Years and over | 0 (0.0%) | 0 (0.0%) |
| Total | 72 (46.2%) | 2 (2.8%) |
Employment Status by Educational Attainment in Manter
According to labor force statistics for Manter, 94.4% of individuals (51) out of the total population between 25 and 64 years of age (54) are in the labor force, with 3.9% or 2 of them being unemployed. The group with the highest labor force participation rate are those with the educational attainment of high school diploma, with 100.0% or 22 individuals in the labor force. Within the labor force, individuals with high school diploma education have the highest percentage of unemployment, with 9.1% or 2 of them being unemployed.
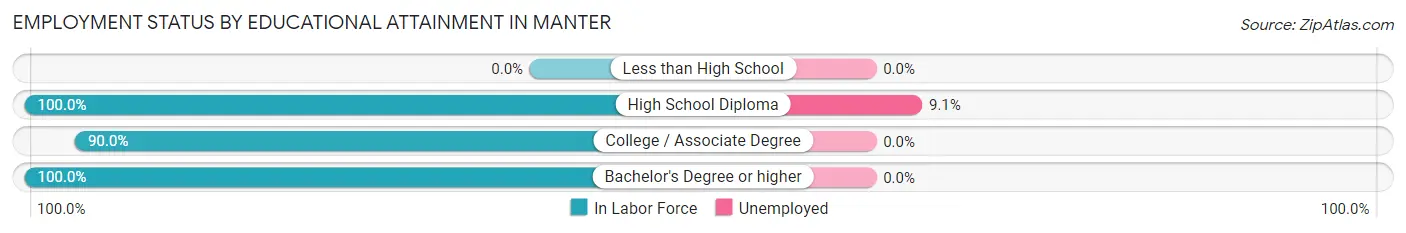
| Educational Attainment | In Labor Force | Unemployed |
| Less than High School | 0 (0.0%) | 0 (0.0%) |
| High School Diploma | 22 (100.0%) | 2 (9.1%) |
| College / Associate Degree | 18 (90.0%) | 0 (0.0%) |
| Bachelor's Degree or higher | 11 (100.0%) | 0 (0.0%) |
| Total | 51 (94.4%) | 2 (3.9%) |
Employment Occupations by Sex in Manter
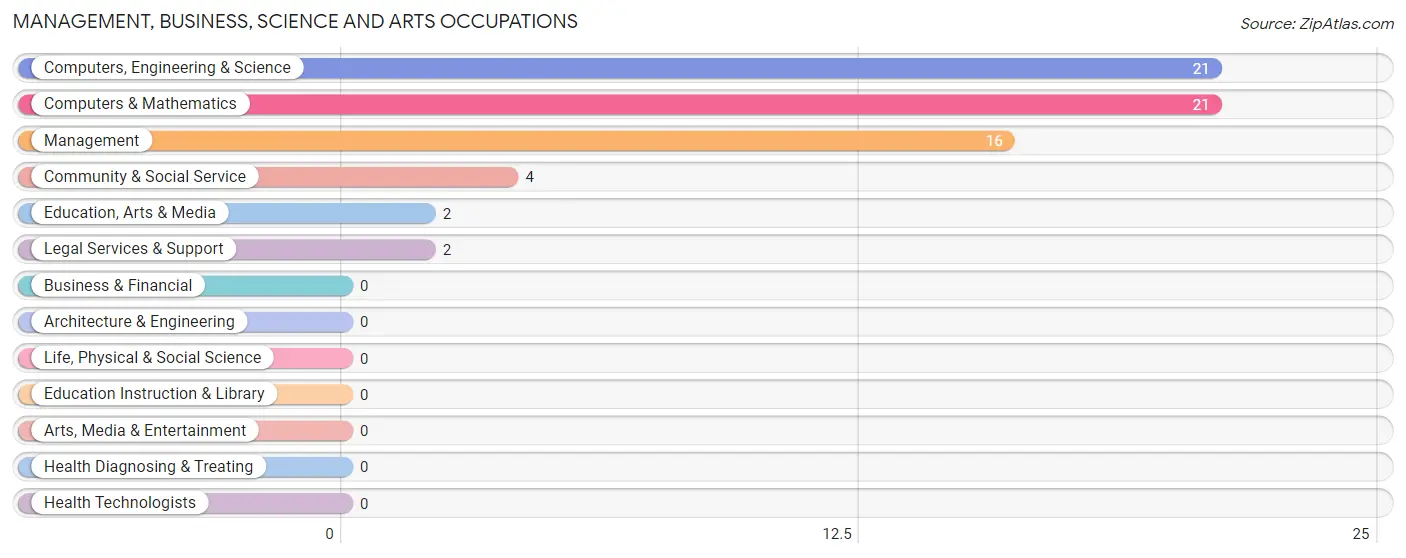
Management, Business, Science and Arts Occupations
The most common Management, Business, Science and Arts occupations in Manter are Computers, Engineering & Science (21 | 30.0%), Computers & Mathematics (21 | 30.0%), Management (16 | 22.9%), Community & Social Service (4 | 5.7%), and Education, Arts & Media (2 | 2.9%).
Management, Business, Science and Arts Occupations by Sex
Within the Management, Business, Science and Arts occupations in Manter, the most male-oriented occupations are Community & Social Service (100.0%), Education, Arts & Media (100.0%), and Legal Services & Support (100.0%), while the most female-oriented occupations are Computers, Engineering & Science (100.0%), Computers & Mathematics (100.0%), and Management (43.8%).
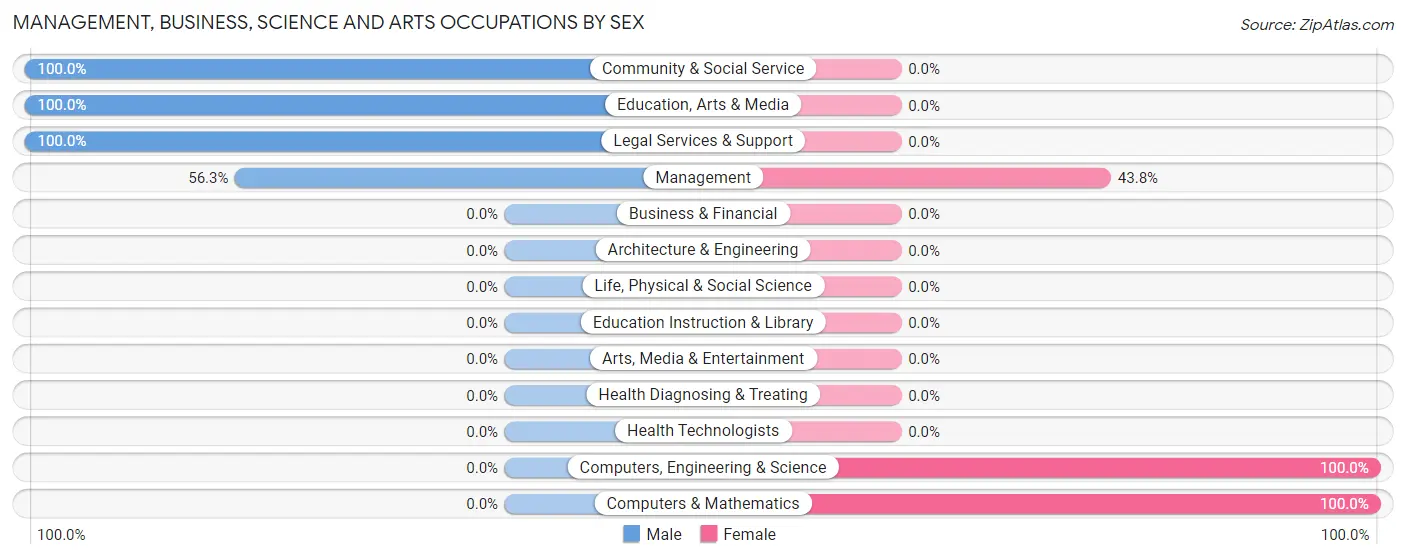
| Occupation | Male | Female |
| Management | 9 (56.2%) | 7 (43.8%) |
| Business & Financial | 0 (0.0%) | 0 (0.0%) |
| Computers, Engineering & Science | 0 (0.0%) | 21 (100.0%) |
| Computers & Mathematics | 0 (0.0%) | 21 (100.0%) |
| Architecture & Engineering | 0 (0.0%) | 0 (0.0%) |
| Life, Physical & Social Science | 0 (0.0%) | 0 (0.0%) |
| Community & Social Service | 4 (100.0%) | 0 (0.0%) |
| Education, Arts & Media | 2 (100.0%) | 0 (0.0%) |
| Legal Services & Support | 2 (100.0%) | 0 (0.0%) |
| Education Instruction & Library | 0 (0.0%) | 0 (0.0%) |
| Arts, Media & Entertainment | 0 (0.0%) | 0 (0.0%) |
| Health Diagnosing & Treating | 0 (0.0%) | 0 (0.0%) |
| Health Technologists | 0 (0.0%) | 0 (0.0%) |
| Total (Category) | 13 (31.7%) | 28 (68.3%) |
| Total (Overall) | 20 (28.6%) | 50 (71.4%) |
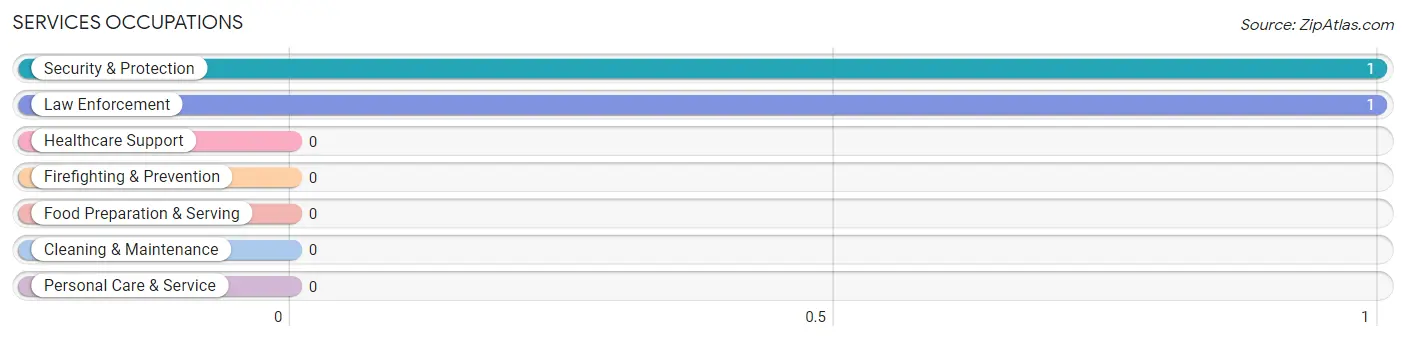
Services Occupations
The most common Services occupations in Manter are Security & Protection (1 | 1.4%), and Law Enforcement (1 | 1.4%).
Services Occupations by Sex
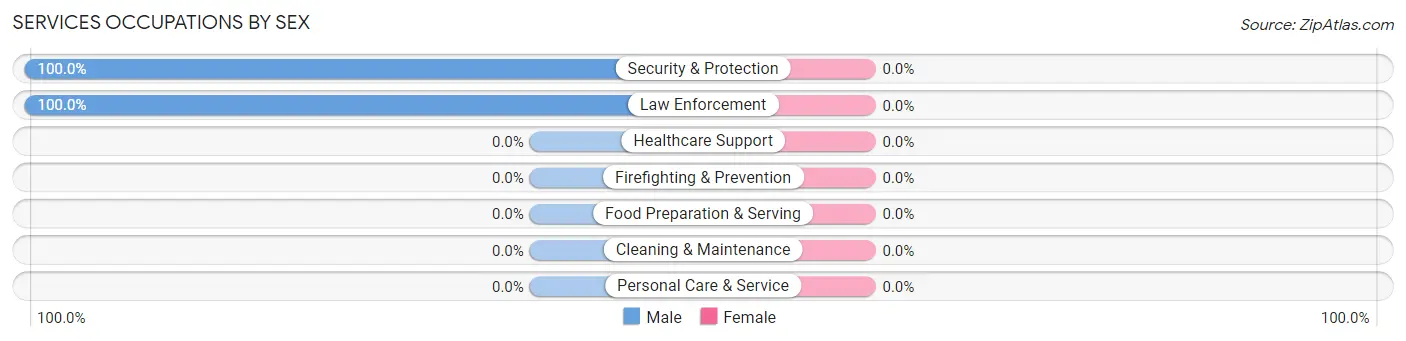
| Occupation | Male | Female |
| Healthcare Support | 0 (0.0%) | 0 (0.0%) |
| Security & Protection | 1 (100.0%) | 0 (0.0%) |
| Firefighting & Prevention | 0 (0.0%) | 0 (0.0%) |
| Law Enforcement | 1 (100.0%) | 0 (0.0%) |
| Food Preparation & Serving | 0 (0.0%) | 0 (0.0%) |
| Cleaning & Maintenance | 0 (0.0%) | 0 (0.0%) |
| Personal Care & Service | 0 (0.0%) | 0 (0.0%) |
| Total (Category) | 1 (100.0%) | 0 (0.0%) |
| Total (Overall) | 20 (28.6%) | 50 (71.4%) |
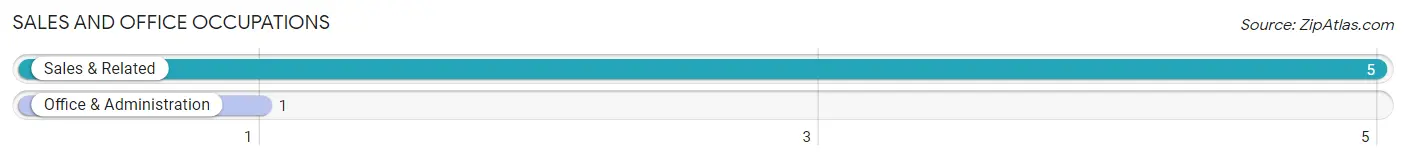
Sales and Office Occupations
The most common Sales and Office occupations in Manter are Sales & Related (5 | 7.1%), and Office & Administration (1 | 1.4%).
Sales and Office Occupations by Sex
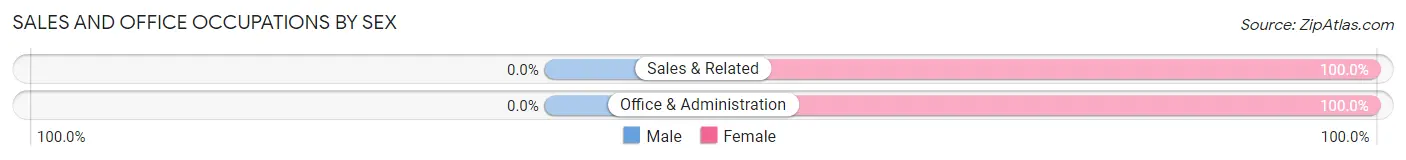
| Occupation | Male | Female |
| Sales & Related | 0 (0.0%) | 5 (100.0%) |
| Office & Administration | 0 (0.0%) | 1 (100.0%) |
| Total (Category) | 0 (0.0%) | 6 (100.0%) |
| Total (Overall) | 20 (28.6%) | 50 (71.4%) |
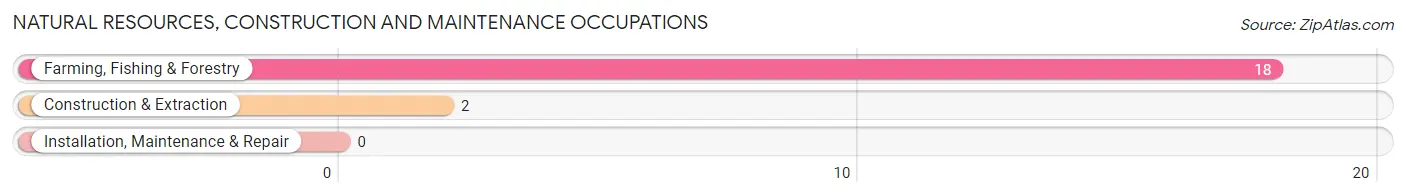
Natural Resources, Construction and Maintenance Occupations
The most common Natural Resources, Construction and Maintenance occupations in Manter are Farming, Fishing & Forestry (18 | 25.7%), and Construction & Extraction (2 | 2.9%).
Natural Resources, Construction and Maintenance Occupations by Sex
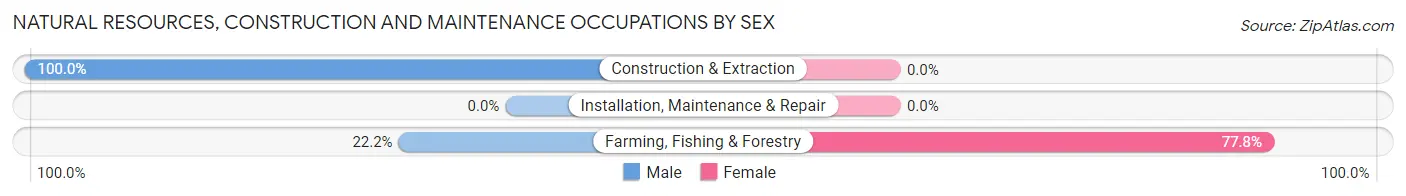
| Occupation | Male | Female |
| Farming, Fishing & Forestry | 4 (22.2%) | 14 (77.8%) |
| Construction & Extraction | 2 (100.0%) | 0 (0.0%) |
| Installation, Maintenance & Repair | 0 (0.0%) | 0 (0.0%) |
| Total (Category) | 6 (30.0%) | 14 (70.0%) |
| Total (Overall) | 20 (28.6%) | 50 (71.4%) |
Production, Transportation and Moving Occupations
The most common Production, Transportation and Moving occupations in Manter are , and Transportation (2 | 2.9%).
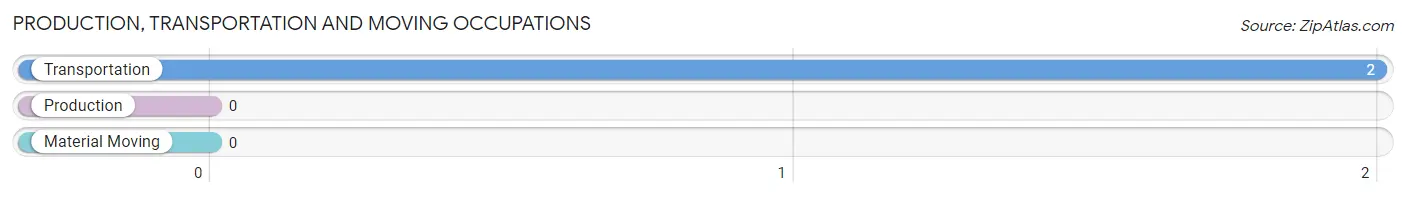
Production, Transportation and Moving Occupations by Sex

| Occupation | Male | Female |
| Production | 0 (0.0%) | 0 (0.0%) |
| Transportation | 0 (0.0%) | 2 (100.0%) |
| Material Moving | 0 (0.0%) | 0 (0.0%) |
| Total (Category) | 0 (0.0%) | 2 (100.0%) |
| Total (Overall) | 20 (28.6%) | 50 (71.4%) |
Employment Industries by Sex in Manter
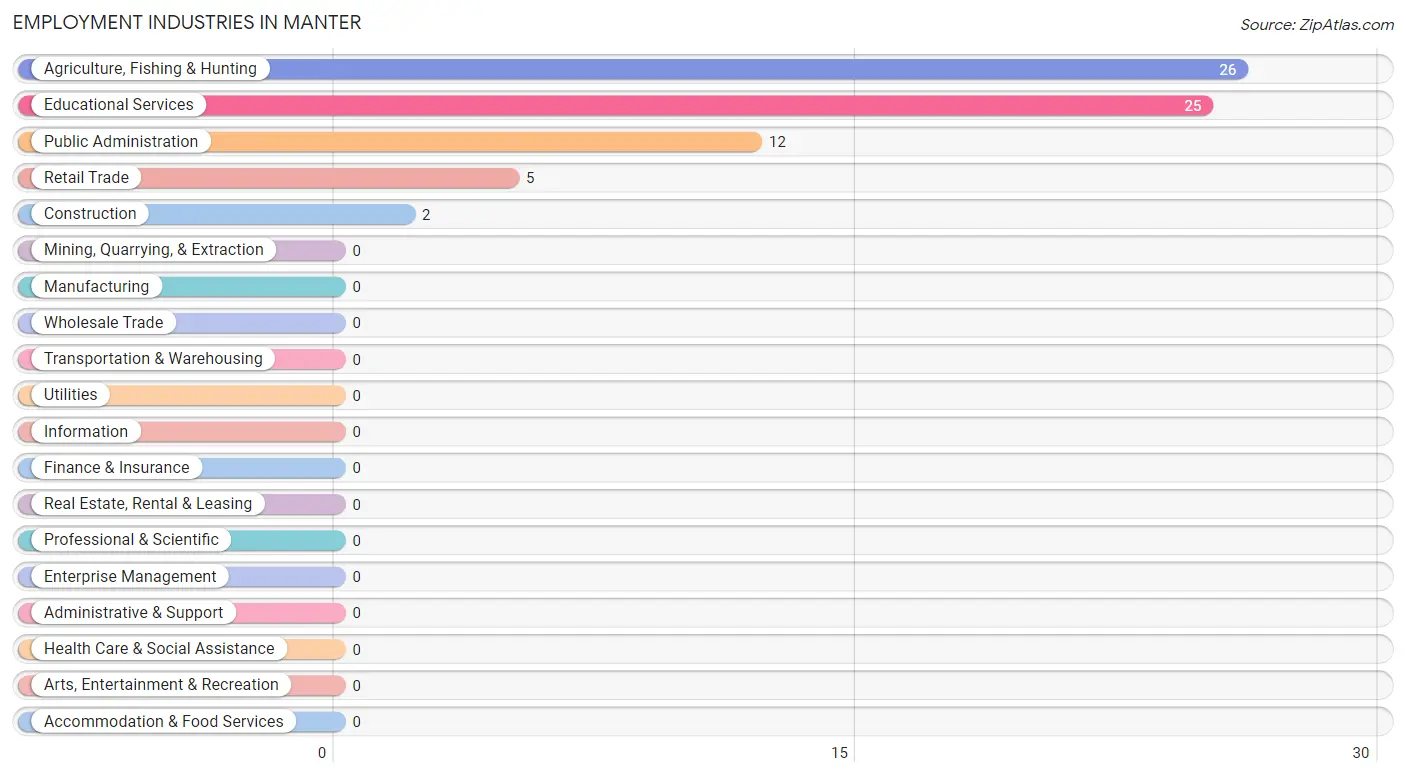
Employment Industries in Manter
The major employment industries in Manter include Agriculture, Fishing & Hunting (26 | 37.1%), Educational Services (25 | 35.7%), Public Administration (12 | 17.1%), Retail Trade (5 | 7.1%), and Construction (2 | 2.9%).
Employment Industries by Sex in Manter
The Manter industries that see more men than women are Construction (100.0%), Agriculture, Fishing & Hunting (42.3%), and Public Administration (41.7%), whereas the industries that tend to have a higher number of women are Retail Trade (100.0%), Educational Services (92.0%), and Public Administration (58.3%).
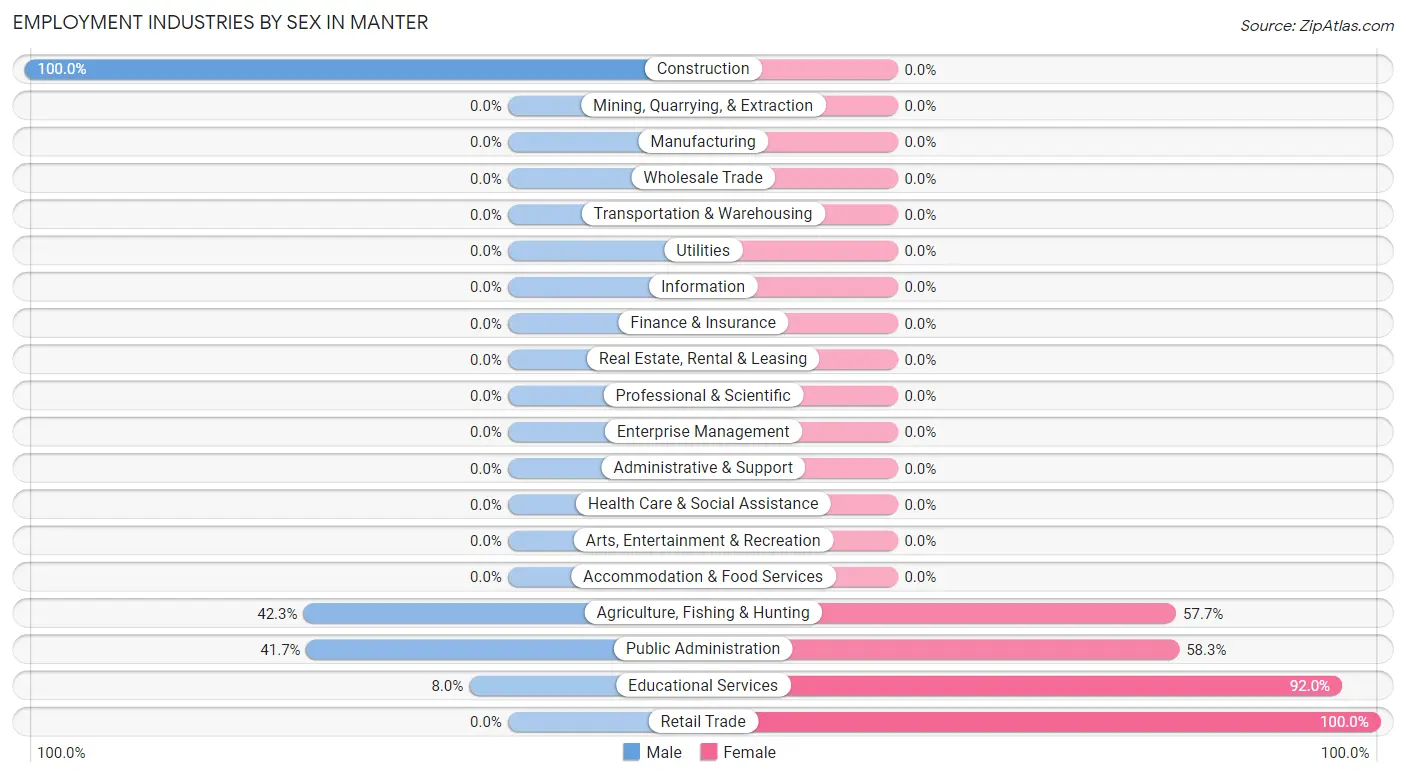
| Industry | Male | Female |
| Agriculture, Fishing & Hunting | 11 (42.3%) | 15 (57.7%) |
| Mining, Quarrying, & Extraction | 0 (0.0%) | 0 (0.0%) |
| Construction | 2 (100.0%) | 0 (0.0%) |
| Manufacturing | 0 (0.0%) | 0 (0.0%) |
| Wholesale Trade | 0 (0.0%) | 0 (0.0%) |
| Retail Trade | 0 (0.0%) | 5 (100.0%) |
| Transportation & Warehousing | 0 (0.0%) | 0 (0.0%) |
| Utilities | 0 (0.0%) | 0 (0.0%) |
| Information | 0 (0.0%) | 0 (0.0%) |
| Finance & Insurance | 0 (0.0%) | 0 (0.0%) |
| Real Estate, Rental & Leasing | 0 (0.0%) | 0 (0.0%) |
| Professional & Scientific | 0 (0.0%) | 0 (0.0%) |
| Enterprise Management | 0 (0.0%) | 0 (0.0%) |
| Administrative & Support | 0 (0.0%) | 0 (0.0%) |
| Educational Services | 2 (8.0%) | 23 (92.0%) |
| Health Care & Social Assistance | 0 (0.0%) | 0 (0.0%) |
| Arts, Entertainment & Recreation | 0 (0.0%) | 0 (0.0%) |
| Accommodation & Food Services | 0 (0.0%) | 0 (0.0%) |
| Public Administration | 5 (41.7%) | 7 (58.3%) |
| Total | 20 (28.6%) | 50 (71.4%) |
Education in Manter
School Enrollment in Manter
The most common levels of schooling among the 20 students in Manter are elementary school (10 | 50.0%), nursery / preschool (5 | 25.0%), and middle school (5 | 25.0%).
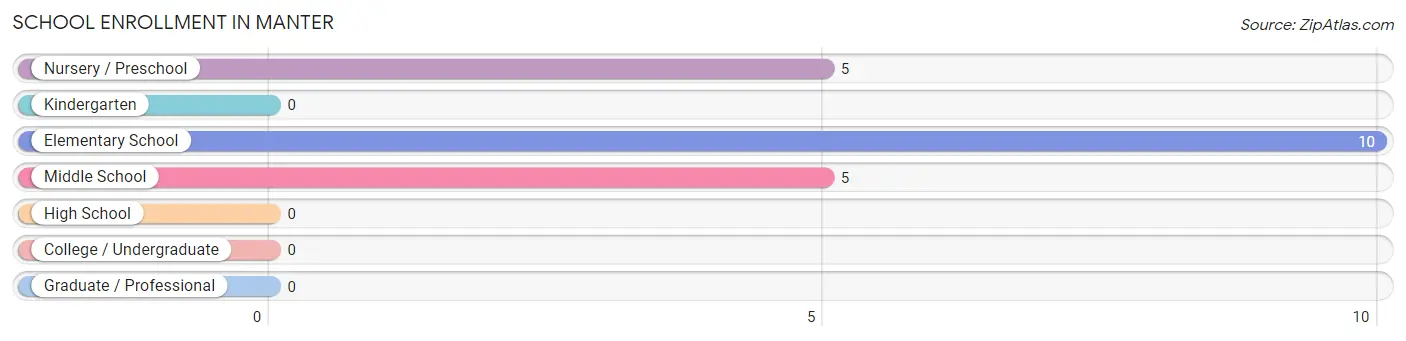
| School Level | # Students | % Students |
| Nursery / Preschool | 5 | 25.0% |
| Kindergarten | 0 | 0.0% |
| Elementary School | 10 | 50.0% |
| Middle School | 5 | 25.0% |
| High School | 0 | 0.0% |
| College / Undergraduate | 0 | 0.0% |
| Graduate / Professional | 0 | 0.0% |
| Total | 20 | 100.0% |
School Enrollment by Age by Funding Source in Manter
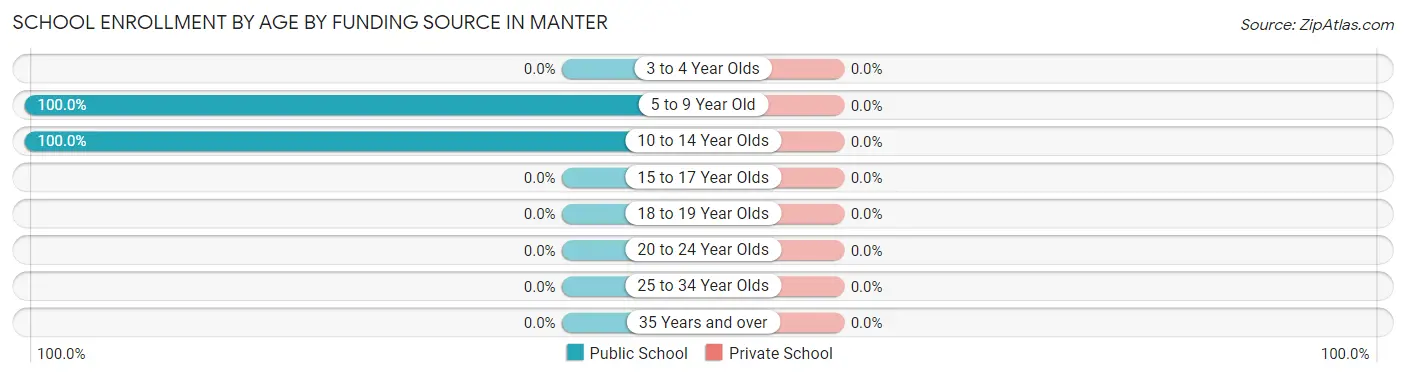
| Age Bracket | Public School | Private School |
| 3 to 4 Year Olds | 0 (0.0%) | 0 (0.0%) |
| 5 to 9 Year Old | 11 (100.0%) | 0 (0.0%) |
| 10 to 14 Year Olds | 9 (100.0%) | 0 (0.0%) |
| 15 to 17 Year Olds | 0 (0.0%) | 0 (0.0%) |
| 18 to 19 Year Olds | 0 (0.0%) | 0 (0.0%) |
| 20 to 24 Year Olds | 0 (0.0%) | 0 (0.0%) |
| 25 to 34 Year Olds | 0 (0.0%) | 0 (0.0%) |
| 35 Years and over | 0 (0.0%) | 0 (0.0%) |
| Total | 20 (100.0%) | 0 (0.0%) |
Educational Attainment by Field of Study in Manter
Education (10 | 58.8%), bio, nature & agricultural (5 | 29.4%), and physical & health sciences (2 | 11.8%) are the most common fields of study among 17 individuals in Manter who have obtained a bachelor's degree or higher.
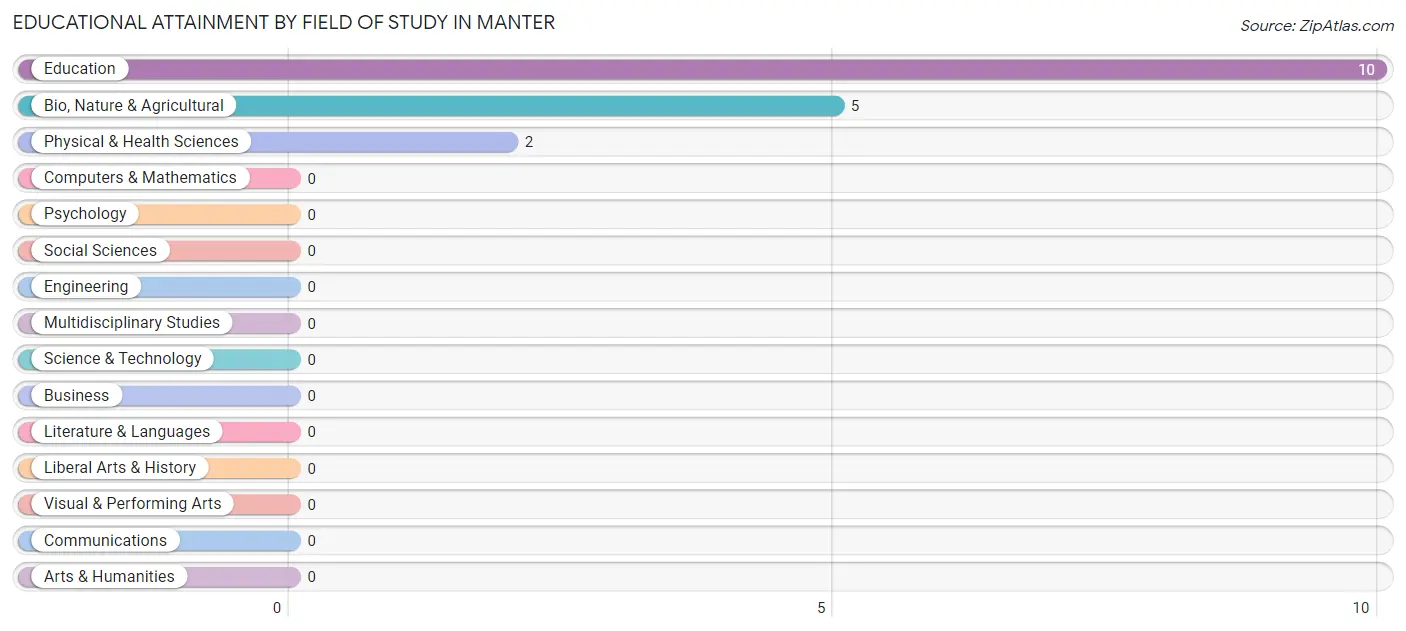
| Field of Study | # Graduates | % Graduates |
| Computers & Mathematics | 0 | 0.0% |
| Bio, Nature & Agricultural | 5 | 29.4% |
| Physical & Health Sciences | 2 | 11.8% |
| Psychology | 0 | 0.0% |
| Social Sciences | 0 | 0.0% |
| Engineering | 0 | 0.0% |
| Multidisciplinary Studies | 0 | 0.0% |
| Science & Technology | 0 | 0.0% |
| Business | 0 | 0.0% |
| Education | 10 | 58.8% |
| Literature & Languages | 0 | 0.0% |
| Liberal Arts & History | 0 | 0.0% |
| Visual & Performing Arts | 0 | 0.0% |
| Communications | 0 | 0.0% |
| Arts & Humanities | 0 | 0.0% |
| Total | 17 | 100.0% |
Transportation & Commute in Manter
Vehicle Availability by Sex in Manter
The most prevalent vehicle ownership categories in Manter are males with 3 vehicles (9, accounting for 45.0%) and females with 3 vehicles (26, making up 18.0%).
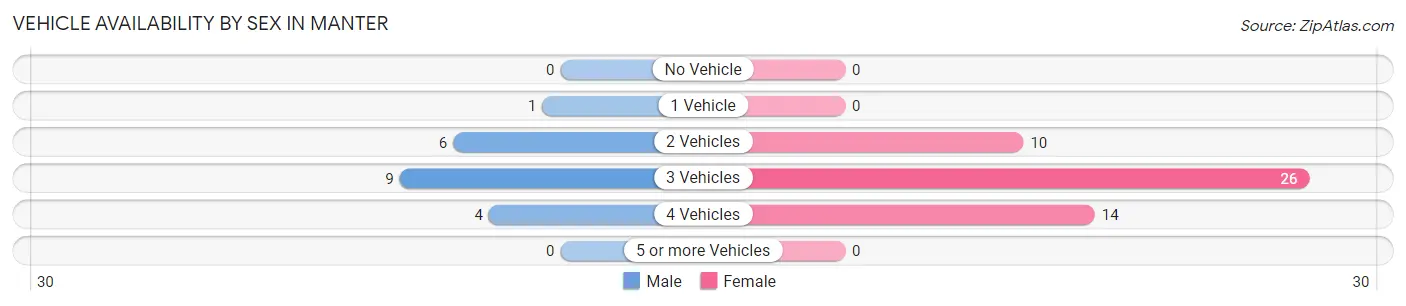
| Vehicles Available | Male | Female |
| No Vehicle | 0 (0.0%) | 0 (0.0%) |
| 1 Vehicle | 1 (5.0%) | 0 (0.0%) |
| 2 Vehicles | 6 (30.0%) | 10 (20.0%) |
| 3 Vehicles | 9 (45.0%) | 26 (52.0%) |
| 4 Vehicles | 4 (20.0%) | 14 (28.0%) |
| 5 or more Vehicles | 0 (0.0%) | 0 (0.0%) |
| Total | 20 (100.0%) | 50 (100.0%) |
Commute Time in Manter
The most frequently occuring commute durations in Manter are 30 to 34 minutes (21 commuters, 30.0%), 15 to 19 minutes (17 commuters, 24.3%), and 20 to 24 minutes (15 commuters, 21.4%).
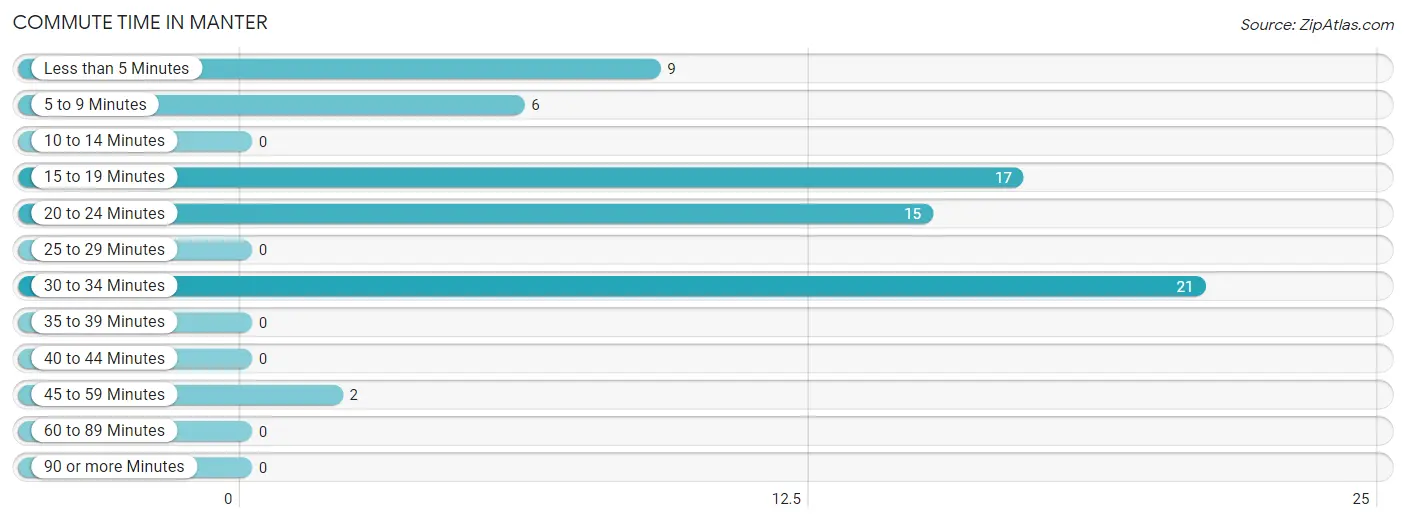
| Commute Time | # Commuters | % Commuters |
| Less than 5 Minutes | 9 | 12.9% |
| 5 to 9 Minutes | 6 | 8.6% |
| 10 to 14 Minutes | 0 | 0.0% |
| 15 to 19 Minutes | 17 | 24.3% |
| 20 to 24 Minutes | 15 | 21.4% |
| 25 to 29 Minutes | 0 | 0.0% |
| 30 to 34 Minutes | 21 | 30.0% |
| 35 to 39 Minutes | 0 | 0.0% |
| 40 to 44 Minutes | 0 | 0.0% |
| 45 to 59 Minutes | 2 | 2.9% |
| 60 to 89 Minutes | 0 | 0.0% |
| 90 or more Minutes | 0 | 0.0% |
Commute Time by Sex in Manter
The most common commute times in Manter are 15 to 19 minutes (10 commuters, 50.0%) for males and 30 to 34 minutes (21 commuters, 42.0%) for females.
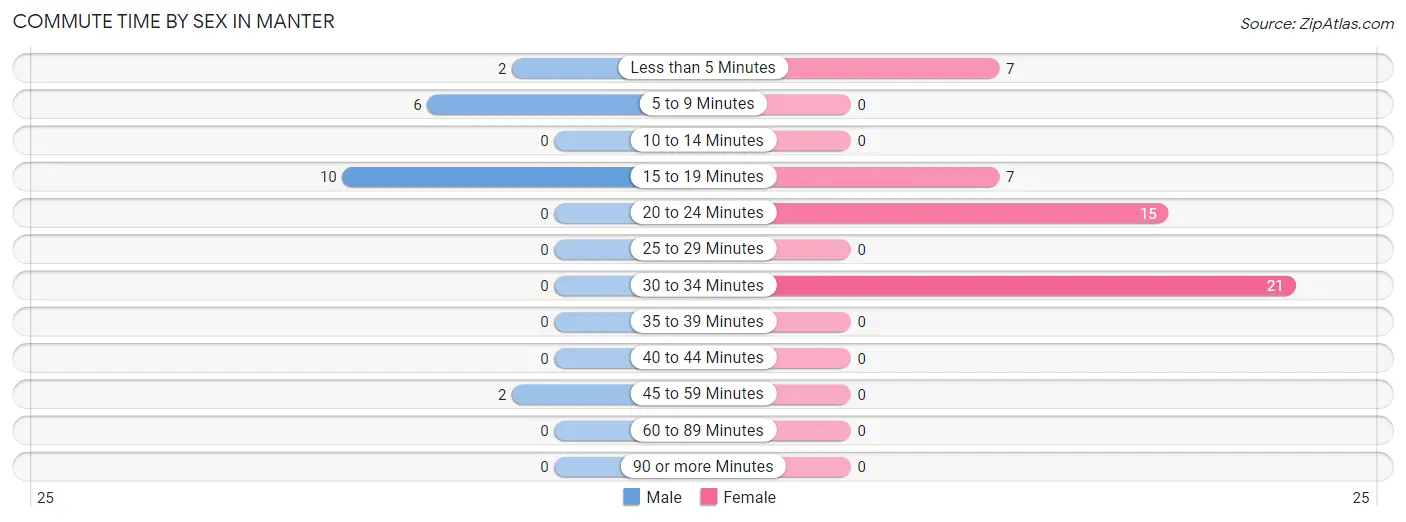
| Commute Time | Male | Female |
| Less than 5 Minutes | 2 (10.0%) | 7 (14.0%) |
| 5 to 9 Minutes | 6 (30.0%) | 0 (0.0%) |
| 10 to 14 Minutes | 0 (0.0%) | 0 (0.0%) |
| 15 to 19 Minutes | 10 (50.0%) | 7 (14.0%) |
| 20 to 24 Minutes | 0 (0.0%) | 15 (30.0%) |
| 25 to 29 Minutes | 0 (0.0%) | 0 (0.0%) |
| 30 to 34 Minutes | 0 (0.0%) | 21 (42.0%) |
| 35 to 39 Minutes | 0 (0.0%) | 0 (0.0%) |
| 40 to 44 Minutes | 0 (0.0%) | 0 (0.0%) |
| 45 to 59 Minutes | 2 (10.0%) | 0 (0.0%) |
| 60 to 89 Minutes | 0 (0.0%) | 0 (0.0%) |
| 90 or more Minutes | 0 (0.0%) | 0 (0.0%) |
Time of Departure to Work by Sex in Manter
The most frequent times of departure to work in Manter are 6:00 AM to 6:29 AM (11, 55.0%) for males and 7:00 AM to 7:29 AM (35, 70.0%) for females.
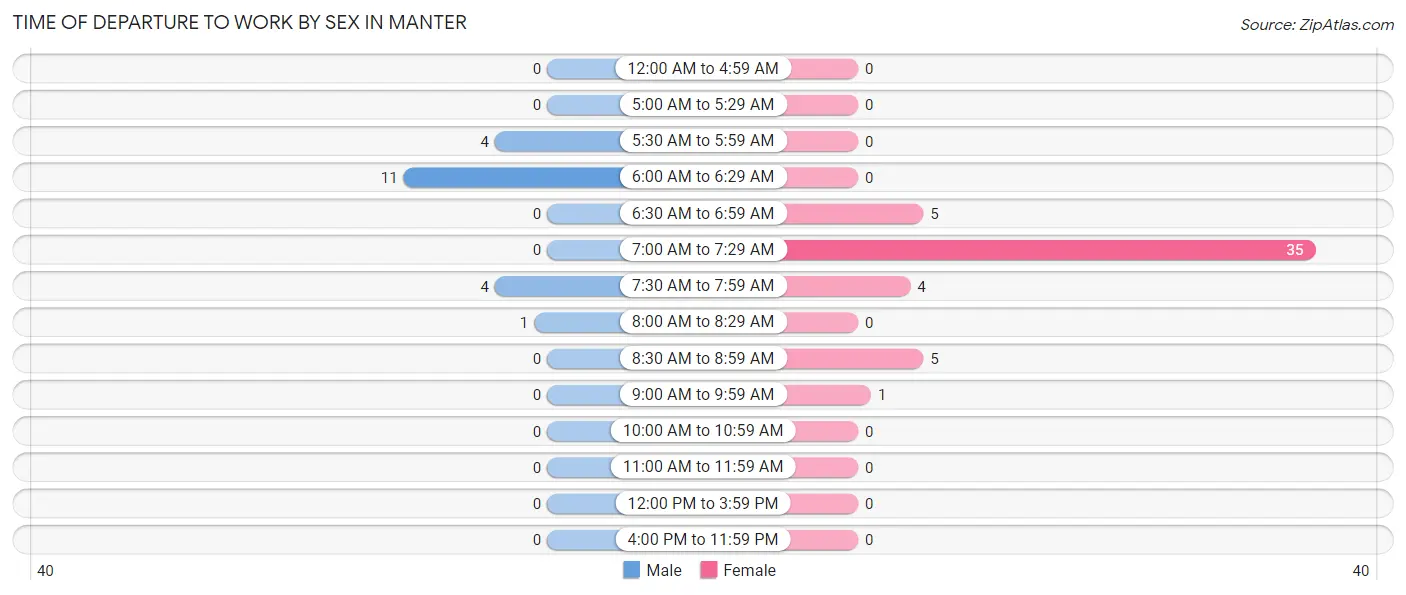
| Time of Departure | Male | Female |
| 12:00 AM to 4:59 AM | 0 (0.0%) | 0 (0.0%) |
| 5:00 AM to 5:29 AM | 0 (0.0%) | 0 (0.0%) |
| 5:30 AM to 5:59 AM | 4 (20.0%) | 0 (0.0%) |
| 6:00 AM to 6:29 AM | 11 (55.0%) | 0 (0.0%) |
| 6:30 AM to 6:59 AM | 0 (0.0%) | 5 (10.0%) |
| 7:00 AM to 7:29 AM | 0 (0.0%) | 35 (70.0%) |
| 7:30 AM to 7:59 AM | 4 (20.0%) | 4 (8.0%) |
| 8:00 AM to 8:29 AM | 1 (5.0%) | 0 (0.0%) |
| 8:30 AM to 8:59 AM | 0 (0.0%) | 5 (10.0%) |
| 9:00 AM to 9:59 AM | 0 (0.0%) | 1 (2.0%) |
| 10:00 AM to 10:59 AM | 0 (0.0%) | 0 (0.0%) |
| 11:00 AM to 11:59 AM | 0 (0.0%) | 0 (0.0%) |
| 12:00 PM to 3:59 PM | 0 (0.0%) | 0 (0.0%) |
| 4:00 PM to 11:59 PM | 0 (0.0%) | 0 (0.0%) |
| Total | 20 (100.0%) | 50 (100.0%) |
Housing Occupancy in Manter
Occupancy by Ownership in Manter
Of the total 59 dwellings in Manter, owner-occupied units account for 52 (88.1%), while renter-occupied units make up 7 (11.9%).
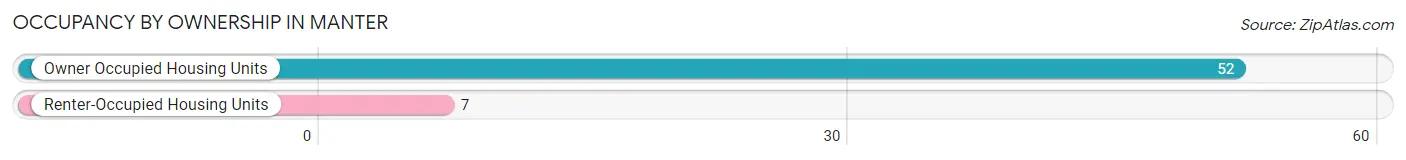
| Occupancy | # Housing Units | % Housing Units |
| Owner Occupied Housing Units | 52 | 88.1% |
| Renter-Occupied Housing Units | 7 | 11.9% |
| Total Occupied Housing Units | 59 | 100.0% |
Occupancy by Household Size in Manter

| Household Size | # Housing Units | % Housing Units |
| 1-Person Household | 20 | 33.9% |
| 2-Person Household | 24 | 40.7% |
| 3-Person Household | 6 | 10.2% |
| 4+ Person Household | 9 | 15.2% |
| Total Housing Units | 59 | 100.0% |
Occupancy by Ownership by Household Size in Manter
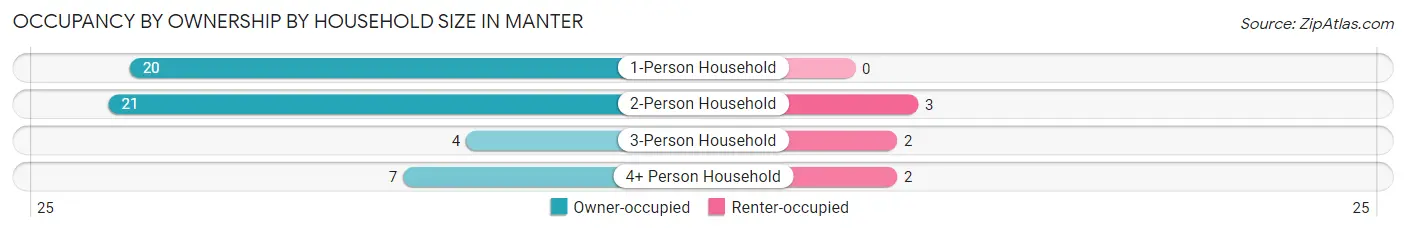
| Household Size | Owner-occupied | Renter-occupied |
| 1-Person Household | 20 (100.0%) | 0 (0.0%) |
| 2-Person Household | 21 (87.5%) | 3 (12.5%) |
| 3-Person Household | 4 (66.7%) | 2 (33.3%) |
| 4+ Person Household | 7 (77.8%) | 2 (22.2%) |
| Total Housing Units | 52 (88.1%) | 7 (11.9%) |
Occupancy by Educational Attainment in Manter
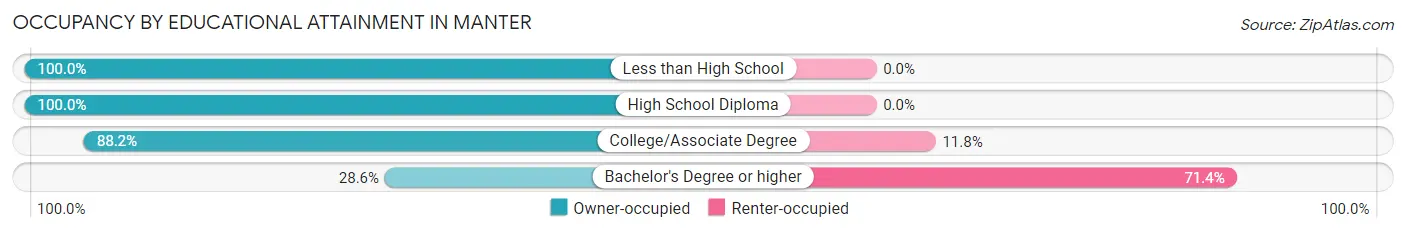
| Household Size | Owner-occupied | Renter-occupied |
| Less than High School | 2 (100.0%) | 0 (0.0%) |
| High School Diploma | 33 (100.0%) | 0 (0.0%) |
| College/Associate Degree | 15 (88.2%) | 2 (11.8%) |
| Bachelor's Degree or higher | 2 (28.6%) | 5 (71.4%) |
Occupancy by Age of Householder in Manter
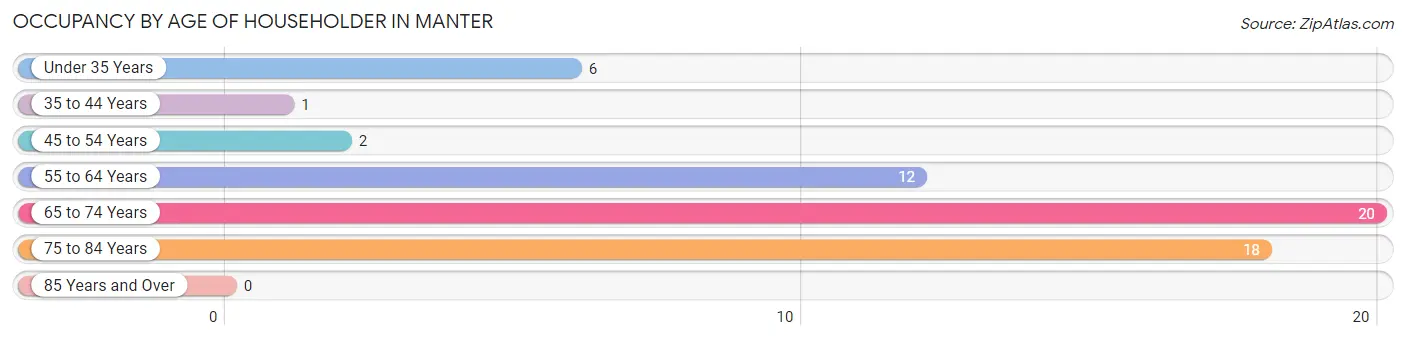
| Age Bracket | # Households | % Households |
| Under 35 Years | 6 | 10.2% |
| 35 to 44 Years | 1 | 1.7% |
| 45 to 54 Years | 2 | 3.4% |
| 55 to 64 Years | 12 | 20.3% |
| 65 to 74 Years | 20 | 33.9% |
| 75 to 84 Years | 18 | 30.5% |
| 85 Years and Over | 0 | 0.0% |
| Total | 59 | 100.0% |
Housing Finances in Manter
Median Income by Occupancy in Manter
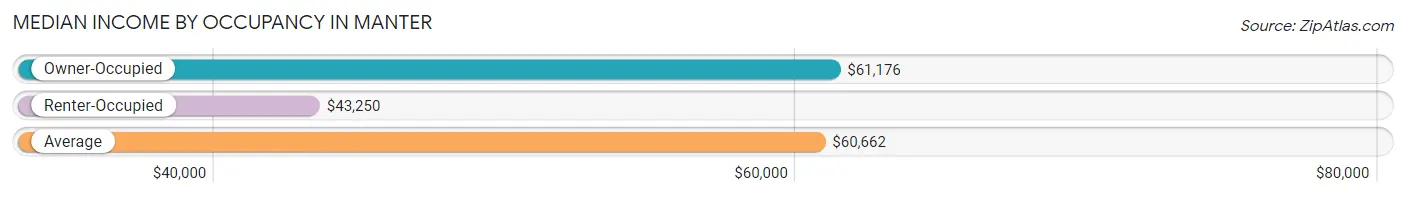
| Occupancy Type | # Households | Median Income |
| Owner-Occupied | 52 (88.1%) | $61,176 |
| Renter-Occupied | 7 (11.9%) | $43,250 |
| Average | 59 (100.0%) | $60,662 |
Occupancy by Householder Income Bracket in Manter
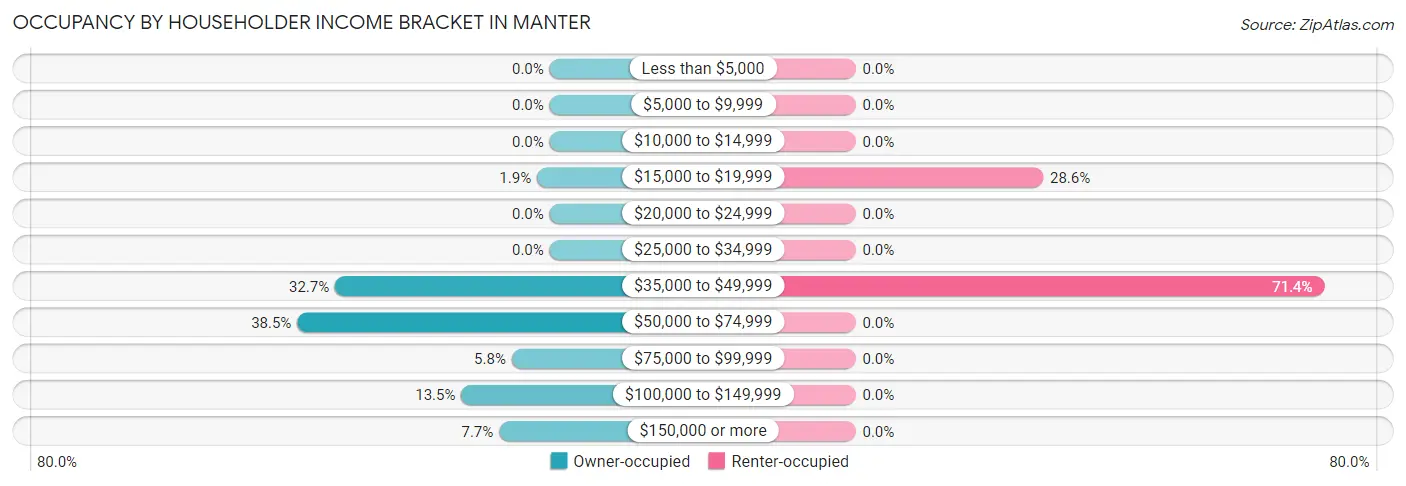
| Income Bracket | Owner-occupied | Renter-occupied |
| Less than $5,000 | 0 (0.0%) | 0 (0.0%) |
| $5,000 to $9,999 | 0 (0.0%) | 0 (0.0%) |
| $10,000 to $14,999 | 0 (0.0%) | 0 (0.0%) |
| $15,000 to $19,999 | 1 (1.9%) | 2 (28.6%) |
| $20,000 to $24,999 | 0 (0.0%) | 0 (0.0%) |
| $25,000 to $34,999 | 0 (0.0%) | 0 (0.0%) |
| $35,000 to $49,999 | 17 (32.7%) | 5 (71.4%) |
| $50,000 to $74,999 | 20 (38.5%) | 0 (0.0%) |
| $75,000 to $99,999 | 3 (5.8%) | 0 (0.0%) |
| $100,000 to $149,999 | 7 (13.5%) | 0 (0.0%) |
| $150,000 or more | 4 (7.7%) | 0 (0.0%) |
| Total | 52 (100.0%) | 7 (100.0%) |
Monthly Housing Cost Tiers in Manter
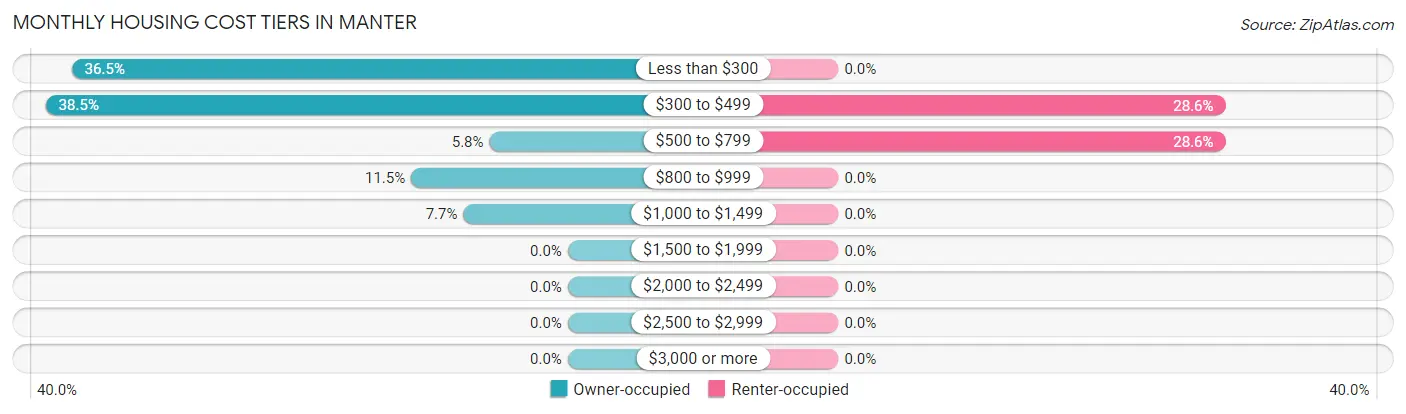
| Monthly Cost | Owner-occupied | Renter-occupied |
| Less than $300 | 19 (36.5%) | 0 (0.0%) |
| $300 to $499 | 20 (38.5%) | 2 (28.6%) |
| $500 to $799 | 3 (5.8%) | 2 (28.6%) |
| $800 to $999 | 6 (11.5%) | 0 (0.0%) |
| $1,000 to $1,499 | 4 (7.7%) | 0 (0.0%) |
| $1,500 to $1,999 | 0 (0.0%) | 0 (0.0%) |
| $2,000 to $2,499 | 0 (0.0%) | 0 (0.0%) |
| $2,500 to $2,999 | 0 (0.0%) | 0 (0.0%) |
| $3,000 or more | 0 (0.0%) | 0 (0.0%) |
| Total | 52 (100.0%) | 7 (100.0%) |
Physical Housing Characteristics in Manter
Housing Structures in Manter
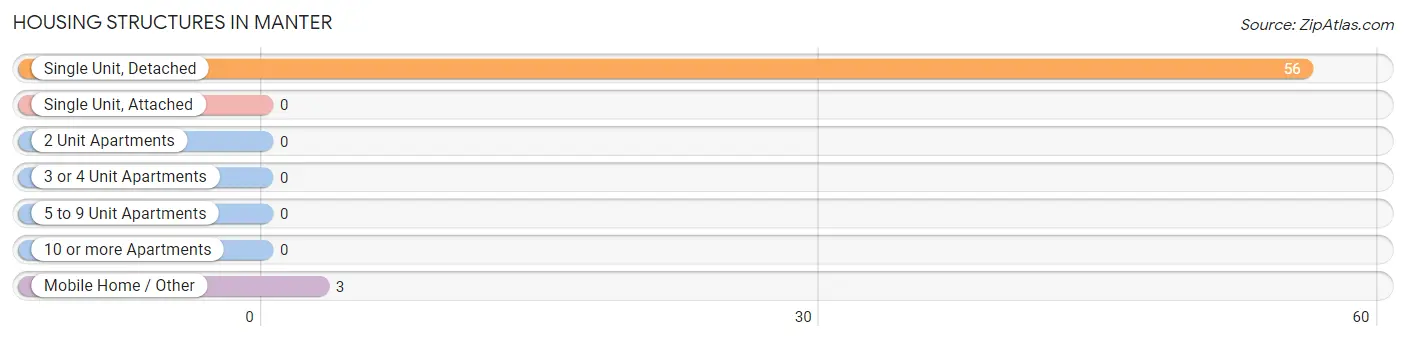
| Structure Type | # Housing Units | % Housing Units |
| Single Unit, Detached | 56 | 94.9% |
| Single Unit, Attached | 0 | 0.0% |
| 2 Unit Apartments | 0 | 0.0% |
| 3 or 4 Unit Apartments | 0 | 0.0% |
| 5 to 9 Unit Apartments | 0 | 0.0% |
| 10 or more Apartments | 0 | 0.0% |
| Mobile Home / Other | 3 | 5.1% |
| Total | 59 | 100.0% |
Housing Structures by Occupancy in Manter
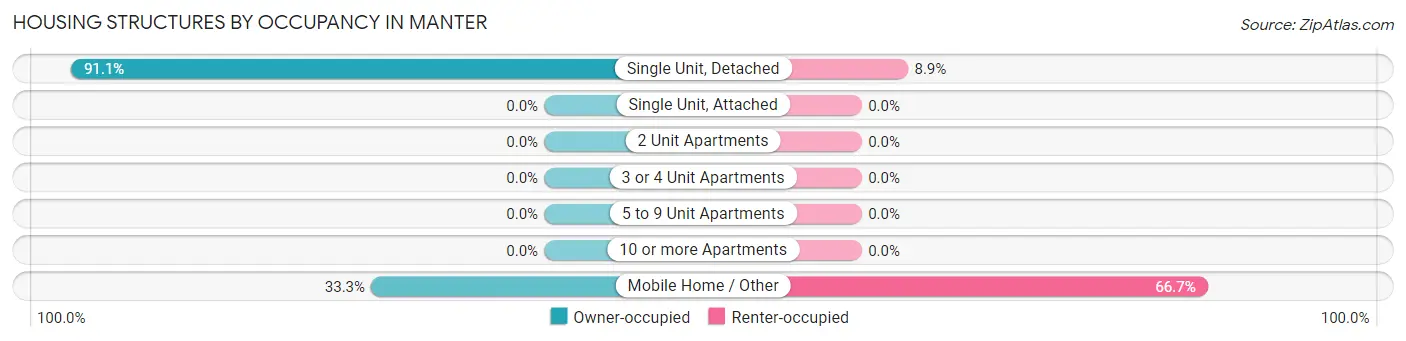
| Structure Type | Owner-occupied | Renter-occupied |
| Single Unit, Detached | 51 (91.1%) | 5 (8.9%) |
| Single Unit, Attached | 0 (0.0%) | 0 (0.0%) |
| 2 Unit Apartments | 0 (0.0%) | 0 (0.0%) |
| 3 or 4 Unit Apartments | 0 (0.0%) | 0 (0.0%) |
| 5 to 9 Unit Apartments | 0 (0.0%) | 0 (0.0%) |
| 10 or more Apartments | 0 (0.0%) | 0 (0.0%) |
| Mobile Home / Other | 1 (33.3%) | 2 (66.7%) |
| Total | 52 (88.1%) | 7 (11.9%) |
Housing Structures by Number of Rooms in Manter
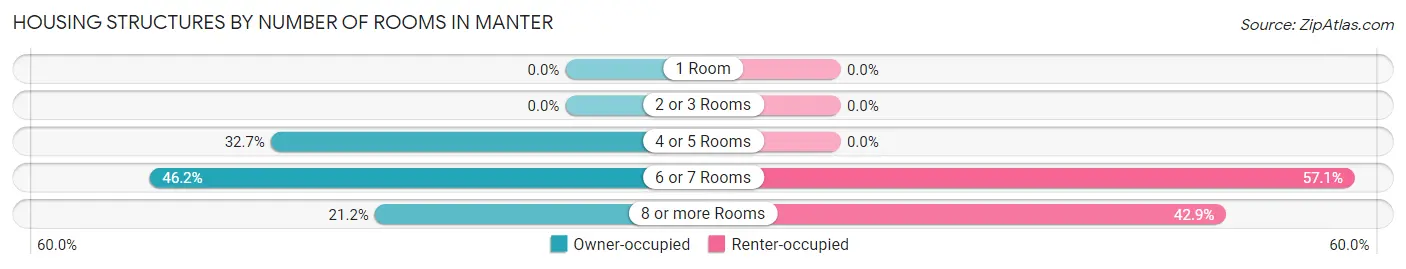
| Number of Rooms | Owner-occupied | Renter-occupied |
| 1 Room | 0 (0.0%) | 0 (0.0%) |
| 2 or 3 Rooms | 0 (0.0%) | 0 (0.0%) |
| 4 or 5 Rooms | 17 (32.7%) | 0 (0.0%) |
| 6 or 7 Rooms | 24 (46.2%) | 4 (57.1%) |
| 8 or more Rooms | 11 (21.1%) | 3 (42.9%) |
| Total | 52 (100.0%) | 7 (100.0%) |
Housing Structure by Heating Type in Manter
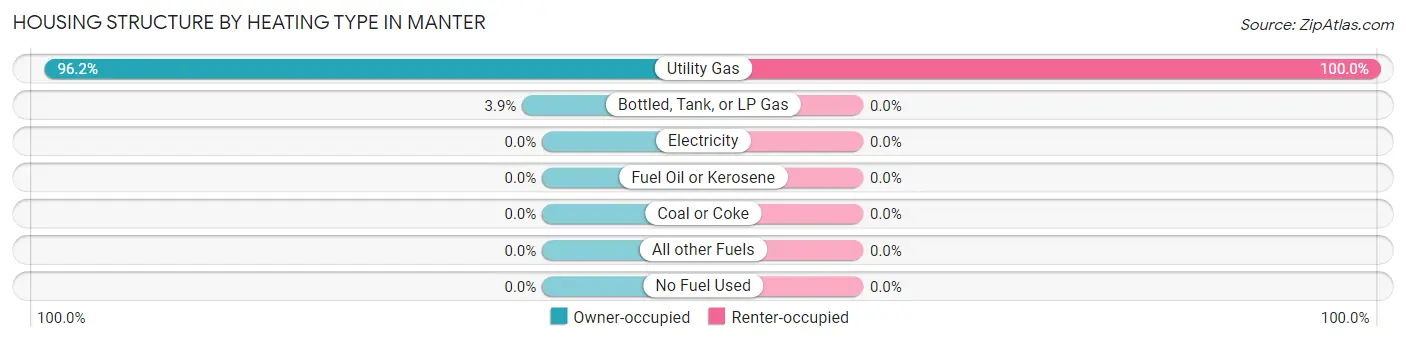
| Heating Type | Owner-occupied | Renter-occupied |
| Utility Gas | 50 (96.2%) | 7 (100.0%) |
| Bottled, Tank, or LP Gas | 2 (3.8%) | 0 (0.0%) |
| Electricity | 0 (0.0%) | 0 (0.0%) |
| Fuel Oil or Kerosene | 0 (0.0%) | 0 (0.0%) |
| Coal or Coke | 0 (0.0%) | 0 (0.0%) |
| All other Fuels | 0 (0.0%) | 0 (0.0%) |
| No Fuel Used | 0 (0.0%) | 0 (0.0%) |
| Total | 52 (100.0%) | 7 (100.0%) |
Household Vehicle Usage in Manter
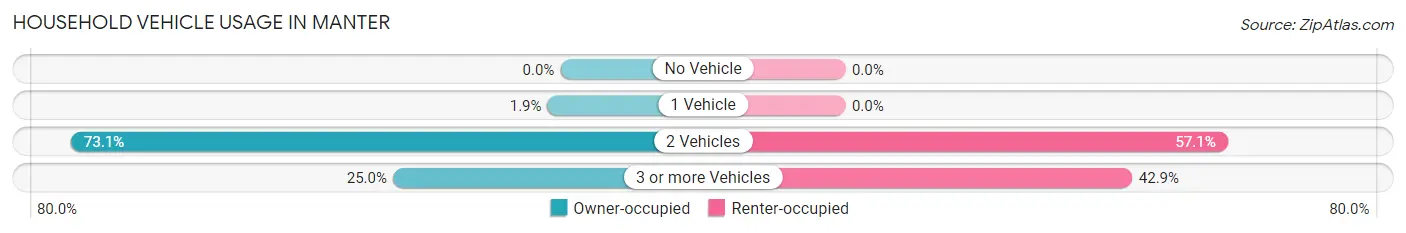
| Vehicles per Household | Owner-occupied | Renter-occupied |
| No Vehicle | 0 (0.0%) | 0 (0.0%) |
| 1 Vehicle | 1 (1.9%) | 0 (0.0%) |
| 2 Vehicles | 38 (73.1%) | 4 (57.1%) |
| 3 or more Vehicles | 13 (25.0%) | 3 (42.9%) |
| Total | 52 (100.0%) | 7 (100.0%) |
Real Estate & Mortgages in Manter
Real Estate and Mortgage Overview in Manter
| Characteristic | Without Mortgage | With Mortgage |
| Housing Units | 47 | 5 |
| Median Property Value | - | - |
| Median Household Income | $60,917 | $0 |
| Monthly Housing Costs | $365 | $0 |
| Real Estate Taxes | $660 | $0 |
Property Value by Mortgage Status in Manter
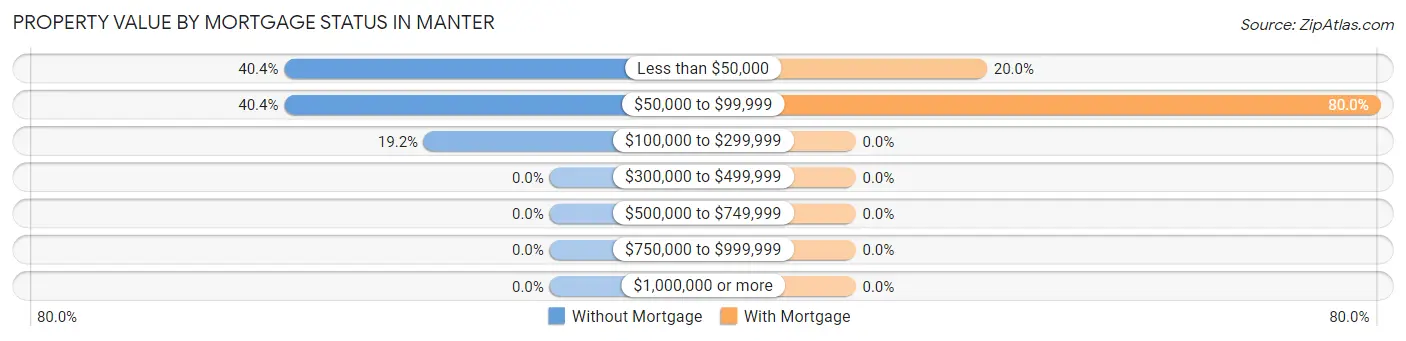
| Property Value | Without Mortgage | With Mortgage |
| Less than $50,000 | 19 (40.4%) | 1 (20.0%) |
| $50,000 to $99,999 | 19 (40.4%) | 4 (80.0%) |
| $100,000 to $299,999 | 9 (19.2%) | 0 (0.0%) |
| $300,000 to $499,999 | 0 (0.0%) | 0 (0.0%) |
| $500,000 to $749,999 | 0 (0.0%) | 0 (0.0%) |
| $750,000 to $999,999 | 0 (0.0%) | 0 (0.0%) |
| $1,000,000 or more | 0 (0.0%) | 0 (0.0%) |
| Total | 47 (100.0%) | 5 (100.0%) |
Household Income by Mortgage Status in Manter
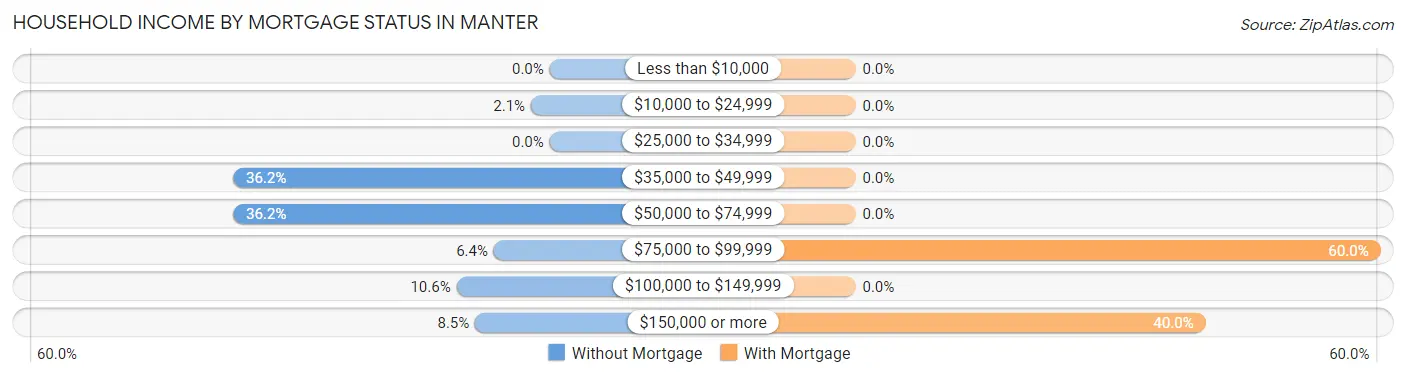
| Household Income | Without Mortgage | With Mortgage |
| Less than $10,000 | 0 (0.0%) | 0 (0.0%) |
| $10,000 to $24,999 | 1 (2.1%) | 0 (0.0%) |
| $25,000 to $34,999 | 0 (0.0%) | 0 (0.0%) |
| $35,000 to $49,999 | 17 (36.2%) | 0 (0.0%) |
| $50,000 to $74,999 | 17 (36.2%) | 0 (0.0%) |
| $75,000 to $99,999 | 3 (6.4%) | 3 (60.0%) |
| $100,000 to $149,999 | 5 (10.6%) | 0 (0.0%) |
| $150,000 or more | 4 (8.5%) | 2 (40.0%) |
| Total | 47 (100.0%) | 5 (100.0%) |
Property Value to Household Income Ratio in Manter
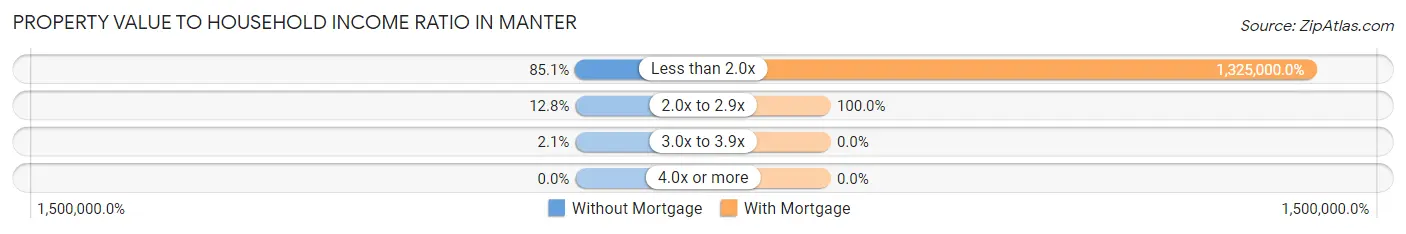
| Value-to-Income Ratio | Without Mortgage | With Mortgage |
| Less than 2.0x | 40 (85.1%) | 66,250 (1,325,000.0%) |
| 2.0x to 2.9x | 6 (12.8%) | 5 (100.0%) |
| 3.0x to 3.9x | 1 (2.1%) | 0 (0.0%) |
| 4.0x or more | 0 (0.0%) | 0 (0.0%) |
| Total | 47 (100.0%) | 5 (100.0%) |
Real Estate Taxes by Mortgage Status in Manter
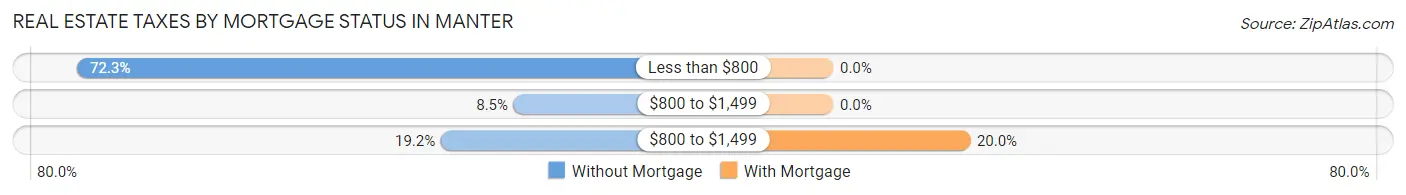
| Property Taxes | Without Mortgage | With Mortgage |
| Less than $800 | 34 (72.3%) | 0 (0.0%) |
| $800 to $1,499 | 4 (8.5%) | 0 (0.0%) |
| $800 to $1,499 | 9 (19.2%) | 1 (20.0%) |
| Total | 47 (100.0%) | 5 (100.0%) |
Health & Disability in Manter
Health Insurance Coverage by Age in Manter
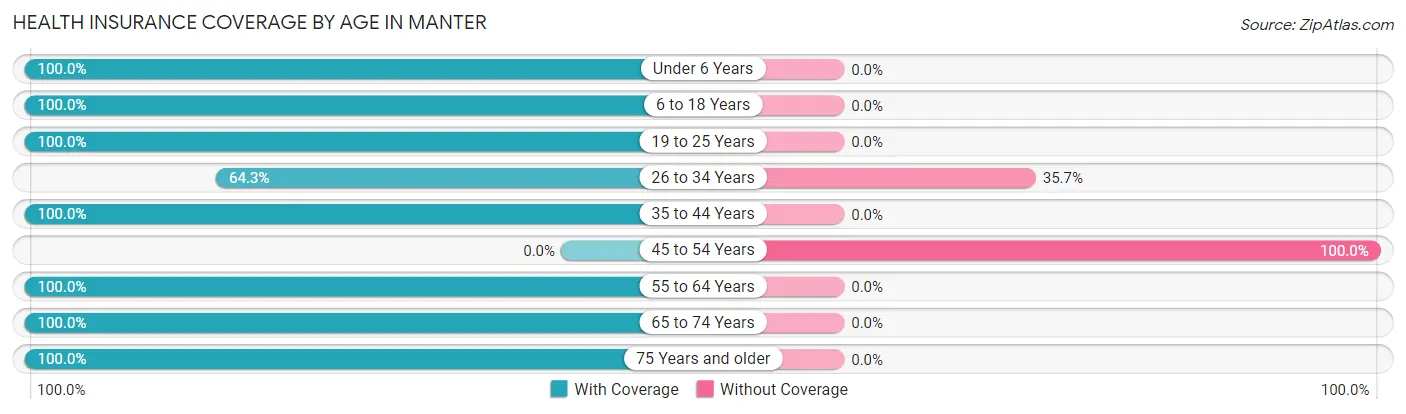
| Age Bracket | With Coverage | Without Coverage |
| Under 6 Years | 19 (100.0%) | 0 (0.0%) |
| 6 to 18 Years | 15 (100.0%) | 0 (0.0%) |
| 19 to 25 Years | 21 (100.0%) | 0 (0.0%) |
| 26 to 34 Years | 9 (64.3%) | 5 (35.7%) |
| 35 to 44 Years | 1 (100.0%) | 0 (0.0%) |
| 45 to 54 Years | 0 (0.0%) | 2 (100.0%) |
| 55 to 64 Years | 37 (100.0%) | 0 (0.0%) |
| 65 to 74 Years | 44 (100.0%) | 0 (0.0%) |
| 75 Years and older | 37 (100.0%) | 0 (0.0%) |
| Total | 183 (96.3%) | 7 (3.7%) |
Health Insurance Coverage by Citizenship Status in Manter
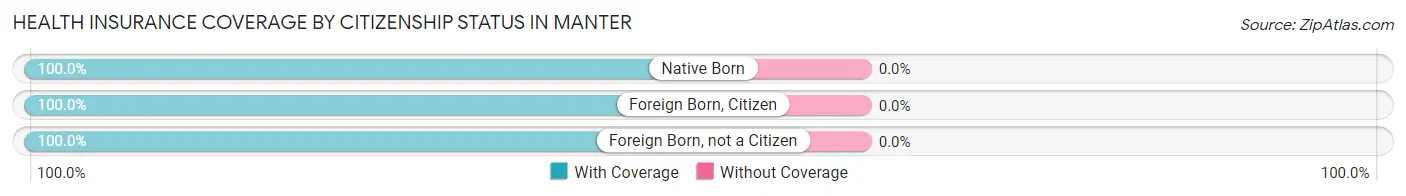
| Citizenship Status | With Coverage | Without Coverage |
| Native Born | 19 (100.0%) | 0 (0.0%) |
| Foreign Born, Citizen | 15 (100.0%) | 0 (0.0%) |
| Foreign Born, not a Citizen | 21 (100.0%) | 0 (0.0%) |
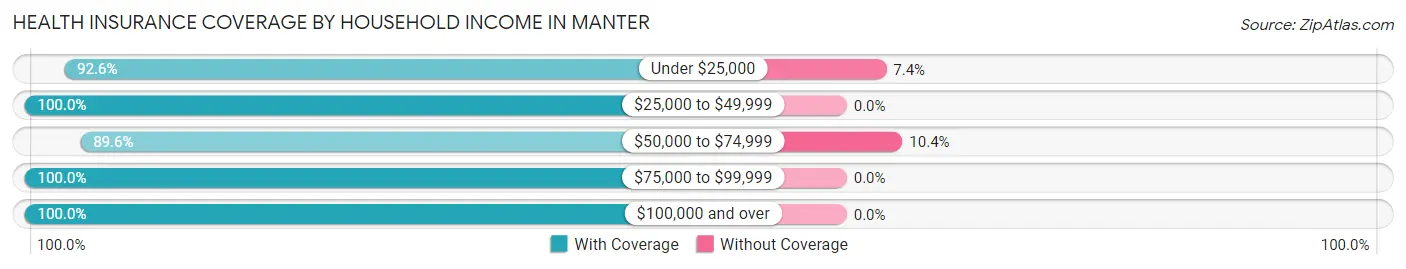
Health Insurance Coverage by Household Income in Manter
| Household Income | With Coverage | Without Coverage |
| Under $25,000 | 25 (92.6%) | 2 (7.4%) |
| $25,000 to $49,999 | 28 (100.0%) | 0 (0.0%) |
| $50,000 to $74,999 | 43 (89.6%) | 5 (10.4%) |
| $75,000 to $99,999 | 7 (100.0%) | 0 (0.0%) |
| $100,000 and over | 80 (100.0%) | 0 (0.0%) |
Public vs Private Health Insurance Coverage by Age in Manter
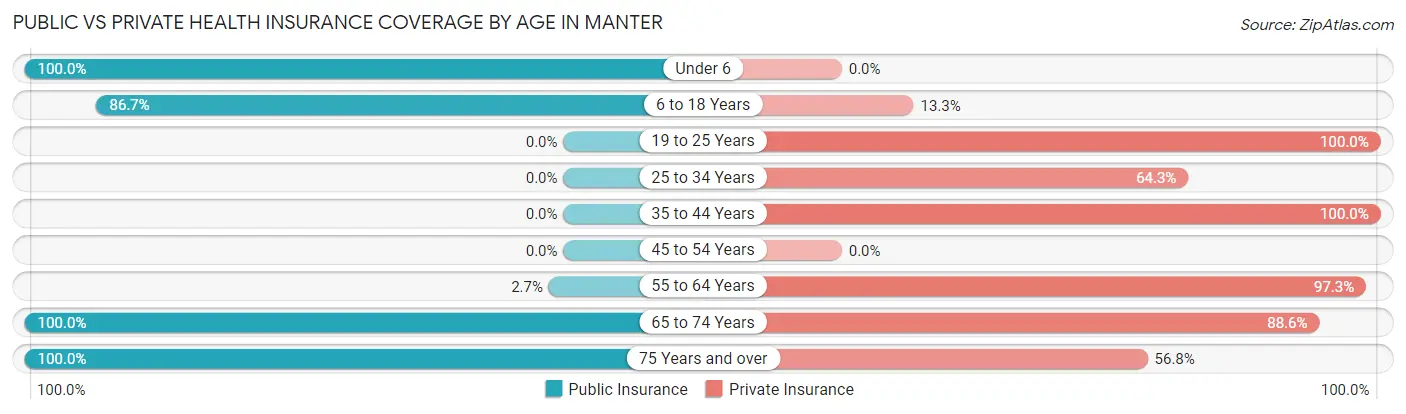
| Age Bracket | Public Insurance | Private Insurance |
| Under 6 | 19 (100.0%) | 0 (0.0%) |
| 6 to 18 Years | 13 (86.7%) | 2 (13.3%) |
| 19 to 25 Years | 0 (0.0%) | 21 (100.0%) |
| 25 to 34 Years | 0 (0.0%) | 9 (64.3%) |
| 35 to 44 Years | 0 (0.0%) | 1 (100.0%) |
| 45 to 54 Years | 0 (0.0%) | 0 (0.0%) |
| 55 to 64 Years | 1 (2.7%) | 36 (97.3%) |
| 65 to 74 Years | 44 (100.0%) | 39 (88.6%) |
| 75 Years and over | 37 (100.0%) | 21 (56.8%) |
| Total | 114 (60.0%) | 129 (67.9%) |
Disability Status by Sex by Age in Manter
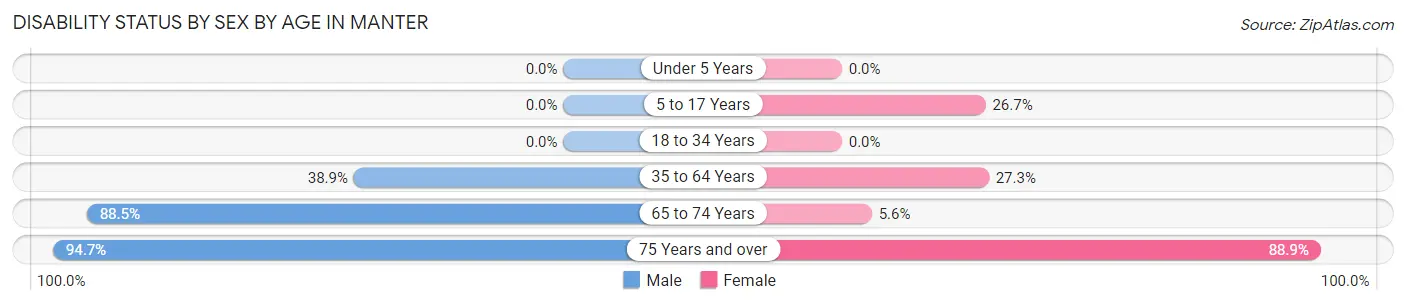
| Age Bracket | Male | Female |
| Under 5 Years | 0 (0.0%) | 0 (0.0%) |
| 5 to 17 Years | 0 (0.0%) | 4 (26.7%) |
| 18 to 34 Years | 0 (0.0%) | 0 (0.0%) |
| 35 to 64 Years | 7 (38.9%) | 6 (27.3%) |
| 65 to 74 Years | 23 (88.5%) | 1 (5.6%) |
| 75 Years and over | 18 (94.7%) | 16 (88.9%) |
Disability Class by Sex by Age in Manter
Disability Class: Hearing Difficulty
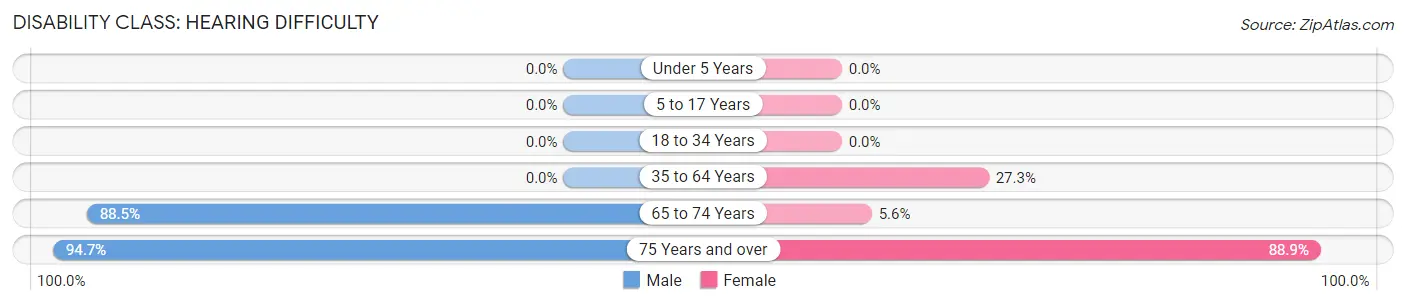
| Age Bracket | Male | Female |
| Under 5 Years | 0 (0.0%) | 0 (0.0%) |
| 5 to 17 Years | 0 (0.0%) | 0 (0.0%) |
| 18 to 34 Years | 0 (0.0%) | 0 (0.0%) |
| 35 to 64 Years | 0 (0.0%) | 6 (27.3%) |
| 65 to 74 Years | 23 (88.5%) | 1 (5.6%) |
| 75 Years and over | 18 (94.7%) | 16 (88.9%) |
Disability Class: Vision Difficulty
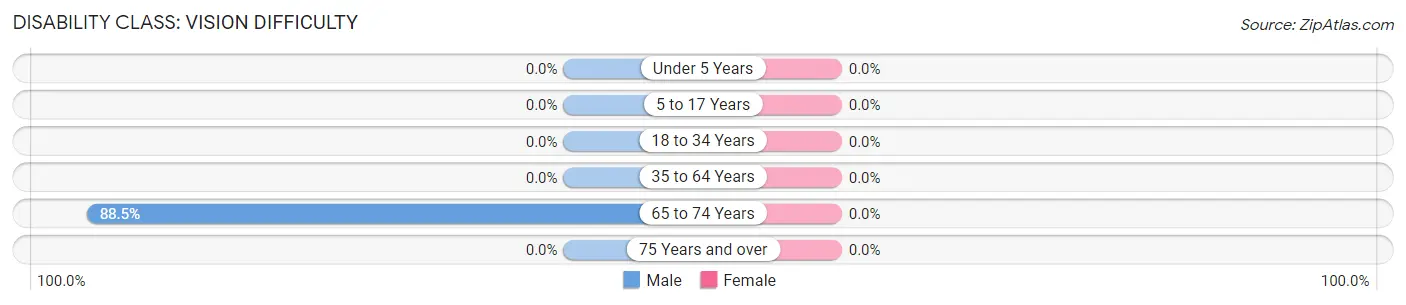
| Age Bracket | Male | Female |
| Under 5 Years | 0 (0.0%) | 0 (0.0%) |
| 5 to 17 Years | 0 (0.0%) | 0 (0.0%) |
| 18 to 34 Years | 0 (0.0%) | 0 (0.0%) |
| 35 to 64 Years | 0 (0.0%) | 0 (0.0%) |
| 65 to 74 Years | 23 (88.5%) | 0 (0.0%) |
| 75 Years and over | 0 (0.0%) | 0 (0.0%) |
Disability Class: Cognitive Difficulty
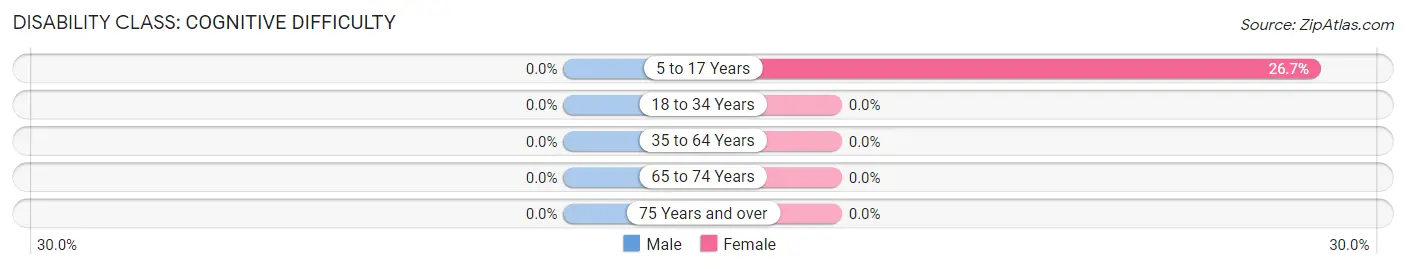
| Age Bracket | Male | Female |
| 5 to 17 Years | 0 (0.0%) | 4 (26.7%) |
| 18 to 34 Years | 0 (0.0%) | 0 (0.0%) |
| 35 to 64 Years | 0 (0.0%) | 0 (0.0%) |
| 65 to 74 Years | 0 (0.0%) | 0 (0.0%) |
| 75 Years and over | 0 (0.0%) | 0 (0.0%) |
Disability Class: Ambulatory Difficulty
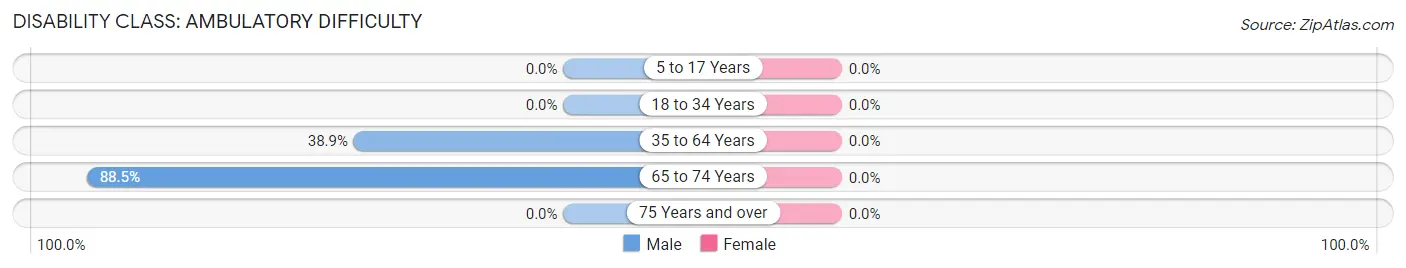
| Age Bracket | Male | Female |
| 5 to 17 Years | 0 (0.0%) | 0 (0.0%) |
| 18 to 34 Years | 0 (0.0%) | 0 (0.0%) |
| 35 to 64 Years | 7 (38.9%) | 0 (0.0%) |
| 65 to 74 Years | 23 (88.5%) | 0 (0.0%) |
| 75 Years and over | 0 (0.0%) | 0 (0.0%) |
Disability Class: Self-Care Difficulty
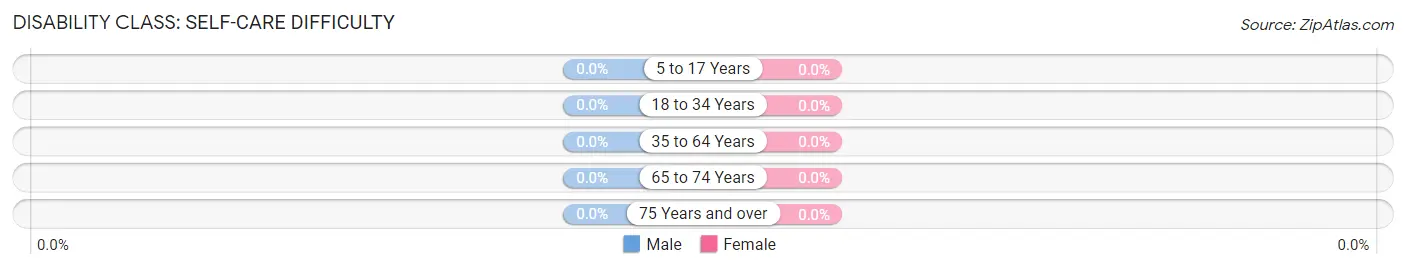
| Age Bracket | Male | Female |
| 5 to 17 Years | 0 (0.0%) | 0 (0.0%) |
| 18 to 34 Years | 0 (0.0%) | 0 (0.0%) |
| 35 to 64 Years | 0 (0.0%) | 0 (0.0%) |
| 65 to 74 Years | 0 (0.0%) | 0 (0.0%) |
| 75 Years and over | 0 (0.0%) | 0 (0.0%) |
Technology Access in Manter
Computing Device Access in Manter
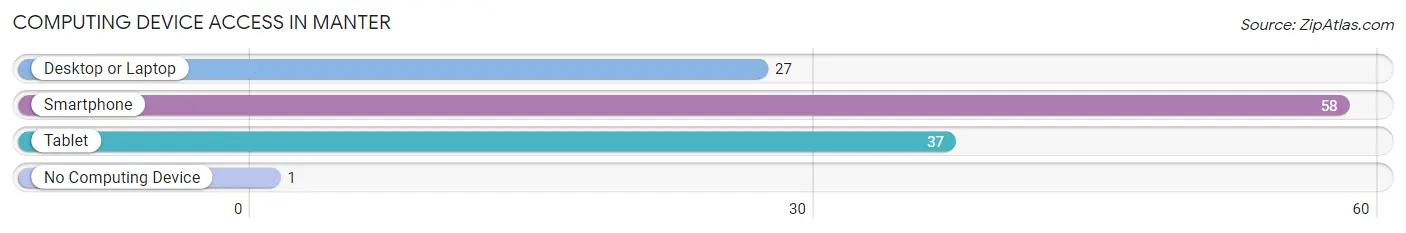
| Device Type | # Households | % Households |
| Desktop or Laptop | 27 | 45.8% |
| Smartphone | 58 | 98.3% |
| Tablet | 37 | 62.7% |
| No Computing Device | 1 | 1.7% |
| Total | 59 | 100.0% |
Internet Access in Manter
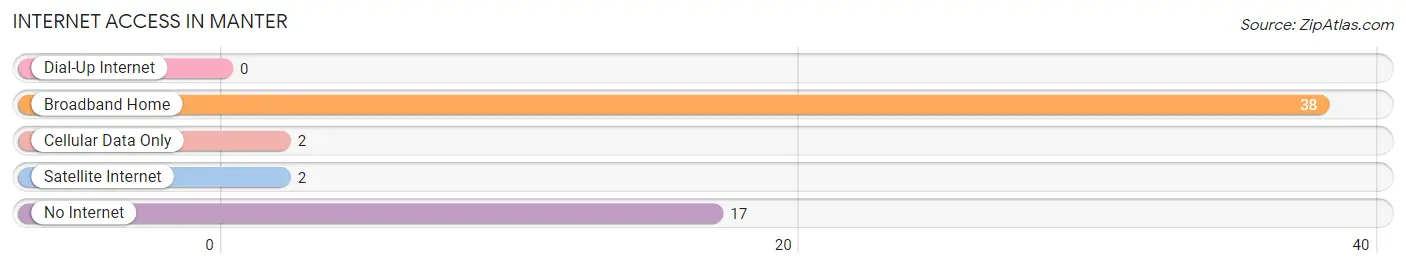
| Internet Type | # Households | % Households |
| Dial-Up Internet | 0 | 0.0% |
| Broadband Home | 38 | 64.4% |
| Cellular Data Only | 2 | 3.4% |
| Satellite Internet | 2 | 3.4% |
| No Internet | 17 | 28.8% |
| Total | 59 | 100.0% |
Manter Summary
KS History
Kansas is a state located in the Midwestern United States. It is bordered by Nebraska to the north, Missouri to the east, Oklahoma to the south, and Colorado to the west. The state was named after the Kansa Native American tribe, which inhabited the area. Kansas was admitted to the Union as the 34th state on January 29, 1861.
The history of Kansas is closely tied to the history of the Great Plains region of the United States. The area was first inhabited by Native Americans, including the Kansa, Osage, Pawnee, and Wichita tribes. The first Europeans to explore the area were French fur traders, who arrived in the late 17th century. In 1803, the United States acquired the area as part of the Louisiana Purchase.
In the mid-19th century, the area was opened up to settlement by white settlers. The Kansas-Nebraska Act of 1854 allowed settlers to determine whether Kansas would become a free or slave state. This led to a period of violence known as “Bleeding Kansas” as pro-slavery and anti-slavery forces clashed. In 1861, Kansas was admitted to the Union as a free state.
During the Civil War, Kansas was a major source of troops for the Union Army. After the war, the state experienced a period of rapid growth and development. Railroads were built, and the population of the state increased dramatically. In the late 19th century, Kansas was a major center of the Populist movement, which sought to reform the political and economic system.
In the 20th century, Kansas continued to experience growth and development. The state’s economy diversified, and its population continued to increase. In the 1950s and 1960s, Kansas was a major center of the civil rights movement. In the late 20th century, the state experienced a period of economic decline, but has since recovered.
Geography
Kansas is located in the Midwestern United States. It is bordered by Nebraska to the north, Missouri to the east, Oklahoma to the south, and Colorado to the west. The state has an area of 82,278 square miles, making it the 15th largest state in the country.
The geography of Kansas is dominated by the Great Plains. The eastern part of the state is characterized by rolling hills and prairies, while the western part is more mountainous. The highest point in the state is Mount Sunflower, which has an elevation of 4,041 feet.
The state is divided into 105 counties. The largest cities in the state are Wichita, Kansas City, Topeka, and Lawrence.
Economy
The economy of Kansas is largely based on agriculture and manufacturing. The state is a major producer of wheat, corn, sorghum, soybeans, and other crops. It is also a major producer of beef and pork.
Manufacturing is also an important part of the state’s economy. Major industries include aerospace, food processing, chemicals, and transportation equipment. The state is also a major producer of oil and natural gas.
The state’s economy has experienced periods of growth and decline over the years. In the late 20th century, the state experienced a period of economic decline, but has since recovered.
Demographics
As of 2019, the population of Kansas was estimated to be 2,913,314. The state has a population density of 35.3 people per square mile.
The largest racial group in the state is white, which makes up 79.2% of the population. The second largest group is Hispanic or Latino, which makes up 11.2% of the population. Other racial groups include African American (6.2%), Asian (2.2%), and Native American (1.2%).
The median household income in the state is $56,422. The median home value is $153,400. The poverty rate is 11.3%.
The largest cities in the state are Wichita, Kansas City, Topeka, and Lawrence. The state capital is Topeka. The largest university in the state is the University of Kansas.
Common Questions
What is Per Capita Income in Manter?
Per Capita income in Manter is $30,958.
What is the Median Family Income in Manter?
Median Family Income in Manter is $61,397.
What is the Median Household income in Manter?
Median Household Income in Manter is $60,662.
What is Income or Wage Gap in Manter?
Income or Wage Gap in Manter is 13.0%.
Women in Manter earn 87.0 cents for every dollar earned by a man.
What is Inequality or Gini Index in Manter?
Inequality or Gini Index in Manter is 0.24.
What is the Total Population of Manter?
Total Population of Manter is 190.
What is the Total Male Population of Manter?
Total Male Population of Manter is 76.
What is the Total Female Population of Manter?
Total Female Population of Manter is 114.
What is the Ratio of Males per 100 Females in Manter?
There are 66.67 Males per 100 Females in Manter.
What is the Ratio of Females per 100 Males in Manter?
There are 150.00 Females per 100 Males in Manter.
What is the Median Population Age in Manter?
Median Population Age in Manter is 58.6 Years.
What is the Average Family Size in Manter
Average Family Size in Manter is 3.9 People.
What is the Average Household Size in Manter
Average Household Size in Manter is 3.2 People.
How Large is the Labor Force in Manter?
There are 72 People in the Labor Forcein in Manter.
What is the Percentage of People in the Labor Force in Manter?
46.2% of People are in the Labor Force in Manter.
What is the Unemployment Rate in Manter?
Unemployment Rate in Manter is 2.8%.