Mooreville, MS Map & Demographics
Mooreville Map
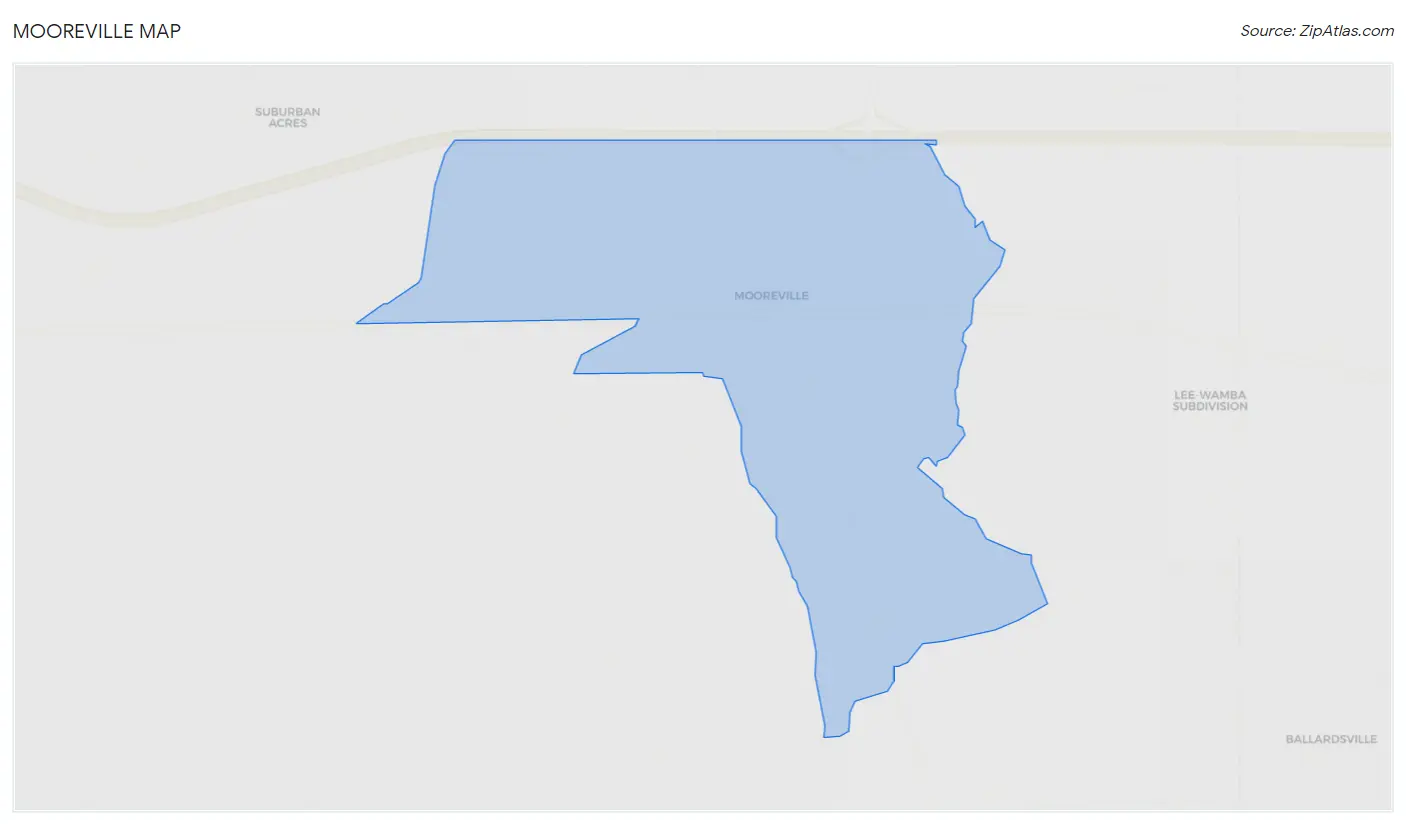
Mooreville Overview
$35,608
PER CAPITA INCOME
$129,473
AVG FAMILY INCOME
$139,473
AVG HOUSEHOLD INCOME
49.2%
WAGE / INCOME GAP [ % ]
50.8¢/ $1
WAGE / INCOME GAP [ $ ]
0.26
INEQUALITY / GINI INDEX
1,839
TOTAL POPULATION
1,029
MALE POPULATION
810
FEMALE POPULATION
127.04
MALES / 100 FEMALES
78.72
FEMALES / 100 MALES
19.9
MEDIAN AGE
3.8
AVG FAMILY SIZE
4.2
AVG HOUSEHOLD SIZE
870
LABOR FORCE [ PEOPLE ]
69.4%
PERCENT IN LABOR FORCE
25.7%
UNEMPLOYMENT RATE
Mooreville Zip Codes
Mooreville Area Codes
Income in Mooreville
Income Overview in Mooreville
Per Capita Income in Mooreville is $35,608, while median incomes of families and households are $129,473 and $139,473 respectively.
| Characteristic | Number | Measure |
| Per Capita Income | 1,839 | $35,608 |
| Median Family Income | 442 | $129,473 |
| Mean Family Income | 442 | $133,726 |
| Median Household Income | 442 | $139,473 |
| Mean Household Income | 442 | $136,369 |
| Income Deficit | 442 | $0 |
| Wage / Income Gap (%) | 1,839 | 49.20% |
| Wage / Income Gap ($) | 1,839 | 50.80¢ per $1 |
| Gini / Inequality Index | 1,839 | 0.26 |
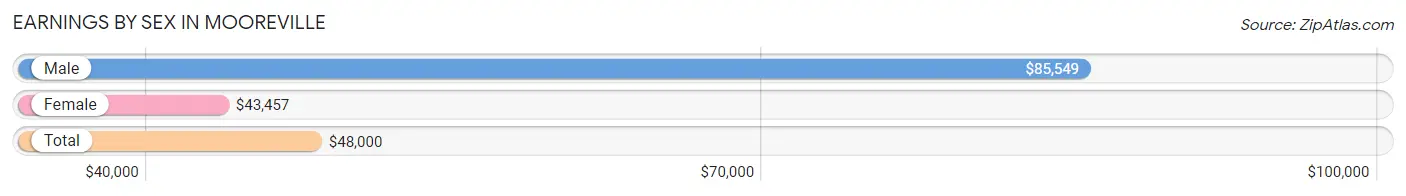
Earnings by Sex in Mooreville
Average Earnings in Mooreville are $48,000, $85,549 for men and $43,457 for women, a difference of 49.2%.
| Sex | Number | Average Earnings |
| Male | 592 (68.0%) | $85,549 |
| Female | 278 (32.0%) | $43,457 |
| Total | 870 (100.0%) | $48,000 |
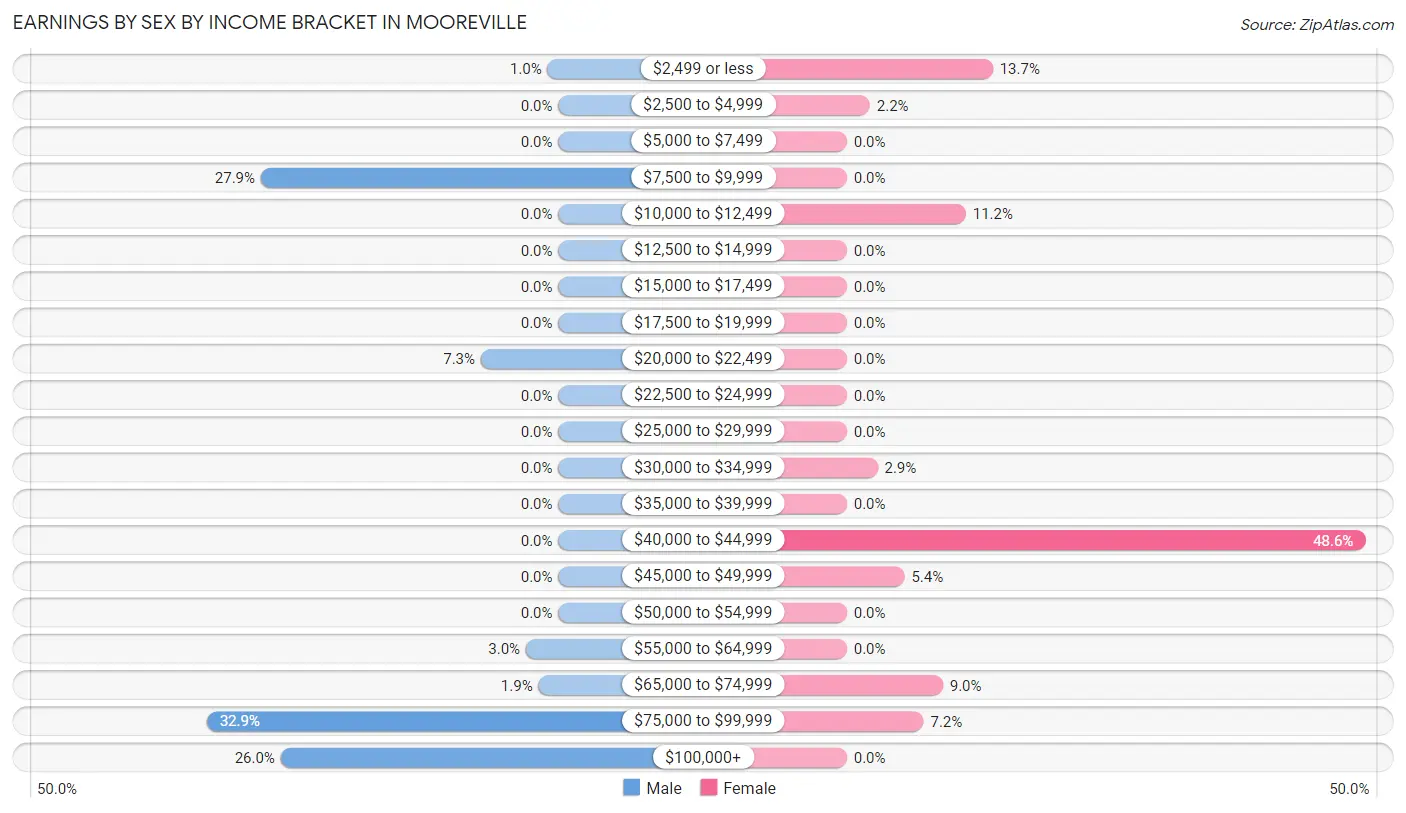
Earnings by Sex by Income Bracket in Mooreville
The most common earnings brackets in Mooreville are $75,000 to $99,999 for men (195 | 32.9%) and $40,000 to $44,999 for women (135 | 48.6%).
| Income | Male | Female |
| $2,499 or less | 6 (1.0%) | 38 (13.7%) |
| $2,500 to $4,999 | 0 (0.0%) | 6 (2.2%) |
| $5,000 to $7,499 | 0 (0.0%) | 0 (0.0%) |
| $7,500 to $9,999 | 165 (27.9%) | 0 (0.0%) |
| $10,000 to $12,499 | 0 (0.0%) | 31 (11.2%) |
| $12,500 to $14,999 | 0 (0.0%) | 0 (0.0%) |
| $15,000 to $17,499 | 0 (0.0%) | 0 (0.0%) |
| $17,500 to $19,999 | 0 (0.0%) | 0 (0.0%) |
| $20,000 to $22,499 | 43 (7.3%) | 0 (0.0%) |
| $22,500 to $24,999 | 0 (0.0%) | 0 (0.0%) |
| $25,000 to $29,999 | 0 (0.0%) | 0 (0.0%) |
| $30,000 to $34,999 | 0 (0.0%) | 8 (2.9%) |
| $35,000 to $39,999 | 0 (0.0%) | 0 (0.0%) |
| $40,000 to $44,999 | 0 (0.0%) | 135 (48.6%) |
| $45,000 to $49,999 | 0 (0.0%) | 15 (5.4%) |
| $50,000 to $54,999 | 0 (0.0%) | 0 (0.0%) |
| $55,000 to $64,999 | 18 (3.0%) | 0 (0.0%) |
| $65,000 to $74,999 | 11 (1.9%) | 25 (9.0%) |
| $75,000 to $99,999 | 195 (32.9%) | 20 (7.2%) |
| $100,000+ | 154 (26.0%) | 0 (0.0%) |
| Total | 592 (100.0%) | 278 (100.0%) |
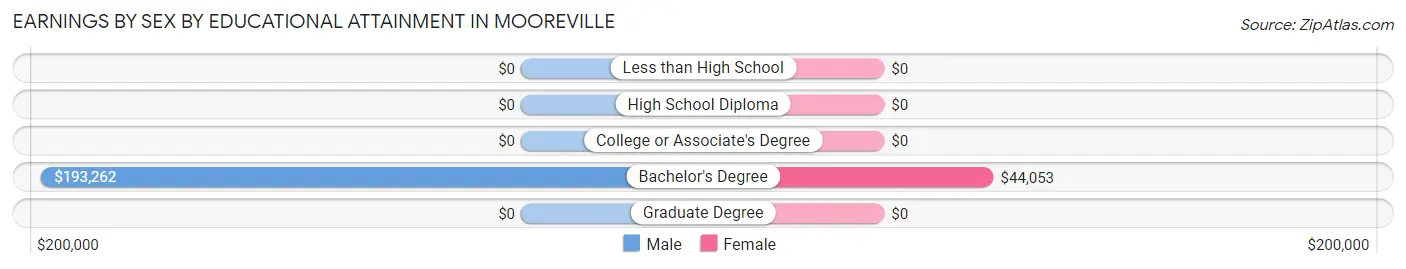
Earnings by Sex by Educational Attainment in Mooreville
Average earnings in Mooreville are $86,683 for men and $43,662 for women, a difference of 49.6%. Men with an educational attainment of bachelor's degree enjoy the highest average annual earnings of $193,262, while those with bachelor's degree education earn the least with $193,262. Women with an educational attainment of bachelor's degree earn the most with the average annual earnings of $44,053, while those with bachelor's degree education have the smallest earnings of $44,053.
| Educational Attainment | Male Income | Female Income |
| Less than High School | - | - |
| High School Diploma | - | - |
| College or Associate's Degree | - | - |
| Bachelor's Degree | $193,262 | $44,053 |
| Graduate Degree | - | - |
| Total | $86,683 | $43,662 |
Family Income in Mooreville
Family Income Brackets in Mooreville
According to the Mooreville family income data, there are 166 families falling into the $100,000 to $149,999 income range, which is the most common income bracket and makes up 37.6% of all families.
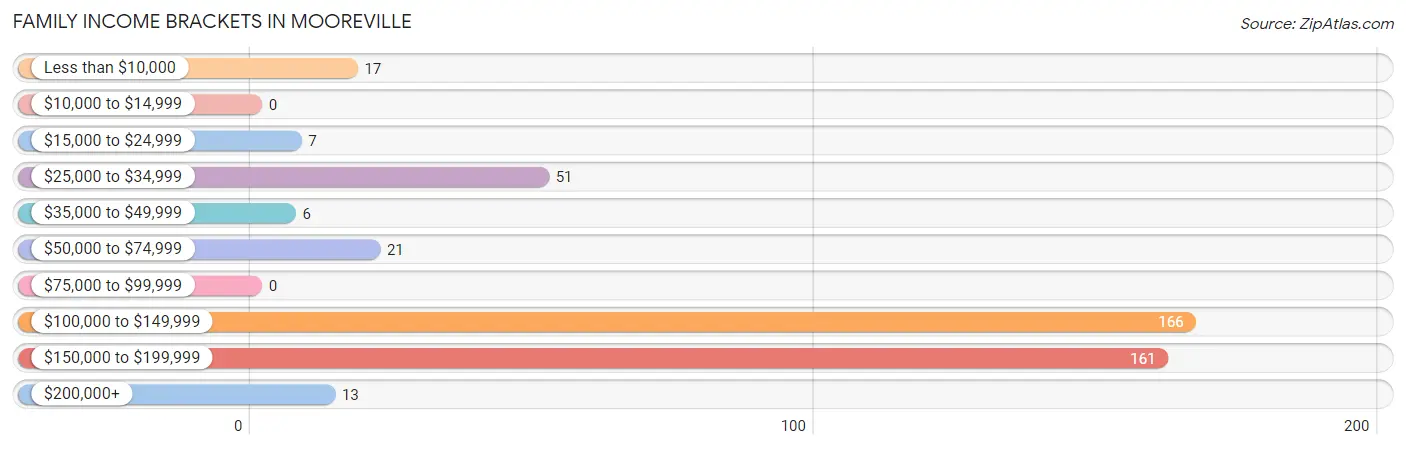
| Income Bracket | # Families | % Families |
| Less than $10,000 | 17 | 3.8% |
| $10,000 to $14,999 | 0 | 0.0% |
| $15,000 to $24,999 | 7 | 1.6% |
| $25,000 to $34,999 | 51 | 11.5% |
| $35,000 to $49,999 | 6 | 1.4% |
| $50,000 to $74,999 | 21 | 4.8% |
| $75,000 to $99,999 | 0 | 0.0% |
| $100,000 to $149,999 | 166 | 37.6% |
| $150,000 to $199,999 | 161 | 36.4% |
| $200,000+ | 13 | 2.9% |
Family Income by Famaliy Size in Mooreville
4-person families (150 | 33.9%) account for the highest median family income in Mooreville with $128,789 per family, while 4-person families (150 | 33.9%) have the highest median income of $32,197 per family member.
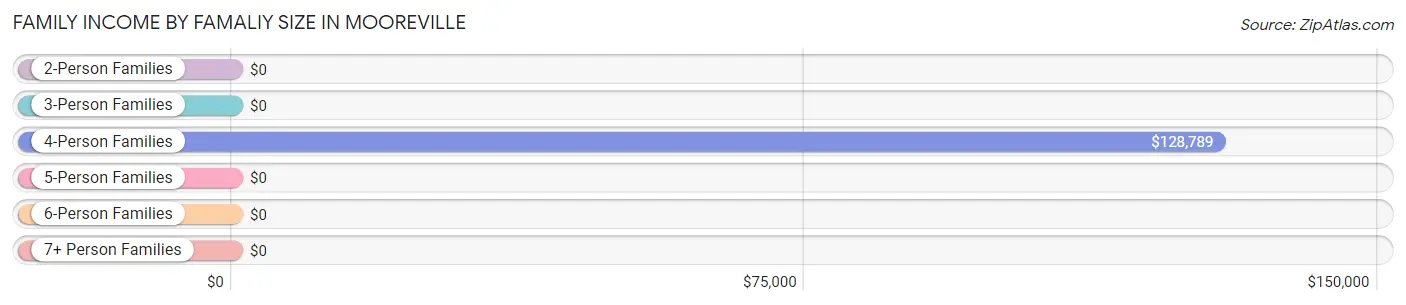
| Income Bracket | # Families | Median Income |
| 2-Person Families | 98 (22.2%) | $0 |
| 3-Person Families | 48 (10.9%) | $0 |
| 4-Person Families | 150 (33.9%) | $128,789 |
| 5-Person Families | 146 (33.0%) | $0 |
| 6-Person Families | 0 (0.0%) | $0 |
| 7+ Person Families | 0 (0.0%) | $0 |
| Total | 442 (100.0%) | $129,473 |
Family Income by Number of Earners in Mooreville
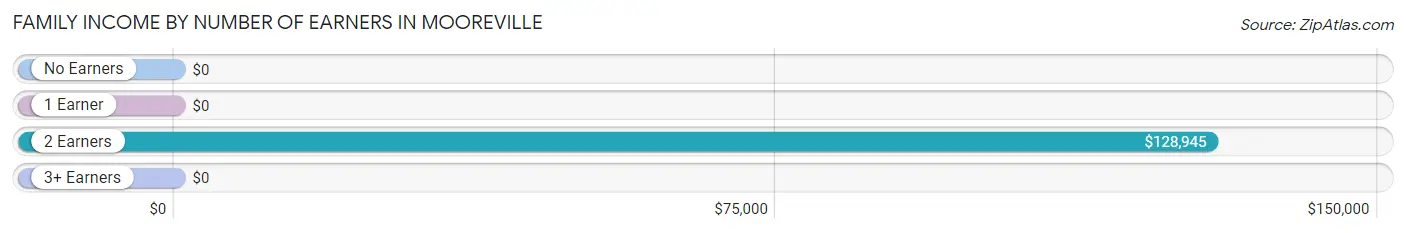
| Number of Earners | # Families | Median Income |
| No Earners | 16 (3.6%) | $0 |
| 1 Earner | 227 (51.4%) | $0 |
| 2 Earners | 190 (43.0%) | $128,945 |
| 3+ Earners | 9 (2.0%) | $0 |
| Total | 442 (100.0%) | $129,473 |
Household Income in Mooreville
Household Income Brackets in Mooreville
With 166 households falling in the category, the $100,000 to $149,999 income range is the most frequent in Mooreville, accounting for 37.6% of all households.
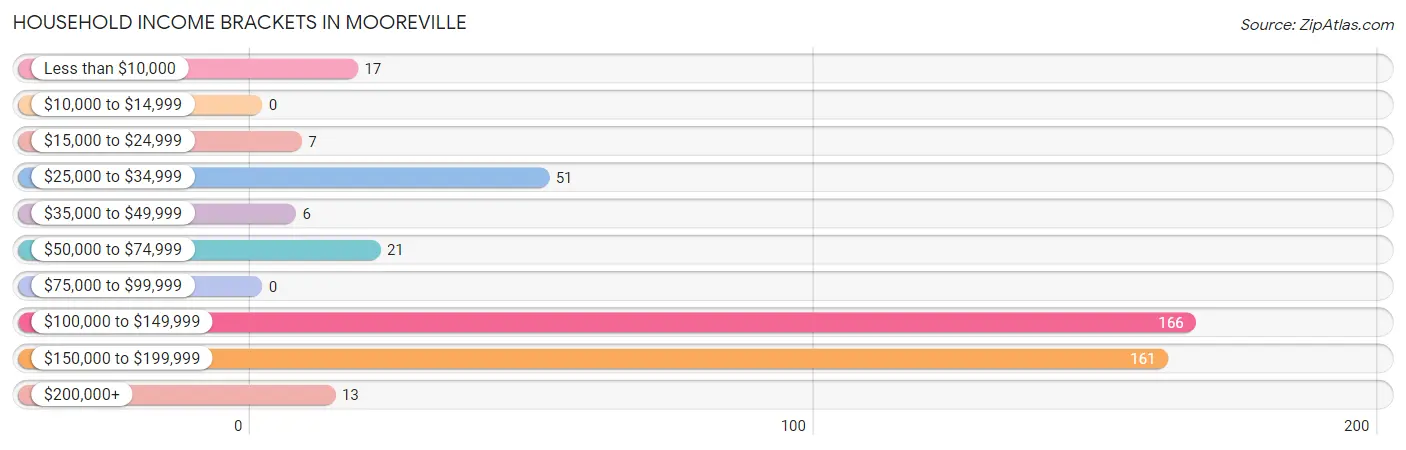
| Income Bracket | # Households | % Households |
| Less than $10,000 | 17 | 3.8% |
| $10,000 to $14,999 | 0 | 0.0% |
| $15,000 to $24,999 | 7 | 1.6% |
| $25,000 to $34,999 | 51 | 11.5% |
| $35,000 to $49,999 | 6 | 1.4% |
| $50,000 to $74,999 | 21 | 4.8% |
| $75,000 to $99,999 | 0 | 0.0% |
| $100,000 to $149,999 | 166 | 37.6% |
| $150,000 to $199,999 | 161 | 36.4% |
| $200,000+ | 13 | 2.9% |
Household Income by Householder Age in Mooreville
The median household income in Mooreville is $139,473, with the highest median household income of $193,562 found in the 25 to 44 years age bracket for the primary householder. A total of 194 households (43.9%) fall into this category.
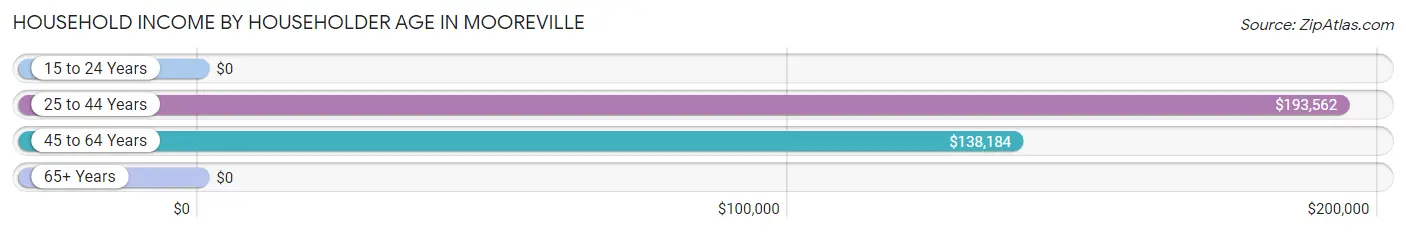
| Income Bracket | # Households | Median Income |
| 15 to 24 Years | 0 (0.0%) | $0 |
| 25 to 44 Years | 194 (43.9%) | $193,562 |
| 45 to 64 Years | 202 (45.7%) | $138,184 |
| 65+ Years | 46 (10.4%) | $0 |
| Total | 442 (100.0%) | $139,473 |
Poverty in Mooreville
Income Below Poverty by Sex and Age in Mooreville
With 16.0% poverty level for males and 5.0% for females among the residents of Mooreville, 18 to 24 year old males and 12 to 14 year old females are the most vulnerable to poverty, with 165 males (100.0%) and 23 females (100.0%) in their respective age groups living below the poverty level.
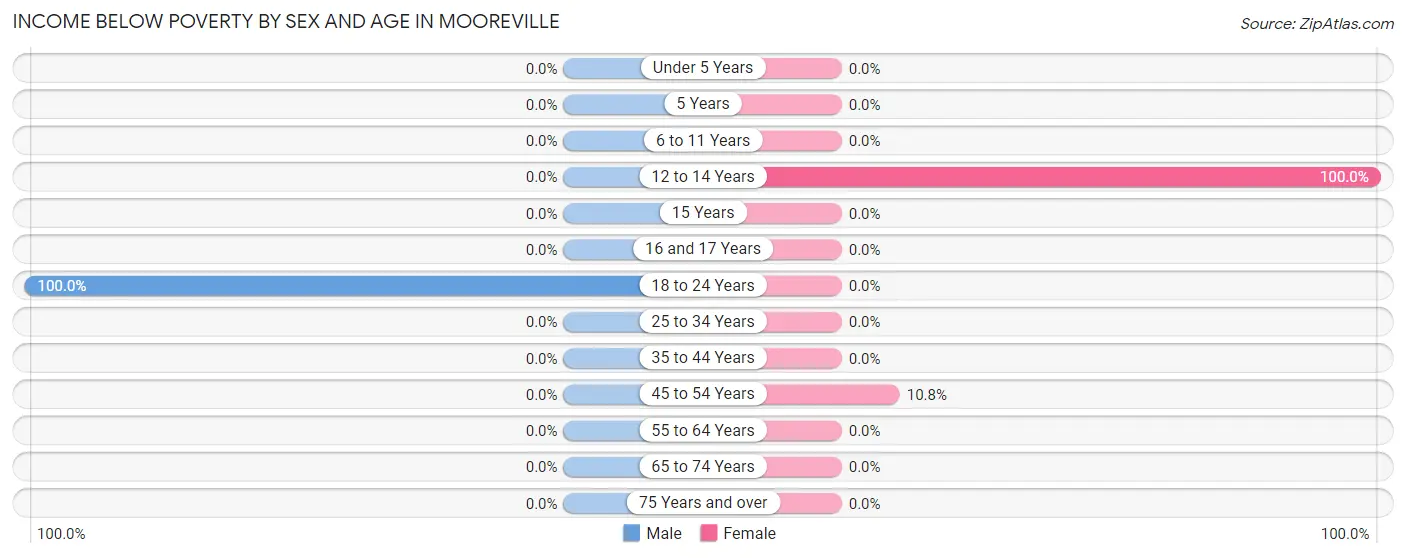
| Age Bracket | Male | Female |
| Under 5 Years | 0 (0.0%) | 0 (0.0%) |
| 5 Years | 0 (0.0%) | 0 (0.0%) |
| 6 to 11 Years | 0 (0.0%) | 0 (0.0%) |
| 12 to 14 Years | 0 (0.0%) | 23 (100.0%) |
| 15 Years | 0 (0.0%) | 0 (0.0%) |
| 16 and 17 Years | 0 (0.0%) | 0 (0.0%) |
| 18 to 24 Years | 165 (100.0%) | 0 (0.0%) |
| 25 to 34 Years | 0 (0.0%) | 0 (0.0%) |
| 35 to 44 Years | 0 (0.0%) | 0 (0.0%) |
| 45 to 54 Years | 0 (0.0%) | 17 (10.8%) |
| 55 to 64 Years | 0 (0.0%) | 0 (0.0%) |
| 65 to 74 Years | 0 (0.0%) | 0 (0.0%) |
| 75 Years and over | 0 (0.0%) | 0 (0.0%) |
| Total | 165 (16.0%) | 40 (5.0%) |
Income Above Poverty by Sex and Age in Mooreville
According to the poverty statistics in Mooreville, males aged under 5 years and females aged under 5 years are the age groups that are most secure financially, with 100.0% of males and 100.0% of females in these age groups living above the poverty line.
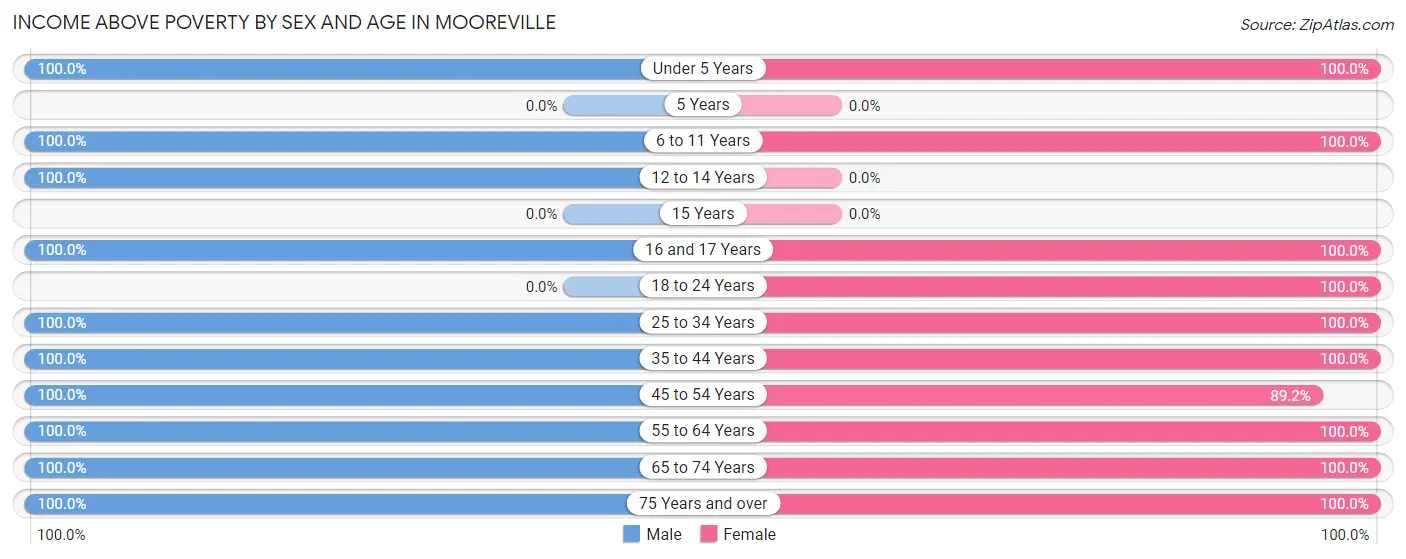
| Age Bracket | Male | Female |
| Under 5 Years | 14 (100.0%) | 189 (100.0%) |
| 5 Years | 0 (0.0%) | 0 (0.0%) |
| 6 to 11 Years | 206 (100.0%) | 15 (100.0%) |
| 12 to 14 Years | 130 (100.0%) | 0 (0.0%) |
| 15 Years | 0 (0.0%) | 0 (0.0%) |
| 16 and 17 Years | 48 (100.0%) | 124 (100.0%) |
| 18 to 24 Years | 0 (0.0%) | 21 (100.0%) |
| 25 to 34 Years | 11 (100.0%) | 34 (100.0%) |
| 35 to 44 Years | 205 (100.0%) | 178 (100.0%) |
| 45 to 54 Years | 191 (100.0%) | 141 (89.2%) |
| 55 to 64 Years | 20 (100.0%) | 34 (100.0%) |
| 65 to 74 Years | 36 (100.0%) | 21 (100.0%) |
| 75 Years and over | 3 (100.0%) | 5 (100.0%) |
| Total | 864 (84.0%) | 762 (95.0%) |
Income Below Poverty Among Married-Couple Families in Mooreville
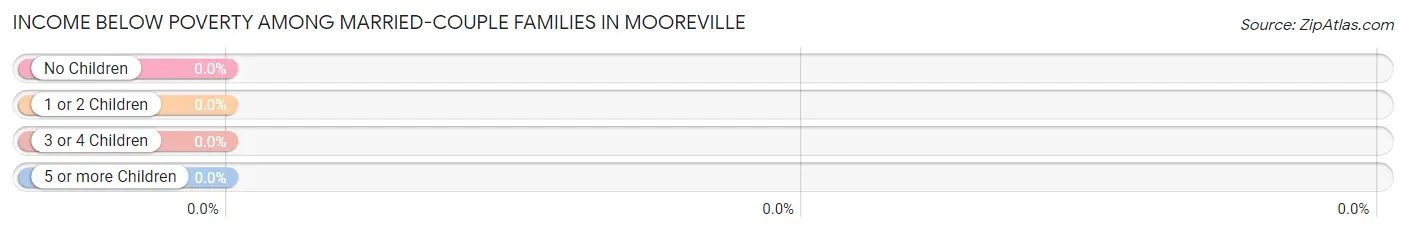
| Children | Above Poverty | Below Poverty |
| No Children | 49 (100.0%) | 0 (0.0%) |
| 1 or 2 Children | 170 (100.0%) | 0 (0.0%) |
| 3 or 4 Children | 146 (100.0%) | 0 (0.0%) |
| 5 or more Children | 0 (0.0%) | 0 (0.0%) |
| Total | 365 (100.0%) | 0 (0.0%) |
Income Below Poverty Among Single-Parent Households in Mooreville
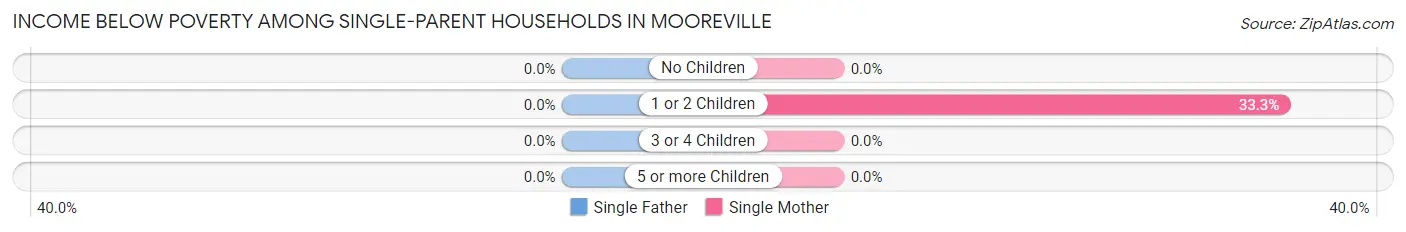
| Children | Single Father | Single Mother |
| No Children | 0 (0.0%) | 0 (0.0%) |
| 1 or 2 Children | 0 (0.0%) | 17 (33.3%) |
| 3 or 4 Children | 0 (0.0%) | 0 (0.0%) |
| 5 or more Children | 0 (0.0%) | 0 (0.0%) |
| Total | 0 (0.0%) | 17 (33.3%) |
Income Below Poverty Among Married-Couple vs Single-Parent Households in Mooreville
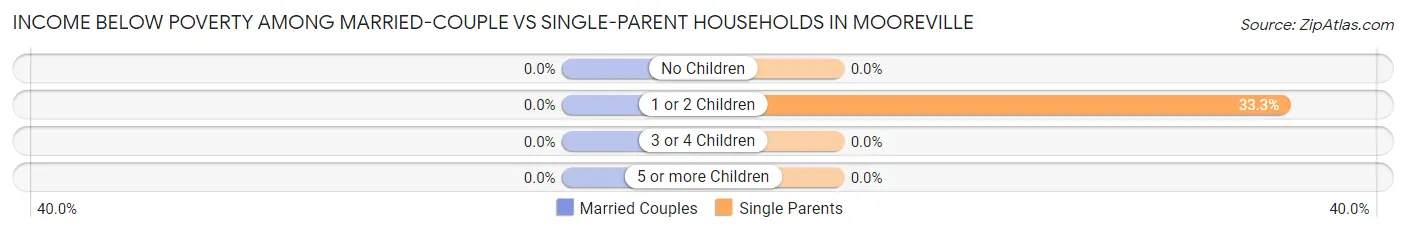
| Children | Married-Couple Families | Single-Parent Households |
| No Children | 0 (0.0%) | 0 (0.0%) |
| 1 or 2 Children | 0 (0.0%) | 17 (33.3%) |
| 3 or 4 Children | 0 (0.0%) | 0 (0.0%) |
| 5 or more Children | 0 (0.0%) | 0 (0.0%) |
| Total | 0 (0.0%) | 17 (22.1%) |
Race in Mooreville
The most populous races in Mooreville are White / Caucasian (1,815 | 98.7%), Asian (13 | 0.7%), and Black / African American (11 | 0.6%).
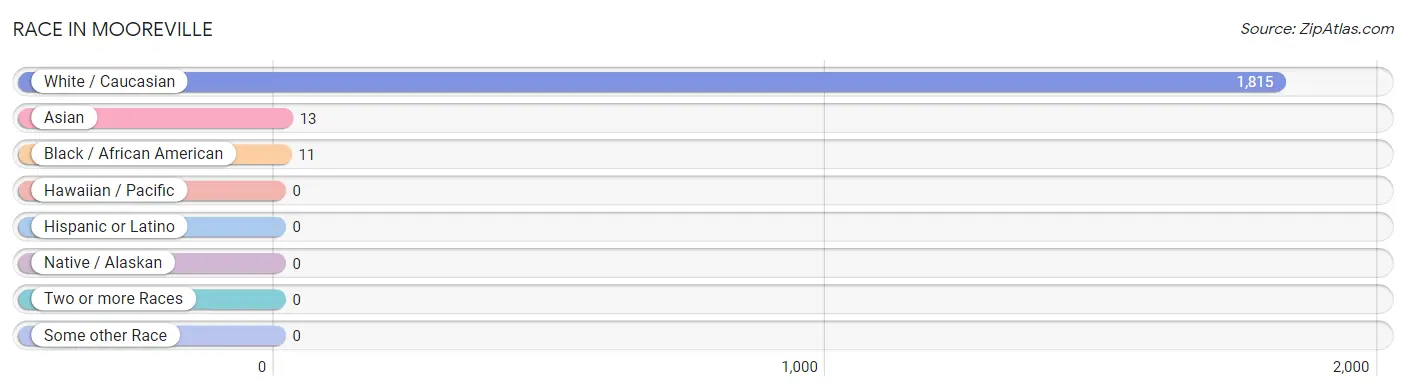
| Race | # Population | % Population |
| Asian | 13 | 0.7% |
| Black / African American | 11 | 0.6% |
| Hawaiian / Pacific | 0 | 0.0% |
| Hispanic or Latino | 0 | 0.0% |
| Native / Alaskan | 0 | 0.0% |
| White / Caucasian | 1,815 | 98.7% |
| Two or more Races | 0 | 0.0% |
| Some other Race | 0 | 0.0% |
| Total | 1,839 | 100.0% |
Ancestry in Mooreville
The most populous ancestries reported in Mooreville are Scotch-Irish (556 | 30.2%), German (355 | 19.3%), English (87 | 4.7%), American (73 | 4.0%), and French (41 | 2.2%), together accounting for 60.5% of all Mooreville residents.
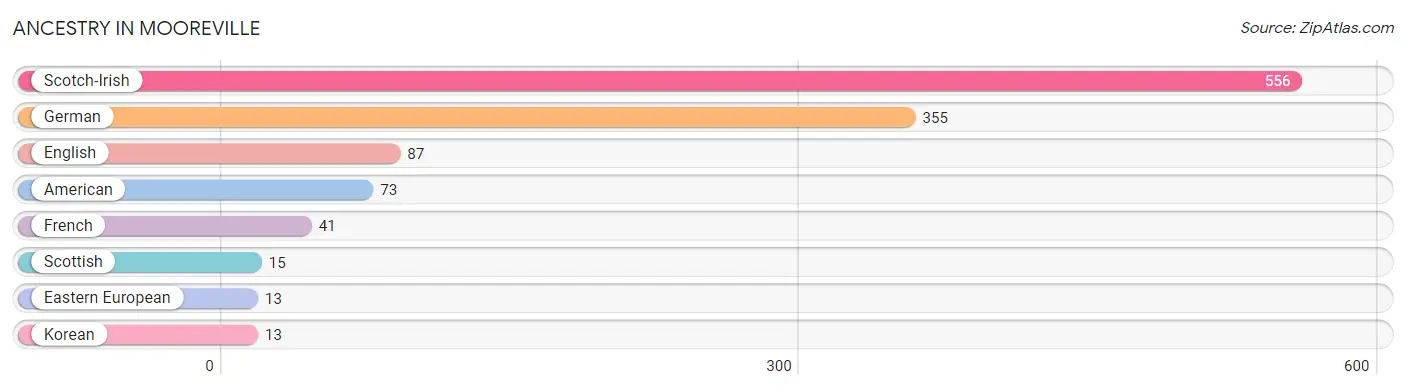
| Ancestry | # Population | % Population |
| American | 73 | 4.0% |
| Eastern European | 13 | 0.7% |
| English | 87 | 4.7% |
| French | 41 | 2.2% |
| German | 355 | 19.3% |
| Korean | 13 | 0.7% |
| Scotch-Irish | 556 | 30.2% |
| Scottish | 15 | 0.8% | View All 8 Rows |
Immigrants in Mooreville
The most numerous immigrant groups reported in Mooreville came from Asia (7 | 0.4%), Philippines (7 | 0.4%), and South Eastern Asia (7 | 0.4%), together accounting for 1.1% of all Mooreville residents.
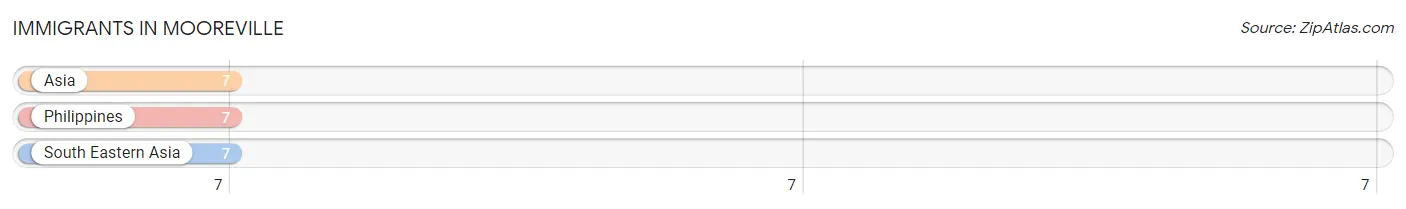
| Immigration Origin | # Population | % Population |
| Asia | 7 | 0.4% |
| Philippines | 7 | 0.4% |
| South Eastern Asia | 7 | 0.4% | View All 3 Rows |
Sex and Age in Mooreville
Sex and Age in Mooreville
The most populous age groups in Mooreville are 15 to 19 Years (213 | 20.7%) for men and Under 5 Years (197 | 24.3%) for women.
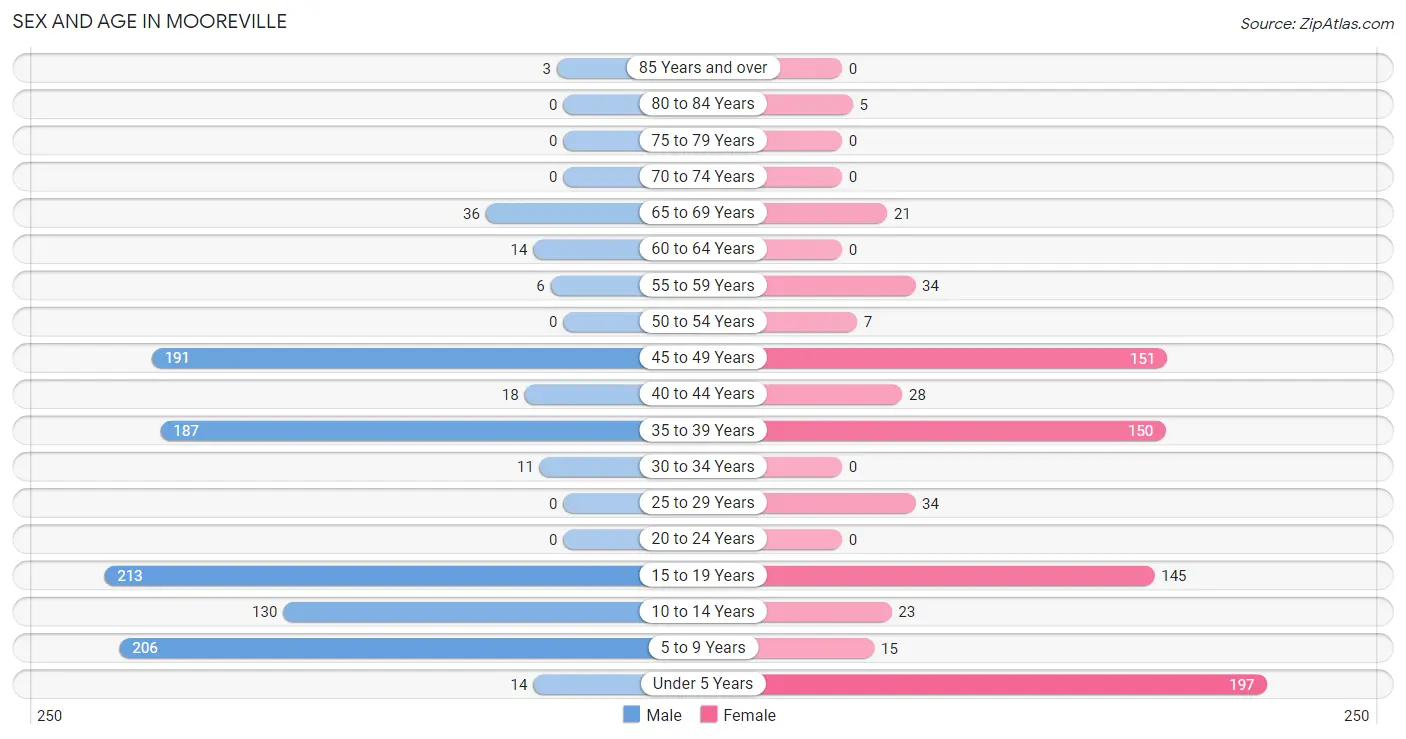
| Age Bracket | Male | Female |
| Under 5 Years | 14 (1.4%) | 197 (24.3%) |
| 5 to 9 Years | 206 (20.0%) | 15 (1.8%) |
| 10 to 14 Years | 130 (12.6%) | 23 (2.8%) |
| 15 to 19 Years | 213 (20.7%) | 145 (17.9%) |
| 20 to 24 Years | 0 (0.0%) | 0 (0.0%) |
| 25 to 29 Years | 0 (0.0%) | 34 (4.2%) |
| 30 to 34 Years | 11 (1.1%) | 0 (0.0%) |
| 35 to 39 Years | 187 (18.2%) | 150 (18.5%) |
| 40 to 44 Years | 18 (1.8%) | 28 (3.5%) |
| 45 to 49 Years | 191 (18.6%) | 151 (18.6%) |
| 50 to 54 Years | 0 (0.0%) | 7 (0.9%) |
| 55 to 59 Years | 6 (0.6%) | 34 (4.2%) |
| 60 to 64 Years | 14 (1.4%) | 0 (0.0%) |
| 65 to 69 Years | 36 (3.5%) | 21 (2.6%) |
| 70 to 74 Years | 0 (0.0%) | 0 (0.0%) |
| 75 to 79 Years | 0 (0.0%) | 0 (0.0%) |
| 80 to 84 Years | 0 (0.0%) | 5 (0.6%) |
| 85 Years and over | 3 (0.3%) | 0 (0.0%) |
| Total | 1,029 (100.0%) | 810 (100.0%) |
Families and Households in Mooreville
Median Family Size in Mooreville
The median family size in Mooreville is 3.77 persons per family, with married-couple families (365 | 82.6%) accounting for the largest median family size of 3.99 persons per family. On the other hand, single male/father families (26 | 5.9%) represent the smallest median family size with 2.27 persons per family.
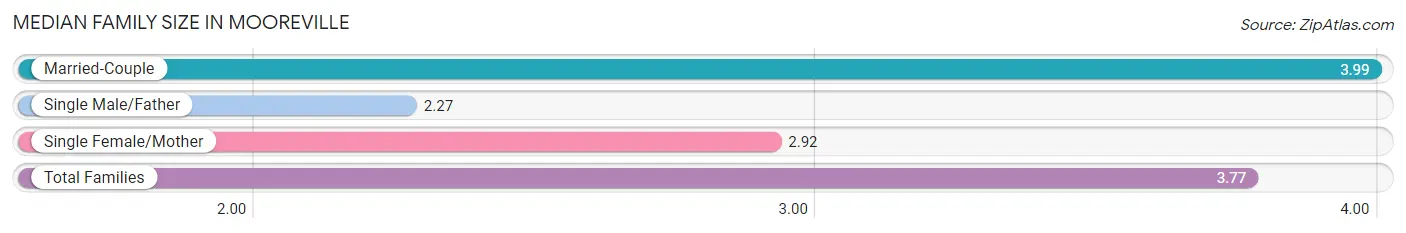
| Family Type | # Families | Family Size |
| Married-Couple | 365 (82.6%) | 3.99 |
| Single Male/Father | 26 (5.9%) | 2.27 |
| Single Female/Mother | 51 (11.5%) | 2.92 |
| Total Families | 442 (100.0%) | 3.77 |
Median Household Size in Mooreville
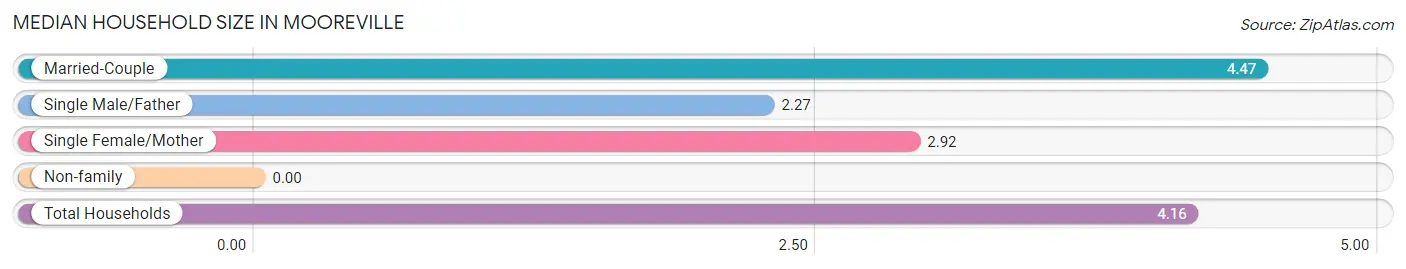
| Household Type | # Households | Household Size |
| Married-Couple | 365 (82.6%) | 4.47 |
| Single Male/Father | 26 (5.9%) | 2.27 |
| Single Female/Mother | 51 (11.5%) | 2.92 |
| Non-family | 0 (0.0%) | - |
| Total Households | 442 (100.0%) | 4.16 |
Household Size by Marriage Status in Mooreville
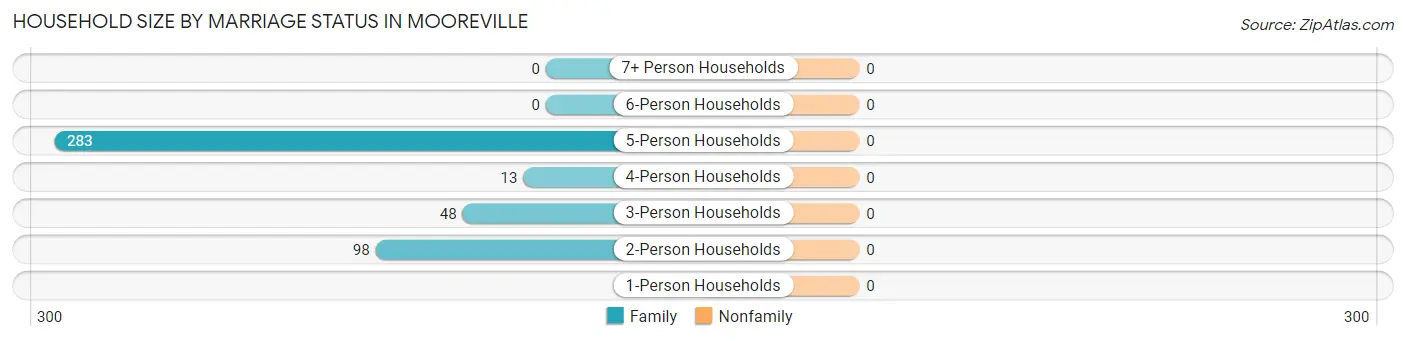
| Household Size | Family Households | Nonfamily Households |
| 1-Person Households | - | 0 (0.0%) |
| 2-Person Households | 98 (22.2%) | 0 (0.0%) |
| 3-Person Households | 48 (10.9%) | 0 (0.0%) |
| 4-Person Households | 13 (2.9%) | 0 (0.0%) |
| 5-Person Households | 283 (64.0%) | 0 (0.0%) |
| 6-Person Households | 0 (0.0%) | 0 (0.0%) |
| 7+ Person Households | 0 (0.0%) | 0 (0.0%) |
| Total | 442 (100.0%) | 0 (0.0%) |
Female Fertility in Mooreville
Fertility by Age in Mooreville
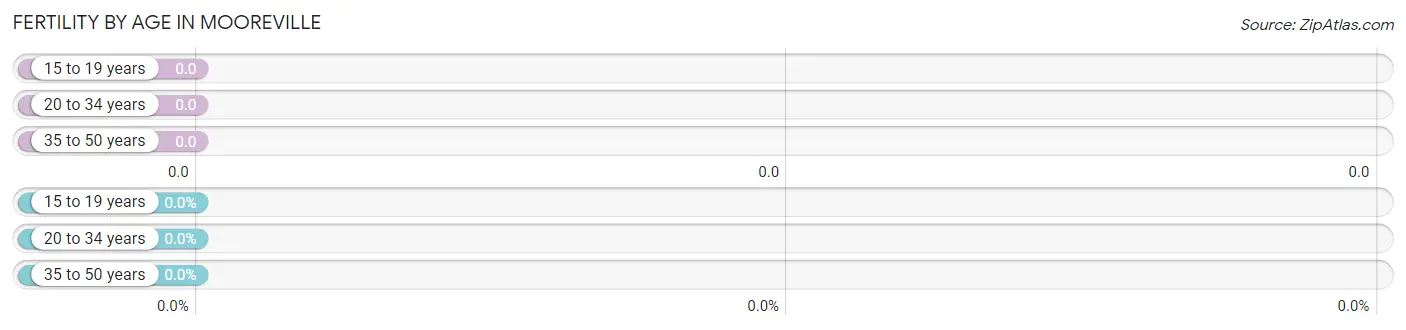
| Age Bracket | Women with Births | Births / 1,000 Women |
| 15 to 19 years | 0 (0.0%) | 0.0 |
| 20 to 34 years | 0 (0.0%) | 0.0 |
| 35 to 50 years | 0 (0.0%) | 0.0 |
| Total | 0 (0.0%) | 0.0 |
Fertility by Age by Marriage Status in Mooreville
| Age Bracket | Married | Unmarried |
| 15 to 19 years | 0 (0.0%) | 0 (0.0%) |
| 20 to 34 years | 0 (0.0%) | 0 (0.0%) |
| 35 to 50 years | 0 (0.0%) | 0 (0.0%) |
| Total | 0 (0.0%) | 0 (0.0%) |
Fertility by Education in Mooreville
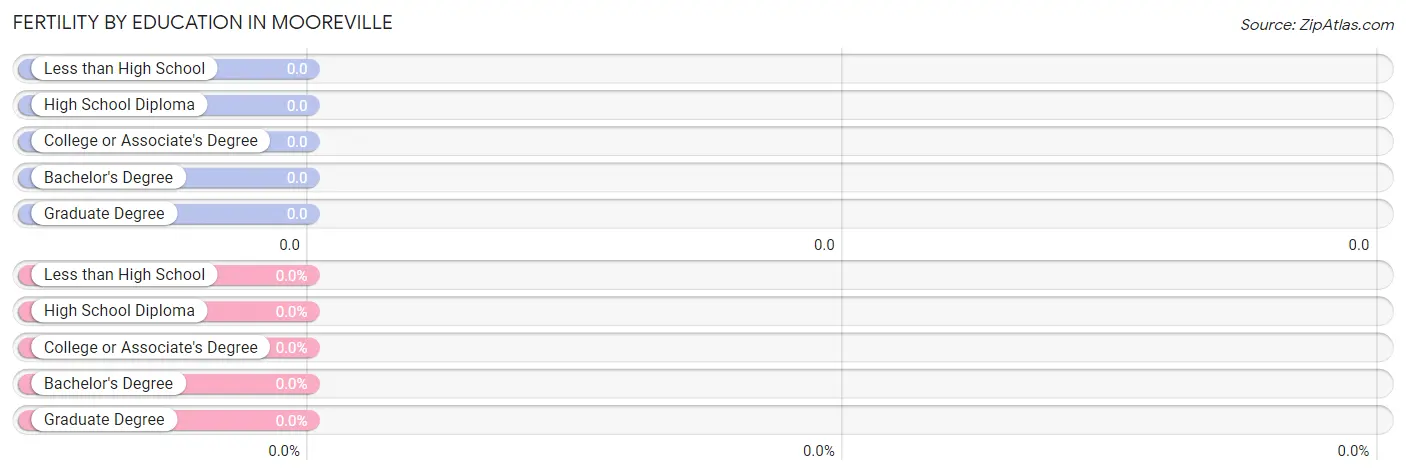
| Educational Attainment | Women with Births | Births / 1,000 Women |
| Less than High School | 0 (0.0%) | 0.0 |
| High School Diploma | 0 (0.0%) | 0.0 |
| College or Associate's Degree | 0 (0.0%) | 0.0 |
| Bachelor's Degree | 0 (0.0%) | 0.0 |
| Graduate Degree | 0 (0.0%) | 0.0 |
| Total | 0 (0.0%) | 0.0 |
Fertility by Education by Marriage Status in Mooreville
| Educational Attainment | Married | Unmarried |
| Less than High School | 0 (0.0%) | 0 (0.0%) |
| High School Diploma | 0 (0.0%) | 0 (0.0%) |
| College or Associate's Degree | 0 (0.0%) | 0 (0.0%) |
| Bachelor's Degree | 0 (0.0%) | 0 (0.0%) |
| Graduate Degree | 0 (0.0%) | 0 (0.0%) |
| Total | 0 (0.0%) | 0 (0.0%) |
Employment Characteristics in Mooreville
Employment by Class of Employer in Mooreville
Among the 646 employed individuals in Mooreville, private company employees (448 | 69.4%), state government employees (134 | 20.7%), and self-employed (not incorporated) (38 | 5.9%) make up the most common classes of employment.
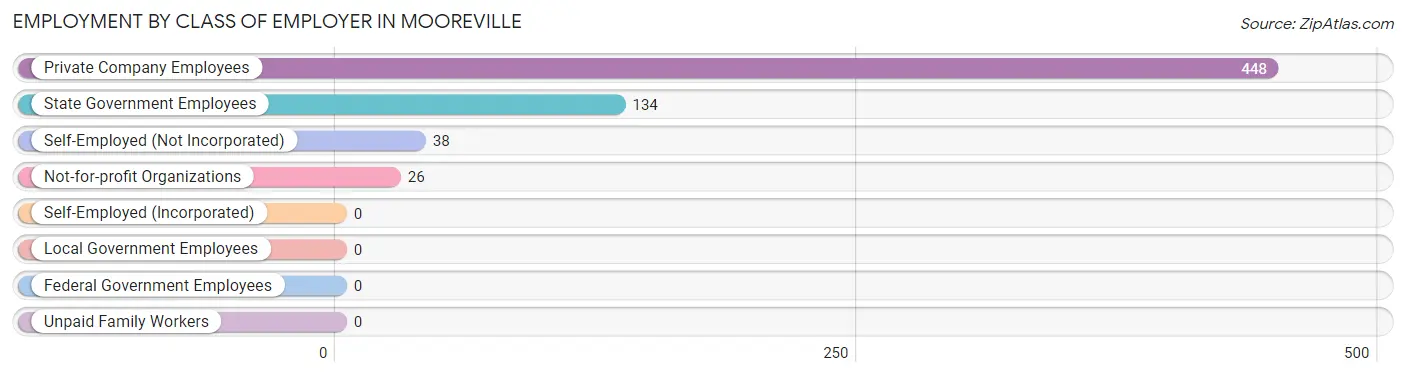
| Employer Class | # Employees | % Employees |
| Private Company Employees | 448 | 69.4% |
| Self-Employed (Incorporated) | 0 | 0.0% |
| Self-Employed (Not Incorporated) | 38 | 5.9% |
| Not-for-profit Organizations | 26 | 4.0% |
| Local Government Employees | 0 | 0.0% |
| State Government Employees | 134 | 20.7% |
| Federal Government Employees | 0 | 0.0% |
| Unpaid Family Workers | 0 | 0.0% |
| Total | 646 | 100.0% |
Employment Status by Age in Mooreville
According to the labor force statistics for Mooreville, out of the total population over 16 years of age (1,254), 69.4% or 870 individuals are in the labor force, with 25.7% or 224 of them unemployed. The age group with the highest labor force participation rate is 25 to 29 years, with 100.0% or 34 individuals in the labor force. Within the labor force, the 16 to 19 years age range has the highest percentage of unemployed individuals, with 88.7% or 165 of them being unemployed.
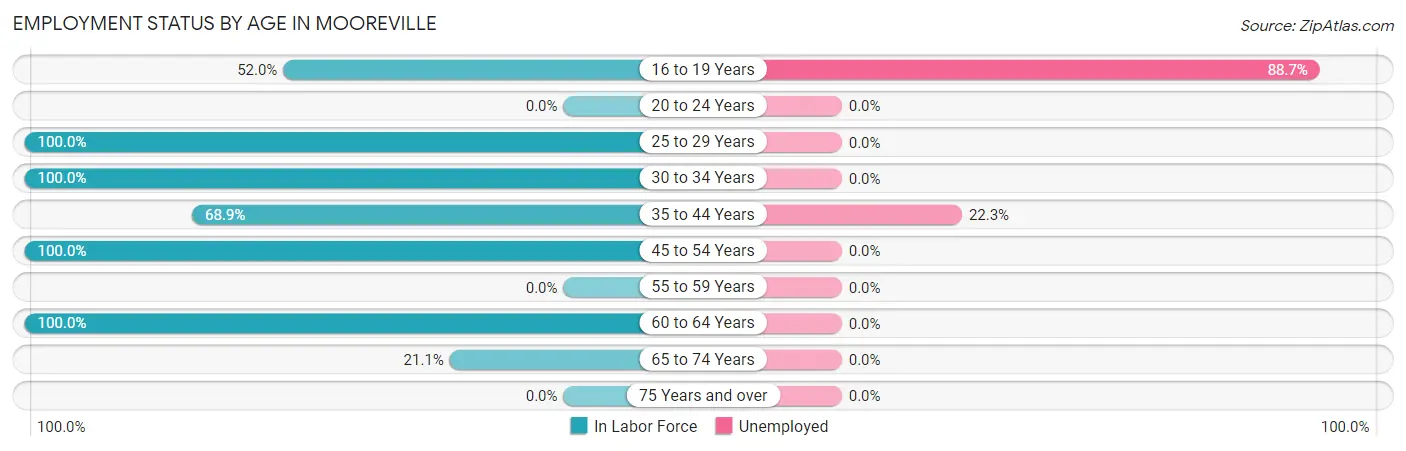
| Age Bracket | In Labor Force | Unemployed |
| 16 to 19 Years | 186 (52.0%) | 165 (88.7%) |
| 20 to 24 Years | 0 (0.0%) | 0 (0.0%) |
| 25 to 29 Years | 34 (100.0%) | 0 (0.0%) |
| 30 to 34 Years | 11 (100.0%) | 0 (0.0%) |
| 35 to 44 Years | 264 (68.9%) | 59 (22.3%) |
| 45 to 54 Years | 349 (100.0%) | 0 (0.0%) |
| 55 to 59 Years | 0 (0.0%) | 0 (0.0%) |
| 60 to 64 Years | 14 (100.0%) | 0 (0.0%) |
| 65 to 74 Years | 12 (21.1%) | 0 (0.0%) |
| 75 Years and over | 0 (0.0%) | 0 (0.0%) |
| Total | 870 (69.4%) | 224 (25.7%) |
Employment Status by Educational Attainment in Mooreville
According to labor force statistics for Mooreville, 80.9% of individuals (672) out of the total population between 25 and 64 years of age (831) are in the labor force, with 8.8% or 59 of them being unemployed. The group with the highest labor force participation rate are those with the educational attainment of less than high school, with 100.0% or 7 individuals in the labor force. Within the labor force, individuals with college / associate degree education have the highest percentage of unemployment, with 65.1% or 28 of them being unemployed.
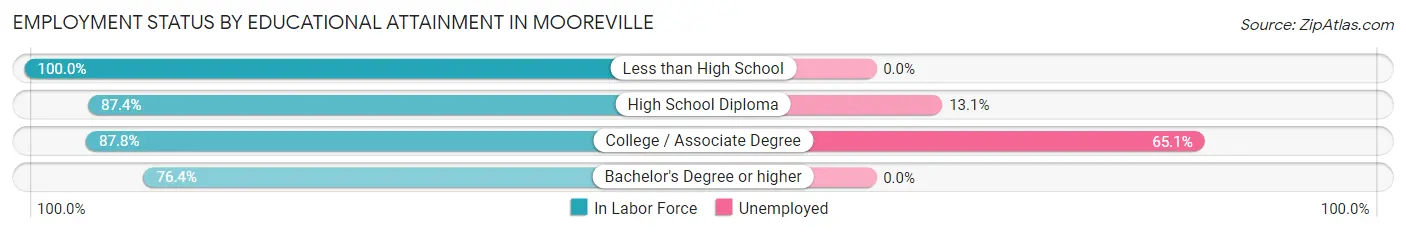
| Educational Attainment | In Labor Force | Unemployed |
| Less than High School | 7 (100.0%) | 0 (0.0%) |
| High School Diploma | 236 (87.4%) | 35 (13.1%) |
| College / Associate Degree | 43 (87.8%) | 32 (65.1%) |
| Bachelor's Degree or higher | 386 (76.4%) | 0 (0.0%) |
| Total | 672 (80.9%) | 73 (8.8%) |
Employment Occupations by Sex in Mooreville
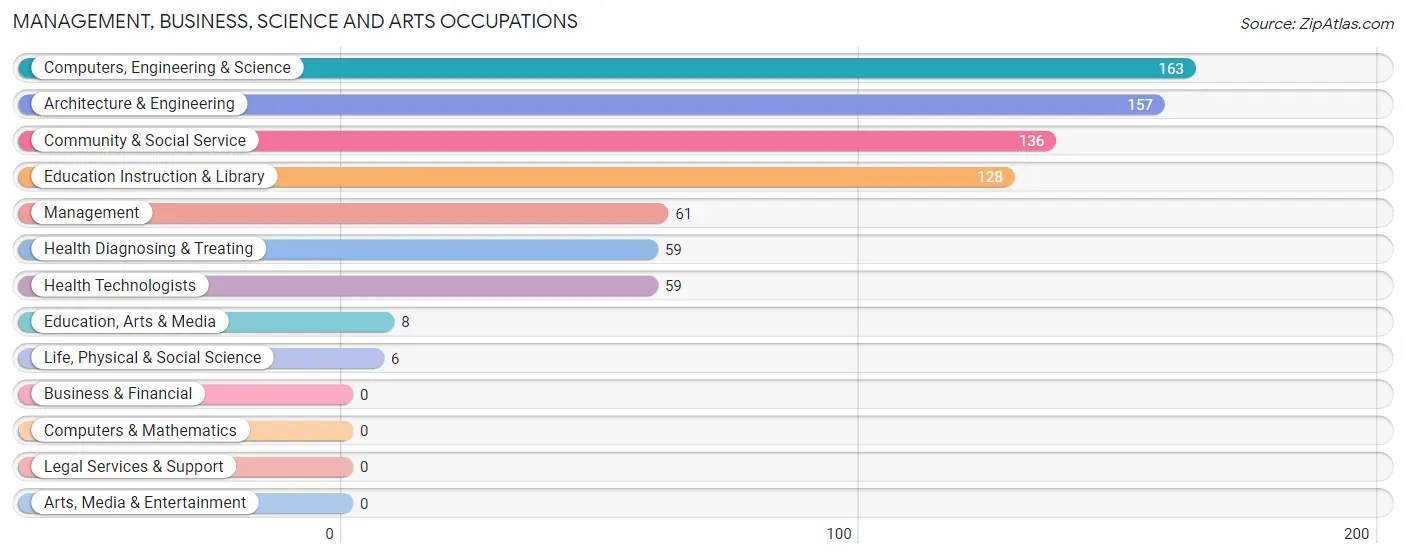
Management, Business, Science and Arts Occupations
The most common Management, Business, Science and Arts occupations in Mooreville are Computers, Engineering & Science (163 | 25.2%), Architecture & Engineering (157 | 24.3%), Community & Social Service (136 | 21.0%), Education Instruction & Library (128 | 19.8%), and Management (61 | 9.4%).
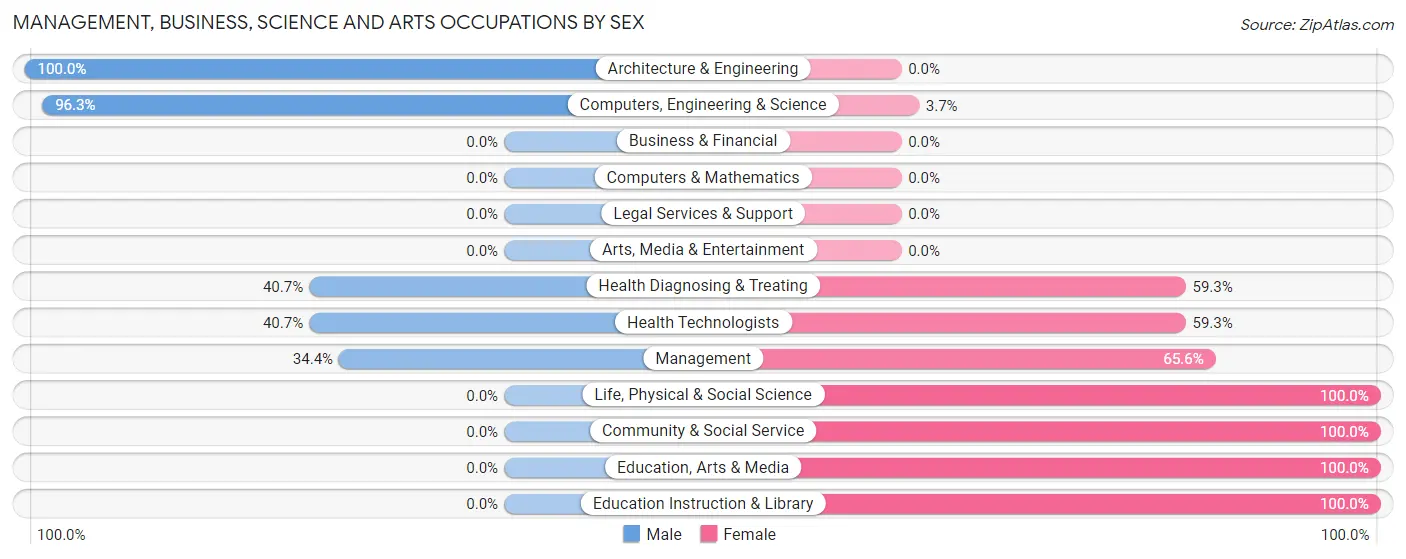
Management, Business, Science and Arts Occupations by Sex
Within the Management, Business, Science and Arts occupations in Mooreville, the most male-oriented occupations are Architecture & Engineering (100.0%), Computers, Engineering & Science (96.3%), and Health Diagnosing & Treating (40.7%), while the most female-oriented occupations are Life, Physical & Social Science (100.0%), Community & Social Service (100.0%), and Education, Arts & Media (100.0%).
| Occupation | Male | Female |
| Management | 21 (34.4%) | 40 (65.6%) |
| Business & Financial | 0 (0.0%) | 0 (0.0%) |
| Computers, Engineering & Science | 157 (96.3%) | 6 (3.7%) |
| Computers & Mathematics | 0 (0.0%) | 0 (0.0%) |
| Architecture & Engineering | 157 (100.0%) | 0 (0.0%) |
| Life, Physical & Social Science | 0 (0.0%) | 6 (100.0%) |
| Community & Social Service | 0 (0.0%) | 136 (100.0%) |
| Education, Arts & Media | 0 (0.0%) | 8 (100.0%) |
| Legal Services & Support | 0 (0.0%) | 0 (0.0%) |
| Education Instruction & Library | 0 (0.0%) | 128 (100.0%) |
| Arts, Media & Entertainment | 0 (0.0%) | 0 (0.0%) |
| Health Diagnosing & Treating | 24 (40.7%) | 35 (59.3%) |
| Health Technologists | 24 (40.7%) | 35 (59.3%) |
| Total (Category) | 202 (48.2%) | 217 (51.8%) |
| Total (Overall) | 399 (61.8%) | 247 (38.2%) |
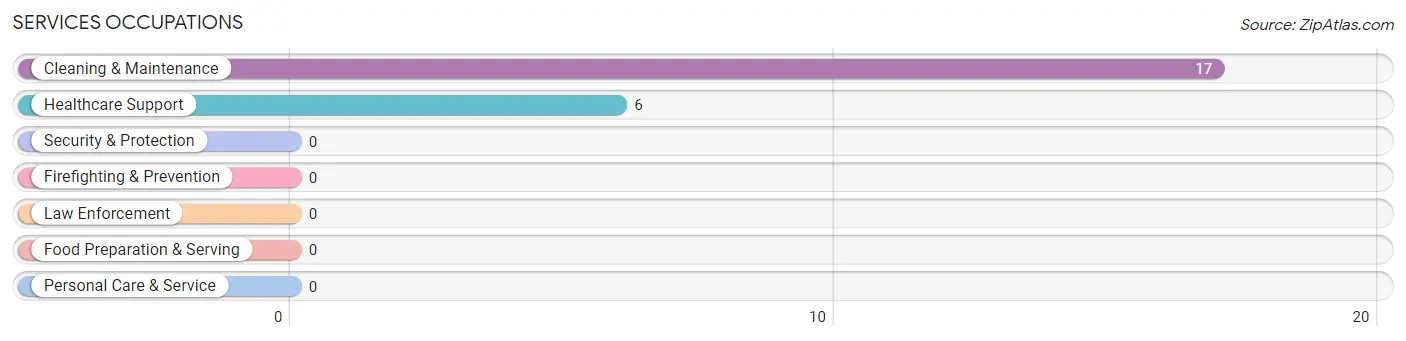
Services Occupations
The most common Services occupations in Mooreville are Cleaning & Maintenance (17 | 2.6%), and Healthcare Support (6 | 0.9%).
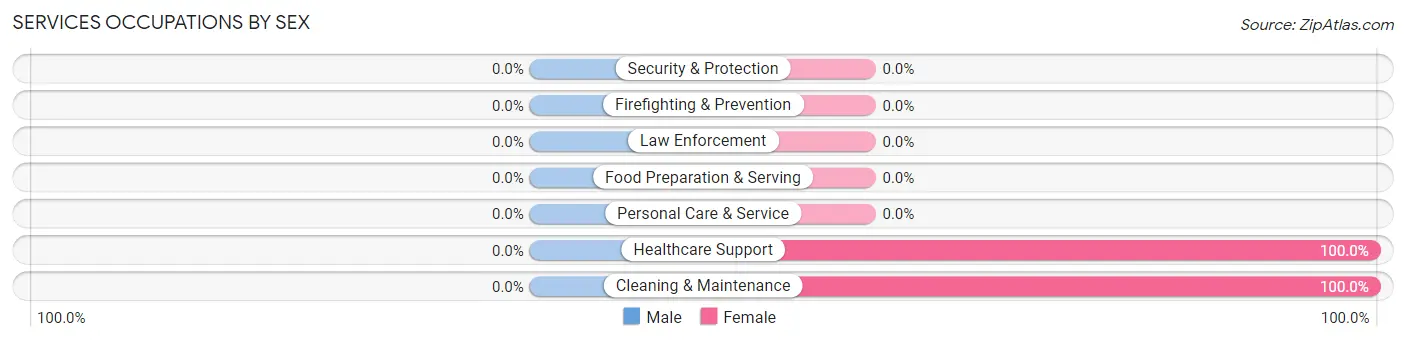
Services Occupations by Sex
| Occupation | Male | Female |
| Healthcare Support | 0 (0.0%) | 6 (100.0%) |
| Security & Protection | 0 (0.0%) | 0 (0.0%) |
| Firefighting & Prevention | 0 (0.0%) | 0 (0.0%) |
| Law Enforcement | 0 (0.0%) | 0 (0.0%) |
| Food Preparation & Serving | 0 (0.0%) | 0 (0.0%) |
| Cleaning & Maintenance | 0 (0.0%) | 17 (100.0%) |
| Personal Care & Service | 0 (0.0%) | 0 (0.0%) |
| Total (Category) | 0 (0.0%) | 23 (100.0%) |
| Total (Overall) | 399 (61.8%) | 247 (38.2%) |
Sales and Office Occupations
The most common Sales and Office occupations in Mooreville are Office & Administration (189 | 29.3%), and Sales & Related (9 | 1.4%).
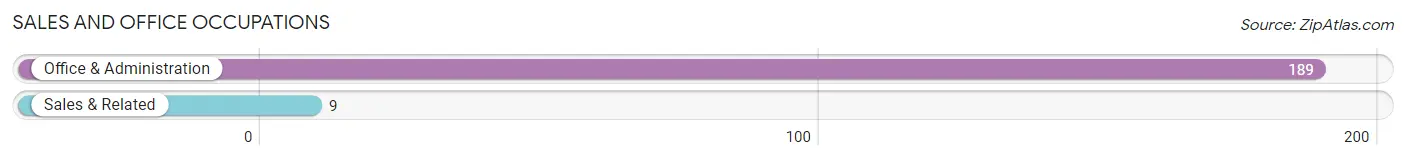
Sales and Office Occupations by Sex
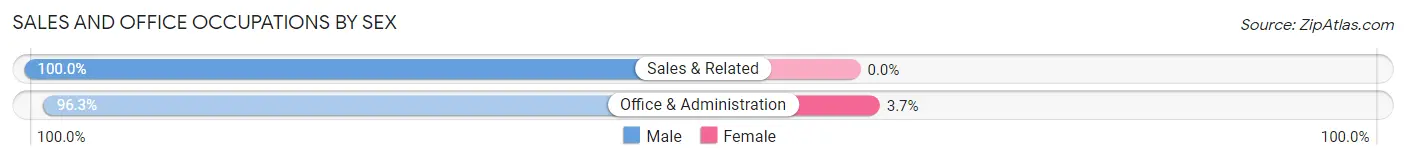
| Occupation | Male | Female |
| Sales & Related | 9 (100.0%) | 0 (0.0%) |
| Office & Administration | 182 (96.3%) | 7 (3.7%) |
| Total (Category) | 191 (96.5%) | 7 (3.5%) |
| Total (Overall) | 399 (61.8%) | 247 (38.2%) |
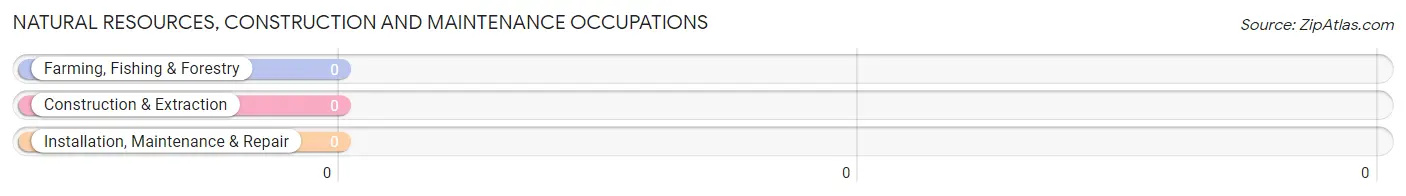
Natural Resources, Construction and Maintenance Occupations
Natural Resources, Construction and Maintenance Occupations by Sex
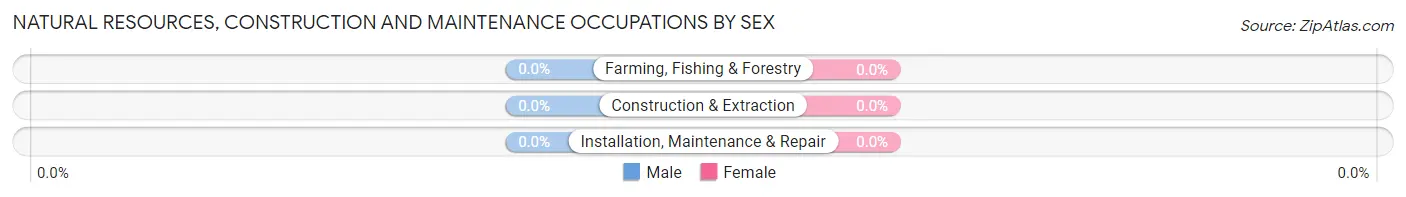
| Occupation | Male | Female |
| Farming, Fishing & Forestry | 0 (0.0%) | 0 (0.0%) |
| Construction & Extraction | 0 (0.0%) | 0 (0.0%) |
| Installation, Maintenance & Repair | 0 (0.0%) | 0 (0.0%) |
| Total (Category) | 0 (0.0%) | 0 (0.0%) |
| Total (Overall) | 399 (61.8%) | 247 (38.2%) |
Production, Transportation and Moving Occupations
The most common Production, Transportation and Moving occupations in Mooreville are , and Production (6 | 0.9%).
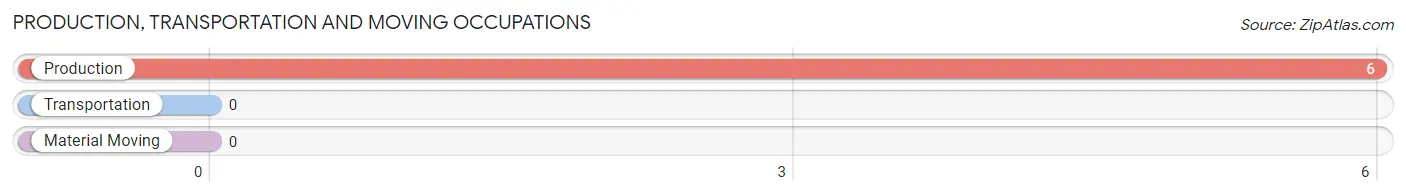
Production, Transportation and Moving Occupations by Sex
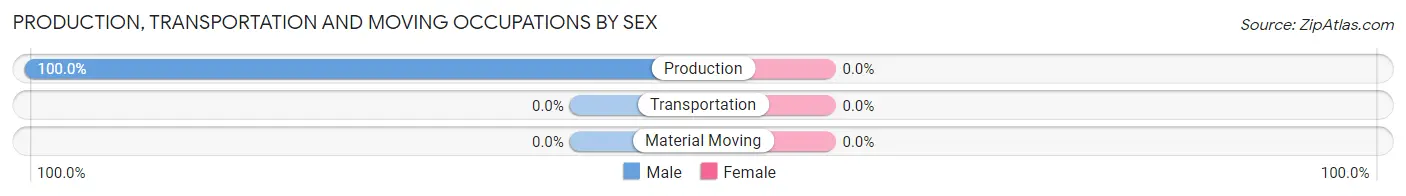
| Occupation | Male | Female |
| Production | 6 (100.0%) | 0 (0.0%) |
| Transportation | 0 (0.0%) | 0 (0.0%) |
| Material Moving | 0 (0.0%) | 0 (0.0%) |
| Total (Category) | 6 (100.0%) | 0 (0.0%) |
| Total (Overall) | 399 (61.8%) | 247 (38.2%) |
Employment Industries by Sex in Mooreville
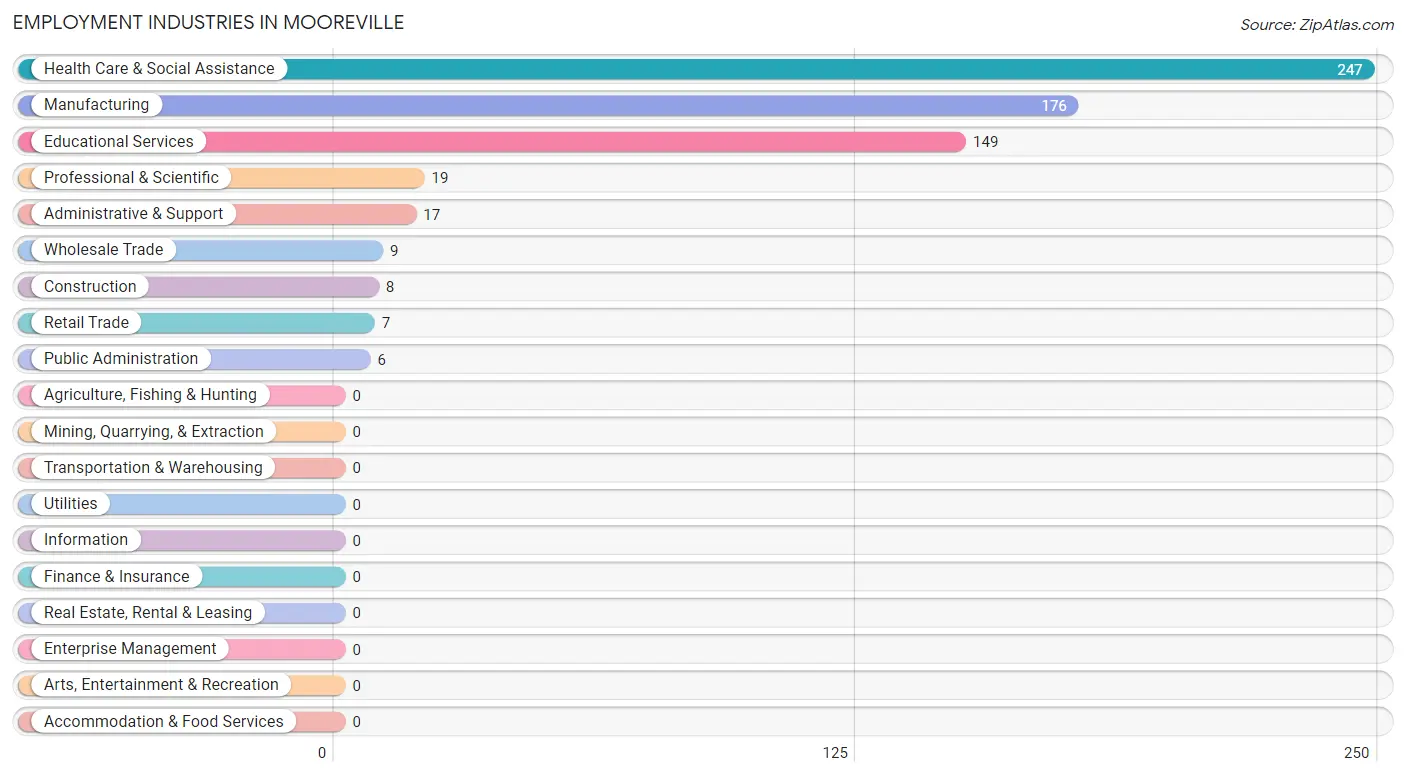
Employment Industries in Mooreville
The major employment industries in Mooreville include Health Care & Social Assistance (247 | 38.2%), Manufacturing (176 | 27.2%), Educational Services (149 | 23.1%), Professional & Scientific (19 | 2.9%), and Administrative & Support (17 | 2.6%).
Employment Industries by Sex in Mooreville
The Mooreville industries that see more men than women are Construction (100.0%), Manufacturing (100.0%), and Wholesale Trade (100.0%), whereas the industries that tend to have a higher number of women are Retail Trade (100.0%), Professional & Scientific (100.0%), and Administrative & Support (100.0%).
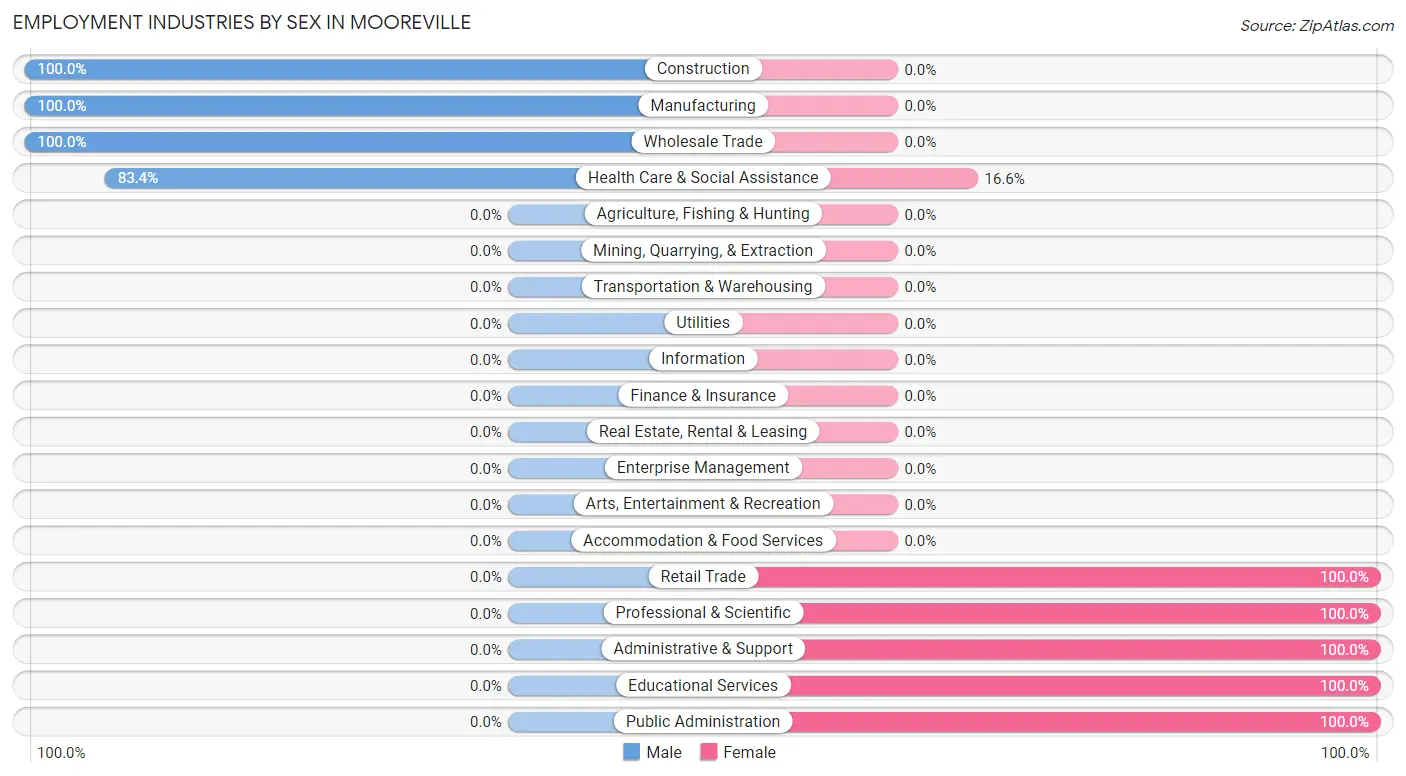
| Industry | Male | Female |
| Agriculture, Fishing & Hunting | 0 (0.0%) | 0 (0.0%) |
| Mining, Quarrying, & Extraction | 0 (0.0%) | 0 (0.0%) |
| Construction | 8 (100.0%) | 0 (0.0%) |
| Manufacturing | 176 (100.0%) | 0 (0.0%) |
| Wholesale Trade | 9 (100.0%) | 0 (0.0%) |
| Retail Trade | 0 (0.0%) | 7 (100.0%) |
| Transportation & Warehousing | 0 (0.0%) | 0 (0.0%) |
| Utilities | 0 (0.0%) | 0 (0.0%) |
| Information | 0 (0.0%) | 0 (0.0%) |
| Finance & Insurance | 0 (0.0%) | 0 (0.0%) |
| Real Estate, Rental & Leasing | 0 (0.0%) | 0 (0.0%) |
| Professional & Scientific | 0 (0.0%) | 19 (100.0%) |
| Enterprise Management | 0 (0.0%) | 0 (0.0%) |
| Administrative & Support | 0 (0.0%) | 17 (100.0%) |
| Educational Services | 0 (0.0%) | 149 (100.0%) |
| Health Care & Social Assistance | 206 (83.4%) | 41 (16.6%) |
| Arts, Entertainment & Recreation | 0 (0.0%) | 0 (0.0%) |
| Accommodation & Food Services | 0 (0.0%) | 0 (0.0%) |
| Public Administration | 0 (0.0%) | 6 (100.0%) |
| Total | 399 (61.8%) | 247 (38.2%) |
Education in Mooreville
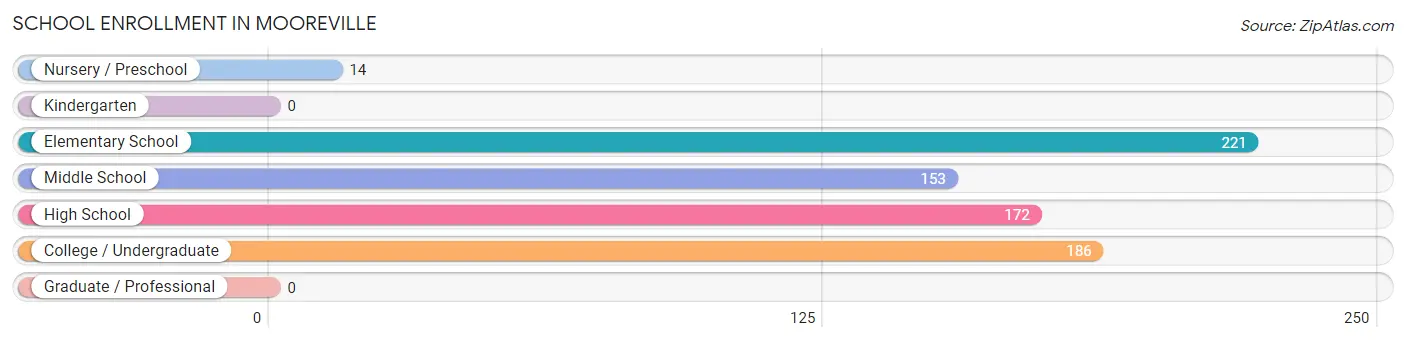
School Enrollment in Mooreville
The most common levels of schooling among the 746 students in Mooreville are elementary school (221 | 29.6%), college / undergraduate (186 | 24.9%), and high school (172 | 23.1%).
| School Level | # Students | % Students |
| Nursery / Preschool | 14 | 1.9% |
| Kindergarten | 0 | 0.0% |
| Elementary School | 221 | 29.6% |
| Middle School | 153 | 20.5% |
| High School | 172 | 23.1% |
| College / Undergraduate | 186 | 24.9% |
| Graduate / Professional | 0 | 0.0% |
| Total | 746 | 100.0% |
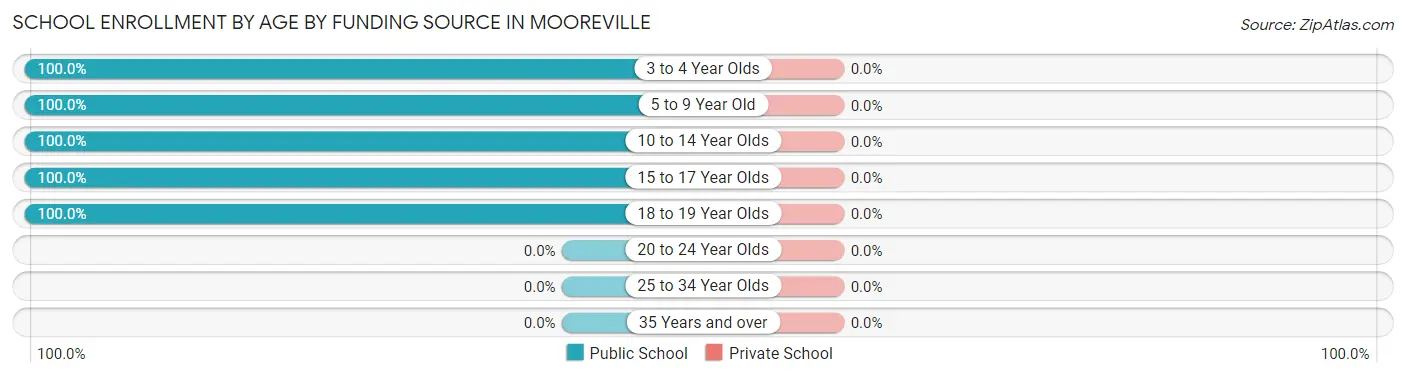
School Enrollment by Age by Funding Source in Mooreville
| Age Bracket | Public School | Private School |
| 3 to 4 Year Olds | 14 (100.0%) | 0 (0.0%) |
| 5 to 9 Year Old | 221 (100.0%) | 0 (0.0%) |
| 10 to 14 Year Olds | 153 (100.0%) | 0 (0.0%) |
| 15 to 17 Year Olds | 172 (100.0%) | 0 (0.0%) |
| 18 to 19 Year Olds | 186 (100.0%) | 0 (0.0%) |
| 20 to 24 Year Olds | 0 (0.0%) | 0 (0.0%) |
| 25 to 34 Year Olds | 0 (0.0%) | 0 (0.0%) |
| 35 Years and over | 0 (0.0%) | 0 (0.0%) |
| Total | 746 (100.0%) | 0 (0.0%) |
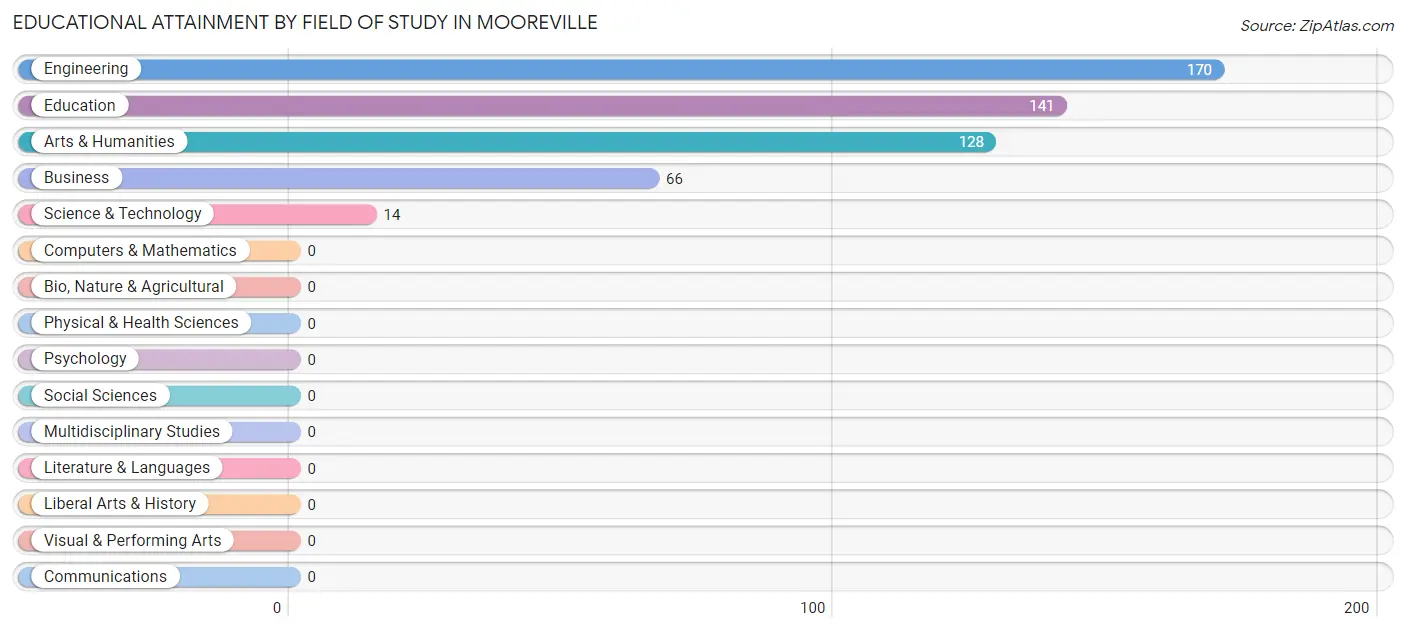
Educational Attainment by Field of Study in Mooreville
Engineering (170 | 32.8%), education (141 | 27.2%), arts & humanities (128 | 24.7%), business (66 | 12.7%), and science & technology (14 | 2.7%) are the most common fields of study among 519 individuals in Mooreville who have obtained a bachelor's degree or higher.
| Field of Study | # Graduates | % Graduates |
| Computers & Mathematics | 0 | 0.0% |
| Bio, Nature & Agricultural | 0 | 0.0% |
| Physical & Health Sciences | 0 | 0.0% |
| Psychology | 0 | 0.0% |
| Social Sciences | 0 | 0.0% |
| Engineering | 170 | 32.8% |
| Multidisciplinary Studies | 0 | 0.0% |
| Science & Technology | 14 | 2.7% |
| Business | 66 | 12.7% |
| Education | 141 | 27.2% |
| Literature & Languages | 0 | 0.0% |
| Liberal Arts & History | 0 | 0.0% |
| Visual & Performing Arts | 0 | 0.0% |
| Communications | 0 | 0.0% |
| Arts & Humanities | 128 | 24.7% |
| Total | 519 | 100.0% |
Transportation & Commute in Mooreville
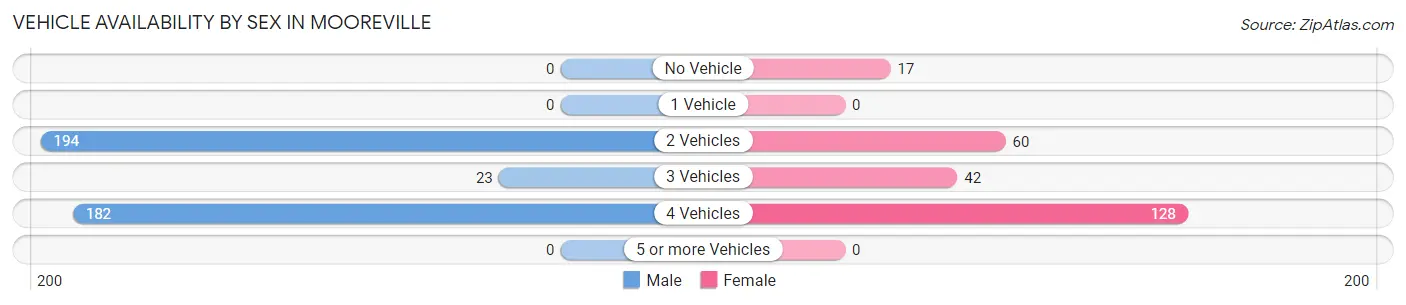
Vehicle Availability by Sex in Mooreville
The most prevalent vehicle ownership categories in Mooreville are males with 2 vehicles (194, accounting for 48.6%) and females with 2 vehicles (60, making up 78.5%).
| Vehicles Available | Male | Female |
| No Vehicle | 0 (0.0%) | 17 (6.9%) |
| 1 Vehicle | 0 (0.0%) | 0 (0.0%) |
| 2 Vehicles | 194 (48.6%) | 60 (24.3%) |
| 3 Vehicles | 23 (5.8%) | 42 (17.0%) |
| 4 Vehicles | 182 (45.6%) | 128 (51.8%) |
| 5 or more Vehicles | 0 (0.0%) | 0 (0.0%) |
| Total | 399 (100.0%) | 247 (100.0%) |
Commute Time in Mooreville
The most frequently occuring commute durations in Mooreville are 15 to 19 minutes (256 commuters, 40.4%), 25 to 29 minutes (152 commuters, 24.0%), and 10 to 14 minutes (137 commuters, 21.6%).
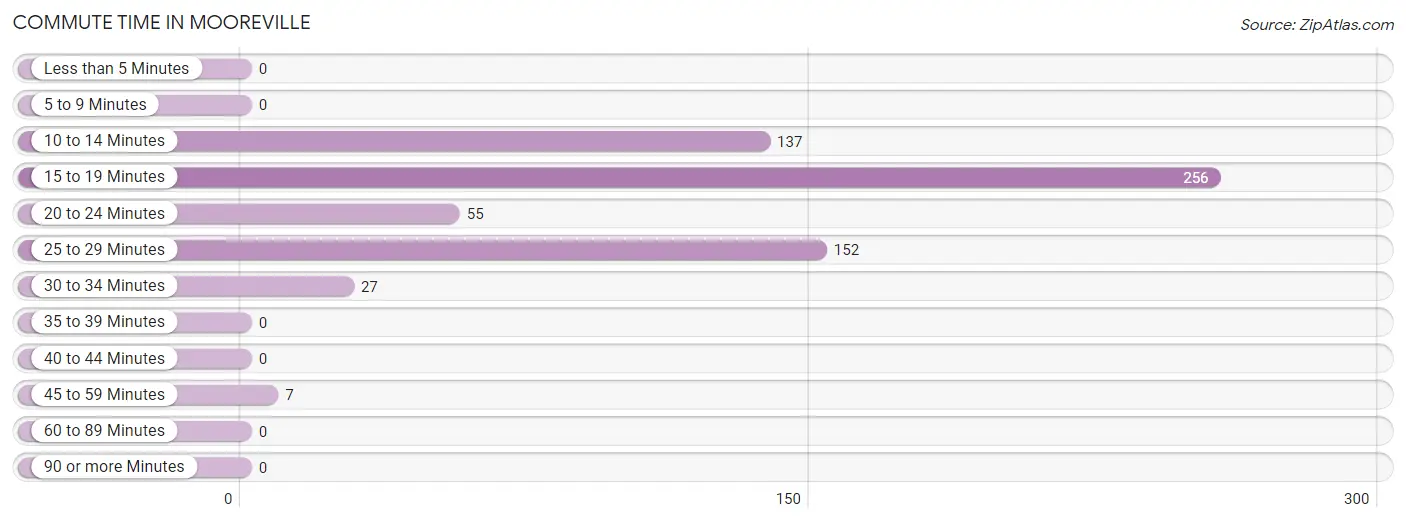
| Commute Time | # Commuters | % Commuters |
| Less than 5 Minutes | 0 | 0.0% |
| 5 to 9 Minutes | 0 | 0.0% |
| 10 to 14 Minutes | 137 | 21.6% |
| 15 to 19 Minutes | 256 | 40.4% |
| 20 to 24 Minutes | 55 | 8.7% |
| 25 to 29 Minutes | 152 | 24.0% |
| 30 to 34 Minutes | 27 | 4.3% |
| 35 to 39 Minutes | 0 | 0.0% |
| 40 to 44 Minutes | 0 | 0.0% |
| 45 to 59 Minutes | 7 | 1.1% |
| 60 to 89 Minutes | 0 | 0.0% |
| 90 or more Minutes | 0 | 0.0% |
Commute Time by Sex in Mooreville
The most common commute times in Mooreville are 15 to 19 minutes (195 commuters, 49.6%) for males and 10 to 14 minutes (128 commuters, 53.1%) for females.
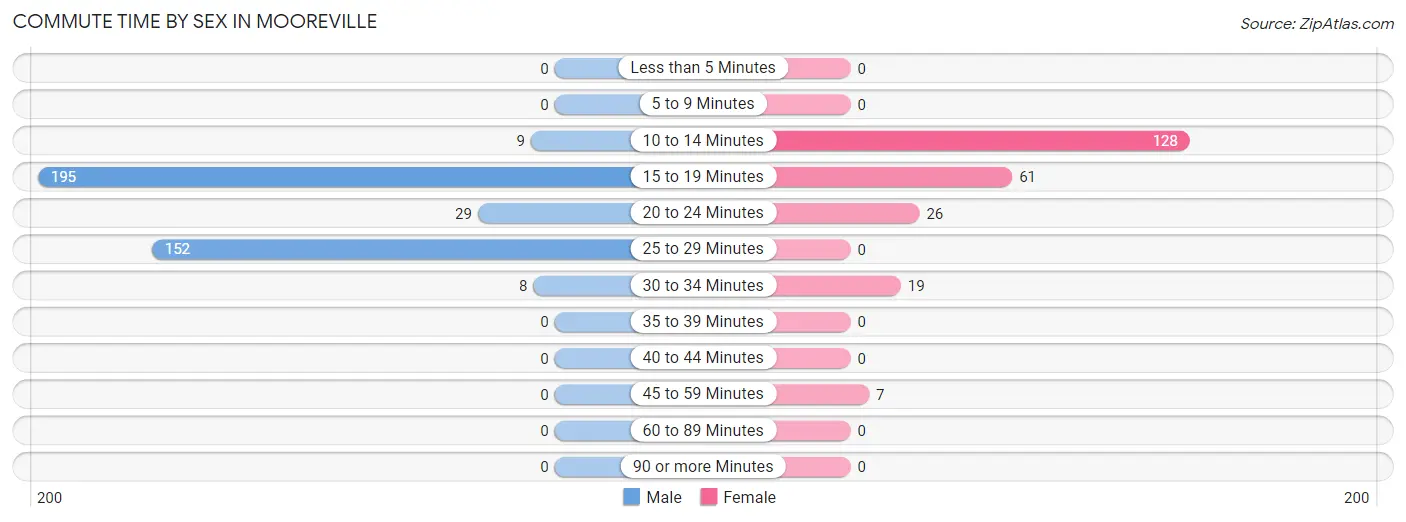
| Commute Time | Male | Female |
| Less than 5 Minutes | 0 (0.0%) | 0 (0.0%) |
| 5 to 9 Minutes | 0 (0.0%) | 0 (0.0%) |
| 10 to 14 Minutes | 9 (2.3%) | 128 (53.1%) |
| 15 to 19 Minutes | 195 (49.6%) | 61 (25.3%) |
| 20 to 24 Minutes | 29 (7.4%) | 26 (10.8%) |
| 25 to 29 Minutes | 152 (38.7%) | 0 (0.0%) |
| 30 to 34 Minutes | 8 (2.0%) | 19 (7.9%) |
| 35 to 39 Minutes | 0 (0.0%) | 0 (0.0%) |
| 40 to 44 Minutes | 0 (0.0%) | 0 (0.0%) |
| 45 to 59 Minutes | 0 (0.0%) | 7 (2.9%) |
| 60 to 89 Minutes | 0 (0.0%) | 0 (0.0%) |
| 90 or more Minutes | 0 (0.0%) | 0 (0.0%) |
Time of Departure to Work by Sex in Mooreville
The most frequent times of departure to work in Mooreville are 7:00 AM to 7:29 AM (328, 83.5%) for males and 5:30 AM to 5:59 AM (128, 53.1%) for females.
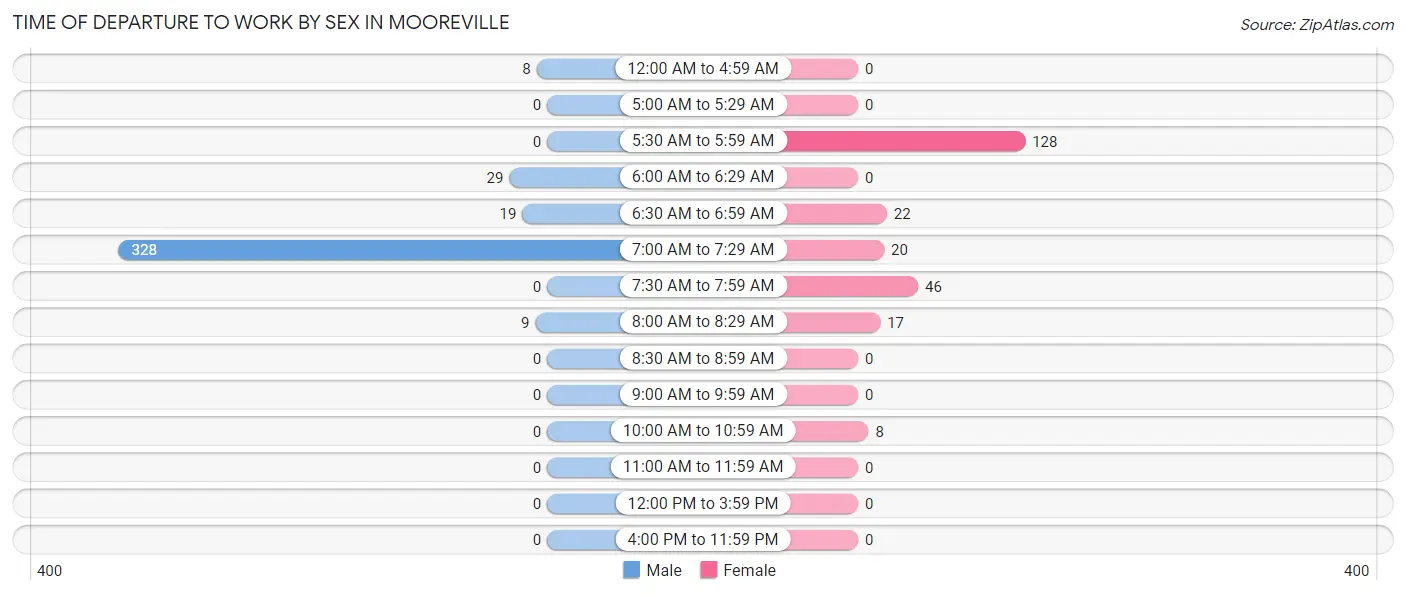
| Time of Departure | Male | Female |
| 12:00 AM to 4:59 AM | 8 (2.0%) | 0 (0.0%) |
| 5:00 AM to 5:29 AM | 0 (0.0%) | 0 (0.0%) |
| 5:30 AM to 5:59 AM | 0 (0.0%) | 128 (53.1%) |
| 6:00 AM to 6:29 AM | 29 (7.4%) | 0 (0.0%) |
| 6:30 AM to 6:59 AM | 19 (4.8%) | 22 (9.1%) |
| 7:00 AM to 7:29 AM | 328 (83.5%) | 20 (8.3%) |
| 7:30 AM to 7:59 AM | 0 (0.0%) | 46 (19.1%) |
| 8:00 AM to 8:29 AM | 9 (2.3%) | 17 (7.0%) |
| 8:30 AM to 8:59 AM | 0 (0.0%) | 0 (0.0%) |
| 9:00 AM to 9:59 AM | 0 (0.0%) | 0 (0.0%) |
| 10:00 AM to 10:59 AM | 0 (0.0%) | 8 (3.3%) |
| 11:00 AM to 11:59 AM | 0 (0.0%) | 0 (0.0%) |
| 12:00 PM to 3:59 PM | 0 (0.0%) | 0 (0.0%) |
| 4:00 PM to 11:59 PM | 0 (0.0%) | 0 (0.0%) |
| Total | 393 (100.0%) | 241 (100.0%) |
Housing Occupancy in Mooreville
Occupancy by Ownership in Mooreville
Of the total 442 dwellings in Mooreville, owner-occupied units account for 368 (83.3%), while renter-occupied units make up 74 (16.7%).
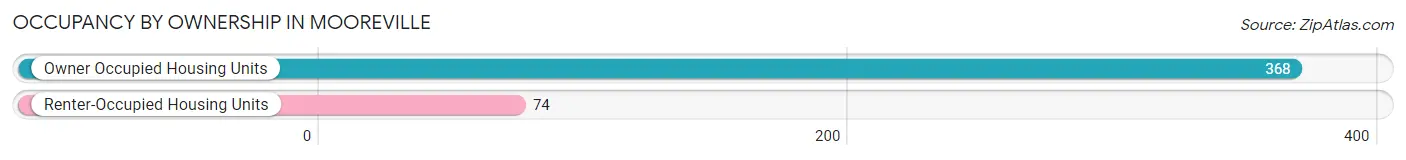
| Occupancy | # Housing Units | % Housing Units |
| Owner Occupied Housing Units | 368 | 83.3% |
| Renter-Occupied Housing Units | 74 | 16.7% |
| Total Occupied Housing Units | 442 | 100.0% |
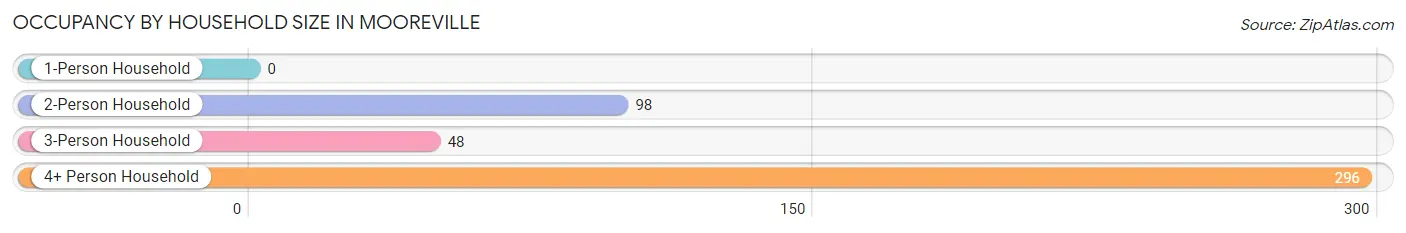
Occupancy by Household Size in Mooreville
| Household Size | # Housing Units | % Housing Units |
| 1-Person Household | 0 | 0.0% |
| 2-Person Household | 98 | 22.2% |
| 3-Person Household | 48 | 10.9% |
| 4+ Person Household | 296 | 67.0% |
| Total Housing Units | 442 | 100.0% |
Occupancy by Ownership by Household Size in Mooreville
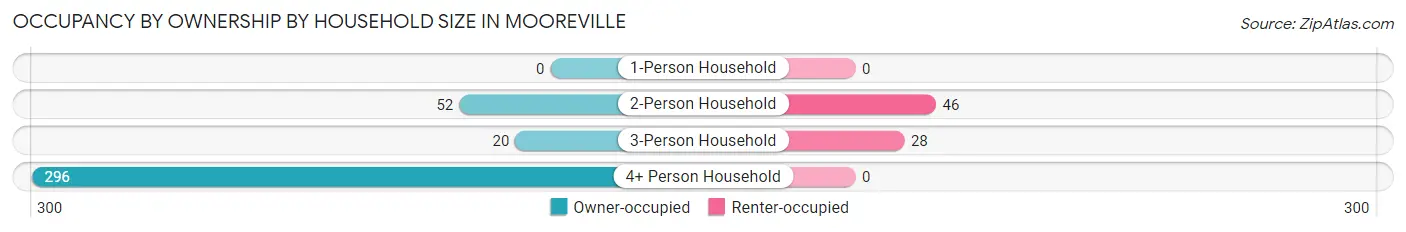
| Household Size | Owner-occupied | Renter-occupied |
| 1-Person Household | 0 (0.0%) | 0 (0.0%) |
| 2-Person Household | 52 (53.1%) | 46 (46.9%) |
| 3-Person Household | 20 (41.7%) | 28 (58.3%) |
| 4+ Person Household | 296 (100.0%) | 0 (0.0%) |
| Total Housing Units | 368 (83.3%) | 74 (16.7%) |
Occupancy by Educational Attainment in Mooreville
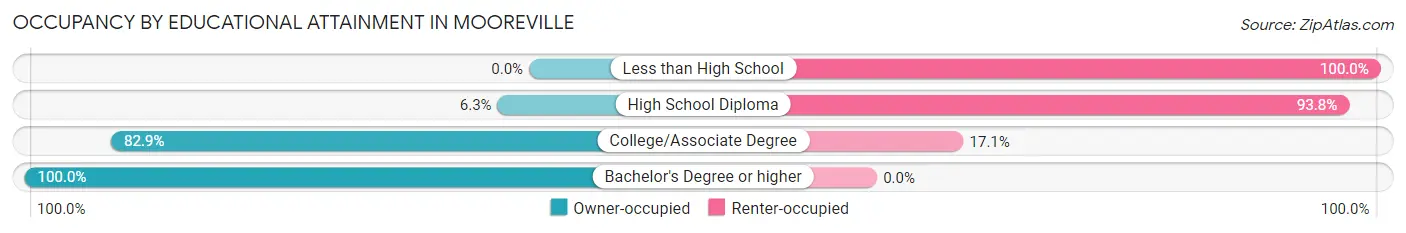
| Household Size | Owner-occupied | Renter-occupied |
| Less than High School | 0 (0.0%) | 23 (100.0%) |
| High School Diploma | 3 (6.2%) | 45 (93.8%) |
| College/Associate Degree | 29 (82.9%) | 6 (17.1%) |
| Bachelor's Degree or higher | 336 (100.0%) | 0 (0.0%) |
Occupancy by Age of Householder in Mooreville
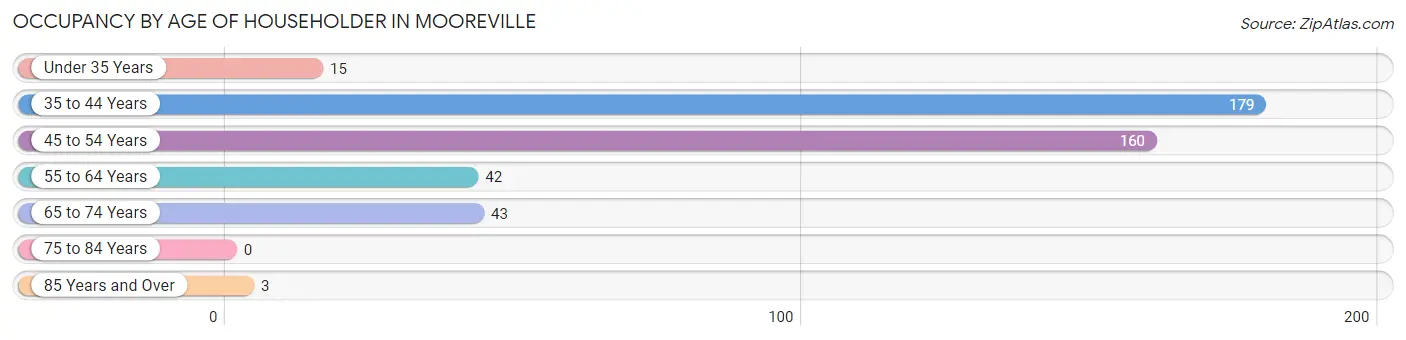
| Age Bracket | # Households | % Households |
| Under 35 Years | 15 | 3.4% |
| 35 to 44 Years | 179 | 40.5% |
| 45 to 54 Years | 160 | 36.2% |
| 55 to 64 Years | 42 | 9.5% |
| 65 to 74 Years | 43 | 9.7% |
| 75 to 84 Years | 0 | 0.0% |
| 85 Years and Over | 3 | 0.7% |
| Total | 442 | 100.0% |
Housing Finances in Mooreville
Median Income by Occupancy in Mooreville
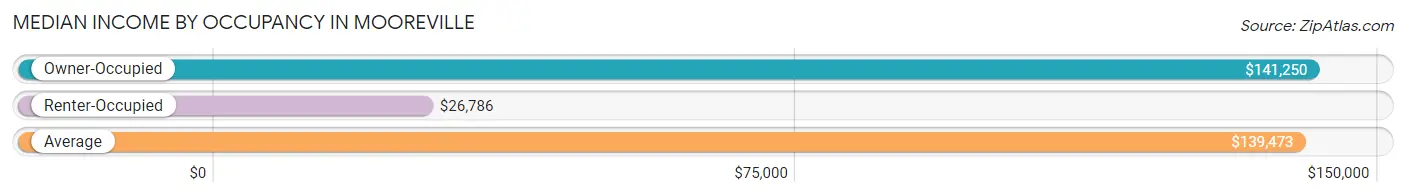
| Occupancy Type | # Households | Median Income |
| Owner-Occupied | 368 (83.3%) | $141,250 |
| Renter-Occupied | 74 (16.7%) | $26,786 |
| Average | 442 (100.0%) | $139,473 |
Occupancy by Householder Income Bracket in Mooreville
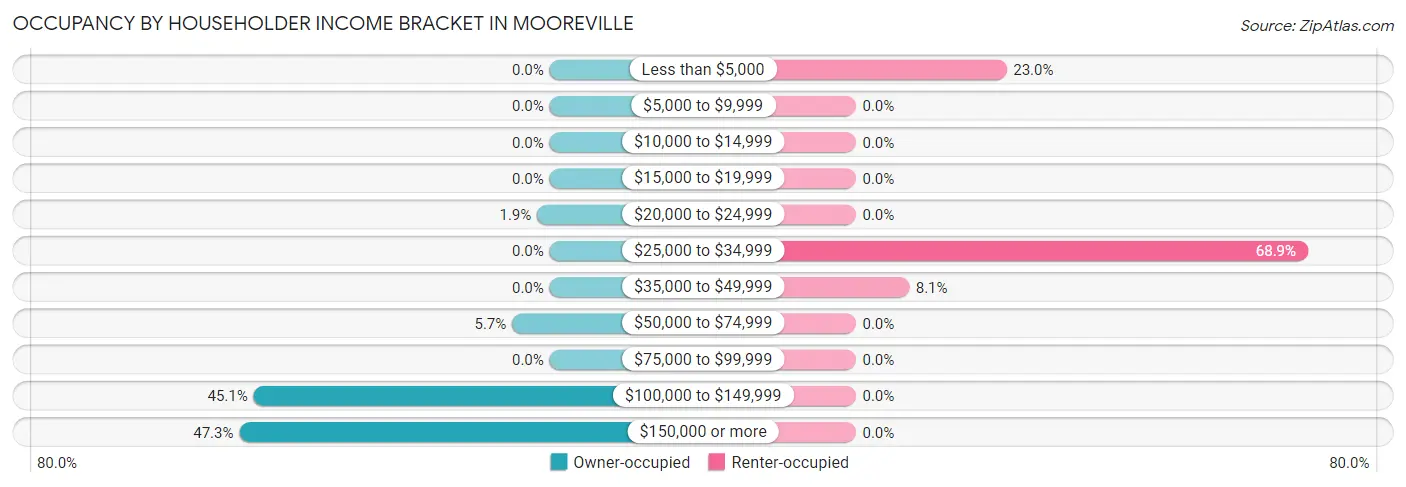
| Income Bracket | Owner-occupied | Renter-occupied |
| Less than $5,000 | 0 (0.0%) | 17 (23.0%) |
| $5,000 to $9,999 | 0 (0.0%) | 0 (0.0%) |
| $10,000 to $14,999 | 0 (0.0%) | 0 (0.0%) |
| $15,000 to $19,999 | 0 (0.0%) | 0 (0.0%) |
| $20,000 to $24,999 | 7 (1.9%) | 0 (0.0%) |
| $25,000 to $34,999 | 0 (0.0%) | 51 (68.9%) |
| $35,000 to $49,999 | 0 (0.0%) | 6 (8.1%) |
| $50,000 to $74,999 | 21 (5.7%) | 0 (0.0%) |
| $75,000 to $99,999 | 0 (0.0%) | 0 (0.0%) |
| $100,000 to $149,999 | 166 (45.1%) | 0 (0.0%) |
| $150,000 or more | 174 (47.3%) | 0 (0.0%) |
| Total | 368 (100.0%) | 74 (100.0%) |
Monthly Housing Cost Tiers in Mooreville
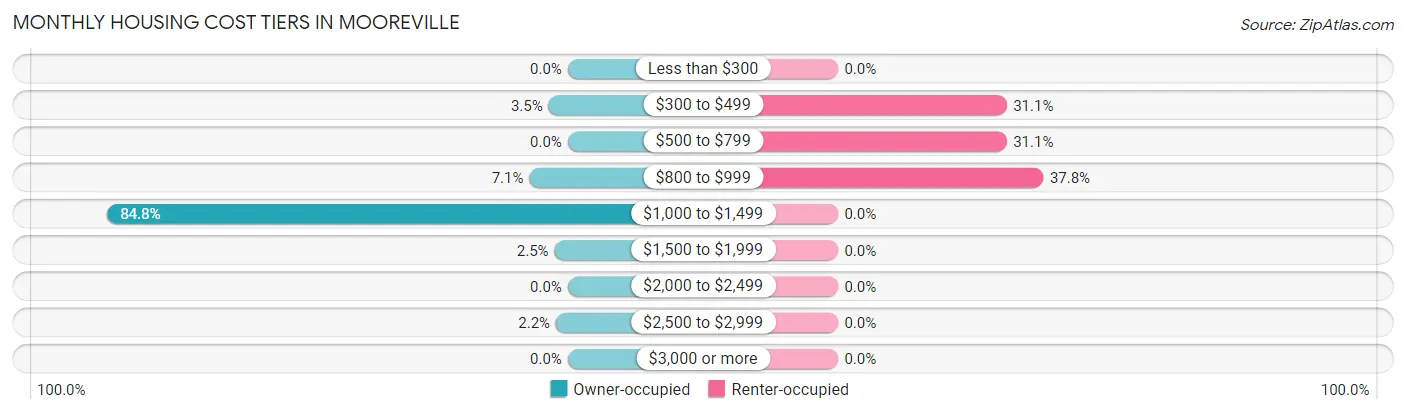
| Monthly Cost | Owner-occupied | Renter-occupied |
| Less than $300 | 0 (0.0%) | 0 (0.0%) |
| $300 to $499 | 13 (3.5%) | 23 (31.1%) |
| $500 to $799 | 0 (0.0%) | 23 (31.1%) |
| $800 to $999 | 26 (7.1%) | 28 (37.8%) |
| $1,000 to $1,499 | 312 (84.8%) | 0 (0.0%) |
| $1,500 to $1,999 | 9 (2.5%) | 0 (0.0%) |
| $2,000 to $2,499 | 0 (0.0%) | 0 (0.0%) |
| $2,500 to $2,999 | 8 (2.2%) | 0 (0.0%) |
| $3,000 or more | 0 (0.0%) | 0 (0.0%) |
| Total | 368 (100.0%) | 74 (100.0%) |
Physical Housing Characteristics in Mooreville
Housing Structures in Mooreville
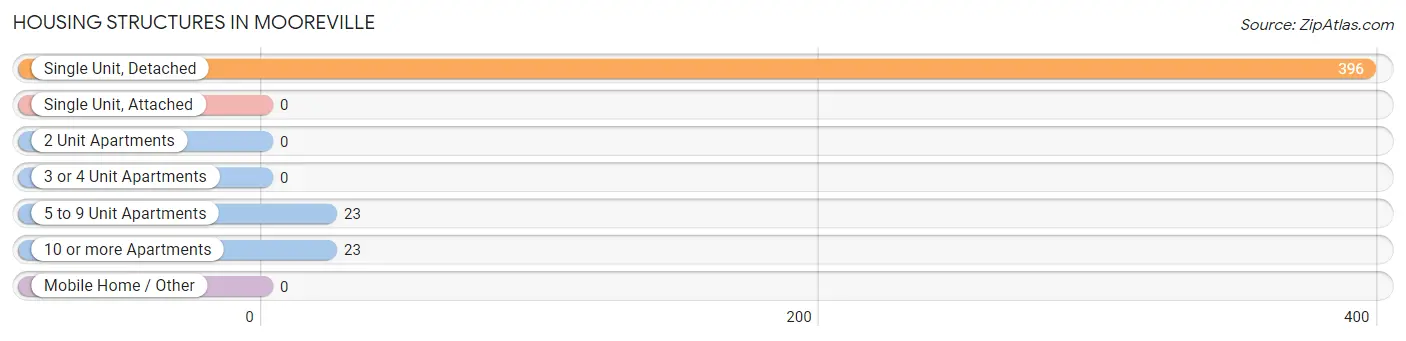
| Structure Type | # Housing Units | % Housing Units |
| Single Unit, Detached | 396 | 89.6% |
| Single Unit, Attached | 0 | 0.0% |
| 2 Unit Apartments | 0 | 0.0% |
| 3 or 4 Unit Apartments | 0 | 0.0% |
| 5 to 9 Unit Apartments | 23 | 5.2% |
| 10 or more Apartments | 23 | 5.2% |
| Mobile Home / Other | 0 | 0.0% |
| Total | 442 | 100.0% |
Housing Structures by Occupancy in Mooreville
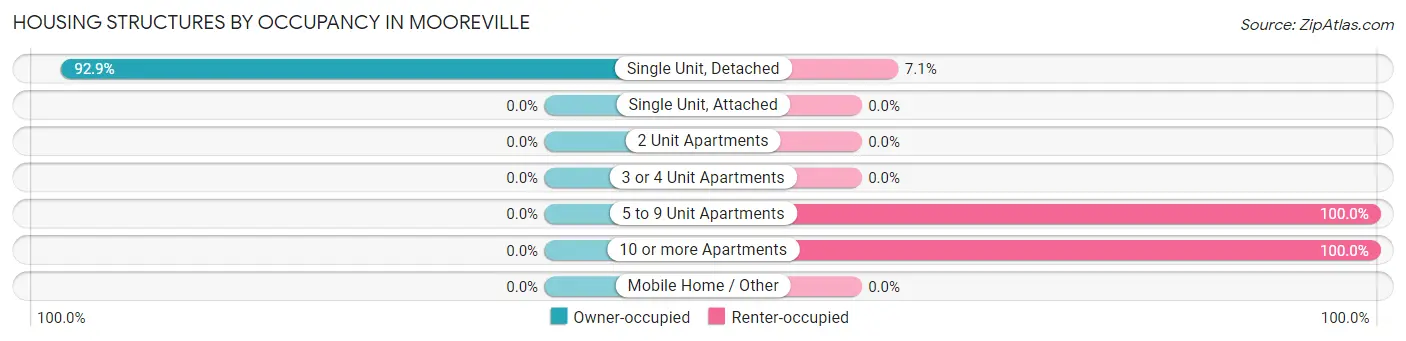
| Structure Type | Owner-occupied | Renter-occupied |
| Single Unit, Detached | 368 (92.9%) | 28 (7.1%) |
| Single Unit, Attached | 0 (0.0%) | 0 (0.0%) |
| 2 Unit Apartments | 0 (0.0%) | 0 (0.0%) |
| 3 or 4 Unit Apartments | 0 (0.0%) | 0 (0.0%) |
| 5 to 9 Unit Apartments | 0 (0.0%) | 23 (100.0%) |
| 10 or more Apartments | 0 (0.0%) | 23 (100.0%) |
| Mobile Home / Other | 0 (0.0%) | 0 (0.0%) |
| Total | 368 (83.3%) | 74 (16.7%) |
Housing Structures by Number of Rooms in Mooreville
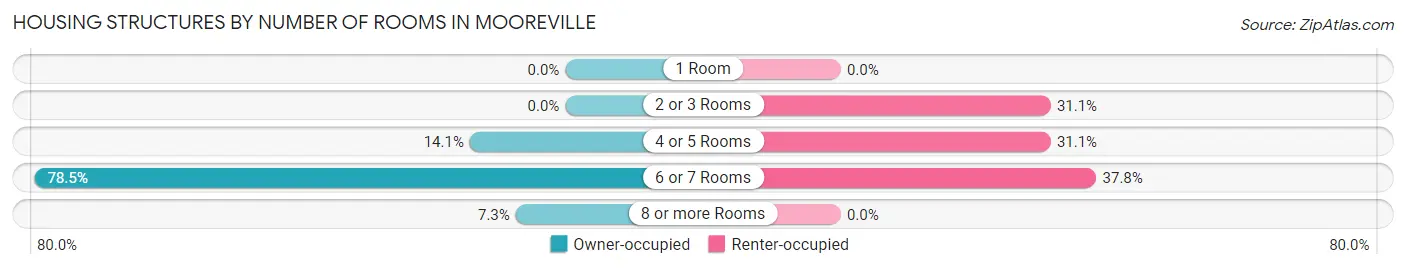
| Number of Rooms | Owner-occupied | Renter-occupied |
| 1 Room | 0 (0.0%) | 0 (0.0%) |
| 2 or 3 Rooms | 0 (0.0%) | 23 (31.1%) |
| 4 or 5 Rooms | 52 (14.1%) | 23 (31.1%) |
| 6 or 7 Rooms | 289 (78.5%) | 28 (37.8%) |
| 8 or more Rooms | 27 (7.3%) | 0 (0.0%) |
| Total | 368 (100.0%) | 74 (100.0%) |
Housing Structure by Heating Type in Mooreville
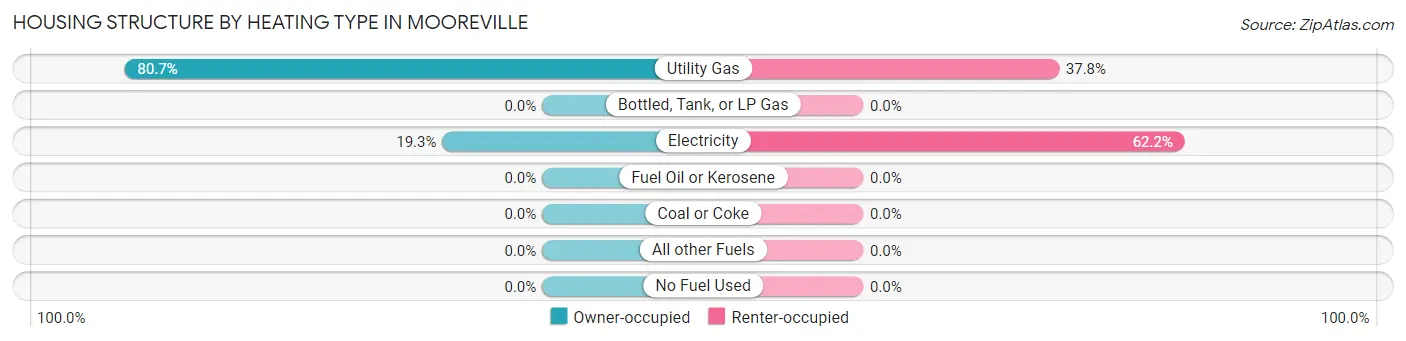
| Heating Type | Owner-occupied | Renter-occupied |
| Utility Gas | 297 (80.7%) | 28 (37.8%) |
| Bottled, Tank, or LP Gas | 0 (0.0%) | 0 (0.0%) |
| Electricity | 71 (19.3%) | 46 (62.2%) |
| Fuel Oil or Kerosene | 0 (0.0%) | 0 (0.0%) |
| Coal or Coke | 0 (0.0%) | 0 (0.0%) |
| All other Fuels | 0 (0.0%) | 0 (0.0%) |
| No Fuel Used | 0 (0.0%) | 0 (0.0%) |
| Total | 368 (100.0%) | 74 (100.0%) |
Household Vehicle Usage in Mooreville
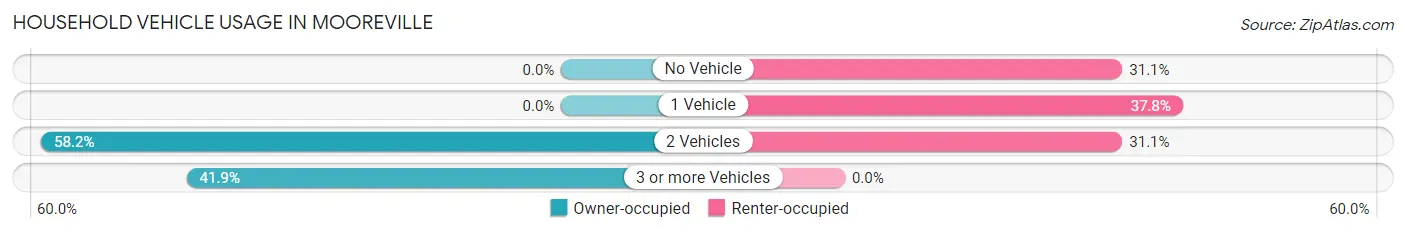
| Vehicles per Household | Owner-occupied | Renter-occupied |
| No Vehicle | 0 (0.0%) | 23 (31.1%) |
| 1 Vehicle | 0 (0.0%) | 28 (37.8%) |
| 2 Vehicles | 214 (58.2%) | 23 (31.1%) |
| 3 or more Vehicles | 154 (41.8%) | 0 (0.0%) |
| Total | 368 (100.0%) | 74 (100.0%) |
Real Estate & Mortgages in Mooreville
Real Estate and Mortgage Overview in Mooreville
| Characteristic | Without Mortgage | With Mortgage |
| Housing Units | 13 | 355 |
| Median Property Value | - | - |
| Median Household Income | - | - |
| Monthly Housing Costs | - | - |
| Real Estate Taxes | - | - |
Property Value by Mortgage Status in Mooreville
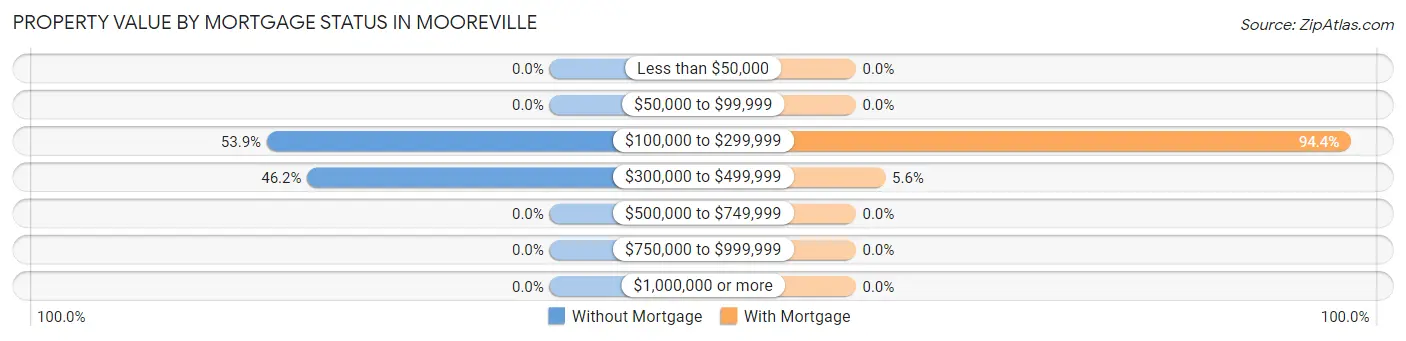
| Property Value | Without Mortgage | With Mortgage |
| Less than $50,000 | 0 (0.0%) | 0 (0.0%) |
| $50,000 to $99,999 | 0 (0.0%) | 0 (0.0%) |
| $100,000 to $299,999 | 7 (53.8%) | 335 (94.4%) |
| $300,000 to $499,999 | 6 (46.2%) | 20 (5.6%) |
| $500,000 to $749,999 | 0 (0.0%) | 0 (0.0%) |
| $750,000 to $999,999 | 0 (0.0%) | 0 (0.0%) |
| $1,000,000 or more | 0 (0.0%) | 0 (0.0%) |
| Total | 13 (100.0%) | 355 (100.0%) |
Household Income by Mortgage Status in Mooreville
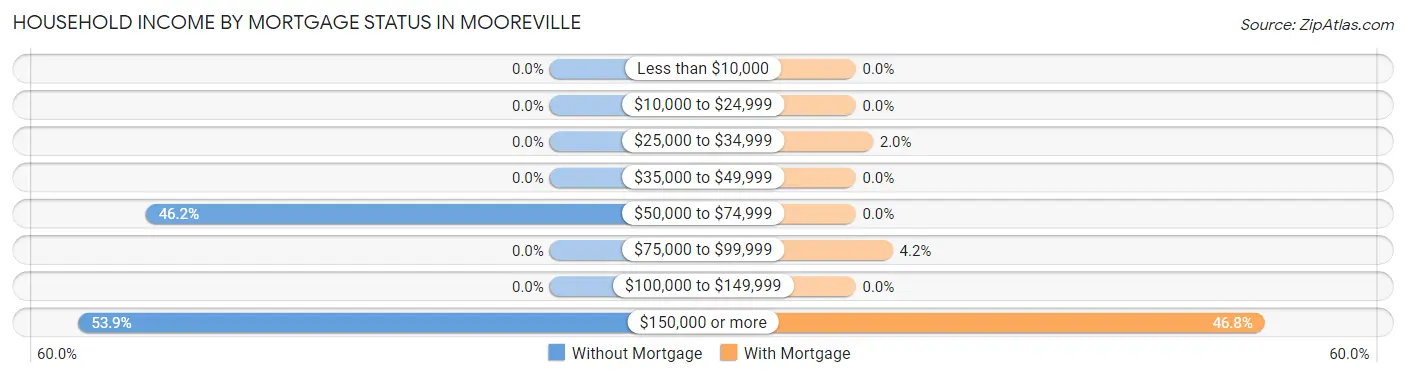
| Household Income | Without Mortgage | With Mortgage |
| Less than $10,000 | 0 (0.0%) | 0 (0.0%) |
| $10,000 to $24,999 | 0 (0.0%) | 0 (0.0%) |
| $25,000 to $34,999 | 0 (0.0%) | 7 (2.0%) |
| $35,000 to $49,999 | 0 (0.0%) | 0 (0.0%) |
| $50,000 to $74,999 | 6 (46.2%) | 0 (0.0%) |
| $75,000 to $99,999 | 0 (0.0%) | 15 (4.2%) |
| $100,000 to $149,999 | 0 (0.0%) | 0 (0.0%) |
| $150,000 or more | 7 (53.8%) | 166 (46.8%) |
| Total | 13 (100.0%) | 355 (100.0%) |
Property Value to Household Income Ratio in Mooreville
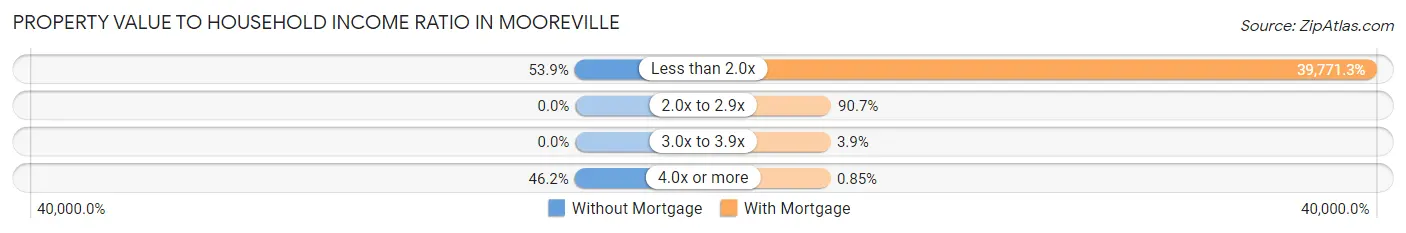
| Value-to-Income Ratio | Without Mortgage | With Mortgage |
| Less than 2.0x | 7 (53.8%) | 141,188 (39,771.3%) |
| 2.0x to 2.9x | 0 (0.0%) | 322 (90.7%) |
| 3.0x to 3.9x | 0 (0.0%) | 14 (3.9%) |
| 4.0x or more | 6 (46.2%) | 3 (0.9%) |
| Total | 13 (100.0%) | 355 (100.0%) |
Real Estate Taxes by Mortgage Status in Mooreville
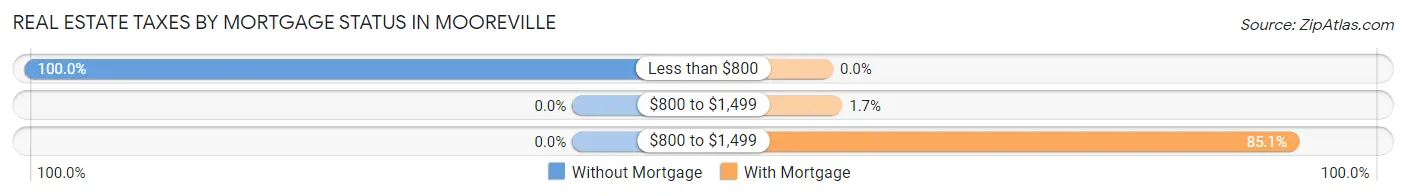
| Property Taxes | Without Mortgage | With Mortgage |
| Less than $800 | 13 (100.0%) | 0 (0.0%) |
| $800 to $1,499 | 0 (0.0%) | 6 (1.7%) |
| $800 to $1,499 | 0 (0.0%) | 302 (85.1%) |
| Total | 13 (100.0%) | 355 (100.0%) |
Health & Disability in Mooreville
Health Insurance Coverage by Age in Mooreville
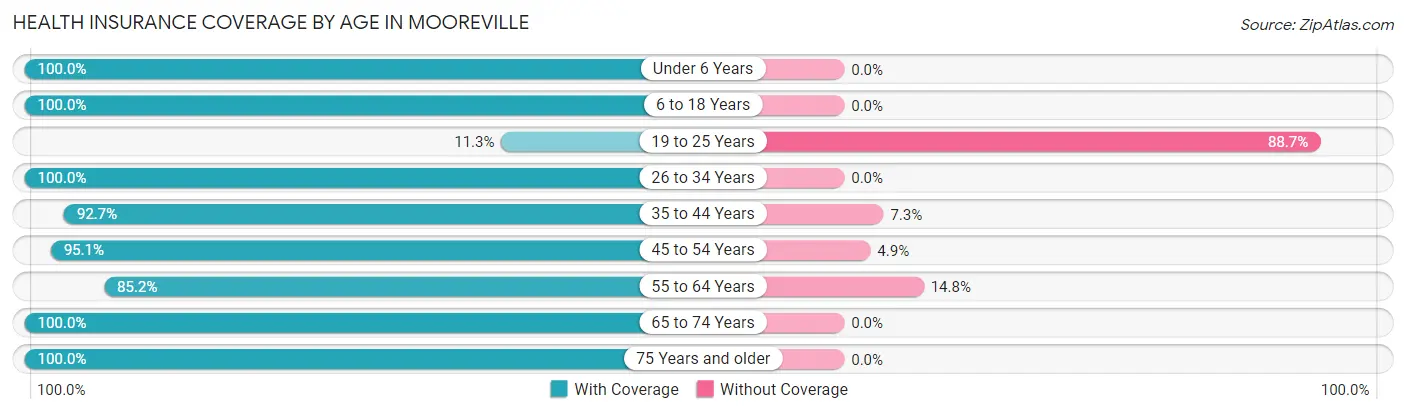
| Age Bracket | With Coverage | Without Coverage |
| Under 6 Years | 211 (100.0%) | 0 (0.0%) |
| 6 to 18 Years | 546 (100.0%) | 0 (0.0%) |
| 19 to 25 Years | 21 (11.3%) | 165 (88.7%) |
| 26 to 34 Years | 45 (100.0%) | 0 (0.0%) |
| 35 to 44 Years | 355 (92.7%) | 28 (7.3%) |
| 45 to 54 Years | 332 (95.1%) | 17 (4.9%) |
| 55 to 64 Years | 46 (85.2%) | 8 (14.8%) |
| 65 to 74 Years | 57 (100.0%) | 0 (0.0%) |
| 75 Years and older | 8 (100.0%) | 0 (0.0%) |
| Total | 1,621 (88.1%) | 218 (11.8%) |
Health Insurance Coverage by Citizenship Status in Mooreville
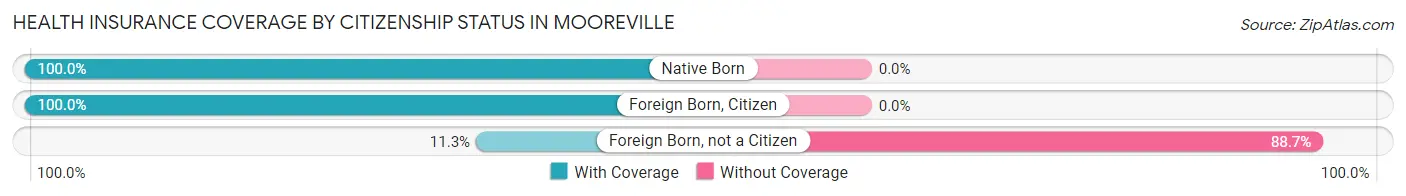
| Citizenship Status | With Coverage | Without Coverage |
| Native Born | 211 (100.0%) | 0 (0.0%) |
| Foreign Born, Citizen | 546 (100.0%) | 0 (0.0%) |
| Foreign Born, not a Citizen | 21 (11.3%) | 165 (88.7%) |
Health Insurance Coverage by Household Income in Mooreville
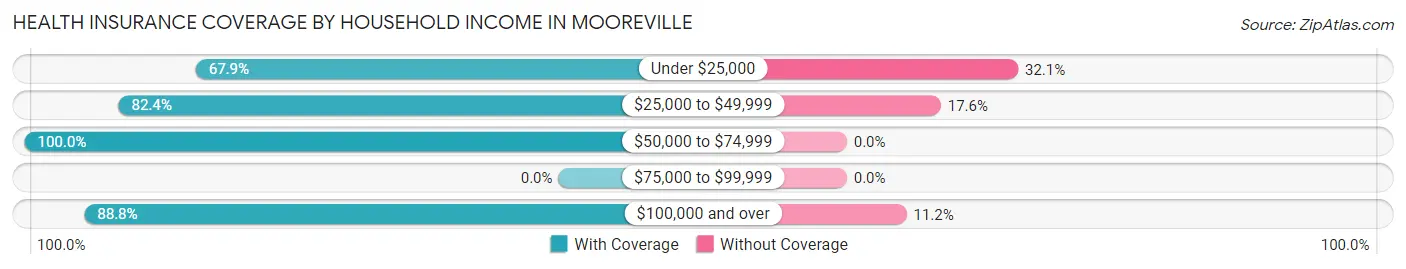
| Household Income | With Coverage | Without Coverage |
| Under $25,000 | 36 (67.9%) | 17 (32.1%) |
| $25,000 to $49,999 | 131 (82.4%) | 28 (17.6%) |
| $50,000 to $74,999 | 82 (100.0%) | 0 (0.0%) |
| $75,000 to $99,999 | 0 (0.0%) | 0 (0.0%) |
| $100,000 and over | 1,372 (88.8%) | 173 (11.2%) |
Public vs Private Health Insurance Coverage by Age in Mooreville
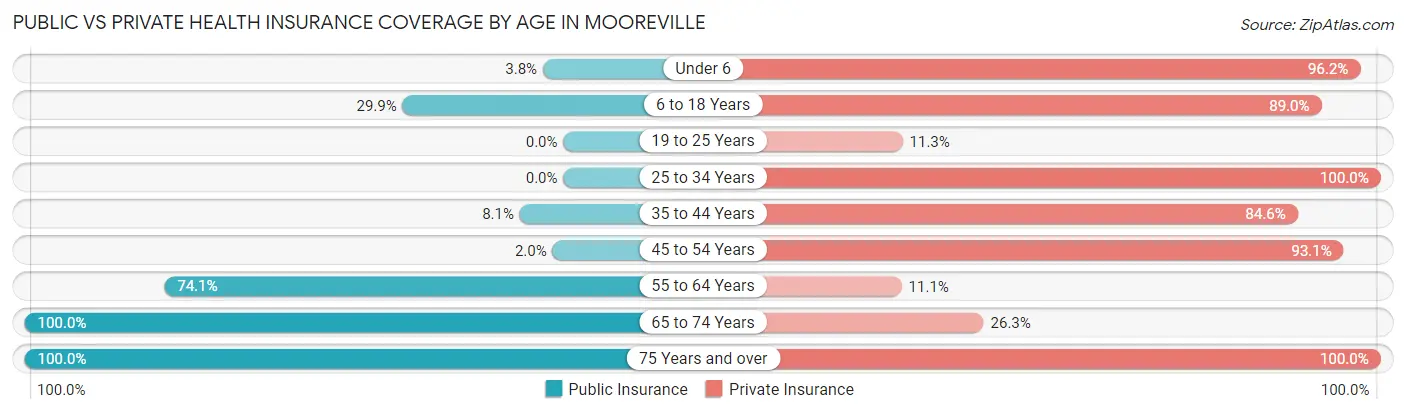
| Age Bracket | Public Insurance | Private Insurance |
| Under 6 | 8 (3.8%) | 203 (96.2%) |
| 6 to 18 Years | 163 (29.8%) | 486 (89.0%) |
| 19 to 25 Years | 0 (0.0%) | 21 (11.3%) |
| 25 to 34 Years | 0 (0.0%) | 45 (100.0%) |
| 35 to 44 Years | 31 (8.1%) | 324 (84.6%) |
| 45 to 54 Years | 7 (2.0%) | 325 (93.1%) |
| 55 to 64 Years | 40 (74.1%) | 6 (11.1%) |
| 65 to 74 Years | 57 (100.0%) | 15 (26.3%) |
| 75 Years and over | 8 (100.0%) | 8 (100.0%) |
| Total | 314 (17.1%) | 1,433 (77.9%) |
Disability Status by Sex by Age in Mooreville
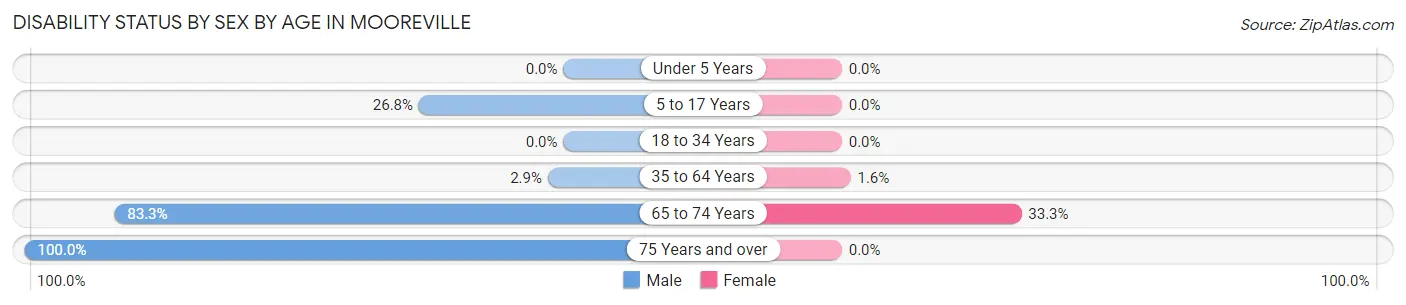
| Age Bracket | Male | Female |
| Under 5 Years | 0 (0.0%) | 0 (0.0%) |
| 5 to 17 Years | 103 (26.8%) | 0 (0.0%) |
| 18 to 34 Years | 0 (0.0%) | 0 (0.0%) |
| 35 to 64 Years | 12 (2.9%) | 6 (1.6%) |
| 65 to 74 Years | 30 (83.3%) | 7 (33.3%) |
| 75 Years and over | 3 (100.0%) | 0 (0.0%) |
Disability Class by Sex by Age in Mooreville
Disability Class: Hearing Difficulty
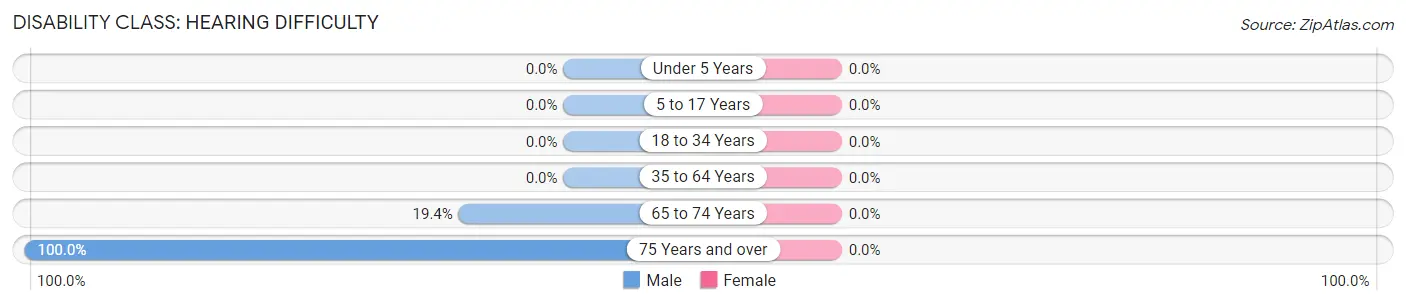
| Age Bracket | Male | Female |
| Under 5 Years | 0 (0.0%) | 0 (0.0%) |
| 5 to 17 Years | 0 (0.0%) | 0 (0.0%) |
| 18 to 34 Years | 0 (0.0%) | 0 (0.0%) |
| 35 to 64 Years | 0 (0.0%) | 0 (0.0%) |
| 65 to 74 Years | 7 (19.4%) | 0 (0.0%) |
| 75 Years and over | 3 (100.0%) | 0 (0.0%) |
Disability Class: Vision Difficulty
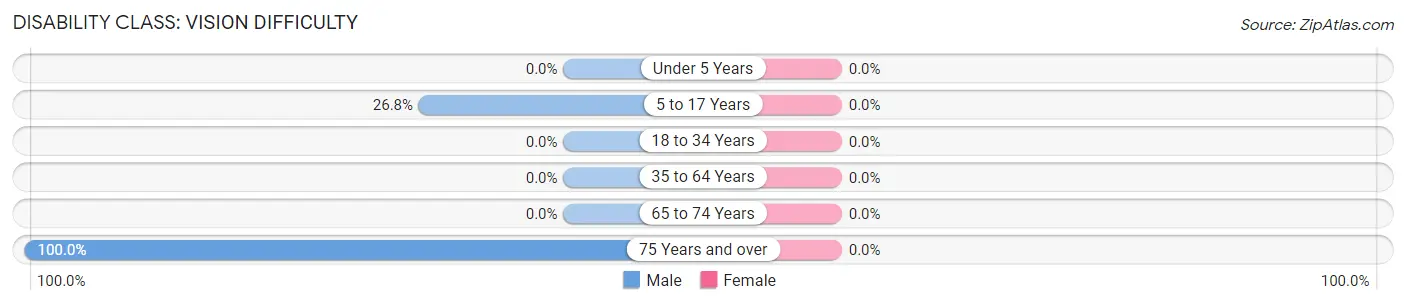
| Age Bracket | Male | Female |
| Under 5 Years | 0 (0.0%) | 0 (0.0%) |
| 5 to 17 Years | 103 (26.8%) | 0 (0.0%) |
| 18 to 34 Years | 0 (0.0%) | 0 (0.0%) |
| 35 to 64 Years | 0 (0.0%) | 0 (0.0%) |
| 65 to 74 Years | 0 (0.0%) | 0 (0.0%) |
| 75 Years and over | 3 (100.0%) | 0 (0.0%) |
Disability Class: Cognitive Difficulty
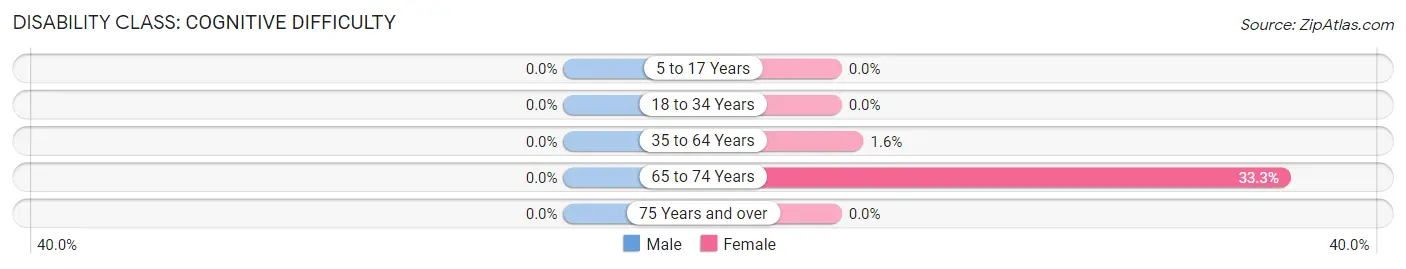
| Age Bracket | Male | Female |
| 5 to 17 Years | 0 (0.0%) | 0 (0.0%) |
| 18 to 34 Years | 0 (0.0%) | 0 (0.0%) |
| 35 to 64 Years | 0 (0.0%) | 6 (1.6%) |
| 65 to 74 Years | 0 (0.0%) | 7 (33.3%) |
| 75 Years and over | 0 (0.0%) | 0 (0.0%) |
Disability Class: Ambulatory Difficulty
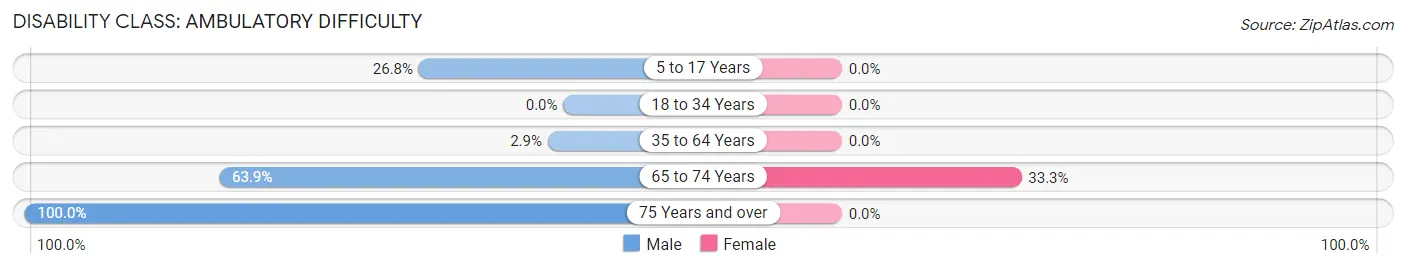
| Age Bracket | Male | Female |
| 5 to 17 Years | 103 (26.8%) | 0 (0.0%) |
| 18 to 34 Years | 0 (0.0%) | 0 (0.0%) |
| 35 to 64 Years | 12 (2.9%) | 0 (0.0%) |
| 65 to 74 Years | 23 (63.9%) | 7 (33.3%) |
| 75 Years and over | 3 (100.0%) | 0 (0.0%) |
Disability Class: Self-Care Difficulty
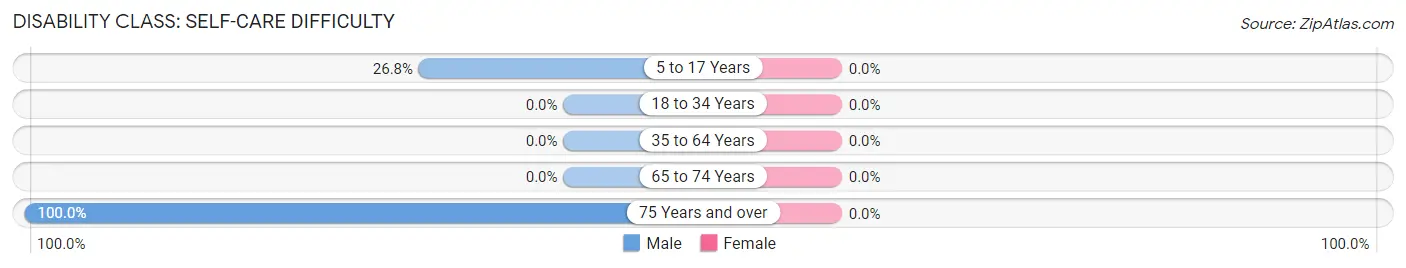
| Age Bracket | Male | Female |
| 5 to 17 Years | 103 (26.8%) | 0 (0.0%) |
| 18 to 34 Years | 0 (0.0%) | 0 (0.0%) |
| 35 to 64 Years | 0 (0.0%) | 0 (0.0%) |
| 65 to 74 Years | 0 (0.0%) | 0 (0.0%) |
| 75 Years and over | 3 (100.0%) | 0 (0.0%) |
Technology Access in Mooreville
Computing Device Access in Mooreville
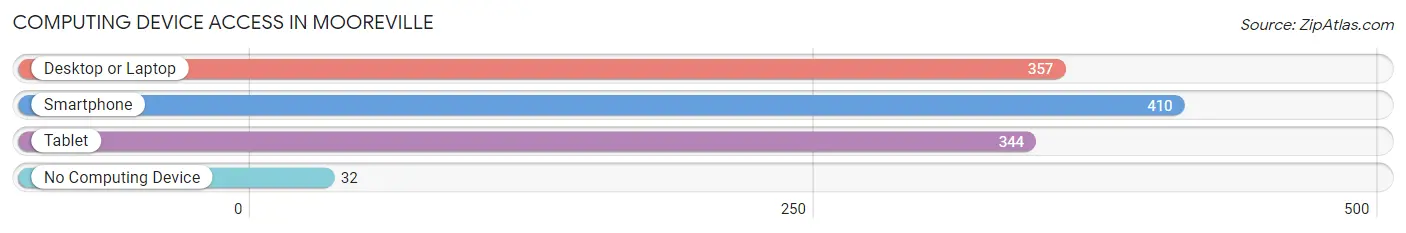
| Device Type | # Households | % Households |
| Desktop or Laptop | 357 | 80.8% |
| Smartphone | 410 | 92.8% |
| Tablet | 344 | 77.8% |
| No Computing Device | 32 | 7.2% |
| Total | 442 | 100.0% |
Internet Access in Mooreville
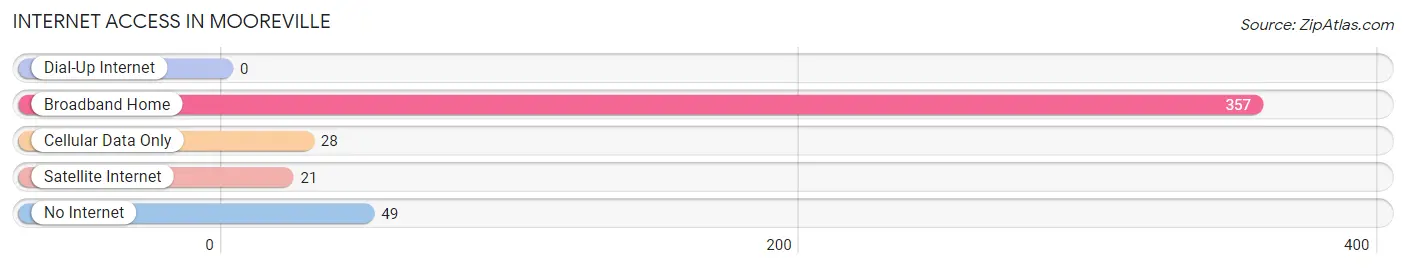
| Internet Type | # Households | % Households |
| Dial-Up Internet | 0 | 0.0% |
| Broadband Home | 357 | 80.8% |
| Cellular Data Only | 28 | 6.3% |
| Satellite Internet | 21 | 4.8% |
| No Internet | 49 | 11.1% |
| Total | 442 | 100.0% |
Mooreville Summary
Mooreville is a small town located in Lee County, Mississippi. It is situated in the northeastern part of the state, approximately 20 miles south of Tupelo and about 90 miles southeast of Memphis, Tennessee. The town has a population of approximately 1,500 people and is part of the Tupelo Metropolitan Statistical Area.
History
Mooreville was founded in 1837 by William Moore, a former slave who had purchased his freedom. Moore purchased a large tract of land in the area and established a small settlement. The town was originally known as Moore’s Crossroads, but was later renamed Mooreville in honor of its founder.
In the late 19th century, Mooreville was a thriving agricultural community. Cotton was the primary crop grown in the area, and the town was home to several cotton gins and a cottonseed oil mill. The town also had a sawmill, a gristmill, and a blacksmith shop.
In the early 20th century, Mooreville began to experience a period of decline. The cotton industry was in decline, and the town’s population began to dwindle. In the 1950s, the town was revitalized by the construction of a new highway, which brought new businesses and residents to the area.
Geography
Mooreville is located in the northeastern part of Lee County, Mississippi. It is situated in the foothills of the Appalachian Mountains, approximately 20 miles south of Tupelo and about 90 miles southeast of Memphis, Tennessee. The town is located at an elevation of approximately 500 feet above sea level.
The town is situated on the banks of the Tombigbee River, which flows through the area. The town is surrounded by rolling hills and forests, and is home to several small lakes and streams.
Economy
Mooreville’s economy is largely based on agriculture. Cotton is the primary crop grown in the area, and the town is home to several cotton gins and a cottonseed oil mill. The town also has a sawmill, a gristmill, and a blacksmith shop.
In addition to agriculture, Mooreville is home to several small businesses, including restaurants, retail stores, and service providers. The town is also home to a number of manufacturing companies, including a furniture factory and a plastics plant.
Demographics
As of the 2010 census, Mooreville had a population of 1,500 people. The town is predominantly white, with approximately 90% of the population identifying as Caucasian. The remaining 10% of the population is made up of African Americans, Hispanics, and other ethnicities.
The median household income in Mooreville is $35,000, and the median home value is $90,000. The town has a poverty rate of approximately 20%, and the unemployment rate is around 8%.
Mooreville is served by the Lee County School District, which operates two elementary schools, one middle school, and one high school. The town is also home to a branch of the Itawamba Community College.
Common Questions
What is Per Capita Income in Mooreville?
Per Capita income in Mooreville is $35,608.
What is the Median Family Income in Mooreville?
Median Family Income in Mooreville is $129,473.
What is the Median Household income in Mooreville?
Median Household Income in Mooreville is $139,473.
What is Income or Wage Gap in Mooreville?
Income or Wage Gap in Mooreville is 49.2%.
Women in Mooreville earn 50.8 cents for every dollar earned by a man.
What is Inequality or Gini Index in Mooreville?
Inequality or Gini Index in Mooreville is 0.26.
What is the Total Population of Mooreville?
Total Population of Mooreville is 1,839.
What is the Total Male Population of Mooreville?
Total Male Population of Mooreville is 1,029.
What is the Total Female Population of Mooreville?
Total Female Population of Mooreville is 810.
What is the Ratio of Males per 100 Females in Mooreville?
There are 127.04 Males per 100 Females in Mooreville.
What is the Ratio of Females per 100 Males in Mooreville?
There are 78.72 Females per 100 Males in Mooreville.
What is the Median Population Age in Mooreville?
Median Population Age in Mooreville is 19.9 Years.
What is the Average Family Size in Mooreville
Average Family Size in Mooreville is 3.8 People.
What is the Average Household Size in Mooreville
Average Household Size in Mooreville is 4.2 People.
How Large is the Labor Force in Mooreville?
There are 870 People in the Labor Forcein in Mooreville.
What is the Percentage of People in the Labor Force in Mooreville?
69.4% of People are in the Labor Force in Mooreville.
What is the Unemployment Rate in Mooreville?
Unemployment Rate in Mooreville is 25.7%.