Elizaville, KY Map & Demographics
Elizaville Map
Elizaville Overview
$36,078
PER CAPITA INCOME
$73,958
AVG FAMILY INCOME
$48,750
AVG HOUSEHOLD INCOME
0.23
INEQUALITY / GINI INDEX
114
TOTAL POPULATION
60
MALE POPULATION
54
FEMALE POPULATION
111.11
MALES / 100 FEMALES
90.00
FEMALES / 100 MALES
60.3
MEDIAN AGE
2.5
AVG FAMILY SIZE
1.8
AVG HOUSEHOLD SIZE
56
LABOR FORCE [ PEOPLE ]
49.1%
PERCENT IN LABOR FORCE
25.0%
UNEMPLOYMENT RATE
Elizaville Area Codes
Income in Elizaville
Income Overview in Elizaville
Per Capita Income in Elizaville is $36,078, while median incomes of families and households are $73,958 and $48,750 respectively.
| Characteristic | Number | Measure |
| Per Capita Income | 114 | $36,078 |
| Median Family Income | 32 | $73,958 |
| Mean Family Income | 32 | $76,619 |
| Median Household Income | 65 | $48,750 |
| Mean Household Income | 65 | $58,772 |
| Income Deficit | 32 | $0 |
| Wage / Income Gap (%) | 114 | 0.00% |
| Wage / Income Gap ($) | 114 | 100.00¢ per $1 |
| Gini / Inequality Index | 114 | 0.23 |
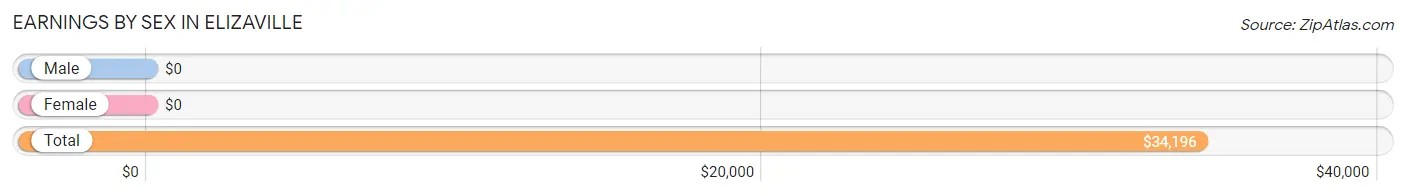
Earnings by Sex in Elizaville
| Sex | Number | Average Earnings |
| Male | 51 (54.8%) | $0 |
| Female | 42 (45.2%) | $0 |
| Total | 93 (100.0%) | $34,196 |
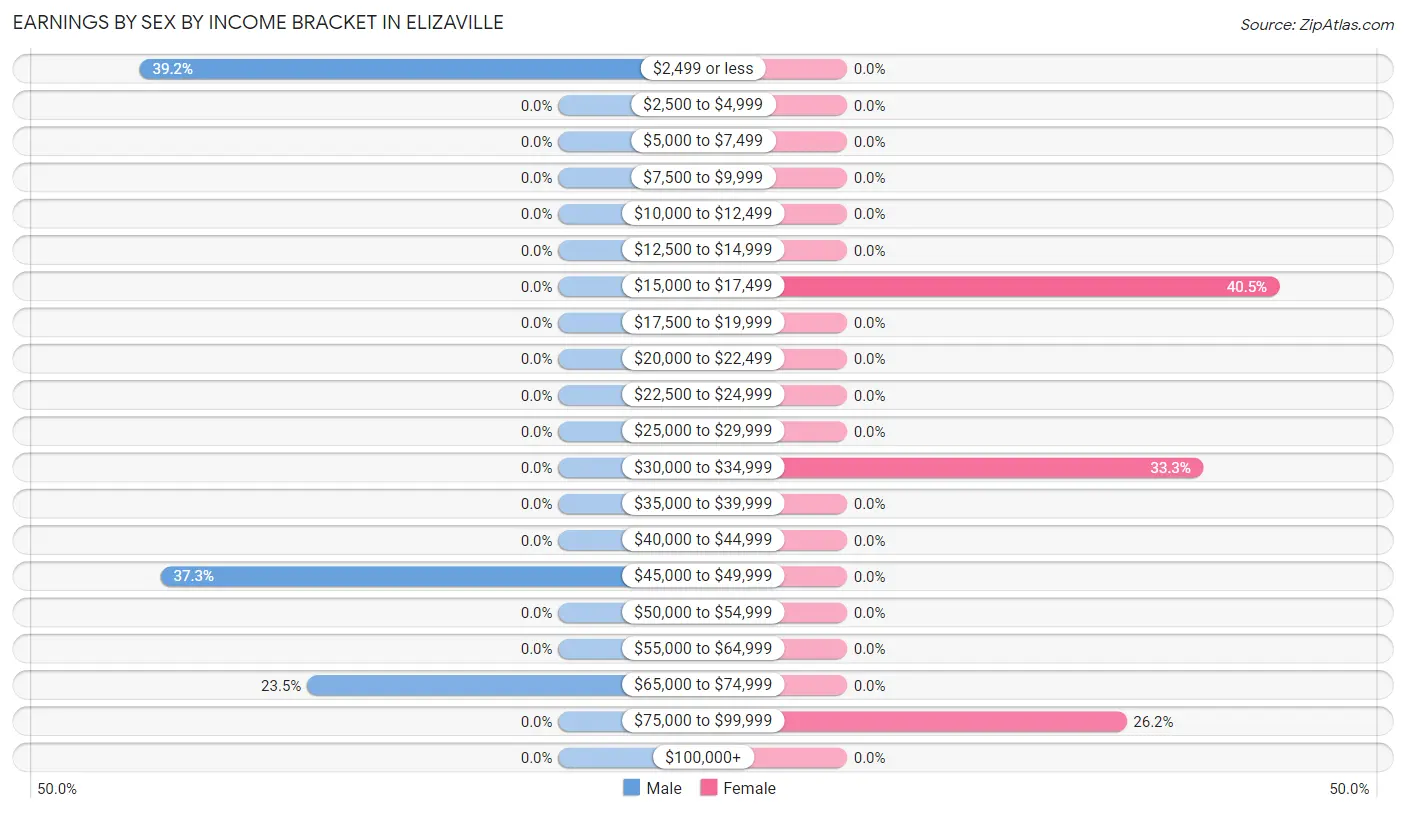
Earnings by Sex by Income Bracket in Elizaville
The most common earnings brackets in Elizaville are $2,499 or less for men (20 | 39.2%) and $15,000 to $17,499 for women (17 | 40.5%).
| Income | Male | Female |
| $2,499 or less | 20 (39.2%) | 0 (0.0%) |
| $2,500 to $4,999 | 0 (0.0%) | 0 (0.0%) |
| $5,000 to $7,499 | 0 (0.0%) | 0 (0.0%) |
| $7,500 to $9,999 | 0 (0.0%) | 0 (0.0%) |
| $10,000 to $12,499 | 0 (0.0%) | 0 (0.0%) |
| $12,500 to $14,999 | 0 (0.0%) | 0 (0.0%) |
| $15,000 to $17,499 | 0 (0.0%) | 17 (40.5%) |
| $17,500 to $19,999 | 0 (0.0%) | 0 (0.0%) |
| $20,000 to $22,499 | 0 (0.0%) | 0 (0.0%) |
| $22,500 to $24,999 | 0 (0.0%) | 0 (0.0%) |
| $25,000 to $29,999 | 0 (0.0%) | 0 (0.0%) |
| $30,000 to $34,999 | 0 (0.0%) | 14 (33.3%) |
| $35,000 to $39,999 | 0 (0.0%) | 0 (0.0%) |
| $40,000 to $44,999 | 0 (0.0%) | 0 (0.0%) |
| $45,000 to $49,999 | 19 (37.2%) | 0 (0.0%) |
| $50,000 to $54,999 | 0 (0.0%) | 0 (0.0%) |
| $55,000 to $64,999 | 0 (0.0%) | 0 (0.0%) |
| $65,000 to $74,999 | 12 (23.5%) | 0 (0.0%) |
| $75,000 to $99,999 | 0 (0.0%) | 11 (26.2%) |
| $100,000+ | 0 (0.0%) | 0 (0.0%) |
| Total | 51 (100.0%) | 42 (100.0%) |
Earnings by Sex by Educational Attainment in Elizaville
| Educational Attainment | Male Income | Female Income |
| Less than High School | - | - |
| High School Diploma | - | - |
| College or Associate's Degree | - | - |
| Bachelor's Degree | - | - |
| Graduate Degree | - | - |
| Total | - | - |
Family Income in Elizaville
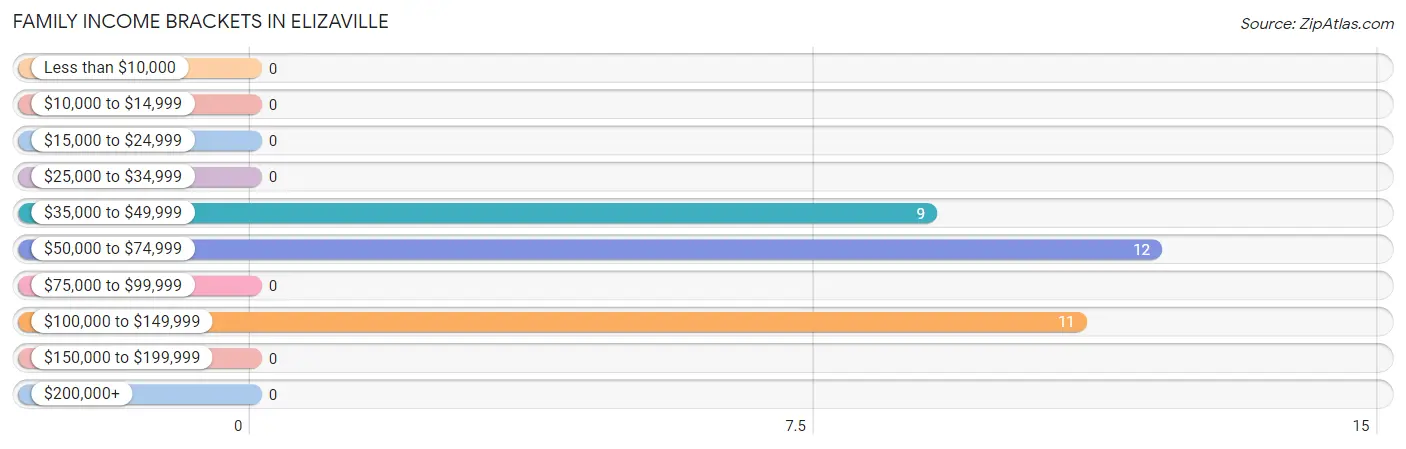
Family Income Brackets in Elizaville
According to the Elizaville family income data, there are 12 families falling into the $50,000 to $74,999 income range, which is the most common income bracket and makes up 37.5% of all families.
| Income Bracket | # Families | % Families |
| Less than $10,000 | 0 | 0.0% |
| $10,000 to $14,999 | 0 | 0.0% |
| $15,000 to $24,999 | 0 | 0.0% |
| $25,000 to $34,999 | 0 | 0.0% |
| $35,000 to $49,999 | 9 | 28.1% |
| $50,000 to $74,999 | 12 | 37.5% |
| $75,000 to $99,999 | 0 | 0.0% |
| $100,000 to $149,999 | 11 | 34.4% |
| $150,000 to $199,999 | 0 | 0.0% |
| $200,000+ | 0 | 0.0% |
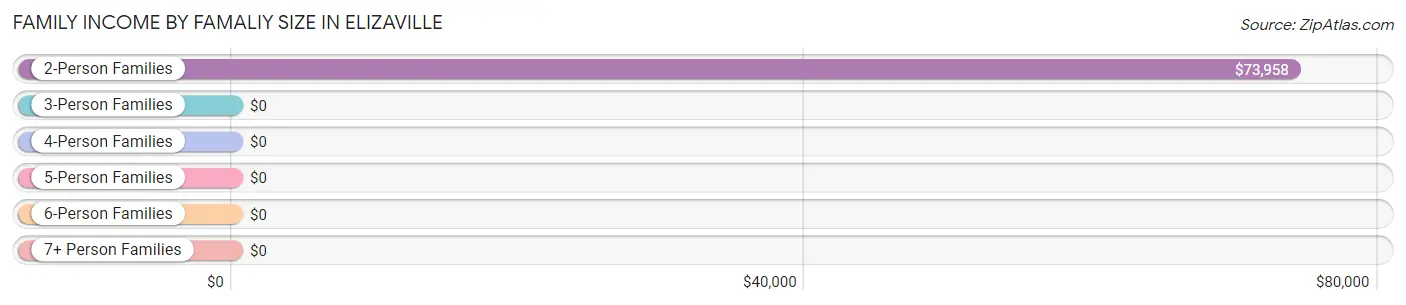
Family Income by Famaliy Size in Elizaville
2-person families (32 | 100.0%) account for the highest median family income in Elizaville with $73,958 per family, while 2-person families (32 | 100.0%) have the highest median income of $36,979 per family member.
| Income Bracket | # Families | Median Income |
| 2-Person Families | 32 (100.0%) | $73,958 |
| 3-Person Families | 0 (0.0%) | $0 |
| 4-Person Families | 0 (0.0%) | $0 |
| 5-Person Families | 0 (0.0%) | $0 |
| 6-Person Families | 0 (0.0%) | $0 |
| 7+ Person Families | 0 (0.0%) | $0 |
| Total | 32 (100.0%) | $73,958 |
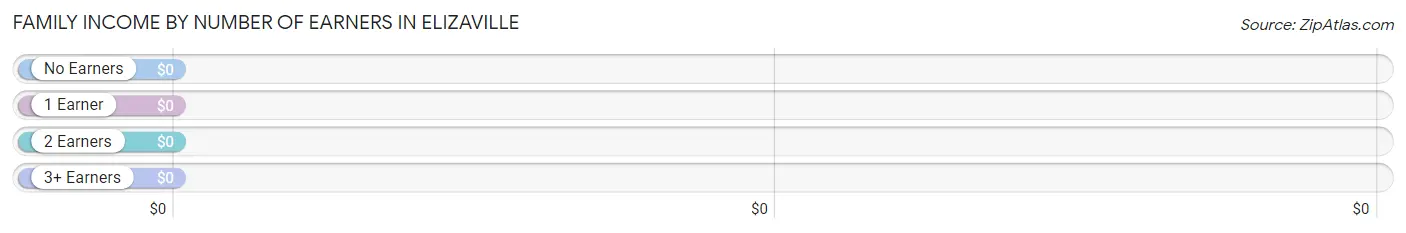
Family Income by Number of Earners in Elizaville
| Number of Earners | # Families | Median Income |
| No Earners | 0 (0.0%) | $0 |
| 1 Earner | 21 (65.6%) | $0 |
| 2 Earners | 11 (34.4%) | $0 |
| 3+ Earners | 0 (0.0%) | $0 |
| Total | 32 (100.0%) | $73,958 |
Household Income in Elizaville
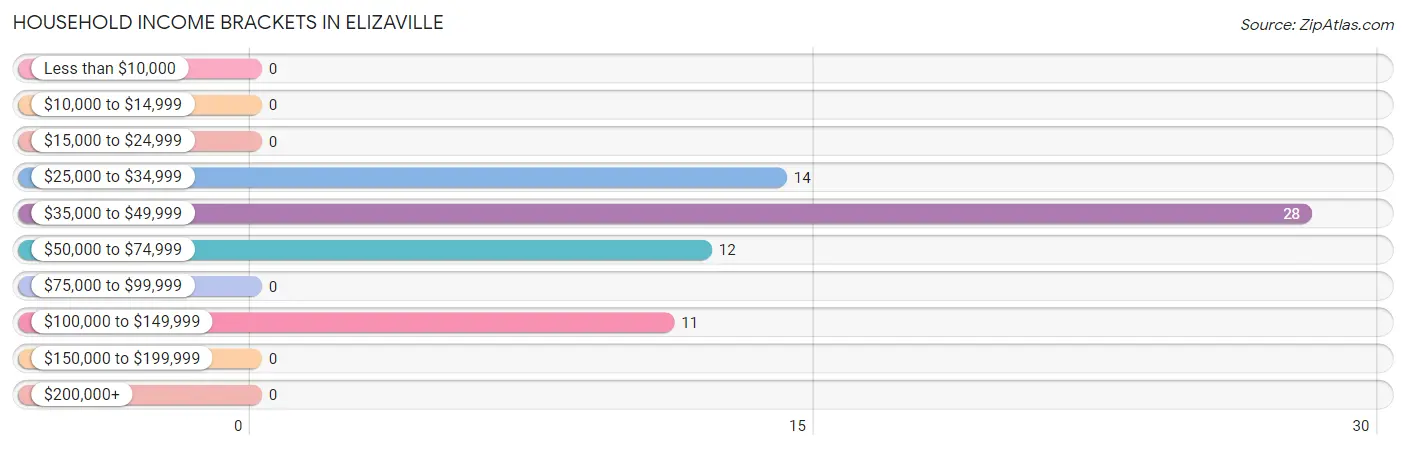
Household Income Brackets in Elizaville
With 28 households falling in the category, the $35,000 to $49,999 income range is the most frequent in Elizaville, accounting for 43.1% of all households.
| Income Bracket | # Households | % Households |
| Less than $10,000 | 0 | 0.0% |
| $10,000 to $14,999 | 0 | 0.0% |
| $15,000 to $24,999 | 0 | 0.0% |
| $25,000 to $34,999 | 14 | 21.5% |
| $35,000 to $49,999 | 28 | 43.1% |
| $50,000 to $74,999 | 12 | 18.5% |
| $75,000 to $99,999 | 0 | 0.0% |
| $100,000 to $149,999 | 11 | 16.9% |
| $150,000 to $199,999 | 0 | 0.0% |
| $200,000+ | 0 | 0.0% |
Household Income by Householder Age in Elizaville
| Income Bracket | # Households | Median Income |
| 15 to 24 Years | 0 (0.0%) | $0 |
| 25 to 44 Years | 19 (29.2%) | $0 |
| 45 to 64 Years | 25 (38.5%) | $0 |
| 65+ Years | 21 (32.3%) | $0 |
| Total | 65 (100.0%) | $48,750 |
Poverty in Elizaville
Income Below Poverty by Sex and Age in Elizaville
| Age Bracket | Male | Female |
| Under 5 Years | 0 (0.0%) | 0 (0.0%) |
| 5 Years | 0 (0.0%) | 0 (0.0%) |
| 6 to 11 Years | 0 (0.0%) | 0 (0.0%) |
| 12 to 14 Years | 0 (0.0%) | 0 (0.0%) |
| 15 Years | 0 (0.0%) | 0 (0.0%) |
| 16 and 17 Years | 0 (0.0%) | 0 (0.0%) |
| 18 to 24 Years | 0 (0.0%) | 0 (0.0%) |
| 25 to 34 Years | 0 (0.0%) | 0 (0.0%) |
| 35 to 44 Years | 0 (0.0%) | 0 (0.0%) |
| 45 to 54 Years | 0 (0.0%) | 0 (0.0%) |
| 55 to 64 Years | 0 (0.0%) | 0 (0.0%) |
| 65 to 74 Years | 0 (0.0%) | 0 (0.0%) |
| 75 Years and over | 0 (0.0%) | 0 (0.0%) |
| Total | 0 (0.0%) | 0 (0.0%) |
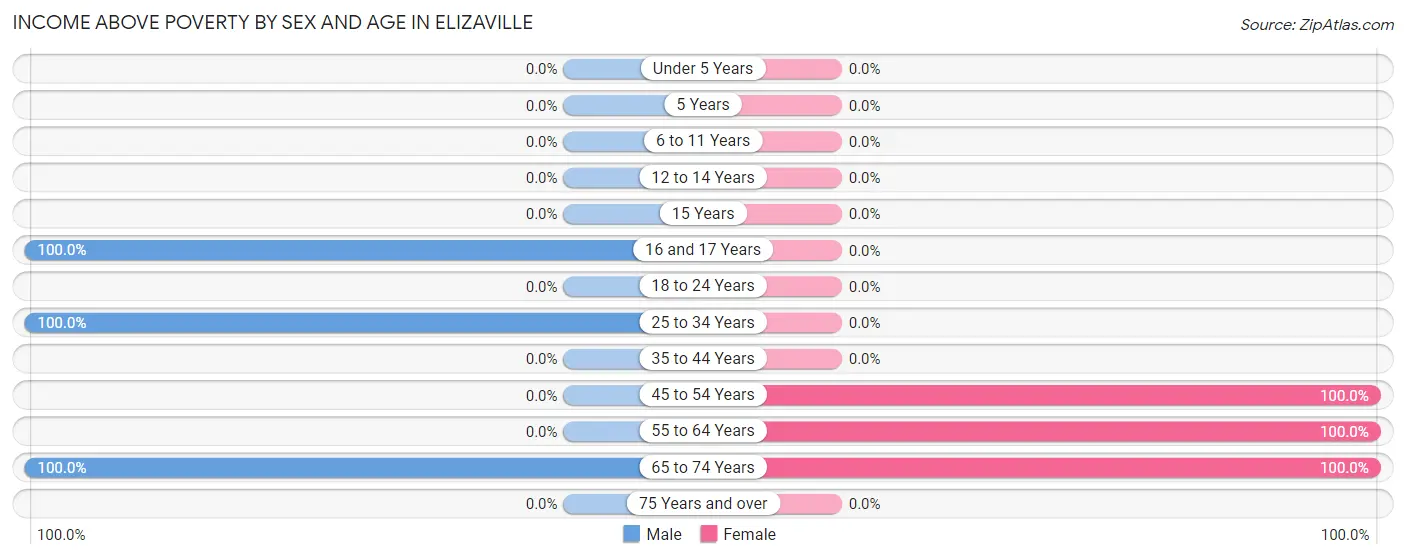
Income Above Poverty by Sex and Age in Elizaville
According to the poverty statistics in Elizaville, males aged 16 and 17 years and females aged 45 to 54 years are the age groups that are most secure financially, with 100.0% of males and 100.0% of females in these age groups living above the poverty line.
| Age Bracket | Male | Female |
| Under 5 Years | 0 (0.0%) | 0 (0.0%) |
| 5 Years | 0 (0.0%) | 0 (0.0%) |
| 6 to 11 Years | 0 (0.0%) | 0 (0.0%) |
| 12 to 14 Years | 0 (0.0%) | 0 (0.0%) |
| 15 Years | 0 (0.0%) | 0 (0.0%) |
| 16 and 17 Years | 20 (100.0%) | 0 (0.0%) |
| 18 to 24 Years | 0 (0.0%) | 0 (0.0%) |
| 25 to 34 Years | 19 (100.0%) | 0 (0.0%) |
| 35 to 44 Years | 0 (0.0%) | 0 (0.0%) |
| 45 to 54 Years | 0 (0.0%) | 11 (100.0%) |
| 55 to 64 Years | 0 (0.0%) | 26 (100.0%) |
| 65 to 74 Years | 21 (100.0%) | 17 (100.0%) |
| 75 Years and over | 0 (0.0%) | 0 (0.0%) |
| Total | 60 (100.0%) | 54 (100.0%) |
Income Below Poverty Among Married-Couple Families in Elizaville
| Children | Above Poverty | Below Poverty |
| No Children | 21 (100.0%) | 0 (0.0%) |
| 1 or 2 Children | 0 (0.0%) | 0 (0.0%) |
| 3 or 4 Children | 0 (0.0%) | 0 (0.0%) |
| 5 or more Children | 0 (0.0%) | 0 (0.0%) |
| Total | 21 (100.0%) | 0 (0.0%) |
Income Below Poverty Among Single-Parent Households in Elizaville
| Children | Single Father | Single Mother |
| No Children | 0 (0.0%) | 0 (0.0%) |
| 1 or 2 Children | 0 (0.0%) | 0 (0.0%) |
| 3 or 4 Children | 0 (0.0%) | 0 (0.0%) |
| 5 or more Children | 0 (0.0%) | 0 (0.0%) |
| Total | 0 (0.0%) | 0 (0.0%) |
Income Below Poverty Among Married-Couple vs Single-Parent Households in Elizaville
| Children | Married-Couple Families | Single-Parent Households |
| No Children | 0 (0.0%) | 0 (0.0%) |
| 1 or 2 Children | 0 (0.0%) | 0 (0.0%) |
| 3 or 4 Children | 0 (0.0%) | 0 (0.0%) |
| 5 or more Children | 0 (0.0%) | 0 (0.0%) |
| Total | 0 (0.0%) | 0 (0.0%) |
Race in Elizaville
The most populous races in Elizaville are , and White / Caucasian (114 | 100.0%).
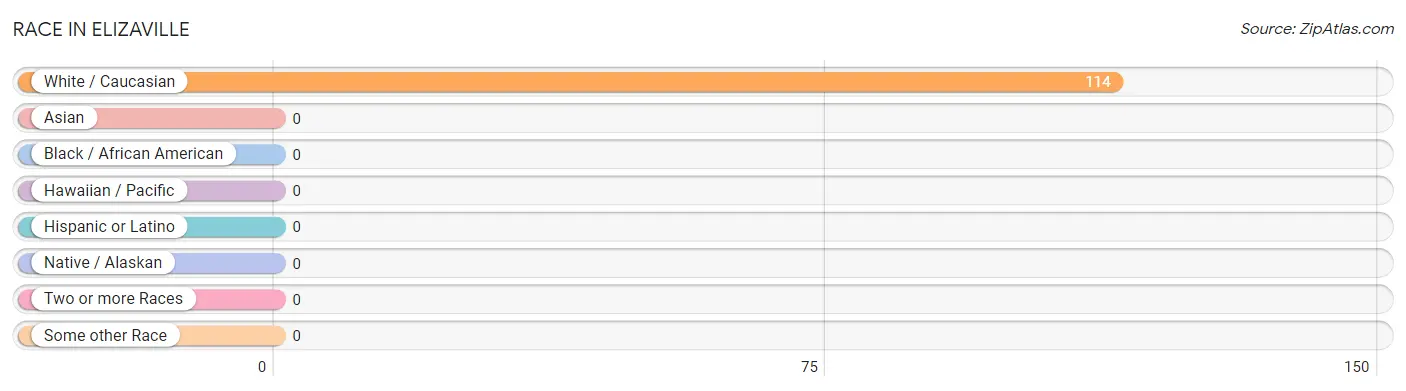
| Race | # Population | % Population |
| Asian | 0 | 0.0% |
| Black / African American | 0 | 0.0% |
| Hawaiian / Pacific | 0 | 0.0% |
| Hispanic or Latino | 0 | 0.0% |
| Native / Alaskan | 0 | 0.0% |
| White / Caucasian | 114 | 100.0% |
| Two or more Races | 0 | 0.0% |
| Some other Race | 0 | 0.0% |
| Total | 114 | 100.0% |
Ancestry in Elizaville
The most populous ancestries reported in Elizaville are American (71 | 62.3%), and British (11 | 9.7%), together accounting for 71.9% of all Elizaville residents.
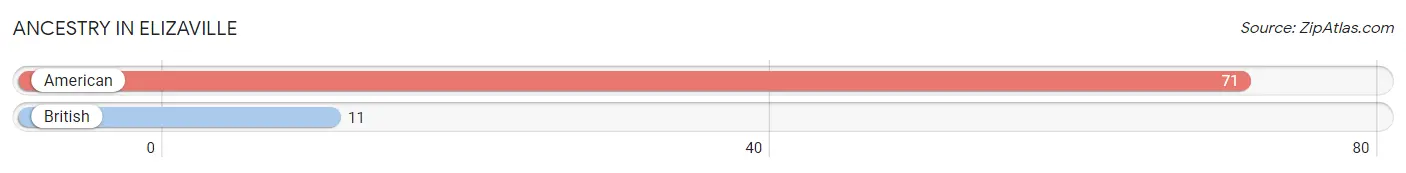
| Ancestry | # Population | % Population |
| American | 71 | 62.3% |
| British | 11 | 9.7% | View All 2 Rows |
Immigrants in Elizaville

| Immigration Origin | # Population | % Population | View All 0 Rows |
Sex and Age in Elizaville
Sex and Age in Elizaville
The most populous age groups in Elizaville are 65 to 69 Years (21 | 35.0%) for men and 60 to 64 Years (26 | 48.1%) for women.
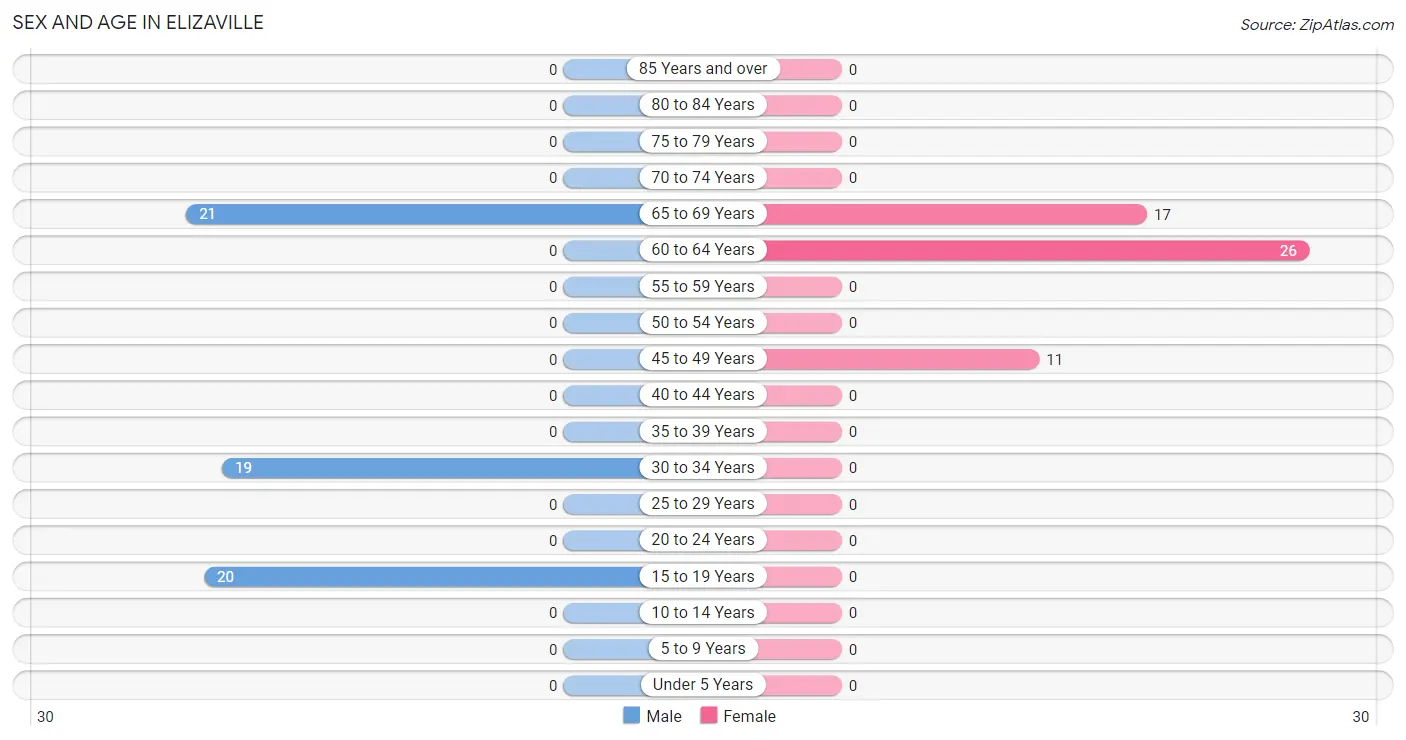
| Age Bracket | Male | Female |
| Under 5 Years | 0 (0.0%) | 0 (0.0%) |
| 5 to 9 Years | 0 (0.0%) | 0 (0.0%) |
| 10 to 14 Years | 0 (0.0%) | 0 (0.0%) |
| 15 to 19 Years | 20 (33.3%) | 0 (0.0%) |
| 20 to 24 Years | 0 (0.0%) | 0 (0.0%) |
| 25 to 29 Years | 0 (0.0%) | 0 (0.0%) |
| 30 to 34 Years | 19 (31.7%) | 0 (0.0%) |
| 35 to 39 Years | 0 (0.0%) | 0 (0.0%) |
| 40 to 44 Years | 0 (0.0%) | 0 (0.0%) |
| 45 to 49 Years | 0 (0.0%) | 11 (20.4%) |
| 50 to 54 Years | 0 (0.0%) | 0 (0.0%) |
| 55 to 59 Years | 0 (0.0%) | 0 (0.0%) |
| 60 to 64 Years | 0 (0.0%) | 26 (48.1%) |
| 65 to 69 Years | 21 (35.0%) | 17 (31.5%) |
| 70 to 74 Years | 0 (0.0%) | 0 (0.0%) |
| 75 to 79 Years | 0 (0.0%) | 0 (0.0%) |
| 80 to 84 Years | 0 (0.0%) | 0 (0.0%) |
| 85 Years and over | 0 (0.0%) | 0 (0.0%) |
| Total | 60 (100.0%) | 54 (100.0%) |
Families and Households in Elizaville
Median Family Size in Elizaville
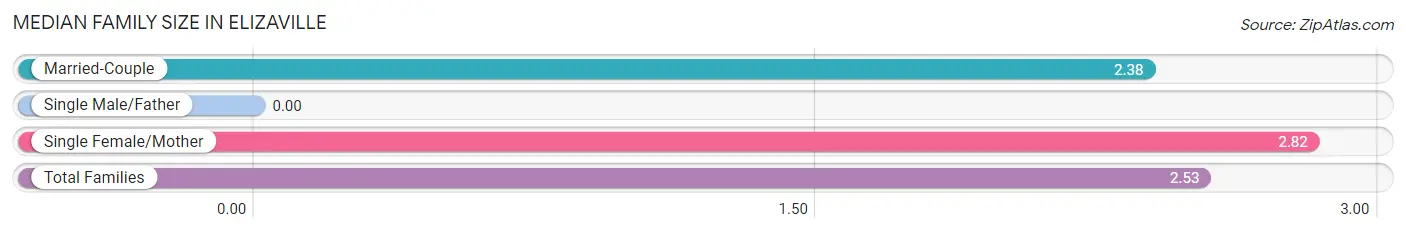
| Family Type | # Families | Family Size |
| Married-Couple | 21 (65.6%) | 2.38 |
| Single Male/Father | 0 (0.0%) | - |
| Single Female/Mother | 11 (34.4%) | 2.82 |
| Total Families | 32 (100.0%) | 2.53 |
Median Household Size in Elizaville
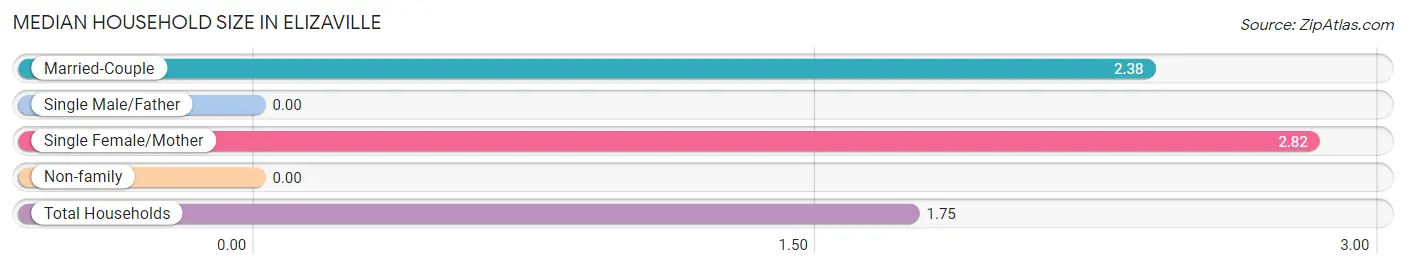
| Household Type | # Households | Household Size |
| Married-Couple | 21 (32.3%) | 2.38 |
| Single Male/Father | 0 (0.0%) | - |
| Single Female/Mother | 11 (16.9%) | 2.82 |
| Non-family | 33 (50.8%) | - |
| Total Households | 65 (100.0%) | 1.75 |
Household Size by Marriage Status in Elizaville
Out of a total of 65 households in Elizaville, 32 (49.2%) are family households, while 33 (50.8%) are nonfamily households. The most numerous type of family households are 2-person households, comprising 32, and the most common type of nonfamily households are 1-person households, comprising 33.
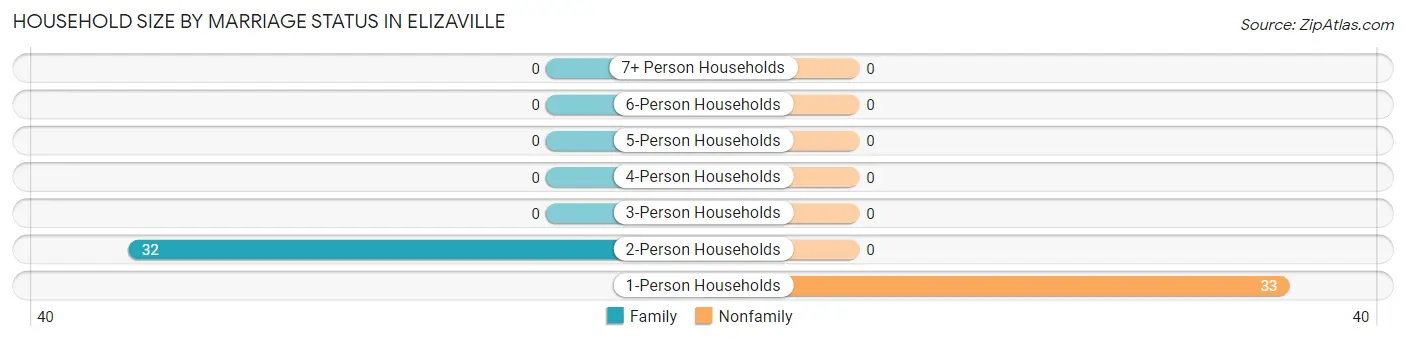
| Household Size | Family Households | Nonfamily Households |
| 1-Person Households | - | 33 (50.8%) |
| 2-Person Households | 32 (49.2%) | 0 (0.0%) |
| 3-Person Households | 0 (0.0%) | 0 (0.0%) |
| 4-Person Households | 0 (0.0%) | 0 (0.0%) |
| 5-Person Households | 0 (0.0%) | 0 (0.0%) |
| 6-Person Households | 0 (0.0%) | 0 (0.0%) |
| 7+ Person Households | 0 (0.0%) | 0 (0.0%) |
| Total | 32 (49.2%) | 33 (50.8%) |
Female Fertility in Elizaville
Fertility by Age in Elizaville
| Age Bracket | Women with Births | Births / 1,000 Women |
| 15 to 19 years | 0 (0.0%) | 0.0 |
| 20 to 34 years | 0 (0.0%) | 0.0 |
| 35 to 50 years | 0 (0.0%) | 0.0 |
| Total | 0 (0.0%) | 0.0 |
Fertility by Age by Marriage Status in Elizaville
| Age Bracket | Married | Unmarried |
| 15 to 19 years | 0 (0.0%) | 0 (0.0%) |
| 20 to 34 years | 0 (0.0%) | 0 (0.0%) |
| 35 to 50 years | 0 (0.0%) | 0 (0.0%) |
| Total | 0 (0.0%) | 0 (0.0%) |
Fertility by Education in Elizaville
| Educational Attainment | Women with Births | Births / 1,000 Women |
| Less than High School | 0 (0.0%) | 0.0 |
| High School Diploma | 0 (0.0%) | 0.0 |
| College or Associate's Degree | 0 (0.0%) | 0.0 |
| Bachelor's Degree | 0 (0.0%) | 0.0 |
| Graduate Degree | 0 (0.0%) | 0.0 |
| Total | 0 (0.0%) | 0.0 |
Fertility by Education by Marriage Status in Elizaville
| Educational Attainment | Married | Unmarried |
| Less than High School | 0 (0.0%) | 0 (0.0%) |
| High School Diploma | 0 (0.0%) | 0 (0.0%) |
| College or Associate's Degree | 0 (0.0%) | 0 (0.0%) |
| Bachelor's Degree | 0 (0.0%) | 0 (0.0%) |
| Graduate Degree | 0 (0.0%) | 0 (0.0%) |
| Total | 0 (0.0%) | 0 (0.0%) |
Employment Characteristics in Elizaville
Employment by Class of Employer in Elizaville
Among the 42 employed individuals in Elizaville, private company employees (31 | 73.8%), and state government employees (11 | 26.2%) make up the most common classes of employment.
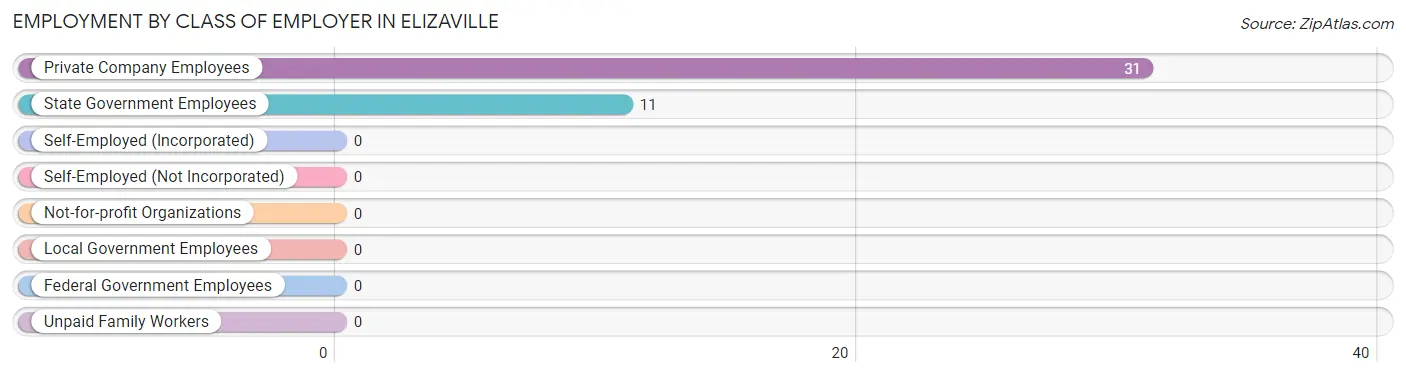
| Employer Class | # Employees | % Employees |
| Private Company Employees | 31 | 73.8% |
| Self-Employed (Incorporated) | 0 | 0.0% |
| Self-Employed (Not Incorporated) | 0 | 0.0% |
| Not-for-profit Organizations | 0 | 0.0% |
| Local Government Employees | 0 | 0.0% |
| State Government Employees | 11 | 26.2% |
| Federal Government Employees | 0 | 0.0% |
| Unpaid Family Workers | 0 | 0.0% |
| Total | 42 | 100.0% |
Employment Status by Age in Elizaville
According to the labor force statistics for Elizaville, out of the total population over 16 years of age (114), 49.1% or 56 individuals are in the labor force, with 25.0% or 14 of them unemployed. The age group with the highest labor force participation rate is 30 to 34 years, with 100.0% or 19 individuals in the labor force. Within the labor force, the 60 to 64 years age range has the highest percentage of unemployed individuals, with 100.0% or 14 of them being unemployed.
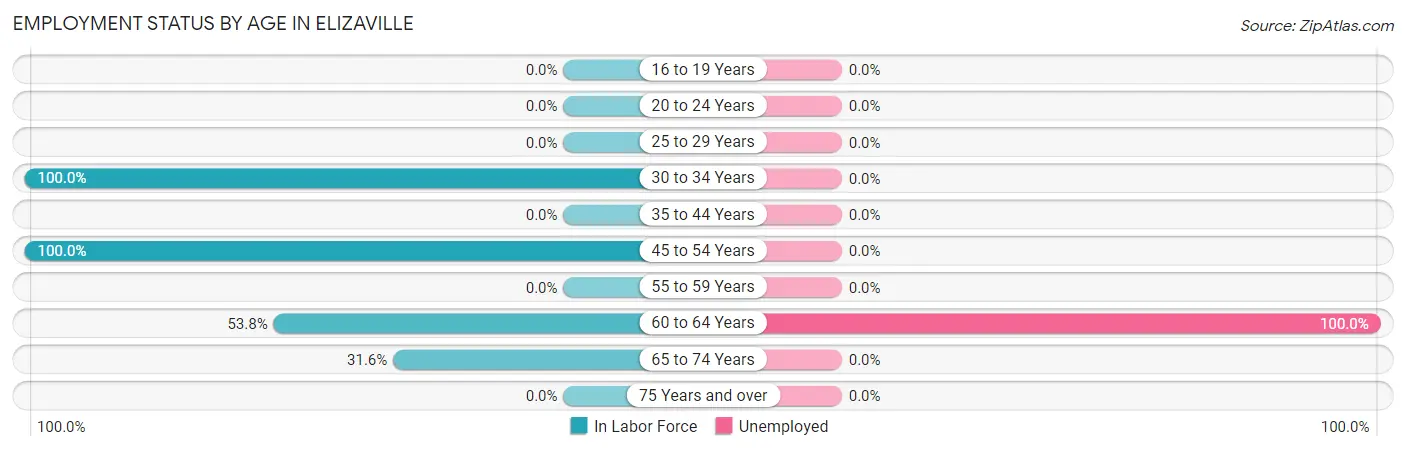
| Age Bracket | In Labor Force | Unemployed |
| 16 to 19 Years | 0 (0.0%) | 0 (0.0%) |
| 20 to 24 Years | 0 (0.0%) | 0 (0.0%) |
| 25 to 29 Years | 0 (0.0%) | 0 (0.0%) |
| 30 to 34 Years | 19 (100.0%) | 0 (0.0%) |
| 35 to 44 Years | 0 (0.0%) | 0 (0.0%) |
| 45 to 54 Years | 11 (100.0%) | 0 (0.0%) |
| 55 to 59 Years | 0 (0.0%) | 0 (0.0%) |
| 60 to 64 Years | 14 (53.8%) | 14 (100.0%) |
| 65 to 74 Years | 12 (31.6%) | 0 (0.0%) |
| 75 Years and over | 0 (0.0%) | 0 (0.0%) |
| Total | 56 (49.1%) | 14 (25.0%) |
Employment Status by Educational Attainment in Elizaville
According to labor force statistics for Elizaville, 78.6% of individuals (44) out of the total population between 25 and 64 years of age (56) are in the labor force, with 31.8% or 14 of them being unemployed. The group with the highest labor force participation rate are those with the educational attainment of bachelor's degree or higher, with 100.0% or 30 individuals in the labor force. Within the labor force, individuals with high school diploma education have the highest percentage of unemployment, with 100.0% or 14 of them being unemployed.
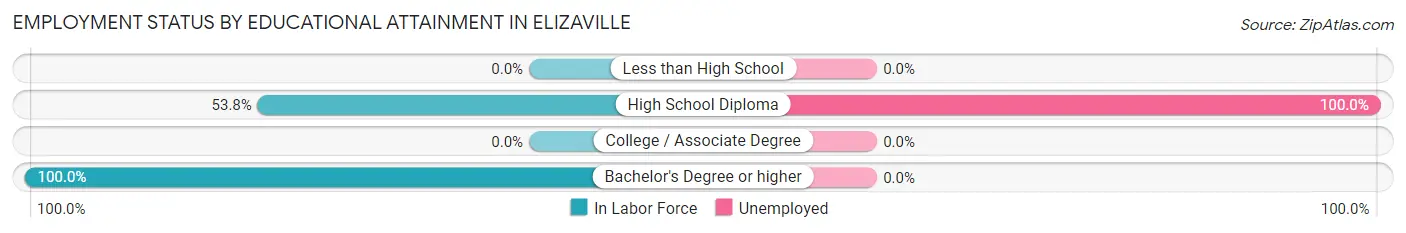
| Educational Attainment | In Labor Force | Unemployed |
| Less than High School | 0 (0.0%) | 0 (0.0%) |
| High School Diploma | 14 (53.8%) | 26 (100.0%) |
| College / Associate Degree | 0 (0.0%) | 0 (0.0%) |
| Bachelor's Degree or higher | 30 (100.0%) | 0 (0.0%) |
| Total | 44 (78.6%) | 18 (31.8%) |
Employment Occupations by Sex in Elizaville
Management, Business, Science and Arts Occupations
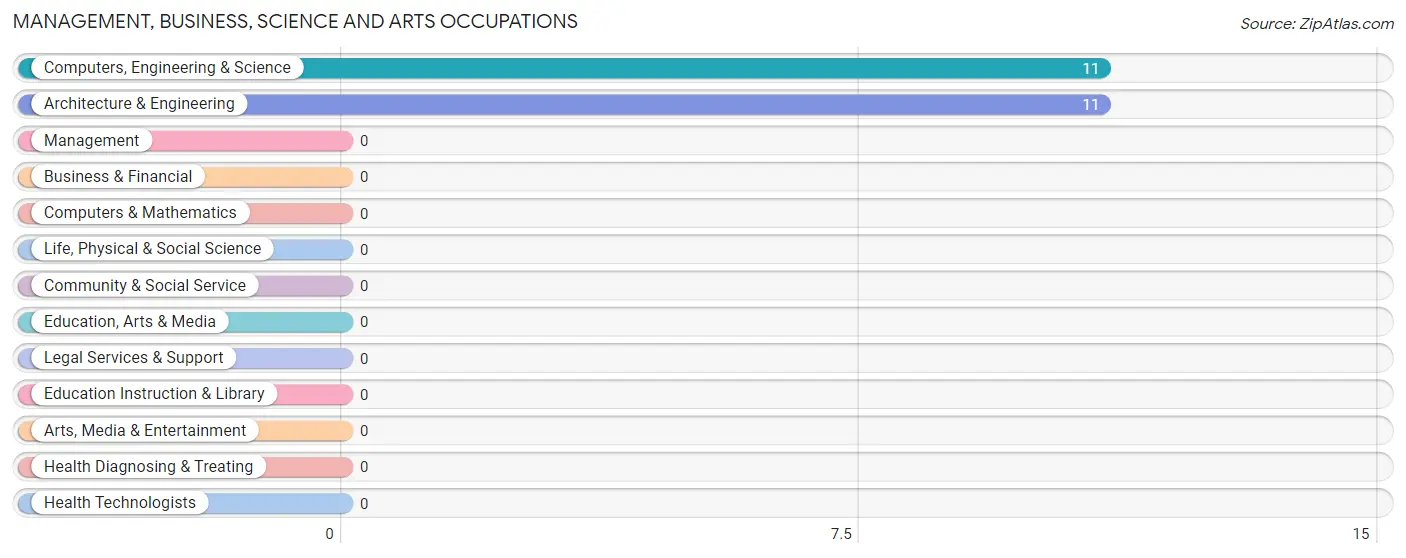
The most common Management, Business, Science and Arts occupations in Elizaville are Computers, Engineering & Science (11 | 26.2%), and Architecture & Engineering (11 | 26.2%).
Management, Business, Science and Arts Occupations by Sex
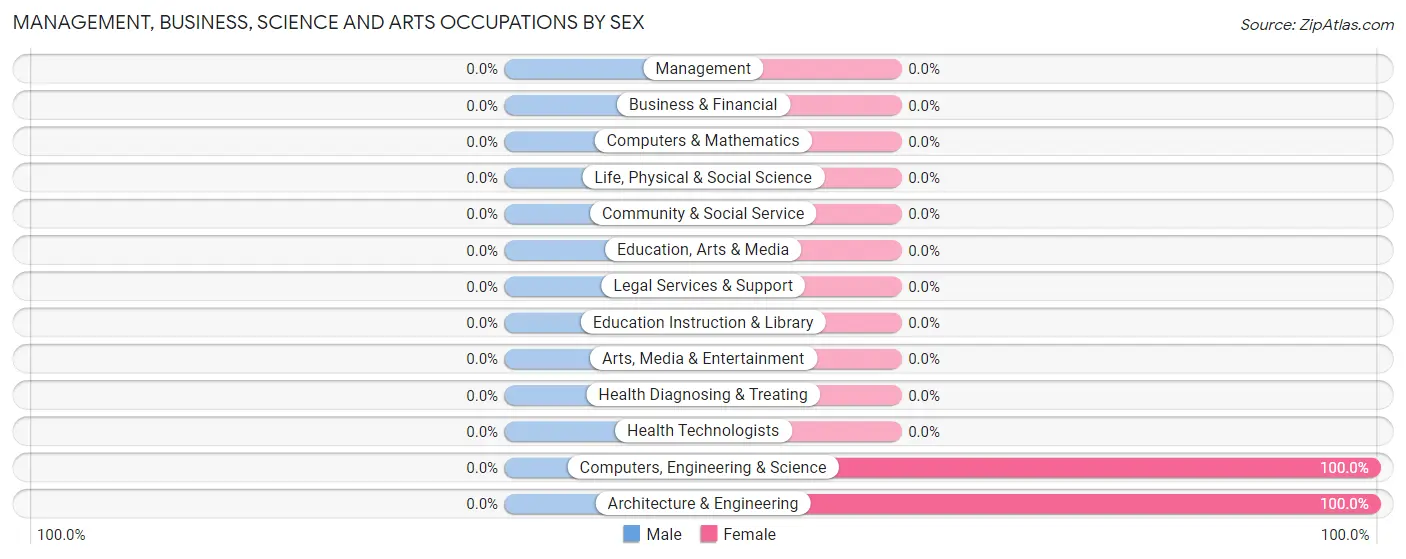
| Occupation | Male | Female |
| Management | 0 (0.0%) | 0 (0.0%) |
| Business & Financial | 0 (0.0%) | 0 (0.0%) |
| Computers, Engineering & Science | 0 (0.0%) | 11 (100.0%) |
| Computers & Mathematics | 0 (0.0%) | 0 (0.0%) |
| Architecture & Engineering | 0 (0.0%) | 11 (100.0%) |
| Life, Physical & Social Science | 0 (0.0%) | 0 (0.0%) |
| Community & Social Service | 0 (0.0%) | 0 (0.0%) |
| Education, Arts & Media | 0 (0.0%) | 0 (0.0%) |
| Legal Services & Support | 0 (0.0%) | 0 (0.0%) |
| Education Instruction & Library | 0 (0.0%) | 0 (0.0%) |
| Arts, Media & Entertainment | 0 (0.0%) | 0 (0.0%) |
| Health Diagnosing & Treating | 0 (0.0%) | 0 (0.0%) |
| Health Technologists | 0 (0.0%) | 0 (0.0%) |
| Total (Category) | 0 (0.0%) | 11 (100.0%) |
| Total (Overall) | 31 (73.8%) | 11 (26.2%) |
Services Occupations
Services Occupations by Sex
| Occupation | Male | Female |
| Healthcare Support | 0 (0.0%) | 0 (0.0%) |
| Security & Protection | 0 (0.0%) | 0 (0.0%) |
| Firefighting & Prevention | 0 (0.0%) | 0 (0.0%) |
| Law Enforcement | 0 (0.0%) | 0 (0.0%) |
| Food Preparation & Serving | 0 (0.0%) | 0 (0.0%) |
| Cleaning & Maintenance | 0 (0.0%) | 0 (0.0%) |
| Personal Care & Service | 0 (0.0%) | 0 (0.0%) |
| Total (Category) | 0 (0.0%) | 0 (0.0%) |
| Total (Overall) | 31 (73.8%) | 11 (26.2%) |
Sales and Office Occupations
The most common Sales and Office occupations in Elizaville are Office & Administration (19 | 45.2%), and Sales & Related (12 | 28.6%).

Sales and Office Occupations by Sex

| Occupation | Male | Female |
| Sales & Related | 12 (100.0%) | 0 (0.0%) |
| Office & Administration | 19 (100.0%) | 0 (0.0%) |
| Total (Category) | 31 (100.0%) | 0 (0.0%) |
| Total (Overall) | 31 (73.8%) | 11 (26.2%) |
Natural Resources, Construction and Maintenance Occupations

Natural Resources, Construction and Maintenance Occupations by Sex
| Occupation | Male | Female |
| Farming, Fishing & Forestry | 0 (0.0%) | 0 (0.0%) |
| Construction & Extraction | 0 (0.0%) | 0 (0.0%) |
| Installation, Maintenance & Repair | 0 (0.0%) | 0 (0.0%) |
| Total (Category) | 0 (0.0%) | 0 (0.0%) |
| Total (Overall) | 31 (73.8%) | 11 (26.2%) |
Production, Transportation and Moving Occupations
Production, Transportation and Moving Occupations by Sex
| Occupation | Male | Female |
| Production | 0 (0.0%) | 0 (0.0%) |
| Transportation | 0 (0.0%) | 0 (0.0%) |
| Material Moving | 0 (0.0%) | 0 (0.0%) |
| Total (Category) | 0 (0.0%) | 0 (0.0%) |
| Total (Overall) | 31 (73.8%) | 11 (26.2%) |
Employment Industries by Sex in Elizaville
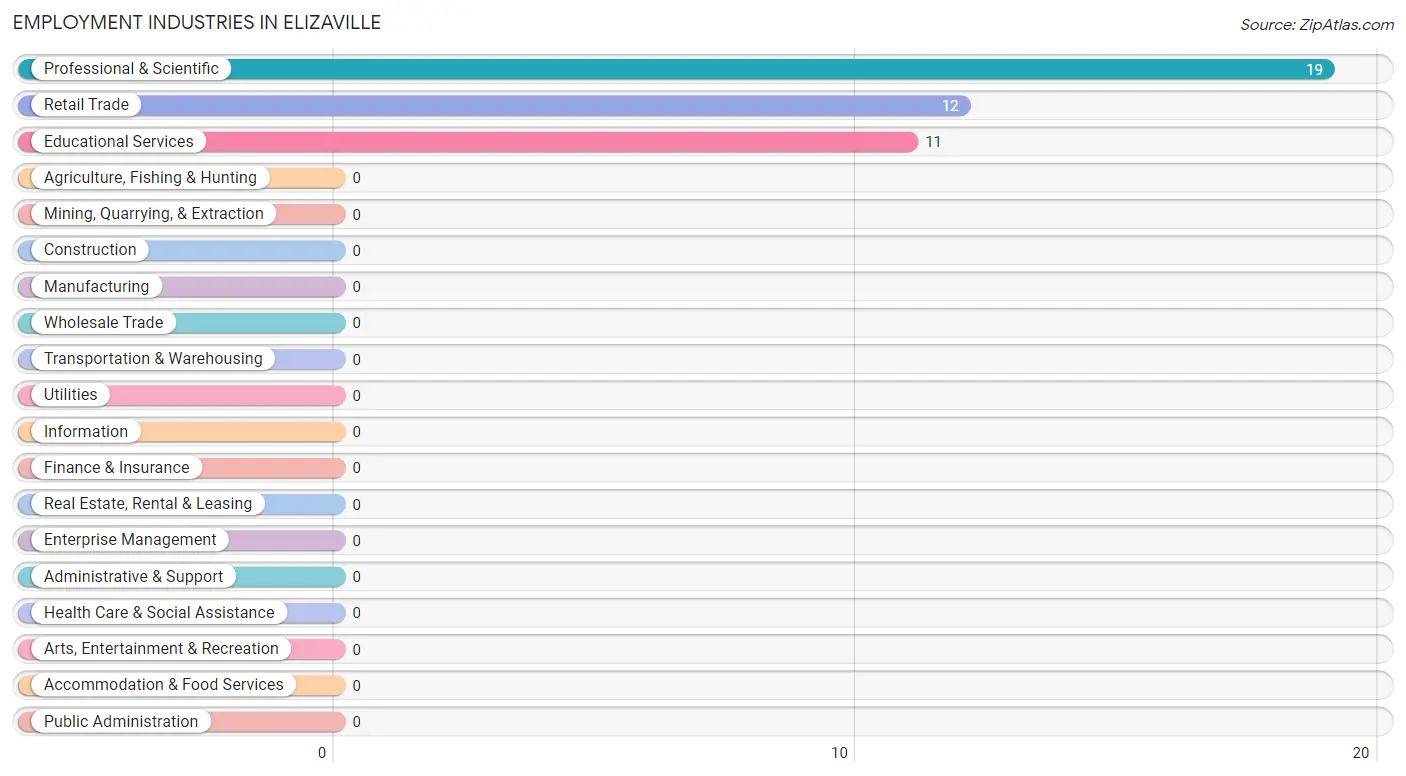
Employment Industries in Elizaville
The major employment industries in Elizaville include Professional & Scientific (19 | 45.2%), Retail Trade (12 | 28.6%), and Educational Services (11 | 26.2%).
Employment Industries by Sex in Elizaville
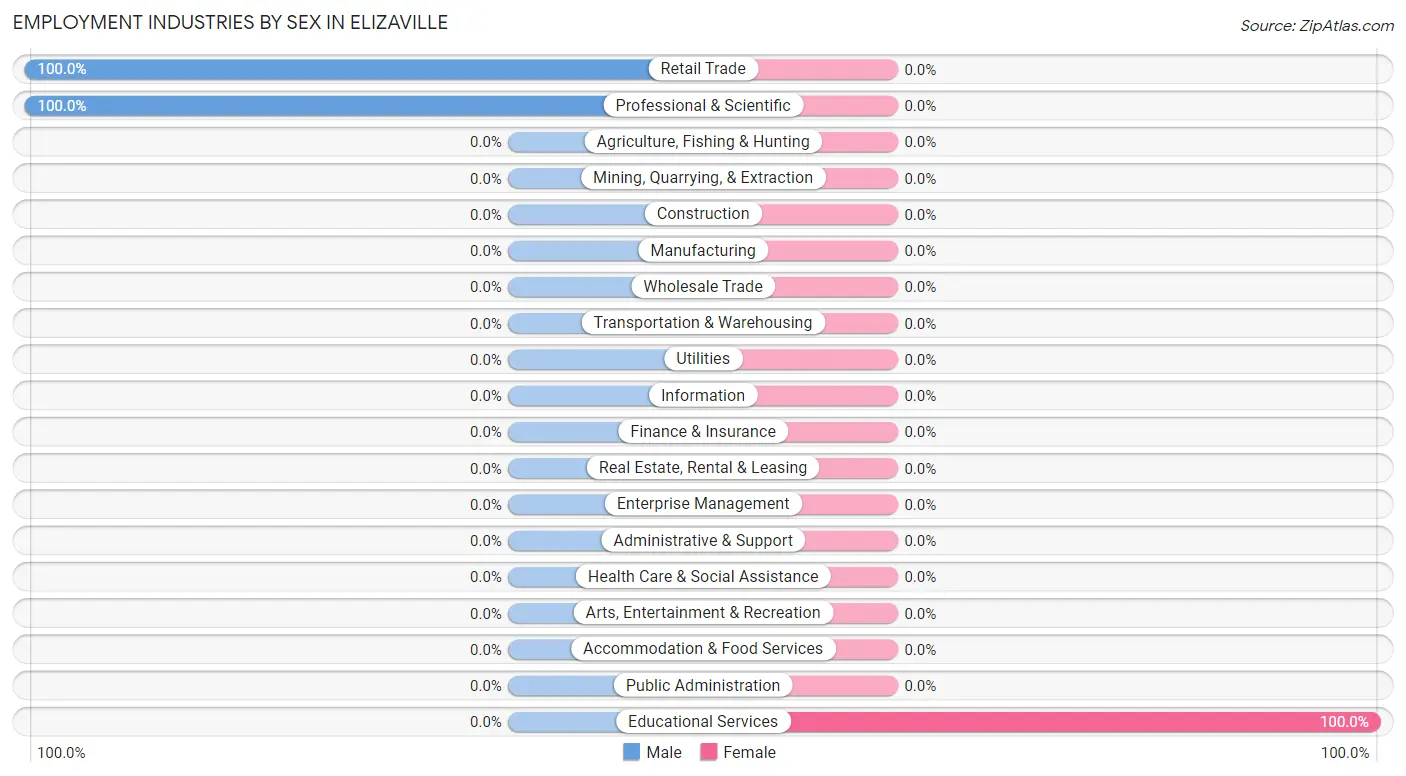
| Industry | Male | Female |
| Agriculture, Fishing & Hunting | 0 (0.0%) | 0 (0.0%) |
| Mining, Quarrying, & Extraction | 0 (0.0%) | 0 (0.0%) |
| Construction | 0 (0.0%) | 0 (0.0%) |
| Manufacturing | 0 (0.0%) | 0 (0.0%) |
| Wholesale Trade | 0 (0.0%) | 0 (0.0%) |
| Retail Trade | 12 (100.0%) | 0 (0.0%) |
| Transportation & Warehousing | 0 (0.0%) | 0 (0.0%) |
| Utilities | 0 (0.0%) | 0 (0.0%) |
| Information | 0 (0.0%) | 0 (0.0%) |
| Finance & Insurance | 0 (0.0%) | 0 (0.0%) |
| Real Estate, Rental & Leasing | 0 (0.0%) | 0 (0.0%) |
| Professional & Scientific | 19 (100.0%) | 0 (0.0%) |
| Enterprise Management | 0 (0.0%) | 0 (0.0%) |
| Administrative & Support | 0 (0.0%) | 0 (0.0%) |
| Educational Services | 0 (0.0%) | 11 (100.0%) |
| Health Care & Social Assistance | 0 (0.0%) | 0 (0.0%) |
| Arts, Entertainment & Recreation | 0 (0.0%) | 0 (0.0%) |
| Accommodation & Food Services | 0 (0.0%) | 0 (0.0%) |
| Public Administration | 0 (0.0%) | 0 (0.0%) |
| Total | 31 (73.8%) | 11 (26.2%) |
Education in Elizaville
School Enrollment in Elizaville
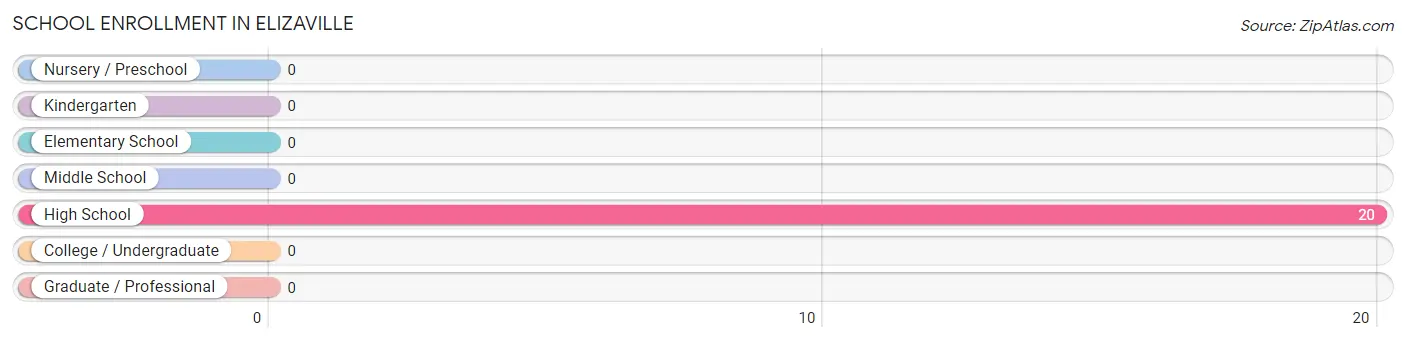
| School Level | # Students | % Students |
| Nursery / Preschool | 0 | 0.0% |
| Kindergarten | 0 | 0.0% |
| Elementary School | 0 | 0.0% |
| Middle School | 0 | 0.0% |
| High School | 20 | 100.0% |
| College / Undergraduate | 0 | 0.0% |
| Graduate / Professional | 0 | 0.0% |
| Total | 20 | 100.0% |
School Enrollment by Age by Funding Source in Elizaville
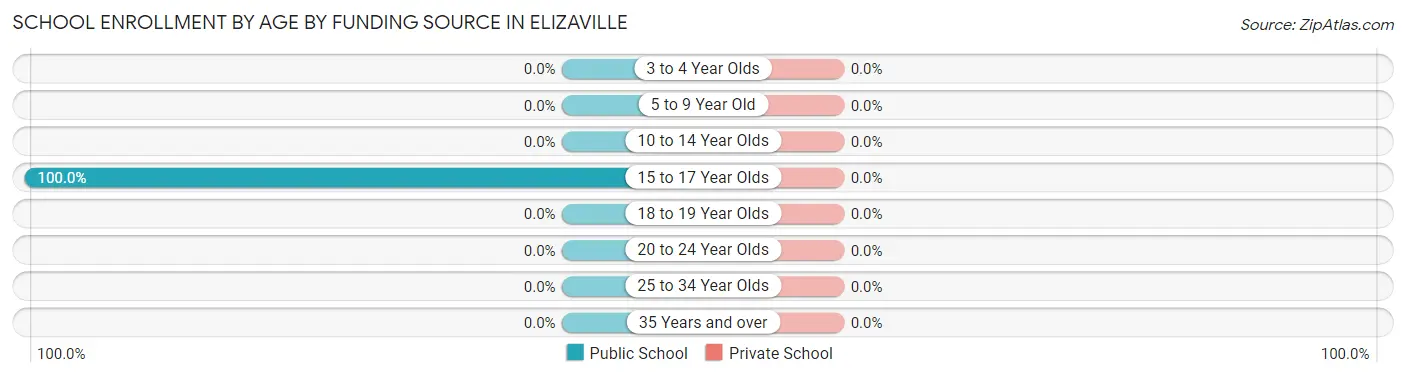
| Age Bracket | Public School | Private School |
| 3 to 4 Year Olds | 0 (0.0%) | 0 (0.0%) |
| 5 to 9 Year Old | 0 (0.0%) | 0 (0.0%) |
| 10 to 14 Year Olds | 0 (0.0%) | 0 (0.0%) |
| 15 to 17 Year Olds | 20 (100.0%) | 0 (0.0%) |
| 18 to 19 Year Olds | 0 (0.0%) | 0 (0.0%) |
| 20 to 24 Year Olds | 0 (0.0%) | 0 (0.0%) |
| 25 to 34 Year Olds | 0 (0.0%) | 0 (0.0%) |
| 35 Years and over | 0 (0.0%) | 0 (0.0%) |
| Total | 20 (100.0%) | 0 (0.0%) |
Educational Attainment by Field of Study in Elizaville
Arts & humanities (19 | 63.3%), and engineering (11 | 36.7%) are the most common fields of study among 30 individuals in Elizaville who have obtained a bachelor's degree or higher.
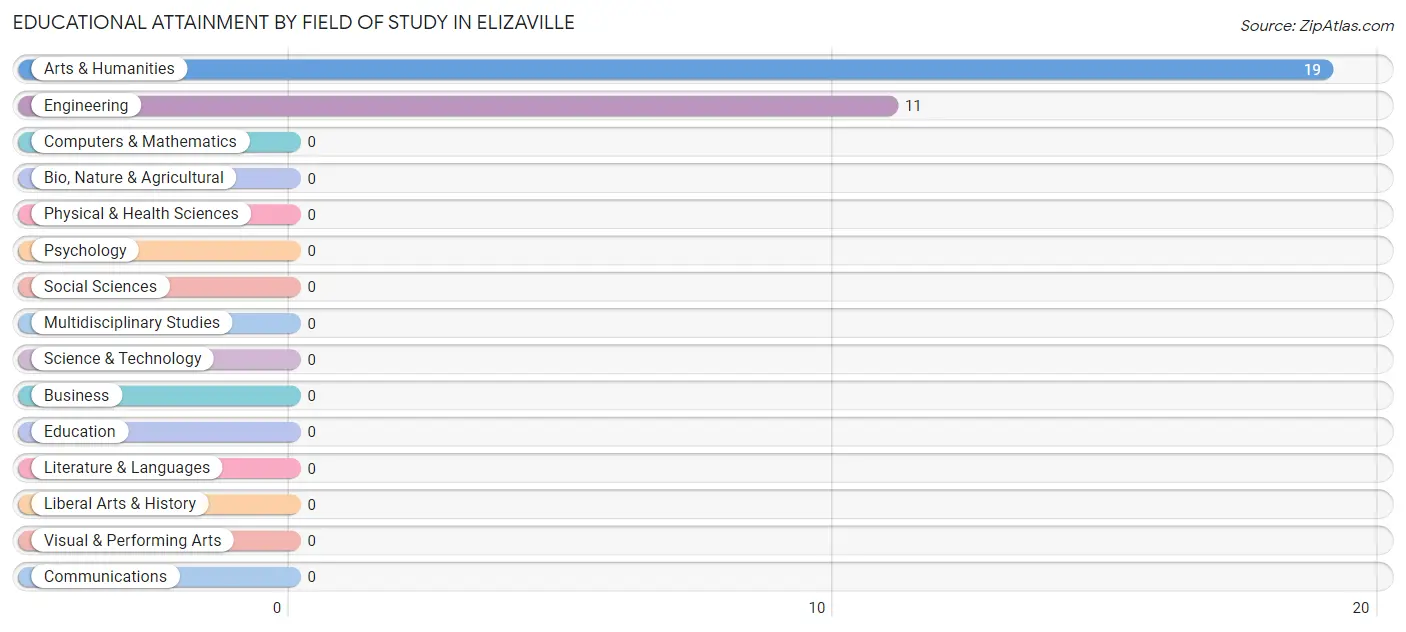
| Field of Study | # Graduates | % Graduates |
| Computers & Mathematics | 0 | 0.0% |
| Bio, Nature & Agricultural | 0 | 0.0% |
| Physical & Health Sciences | 0 | 0.0% |
| Psychology | 0 | 0.0% |
| Social Sciences | 0 | 0.0% |
| Engineering | 11 | 36.7% |
| Multidisciplinary Studies | 0 | 0.0% |
| Science & Technology | 0 | 0.0% |
| Business | 0 | 0.0% |
| Education | 0 | 0.0% |
| Literature & Languages | 0 | 0.0% |
| Liberal Arts & History | 0 | 0.0% |
| Visual & Performing Arts | 0 | 0.0% |
| Communications | 0 | 0.0% |
| Arts & Humanities | 19 | 63.3% |
| Total | 30 | 100.0% |
Transportation & Commute in Elizaville
Vehicle Availability by Sex in Elizaville
The most prevalent vehicle ownership categories in Elizaville are males with 1 vehicle (19, accounting for 61.3%) and females with 1 vehicle (0, making up 172.7%).
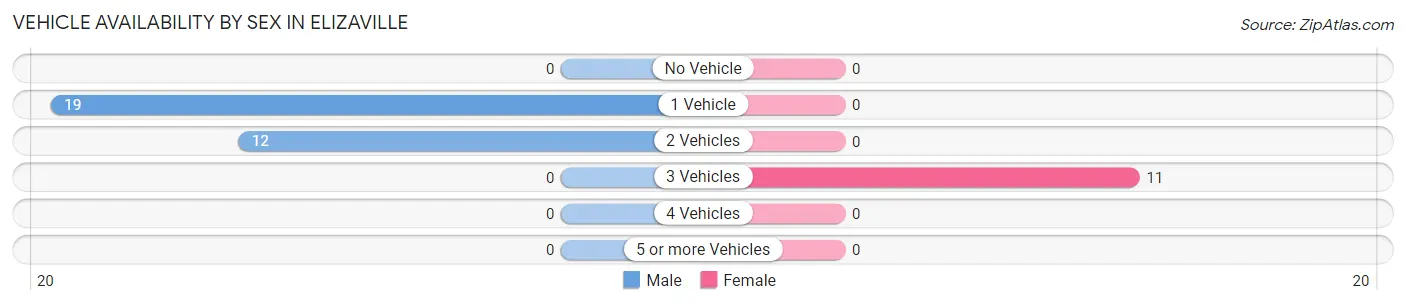
| Vehicles Available | Male | Female |
| No Vehicle | 0 (0.0%) | 0 (0.0%) |
| 1 Vehicle | 19 (61.3%) | 0 (0.0%) |
| 2 Vehicles | 12 (38.7%) | 0 (0.0%) |
| 3 Vehicles | 0 (0.0%) | 11 (100.0%) |
| 4 Vehicles | 0 (0.0%) | 0 (0.0%) |
| 5 or more Vehicles | 0 (0.0%) | 0 (0.0%) |
| Total | 31 (100.0%) | 11 (100.0%) |
Commute Time in Elizaville
The most frequently occuring commute durations in Elizaville are 15 to 19 minutes (19 commuters, 45.2%), 10 to 14 minutes (12 commuters, 28.6%), and 90 or more minutes (11 commuters, 26.2%).
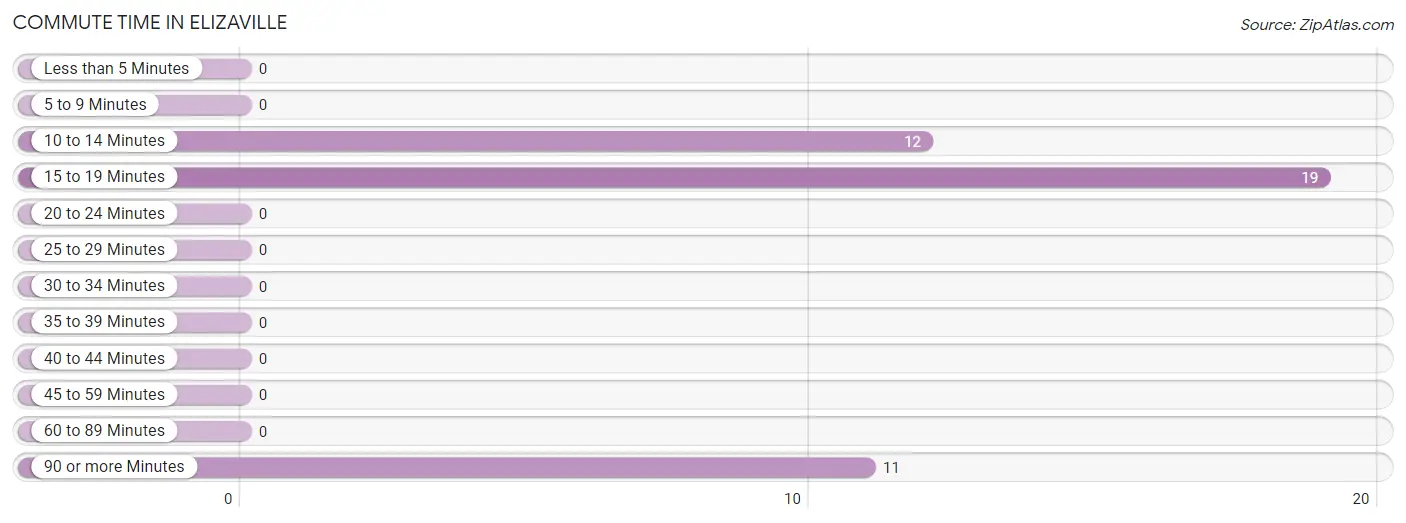
| Commute Time | # Commuters | % Commuters |
| Less than 5 Minutes | 0 | 0.0% |
| 5 to 9 Minutes | 0 | 0.0% |
| 10 to 14 Minutes | 12 | 28.6% |
| 15 to 19 Minutes | 19 | 45.2% |
| 20 to 24 Minutes | 0 | 0.0% |
| 25 to 29 Minutes | 0 | 0.0% |
| 30 to 34 Minutes | 0 | 0.0% |
| 35 to 39 Minutes | 0 | 0.0% |
| 40 to 44 Minutes | 0 | 0.0% |
| 45 to 59 Minutes | 0 | 0.0% |
| 60 to 89 Minutes | 0 | 0.0% |
| 90 or more Minutes | 11 | 26.2% |
Commute Time by Sex in Elizaville
The most common commute times in Elizaville are 15 to 19 minutes (19 commuters, 61.3%) for males and 90 or more minutes (11 commuters, 100.0%) for females.
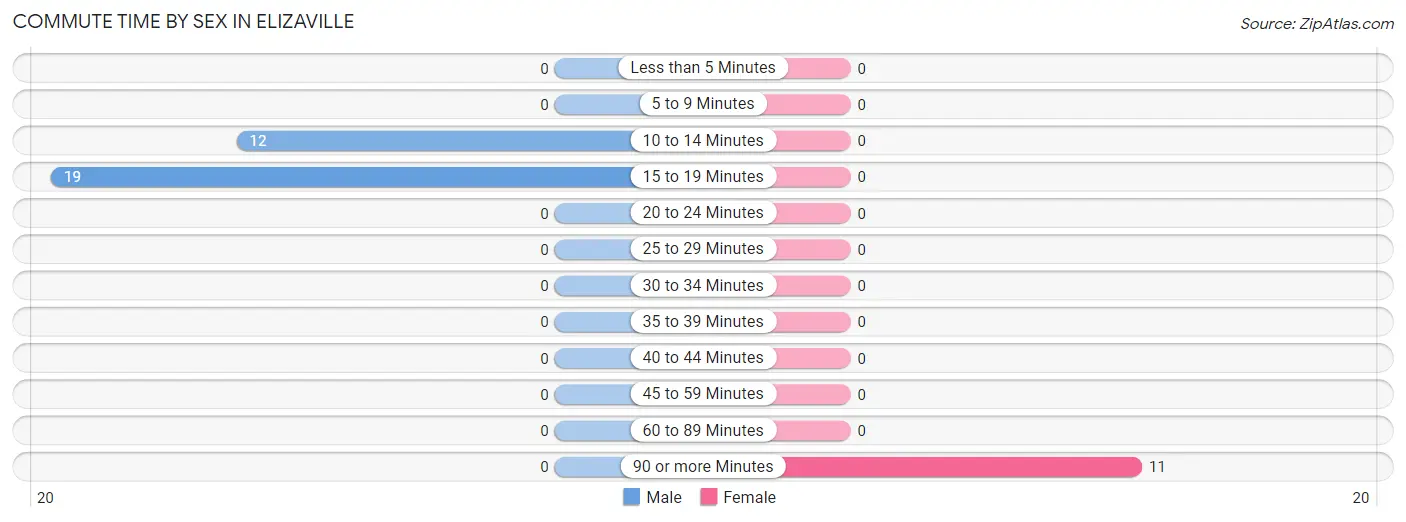
| Commute Time | Male | Female |
| Less than 5 Minutes | 0 (0.0%) | 0 (0.0%) |
| 5 to 9 Minutes | 0 (0.0%) | 0 (0.0%) |
| 10 to 14 Minutes | 12 (38.7%) | 0 (0.0%) |
| 15 to 19 Minutes | 19 (61.3%) | 0 (0.0%) |
| 20 to 24 Minutes | 0 (0.0%) | 0 (0.0%) |
| 25 to 29 Minutes | 0 (0.0%) | 0 (0.0%) |
| 30 to 34 Minutes | 0 (0.0%) | 0 (0.0%) |
| 35 to 39 Minutes | 0 (0.0%) | 0 (0.0%) |
| 40 to 44 Minutes | 0 (0.0%) | 0 (0.0%) |
| 45 to 59 Minutes | 0 (0.0%) | 0 (0.0%) |
| 60 to 89 Minutes | 0 (0.0%) | 0 (0.0%) |
| 90 or more Minutes | 0 (0.0%) | 11 (100.0%) |
Time of Departure to Work by Sex in Elizaville
The most frequent times of departure to work in Elizaville are 7:00 AM to 7:29 AM (31, 100.0%) for males and 7:30 AM to 7:59 AM (11, 100.0%) for females.
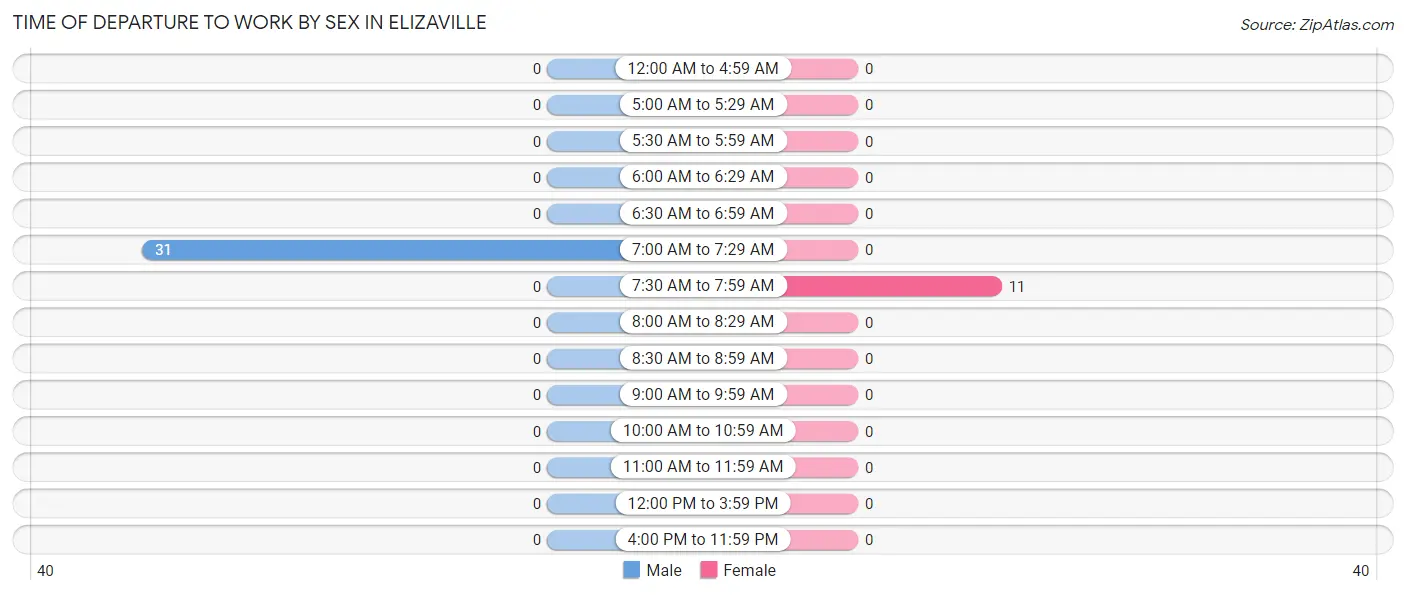
| Time of Departure | Male | Female |
| 12:00 AM to 4:59 AM | 0 (0.0%) | 0 (0.0%) |
| 5:00 AM to 5:29 AM | 0 (0.0%) | 0 (0.0%) |
| 5:30 AM to 5:59 AM | 0 (0.0%) | 0 (0.0%) |
| 6:00 AM to 6:29 AM | 0 (0.0%) | 0 (0.0%) |
| 6:30 AM to 6:59 AM | 0 (0.0%) | 0 (0.0%) |
| 7:00 AM to 7:29 AM | 31 (100.0%) | 0 (0.0%) |
| 7:30 AM to 7:59 AM | 0 (0.0%) | 11 (100.0%) |
| 8:00 AM to 8:29 AM | 0 (0.0%) | 0 (0.0%) |
| 8:30 AM to 8:59 AM | 0 (0.0%) | 0 (0.0%) |
| 9:00 AM to 9:59 AM | 0 (0.0%) | 0 (0.0%) |
| 10:00 AM to 10:59 AM | 0 (0.0%) | 0 (0.0%) |
| 11:00 AM to 11:59 AM | 0 (0.0%) | 0 (0.0%) |
| 12:00 PM to 3:59 PM | 0 (0.0%) | 0 (0.0%) |
| 4:00 PM to 11:59 PM | 0 (0.0%) | 0 (0.0%) |
| Total | 31 (100.0%) | 11 (100.0%) |
Housing Occupancy in Elizaville
Occupancy by Ownership in Elizaville
Of the total 65 dwellings in Elizaville, owner-occupied units account for 35 (53.8%), while renter-occupied units make up 30 (46.2%).
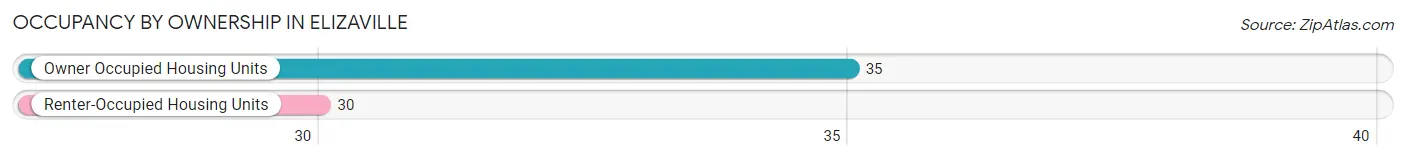
| Occupancy | # Housing Units | % Housing Units |
| Owner Occupied Housing Units | 35 | 53.8% |
| Renter-Occupied Housing Units | 30 | 46.2% |
| Total Occupied Housing Units | 65 | 100.0% |
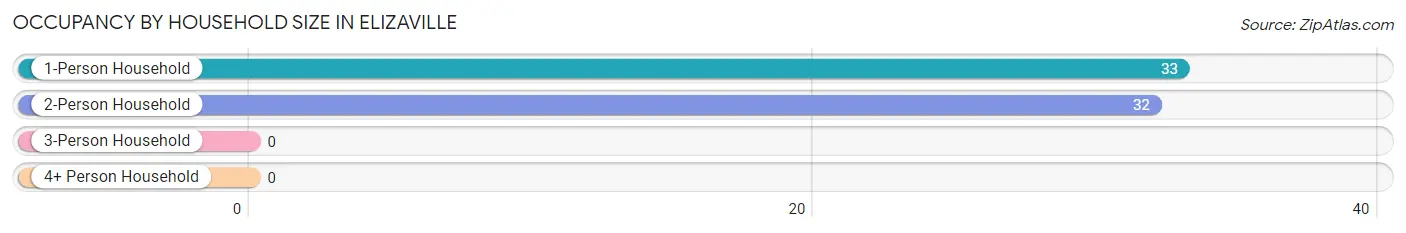
Occupancy by Household Size in Elizaville
| Household Size | # Housing Units | % Housing Units |
| 1-Person Household | 33 | 50.8% |
| 2-Person Household | 32 | 49.2% |
| 3-Person Household | 0 | 0.0% |
| 4+ Person Household | 0 | 0.0% |
| Total Housing Units | 65 | 100.0% |
Occupancy by Ownership by Household Size in Elizaville
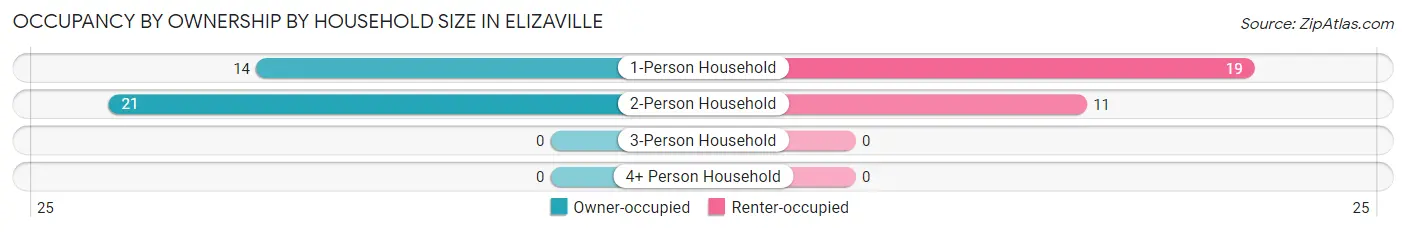
| Household Size | Owner-occupied | Renter-occupied |
| 1-Person Household | 14 (42.4%) | 19 (57.6%) |
| 2-Person Household | 21 (65.6%) | 11 (34.4%) |
| 3-Person Household | 0 (0.0%) | 0 (0.0%) |
| 4+ Person Household | 0 (0.0%) | 0 (0.0%) |
| Total Housing Units | 35 (53.8%) | 30 (46.2%) |
Occupancy by Educational Attainment in Elizaville
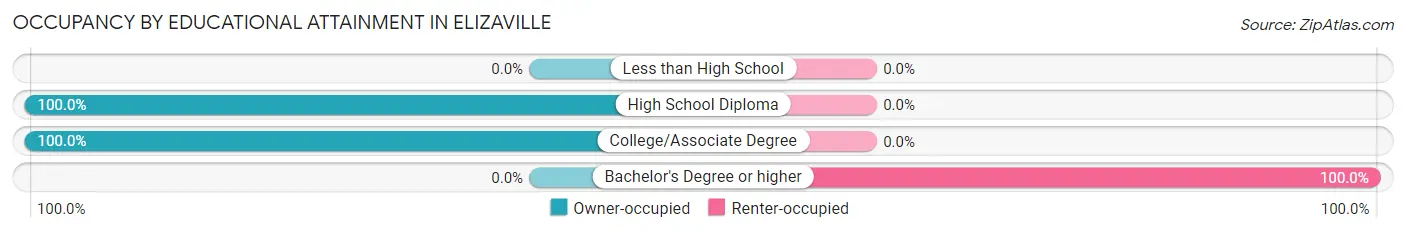
| Household Size | Owner-occupied | Renter-occupied |
| Less than High School | 0 (0.0%) | 0 (0.0%) |
| High School Diploma | 23 (100.0%) | 0 (0.0%) |
| College/Associate Degree | 12 (100.0%) | 0 (0.0%) |
| Bachelor's Degree or higher | 0 (0.0%) | 30 (100.0%) |
Occupancy by Age of Householder in Elizaville
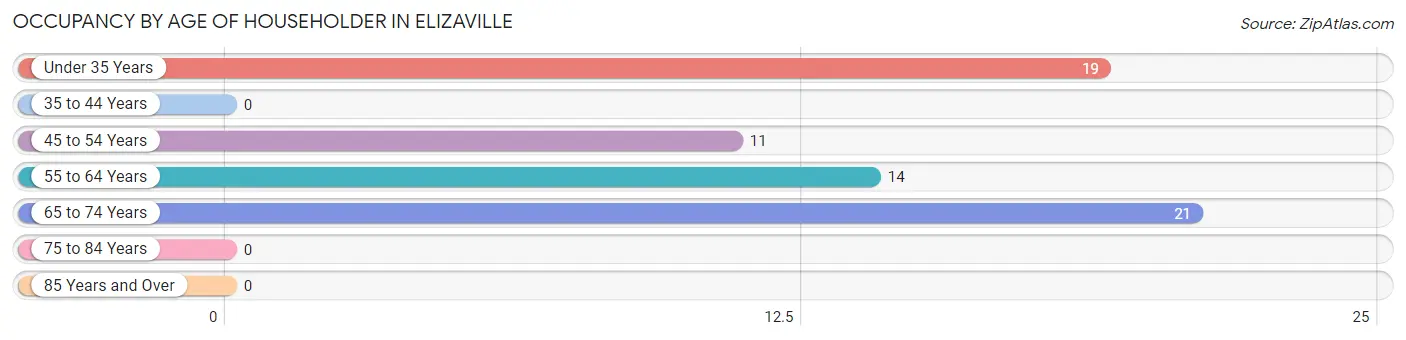
| Age Bracket | # Households | % Households |
| Under 35 Years | 19 | 29.2% |
| 35 to 44 Years | 0 | 0.0% |
| 45 to 54 Years | 11 | 16.9% |
| 55 to 64 Years | 14 | 21.5% |
| 65 to 74 Years | 21 | 32.3% |
| 75 to 84 Years | 0 | 0.0% |
| 85 Years and Over | 0 | 0.0% |
| Total | 65 | 100.0% |
Housing Finances in Elizaville
Median Income by Occupancy in Elizaville
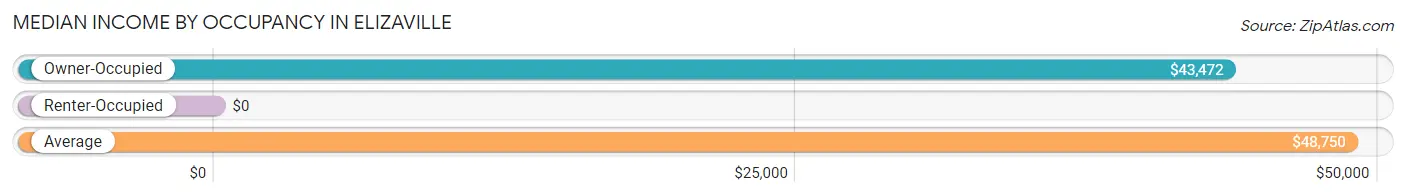
| Occupancy Type | # Households | Median Income |
| Owner-Occupied | 35 (53.8%) | $43,472 |
| Renter-Occupied | 30 (46.2%) | $0 |
| Average | 65 (100.0%) | $48,750 |
Occupancy by Householder Income Bracket in Elizaville
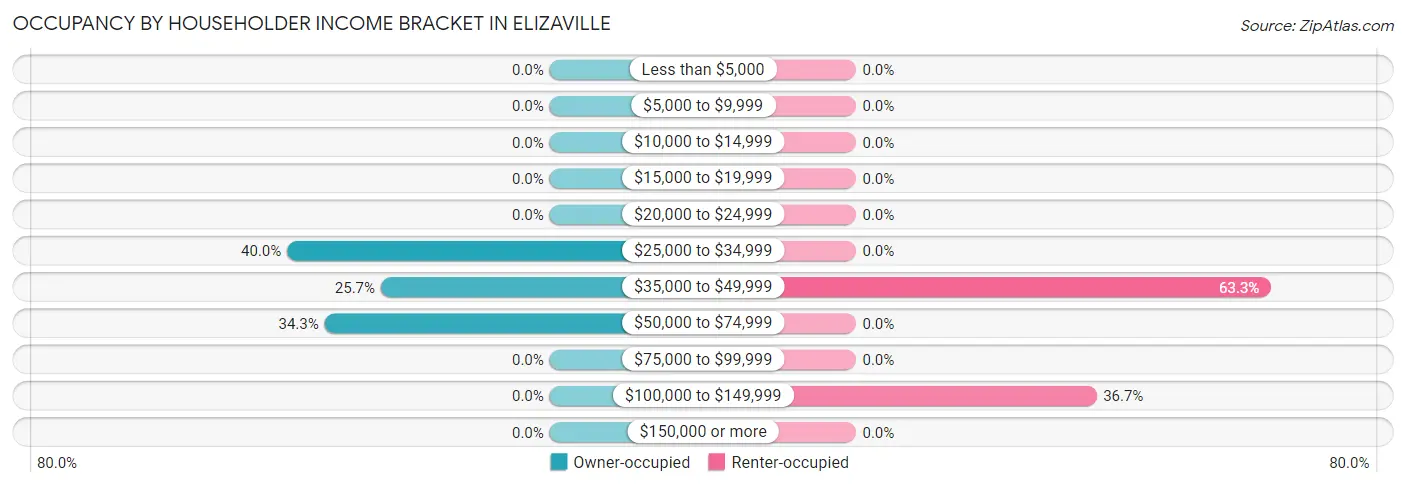
| Income Bracket | Owner-occupied | Renter-occupied |
| Less than $5,000 | 0 (0.0%) | 0 (0.0%) |
| $5,000 to $9,999 | 0 (0.0%) | 0 (0.0%) |
| $10,000 to $14,999 | 0 (0.0%) | 0 (0.0%) |
| $15,000 to $19,999 | 0 (0.0%) | 0 (0.0%) |
| $20,000 to $24,999 | 0 (0.0%) | 0 (0.0%) |
| $25,000 to $34,999 | 14 (40.0%) | 0 (0.0%) |
| $35,000 to $49,999 | 9 (25.7%) | 19 (63.3%) |
| $50,000 to $74,999 | 12 (34.3%) | 0 (0.0%) |
| $75,000 to $99,999 | 0 (0.0%) | 0 (0.0%) |
| $100,000 to $149,999 | 0 (0.0%) | 11 (36.7%) |
| $150,000 or more | 0 (0.0%) | 0 (0.0%) |
| Total | 35 (100.0%) | 30 (100.0%) |
Monthly Housing Cost Tiers in Elizaville
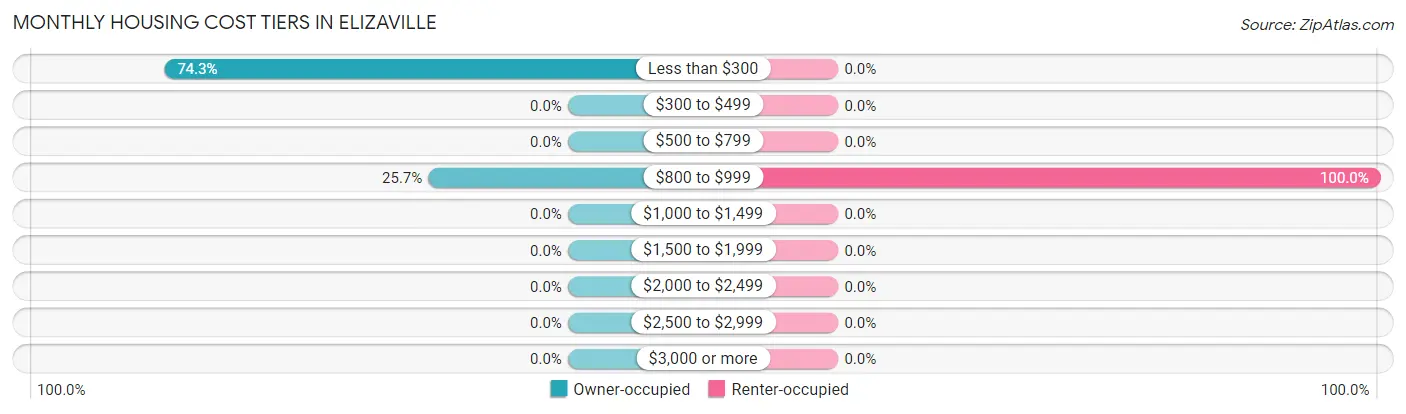
| Monthly Cost | Owner-occupied | Renter-occupied |
| Less than $300 | 26 (74.3%) | 0 (0.0%) |
| $300 to $499 | 0 (0.0%) | 0 (0.0%) |
| $500 to $799 | 0 (0.0%) | 0 (0.0%) |
| $800 to $999 | 9 (25.7%) | 30 (100.0%) |
| $1,000 to $1,499 | 0 (0.0%) | 0 (0.0%) |
| $1,500 to $1,999 | 0 (0.0%) | 0 (0.0%) |
| $2,000 to $2,499 | 0 (0.0%) | 0 (0.0%) |
| $2,500 to $2,999 | 0 (0.0%) | 0 (0.0%) |
| $3,000 or more | 0 (0.0%) | 0 (0.0%) |
| Total | 35 (100.0%) | 30 (100.0%) |
Physical Housing Characteristics in Elizaville
Housing Structures in Elizaville
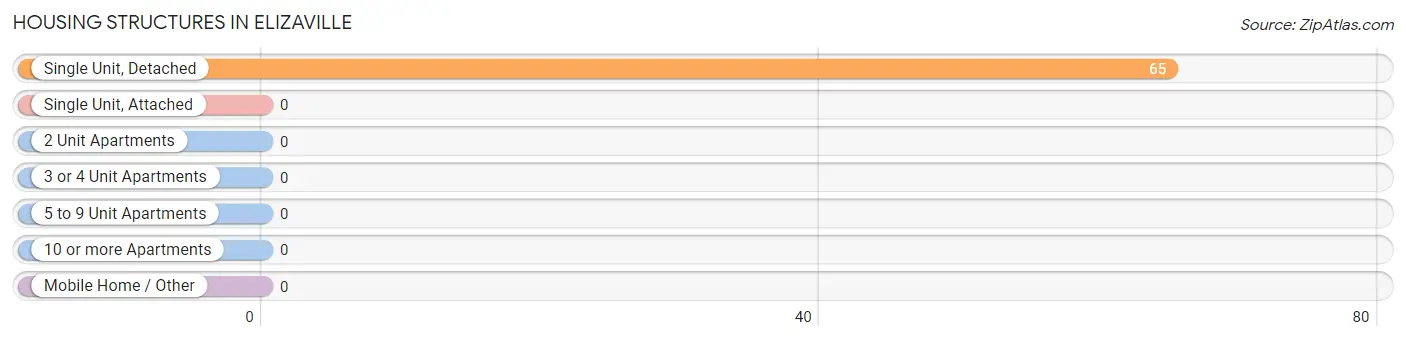
| Structure Type | # Housing Units | % Housing Units |
| Single Unit, Detached | 65 | 100.0% |
| Single Unit, Attached | 0 | 0.0% |
| 2 Unit Apartments | 0 | 0.0% |
| 3 or 4 Unit Apartments | 0 | 0.0% |
| 5 to 9 Unit Apartments | 0 | 0.0% |
| 10 or more Apartments | 0 | 0.0% |
| Mobile Home / Other | 0 | 0.0% |
| Total | 65 | 100.0% |
Housing Structures by Occupancy in Elizaville
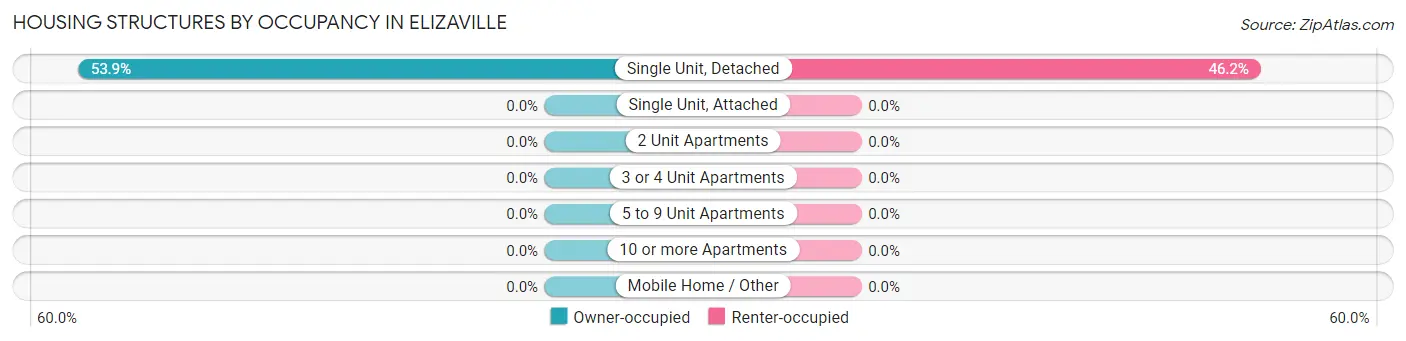
| Structure Type | Owner-occupied | Renter-occupied |
| Single Unit, Detached | 35 (53.8%) | 30 (46.2%) |
| Single Unit, Attached | 0 (0.0%) | 0 (0.0%) |
| 2 Unit Apartments | 0 (0.0%) | 0 (0.0%) |
| 3 or 4 Unit Apartments | 0 (0.0%) | 0 (0.0%) |
| 5 to 9 Unit Apartments | 0 (0.0%) | 0 (0.0%) |
| 10 or more Apartments | 0 (0.0%) | 0 (0.0%) |
| Mobile Home / Other | 0 (0.0%) | 0 (0.0%) |
| Total | 35 (53.8%) | 30 (46.2%) |
Housing Structures by Number of Rooms in Elizaville
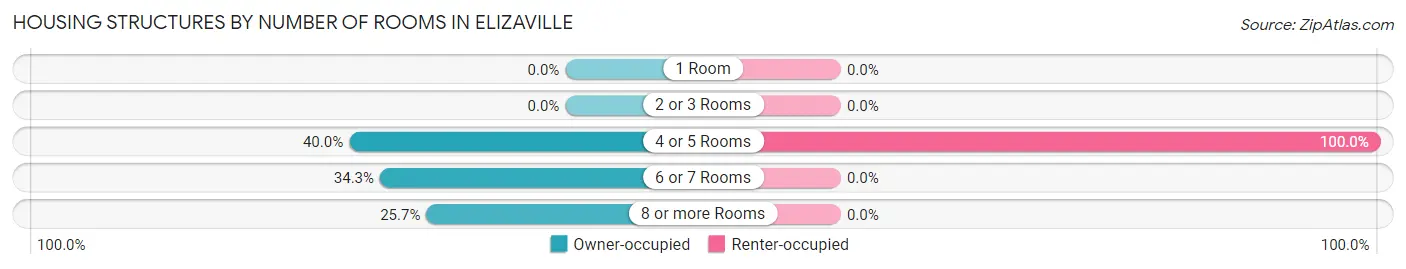
| Number of Rooms | Owner-occupied | Renter-occupied |
| 1 Room | 0 (0.0%) | 0 (0.0%) |
| 2 or 3 Rooms | 0 (0.0%) | 0 (0.0%) |
| 4 or 5 Rooms | 14 (40.0%) | 30 (100.0%) |
| 6 or 7 Rooms | 12 (34.3%) | 0 (0.0%) |
| 8 or more Rooms | 9 (25.7%) | 0 (0.0%) |
| Total | 35 (100.0%) | 30 (100.0%) |
Housing Structure by Heating Type in Elizaville
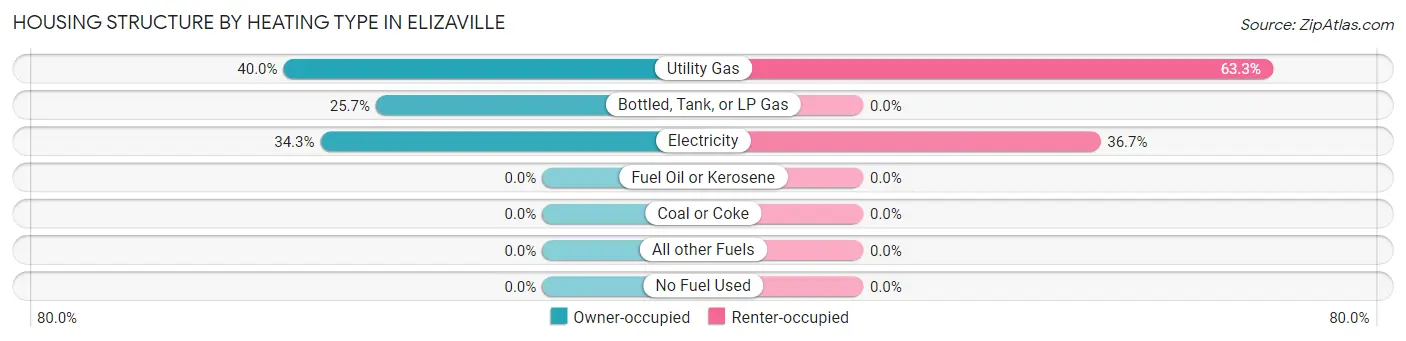
| Heating Type | Owner-occupied | Renter-occupied |
| Utility Gas | 14 (40.0%) | 19 (63.3%) |
| Bottled, Tank, or LP Gas | 9 (25.7%) | 0 (0.0%) |
| Electricity | 12 (34.3%) | 11 (36.7%) |
| Fuel Oil or Kerosene | 0 (0.0%) | 0 (0.0%) |
| Coal or Coke | 0 (0.0%) | 0 (0.0%) |
| All other Fuels | 0 (0.0%) | 0 (0.0%) |
| No Fuel Used | 0 (0.0%) | 0 (0.0%) |
| Total | 35 (100.0%) | 30 (100.0%) |
Household Vehicle Usage in Elizaville
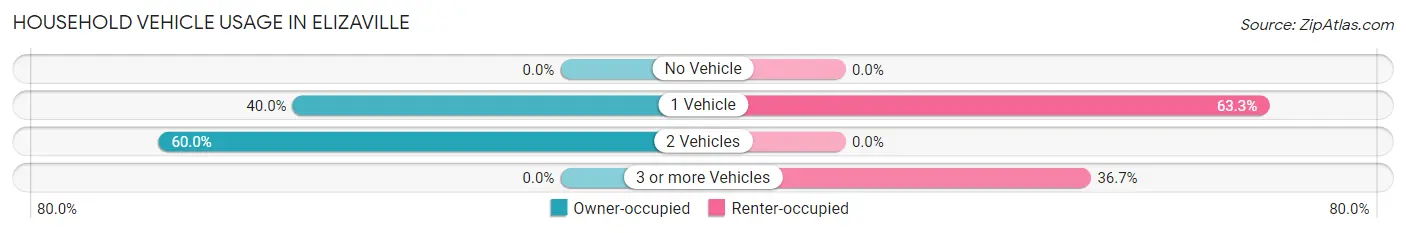
| Vehicles per Household | Owner-occupied | Renter-occupied |
| No Vehicle | 0 (0.0%) | 0 (0.0%) |
| 1 Vehicle | 14 (40.0%) | 19 (63.3%) |
| 2 Vehicles | 21 (60.0%) | 0 (0.0%) |
| 3 or more Vehicles | 0 (0.0%) | 11 (36.7%) |
| Total | 35 (100.0%) | 30 (100.0%) |
Real Estate & Mortgages in Elizaville
Real Estate and Mortgage Overview in Elizaville
| Characteristic | Without Mortgage | With Mortgage |
| Housing Units | 26 | 9 |
| Median Property Value | - | - |
| Median Household Income | - | - |
| Monthly Housing Costs | - | - |
| Real Estate Taxes | - | - |
Property Value by Mortgage Status in Elizaville
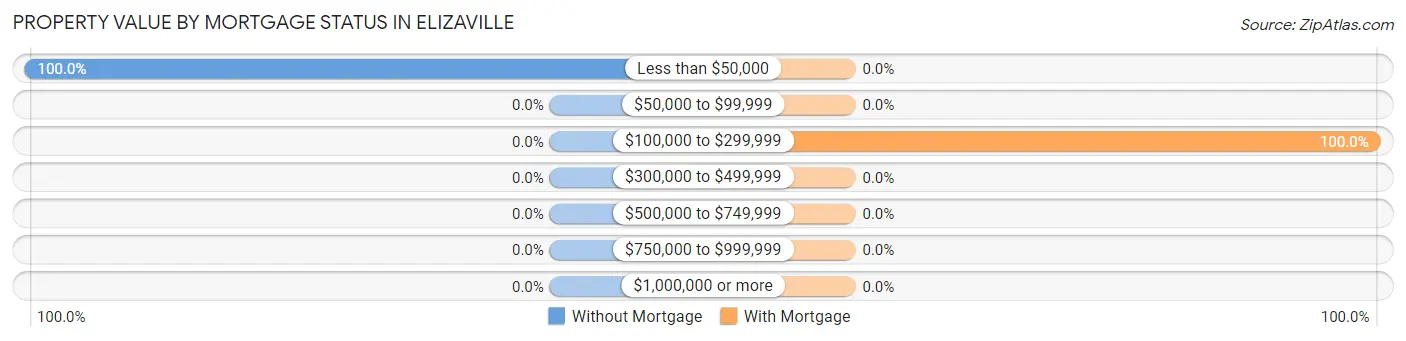
| Property Value | Without Mortgage | With Mortgage |
| Less than $50,000 | 26 (100.0%) | 0 (0.0%) |
| $50,000 to $99,999 | 0 (0.0%) | 0 (0.0%) |
| $100,000 to $299,999 | 0 (0.0%) | 9 (100.0%) |
| $300,000 to $499,999 | 0 (0.0%) | 0 (0.0%) |
| $500,000 to $749,999 | 0 (0.0%) | 0 (0.0%) |
| $750,000 to $999,999 | 0 (0.0%) | 0 (0.0%) |
| $1,000,000 or more | 0 (0.0%) | 0 (0.0%) |
| Total | 26 (100.0%) | 9 (100.0%) |
Household Income by Mortgage Status in Elizaville
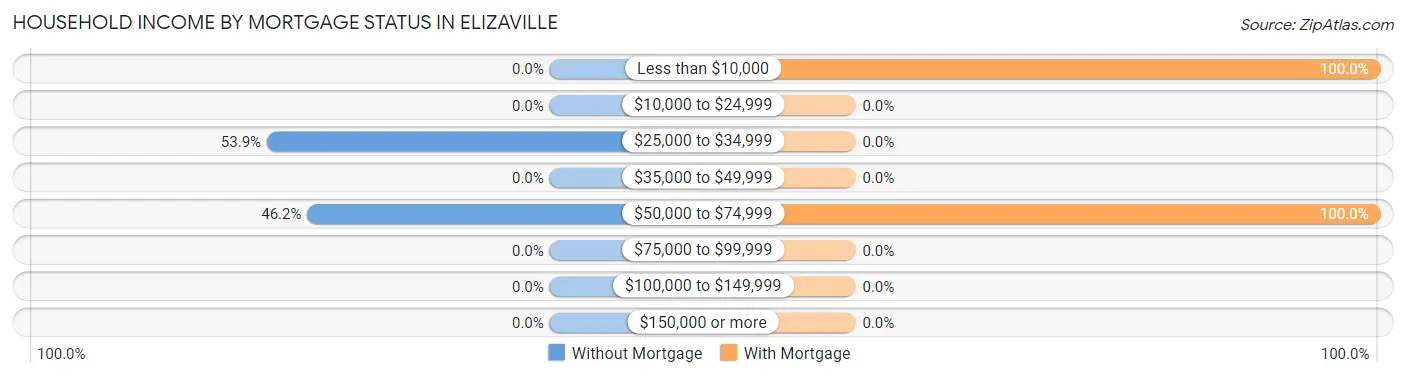
| Household Income | Without Mortgage | With Mortgage |
| Less than $10,000 | 0 (0.0%) | 9 (100.0%) |
| $10,000 to $24,999 | 0 (0.0%) | 0 (0.0%) |
| $25,000 to $34,999 | 14 (53.8%) | 0 (0.0%) |
| $35,000 to $49,999 | 0 (0.0%) | 0 (0.0%) |
| $50,000 to $74,999 | 12 (46.2%) | 9 (100.0%) |
| $75,000 to $99,999 | 0 (0.0%) | 0 (0.0%) |
| $100,000 to $149,999 | 0 (0.0%) | 0 (0.0%) |
| $150,000 or more | 0 (0.0%) | 0 (0.0%) |
| Total | 26 (100.0%) | 9 (100.0%) |
Property Value to Household Income Ratio in Elizaville
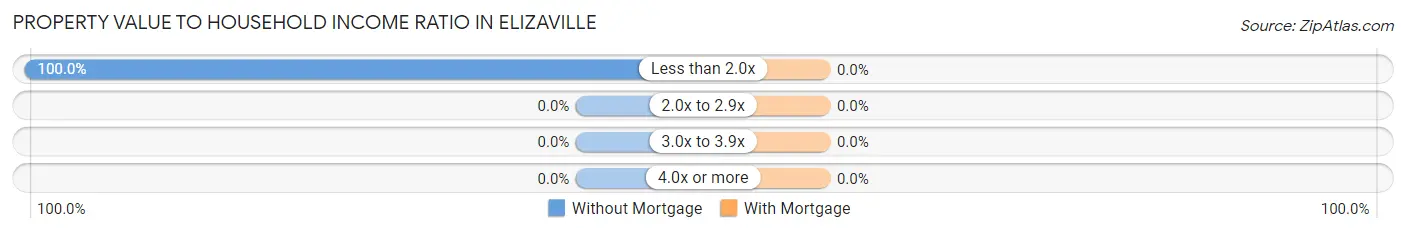
| Value-to-Income Ratio | Without Mortgage | With Mortgage |
| Less than 2.0x | 26 (100.0%) | 0 (0.0%) |
| 2.0x to 2.9x | 0 (0.0%) | 0 (0.0%) |
| 3.0x to 3.9x | 0 (0.0%) | 0 (0.0%) |
| 4.0x or more | 0 (0.0%) | 0 (0.0%) |
| Total | 26 (100.0%) | 9 (100.0%) |
Real Estate Taxes by Mortgage Status in Elizaville
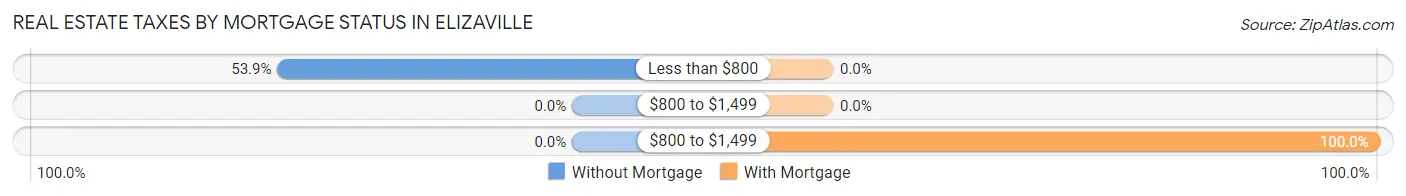
| Property Taxes | Without Mortgage | With Mortgage |
| Less than $800 | 14 (53.8%) | 0 (0.0%) |
| $800 to $1,499 | 0 (0.0%) | 0 (0.0%) |
| $800 to $1,499 | 0 (0.0%) | 9 (100.0%) |
| Total | 26 (100.0%) | 9 (100.0%) |
Health & Disability in Elizaville
Health Insurance Coverage by Age in Elizaville
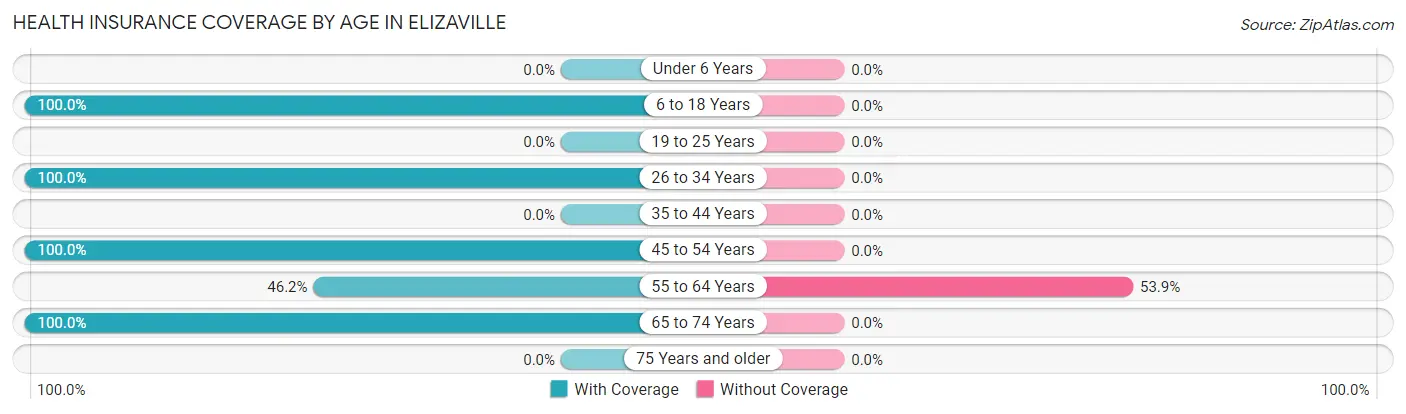
| Age Bracket | With Coverage | Without Coverage |
| Under 6 Years | 0 (0.0%) | 0 (0.0%) |
| 6 to 18 Years | 20 (100.0%) | 0 (0.0%) |
| 19 to 25 Years | 0 (0.0%) | 0 (0.0%) |
| 26 to 34 Years | 19 (100.0%) | 0 (0.0%) |
| 35 to 44 Years | 0 (0.0%) | 0 (0.0%) |
| 45 to 54 Years | 11 (100.0%) | 0 (0.0%) |
| 55 to 64 Years | 12 (46.2%) | 14 (53.8%) |
| 65 to 74 Years | 38 (100.0%) | 0 (0.0%) |
| 75 Years and older | 0 (0.0%) | 0 (0.0%) |
| Total | 100 (87.7%) | 14 (12.3%) |
Health Insurance Coverage by Citizenship Status in Elizaville

| Citizenship Status | With Coverage | Without Coverage |
| Native Born | 0 (0.0%) | 0 (0.0%) |
| Foreign Born, Citizen | 20 (100.0%) | 0 (0.0%) |
| Foreign Born, not a Citizen | 0 (0.0%) | 0 (0.0%) |
Health Insurance Coverage by Household Income in Elizaville
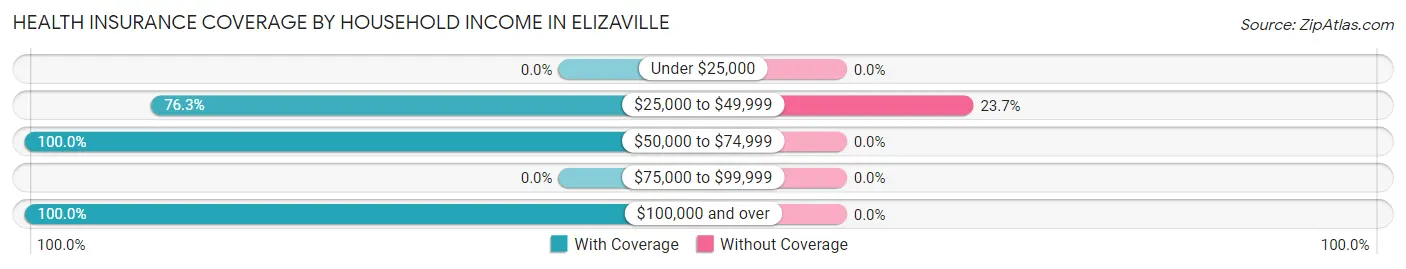
| Household Income | With Coverage | Without Coverage |
| Under $25,000 | 0 (0.0%) | 0 (0.0%) |
| $25,000 to $49,999 | 45 (76.3%) | 14 (23.7%) |
| $50,000 to $74,999 | 24 (100.0%) | 0 (0.0%) |
| $75,000 to $99,999 | 0 (0.0%) | 0 (0.0%) |
| $100,000 and over | 31 (100.0%) | 0 (0.0%) |
Public vs Private Health Insurance Coverage by Age in Elizaville
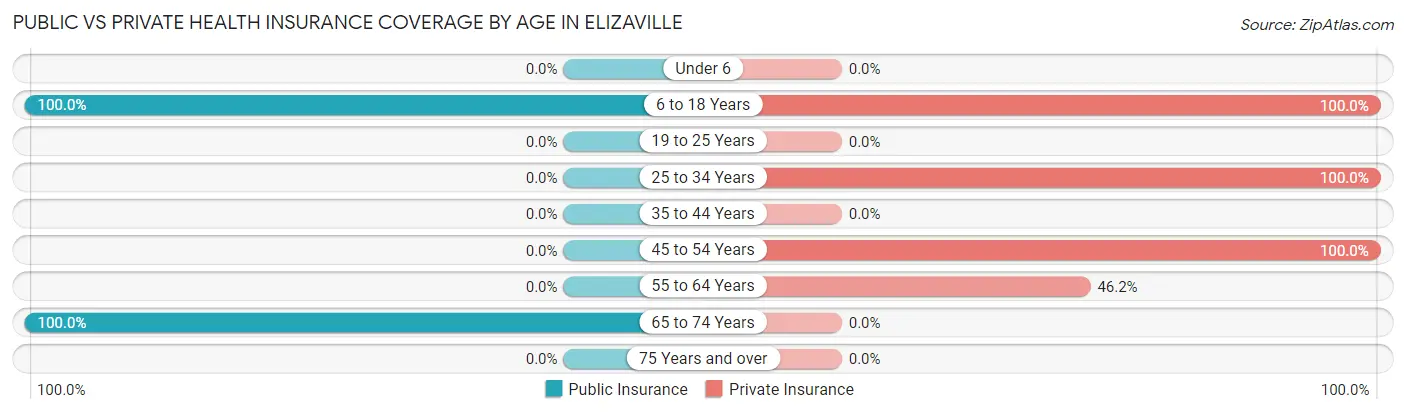
| Age Bracket | Public Insurance | Private Insurance |
| Under 6 | 0 (0.0%) | 0 (0.0%) |
| 6 to 18 Years | 20 (100.0%) | 20 (100.0%) |
| 19 to 25 Years | 0 (0.0%) | 0 (0.0%) |
| 25 to 34 Years | 0 (0.0%) | 19 (100.0%) |
| 35 to 44 Years | 0 (0.0%) | 0 (0.0%) |
| 45 to 54 Years | 0 (0.0%) | 11 (100.0%) |
| 55 to 64 Years | 0 (0.0%) | 12 (46.2%) |
| 65 to 74 Years | 38 (100.0%) | 0 (0.0%) |
| 75 Years and over | 0 (0.0%) | 0 (0.0%) |
| Total | 58 (50.9%) | 62 (54.4%) |
Disability Status by Sex by Age in Elizaville
| Age Bracket | Male | Female |
| Under 5 Years | 0 (0.0%) | 0 (0.0%) |
| 5 to 17 Years | 0 (0.0%) | 0 (0.0%) |
| 18 to 34 Years | 0 (0.0%) | 0 (0.0%) |
| 35 to 64 Years | 0 (0.0%) | 0 (0.0%) |
| 65 to 74 Years | 0 (0.0%) | 0 (0.0%) |
| 75 Years and over | 0 (0.0%) | 0 (0.0%) |
Disability Class by Sex by Age in Elizaville
Disability Class: Hearing Difficulty
| Age Bracket | Male | Female |
| Under 5 Years | 0 (0.0%) | 0 (0.0%) |
| 5 to 17 Years | 0 (0.0%) | 0 (0.0%) |
| 18 to 34 Years | 0 (0.0%) | 0 (0.0%) |
| 35 to 64 Years | 0 (0.0%) | 0 (0.0%) |
| 65 to 74 Years | 0 (0.0%) | 0 (0.0%) |
| 75 Years and over | 0 (0.0%) | 0 (0.0%) |
Disability Class: Vision Difficulty
| Age Bracket | Male | Female |
| Under 5 Years | 0 (0.0%) | 0 (0.0%) |
| 5 to 17 Years | 0 (0.0%) | 0 (0.0%) |
| 18 to 34 Years | 0 (0.0%) | 0 (0.0%) |
| 35 to 64 Years | 0 (0.0%) | 0 (0.0%) |
| 65 to 74 Years | 0 (0.0%) | 0 (0.0%) |
| 75 Years and over | 0 (0.0%) | 0 (0.0%) |
Disability Class: Cognitive Difficulty
| Age Bracket | Male | Female |
| 5 to 17 Years | 0 (0.0%) | 0 (0.0%) |
| 18 to 34 Years | 0 (0.0%) | 0 (0.0%) |
| 35 to 64 Years | 0 (0.0%) | 0 (0.0%) |
| 65 to 74 Years | 0 (0.0%) | 0 (0.0%) |
| 75 Years and over | 0 (0.0%) | 0 (0.0%) |
Disability Class: Ambulatory Difficulty
| Age Bracket | Male | Female |
| 5 to 17 Years | 0 (0.0%) | 0 (0.0%) |
| 18 to 34 Years | 0 (0.0%) | 0 (0.0%) |
| 35 to 64 Years | 0 (0.0%) | 0 (0.0%) |
| 65 to 74 Years | 0 (0.0%) | 0 (0.0%) |
| 75 Years and over | 0 (0.0%) | 0 (0.0%) |
Disability Class: Self-Care Difficulty
| Age Bracket | Male | Female |
| 5 to 17 Years | 0 (0.0%) | 0 (0.0%) |
| 18 to 34 Years | 0 (0.0%) | 0 (0.0%) |
| 35 to 64 Years | 0 (0.0%) | 0 (0.0%) |
| 65 to 74 Years | 0 (0.0%) | 0 (0.0%) |
| 75 Years and over | 0 (0.0%) | 0 (0.0%) |
Technology Access in Elizaville
Computing Device Access in Elizaville
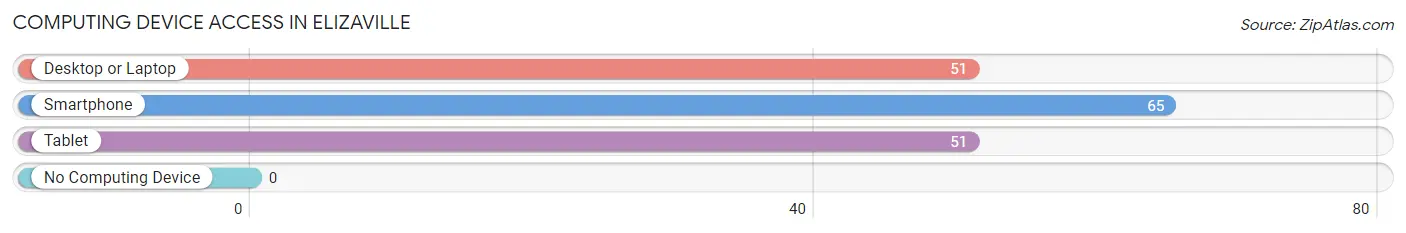
| Device Type | # Households | % Households |
| Desktop or Laptop | 51 | 78.5% |
| Smartphone | 65 | 100.0% |
| Tablet | 51 | 78.5% |
| No Computing Device | 0 | 0.0% |
| Total | 65 | 100.0% |
Internet Access in Elizaville
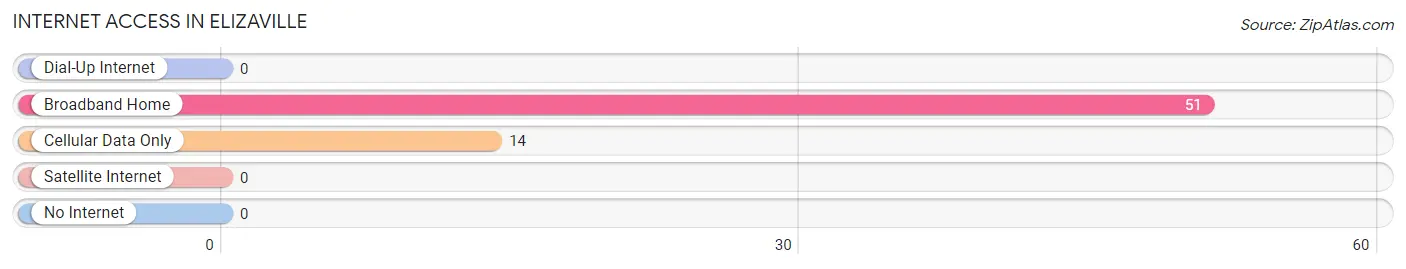
| Internet Type | # Households | % Households |
| Dial-Up Internet | 0 | 0.0% |
| Broadband Home | 51 | 78.5% |
| Cellular Data Only | 14 | 21.5% |
| Satellite Internet | 0 | 0.0% |
| No Internet | 0 | 0.0% |
| Total | 65 | 100.0% |
Elizaville Summary
Elizaville is a small unincorporated community located in Fleming County, Kentucky, United States. It is situated along the banks of the Licking River, approximately 8 miles south of Flemingsburg, the county seat. The population of Elizaville was estimated to be around 200 people in 2020.
History
Elizaville was founded in 1817 by William and Elizabeth Elizaville, who were among the first settlers in the area. The town was named after Elizabeth, who was the daughter of a Revolutionary War veteran. The town was originally a farming community, but it soon became a hub for the local timber industry. In the late 19th century, Elizaville was home to several sawmills, gristmills, and a distillery.
The town was also home to a post office, which opened in 1837 and closed in 1907. The post office was located in a building that is now a private residence.
Geography
Elizaville is located in Fleming County, Kentucky, approximately 8 miles south of Flemingsburg, the county seat. The town is situated along the banks of the Licking River, which is a tributary of the Ohio River. The town is surrounded by rolling hills and farmland.
The climate in Elizaville is humid subtropical, with hot summers and mild winters. The average annual temperature is around 57°F (14°C). The average annual precipitation is around 43 inches (109 cm).
Economy
The economy of Elizaville is largely based on agriculture and tourism. The town is home to several farms, which produce a variety of crops, including corn, soybeans, and hay. The town is also home to several small businesses, including a general store, a gas station, and a restaurant.
Tourism is an important part of the local economy. The town is home to several historic sites, including the Elizaville Cemetery, which dates back to the early 19th century. The town is also home to several parks, including the Elizaville Park, which offers camping, fishing, and hiking.
Demographics
The population of Elizaville was estimated to be around 200 people in 2020. The racial makeup of the town is 97.5% White, 0.5% African American, 0.5% Native American, and 1.5% other. The median household income is around $35,000, and the median home value is around $90,000.
Elizaville is served by the Fleming County School District, which includes two elementary schools, one middle school, and one high school. The town is also home to several churches, including the Elizaville United Methodist Church and the Elizaville Baptist Church.
Conclusion
Elizaville is a small unincorporated community located in Fleming County, Kentucky. It was founded in 1817 by William and Elizabeth Elizaville, and it was originally a farming community. Today, the economy of Elizaville is largely based on agriculture and tourism. The population of Elizaville was estimated to be around 200 people in 2020, and the town is served by the Fleming County School District. Elizaville is home to several historic sites and parks, making it a popular destination for tourists.
Common Questions
What is Per Capita Income in Elizaville?
Per Capita income in Elizaville is $36,078.
What is the Median Family Income in Elizaville?
Median Family Income in Elizaville is $73,958.
What is the Median Household income in Elizaville?
Median Household Income in Elizaville is $48,750.
What is Inequality or Gini Index in Elizaville?
Inequality or Gini Index in Elizaville is 0.23.
What is the Total Population of Elizaville?
Total Population of Elizaville is 114.
What is the Total Male Population of Elizaville?
Total Male Population of Elizaville is 60.
What is the Total Female Population of Elizaville?
Total Female Population of Elizaville is 54.
What is the Ratio of Males per 100 Females in Elizaville?
There are 111.11 Males per 100 Females in Elizaville.
What is the Ratio of Females per 100 Males in Elizaville?
There are 90.00 Females per 100 Males in Elizaville.
What is the Median Population Age in Elizaville?
Median Population Age in Elizaville is 60.3 Years.
What is the Average Family Size in Elizaville
Average Family Size in Elizaville is 2.5 People.
What is the Average Household Size in Elizaville
Average Household Size in Elizaville is 1.8 People.
How Large is the Labor Force in Elizaville?
There are 56 People in the Labor Forcein in Elizaville.
What is the Percentage of People in the Labor Force in Elizaville?
49.1% of People are in the Labor Force in Elizaville.
What is the Unemployment Rate in Elizaville?
Unemployment Rate in Elizaville is 25.0%.