Auburn, WY Map & Demographics
Auburn Map
Auburn Overview
$31,512
PER CAPITA INCOME
$101,250
AVG FAMILY INCOME
$100,776
AVG HOUSEHOLD INCOME
0.15
INEQUALITY / GINI INDEX
369
TOTAL POPULATION
137
MALE POPULATION
232
FEMALE POPULATION
59.05
MALES / 100 FEMALES
169.34
FEMALES / 100 MALES
28.6
MEDIAN AGE
3.3
AVG FAMILY SIZE
3.1
AVG HOUSEHOLD SIZE
86
LABOR FORCE [ PEOPLE ]
38.6%
PERCENT IN LABOR FORCE
Auburn Zip Codes
Auburn Area Codes
Income in Auburn
Income Overview in Auburn
Per Capita Income in Auburn is $31,512, while median incomes of families and households are $101,250 and $100,776 respectively.
| Characteristic | Number | Measure |
| Per Capita Income | 369 | $31,512 |
| Median Family Income | 109 | $101,250 |
| Mean Family Income | 109 | $99,511 |
| Median Household Income | 120 | $100,776 |
| Mean Household Income | 120 | $92,029 |
| Income Deficit | 109 | $0 |
| Wage / Income Gap (%) | 369 | 0.00% |
| Wage / Income Gap ($) | 369 | 100.00¢ per $1 |
| Gini / Inequality Index | 369 | 0.15 |
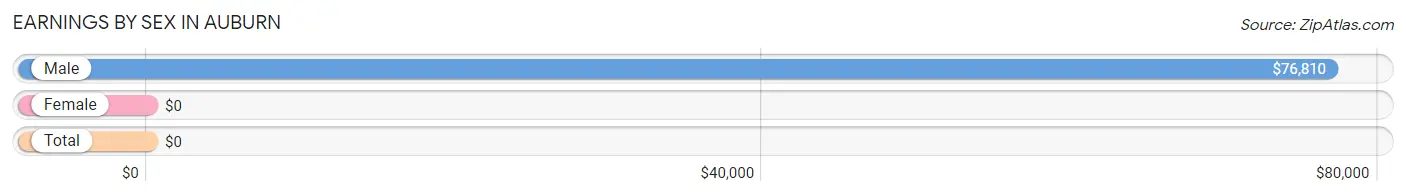
Earnings by Sex in Auburn
| Sex | Number | Average Earnings |
| Male | 86 (62.8%) | $76,810 |
| Female | 51 (37.2%) | $0 |
| Total | 137 (100.0%) | $0 |
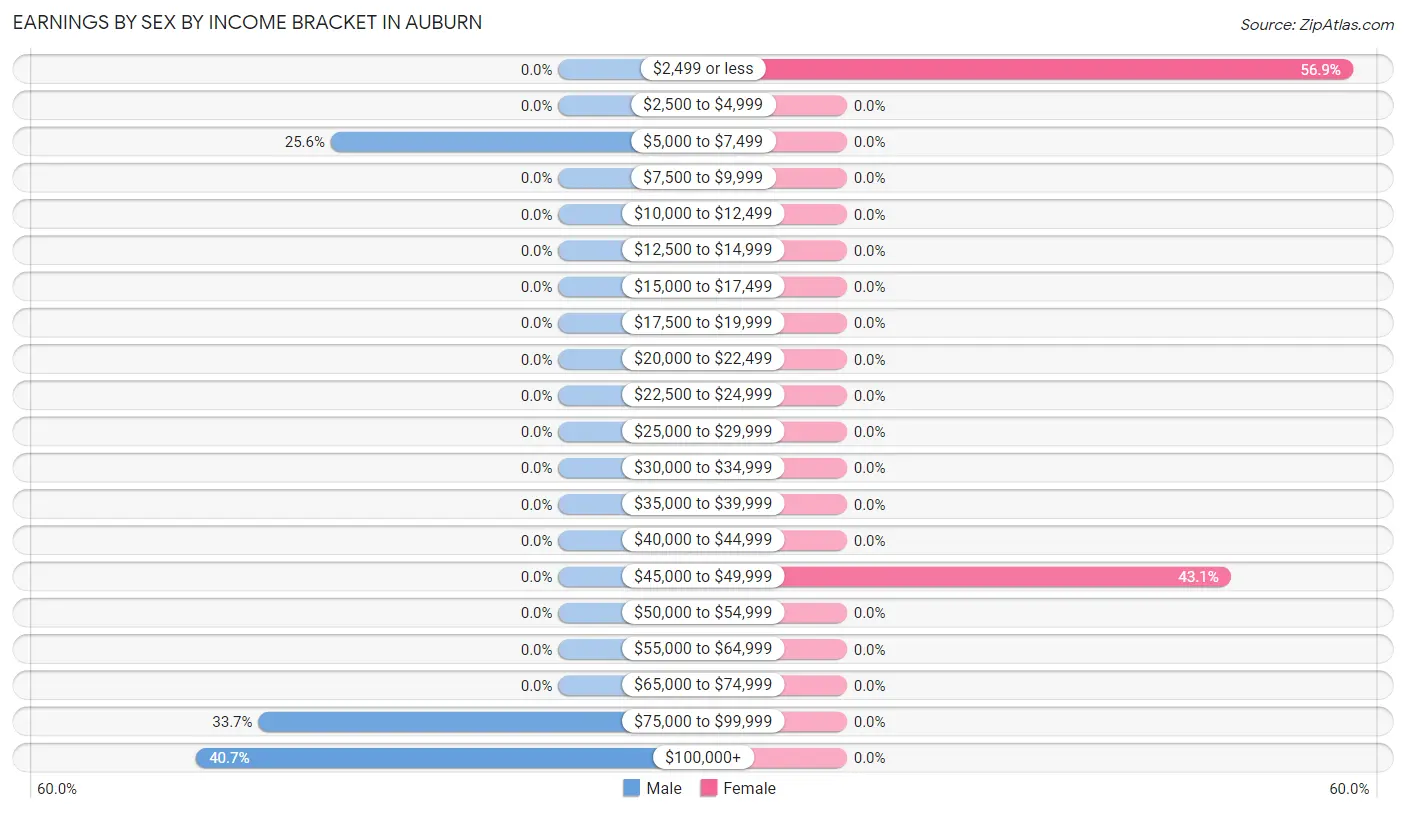
Earnings by Sex by Income Bracket in Auburn
The most common earnings brackets in Auburn are $100,000+ for men (35 | 40.7%) and $2,499 or less for women (29 | 56.9%).
| Income | Male | Female |
| $2,499 or less | 0 (0.0%) | 29 (56.9%) |
| $2,500 to $4,999 | 0 (0.0%) | 0 (0.0%) |
| $5,000 to $7,499 | 22 (25.6%) | 0 (0.0%) |
| $7,500 to $9,999 | 0 (0.0%) | 0 (0.0%) |
| $10,000 to $12,499 | 0 (0.0%) | 0 (0.0%) |
| $12,500 to $14,999 | 0 (0.0%) | 0 (0.0%) |
| $15,000 to $17,499 | 0 (0.0%) | 0 (0.0%) |
| $17,500 to $19,999 | 0 (0.0%) | 0 (0.0%) |
| $20,000 to $22,499 | 0 (0.0%) | 0 (0.0%) |
| $22,500 to $24,999 | 0 (0.0%) | 0 (0.0%) |
| $25,000 to $29,999 | 0 (0.0%) | 0 (0.0%) |
| $30,000 to $34,999 | 0 (0.0%) | 0 (0.0%) |
| $35,000 to $39,999 | 0 (0.0%) | 0 (0.0%) |
| $40,000 to $44,999 | 0 (0.0%) | 0 (0.0%) |
| $45,000 to $49,999 | 0 (0.0%) | 22 (43.1%) |
| $50,000 to $54,999 | 0 (0.0%) | 0 (0.0%) |
| $55,000 to $64,999 | 0 (0.0%) | 0 (0.0%) |
| $65,000 to $74,999 | 0 (0.0%) | 0 (0.0%) |
| $75,000 to $99,999 | 29 (33.7%) | 0 (0.0%) |
| $100,000+ | 35 (40.7%) | 0 (0.0%) |
| Total | 86 (100.0%) | 51 (100.0%) |
Earnings by Sex by Educational Attainment in Auburn
| Educational Attainment | Male Income | Female Income |
| Less than High School | - | - |
| High School Diploma | - | - |
| College or Associate's Degree | - | - |
| Bachelor's Degree | - | - |
| Graduate Degree | - | - |
| Total | $76,810 | $0 |
Family Income in Auburn
Family Income Brackets in Auburn
According to the Auburn family income data, there are 69 families falling into the $100,000 to $149,999 income range, which is the most common income bracket and makes up 63.3% of all families.
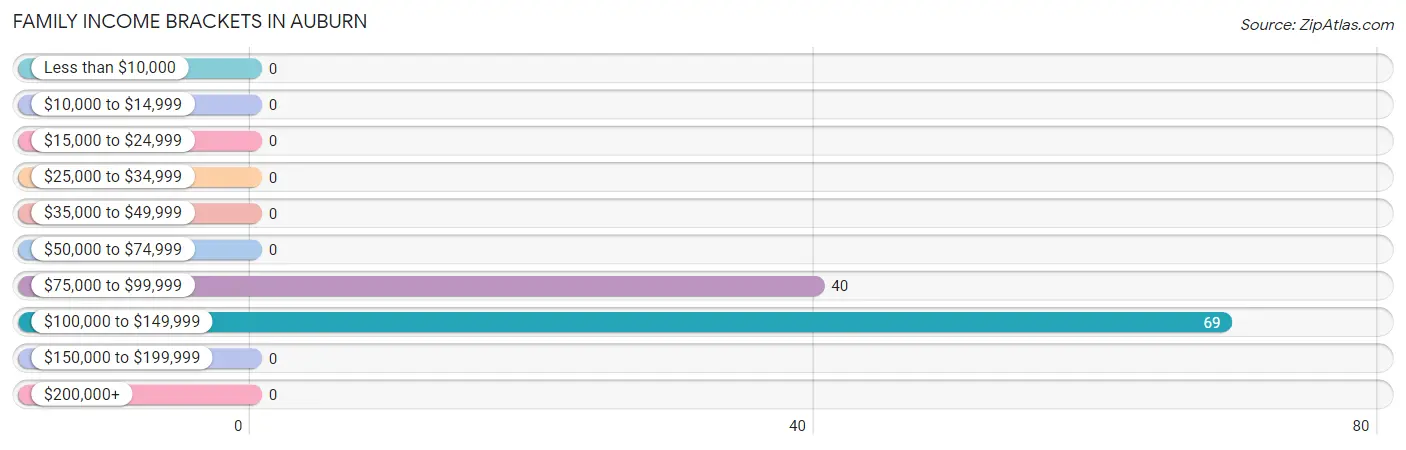
| Income Bracket | # Families | % Families |
| Less than $10,000 | 0 | 0.0% |
| $10,000 to $14,999 | 0 | 0.0% |
| $15,000 to $24,999 | 0 | 0.0% |
| $25,000 to $34,999 | 0 | 0.0% |
| $35,000 to $49,999 | 0 | 0.0% |
| $50,000 to $74,999 | 0 | 0.0% |
| $75,000 to $99,999 | 40 | 36.7% |
| $100,000 to $149,999 | 69 | 63.3% |
| $150,000 to $199,999 | 0 | 0.0% |
| $200,000+ | 0 | 0.0% |
Family Income by Famaliy Size in Auburn
2-person families (51 | 46.8%) account for the highest median family income in Auburn with $109,514 per family, while 2-person families (51 | 46.8%) have the highest median income of $54,757 per family member.
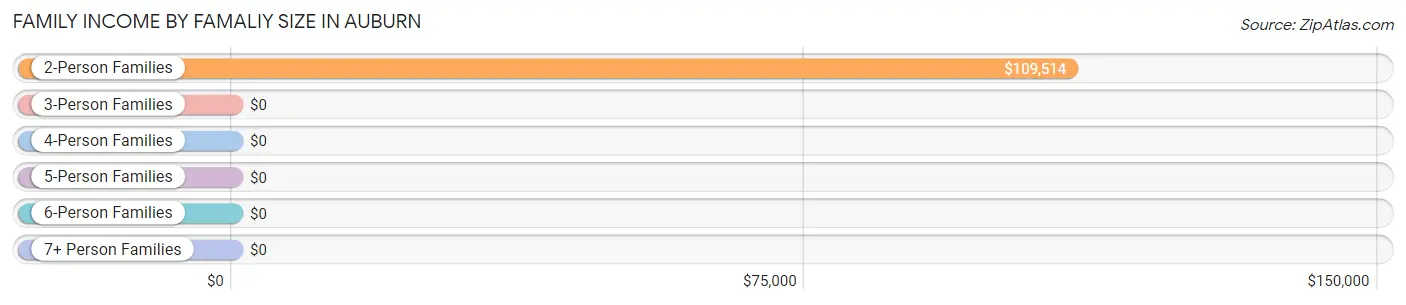
| Income Bracket | # Families | Median Income |
| 2-Person Families | 51 (46.8%) | $109,514 |
| 3-Person Families | 29 (26.6%) | $0 |
| 4-Person Families | 0 (0.0%) | $0 |
| 5-Person Families | 0 (0.0%) | $0 |
| 6-Person Families | 29 (26.6%) | $0 |
| 7+ Person Families | 0 (0.0%) | $0 |
| Total | 109 (100.0%) | $101,250 |
Family Income by Number of Earners in Auburn
| Number of Earners | # Families | Median Income |
| No Earners | 29 (26.6%) | $0 |
| 1 Earner | 29 (26.6%) | $0 |
| 2 Earners | 51 (46.8%) | $0 |
| 3+ Earners | 0 (0.0%) | $0 |
| Total | 109 (100.0%) | $101,250 |
Household Income in Auburn
Household Income Brackets in Auburn
With 69 households falling in the category, the $100,000 to $149,999 income range is the most frequent in Auburn, accounting for 57.5% of all households.
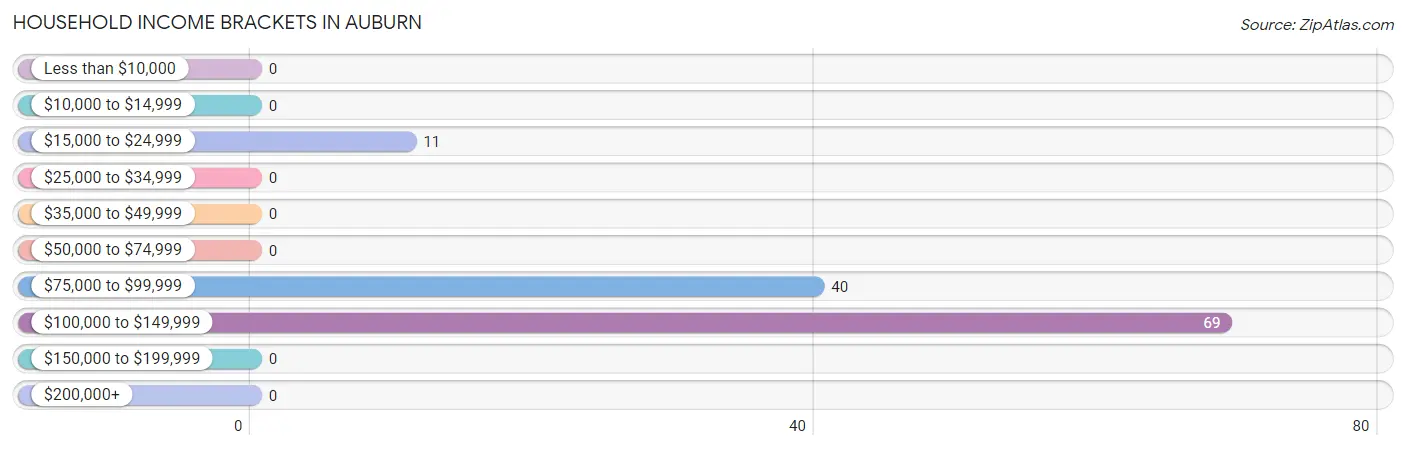
| Income Bracket | # Households | % Households |
| Less than $10,000 | 0 | 0.0% |
| $10,000 to $14,999 | 0 | 0.0% |
| $15,000 to $24,999 | 11 | 9.2% |
| $25,000 to $34,999 | 0 | 0.0% |
| $35,000 to $49,999 | 0 | 0.0% |
| $50,000 to $74,999 | 0 | 0.0% |
| $75,000 to $99,999 | 40 | 33.3% |
| $100,000 to $149,999 | 69 | 57.5% |
| $150,000 to $199,999 | 0 | 0.0% |
| $200,000+ | 0 | 0.0% |
Household Income by Householder Age in Auburn
The median household income in Auburn is $100,776, with the highest median household income of $97,045 found in the 65+ years age bracket for the primary householder. A total of 40 households (33.3%) fall into this category.
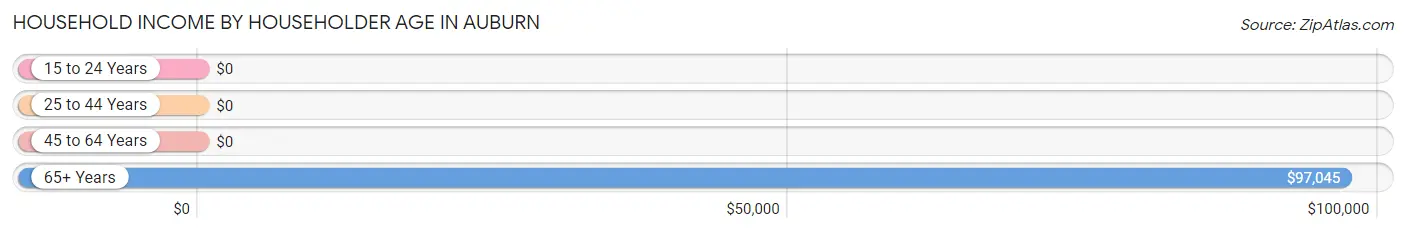
| Income Bracket | # Households | Median Income |
| 15 to 24 Years | 0 (0.0%) | $0 |
| 25 to 44 Years | 58 (48.3%) | $0 |
| 45 to 64 Years | 22 (18.3%) | $0 |
| 65+ Years | 40 (33.3%) | $97,045 |
| Total | 120 (100.0%) | $100,776 |
Poverty in Auburn
Income Below Poverty by Sex and Age in Auburn
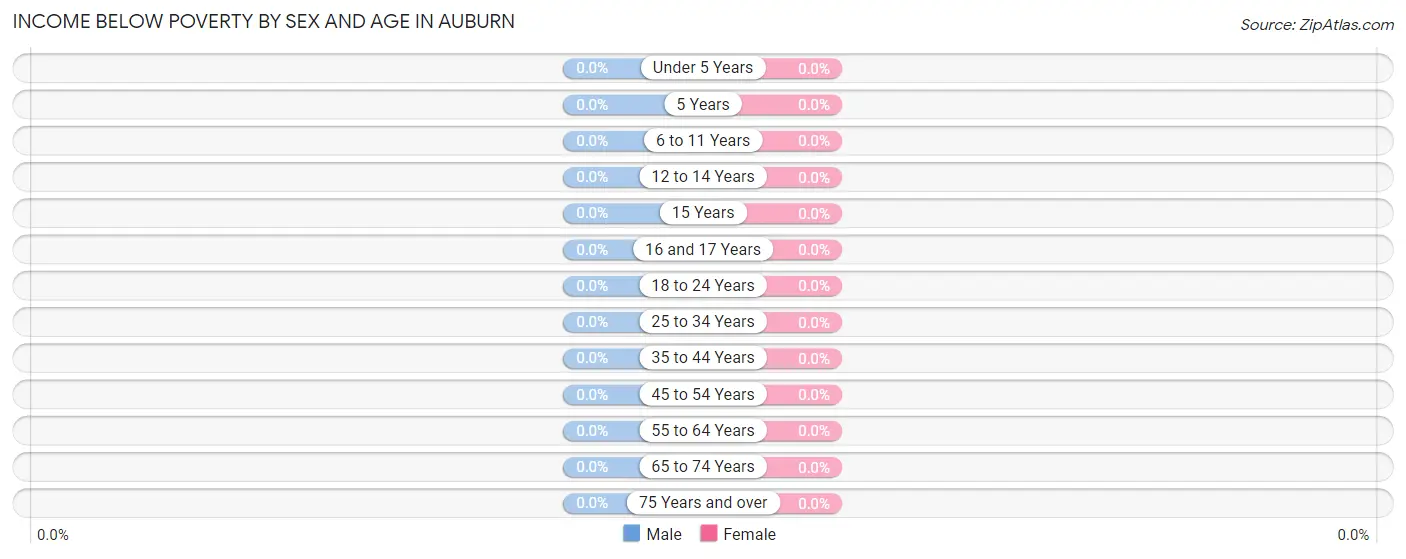
| Age Bracket | Male | Female |
| Under 5 Years | 0 (0.0%) | 0 (0.0%) |
| 5 Years | 0 (0.0%) | 0 (0.0%) |
| 6 to 11 Years | 0 (0.0%) | 0 (0.0%) |
| 12 to 14 Years | 0 (0.0%) | 0 (0.0%) |
| 15 Years | 0 (0.0%) | 0 (0.0%) |
| 16 and 17 Years | 0 (0.0%) | 0 (0.0%) |
| 18 to 24 Years | 0 (0.0%) | 0 (0.0%) |
| 25 to 34 Years | 0 (0.0%) | 0 (0.0%) |
| 35 to 44 Years | 0 (0.0%) | 0 (0.0%) |
| 45 to 54 Years | 0 (0.0%) | 0 (0.0%) |
| 55 to 64 Years | 0 (0.0%) | 0 (0.0%) |
| 65 to 74 Years | 0 (0.0%) | 0 (0.0%) |
| 75 Years and over | 0 (0.0%) | 0 (0.0%) |
| Total | 0 (0.0%) | 0 (0.0%) |
Income Above Poverty by Sex and Age in Auburn
According to the poverty statistics in Auburn, males aged 6 to 11 years and females aged under 5 years are the age groups that are most secure financially, with 100.0% of males and 100.0% of females in these age groups living above the poverty line.
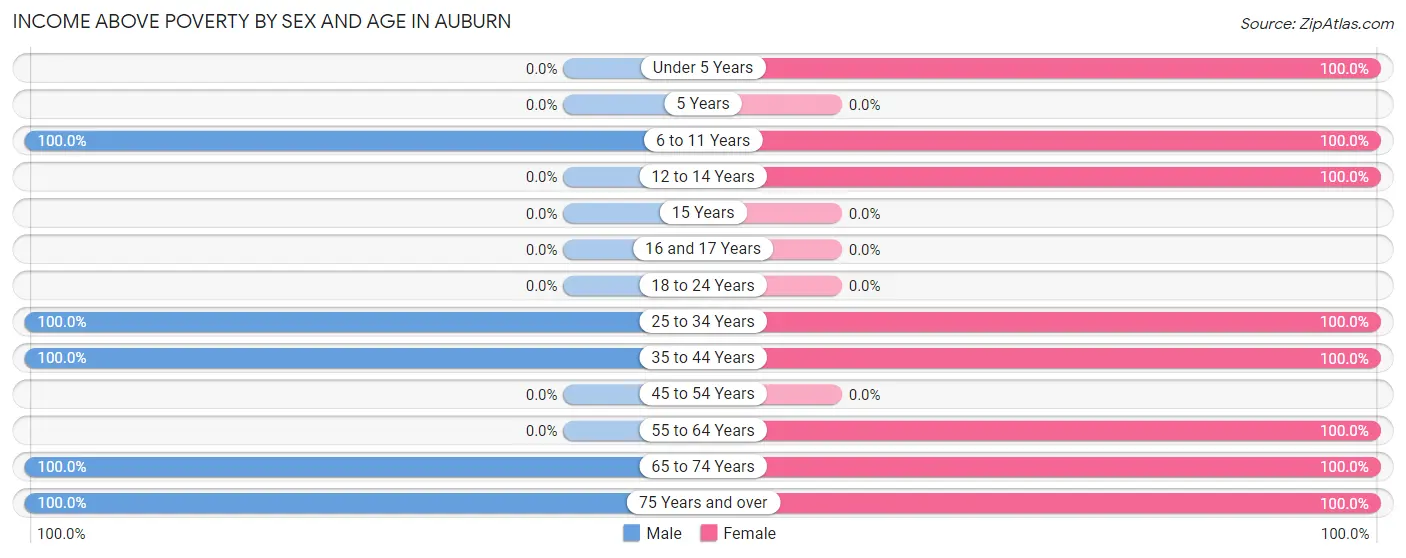
| Age Bracket | Male | Female |
| Under 5 Years | 0 (0.0%) | 30 (100.0%) |
| 5 Years | 0 (0.0%) | 0 (0.0%) |
| 6 to 11 Years | 29 (100.0%) | 58 (100.0%) |
| 12 to 14 Years | 0 (0.0%) | 29 (100.0%) |
| 15 Years | 0 (0.0%) | 0 (0.0%) |
| 16 and 17 Years | 0 (0.0%) | 0 (0.0%) |
| 18 to 24 Years | 0 (0.0%) | 0 (0.0%) |
| 25 to 34 Years | 29 (100.0%) | 21 (100.0%) |
| 35 to 44 Years | 35 (100.0%) | 29 (100.0%) |
| 45 to 54 Years | 0 (0.0%) | 0 (0.0%) |
| 55 to 64 Years | 0 (0.0%) | 22 (100.0%) |
| 65 to 74 Years | 22 (100.0%) | 18 (100.0%) |
| 75 Years and over | 22 (100.0%) | 25 (100.0%) |
| Total | 137 (100.0%) | 232 (100.0%) |
Income Below Poverty Among Married-Couple Families in Auburn
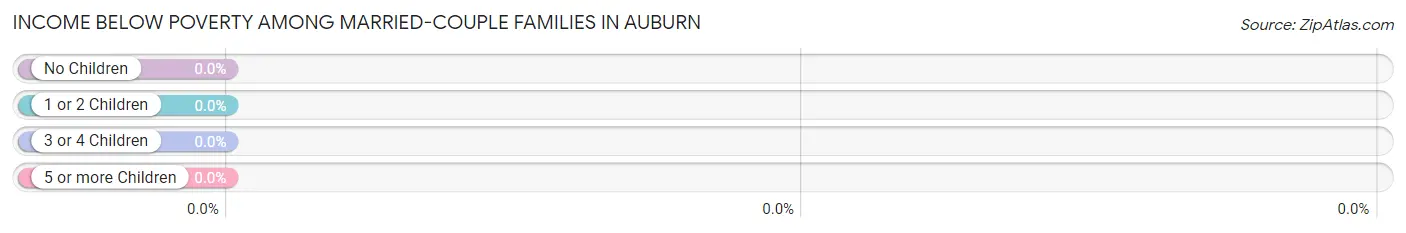
| Children | Above Poverty | Below Poverty |
| No Children | 51 (100.0%) | 0 (0.0%) |
| 1 or 2 Children | 29 (100.0%) | 0 (0.0%) |
| 3 or 4 Children | 29 (100.0%) | 0 (0.0%) |
| 5 or more Children | 0 (0.0%) | 0 (0.0%) |
| Total | 109 (100.0%) | 0 (0.0%) |
Income Below Poverty Among Single-Parent Households in Auburn
| Children | Single Father | Single Mother |
| No Children | 0 (0.0%) | 0 (0.0%) |
| 1 or 2 Children | 0 (0.0%) | 0 (0.0%) |
| 3 or 4 Children | 0 (0.0%) | 0 (0.0%) |
| 5 or more Children | 0 (0.0%) | 0 (0.0%) |
| Total | 0 (0.0%) | 0 (0.0%) |
Income Below Poverty Among Married-Couple vs Single-Parent Households in Auburn
| Children | Married-Couple Families | Single-Parent Households |
| No Children | 0 (0.0%) | 0 (0.0%) |
| 1 or 2 Children | 0 (0.0%) | 0 (0.0%) |
| 3 or 4 Children | 0 (0.0%) | 0 (0.0%) |
| 5 or more Children | 0 (0.0%) | 0 (0.0%) |
| Total | 0 (0.0%) | 0 (0.0%) |
Race in Auburn
The most populous races in Auburn are White / Caucasian (347 | 94.0%), Hispanic or Latino (22 | 6.0%), and Two or more Races (22 | 6.0%).
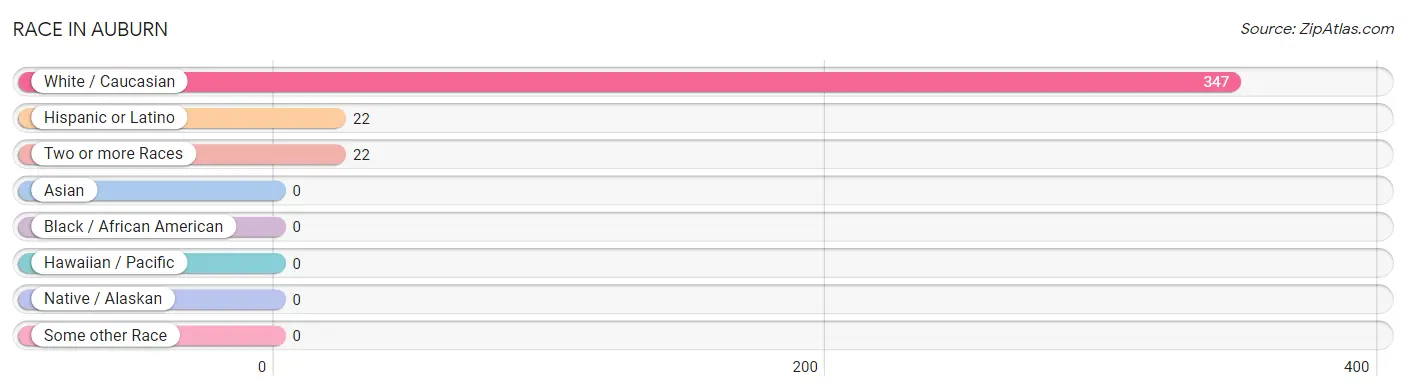
| Race | # Population | % Population |
| Asian | 0 | 0.0% |
| Black / African American | 0 | 0.0% |
| Hawaiian / Pacific | 0 | 0.0% |
| Hispanic or Latino | 22 | 6.0% |
| Native / Alaskan | 0 | 0.0% |
| White / Caucasian | 347 | 94.0% |
| Two or more Races | 22 | 6.0% |
| Some other Race | 0 | 0.0% |
| Total | 369 | 100.0% |
Ancestry in Auburn
The most populous ancestries reported in Auburn are Swedish (25 | 6.8%), English (22 | 6.0%), German (22 | 6.0%), Mexican (22 | 6.0%), and Portuguese (22 | 6.0%), together accounting for 30.6% of all Auburn residents.
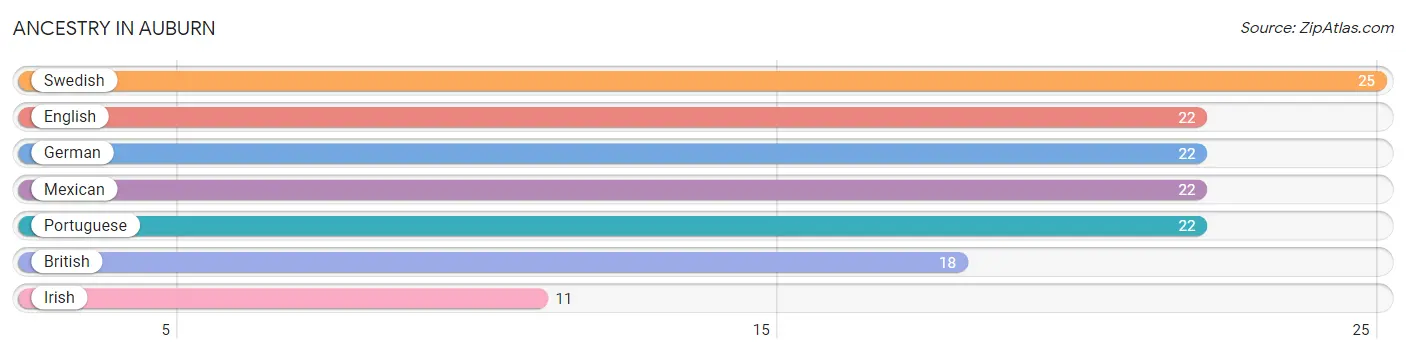
| Ancestry | # Population | % Population |
| British | 18 | 4.9% |
| English | 22 | 6.0% |
| German | 22 | 6.0% |
| Irish | 11 | 3.0% |
| Mexican | 22 | 6.0% |
| Portuguese | 22 | 6.0% |
| Swedish | 25 | 6.8% | View All 7 Rows |
Immigrants in Auburn

| Immigration Origin | # Population | % Population | View All 0 Rows |
Sex and Age in Auburn
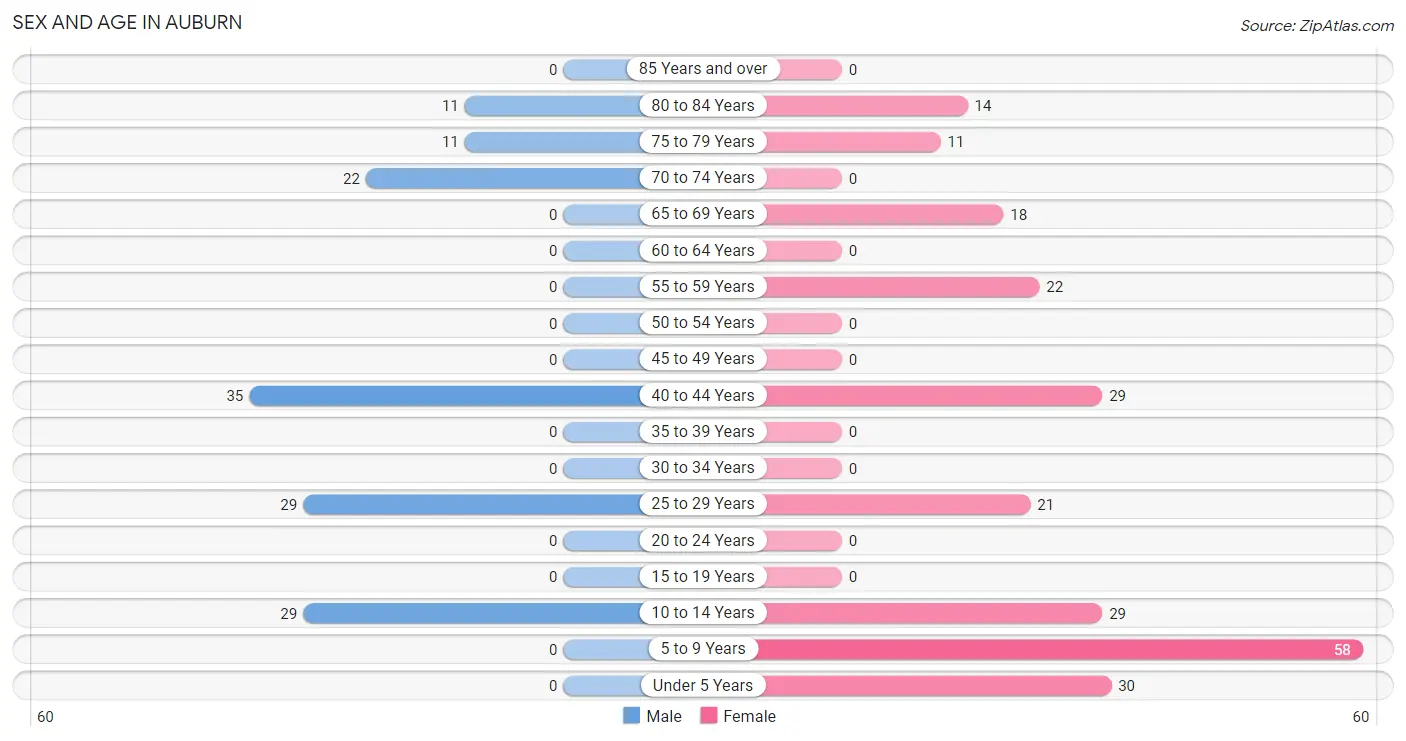
Sex and Age in Auburn
The most populous age groups in Auburn are 40 to 44 Years (35 | 25.6%) for men and 5 to 9 Years (58 | 25.0%) for women.
| Age Bracket | Male | Female |
| Under 5 Years | 0 (0.0%) | 30 (12.9%) |
| 5 to 9 Years | 0 (0.0%) | 58 (25.0%) |
| 10 to 14 Years | 29 (21.2%) | 29 (12.5%) |
| 15 to 19 Years | 0 (0.0%) | 0 (0.0%) |
| 20 to 24 Years | 0 (0.0%) | 0 (0.0%) |
| 25 to 29 Years | 29 (21.2%) | 21 (9.0%) |
| 30 to 34 Years | 0 (0.0%) | 0 (0.0%) |
| 35 to 39 Years | 0 (0.0%) | 0 (0.0%) |
| 40 to 44 Years | 35 (25.6%) | 29 (12.5%) |
| 45 to 49 Years | 0 (0.0%) | 0 (0.0%) |
| 50 to 54 Years | 0 (0.0%) | 0 (0.0%) |
| 55 to 59 Years | 0 (0.0%) | 22 (9.5%) |
| 60 to 64 Years | 0 (0.0%) | 0 (0.0%) |
| 65 to 69 Years | 0 (0.0%) | 18 (7.8%) |
| 70 to 74 Years | 22 (16.1%) | 0 (0.0%) |
| 75 to 79 Years | 11 (8.0%) | 11 (4.7%) |
| 80 to 84 Years | 11 (8.0%) | 14 (6.0%) |
| 85 Years and over | 0 (0.0%) | 0 (0.0%) |
| Total | 137 (100.0%) | 232 (100.0%) |
Families and Households in Auburn
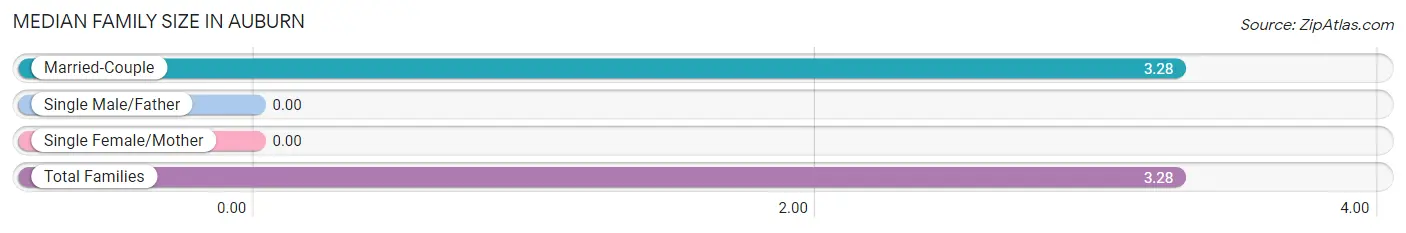
Median Family Size in Auburn
| Family Type | # Families | Family Size |
| Married-Couple | 109 (100.0%) | 3.28 |
| Single Male/Father | 0 (0.0%) | - |
| Single Female/Mother | 0 (0.0%) | - |
| Total Families | 109 (100.0%) | 3.28 |
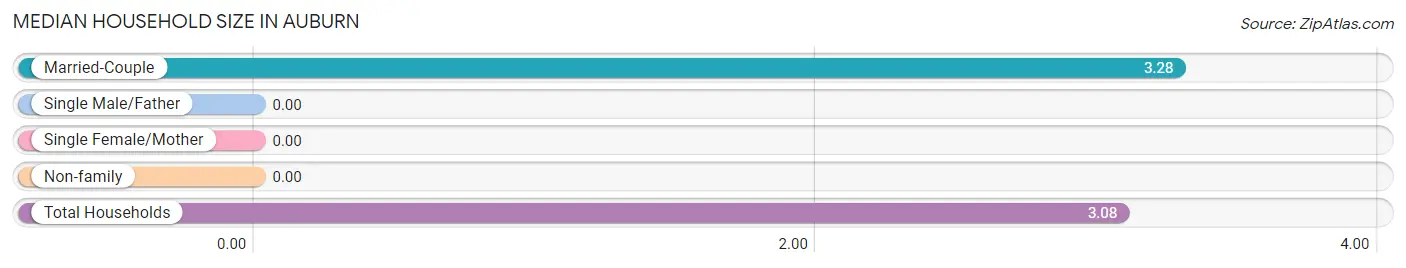
Median Household Size in Auburn
| Household Type | # Households | Household Size |
| Married-Couple | 109 (90.8%) | 3.28 |
| Single Male/Father | 0 (0.0%) | - |
| Single Female/Mother | 0 (0.0%) | - |
| Non-family | 11 (9.2%) | - |
| Total Households | 120 (100.0%) | 3.08 |
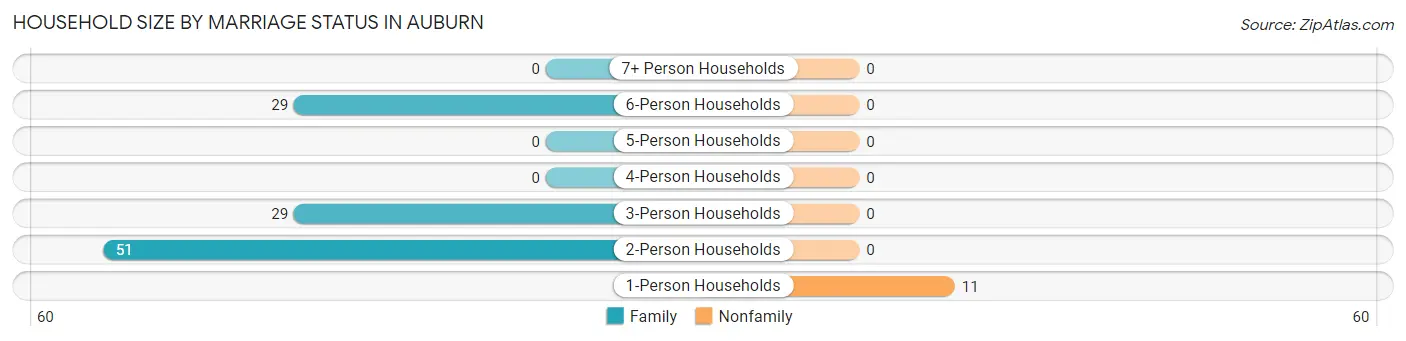
Household Size by Marriage Status in Auburn
Out of a total of 120 households in Auburn, 109 (90.8%) are family households, while 11 (9.2%) are nonfamily households. The most numerous type of family households are 2-person households, comprising 51, and the most common type of nonfamily households are 1-person households, comprising 11.
| Household Size | Family Households | Nonfamily Households |
| 1-Person Households | - | 11 (9.2%) |
| 2-Person Households | 51 (42.5%) | 0 (0.0%) |
| 3-Person Households | 29 (24.2%) | 0 (0.0%) |
| 4-Person Households | 0 (0.0%) | 0 (0.0%) |
| 5-Person Households | 0 (0.0%) | 0 (0.0%) |
| 6-Person Households | 29 (24.2%) | 0 (0.0%) |
| 7+ Person Households | 0 (0.0%) | 0 (0.0%) |
| Total | 109 (90.8%) | 11 (9.2%) |
Female Fertility in Auburn
Fertility by Age in Auburn
Average fertility rate in Auburn is 420.0 births per 1,000 women. Women in the age bracket of 20 to 34 years have the highest fertility rate with 1,000.0 births per 1,000 women. Women in the age bracket of 20 to 34 years acount for 100.0% of all women with births.
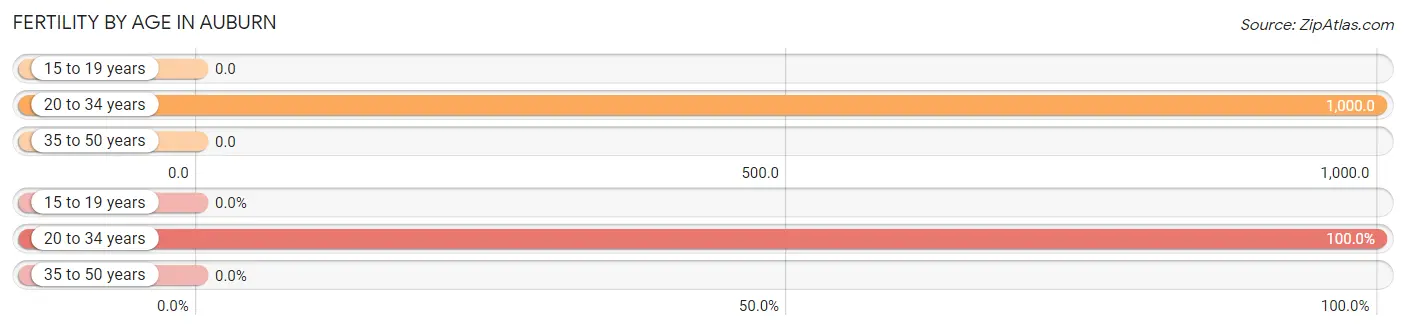
| Age Bracket | Women with Births | Births / 1,000 Women |
| 15 to 19 years | 0 (0.0%) | 0.0 |
| 20 to 34 years | 21 (100.0%) | 1,000.0 |
| 35 to 50 years | 0 (0.0%) | 0.0 |
| Total | 21 (100.0%) | 420.0 |
Fertility by Age by Marriage Status in Auburn
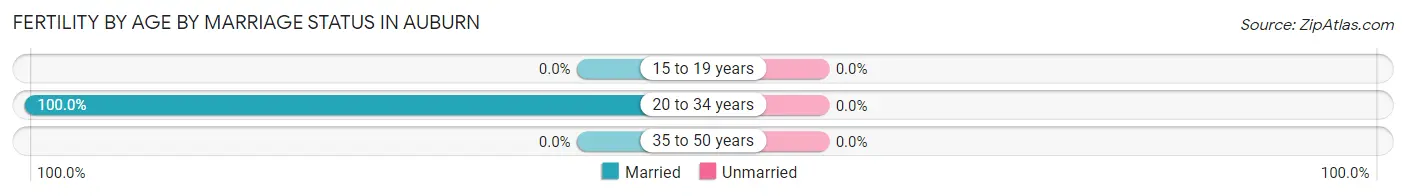
| Age Bracket | Married | Unmarried |
| 15 to 19 years | 0 (0.0%) | 0 (0.0%) |
| 20 to 34 years | 21 (100.0%) | 0 (0.0%) |
| 35 to 50 years | 0 (0.0%) | 0 (0.0%) |
| Total | 21 (100.0%) | 0 (0.0%) |
Fertility by Education in Auburn
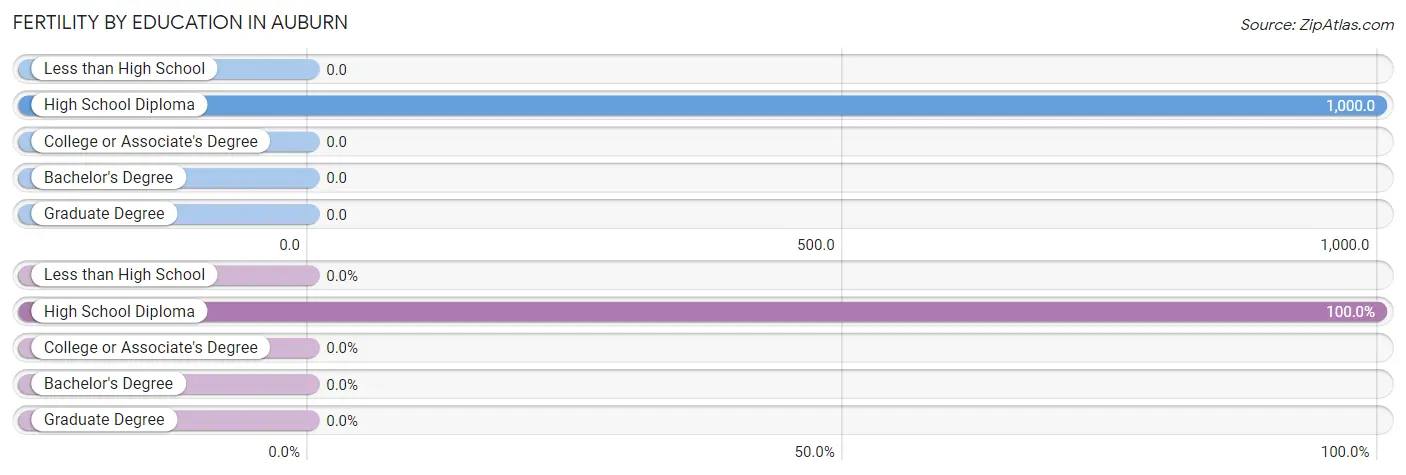
| Educational Attainment | Women with Births | Births / 1,000 Women |
| Less than High School | 0 (0.0%) | 0.0 |
| High School Diploma | 21 (100.0%) | 1,000.0 |
| College or Associate's Degree | 0 (0.0%) | 0.0 |
| Bachelor's Degree | 0 (0.0%) | 0.0 |
| Graduate Degree | 0 (0.0%) | 0.0 |
| Total | 21 (100.0%) | 420.0 |
Fertility by Education by Marriage Status in Auburn
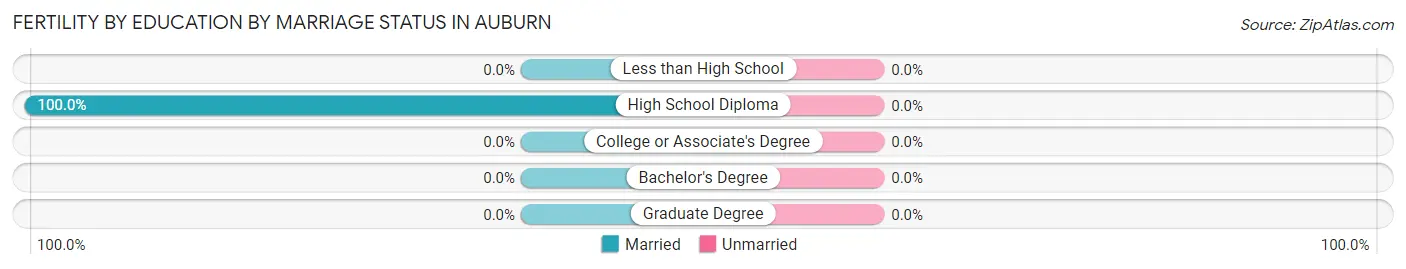
| Educational Attainment | Married | Unmarried |
| Less than High School | 0 (0.0%) | 0 (0.0%) |
| High School Diploma | 21 (100.0%) | 0 (0.0%) |
| College or Associate's Degree | 0 (0.0%) | 0 (0.0%) |
| Bachelor's Degree | 0 (0.0%) | 0 (0.0%) |
| Graduate Degree | 0 (0.0%) | 0 (0.0%) |
| Total | 21 (100.0%) | 0 (0.0%) |
Employment Characteristics in Auburn
Employment by Class of Employer in Auburn
Among the 86 employed individuals in Auburn, , and private company employees (86 | 100.0%) make up the most common classes of employment.
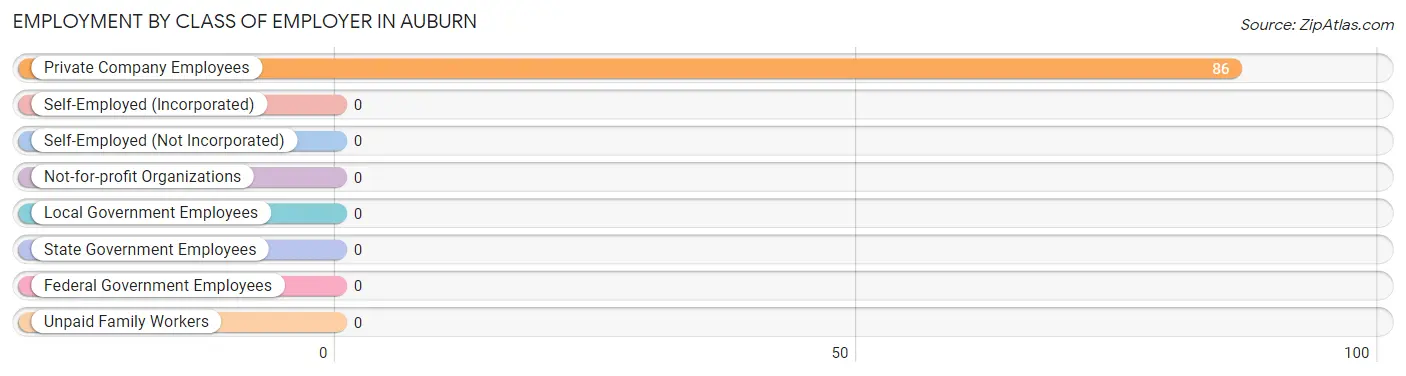
| Employer Class | # Employees | % Employees |
| Private Company Employees | 86 | 100.0% |
| Self-Employed (Incorporated) | 0 | 0.0% |
| Self-Employed (Not Incorporated) | 0 | 0.0% |
| Not-for-profit Organizations | 0 | 0.0% |
| Local Government Employees | 0 | 0.0% |
| State Government Employees | 0 | 0.0% |
| Federal Government Employees | 0 | 0.0% |
| Unpaid Family Workers | 0 | 0.0% |
| Total | 86 | 100.0% |
Employment Status by Age in Auburn
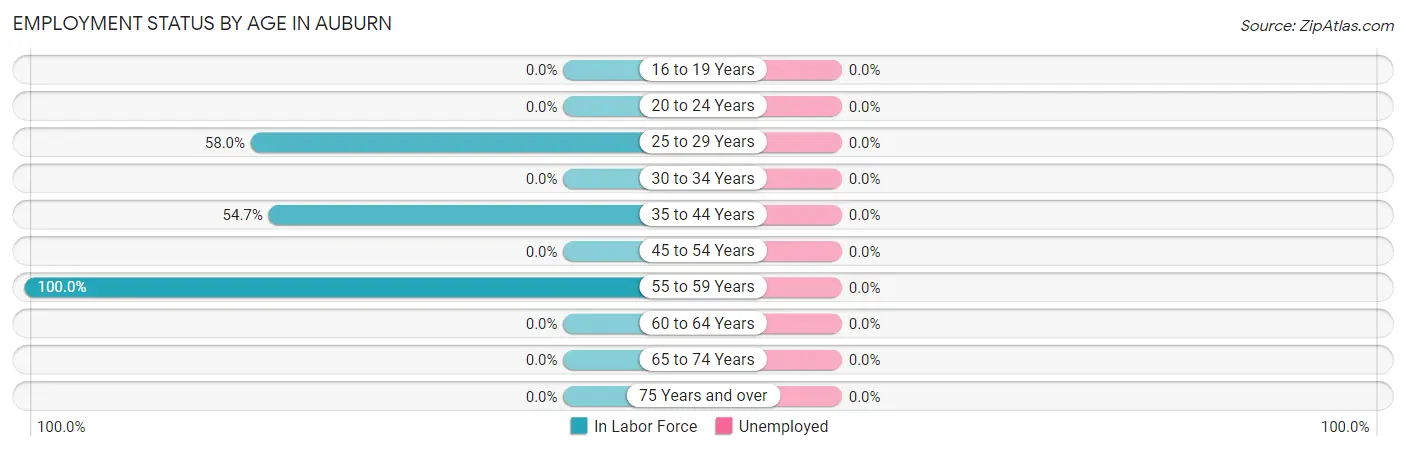
| Age Bracket | In Labor Force | Unemployed |
| 16 to 19 Years | 0 (0.0%) | 0 (0.0%) |
| 20 to 24 Years | 0 (0.0%) | 0 (0.0%) |
| 25 to 29 Years | 29 (58.0%) | 0 (0.0%) |
| 30 to 34 Years | 0 (0.0%) | 0 (0.0%) |
| 35 to 44 Years | 35 (54.7%) | 0 (0.0%) |
| 45 to 54 Years | 0 (0.0%) | 0 (0.0%) |
| 55 to 59 Years | 22 (100.0%) | 0 (0.0%) |
| 60 to 64 Years | 0 (0.0%) | 0 (0.0%) |
| 65 to 74 Years | 0 (0.0%) | 0 (0.0%) |
| 75 Years and over | 0 (0.0%) | 0 (0.0%) |
| Total | 86 (38.6%) | 0 (0.0%) |
Employment Status by Educational Attainment in Auburn
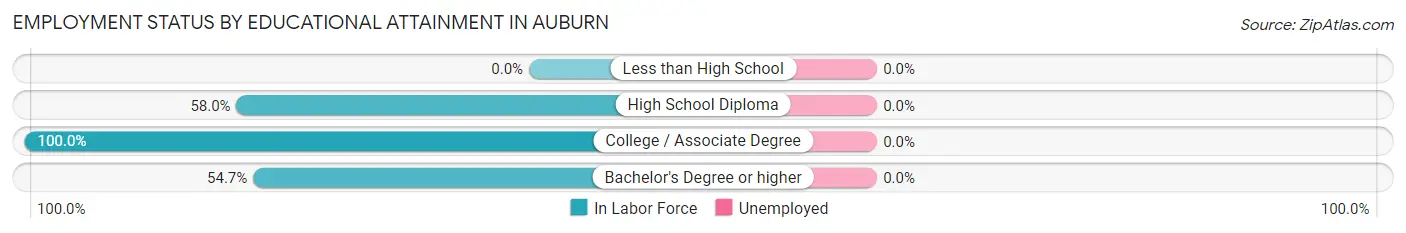
| Educational Attainment | In Labor Force | Unemployed |
| Less than High School | 0 (0.0%) | 0 (0.0%) |
| High School Diploma | 29 (58.0%) | 0 (0.0%) |
| College / Associate Degree | 22 (100.0%) | 0 (0.0%) |
| Bachelor's Degree or higher | 35 (54.7%) | 0 (0.0%) |
| Total | 86 (63.2%) | 0 (0.0%) |
Employment Occupations by Sex in Auburn
Management, Business, Science and Arts Occupations
The most common Management, Business, Science and Arts occupations in Auburn are Computers, Engineering & Science (35 | 40.7%), and Architecture & Engineering (35 | 40.7%).
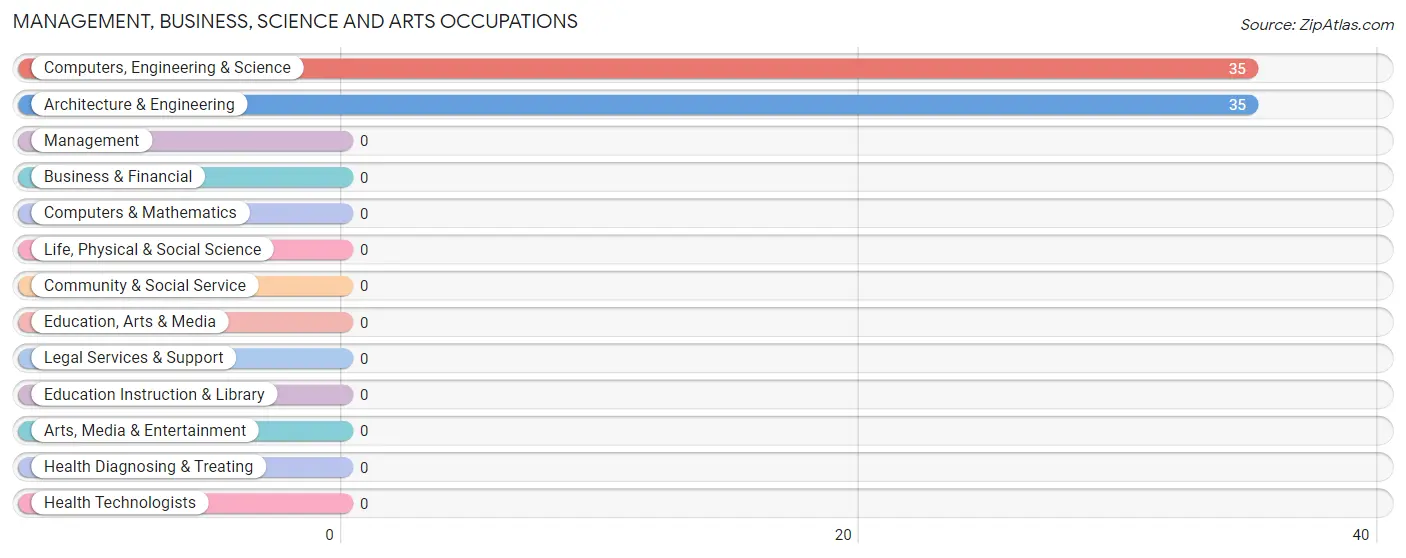
Management, Business, Science and Arts Occupations by Sex
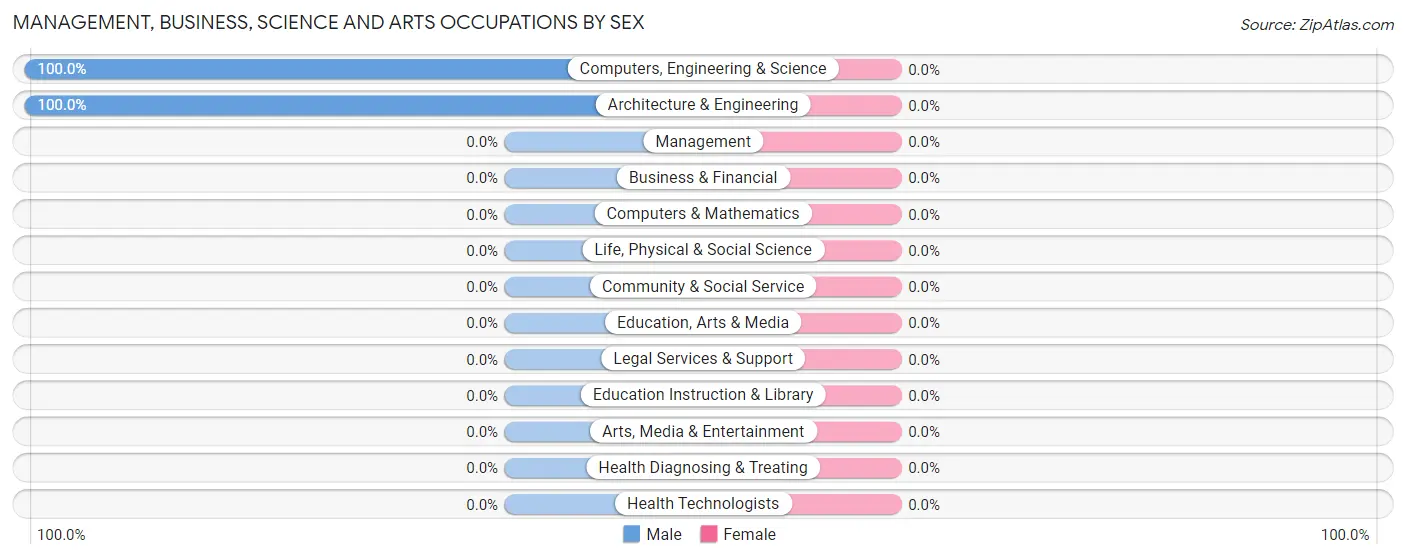
| Occupation | Male | Female |
| Management | 0 (0.0%) | 0 (0.0%) |
| Business & Financial | 0 (0.0%) | 0 (0.0%) |
| Computers, Engineering & Science | 35 (100.0%) | 0 (0.0%) |
| Computers & Mathematics | 0 (0.0%) | 0 (0.0%) |
| Architecture & Engineering | 35 (100.0%) | 0 (0.0%) |
| Life, Physical & Social Science | 0 (0.0%) | 0 (0.0%) |
| Community & Social Service | 0 (0.0%) | 0 (0.0%) |
| Education, Arts & Media | 0 (0.0%) | 0 (0.0%) |
| Legal Services & Support | 0 (0.0%) | 0 (0.0%) |
| Education Instruction & Library | 0 (0.0%) | 0 (0.0%) |
| Arts, Media & Entertainment | 0 (0.0%) | 0 (0.0%) |
| Health Diagnosing & Treating | 0 (0.0%) | 0 (0.0%) |
| Health Technologists | 0 (0.0%) | 0 (0.0%) |
| Total (Category) | 35 (100.0%) | 0 (0.0%) |
| Total (Overall) | 64 (74.4%) | 22 (25.6%) |
Services Occupations
Services Occupations by Sex
| Occupation | Male | Female |
| Healthcare Support | 0 (0.0%) | 0 (0.0%) |
| Security & Protection | 0 (0.0%) | 0 (0.0%) |
| Firefighting & Prevention | 0 (0.0%) | 0 (0.0%) |
| Law Enforcement | 0 (0.0%) | 0 (0.0%) |
| Food Preparation & Serving | 0 (0.0%) | 0 (0.0%) |
| Cleaning & Maintenance | 0 (0.0%) | 0 (0.0%) |
| Personal Care & Service | 0 (0.0%) | 0 (0.0%) |
| Total (Category) | 0 (0.0%) | 0 (0.0%) |
| Total (Overall) | 64 (74.4%) | 22 (25.6%) |
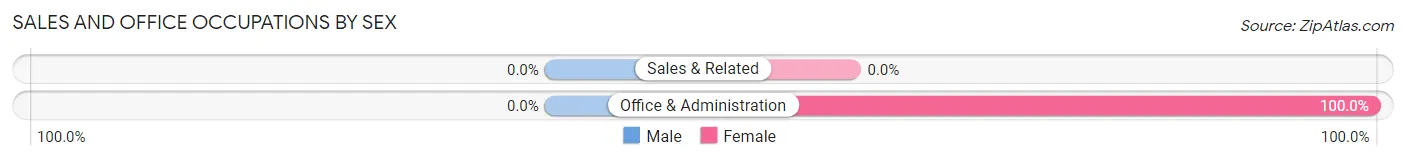
Sales and Office Occupations
The most common Sales and Office occupations in Auburn are , and Office & Administration (22 | 25.6%).
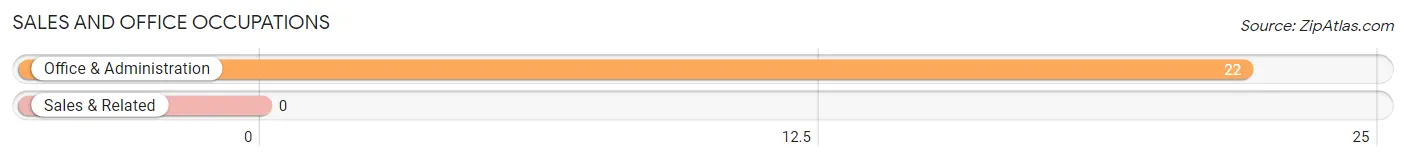
Sales and Office Occupations by Sex
| Occupation | Male | Female |
| Sales & Related | 0 (0.0%) | 0 (0.0%) |
| Office & Administration | 0 (0.0%) | 22 (100.0%) |
| Total (Category) | 0 (0.0%) | 22 (100.0%) |
| Total (Overall) | 64 (74.4%) | 22 (25.6%) |
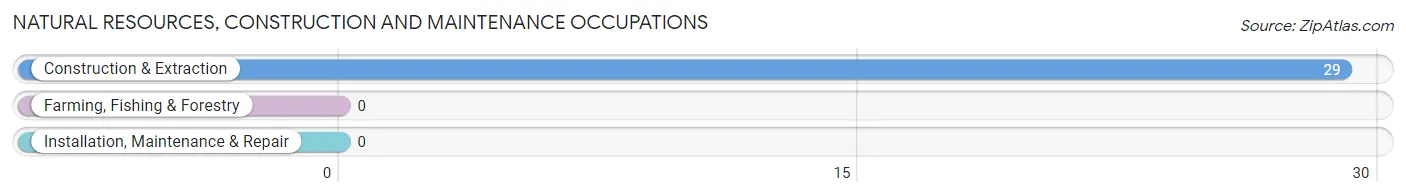
Natural Resources, Construction and Maintenance Occupations
The most common Natural Resources, Construction and Maintenance occupations in Auburn are , and Construction & Extraction (29 | 33.7%).
Natural Resources, Construction and Maintenance Occupations by Sex
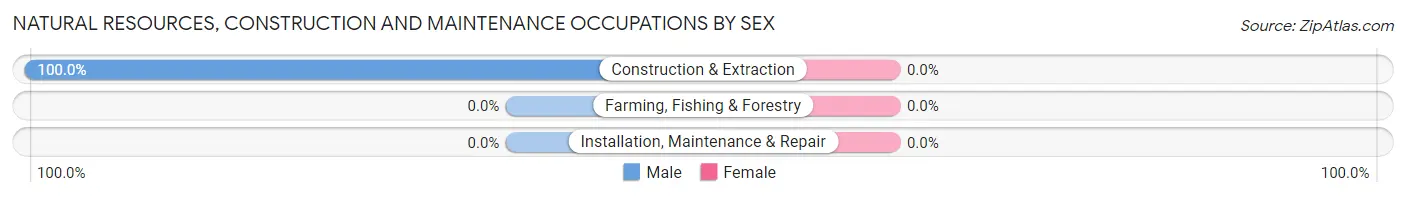
| Occupation | Male | Female |
| Farming, Fishing & Forestry | 0 (0.0%) | 0 (0.0%) |
| Construction & Extraction | 29 (100.0%) | 0 (0.0%) |
| Installation, Maintenance & Repair | 0 (0.0%) | 0 (0.0%) |
| Total (Category) | 29 (100.0%) | 0 (0.0%) |
| Total (Overall) | 64 (74.4%) | 22 (25.6%) |
Production, Transportation and Moving Occupations

Production, Transportation and Moving Occupations by Sex
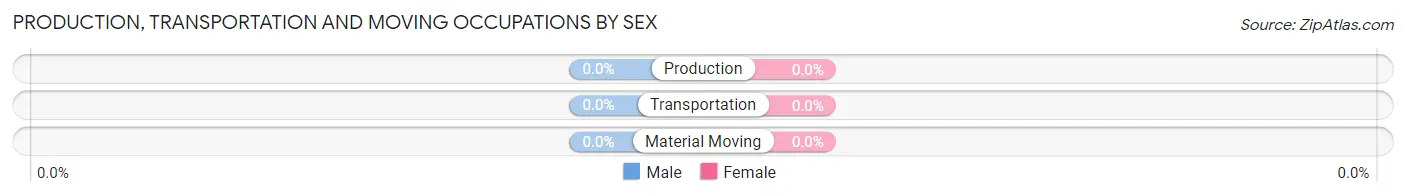
| Occupation | Male | Female |
| Production | 0 (0.0%) | 0 (0.0%) |
| Transportation | 0 (0.0%) | 0 (0.0%) |
| Material Moving | 0 (0.0%) | 0 (0.0%) |
| Total (Category) | 0 (0.0%) | 0 (0.0%) |
| Total (Overall) | 64 (74.4%) | 22 (25.6%) |
Employment Industries by Sex in Auburn
Employment Industries in Auburn
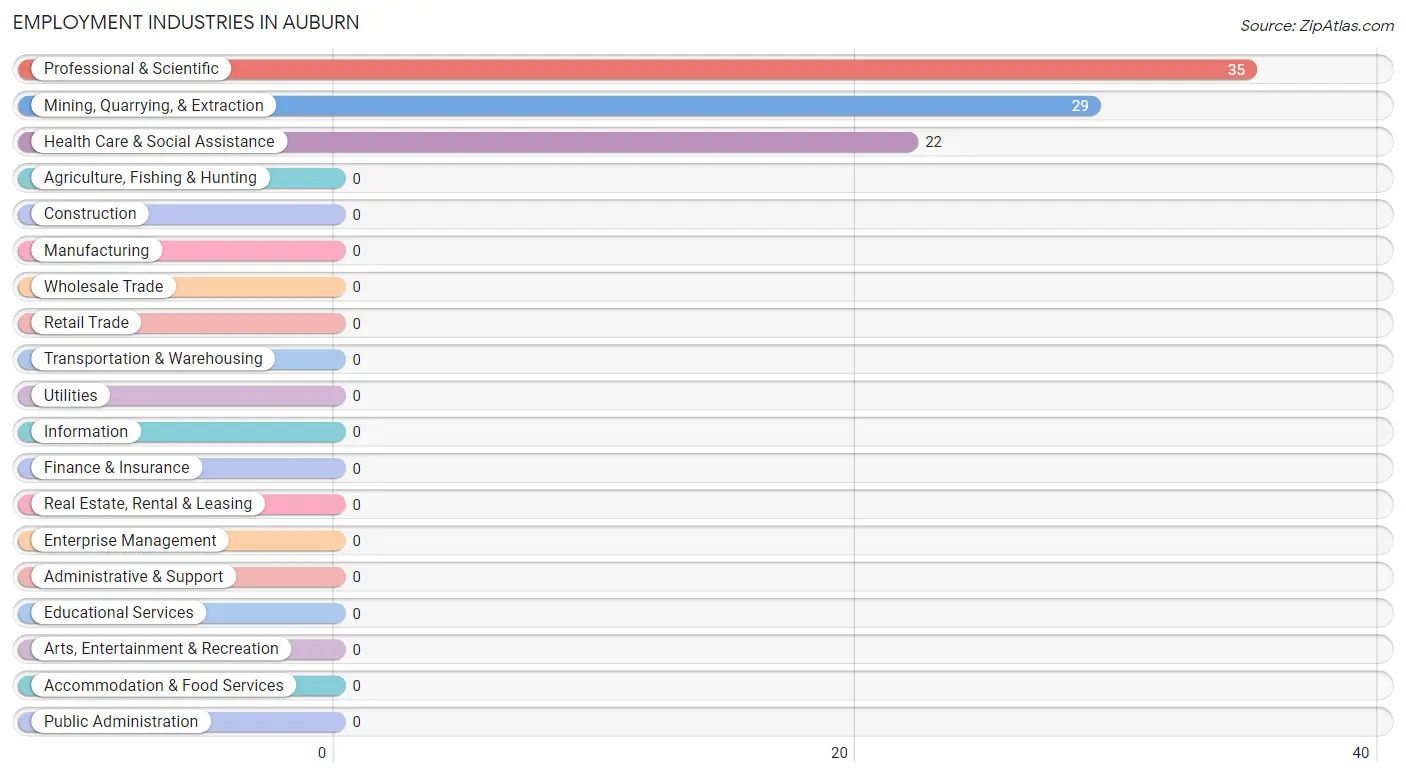
The major employment industries in Auburn include Professional & Scientific (35 | 40.7%), Mining, Quarrying, & Extraction (29 | 33.7%), and Health Care & Social Assistance (22 | 25.6%).
Employment Industries by Sex in Auburn
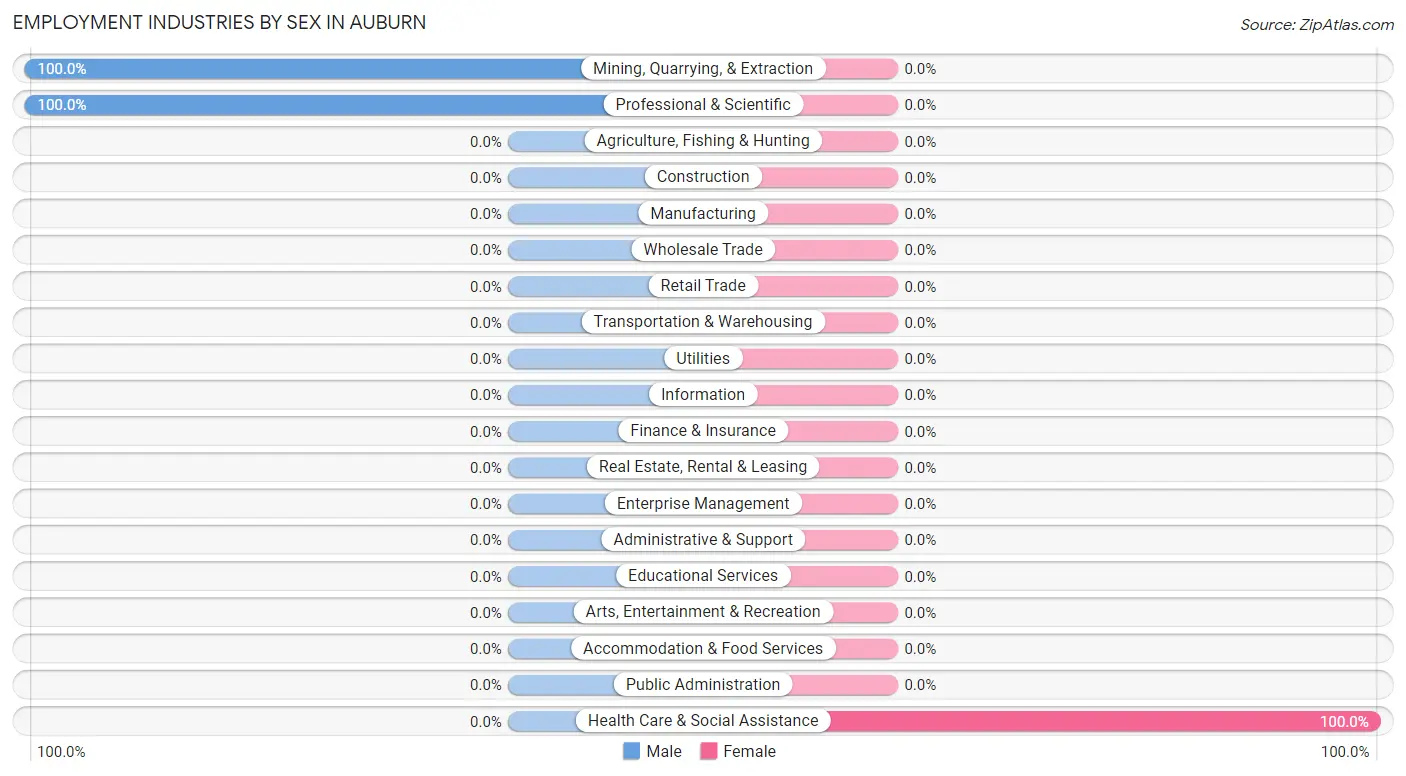
| Industry | Male | Female |
| Agriculture, Fishing & Hunting | 0 (0.0%) | 0 (0.0%) |
| Mining, Quarrying, & Extraction | 29 (100.0%) | 0 (0.0%) |
| Construction | 0 (0.0%) | 0 (0.0%) |
| Manufacturing | 0 (0.0%) | 0 (0.0%) |
| Wholesale Trade | 0 (0.0%) | 0 (0.0%) |
| Retail Trade | 0 (0.0%) | 0 (0.0%) |
| Transportation & Warehousing | 0 (0.0%) | 0 (0.0%) |
| Utilities | 0 (0.0%) | 0 (0.0%) |
| Information | 0 (0.0%) | 0 (0.0%) |
| Finance & Insurance | 0 (0.0%) | 0 (0.0%) |
| Real Estate, Rental & Leasing | 0 (0.0%) | 0 (0.0%) |
| Professional & Scientific | 35 (100.0%) | 0 (0.0%) |
| Enterprise Management | 0 (0.0%) | 0 (0.0%) |
| Administrative & Support | 0 (0.0%) | 0 (0.0%) |
| Educational Services | 0 (0.0%) | 0 (0.0%) |
| Health Care & Social Assistance | 0 (0.0%) | 22 (100.0%) |
| Arts, Entertainment & Recreation | 0 (0.0%) | 0 (0.0%) |
| Accommodation & Food Services | 0 (0.0%) | 0 (0.0%) |
| Public Administration | 0 (0.0%) | 0 (0.0%) |
| Total | 64 (74.4%) | 22 (25.6%) |
Education in Auburn
School Enrollment in Auburn
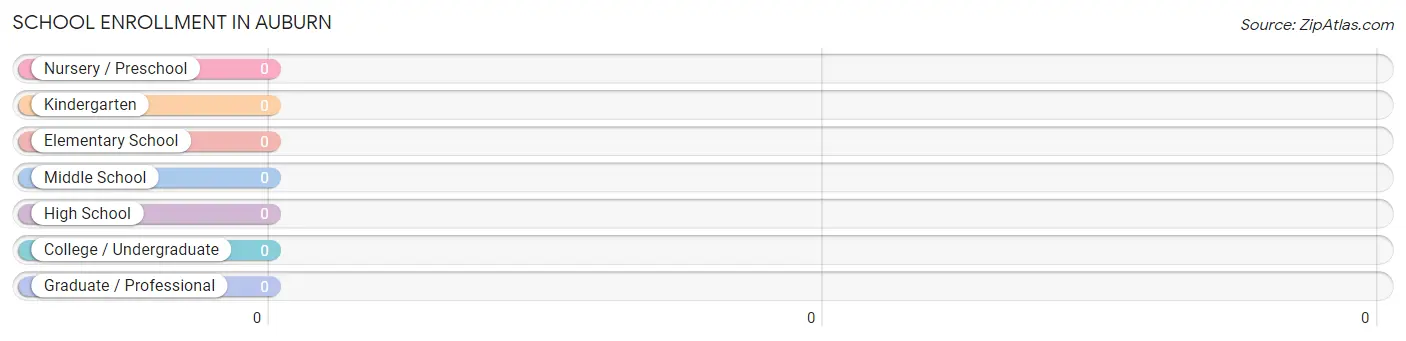
| School Level | # Students | % Students |
| Nursery / Preschool | 0 | 0.0% |
| Kindergarten | 0 | 0.0% |
| Elementary School | 0 | 0.0% |
| Middle School | 0 | 0.0% |
| High School | 0 | 0.0% |
| College / Undergraduate | 0 | 0.0% |
| Graduate / Professional | 0 | 0.0% |
| Total | 0 | 0.0% |
School Enrollment by Age by Funding Source in Auburn
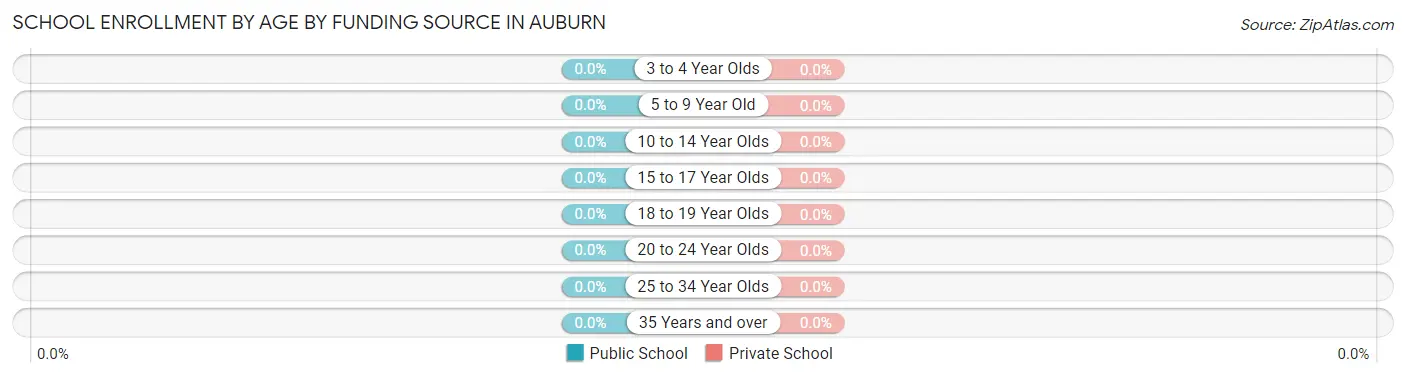
| Age Bracket | Public School | Private School |
| 3 to 4 Year Olds | 0 (0.0%) | 0 (0.0%) |
| 5 to 9 Year Old | 0 (0.0%) | 0 (0.0%) |
| 10 to 14 Year Olds | 0 (0.0%) | 0 (0.0%) |
| 15 to 17 Year Olds | 0 (0.0%) | 0 (0.0%) |
| 18 to 19 Year Olds | 0 (0.0%) | 0 (0.0%) |
| 20 to 24 Year Olds | 0 (0.0%) | 0 (0.0%) |
| 25 to 34 Year Olds | 0 (0.0%) | 0 (0.0%) |
| 35 Years and over | 0 (0.0%) | 0 (0.0%) |
| Total | 0 (0.0%) | 0 (0.0%) |
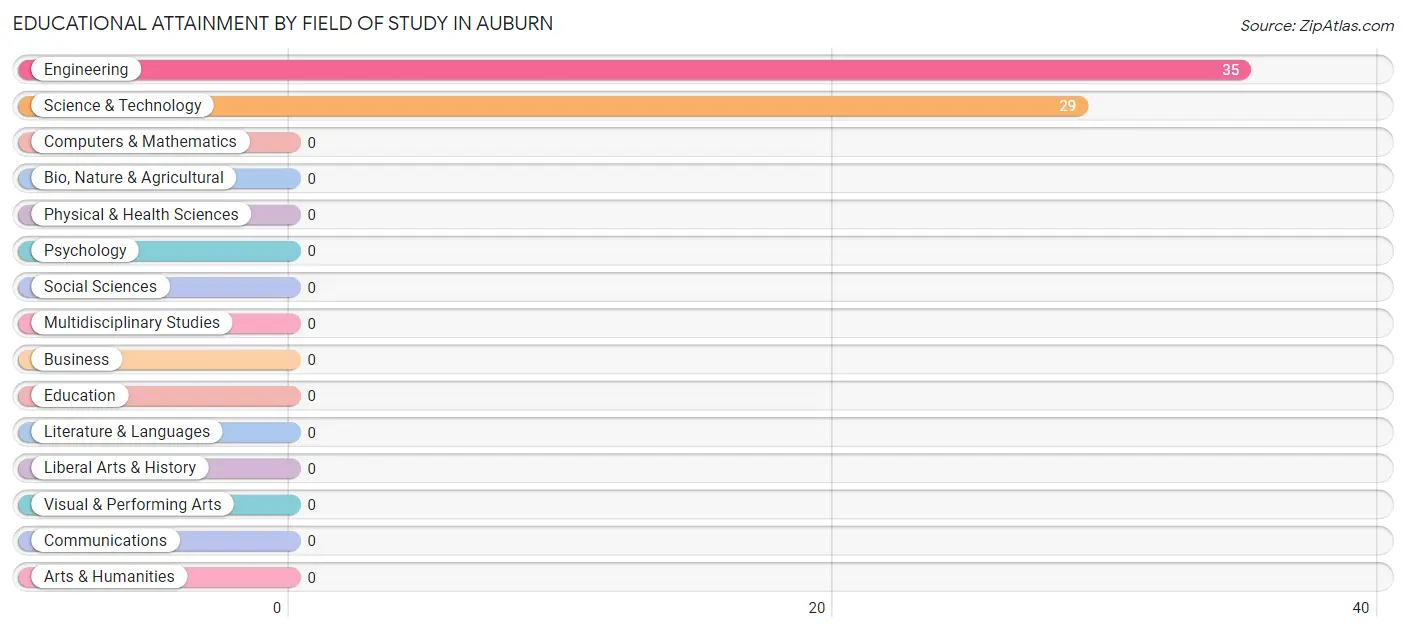
Educational Attainment by Field of Study in Auburn
Engineering (35 | 54.7%), and science & technology (29 | 45.3%) are the most common fields of study among 64 individuals in Auburn who have obtained a bachelor's degree or higher.
| Field of Study | # Graduates | % Graduates |
| Computers & Mathematics | 0 | 0.0% |
| Bio, Nature & Agricultural | 0 | 0.0% |
| Physical & Health Sciences | 0 | 0.0% |
| Psychology | 0 | 0.0% |
| Social Sciences | 0 | 0.0% |
| Engineering | 35 | 54.7% |
| Multidisciplinary Studies | 0 | 0.0% |
| Science & Technology | 29 | 45.3% |
| Business | 0 | 0.0% |
| Education | 0 | 0.0% |
| Literature & Languages | 0 | 0.0% |
| Liberal Arts & History | 0 | 0.0% |
| Visual & Performing Arts | 0 | 0.0% |
| Communications | 0 | 0.0% |
| Arts & Humanities | 0 | 0.0% |
| Total | 64 | 100.0% |
Transportation & Commute in Auburn
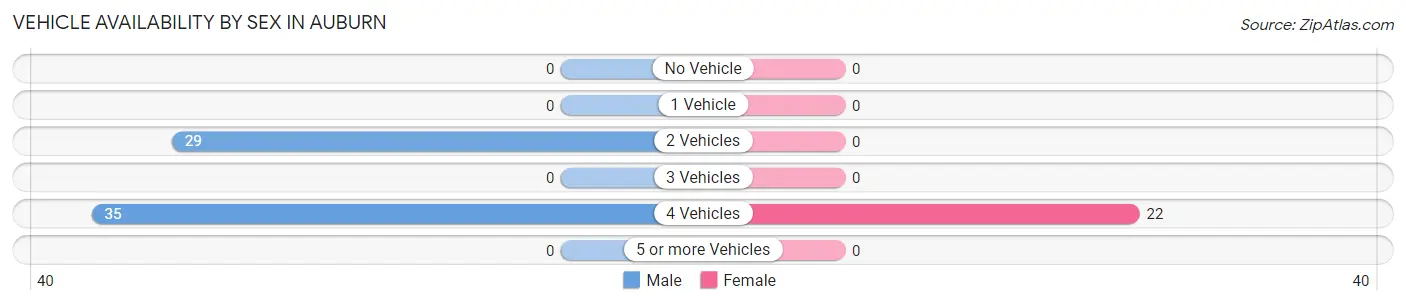
Vehicle Availability by Sex in Auburn
The most prevalent vehicle ownership categories in Auburn are males with 4 vehicles (35, accounting for 54.7%) and females with 4 vehicles (22, making up 159.1%).
| Vehicles Available | Male | Female |
| No Vehicle | 0 (0.0%) | 0 (0.0%) |
| 1 Vehicle | 0 (0.0%) | 0 (0.0%) |
| 2 Vehicles | 29 (45.3%) | 0 (0.0%) |
| 3 Vehicles | 0 (0.0%) | 0 (0.0%) |
| 4 Vehicles | 35 (54.7%) | 22 (100.0%) |
| 5 or more Vehicles | 0 (0.0%) | 0 (0.0%) |
| Total | 64 (100.0%) | 22 (100.0%) |
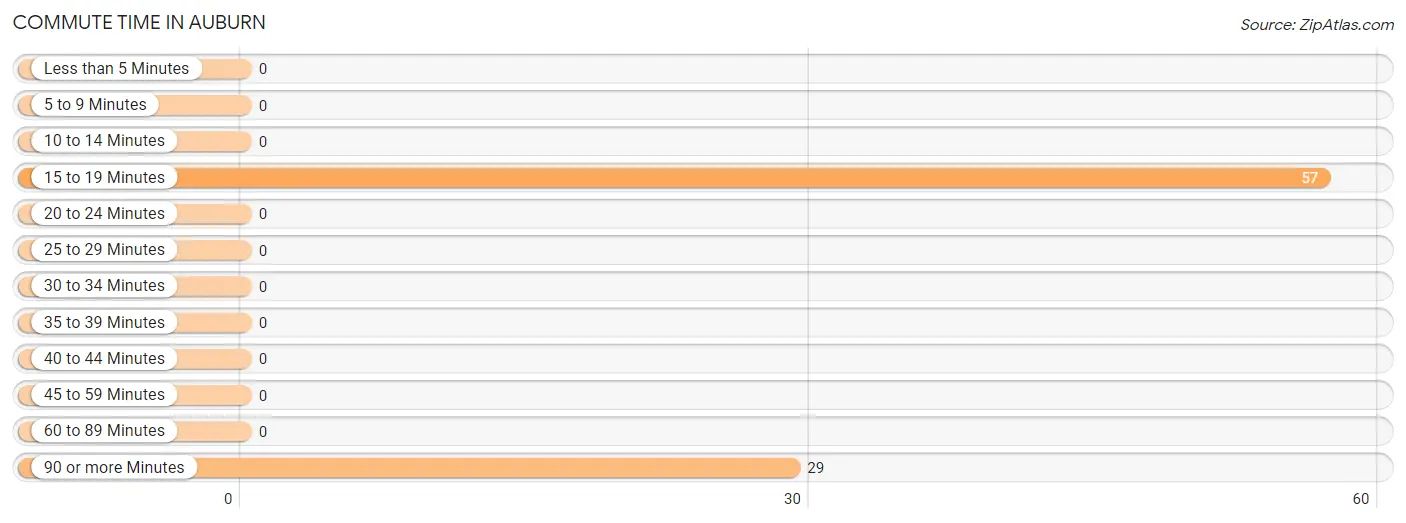
Commute Time in Auburn
The most frequently occuring commute durations in Auburn are 15 to 19 minutes (57 commuters, 66.3%), 90 or more minutes (29 commuters, 33.7%), and less than 5 minutes (0 commuters, 0.0%).
| Commute Time | # Commuters | % Commuters |
| Less than 5 Minutes | 0 | 0.0% |
| 5 to 9 Minutes | 0 | 0.0% |
| 10 to 14 Minutes | 0 | 0.0% |
| 15 to 19 Minutes | 57 | 66.3% |
| 20 to 24 Minutes | 0 | 0.0% |
| 25 to 29 Minutes | 0 | 0.0% |
| 30 to 34 Minutes | 0 | 0.0% |
| 35 to 39 Minutes | 0 | 0.0% |
| 40 to 44 Minutes | 0 | 0.0% |
| 45 to 59 Minutes | 0 | 0.0% |
| 60 to 89 Minutes | 0 | 0.0% |
| 90 or more Minutes | 29 | 33.7% |
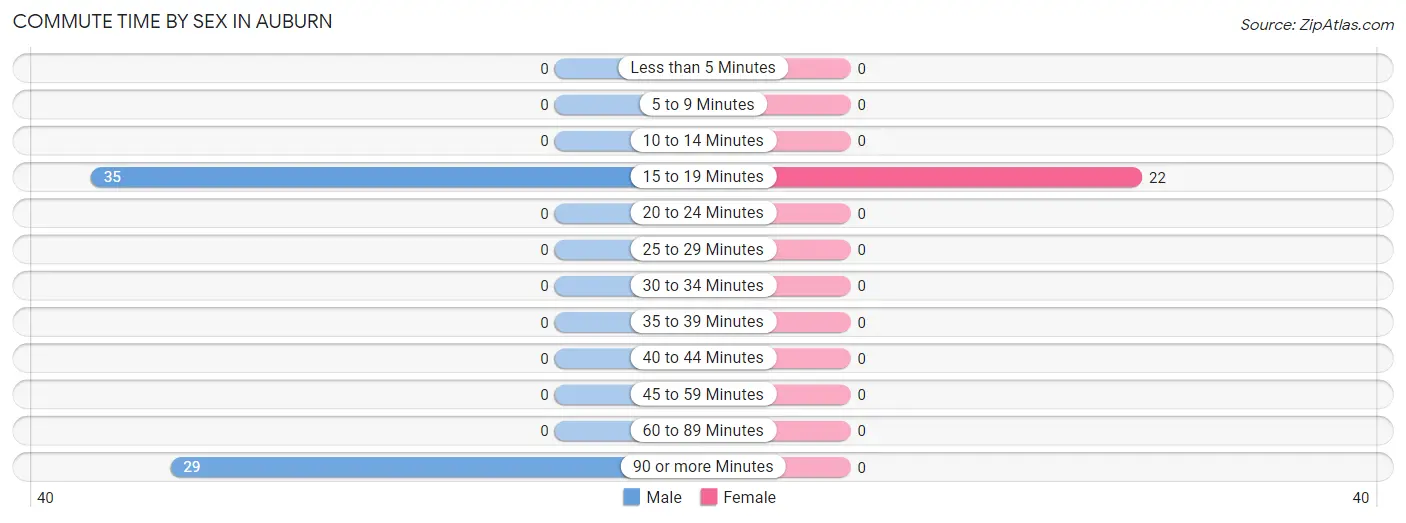
Commute Time by Sex in Auburn
The most common commute times in Auburn are 15 to 19 minutes (35 commuters, 54.7%) for males and 15 to 19 minutes (22 commuters, 100.0%) for females.
| Commute Time | Male | Female |
| Less than 5 Minutes | 0 (0.0%) | 0 (0.0%) |
| 5 to 9 Minutes | 0 (0.0%) | 0 (0.0%) |
| 10 to 14 Minutes | 0 (0.0%) | 0 (0.0%) |
| 15 to 19 Minutes | 35 (54.7%) | 22 (100.0%) |
| 20 to 24 Minutes | 0 (0.0%) | 0 (0.0%) |
| 25 to 29 Minutes | 0 (0.0%) | 0 (0.0%) |
| 30 to 34 Minutes | 0 (0.0%) | 0 (0.0%) |
| 35 to 39 Minutes | 0 (0.0%) | 0 (0.0%) |
| 40 to 44 Minutes | 0 (0.0%) | 0 (0.0%) |
| 45 to 59 Minutes | 0 (0.0%) | 0 (0.0%) |
| 60 to 89 Minutes | 0 (0.0%) | 0 (0.0%) |
| 90 or more Minutes | 29 (45.3%) | 0 (0.0%) |
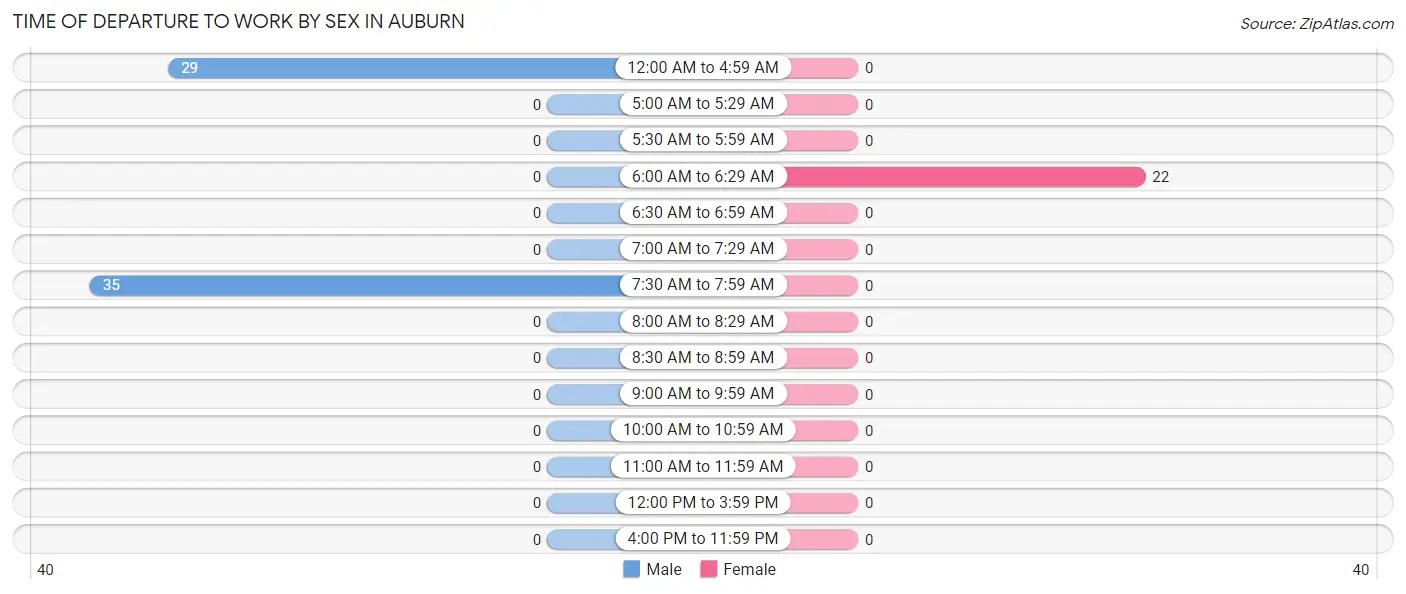
Time of Departure to Work by Sex in Auburn
The most frequent times of departure to work in Auburn are 7:30 AM to 7:59 AM (35, 54.7%) for males and 6:00 AM to 6:29 AM (22, 100.0%) for females.
| Time of Departure | Male | Female |
| 12:00 AM to 4:59 AM | 29 (45.3%) | 0 (0.0%) |
| 5:00 AM to 5:29 AM | 0 (0.0%) | 0 (0.0%) |
| 5:30 AM to 5:59 AM | 0 (0.0%) | 0 (0.0%) |
| 6:00 AM to 6:29 AM | 0 (0.0%) | 22 (100.0%) |
| 6:30 AM to 6:59 AM | 0 (0.0%) | 0 (0.0%) |
| 7:00 AM to 7:29 AM | 0 (0.0%) | 0 (0.0%) |
| 7:30 AM to 7:59 AM | 35 (54.7%) | 0 (0.0%) |
| 8:00 AM to 8:29 AM | 0 (0.0%) | 0 (0.0%) |
| 8:30 AM to 8:59 AM | 0 (0.0%) | 0 (0.0%) |
| 9:00 AM to 9:59 AM | 0 (0.0%) | 0 (0.0%) |
| 10:00 AM to 10:59 AM | 0 (0.0%) | 0 (0.0%) |
| 11:00 AM to 11:59 AM | 0 (0.0%) | 0 (0.0%) |
| 12:00 PM to 3:59 PM | 0 (0.0%) | 0 (0.0%) |
| 4:00 PM to 11:59 PM | 0 (0.0%) | 0 (0.0%) |
| Total | 64 (100.0%) | 22 (100.0%) |
Housing Occupancy in Auburn
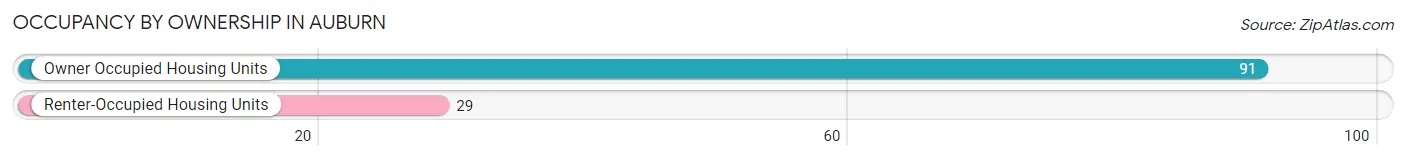
Occupancy by Ownership in Auburn
Of the total 120 dwellings in Auburn, owner-occupied units account for 91 (75.8%), while renter-occupied units make up 29 (24.2%).
| Occupancy | # Housing Units | % Housing Units |
| Owner Occupied Housing Units | 91 | 75.8% |
| Renter-Occupied Housing Units | 29 | 24.2% |
| Total Occupied Housing Units | 120 | 100.0% |
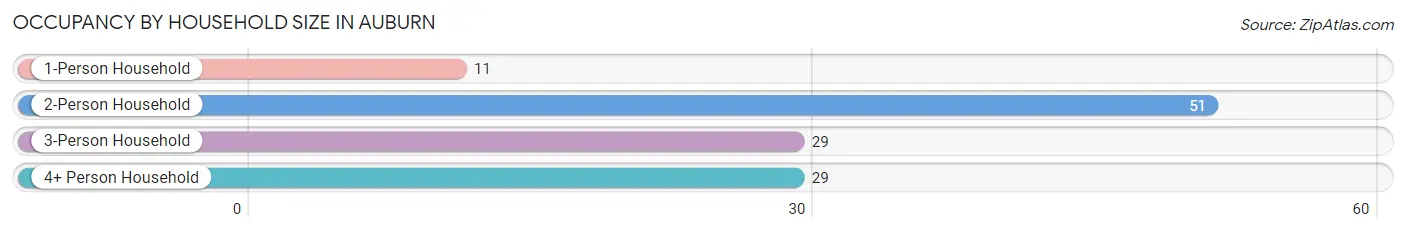
Occupancy by Household Size in Auburn
| Household Size | # Housing Units | % Housing Units |
| 1-Person Household | 11 | 9.2% |
| 2-Person Household | 51 | 42.5% |
| 3-Person Household | 29 | 24.2% |
| 4+ Person Household | 29 | 24.2% |
| Total Housing Units | 120 | 100.0% |
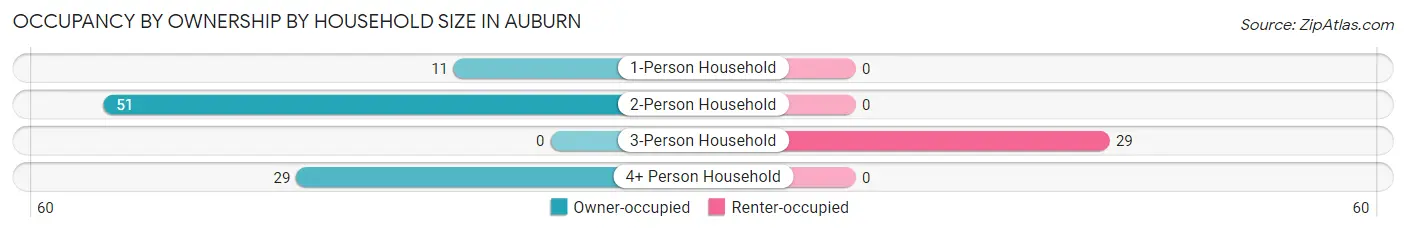
Occupancy by Ownership by Household Size in Auburn
| Household Size | Owner-occupied | Renter-occupied |
| 1-Person Household | 11 (100.0%) | 0 (0.0%) |
| 2-Person Household | 51 (100.0%) | 0 (0.0%) |
| 3-Person Household | 0 (0.0%) | 29 (100.0%) |
| 4+ Person Household | 29 (100.0%) | 0 (0.0%) |
| Total Housing Units | 91 (75.8%) | 29 (24.2%) |
Occupancy by Educational Attainment in Auburn
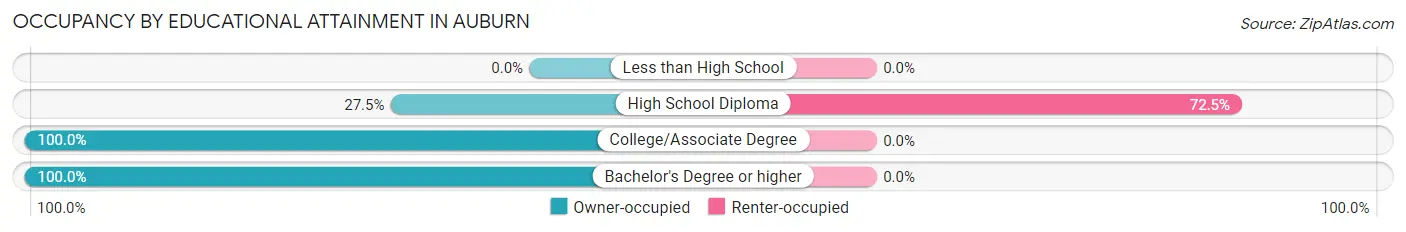
| Household Size | Owner-occupied | Renter-occupied |
| Less than High School | 0 (0.0%) | 0 (0.0%) |
| High School Diploma | 11 (27.5%) | 29 (72.5%) |
| College/Associate Degree | 51 (100.0%) | 0 (0.0%) |
| Bachelor's Degree or higher | 29 (100.0%) | 0 (0.0%) |
Occupancy by Age of Householder in Auburn
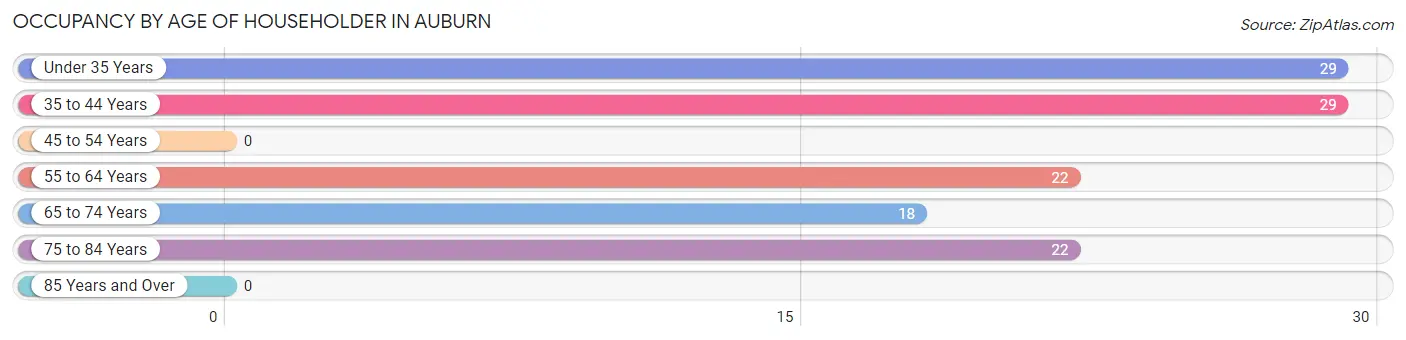
| Age Bracket | # Households | % Households |
| Under 35 Years | 29 | 24.2% |
| 35 to 44 Years | 29 | 24.2% |
| 45 to 54 Years | 0 | 0.0% |
| 55 to 64 Years | 22 | 18.3% |
| 65 to 74 Years | 18 | 15.0% |
| 75 to 84 Years | 22 | 18.3% |
| 85 Years and Over | 0 | 0.0% |
| Total | 120 | 100.0% |
Housing Finances in Auburn
Median Income by Occupancy in Auburn
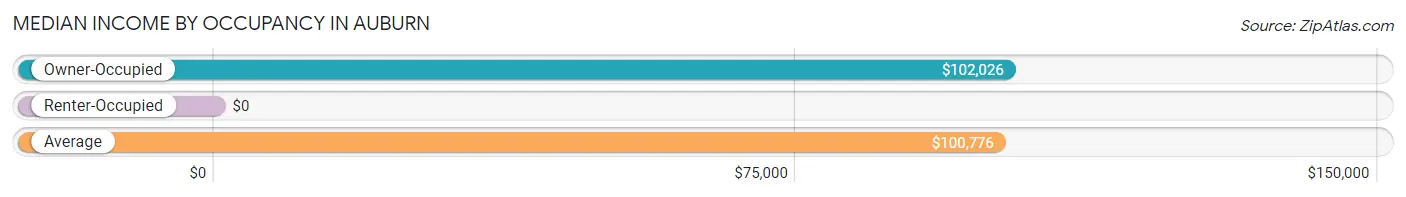
| Occupancy Type | # Households | Median Income |
| Owner-Occupied | 91 (75.8%) | $102,026 |
| Renter-Occupied | 29 (24.2%) | $0 |
| Average | 120 (100.0%) | $100,776 |
Occupancy by Householder Income Bracket in Auburn
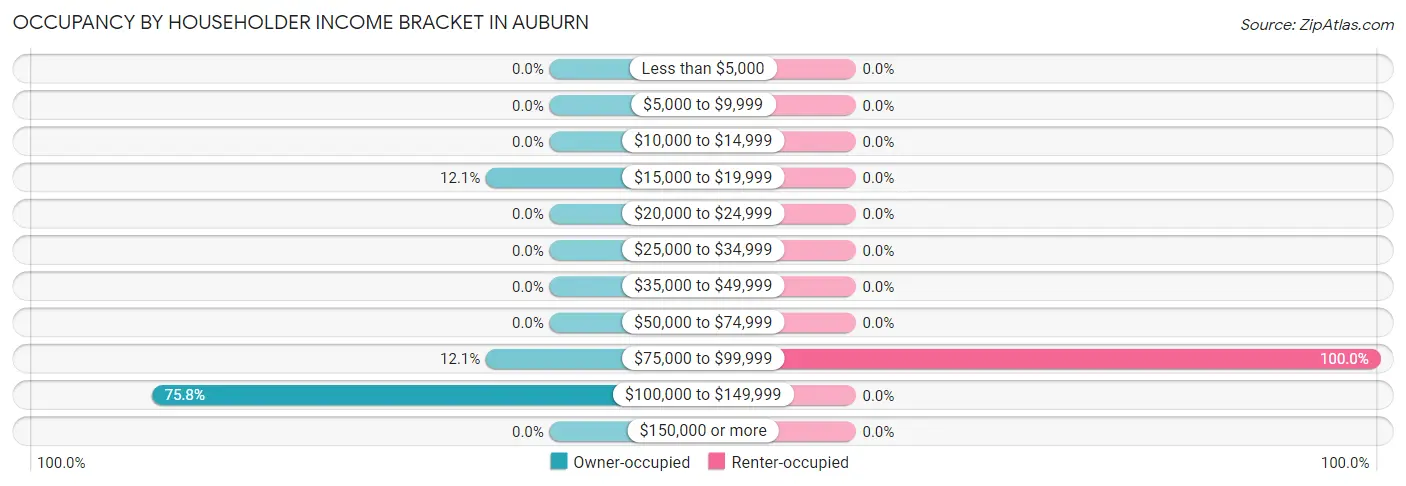
| Income Bracket | Owner-occupied | Renter-occupied |
| Less than $5,000 | 0 (0.0%) | 0 (0.0%) |
| $5,000 to $9,999 | 0 (0.0%) | 0 (0.0%) |
| $10,000 to $14,999 | 0 (0.0%) | 0 (0.0%) |
| $15,000 to $19,999 | 11 (12.1%) | 0 (0.0%) |
| $20,000 to $24,999 | 0 (0.0%) | 0 (0.0%) |
| $25,000 to $34,999 | 0 (0.0%) | 0 (0.0%) |
| $35,000 to $49,999 | 0 (0.0%) | 0 (0.0%) |
| $50,000 to $74,999 | 0 (0.0%) | 0 (0.0%) |
| $75,000 to $99,999 | 11 (12.1%) | 29 (100.0%) |
| $100,000 to $149,999 | 69 (75.8%) | 0 (0.0%) |
| $150,000 or more | 0 (0.0%) | 0 (0.0%) |
| Total | 91 (100.0%) | 29 (100.0%) |
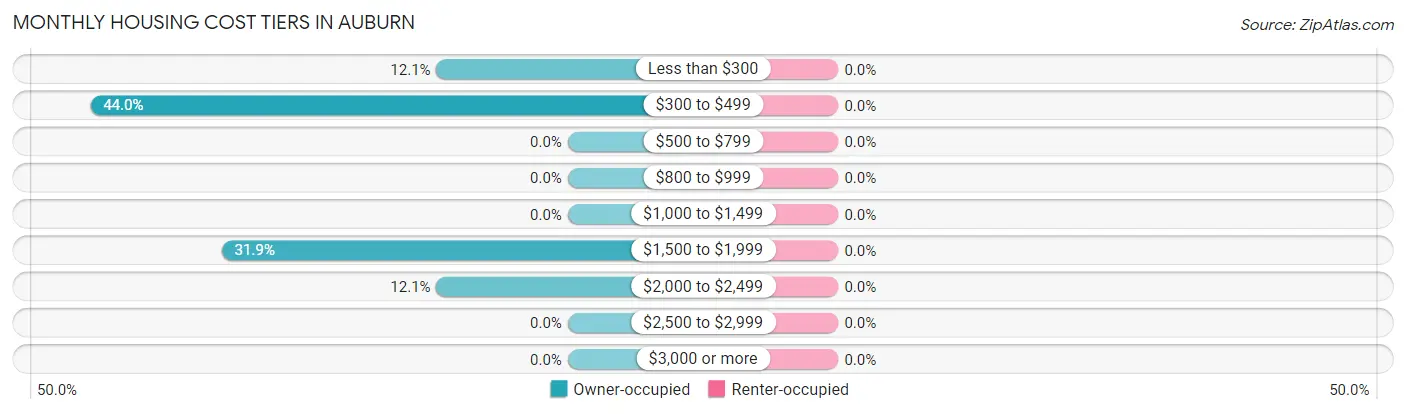
Monthly Housing Cost Tiers in Auburn
| Monthly Cost | Owner-occupied | Renter-occupied |
| Less than $300 | 11 (12.1%) | 0 (0.0%) |
| $300 to $499 | 40 (44.0%) | 0 (0.0%) |
| $500 to $799 | 0 (0.0%) | 0 (0.0%) |
| $800 to $999 | 0 (0.0%) | 0 (0.0%) |
| $1,000 to $1,499 | 0 (0.0%) | 0 (0.0%) |
| $1,500 to $1,999 | 29 (31.9%) | 0 (0.0%) |
| $2,000 to $2,499 | 11 (12.1%) | 0 (0.0%) |
| $2,500 to $2,999 | 0 (0.0%) | 0 (0.0%) |
| $3,000 or more | 0 (0.0%) | 0 (0.0%) |
| Total | 91 (100.0%) | 29 (100.0%) |
Physical Housing Characteristics in Auburn
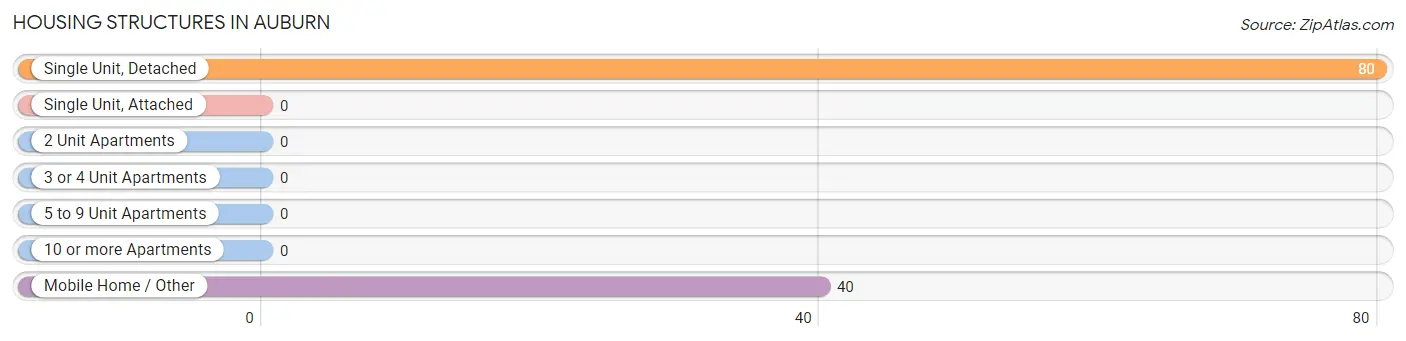
Housing Structures in Auburn
| Structure Type | # Housing Units | % Housing Units |
| Single Unit, Detached | 80 | 66.7% |
| Single Unit, Attached | 0 | 0.0% |
| 2 Unit Apartments | 0 | 0.0% |
| 3 or 4 Unit Apartments | 0 | 0.0% |
| 5 to 9 Unit Apartments | 0 | 0.0% |
| 10 or more Apartments | 0 | 0.0% |
| Mobile Home / Other | 40 | 33.3% |
| Total | 120 | 100.0% |
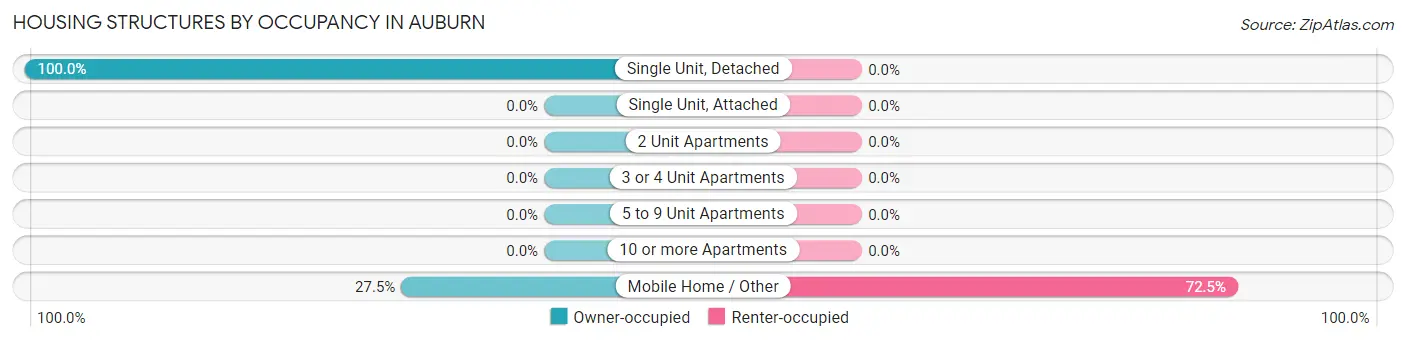
Housing Structures by Occupancy in Auburn
| Structure Type | Owner-occupied | Renter-occupied |
| Single Unit, Detached | 80 (100.0%) | 0 (0.0%) |
| Single Unit, Attached | 0 (0.0%) | 0 (0.0%) |
| 2 Unit Apartments | 0 (0.0%) | 0 (0.0%) |
| 3 or 4 Unit Apartments | 0 (0.0%) | 0 (0.0%) |
| 5 to 9 Unit Apartments | 0 (0.0%) | 0 (0.0%) |
| 10 or more Apartments | 0 (0.0%) | 0 (0.0%) |
| Mobile Home / Other | 11 (27.5%) | 29 (72.5%) |
| Total | 91 (75.8%) | 29 (24.2%) |
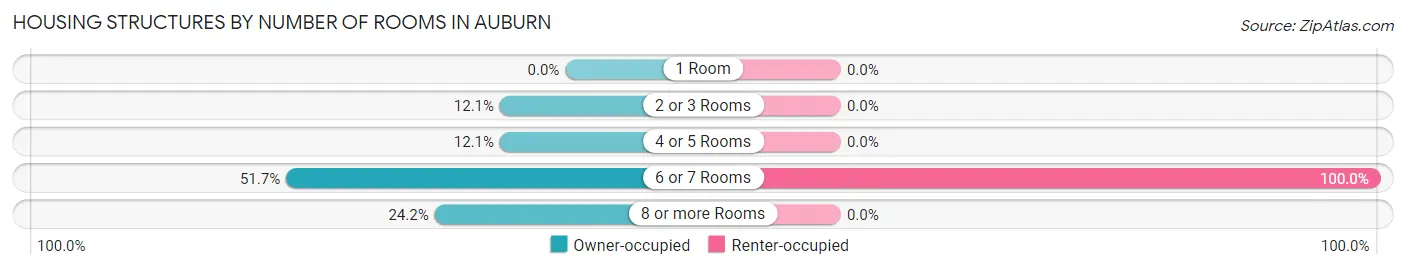
Housing Structures by Number of Rooms in Auburn
| Number of Rooms | Owner-occupied | Renter-occupied |
| 1 Room | 0 (0.0%) | 0 (0.0%) |
| 2 or 3 Rooms | 11 (12.1%) | 0 (0.0%) |
| 4 or 5 Rooms | 11 (12.1%) | 0 (0.0%) |
| 6 or 7 Rooms | 47 (51.6%) | 29 (100.0%) |
| 8 or more Rooms | 22 (24.2%) | 0 (0.0%) |
| Total | 91 (100.0%) | 29 (100.0%) |
Housing Structure by Heating Type in Auburn
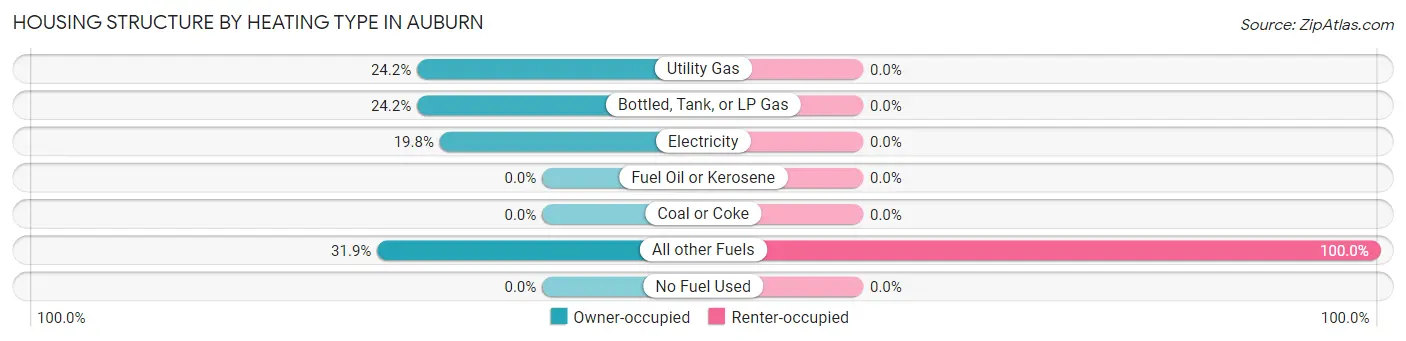
| Heating Type | Owner-occupied | Renter-occupied |
| Utility Gas | 22 (24.2%) | 0 (0.0%) |
| Bottled, Tank, or LP Gas | 22 (24.2%) | 0 (0.0%) |
| Electricity | 18 (19.8%) | 0 (0.0%) |
| Fuel Oil or Kerosene | 0 (0.0%) | 0 (0.0%) |
| Coal or Coke | 0 (0.0%) | 0 (0.0%) |
| All other Fuels | 29 (31.9%) | 29 (100.0%) |
| No Fuel Used | 0 (0.0%) | 0 (0.0%) |
| Total | 91 (100.0%) | 29 (100.0%) |
Household Vehicle Usage in Auburn
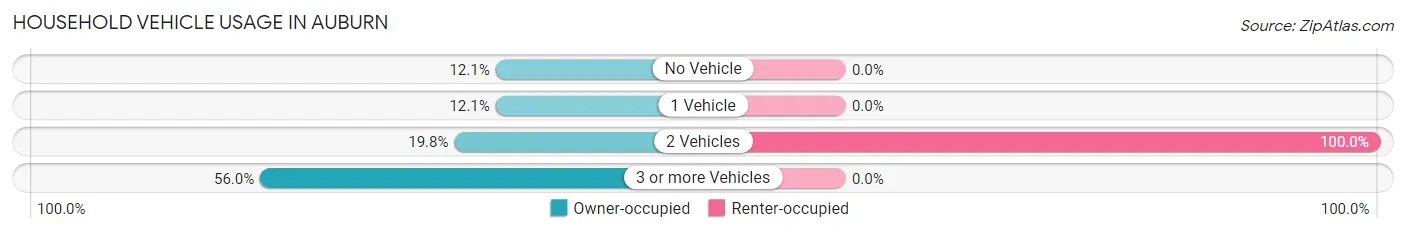
| Vehicles per Household | Owner-occupied | Renter-occupied |
| No Vehicle | 11 (12.1%) | 0 (0.0%) |
| 1 Vehicle | 11 (12.1%) | 0 (0.0%) |
| 2 Vehicles | 18 (19.8%) | 29 (100.0%) |
| 3 or more Vehicles | 51 (56.0%) | 0 (0.0%) |
| Total | 91 (100.0%) | 29 (100.0%) |
Real Estate & Mortgages in Auburn
Real Estate and Mortgage Overview in Auburn
| Characteristic | Without Mortgage | With Mortgage |
| Housing Units | 51 | 40 |
| Median Property Value | $191,500 | $0 |
| Median Household Income | $109,514 | $0 |
| Monthly Housing Costs | $436 | $0 |
| Real Estate Taxes | $1,330 | $0 |
Property Value by Mortgage Status in Auburn
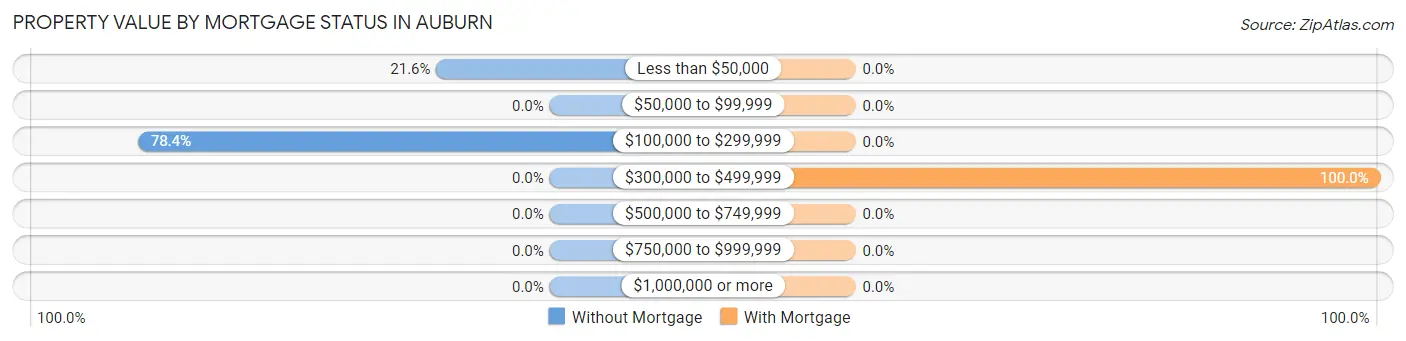
| Property Value | Without Mortgage | With Mortgage |
| Less than $50,000 | 11 (21.6%) | 0 (0.0%) |
| $50,000 to $99,999 | 0 (0.0%) | 0 (0.0%) |
| $100,000 to $299,999 | 40 (78.4%) | 0 (0.0%) |
| $300,000 to $499,999 | 0 (0.0%) | 40 (100.0%) |
| $500,000 to $749,999 | 0 (0.0%) | 0 (0.0%) |
| $750,000 to $999,999 | 0 (0.0%) | 0 (0.0%) |
| $1,000,000 or more | 0 (0.0%) | 0 (0.0%) |
| Total | 51 (100.0%) | 40 (100.0%) |
Household Income by Mortgage Status in Auburn
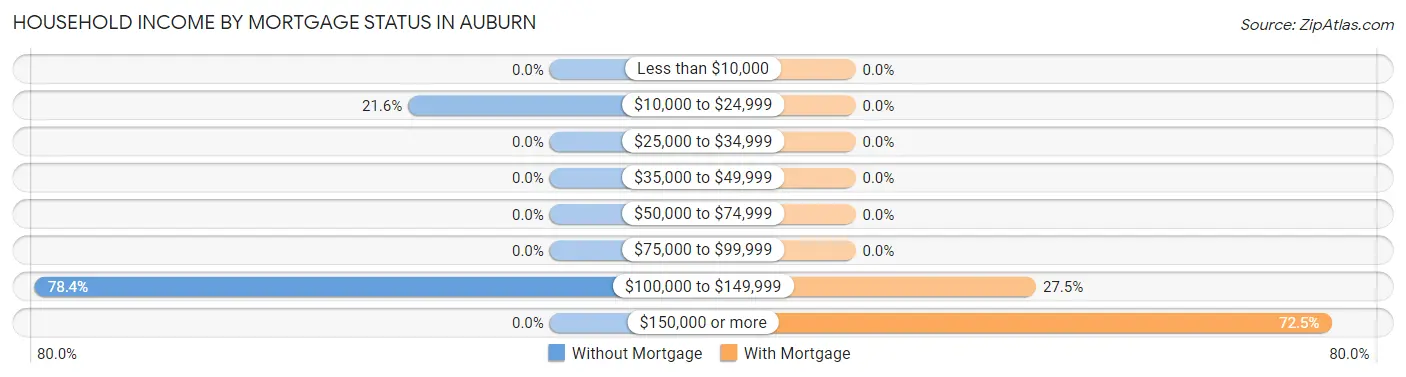
| Household Income | Without Mortgage | With Mortgage |
| Less than $10,000 | 0 (0.0%) | 0 (0.0%) |
| $10,000 to $24,999 | 11 (21.6%) | 0 (0.0%) |
| $25,000 to $34,999 | 0 (0.0%) | 0 (0.0%) |
| $35,000 to $49,999 | 0 (0.0%) | 0 (0.0%) |
| $50,000 to $74,999 | 0 (0.0%) | 0 (0.0%) |
| $75,000 to $99,999 | 0 (0.0%) | 0 (0.0%) |
| $100,000 to $149,999 | 40 (78.4%) | 11 (27.5%) |
| $150,000 or more | 0 (0.0%) | 29 (72.5%) |
| Total | 51 (100.0%) | 40 (100.0%) |
Property Value to Household Income Ratio in Auburn
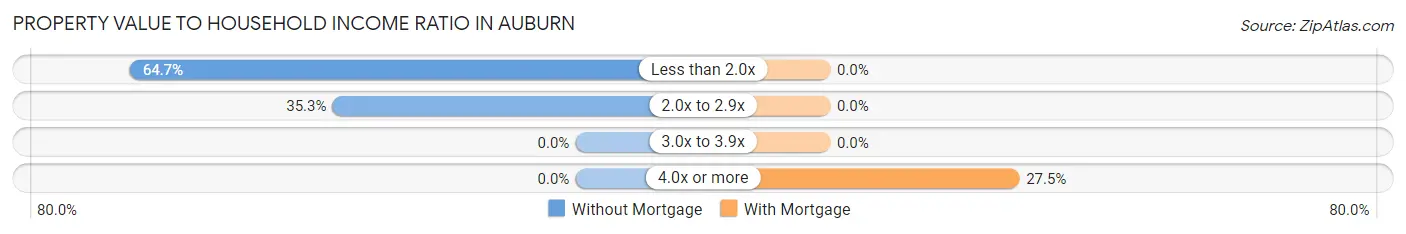
| Value-to-Income Ratio | Without Mortgage | With Mortgage |
| Less than 2.0x | 33 (64.7%) | 0 (0.0%) |
| 2.0x to 2.9x | 18 (35.3%) | 0 (0.0%) |
| 3.0x to 3.9x | 0 (0.0%) | 0 (0.0%) |
| 4.0x or more | 0 (0.0%) | 11 (27.5%) |
| Total | 51 (100.0%) | 40 (100.0%) |
Real Estate Taxes by Mortgage Status in Auburn
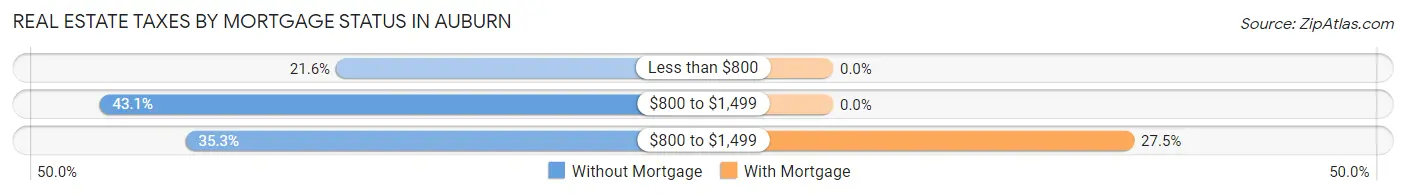
| Property Taxes | Without Mortgage | With Mortgage |
| Less than $800 | 11 (21.6%) | 0 (0.0%) |
| $800 to $1,499 | 22 (43.1%) | 0 (0.0%) |
| $800 to $1,499 | 18 (35.3%) | 11 (27.5%) |
| Total | 51 (100.0%) | 40 (100.0%) |
Health & Disability in Auburn
Health Insurance Coverage by Age in Auburn
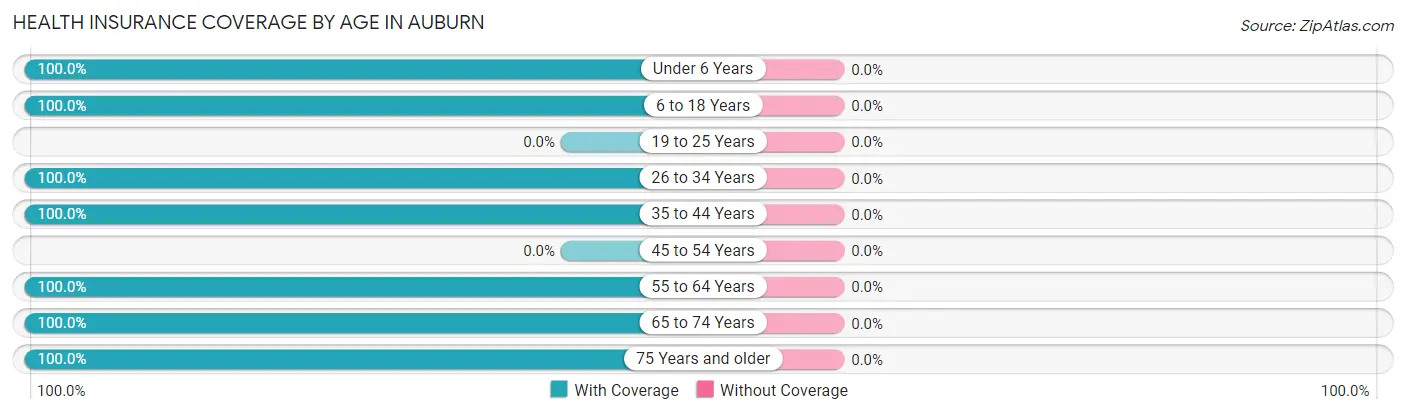
| Age Bracket | With Coverage | Without Coverage |
| Under 6 Years | 30 (100.0%) | 0 (0.0%) |
| 6 to 18 Years | 116 (100.0%) | 0 (0.0%) |
| 19 to 25 Years | 0 (0.0%) | 0 (0.0%) |
| 26 to 34 Years | 50 (100.0%) | 0 (0.0%) |
| 35 to 44 Years | 64 (100.0%) | 0 (0.0%) |
| 45 to 54 Years | 0 (0.0%) | 0 (0.0%) |
| 55 to 64 Years | 22 (100.0%) | 0 (0.0%) |
| 65 to 74 Years | 40 (100.0%) | 0 (0.0%) |
| 75 Years and older | 47 (100.0%) | 0 (0.0%) |
| Total | 369 (100.0%) | 0 (0.0%) |
Health Insurance Coverage by Citizenship Status in Auburn
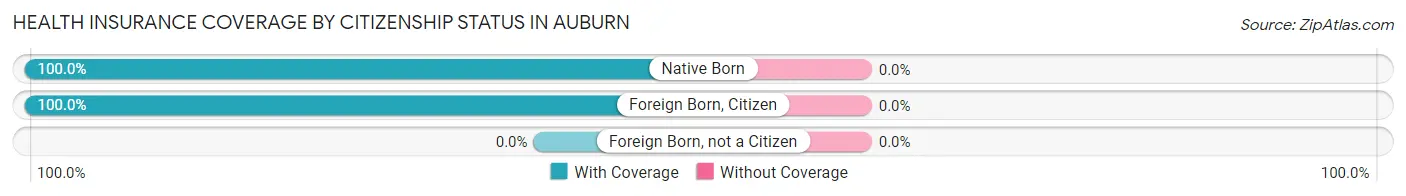
| Citizenship Status | With Coverage | Without Coverage |
| Native Born | 30 (100.0%) | 0 (0.0%) |
| Foreign Born, Citizen | 116 (100.0%) | 0 (0.0%) |
| Foreign Born, not a Citizen | 0 (0.0%) | 0 (0.0%) |
Health Insurance Coverage by Household Income in Auburn
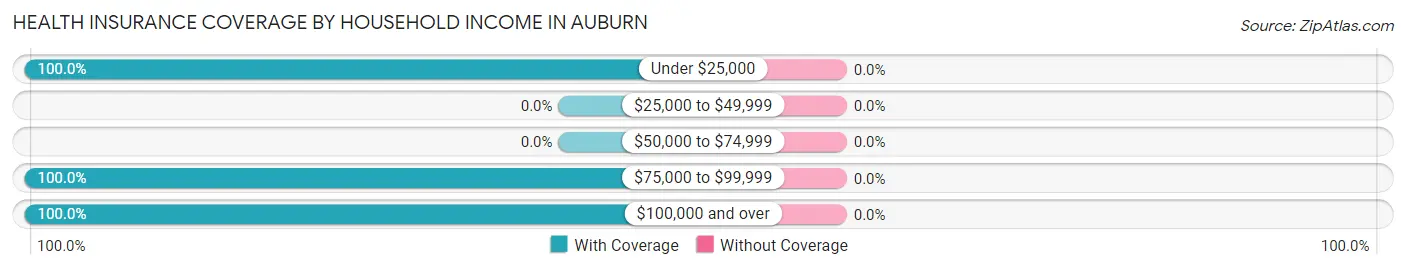
| Household Income | With Coverage | Without Coverage |
| Under $25,000 | 11 (100.0%) | 0 (0.0%) |
| $25,000 to $49,999 | 0 (0.0%) | 0 (0.0%) |
| $50,000 to $74,999 | 0 (0.0%) | 0 (0.0%) |
| $75,000 to $99,999 | 105 (100.0%) | 0 (0.0%) |
| $100,000 and over | 253 (100.0%) | 0 (0.0%) |
Public vs Private Health Insurance Coverage by Age in Auburn
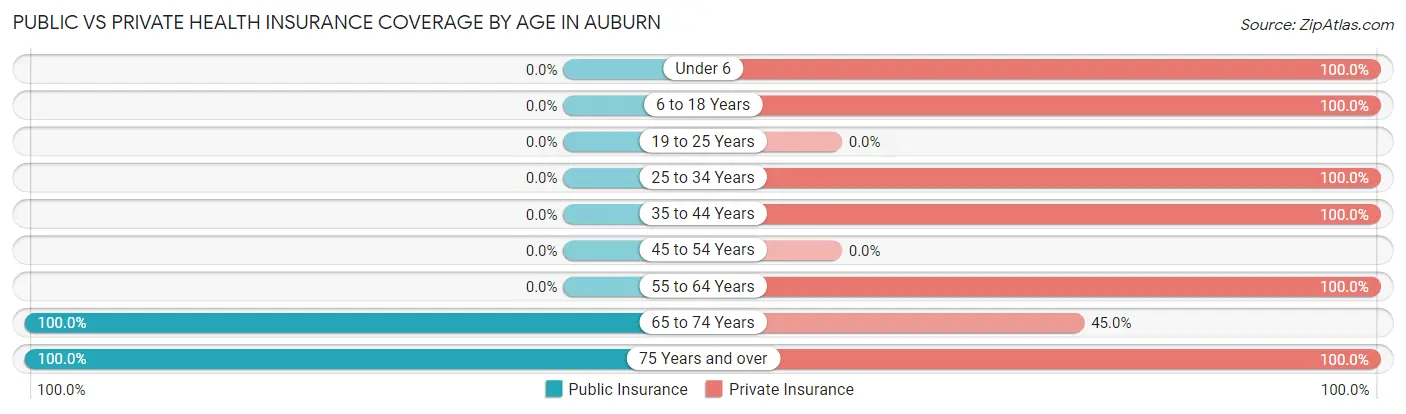
| Age Bracket | Public Insurance | Private Insurance |
| Under 6 | 0 (0.0%) | 30 (100.0%) |
| 6 to 18 Years | 0 (0.0%) | 116 (100.0%) |
| 19 to 25 Years | 0 (0.0%) | 0 (0.0%) |
| 25 to 34 Years | 0 (0.0%) | 50 (100.0%) |
| 35 to 44 Years | 0 (0.0%) | 64 (100.0%) |
| 45 to 54 Years | 0 (0.0%) | 0 (0.0%) |
| 55 to 64 Years | 0 (0.0%) | 22 (100.0%) |
| 65 to 74 Years | 40 (100.0%) | 18 (45.0%) |
| 75 Years and over | 47 (100.0%) | 47 (100.0%) |
| Total | 87 (23.6%) | 347 (94.0%) |
Disability Status by Sex by Age in Auburn
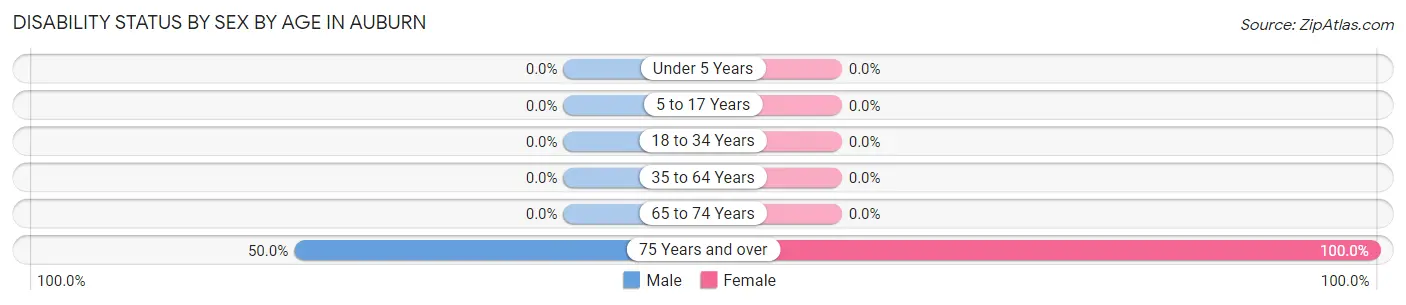
| Age Bracket | Male | Female |
| Under 5 Years | 0 (0.0%) | 0 (0.0%) |
| 5 to 17 Years | 0 (0.0%) | 0 (0.0%) |
| 18 to 34 Years | 0 (0.0%) | 0 (0.0%) |
| 35 to 64 Years | 0 (0.0%) | 0 (0.0%) |
| 65 to 74 Years | 0 (0.0%) | 0 (0.0%) |
| 75 Years and over | 11 (50.0%) | 25 (100.0%) |
Disability Class by Sex by Age in Auburn
Disability Class: Hearing Difficulty
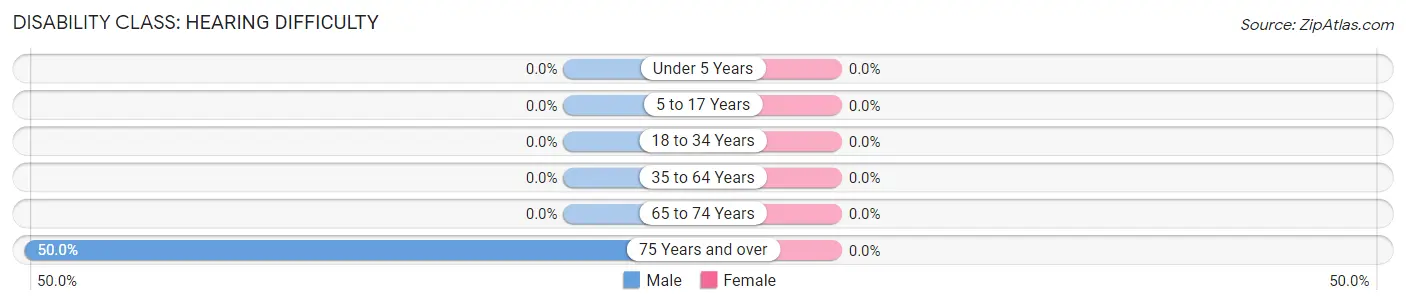
| Age Bracket | Male | Female |
| Under 5 Years | 0 (0.0%) | 0 (0.0%) |
| 5 to 17 Years | 0 (0.0%) | 0 (0.0%) |
| 18 to 34 Years | 0 (0.0%) | 0 (0.0%) |
| 35 to 64 Years | 0 (0.0%) | 0 (0.0%) |
| 65 to 74 Years | 0 (0.0%) | 0 (0.0%) |
| 75 Years and over | 11 (50.0%) | 0 (0.0%) |
Disability Class: Vision Difficulty
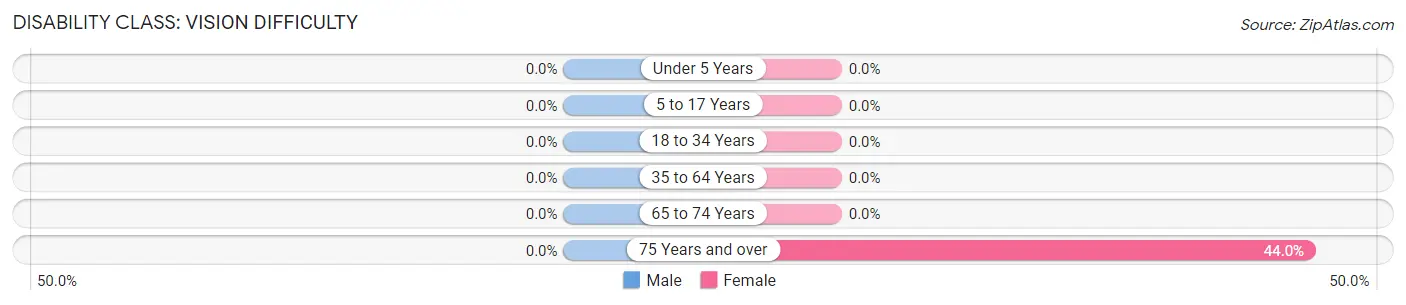
| Age Bracket | Male | Female |
| Under 5 Years | 0 (0.0%) | 0 (0.0%) |
| 5 to 17 Years | 0 (0.0%) | 0 (0.0%) |
| 18 to 34 Years | 0 (0.0%) | 0 (0.0%) |
| 35 to 64 Years | 0 (0.0%) | 0 (0.0%) |
| 65 to 74 Years | 0 (0.0%) | 0 (0.0%) |
| 75 Years and over | 0 (0.0%) | 11 (44.0%) |
Disability Class: Cognitive Difficulty
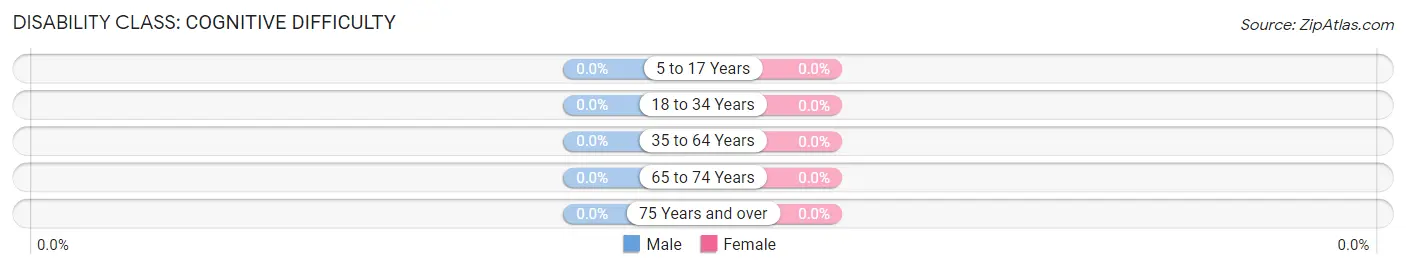
| Age Bracket | Male | Female |
| 5 to 17 Years | 0 (0.0%) | 0 (0.0%) |
| 18 to 34 Years | 0 (0.0%) | 0 (0.0%) |
| 35 to 64 Years | 0 (0.0%) | 0 (0.0%) |
| 65 to 74 Years | 0 (0.0%) | 0 (0.0%) |
| 75 Years and over | 0 (0.0%) | 0 (0.0%) |
Disability Class: Ambulatory Difficulty
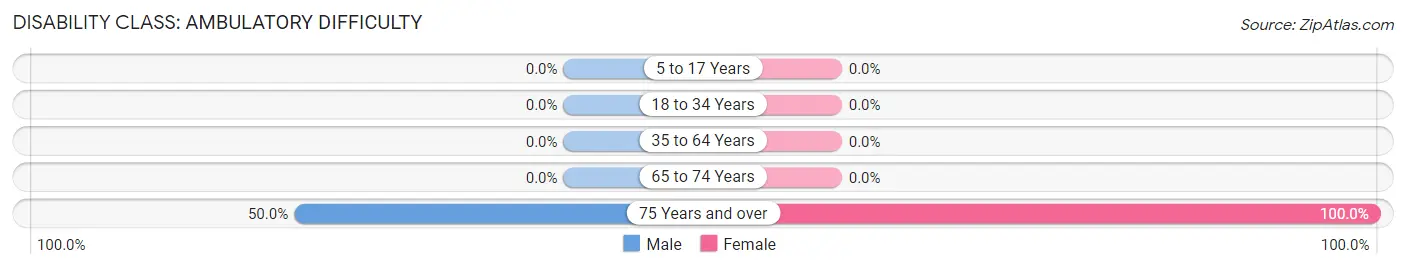
| Age Bracket | Male | Female |
| 5 to 17 Years | 0 (0.0%) | 0 (0.0%) |
| 18 to 34 Years | 0 (0.0%) | 0 (0.0%) |
| 35 to 64 Years | 0 (0.0%) | 0 (0.0%) |
| 65 to 74 Years | 0 (0.0%) | 0 (0.0%) |
| 75 Years and over | 11 (50.0%) | 25 (100.0%) |
Disability Class: Self-Care Difficulty
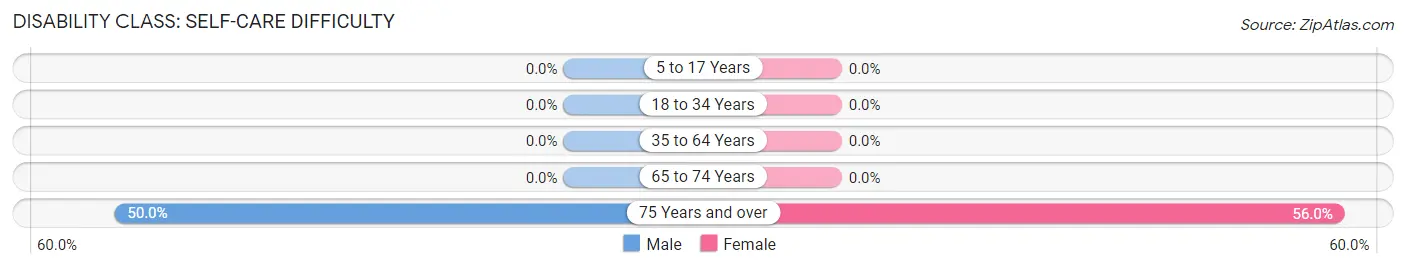
| Age Bracket | Male | Female |
| 5 to 17 Years | 0 (0.0%) | 0 (0.0%) |
| 18 to 34 Years | 0 (0.0%) | 0 (0.0%) |
| 35 to 64 Years | 0 (0.0%) | 0 (0.0%) |
| 65 to 74 Years | 0 (0.0%) | 0 (0.0%) |
| 75 Years and over | 11 (50.0%) | 14 (56.0%) |
Technology Access in Auburn
Computing Device Access in Auburn
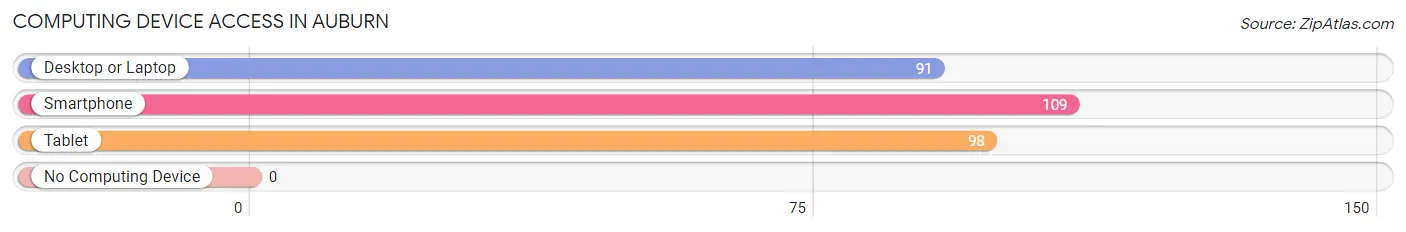
| Device Type | # Households | % Households |
| Desktop or Laptop | 91 | 75.8% |
| Smartphone | 109 | 90.8% |
| Tablet | 98 | 81.7% |
| No Computing Device | 0 | 0.0% |
| Total | 120 | 100.0% |
Internet Access in Auburn
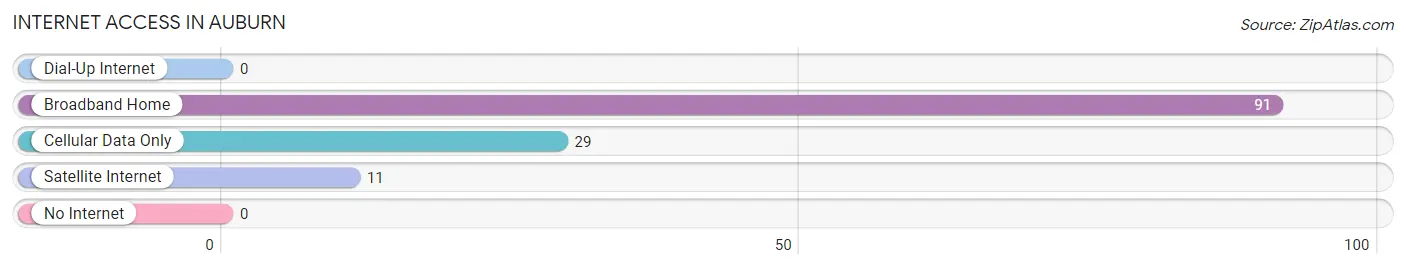
| Internet Type | # Households | % Households |
| Dial-Up Internet | 0 | 0.0% |
| Broadband Home | 91 | 75.8% |
| Cellular Data Only | 29 | 24.2% |
| Satellite Internet | 11 | 9.2% |
| No Internet | 0 | 0.0% |
| Total | 120 | 100.0% |
Auburn Summary
Auburn, Wyoming is a small town located in the southeastern corner of the state, near the border of Colorado and Nebraska. It is part of the Cheyenne metropolitan area and is the county seat of Laramie County. The town was founded in 1868 and has a population of approximately 1,000 people.
History
Auburn was founded in 1868 by a group of settlers from the nearby town of Cheyenne. The town was named after Auburn, New York, the hometown of one of the settlers. The town was originally a farming community, but soon became a trading post for the surrounding area. In 1872, the Union Pacific Railroad built a line through the town, which helped to spur its growth.
In the late 19th century, Auburn was a popular stop for travelers on the Union Pacific Railroad. The town was also home to a number of saloons, hotels, and other businesses. In the early 20th century, the town began to decline as the railroad moved away and the population decreased.
Geography
Auburn is located in the southeastern corner of Wyoming, near the border of Colorado and Nebraska. The town is situated in the Laramie Basin, which is part of the Great Plains region. The town is located at an elevation of 5,890 feet above sea level.
The town is surrounded by rolling hills and grasslands, with the Laramie Mountains to the west. The nearby Laramie River flows through the town, providing a source of water for the area.
Economy
Auburn’s economy is largely based on agriculture and ranching. The town is home to a number of farms and ranches, which produce a variety of crops and livestock. The town is also home to a number of small businesses, including restaurants, stores, and other services.
The town is also home to a number of tourist attractions, including the Laramie County Museum and the Wyoming State Museum. The town is also home to a number of outdoor recreation opportunities, including camping, fishing, and hiking.
Demographics
As of the 2010 census, Auburn had a population of 1,000 people. The town is predominantly white, with a small Hispanic population. The median household income is $45,000, and the median home value is $150,000.
The town is served by the Laramie County School District, which includes two elementary schools, one middle school, and one high school. The town is also home to a number of churches, including the First Baptist Church of Auburn.
Conclusion
Auburn, Wyoming is a small town located in the southeastern corner of the state, near the border of Colorado and Nebraska. The town was founded in 1868 and has a population of approximately 1,000 people. The town’s economy is largely based on agriculture and ranching, and the town is home to a number of tourist attractions and outdoor recreation opportunities. The town is predominantly white, with a small Hispanic population, and is served by the Laramie County School District.
Common Questions
What is Per Capita Income in Auburn?
Per Capita income in Auburn is $31,512.
What is the Median Family Income in Auburn?
Median Family Income in Auburn is $101,250.
What is the Median Household income in Auburn?
Median Household Income in Auburn is $100,776.
What is Inequality or Gini Index in Auburn?
Inequality or Gini Index in Auburn is 0.15.
What is the Total Population of Auburn?
Total Population of Auburn is 369.
What is the Total Male Population of Auburn?
Total Male Population of Auburn is 137.
What is the Total Female Population of Auburn?
Total Female Population of Auburn is 232.
What is the Ratio of Males per 100 Females in Auburn?
There are 59.05 Males per 100 Females in Auburn.
What is the Ratio of Females per 100 Males in Auburn?
There are 169.34 Females per 100 Males in Auburn.
What is the Median Population Age in Auburn?
Median Population Age in Auburn is 28.6 Years.
What is the Average Family Size in Auburn
Average Family Size in Auburn is 3.3 People.
What is the Average Household Size in Auburn
Average Household Size in Auburn is 3.1 People.
How Large is the Labor Force in Auburn?
There are 86 People in the Labor Forcein in Auburn.
What is the Percentage of People in the Labor Force in Auburn?
38.6% of People are in the Labor Force in Auburn.