Tetlin, AK Map & Demographics
Tetlin Map

Tetlin Overview
$11,811
PER CAPITA INCOME
$70,625
AVG FAMILY INCOME
$20,417
AVG HOUSEHOLD INCOME
58.9%
WAGE / INCOME GAP [ % ]
41.1¢/ $1
WAGE / INCOME GAP [ $ ]
0.52
INEQUALITY / GINI INDEX
201
TOTAL POPULATION
146
MALE POPULATION
55
FEMALE POPULATION
265.45
MALES / 100 FEMALES
37.67
FEMALES / 100 MALES
25.6
MEDIAN AGE
6.0
AVG FAMILY SIZE
3.8
AVG HOUSEHOLD SIZE
51
LABOR FORCE [ PEOPLE ]
40.5%
PERCENT IN LABOR FORCE
23.5%
UNEMPLOYMENT RATE
Income in Tetlin
Income Overview in Tetlin
Per Capita Income in Tetlin is $11,811, while median incomes of families and households are $70,625 and $20,417 respectively.
| Characteristic | Number | Measure |
| Per Capita Income | 201 | $11,811 |
| Median Family Income | 27 | $70,625 |
| Mean Family Income | 27 | $51,956 |
| Median Household Income | 53 | $20,417 |
| Mean Household Income | 53 | $37,649 |
| Income Deficit | 27 | $0 |
| Wage / Income Gap (%) | 201 | 58.89% |
| Wage / Income Gap ($) | 201 | 41.11¢ per $1 |
| Gini / Inequality Index | 201 | 0.52 |
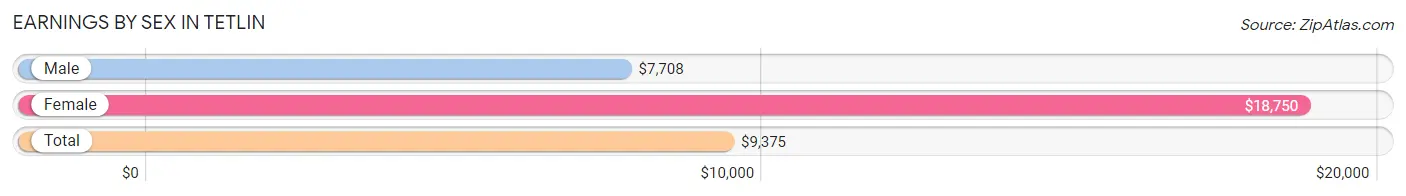
Earnings by Sex in Tetlin
Average Earnings in Tetlin are $9,375, $7,708 for men and $18,750 for women, a difference of 58.9%.
| Sex | Number | Average Earnings |
| Male | 66 (73.3%) | $7,708 |
| Female | 24 (26.7%) | $18,750 |
| Total | 90 (100.0%) | $9,375 |
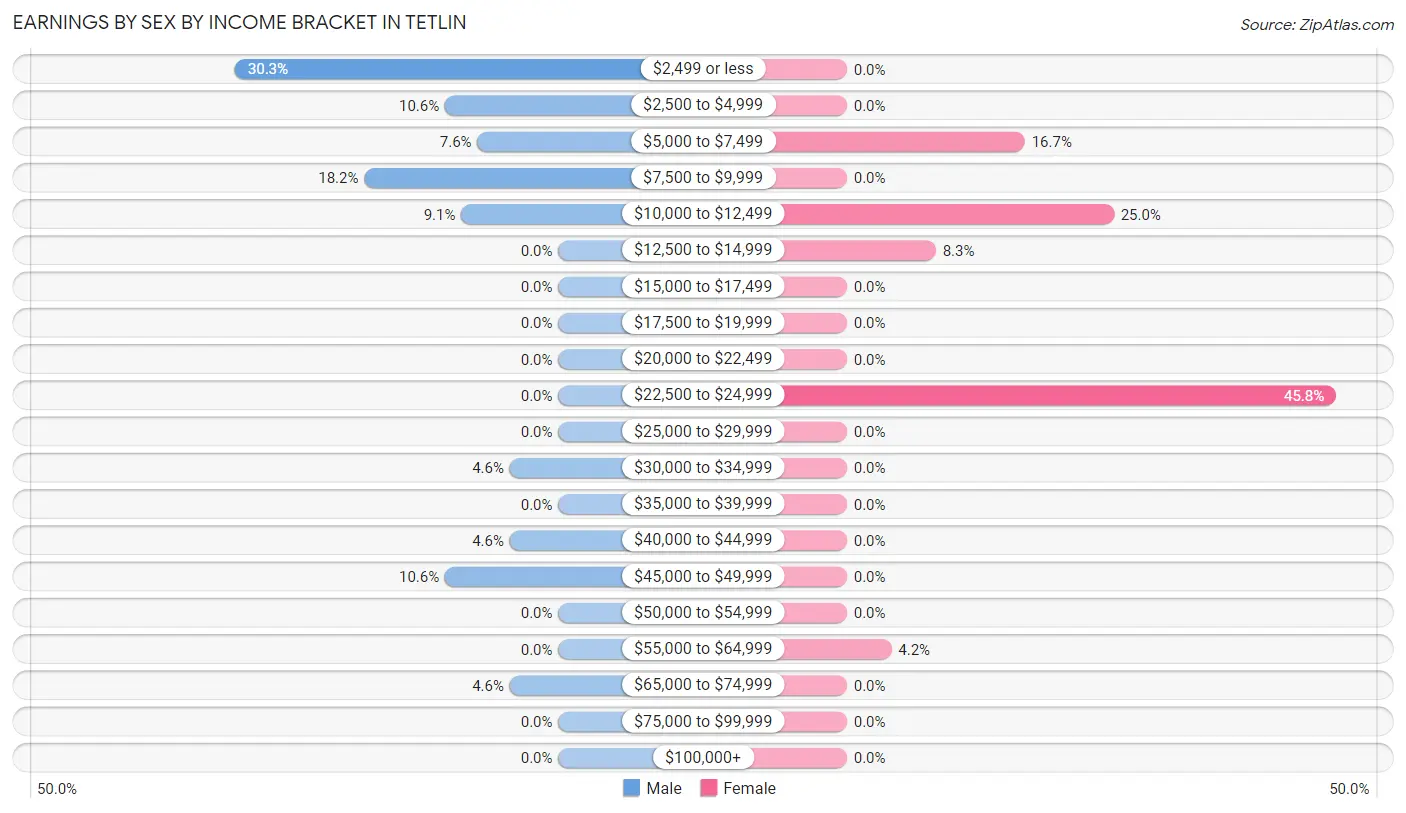
Earnings by Sex by Income Bracket in Tetlin
The most common earnings brackets in Tetlin are $2,499 or less for men (20 | 30.3%) and $22,500 to $24,999 for women (11 | 45.8%).
| Income | Male | Female |
| $2,499 or less | 20 (30.3%) | 0 (0.0%) |
| $2,500 to $4,999 | 7 (10.6%) | 0 (0.0%) |
| $5,000 to $7,499 | 5 (7.6%) | 4 (16.7%) |
| $7,500 to $9,999 | 12 (18.2%) | 0 (0.0%) |
| $10,000 to $12,499 | 6 (9.1%) | 6 (25.0%) |
| $12,500 to $14,999 | 0 (0.0%) | 2 (8.3%) |
| $15,000 to $17,499 | 0 (0.0%) | 0 (0.0%) |
| $17,500 to $19,999 | 0 (0.0%) | 0 (0.0%) |
| $20,000 to $22,499 | 0 (0.0%) | 0 (0.0%) |
| $22,500 to $24,999 | 0 (0.0%) | 11 (45.8%) |
| $25,000 to $29,999 | 0 (0.0%) | 0 (0.0%) |
| $30,000 to $34,999 | 3 (4.5%) | 0 (0.0%) |
| $35,000 to $39,999 | 0 (0.0%) | 0 (0.0%) |
| $40,000 to $44,999 | 3 (4.5%) | 0 (0.0%) |
| $45,000 to $49,999 | 7 (10.6%) | 0 (0.0%) |
| $50,000 to $54,999 | 0 (0.0%) | 0 (0.0%) |
| $55,000 to $64,999 | 0 (0.0%) | 1 (4.2%) |
| $65,000 to $74,999 | 3 (4.5%) | 0 (0.0%) |
| $75,000 to $99,999 | 0 (0.0%) | 0 (0.0%) |
| $100,000+ | 0 (0.0%) | 0 (0.0%) |
| Total | 66 (100.0%) | 24 (100.0%) |
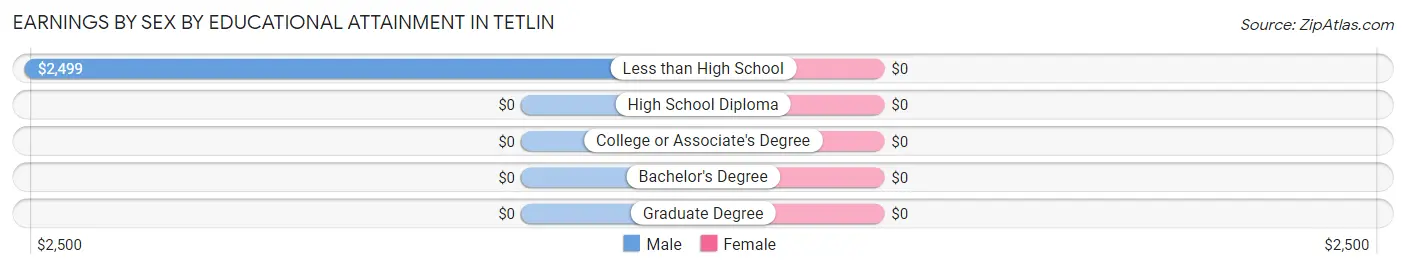
Earnings by Sex by Educational Attainment in Tetlin
| Educational Attainment | Male Income | Female Income |
| Less than High School | $2,499 | $0 |
| High School Diploma | - | - |
| College or Associate's Degree | - | - |
| Bachelor's Degree | - | - |
| Graduate Degree | - | - |
| Total | $8,646 | $11,042 |
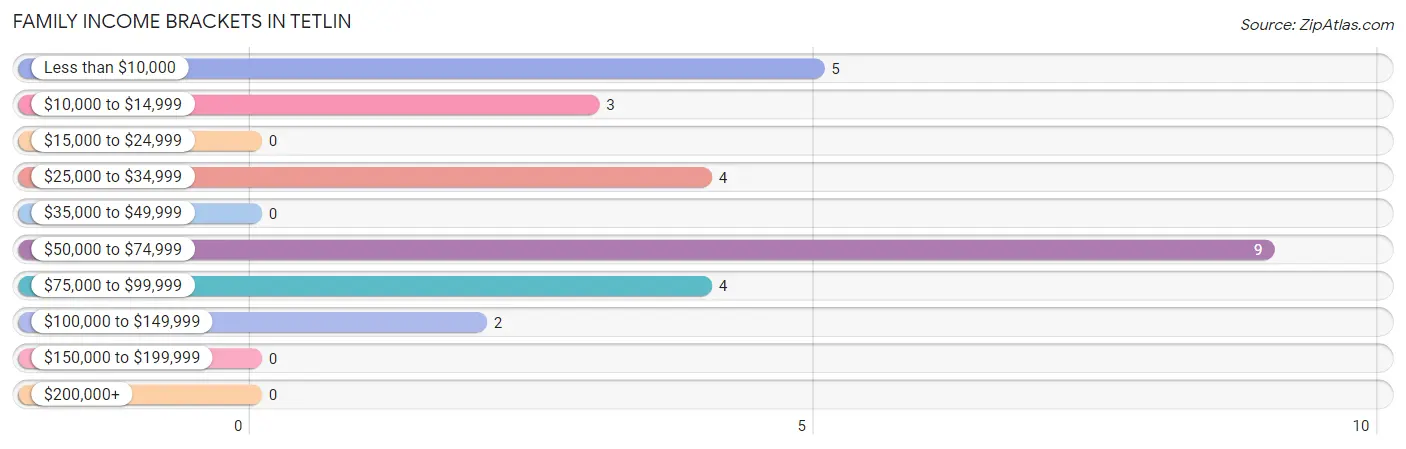
Family Income in Tetlin
Family Income Brackets in Tetlin
According to the Tetlin family income data, there are 9 families falling into the $50,000 to $74,999 income range, which is the most common income bracket and makes up 33.3% of all families.
| Income Bracket | # Families | % Families |
| Less than $10,000 | 5 | 18.5% |
| $10,000 to $14,999 | 3 | 11.1% |
| $15,000 to $24,999 | 0 | 0.0% |
| $25,000 to $34,999 | 4 | 14.8% |
| $35,000 to $49,999 | 0 | 0.0% |
| $50,000 to $74,999 | 9 | 33.3% |
| $75,000 to $99,999 | 4 | 14.8% |
| $100,000 to $149,999 | 2 | 7.4% |
| $150,000 to $199,999 | 0 | 0.0% |
| $200,000+ | 0 | 0.0% |
Family Income by Famaliy Size in Tetlin
2-person families (16 | 59.3%) account for the highest median family income in Tetlin with $71,667 per family, while 2-person families (16 | 59.3%) have the highest median income of $35,834 per family member.
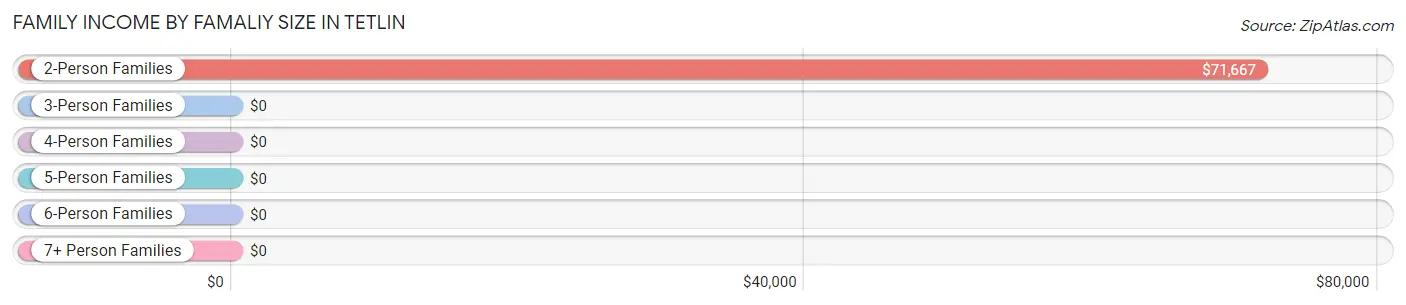
| Income Bracket | # Families | Median Income |
| 2-Person Families | 16 (59.3%) | $71,667 |
| 3-Person Families | 3 (11.1%) | $0 |
| 4-Person Families | 0 (0.0%) | $0 |
| 5-Person Families | 2 (7.4%) | $0 |
| 6-Person Families | 0 (0.0%) | $0 |
| 7+ Person Families | 6 (22.2%) | $0 |
| Total | 27 (100.0%) | $70,625 |
Family Income by Number of Earners in Tetlin
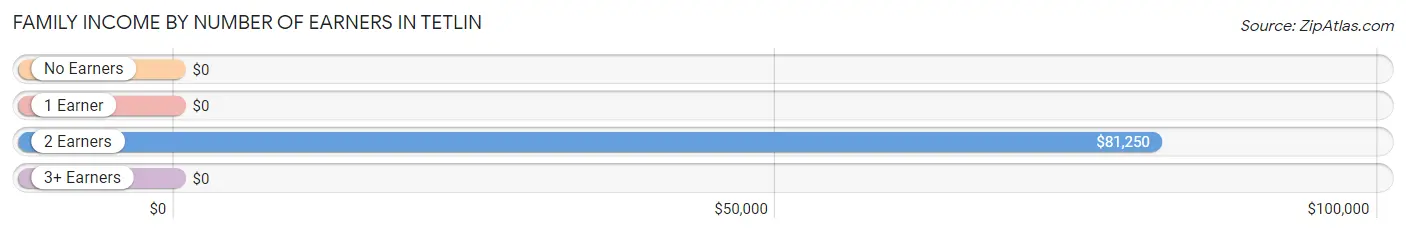
| Number of Earners | # Families | Median Income |
| No Earners | 5 (18.5%) | $0 |
| 1 Earner | 7 (25.9%) | $0 |
| 2 Earners | 12 (44.4%) | $81,250 |
| 3+ Earners | 3 (11.1%) | $0 |
| Total | 27 (100.0%) | $70,625 |
Household Income in Tetlin
Household Income Brackets in Tetlin
With 15 households falling in the category, the less than $10,000 income range is the most frequent in Tetlin, accounting for 28.3% of all households.
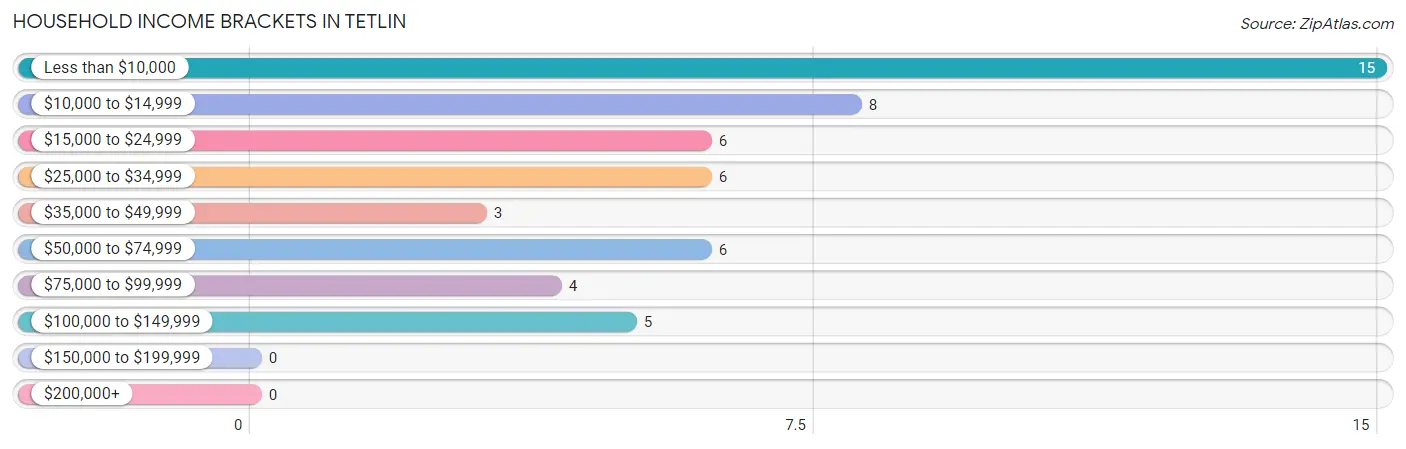
| Income Bracket | # Households | % Households |
| Less than $10,000 | 15 | 28.3% |
| $10,000 to $14,999 | 8 | 15.1% |
| $15,000 to $24,999 | 6 | 11.3% |
| $25,000 to $34,999 | 6 | 11.3% |
| $35,000 to $49,999 | 3 | 5.7% |
| $50,000 to $74,999 | 6 | 11.3% |
| $75,000 to $99,999 | 4 | 7.5% |
| $100,000 to $149,999 | 5 | 9.4% |
| $150,000 to $199,999 | 0 | 0.0% |
| $200,000+ | 0 | 0.0% |
Household Income by Householder Age in Tetlin
The median household income in Tetlin is $20,417, with the highest median household income of $28,000 found in the 65+ years age bracket for the primary householder. A total of 18 households (34.0%) fall into this category.
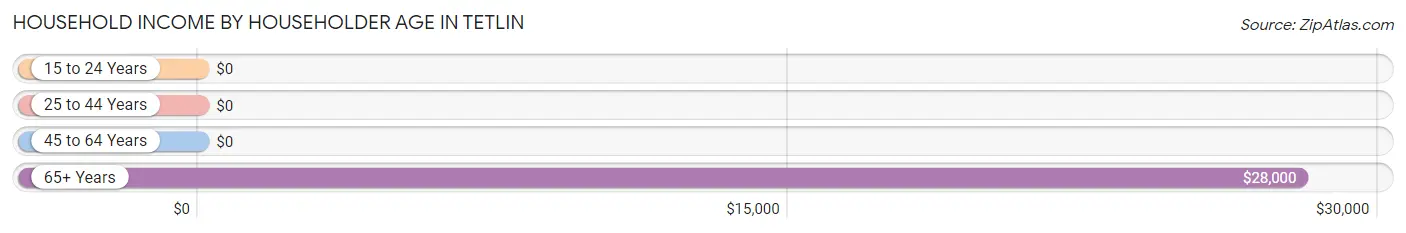
| Income Bracket | # Households | Median Income |
| 15 to 24 Years | 0 (0.0%) | $0 |
| 25 to 44 Years | 10 (18.9%) | $0 |
| 45 to 64 Years | 25 (47.2%) | $0 |
| 65+ Years | 18 (34.0%) | $28,000 |
| Total | 53 (100.0%) | $20,417 |
Poverty in Tetlin
Income Below Poverty by Sex and Age in Tetlin
With 45.4% poverty level for males and 16.4% for females among the residents of Tetlin, 5 year old males and 12 to 14 year old females are the most vulnerable to poverty, with 5 males (100.0%) and 3 females (100.0%) in their respective age groups living below the poverty level.
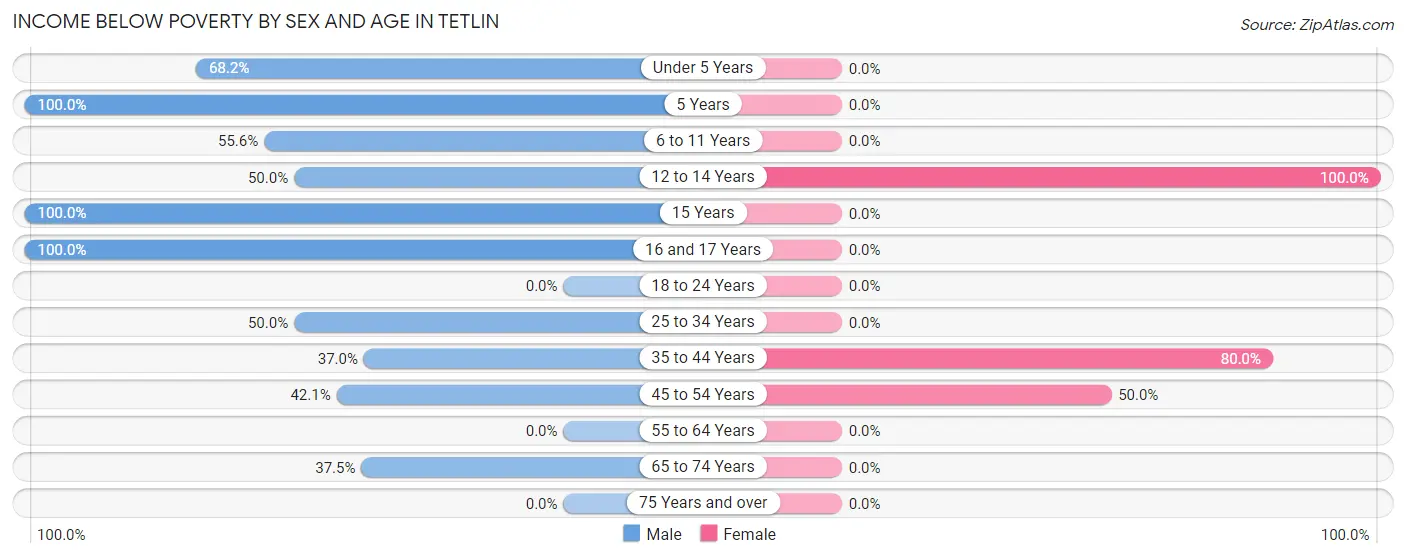
| Age Bracket | Male | Female |
| Under 5 Years | 15 (68.2%) | 0 (0.0%) |
| 5 Years | 5 (100.0%) | 0 (0.0%) |
| 6 to 11 Years | 5 (55.6%) | 0 (0.0%) |
| 12 to 14 Years | 5 (50.0%) | 3 (100.0%) |
| 15 Years | 3 (100.0%) | 0 (0.0%) |
| 16 and 17 Years | 3 (100.0%) | 0 (0.0%) |
| 18 to 24 Years | 0 (0.0%) | 0 (0.0%) |
| 25 to 34 Years | 4 (50.0%) | 0 (0.0%) |
| 35 to 44 Years | 10 (37.0%) | 4 (80.0%) |
| 45 to 54 Years | 8 (42.1%) | 2 (50.0%) |
| 55 to 64 Years | 0 (0.0%) | 0 (0.0%) |
| 65 to 74 Years | 6 (37.5%) | 0 (0.0%) |
| 75 Years and over | 0 (0.0%) | 0 (0.0%) |
| Total | 64 (45.4%) | 9 (16.4%) |
Income Above Poverty by Sex and Age in Tetlin
According to the poverty statistics in Tetlin, males aged 18 to 24 years and females aged under 5 years are the age groups that are most secure financially, with 100.0% of males and 100.0% of females in these age groups living above the poverty line.
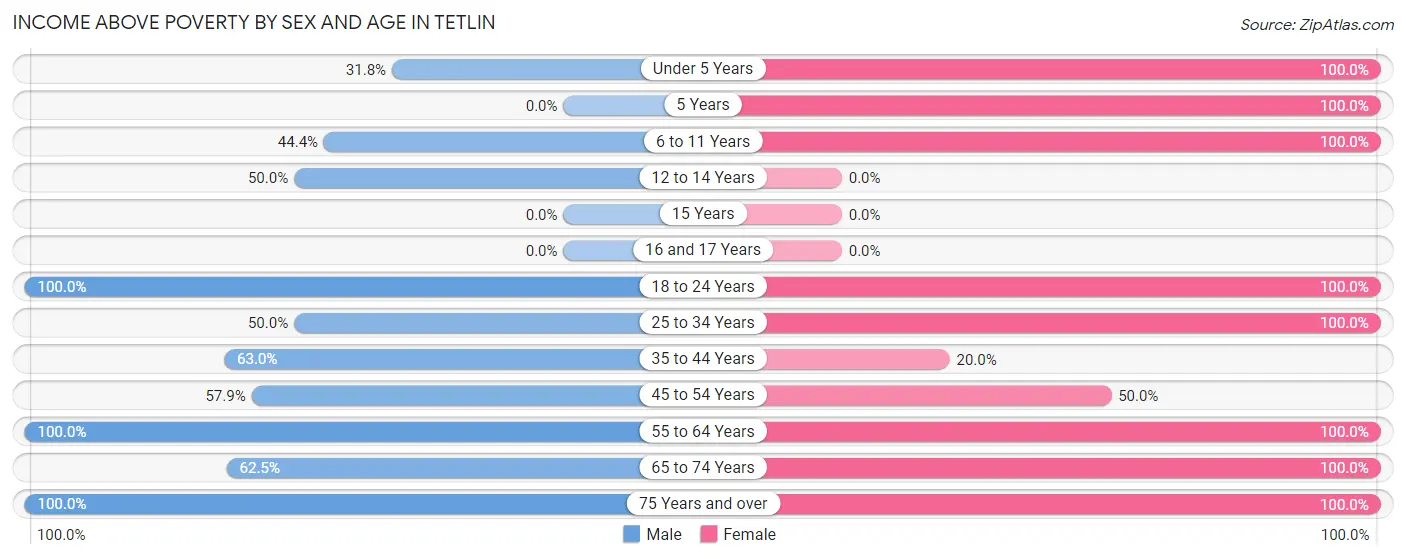
| Age Bracket | Male | Female |
| Under 5 Years | 7 (31.8%) | 7 (100.0%) |
| 5 Years | 0 (0.0%) | 3 (100.0%) |
| 6 to 11 Years | 4 (44.4%) | 8 (100.0%) |
| 12 to 14 Years | 5 (50.0%) | 0 (0.0%) |
| 15 Years | 0 (0.0%) | 0 (0.0%) |
| 16 and 17 Years | 0 (0.0%) | 0 (0.0%) |
| 18 to 24 Years | 9 (100.0%) | 11 (100.0%) |
| 25 to 34 Years | 4 (50.0%) | 6 (100.0%) |
| 35 to 44 Years | 17 (63.0%) | 1 (20.0%) |
| 45 to 54 Years | 11 (57.9%) | 2 (50.0%) |
| 55 to 64 Years | 5 (100.0%) | 4 (100.0%) |
| 65 to 74 Years | 10 (62.5%) | 3 (100.0%) |
| 75 Years and over | 5 (100.0%) | 1 (100.0%) |
| Total | 77 (54.6%) | 46 (83.6%) |
Income Below Poverty Among Married-Couple Families in Tetlin
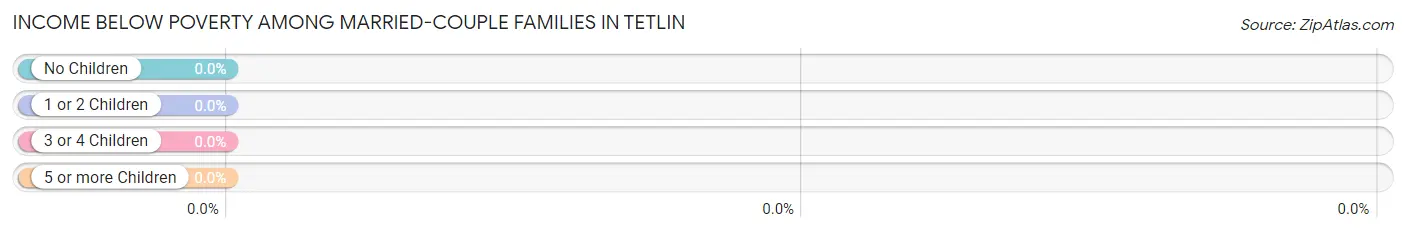
| Children | Above Poverty | Below Poverty |
| No Children | 5 (100.0%) | 0 (0.0%) |
| 1 or 2 Children | 2 (100.0%) | 0 (0.0%) |
| 3 or 4 Children | 0 (0.0%) | 0 (0.0%) |
| 5 or more Children | 3 (100.0%) | 0 (0.0%) |
| Total | 10 (100.0%) | 0 (0.0%) |
Income Below Poverty Among Single-Parent Households in Tetlin
According to the poverty data in Tetlin, 40.0% or 6 single-father households and 100.0% or 2 single-mother households are living below the poverty line. Among single-father households, those with 5 or more children have the highest poverty rate, with 3 households (100.0%) experiencing poverty. Likewise, among single-mother households, those with 1 or 2 children have the highest poverty rate, with 2 households (100.0%) falling below the poverty line.
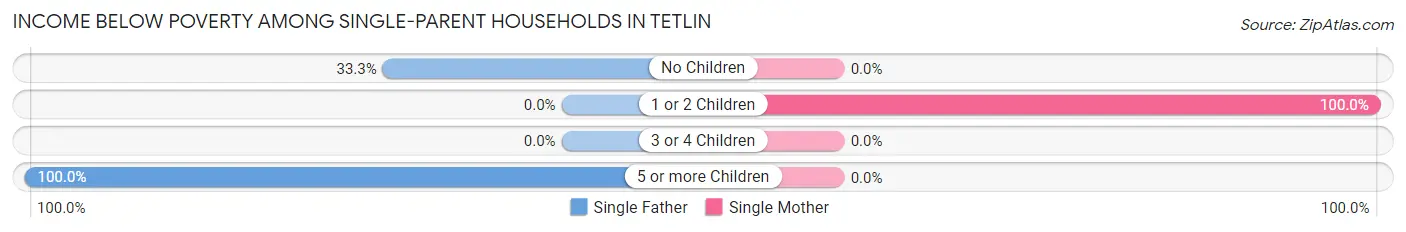
| Children | Single Father | Single Mother |
| No Children | 3 (33.3%) | 0 (0.0%) |
| 1 or 2 Children | 0 (0.0%) | 2 (100.0%) |
| 3 or 4 Children | 0 (0.0%) | 0 (0.0%) |
| 5 or more Children | 3 (100.0%) | 0 (0.0%) |
| Total | 6 (40.0%) | 2 (100.0%) |
Income Below Poverty Among Married-Couple vs Single-Parent Households in Tetlin
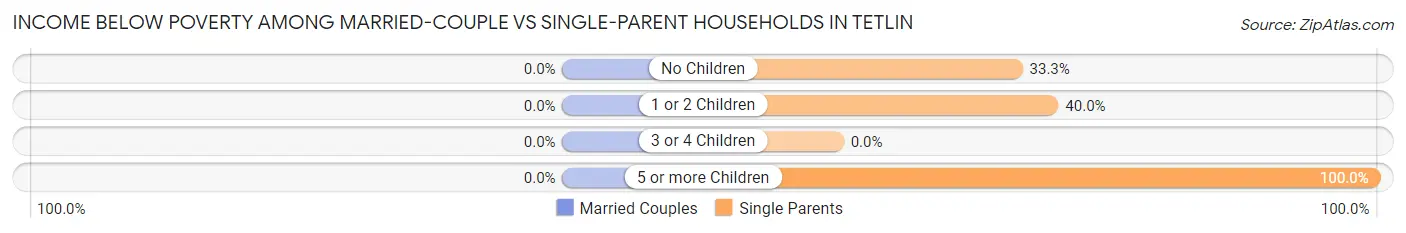
| Children | Married-Couple Families | Single-Parent Households |
| No Children | 0 (0.0%) | 3 (33.3%) |
| 1 or 2 Children | 0 (0.0%) | 2 (40.0%) |
| 3 or 4 Children | 0 (0.0%) | 0 (0.0%) |
| 5 or more Children | 0 (0.0%) | 3 (100.0%) |
| Total | 0 (0.0%) | 8 (47.1%) |
Race in Tetlin
The most populous races in Tetlin are , and Native / Alaskan (201 | 100.0%).
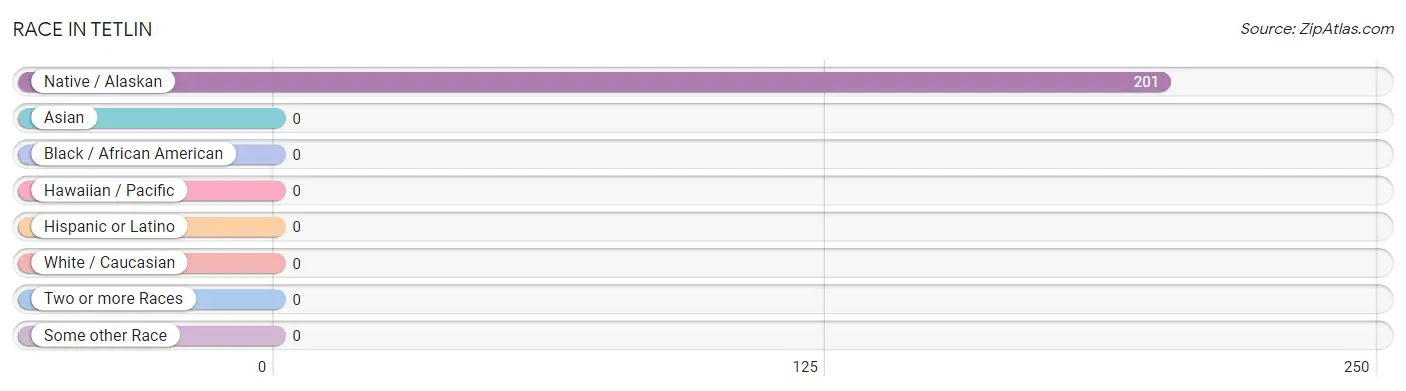
| Race | # Population | % Population |
| Asian | 0 | 0.0% |
| Black / African American | 0 | 0.0% |
| Hawaiian / Pacific | 0 | 0.0% |
| Hispanic or Latino | 0 | 0.0% |
| Native / Alaskan | 201 | 100.0% |
| White / Caucasian | 0 | 0.0% |
| Two or more Races | 0 | 0.0% |
| Some other Race | 0 | 0.0% |
| Total | 201 | 100.0% |
Ancestry in Tetlin
The most populous ancestries reported in Tetlin are Alaskan Athabascan (199 | 99.0%), Norwegian (9 | 4.5%), and Inupiat (2 | 1.0%), together accounting for 104.5% of all Tetlin residents.
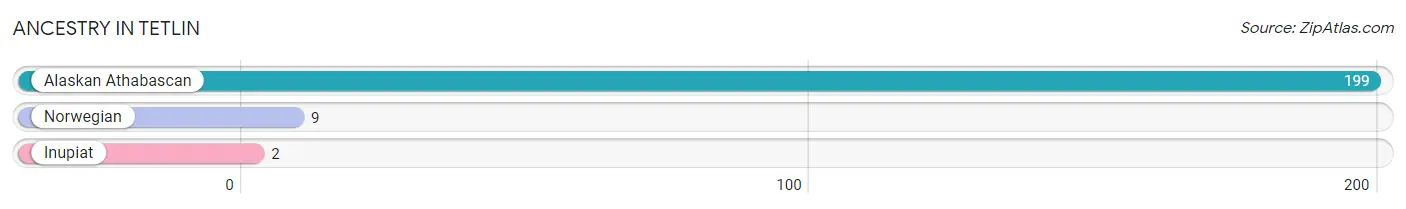
| Ancestry | # Population | % Population |
| Alaskan Athabascan | 199 | 99.0% |
| Inupiat | 2 | 1.0% |
| Norwegian | 9 | 4.5% | View All 3 Rows |
Immigrants in Tetlin
The most numerous immigrant groups reported in Tetlin came from , and Canada (9 | 4.5%), together accounting for 4.5% of all Tetlin residents.

| Immigration Origin | # Population | % Population |
| Canada | 9 | 4.5% | View All 1 Rows |
Sex and Age in Tetlin
Sex and Age in Tetlin
The most populous age groups in Tetlin are 40 to 44 Years (27 | 18.5%) for men and 20 to 24 Years (11 | 20.0%) for women.
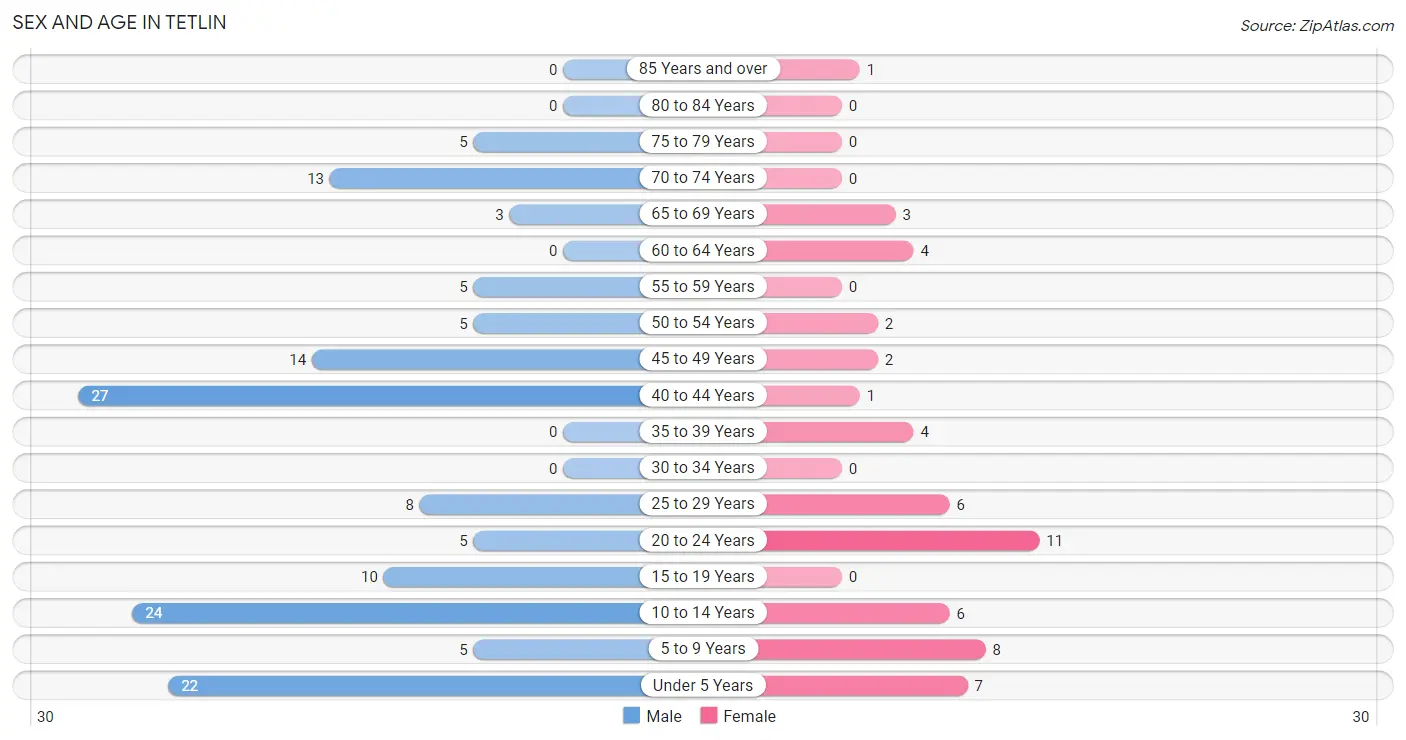
| Age Bracket | Male | Female |
| Under 5 Years | 22 (15.1%) | 7 (12.7%) |
| 5 to 9 Years | 5 (3.4%) | 8 (14.5%) |
| 10 to 14 Years | 24 (16.4%) | 6 (10.9%) |
| 15 to 19 Years | 10 (6.9%) | 0 (0.0%) |
| 20 to 24 Years | 5 (3.4%) | 11 (20.0%) |
| 25 to 29 Years | 8 (5.5%) | 6 (10.9%) |
| 30 to 34 Years | 0 (0.0%) | 0 (0.0%) |
| 35 to 39 Years | 0 (0.0%) | 4 (7.3%) |
| 40 to 44 Years | 27 (18.5%) | 1 (1.8%) |
| 45 to 49 Years | 14 (9.6%) | 2 (3.6%) |
| 50 to 54 Years | 5 (3.4%) | 2 (3.6%) |
| 55 to 59 Years | 5 (3.4%) | 0 (0.0%) |
| 60 to 64 Years | 0 (0.0%) | 4 (7.3%) |
| 65 to 69 Years | 3 (2.1%) | 3 (5.4%) |
| 70 to 74 Years | 13 (8.9%) | 0 (0.0%) |
| 75 to 79 Years | 5 (3.4%) | 0 (0.0%) |
| 80 to 84 Years | 0 (0.0%) | 0 (0.0%) |
| 85 Years and over | 0 (0.0%) | 1 (1.8%) |
| Total | 146 (100.0%) | 55 (100.0%) |
Families and Households in Tetlin
Median Family Size in Tetlin
The median family size in Tetlin is 6.00 persons per family, with married-couple families (10 | 37.0%) accounting for the largest median family size of 9 persons per family. On the other hand, single female/mother families (2 | 7.4%) represent the smallest median family size with 3.50 persons per family.
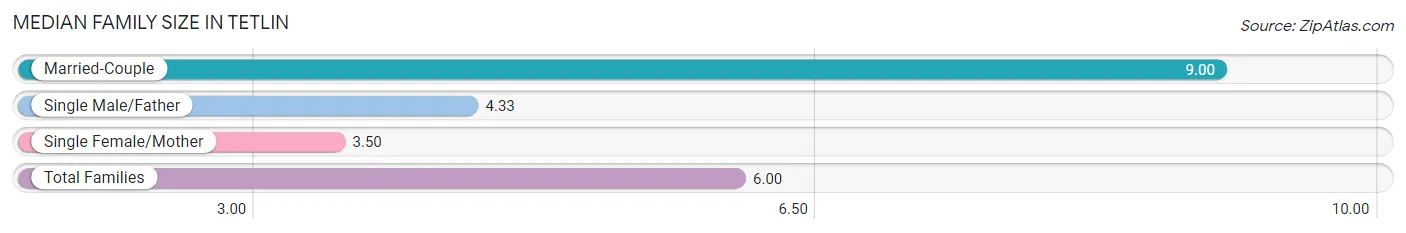
| Family Type | # Families | Family Size |
| Married-Couple | 10 (37.0%) | 9.00 |
| Single Male/Father | 15 (55.6%) | 4.33 |
| Single Female/Mother | 2 (7.4%) | 3.50 |
| Total Families | 27 (100.0%) | 6.00 |
Median Household Size in Tetlin
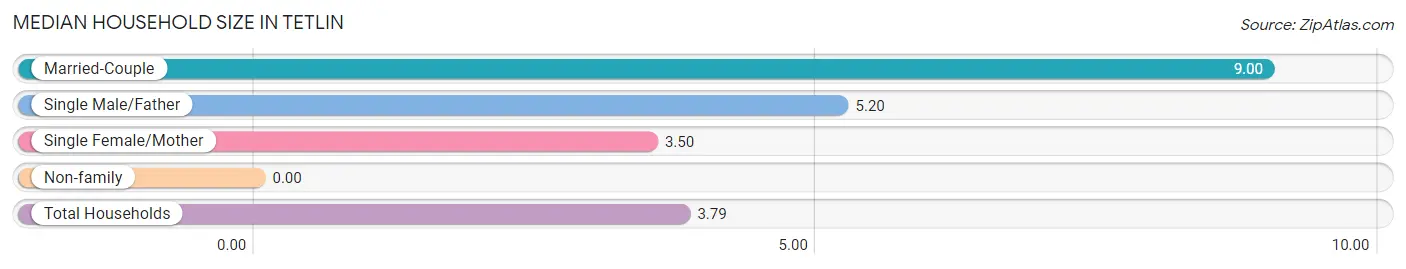
| Household Type | # Households | Household Size |
| Married-Couple | 10 (18.9%) | 9.00 |
| Single Male/Father | 15 (28.3%) | 5.20 |
| Single Female/Mother | 2 (3.8%) | 3.50 |
| Non-family | 26 (49.1%) | - |
| Total Households | 53 (100.0%) | 3.79 |
Household Size by Marriage Status in Tetlin
Out of a total of 53 households in Tetlin, 27 (50.9%) are family households, while 26 (49.1%) are nonfamily households. The most numerous type of family households are 2-person households, comprising 13, and the most common type of nonfamily households are 1-person households, comprising 26.
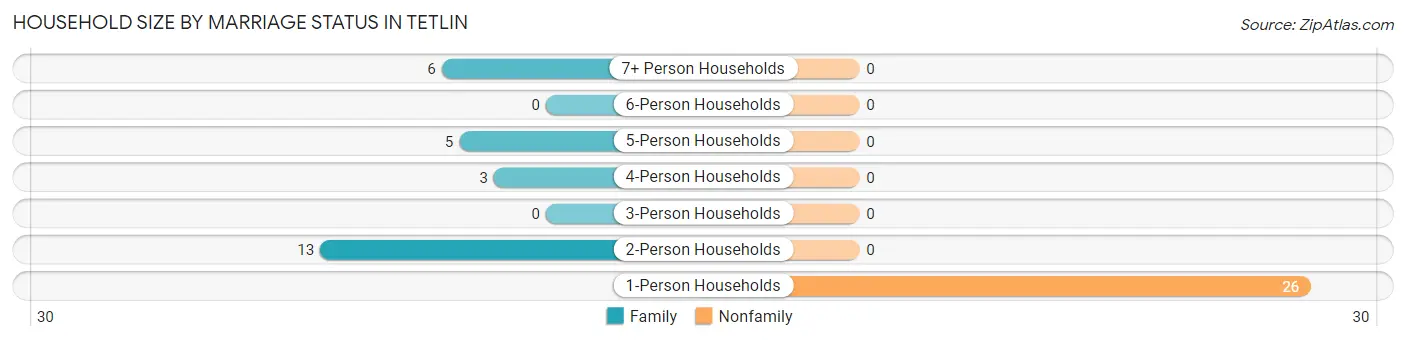
| Household Size | Family Households | Nonfamily Households |
| 1-Person Households | - | 26 (49.1%) |
| 2-Person Households | 13 (24.5%) | 0 (0.0%) |
| 3-Person Households | 0 (0.0%) | 0 (0.0%) |
| 4-Person Households | 3 (5.7%) | 0 (0.0%) |
| 5-Person Households | 5 (9.4%) | 0 (0.0%) |
| 6-Person Households | 0 (0.0%) | 0 (0.0%) |
| 7+ Person Households | 6 (11.3%) | 0 (0.0%) |
| Total | 27 (50.9%) | 26 (49.1%) |
Female Fertility in Tetlin
Fertility by Age in Tetlin
Average fertility rate in Tetlin is 83.0 births per 1,000 women. Women in the age bracket of 35 to 50 years have the highest fertility rate with 286.0 births per 1,000 women. Women in the age bracket of 35 to 50 years acount for 100.0% of all women with births.
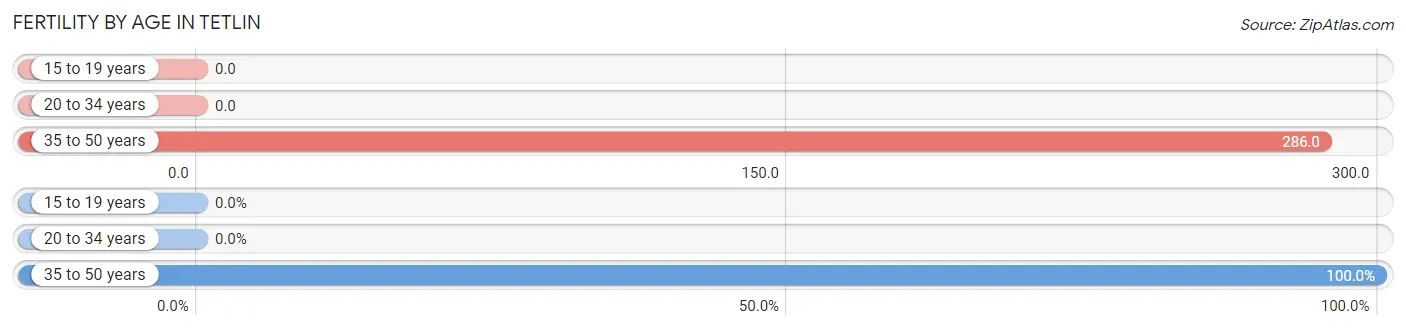
| Age Bracket | Women with Births | Births / 1,000 Women |
| 15 to 19 years | 0 (0.0%) | 0.0 |
| 20 to 34 years | 0 (0.0%) | 0.0 |
| 35 to 50 years | 2 (100.0%) | 286.0 |
| Total | 2 (100.0%) | 83.0 |
Fertility by Age by Marriage Status in Tetlin
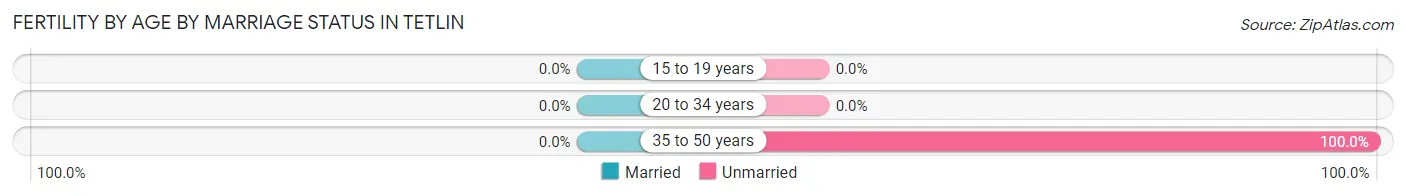
| Age Bracket | Married | Unmarried |
| 15 to 19 years | 0 (0.0%) | 0 (0.0%) |
| 20 to 34 years | 0 (0.0%) | 0 (0.0%) |
| 35 to 50 years | 0 (0.0%) | 2 (100.0%) |
| Total | 0 (0.0%) | 2 (100.0%) |
Fertility by Education in Tetlin
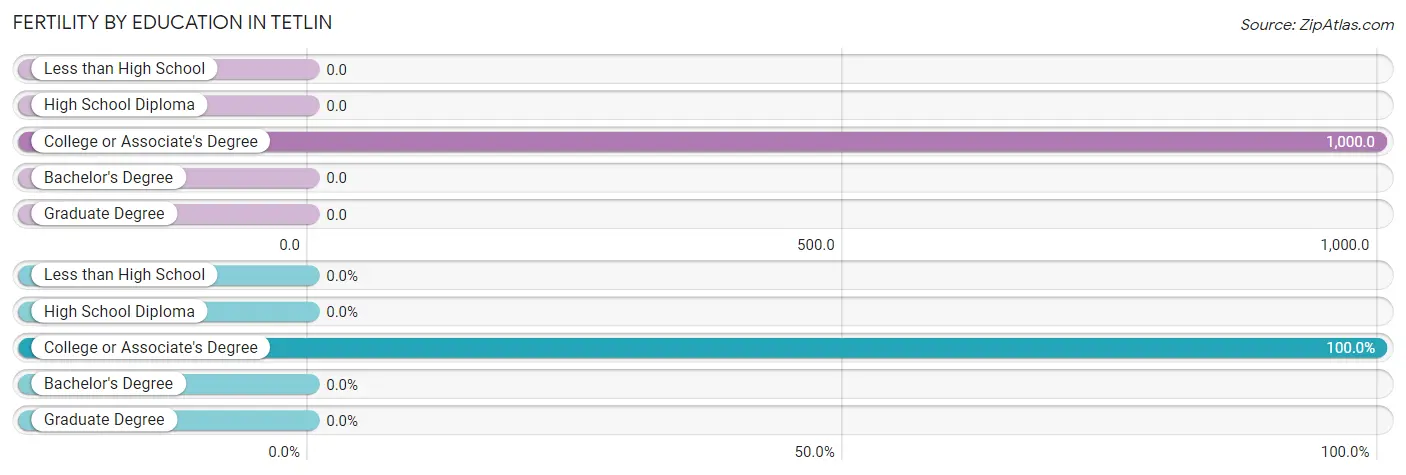
| Educational Attainment | Women with Births | Births / 1,000 Women |
| Less than High School | 0 (0.0%) | 0.0 |
| High School Diploma | 0 (0.0%) | 0.0 |
| College or Associate's Degree | 2 (100.0%) | 1,000.0 |
| Bachelor's Degree | 0 (0.0%) | 0.0 |
| Graduate Degree | 0 (0.0%) | 0.0 |
| Total | 2 (100.0%) | 83.0 |
Fertility by Education by Marriage Status in Tetlin
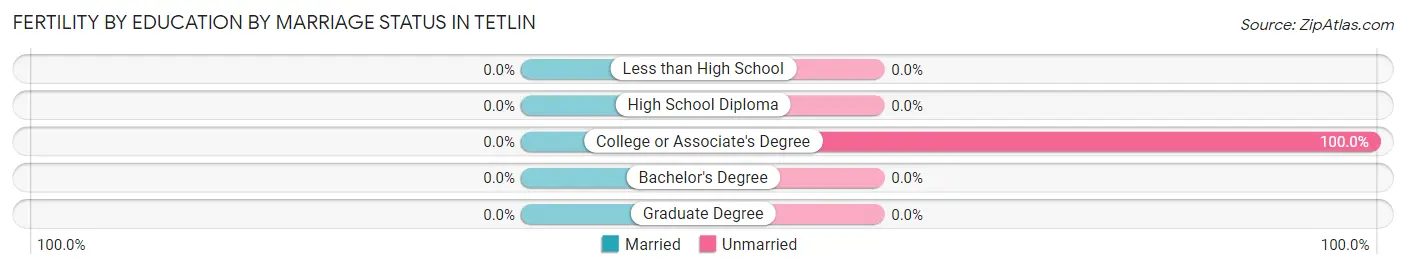
| Educational Attainment | Married | Unmarried |
| Less than High School | 0 (0.0%) | 0 (0.0%) |
| High School Diploma | 0 (0.0%) | 0 (0.0%) |
| College or Associate's Degree | 0 (0.0%) | 2 (100.0%) |
| Bachelor's Degree | 0 (0.0%) | 0 (0.0%) |
| Graduate Degree | 0 (0.0%) | 0 (0.0%) |
| Total | 0 (0.0%) | 2 (100.0%) |
Employment Characteristics in Tetlin
Employment by Class of Employer in Tetlin
Among the 35 employed individuals in Tetlin, local government employees (23 | 65.7%), state government employees (9 | 25.7%), and private company employees (3 | 8.6%) make up the most common classes of employment.
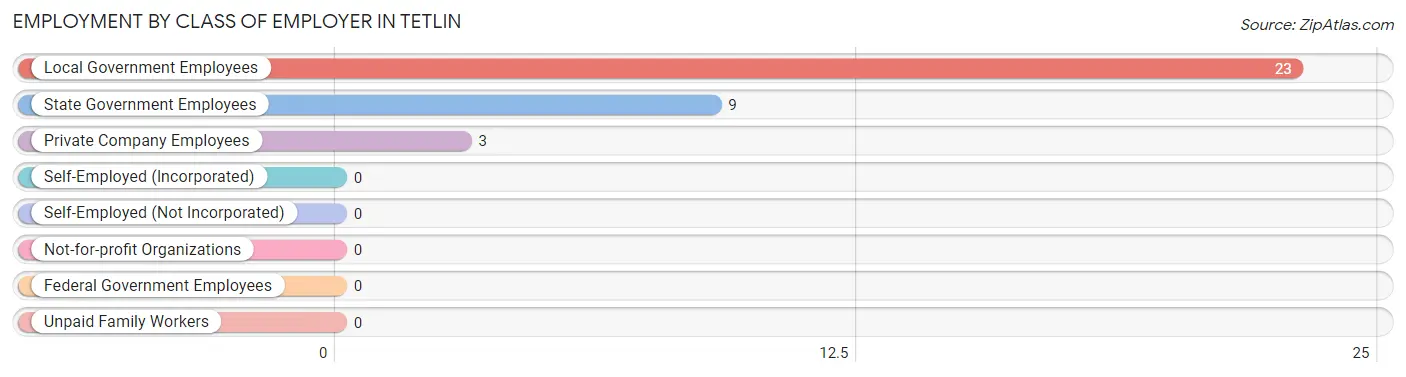
| Employer Class | # Employees | % Employees |
| Private Company Employees | 3 | 8.6% |
| Self-Employed (Incorporated) | 0 | 0.0% |
| Self-Employed (Not Incorporated) | 0 | 0.0% |
| Not-for-profit Organizations | 0 | 0.0% |
| Local Government Employees | 23 | 65.7% |
| State Government Employees | 9 | 25.7% |
| Federal Government Employees | 0 | 0.0% |
| Unpaid Family Workers | 0 | 0.0% |
| Total | 35 | 100.0% |
Employment Status by Age in Tetlin
According to the labor force statistics for Tetlin, out of the total population over 16 years of age (126), 40.5% or 51 individuals are in the labor force, with 23.5% or 12 of them unemployed. The age group with the highest labor force participation rate is 55 to 59 years, with 100.0% or 5 individuals in the labor force. Within the labor force, the 35 to 44 years age range has the highest percentage of unemployed individuals, with 90.9% or 10 of them being unemployed.
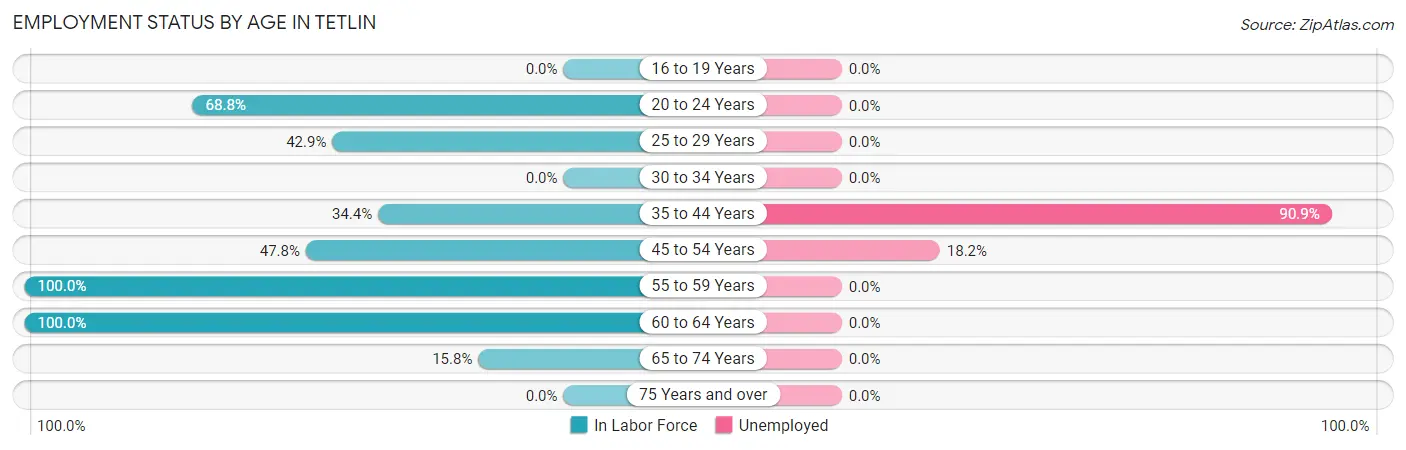
| Age Bracket | In Labor Force | Unemployed |
| 16 to 19 Years | 0 (0.0%) | 0 (0.0%) |
| 20 to 24 Years | 11 (68.8%) | 0 (0.0%) |
| 25 to 29 Years | 6 (42.9%) | 0 (0.0%) |
| 30 to 34 Years | 0 (0.0%) | 0 (0.0%) |
| 35 to 44 Years | 11 (34.4%) | 10 (90.9%) |
| 45 to 54 Years | 11 (47.8%) | 2 (18.2%) |
| 55 to 59 Years | 5 (100.0%) | 0 (0.0%) |
| 60 to 64 Years | 4 (100.0%) | 0 (0.0%) |
| 65 to 74 Years | 3 (15.8%) | 0 (0.0%) |
| 75 Years and over | 0 (0.0%) | 0 (0.0%) |
| Total | 51 (40.5%) | 12 (23.5%) |
Employment Status by Educational Attainment in Tetlin
According to labor force statistics for Tetlin, 47.4% of individuals (37) out of the total population between 25 and 64 years of age (78) are in the labor force, with 32.4% or 12 of them being unemployed. The group with the highest labor force participation rate are those with the educational attainment of college / associate degree, with 66.7% or 8 individuals in the labor force. Within the labor force, individuals with high school diploma education have the highest percentage of unemployment, with 48.0% or 12 of them being unemployed.
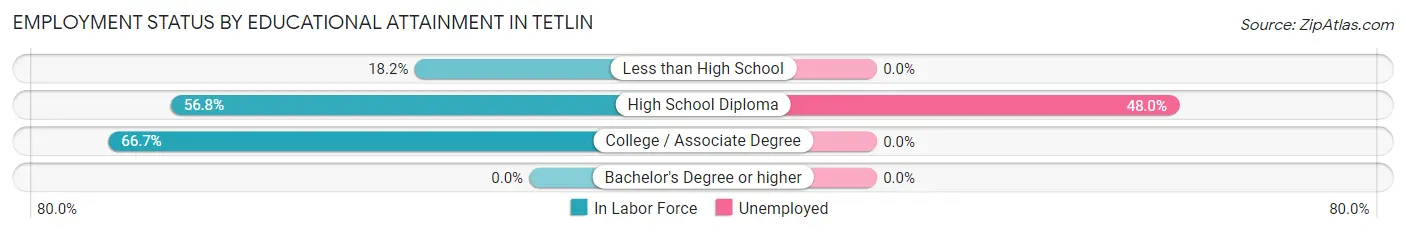
| Educational Attainment | In Labor Force | Unemployed |
| Less than High School | 4 (18.2%) | 0 (0.0%) |
| High School Diploma | 25 (56.8%) | 21 (48.0%) |
| College / Associate Degree | 8 (66.7%) | 0 (0.0%) |
| Bachelor's Degree or higher | 0 (0.0%) | 0 (0.0%) |
| Total | 37 (47.4%) | 25 (32.4%) |
Employment Occupations by Sex in Tetlin
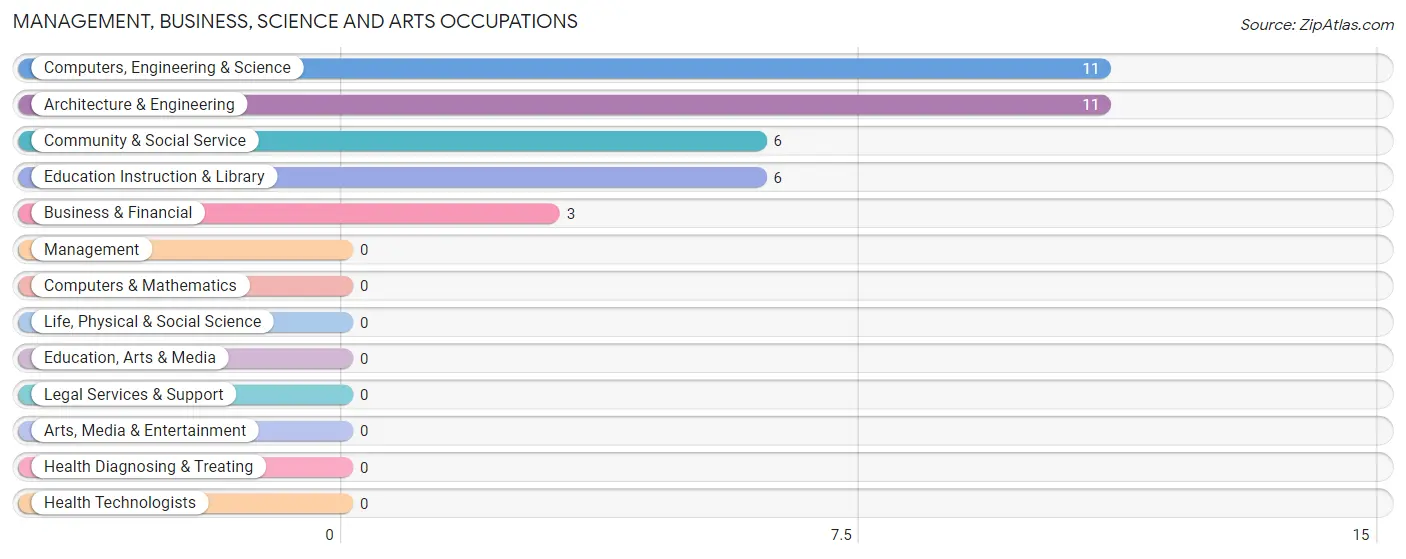
Management, Business, Science and Arts Occupations
The most common Management, Business, Science and Arts occupations in Tetlin are Computers, Engineering & Science (11 | 28.2%), Architecture & Engineering (11 | 28.2%), Community & Social Service (6 | 15.4%), Education Instruction & Library (6 | 15.4%), and Business & Financial (3 | 7.7%).
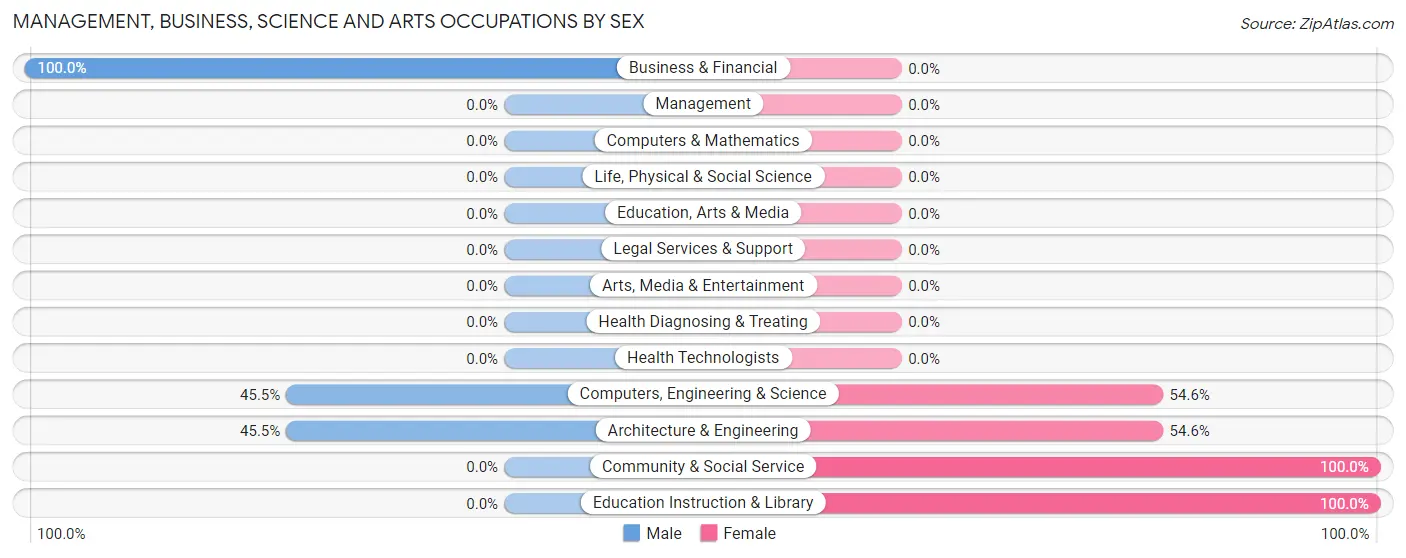
Management, Business, Science and Arts Occupations by Sex
Within the Management, Business, Science and Arts occupations in Tetlin, the most male-oriented occupations are Business & Financial (100.0%), Computers, Engineering & Science (45.5%), and Architecture & Engineering (45.5%), while the most female-oriented occupations are Community & Social Service (100.0%), Education Instruction & Library (100.0%), and Computers, Engineering & Science (54.5%).
| Occupation | Male | Female |
| Management | 0 (0.0%) | 0 (0.0%) |
| Business & Financial | 3 (100.0%) | 0 (0.0%) |
| Computers, Engineering & Science | 5 (45.5%) | 6 (54.5%) |
| Computers & Mathematics | 0 (0.0%) | 0 (0.0%) |
| Architecture & Engineering | 5 (45.5%) | 6 (54.5%) |
| Life, Physical & Social Science | 0 (0.0%) | 0 (0.0%) |
| Community & Social Service | 0 (0.0%) | 6 (100.0%) |
| Education, Arts & Media | 0 (0.0%) | 0 (0.0%) |
| Legal Services & Support | 0 (0.0%) | 0 (0.0%) |
| Education Instruction & Library | 0 (0.0%) | 6 (100.0%) |
| Arts, Media & Entertainment | 0 (0.0%) | 0 (0.0%) |
| Health Diagnosing & Treating | 0 (0.0%) | 0 (0.0%) |
| Health Technologists | 0 (0.0%) | 0 (0.0%) |
| Total (Category) | 8 (40.0%) | 12 (60.0%) |
| Total (Overall) | 17 (43.6%) | 22 (56.4%) |
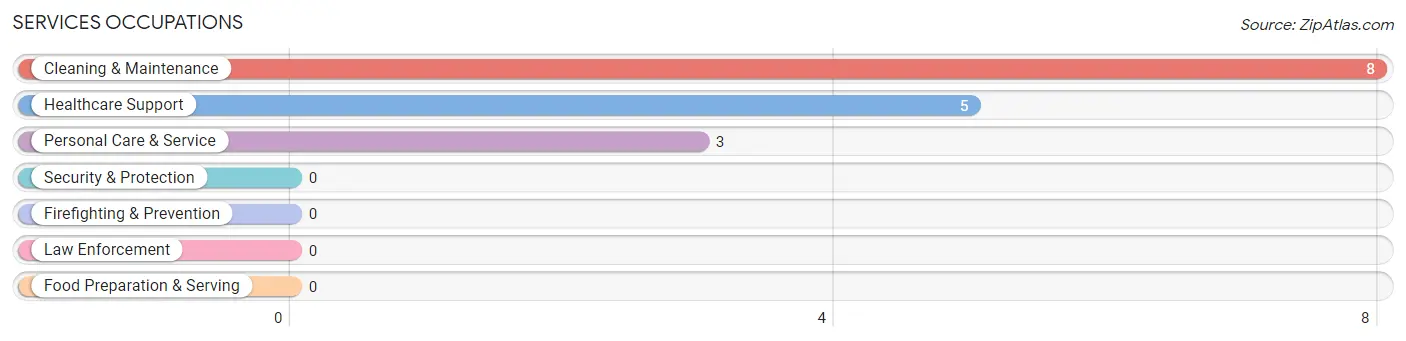
Services Occupations
The most common Services occupations in Tetlin are Cleaning & Maintenance (8 | 20.5%), Healthcare Support (5 | 12.8%), and Personal Care & Service (3 | 7.7%).
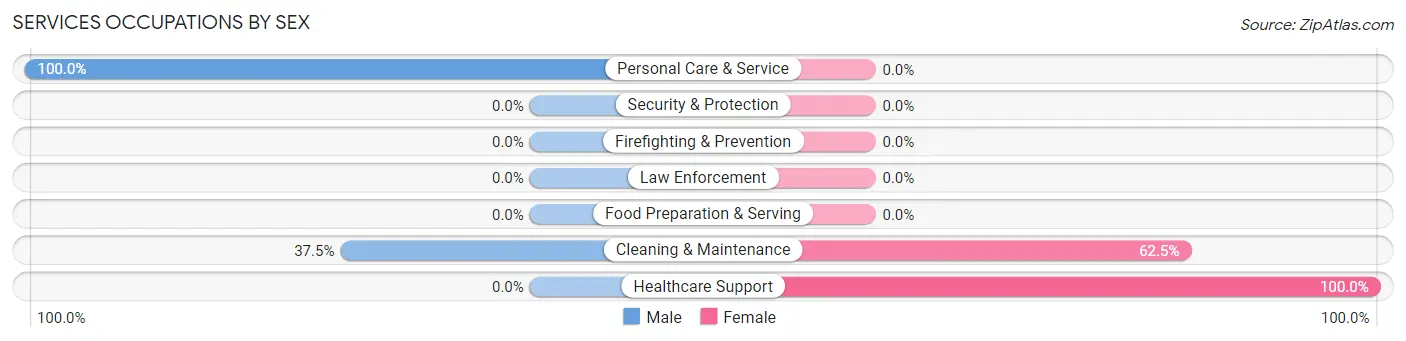
Services Occupations by Sex
Within the Services occupations in Tetlin, the most male-oriented occupations are Personal Care & Service (100.0%), and Cleaning & Maintenance (37.5%), while the most female-oriented occupations are Healthcare Support (100.0%), and Cleaning & Maintenance (62.5%).
| Occupation | Male | Female |
| Healthcare Support | 0 (0.0%) | 5 (100.0%) |
| Security & Protection | 0 (0.0%) | 0 (0.0%) |
| Firefighting & Prevention | 0 (0.0%) | 0 (0.0%) |
| Law Enforcement | 0 (0.0%) | 0 (0.0%) |
| Food Preparation & Serving | 0 (0.0%) | 0 (0.0%) |
| Cleaning & Maintenance | 3 (37.5%) | 5 (62.5%) |
| Personal Care & Service | 3 (100.0%) | 0 (0.0%) |
| Total (Category) | 6 (37.5%) | 10 (62.5%) |
| Total (Overall) | 17 (43.6%) | 22 (56.4%) |
Sales and Office Occupations
Sales and Office Occupations by Sex
| Occupation | Male | Female |
| Sales & Related | 0 (0.0%) | 0 (0.0%) |
| Office & Administration | 0 (0.0%) | 0 (0.0%) |
| Total (Category) | 0 (0.0%) | 0 (0.0%) |
| Total (Overall) | 17 (43.6%) | 22 (56.4%) |
Natural Resources, Construction and Maintenance Occupations
Natural Resources, Construction and Maintenance Occupations by Sex
| Occupation | Male | Female |
| Farming, Fishing & Forestry | 0 (0.0%) | 0 (0.0%) |
| Construction & Extraction | 0 (0.0%) | 0 (0.0%) |
| Installation, Maintenance & Repair | 0 (0.0%) | 0 (0.0%) |
| Total (Category) | 0 (0.0%) | 0 (0.0%) |
| Total (Overall) | 17 (43.6%) | 22 (56.4%) |
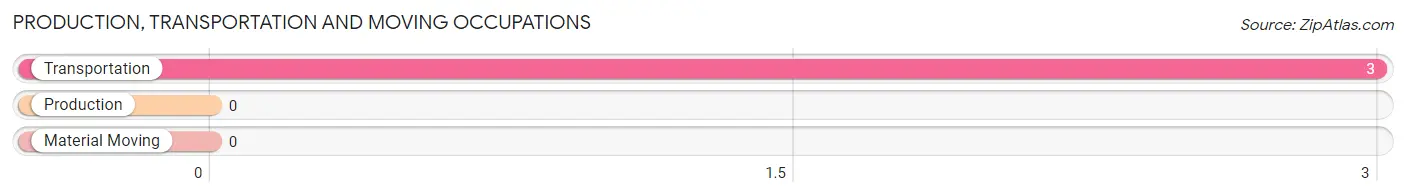
Production, Transportation and Moving Occupations
The most common Production, Transportation and Moving occupations in Tetlin are , and Transportation (3 | 7.7%).
Production, Transportation and Moving Occupations by Sex
| Occupation | Male | Female |
| Production | 0 (0.0%) | 0 (0.0%) |
| Transportation | 3 (100.0%) | 0 (0.0%) |
| Material Moving | 0 (0.0%) | 0 (0.0%) |
| Total (Category) | 3 (100.0%) | 0 (0.0%) |
| Total (Overall) | 17 (43.6%) | 22 (56.4%) |
Employment Industries by Sex in Tetlin
Employment Industries in Tetlin
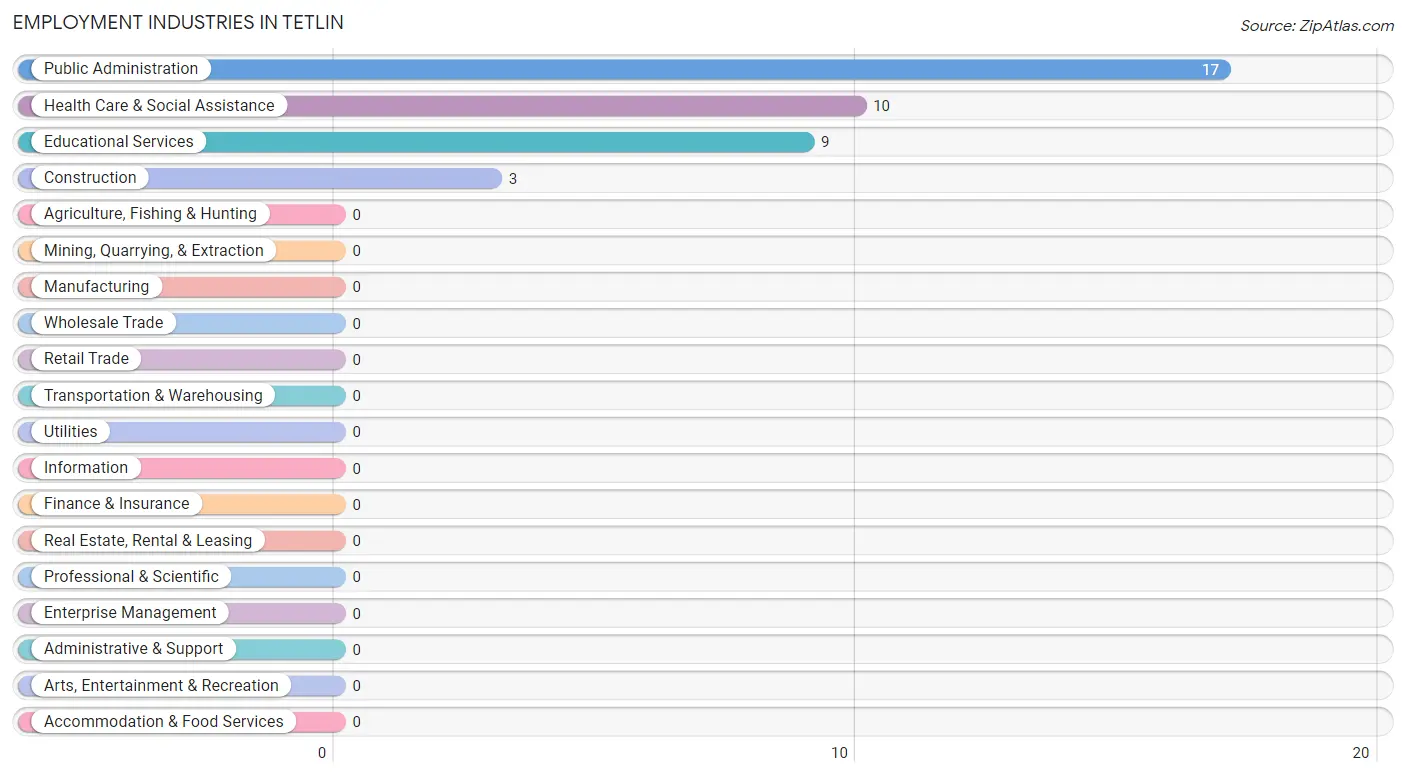
The major employment industries in Tetlin include Public Administration (17 | 43.6%), Health Care & Social Assistance (10 | 25.6%), Educational Services (9 | 23.1%), and Construction (3 | 7.7%).
Employment Industries by Sex in Tetlin
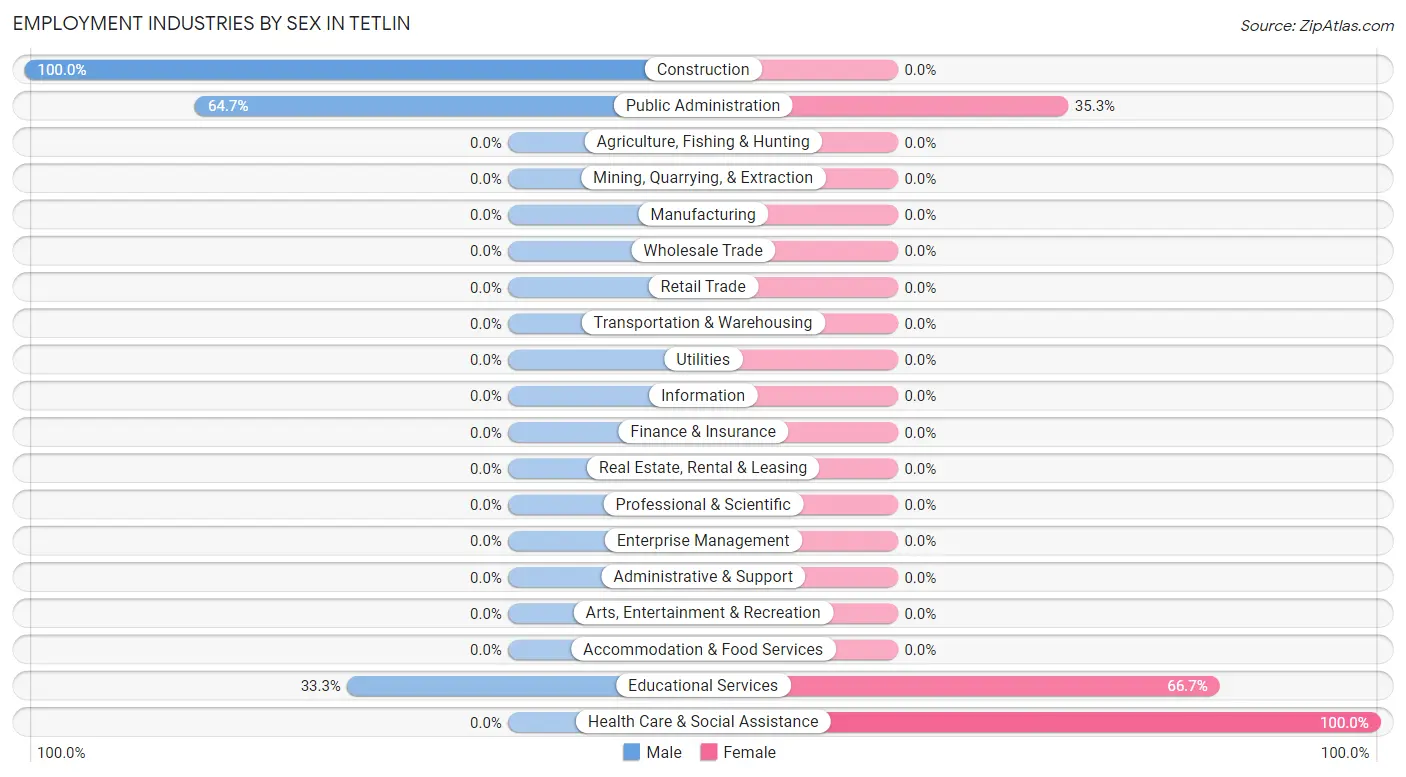
The Tetlin industries that see more men than women are Construction (100.0%), Public Administration (64.7%), and Educational Services (33.3%), whereas the industries that tend to have a higher number of women are Health Care & Social Assistance (100.0%), Educational Services (66.7%), and Public Administration (35.3%).
| Industry | Male | Female |
| Agriculture, Fishing & Hunting | 0 (0.0%) | 0 (0.0%) |
| Mining, Quarrying, & Extraction | 0 (0.0%) | 0 (0.0%) |
| Construction | 3 (100.0%) | 0 (0.0%) |
| Manufacturing | 0 (0.0%) | 0 (0.0%) |
| Wholesale Trade | 0 (0.0%) | 0 (0.0%) |
| Retail Trade | 0 (0.0%) | 0 (0.0%) |
| Transportation & Warehousing | 0 (0.0%) | 0 (0.0%) |
| Utilities | 0 (0.0%) | 0 (0.0%) |
| Information | 0 (0.0%) | 0 (0.0%) |
| Finance & Insurance | 0 (0.0%) | 0 (0.0%) |
| Real Estate, Rental & Leasing | 0 (0.0%) | 0 (0.0%) |
| Professional & Scientific | 0 (0.0%) | 0 (0.0%) |
| Enterprise Management | 0 (0.0%) | 0 (0.0%) |
| Administrative & Support | 0 (0.0%) | 0 (0.0%) |
| Educational Services | 3 (33.3%) | 6 (66.7%) |
| Health Care & Social Assistance | 0 (0.0%) | 10 (100.0%) |
| Arts, Entertainment & Recreation | 0 (0.0%) | 0 (0.0%) |
| Accommodation & Food Services | 0 (0.0%) | 0 (0.0%) |
| Public Administration | 11 (64.7%) | 6 (35.3%) |
| Total | 17 (43.6%) | 22 (56.4%) |
Education in Tetlin
School Enrollment in Tetlin
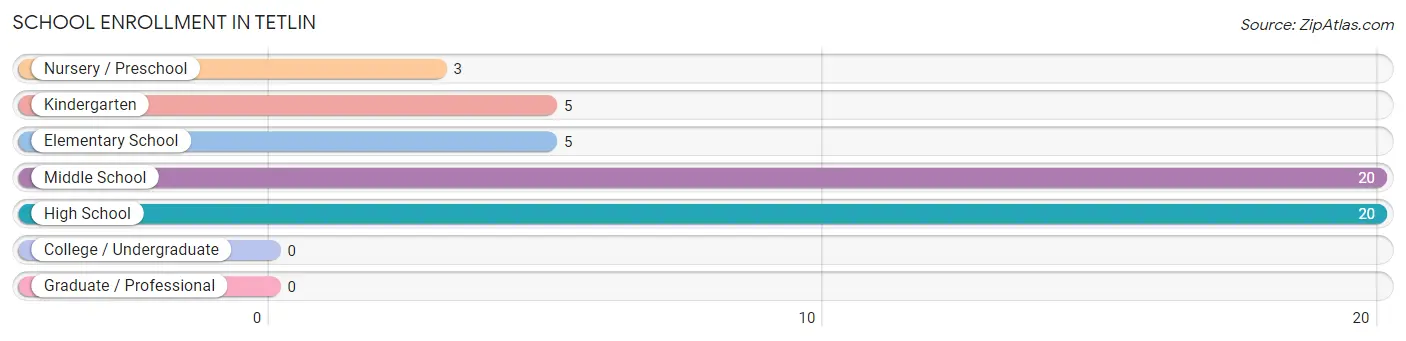
The most common levels of schooling among the 53 students in Tetlin are middle school (20 | 37.7%), high school (20 | 37.7%), and kindergarten (5 | 9.4%).
| School Level | # Students | % Students |
| Nursery / Preschool | 3 | 5.7% |
| Kindergarten | 5 | 9.4% |
| Elementary School | 5 | 9.4% |
| Middle School | 20 | 37.7% |
| High School | 20 | 37.7% |
| College / Undergraduate | 0 | 0.0% |
| Graduate / Professional | 0 | 0.0% |
| Total | 53 | 100.0% |
School Enrollment by Age by Funding Source in Tetlin
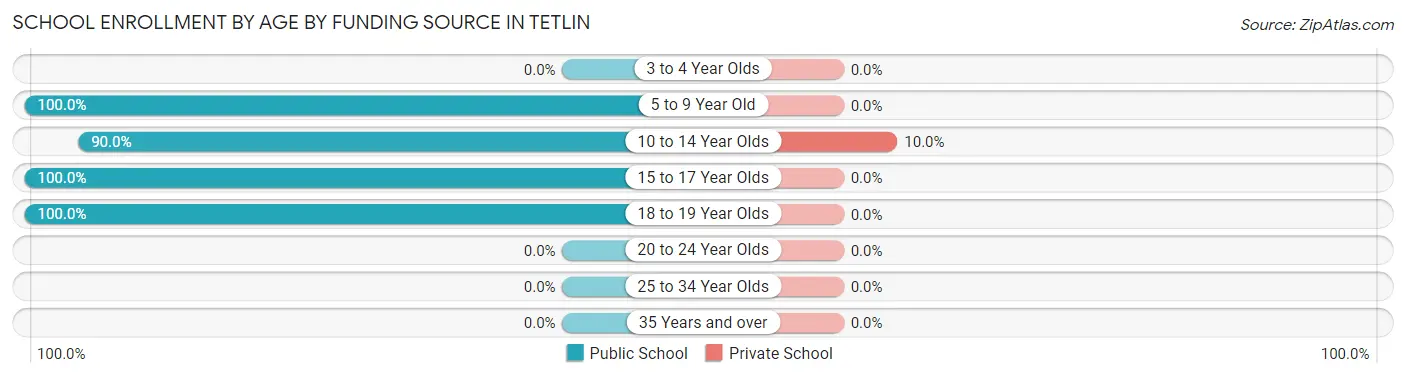
Out of a total of 53 students who are enrolled in schools in Tetlin, 3 (5.7%) attend a private institution, while the remaining 50 (94.3%) are enrolled in public schools. The age group of 10 to 14 year olds has the highest likelihood of being enrolled in private schools, with 3 (10.0% in the age bracket) enrolled. Conversely, the age group of 5 to 9 year old has the lowest likelihood of being enrolled in a private school, with 13 (100.0% in the age bracket) attending a public institution.
| Age Bracket | Public School | Private School |
| 3 to 4 Year Olds | 0 (0.0%) | 0 (0.0%) |
| 5 to 9 Year Old | 13 (100.0%) | 0 (0.0%) |
| 10 to 14 Year Olds | 27 (90.0%) | 3 (10.0%) |
| 15 to 17 Year Olds | 6 (100.0%) | 0 (0.0%) |
| 18 to 19 Year Olds | 4 (100.0%) | 0 (0.0%) |
| 20 to 24 Year Olds | 0 (0.0%) | 0 (0.0%) |
| 25 to 34 Year Olds | 0 (0.0%) | 0 (0.0%) |
| 35 Years and over | 0 (0.0%) | 0 (0.0%) |
| Total | 50 (94.3%) | 3 (5.7%) |
Educational Attainment by Field of Study in Tetlin
| Field of Study | # Graduates | % Graduates |
| Computers & Mathematics | 0 | 0.0% |
| Bio, Nature & Agricultural | 0 | 0.0% |
| Physical & Health Sciences | 0 | 0.0% |
| Psychology | 0 | 0.0% |
| Social Sciences | 0 | 0.0% |
| Engineering | 0 | 0.0% |
| Multidisciplinary Studies | 0 | 0.0% |
| Science & Technology | 0 | 0.0% |
| Business | 0 | 0.0% |
| Education | 0 | 0.0% |
| Literature & Languages | 0 | 0.0% |
| Liberal Arts & History | 0 | 0.0% |
| Visual & Performing Arts | 0 | 0.0% |
| Communications | 0 | 0.0% |
| Arts & Humanities | 0 | 0.0% |
| Total | 0 | 0.0% |
Transportation & Commute in Tetlin
Vehicle Availability by Sex in Tetlin
The most prevalent vehicle ownership categories in Tetlin are males with 1 vehicle (11, accounting for 64.7%) and females with 1 vehicle (12, making up 61.1%).
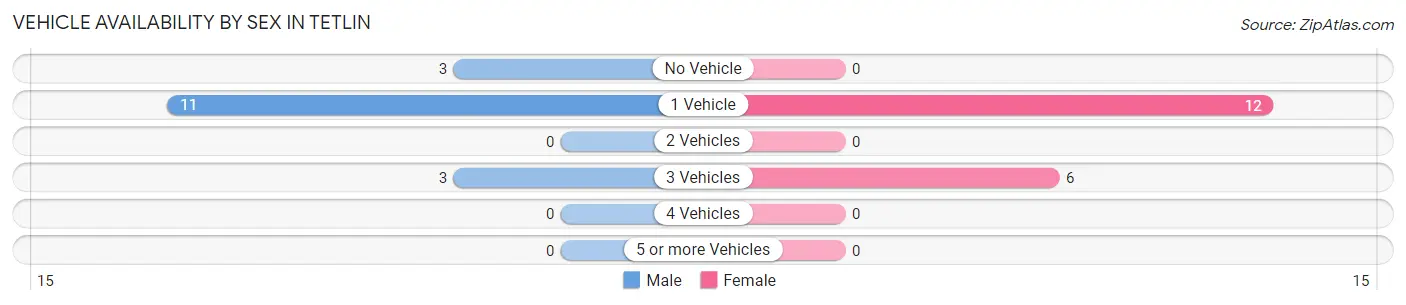
| Vehicles Available | Male | Female |
| No Vehicle | 3 (17.6%) | 0 (0.0%) |
| 1 Vehicle | 11 (64.7%) | 12 (66.7%) |
| 2 Vehicles | 0 (0.0%) | 0 (0.0%) |
| 3 Vehicles | 3 (17.6%) | 6 (33.3%) |
| 4 Vehicles | 0 (0.0%) | 0 (0.0%) |
| 5 or more Vehicles | 0 (0.0%) | 0 (0.0%) |
| Total | 17 (100.0%) | 18 (100.0%) |
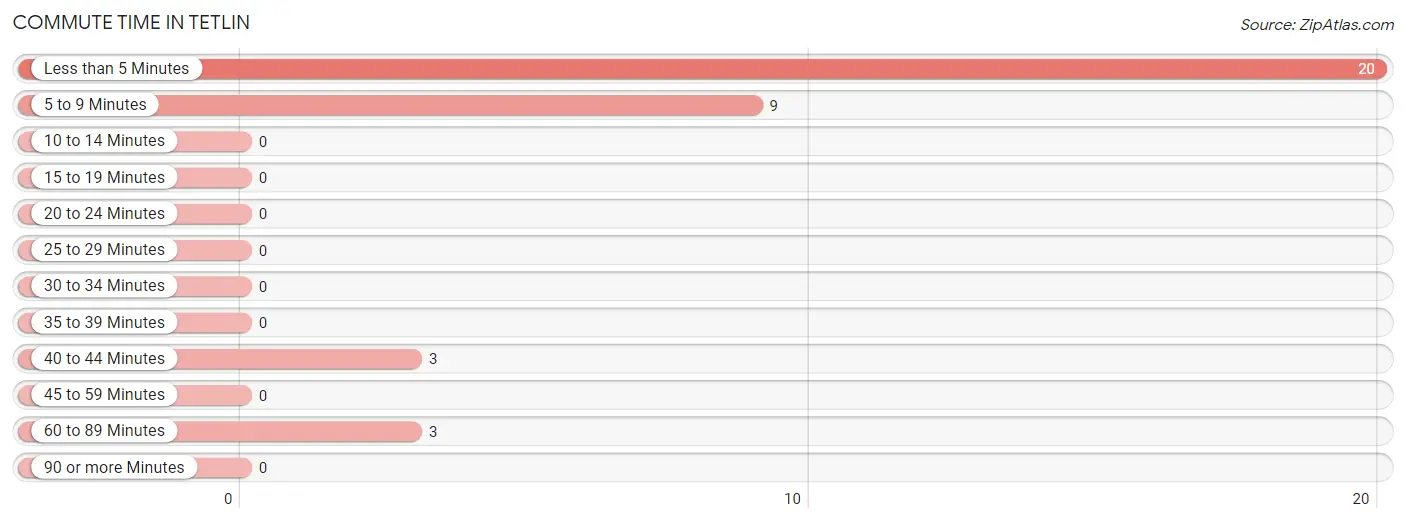
Commute Time in Tetlin
The most frequently occuring commute durations in Tetlin are less than 5 minutes (20 commuters, 57.1%), 5 to 9 minutes (9 commuters, 25.7%), and 40 to 44 minutes (3 commuters, 8.6%).
| Commute Time | # Commuters | % Commuters |
| Less than 5 Minutes | 20 | 57.1% |
| 5 to 9 Minutes | 9 | 25.7% |
| 10 to 14 Minutes | 0 | 0.0% |
| 15 to 19 Minutes | 0 | 0.0% |
| 20 to 24 Minutes | 0 | 0.0% |
| 25 to 29 Minutes | 0 | 0.0% |
| 30 to 34 Minutes | 0 | 0.0% |
| 35 to 39 Minutes | 0 | 0.0% |
| 40 to 44 Minutes | 3 | 8.6% |
| 45 to 59 Minutes | 0 | 0.0% |
| 60 to 89 Minutes | 3 | 8.6% |
| 90 or more Minutes | 0 | 0.0% |
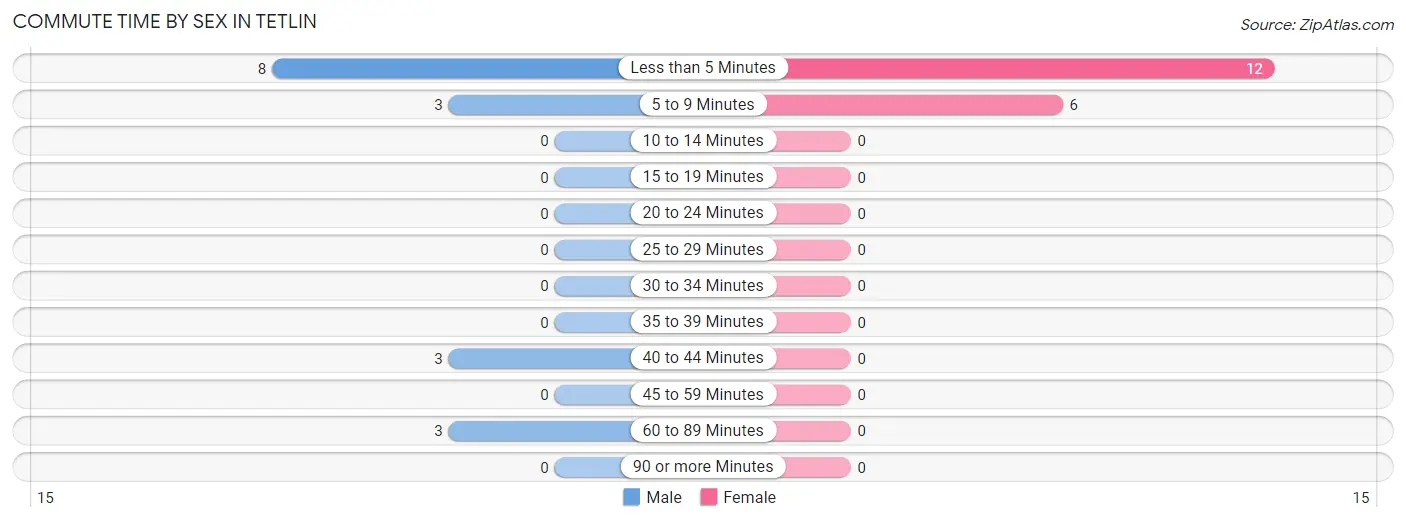
Commute Time by Sex in Tetlin
The most common commute times in Tetlin are less than 5 minutes (8 commuters, 47.1%) for males and less than 5 minutes (12 commuters, 66.7%) for females.
| Commute Time | Male | Female |
| Less than 5 Minutes | 8 (47.1%) | 12 (66.7%) |
| 5 to 9 Minutes | 3 (17.6%) | 6 (33.3%) |
| 10 to 14 Minutes | 0 (0.0%) | 0 (0.0%) |
| 15 to 19 Minutes | 0 (0.0%) | 0 (0.0%) |
| 20 to 24 Minutes | 0 (0.0%) | 0 (0.0%) |
| 25 to 29 Minutes | 0 (0.0%) | 0 (0.0%) |
| 30 to 34 Minutes | 0 (0.0%) | 0 (0.0%) |
| 35 to 39 Minutes | 0 (0.0%) | 0 (0.0%) |
| 40 to 44 Minutes | 3 (17.6%) | 0 (0.0%) |
| 45 to 59 Minutes | 0 (0.0%) | 0 (0.0%) |
| 60 to 89 Minutes | 3 (17.6%) | 0 (0.0%) |
| 90 or more Minutes | 0 (0.0%) | 0 (0.0%) |
Time of Departure to Work by Sex in Tetlin
The most frequent times of departure to work in Tetlin are 7:30 AM to 7:59 AM (8, 47.1%) for males and 9:00 AM to 9:59 AM (12, 66.7%) for females.
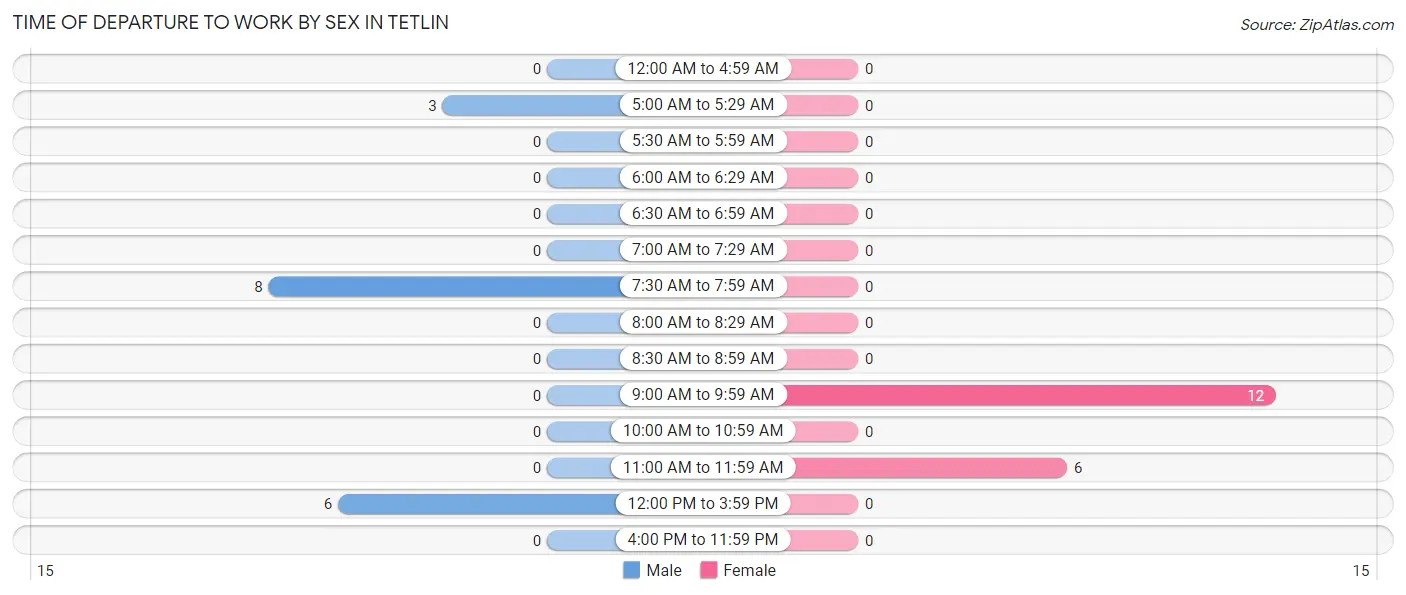
| Time of Departure | Male | Female |
| 12:00 AM to 4:59 AM | 0 (0.0%) | 0 (0.0%) |
| 5:00 AM to 5:29 AM | 3 (17.6%) | 0 (0.0%) |
| 5:30 AM to 5:59 AM | 0 (0.0%) | 0 (0.0%) |
| 6:00 AM to 6:29 AM | 0 (0.0%) | 0 (0.0%) |
| 6:30 AM to 6:59 AM | 0 (0.0%) | 0 (0.0%) |
| 7:00 AM to 7:29 AM | 0 (0.0%) | 0 (0.0%) |
| 7:30 AM to 7:59 AM | 8 (47.1%) | 0 (0.0%) |
| 8:00 AM to 8:29 AM | 0 (0.0%) | 0 (0.0%) |
| 8:30 AM to 8:59 AM | 0 (0.0%) | 0 (0.0%) |
| 9:00 AM to 9:59 AM | 0 (0.0%) | 12 (66.7%) |
| 10:00 AM to 10:59 AM | 0 (0.0%) | 0 (0.0%) |
| 11:00 AM to 11:59 AM | 0 (0.0%) | 6 (33.3%) |
| 12:00 PM to 3:59 PM | 6 (35.3%) | 0 (0.0%) |
| 4:00 PM to 11:59 PM | 0 (0.0%) | 0 (0.0%) |
| Total | 17 (100.0%) | 18 (100.0%) |
Housing Occupancy in Tetlin
Occupancy by Ownership in Tetlin
Of the total 53 dwellings in Tetlin, owner-occupied units account for 45 (84.9%), while renter-occupied units make up 8 (15.1%).
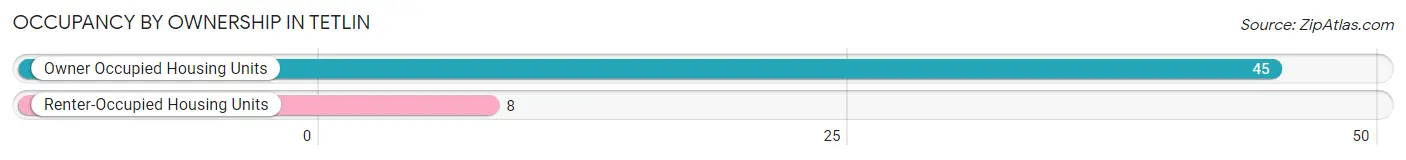
| Occupancy | # Housing Units | % Housing Units |
| Owner Occupied Housing Units | 45 | 84.9% |
| Renter-Occupied Housing Units | 8 | 15.1% |
| Total Occupied Housing Units | 53 | 100.0% |
Occupancy by Household Size in Tetlin
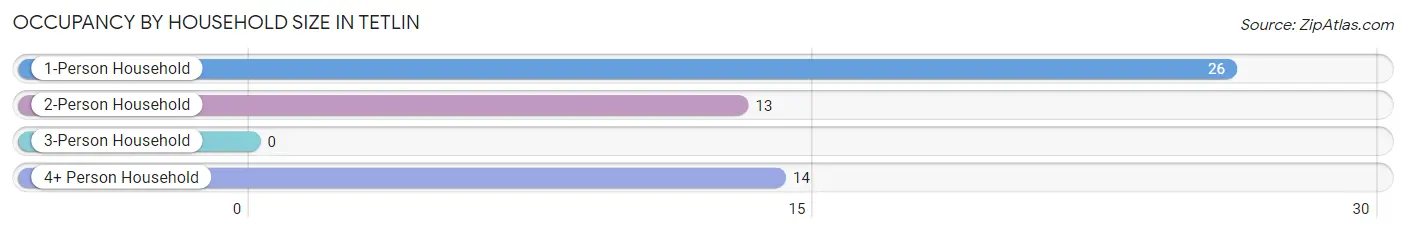
| Household Size | # Housing Units | % Housing Units |
| 1-Person Household | 26 | 49.1% |
| 2-Person Household | 13 | 24.5% |
| 3-Person Household | 0 | 0.0% |
| 4+ Person Household | 14 | 26.4% |
| Total Housing Units | 53 | 100.0% |
Occupancy by Ownership by Household Size in Tetlin
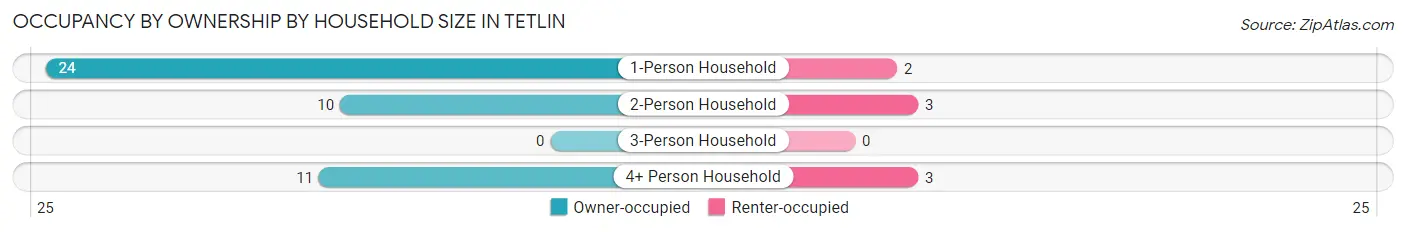
| Household Size | Owner-occupied | Renter-occupied |
| 1-Person Household | 24 (92.3%) | 2 (7.7%) |
| 2-Person Household | 10 (76.9%) | 3 (23.1%) |
| 3-Person Household | 0 (0.0%) | 0 (0.0%) |
| 4+ Person Household | 11 (78.6%) | 3 (21.4%) |
| Total Housing Units | 45 (84.9%) | 8 (15.1%) |
Occupancy by Educational Attainment in Tetlin
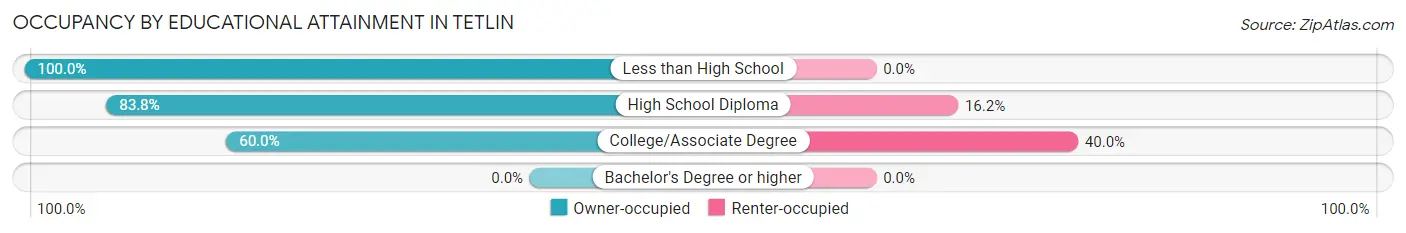
| Household Size | Owner-occupied | Renter-occupied |
| Less than High School | 11 (100.0%) | 0 (0.0%) |
| High School Diploma | 31 (83.8%) | 6 (16.2%) |
| College/Associate Degree | 3 (60.0%) | 2 (40.0%) |
| Bachelor's Degree or higher | 0 (0.0%) | 0 (0.0%) |
Occupancy by Age of Householder in Tetlin
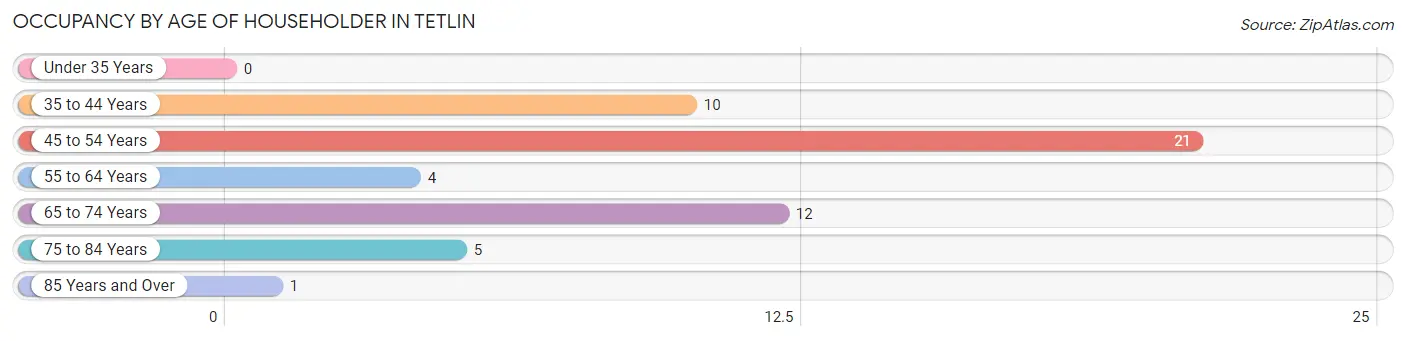
| Age Bracket | # Households | % Households |
| Under 35 Years | 0 | 0.0% |
| 35 to 44 Years | 10 | 18.9% |
| 45 to 54 Years | 21 | 39.6% |
| 55 to 64 Years | 4 | 7.5% |
| 65 to 74 Years | 12 | 22.6% |
| 75 to 84 Years | 5 | 9.4% |
| 85 Years and Over | 1 | 1.9% |
| Total | 53 | 100.0% |
Housing Finances in Tetlin
Median Income by Occupancy in Tetlin
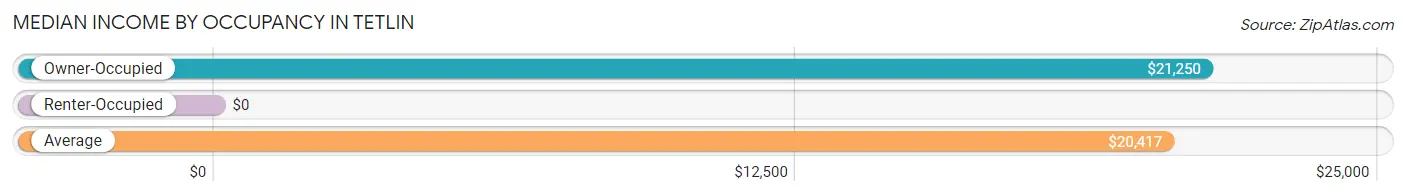
| Occupancy Type | # Households | Median Income |
| Owner-Occupied | 45 (84.9%) | $21,250 |
| Renter-Occupied | 8 (15.1%) | $0 |
| Average | 53 (100.0%) | $20,417 |
Occupancy by Householder Income Bracket in Tetlin
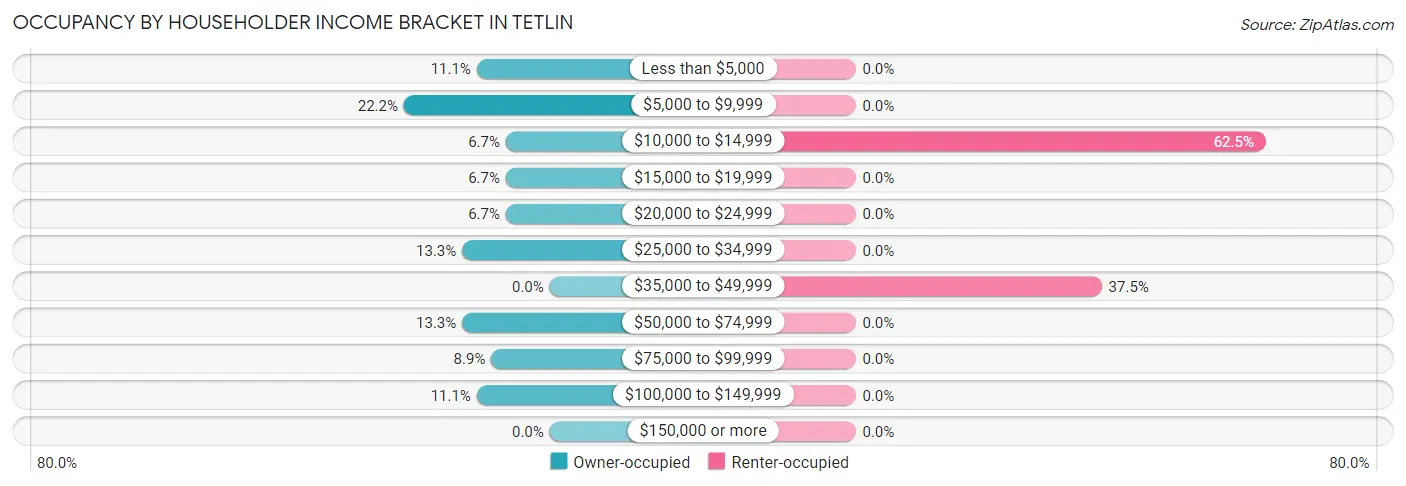
| Income Bracket | Owner-occupied | Renter-occupied |
| Less than $5,000 | 5 (11.1%) | 0 (0.0%) |
| $5,000 to $9,999 | 10 (22.2%) | 0 (0.0%) |
| $10,000 to $14,999 | 3 (6.7%) | 5 (62.5%) |
| $15,000 to $19,999 | 3 (6.7%) | 0 (0.0%) |
| $20,000 to $24,999 | 3 (6.7%) | 0 (0.0%) |
| $25,000 to $34,999 | 6 (13.3%) | 0 (0.0%) |
| $35,000 to $49,999 | 0 (0.0%) | 3 (37.5%) |
| $50,000 to $74,999 | 6 (13.3%) | 0 (0.0%) |
| $75,000 to $99,999 | 4 (8.9%) | 0 (0.0%) |
| $100,000 to $149,999 | 5 (11.1%) | 0 (0.0%) |
| $150,000 or more | 0 (0.0%) | 0 (0.0%) |
| Total | 45 (100.0%) | 8 (100.0%) |
Monthly Housing Cost Tiers in Tetlin
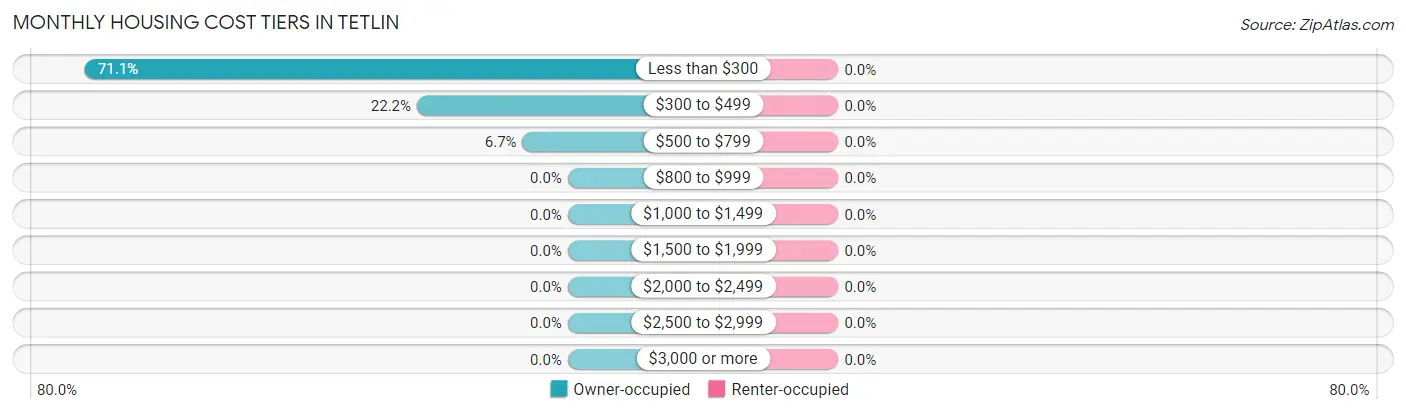
| Monthly Cost | Owner-occupied | Renter-occupied |
| Less than $300 | 32 (71.1%) | 0 (0.0%) |
| $300 to $499 | 10 (22.2%) | 0 (0.0%) |
| $500 to $799 | 3 (6.7%) | 0 (0.0%) |
| $800 to $999 | 0 (0.0%) | 0 (0.0%) |
| $1,000 to $1,499 | 0 (0.0%) | 0 (0.0%) |
| $1,500 to $1,999 | 0 (0.0%) | 0 (0.0%) |
| $2,000 to $2,499 | 0 (0.0%) | 0 (0.0%) |
| $2,500 to $2,999 | 0 (0.0%) | 0 (0.0%) |
| $3,000 or more | 0 (0.0%) | 0 (0.0%) |
| Total | 45 (100.0%) | 8 (100.0%) |
Physical Housing Characteristics in Tetlin
Housing Structures in Tetlin
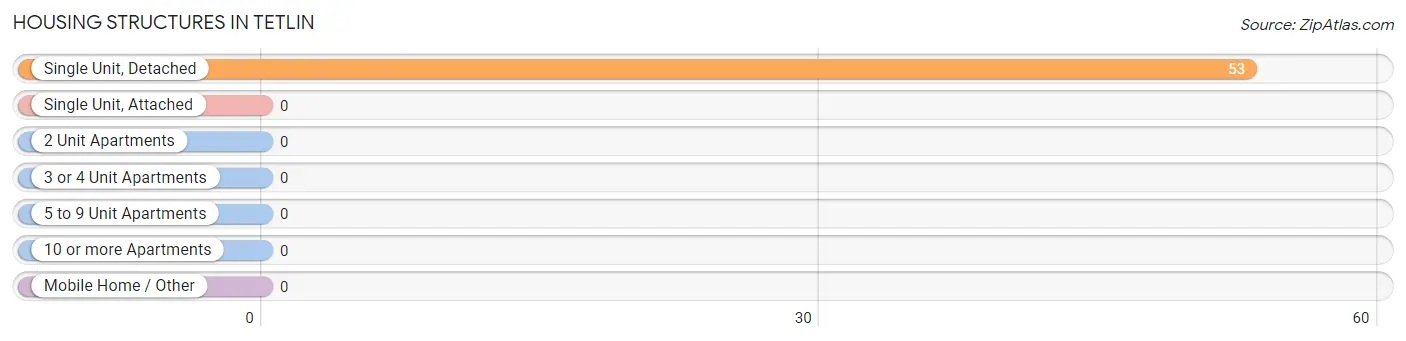
| Structure Type | # Housing Units | % Housing Units |
| Single Unit, Detached | 53 | 100.0% |
| Single Unit, Attached | 0 | 0.0% |
| 2 Unit Apartments | 0 | 0.0% |
| 3 or 4 Unit Apartments | 0 | 0.0% |
| 5 to 9 Unit Apartments | 0 | 0.0% |
| 10 or more Apartments | 0 | 0.0% |
| Mobile Home / Other | 0 | 0.0% |
| Total | 53 | 100.0% |
Housing Structures by Occupancy in Tetlin
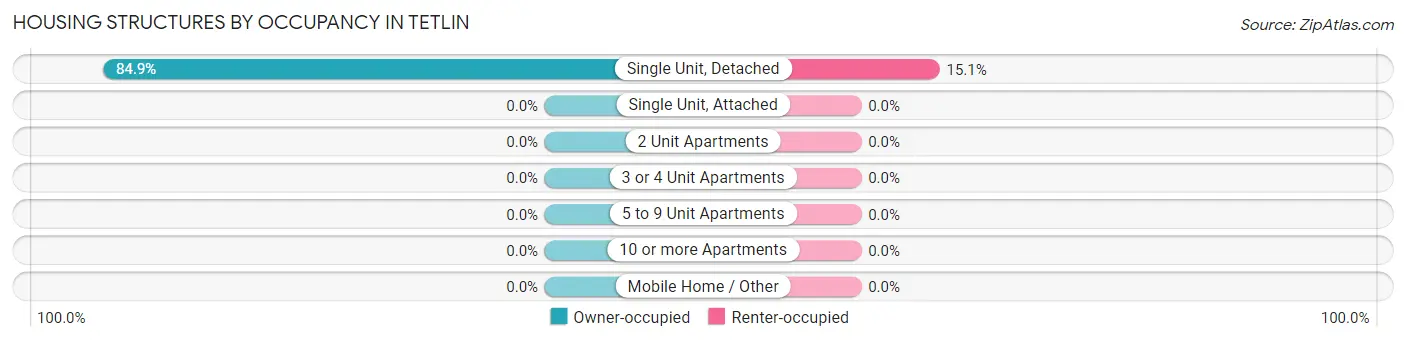
| Structure Type | Owner-occupied | Renter-occupied |
| Single Unit, Detached | 45 (84.9%) | 8 (15.1%) |
| Single Unit, Attached | 0 (0.0%) | 0 (0.0%) |
| 2 Unit Apartments | 0 (0.0%) | 0 (0.0%) |
| 3 or 4 Unit Apartments | 0 (0.0%) | 0 (0.0%) |
| 5 to 9 Unit Apartments | 0 (0.0%) | 0 (0.0%) |
| 10 or more Apartments | 0 (0.0%) | 0 (0.0%) |
| Mobile Home / Other | 0 (0.0%) | 0 (0.0%) |
| Total | 45 (84.9%) | 8 (15.1%) |
Housing Structures by Number of Rooms in Tetlin

| Number of Rooms | Owner-occupied | Renter-occupied |
| 1 Room | 0 (0.0%) | 0 (0.0%) |
| 2 or 3 Rooms | 29 (64.4%) | 8 (100.0%) |
| 4 or 5 Rooms | 10 (22.2%) | 0 (0.0%) |
| 6 or 7 Rooms | 6 (13.3%) | 0 (0.0%) |
| 8 or more Rooms | 0 (0.0%) | 0 (0.0%) |
| Total | 45 (100.0%) | 8 (100.0%) |
Housing Structure by Heating Type in Tetlin
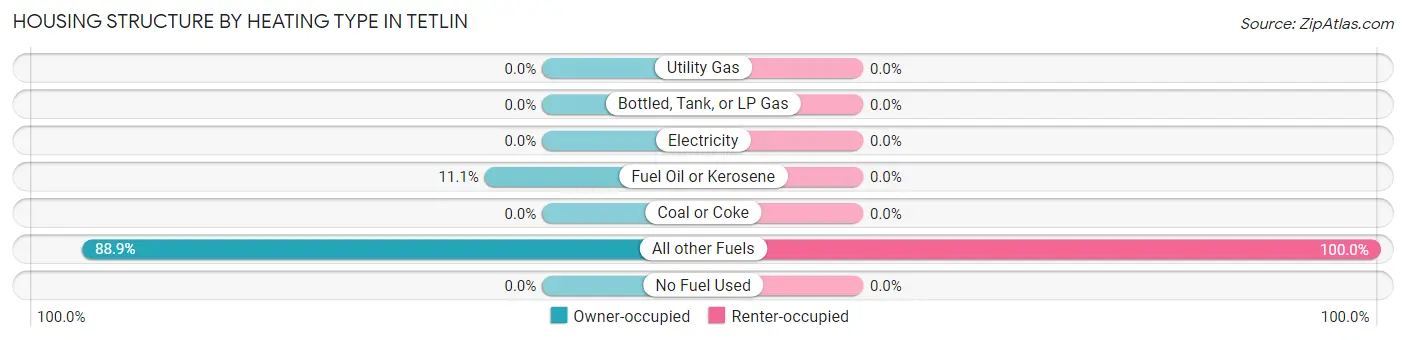
| Heating Type | Owner-occupied | Renter-occupied |
| Utility Gas | 0 (0.0%) | 0 (0.0%) |
| Bottled, Tank, or LP Gas | 0 (0.0%) | 0 (0.0%) |
| Electricity | 0 (0.0%) | 0 (0.0%) |
| Fuel Oil or Kerosene | 5 (11.1%) | 0 (0.0%) |
| Coal or Coke | 0 (0.0%) | 0 (0.0%) |
| All other Fuels | 40 (88.9%) | 8 (100.0%) |
| No Fuel Used | 0 (0.0%) | 0 (0.0%) |
| Total | 45 (100.0%) | 8 (100.0%) |
Household Vehicle Usage in Tetlin
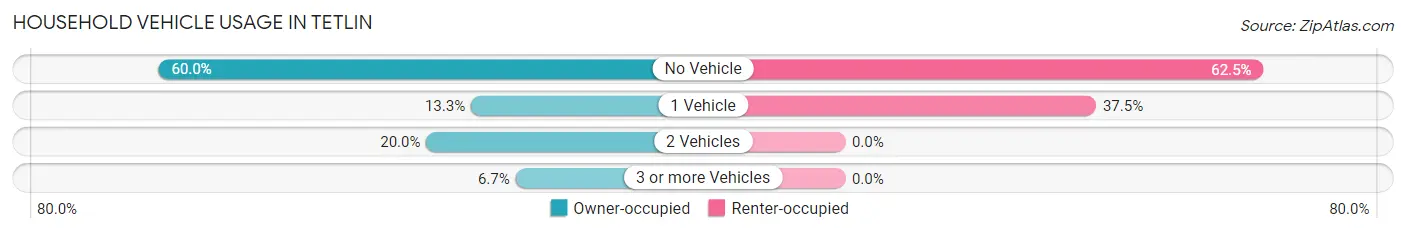
| Vehicles per Household | Owner-occupied | Renter-occupied |
| No Vehicle | 27 (60.0%) | 5 (62.5%) |
| 1 Vehicle | 6 (13.3%) | 3 (37.5%) |
| 2 Vehicles | 9 (20.0%) | 0 (0.0%) |
| 3 or more Vehicles | 3 (6.7%) | 0 (0.0%) |
| Total | 45 (100.0%) | 8 (100.0%) |
Real Estate & Mortgages in Tetlin
Real Estate and Mortgage Overview in Tetlin
| Characteristic | Without Mortgage | With Mortgage |
| Housing Units | 45 | 0 |
| Median Property Value | - | - |
| Median Household Income | $21,250 | $0 |
| Monthly Housing Costs | $99 | $0 |
| Real Estate Taxes | - | - |
Property Value by Mortgage Status in Tetlin
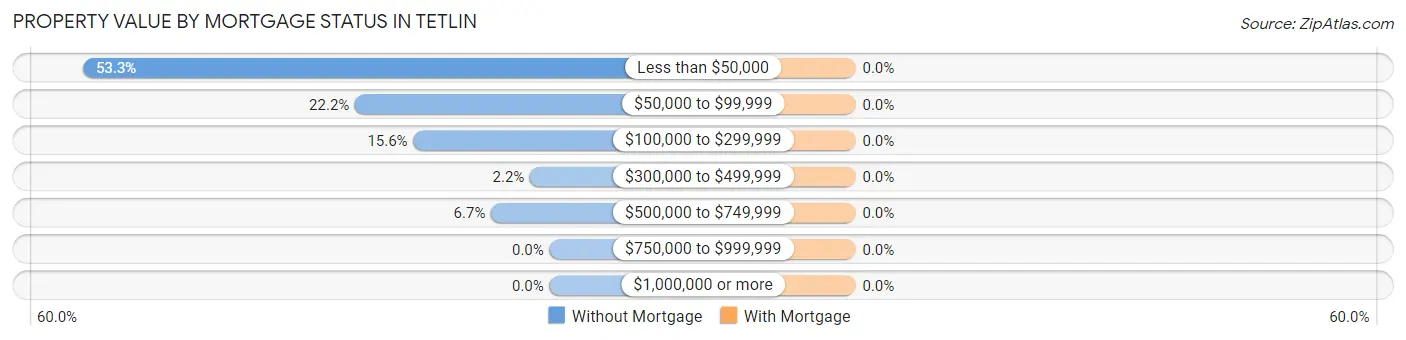
| Property Value | Without Mortgage | With Mortgage |
| Less than $50,000 | 24 (53.3%) | 0 (0.0%) |
| $50,000 to $99,999 | 10 (22.2%) | 0 (0.0%) |
| $100,000 to $299,999 | 7 (15.6%) | 0 (0.0%) |
| $300,000 to $499,999 | 1 (2.2%) | 0 (0.0%) |
| $500,000 to $749,999 | 3 (6.7%) | 0 (0.0%) |
| $750,000 to $999,999 | 0 (0.0%) | 0 (0.0%) |
| $1,000,000 or more | 0 (0.0%) | 0 (0.0%) |
| Total | 45 (100.0%) | 0 (0.0%) |
Household Income by Mortgage Status in Tetlin
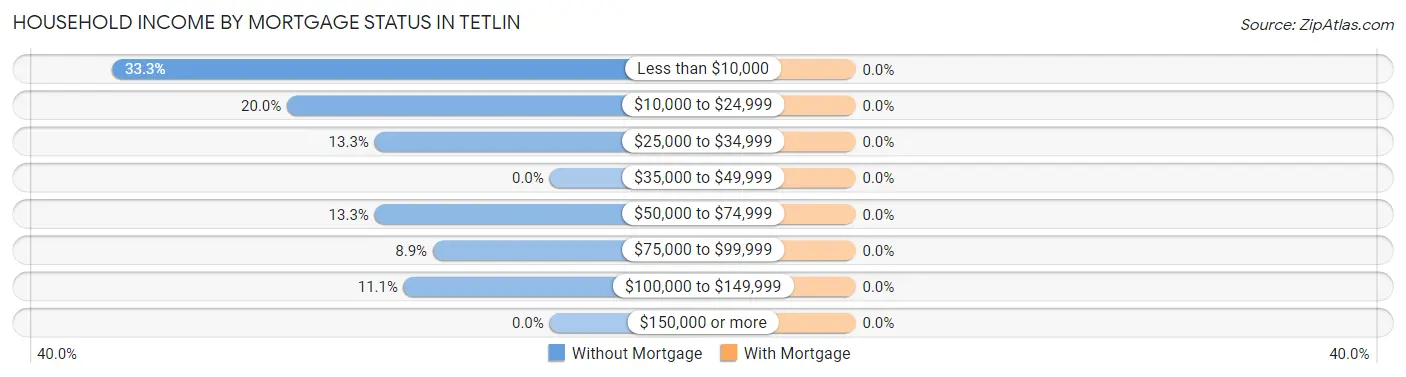
| Household Income | Without Mortgage | With Mortgage |
| Less than $10,000 | 15 (33.3%) | 0 (0.0%) |
| $10,000 to $24,999 | 9 (20.0%) | 0 (0.0%) |
| $25,000 to $34,999 | 6 (13.3%) | 0 (0.0%) |
| $35,000 to $49,999 | 0 (0.0%) | 0 (0.0%) |
| $50,000 to $74,999 | 6 (13.3%) | 0 (0.0%) |
| $75,000 to $99,999 | 4 (8.9%) | 0 (0.0%) |
| $100,000 to $149,999 | 5 (11.1%) | 0 (0.0%) |
| $150,000 or more | 0 (0.0%) | 0 (0.0%) |
| Total | 45 (100.0%) | 0 (0.0%) |
Property Value to Household Income Ratio in Tetlin
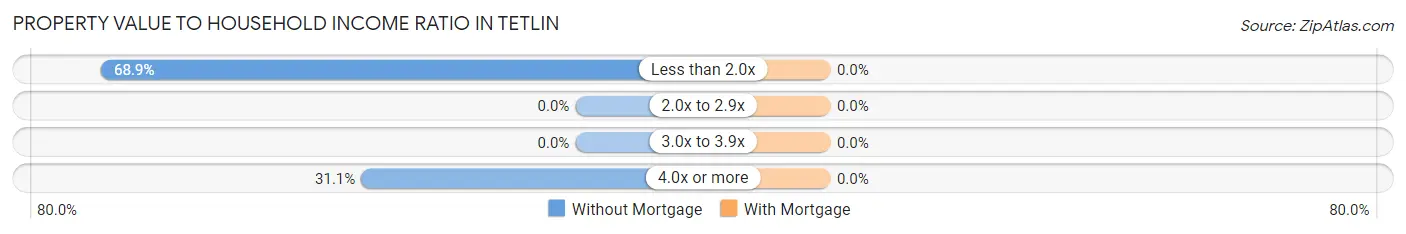
| Value-to-Income Ratio | Without Mortgage | With Mortgage |
| Less than 2.0x | 31 (68.9%) | 0 (0.0%) |
| 2.0x to 2.9x | 0 (0.0%) | 0 (0.0%) |
| 3.0x to 3.9x | 0 (0.0%) | 0 (0.0%) |
| 4.0x or more | 14 (31.1%) | 0 (0.0%) |
| Total | 45 (100.0%) | 0 (0.0%) |
Real Estate Taxes by Mortgage Status in Tetlin
| Property Taxes | Without Mortgage | With Mortgage |
| Less than $800 | 0 (0.0%) | 0 (0.0%) |
| $800 to $1,499 | 0 (0.0%) | 0 (0.0%) |
| $800 to $1,499 | 0 (0.0%) | 0 (0.0%) |
| Total | 45 (100.0%) | 0 (0.0%) |
Health & Disability in Tetlin
Health Insurance Coverage by Age in Tetlin
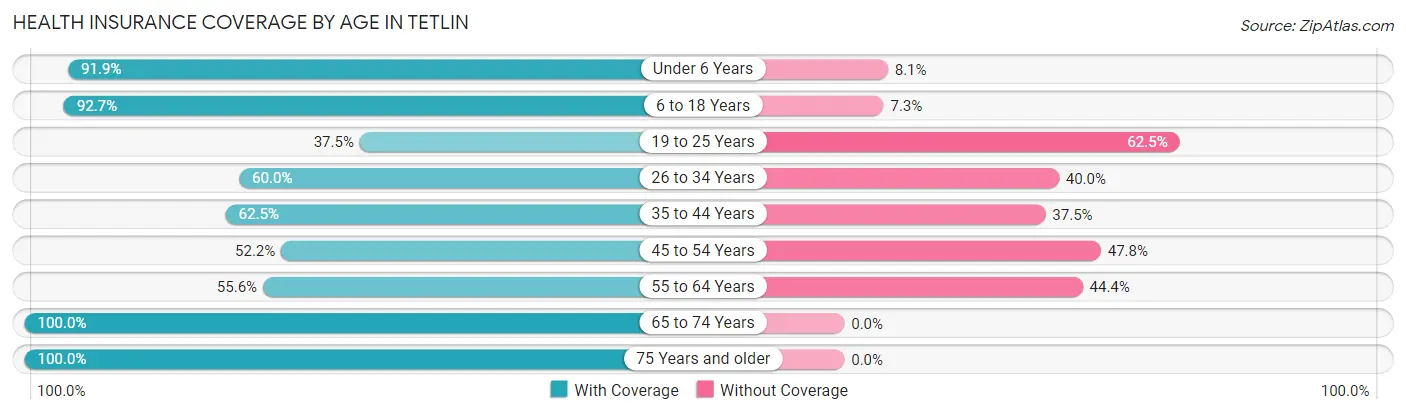
| Age Bracket | With Coverage | Without Coverage |
| Under 6 Years | 34 (91.9%) | 3 (8.1%) |
| 6 to 18 Years | 38 (92.7%) | 3 (7.3%) |
| 19 to 25 Years | 9 (37.5%) | 15 (62.5%) |
| 26 to 34 Years | 6 (60.0%) | 4 (40.0%) |
| 35 to 44 Years | 20 (62.5%) | 12 (37.5%) |
| 45 to 54 Years | 12 (52.2%) | 11 (47.8%) |
| 55 to 64 Years | 5 (55.6%) | 4 (44.4%) |
| 65 to 74 Years | 19 (100.0%) | 0 (0.0%) |
| 75 Years and older | 6 (100.0%) | 0 (0.0%) |
| Total | 149 (74.1%) | 52 (25.9%) |
Health Insurance Coverage by Citizenship Status in Tetlin
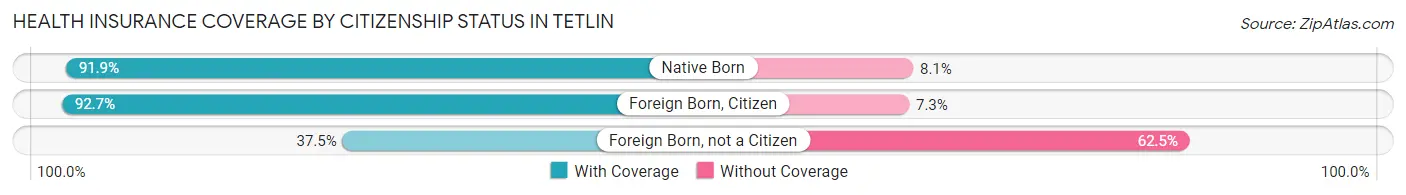
| Citizenship Status | With Coverage | Without Coverage |
| Native Born | 34 (91.9%) | 3 (8.1%) |
| Foreign Born, Citizen | 38 (92.7%) | 3 (7.3%) |
| Foreign Born, not a Citizen | 9 (37.5%) | 15 (62.5%) |
Health Insurance Coverage by Household Income in Tetlin
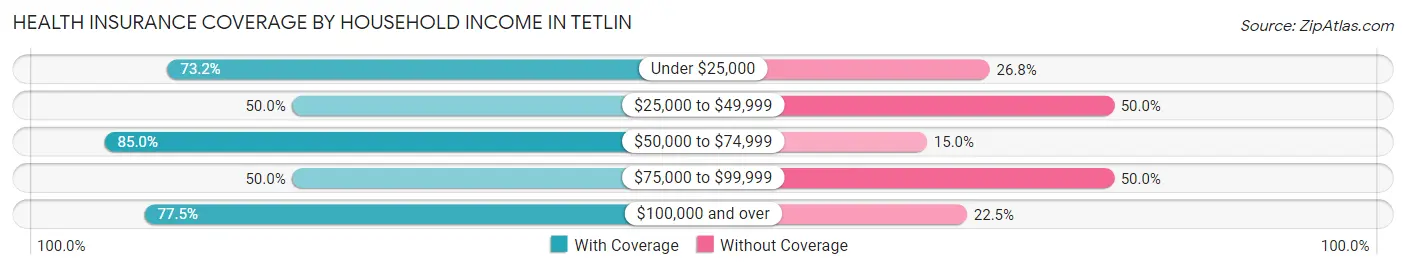
| Household Income | With Coverage | Without Coverage |
| Under $25,000 | 52 (73.2%) | 19 (26.8%) |
| $25,000 to $49,999 | 11 (50.0%) | 11 (50.0%) |
| $50,000 to $74,999 | 51 (85.0%) | 9 (15.0%) |
| $75,000 to $99,999 | 4 (50.0%) | 4 (50.0%) |
| $100,000 and over | 31 (77.5%) | 9 (22.5%) |
Public vs Private Health Insurance Coverage by Age in Tetlin
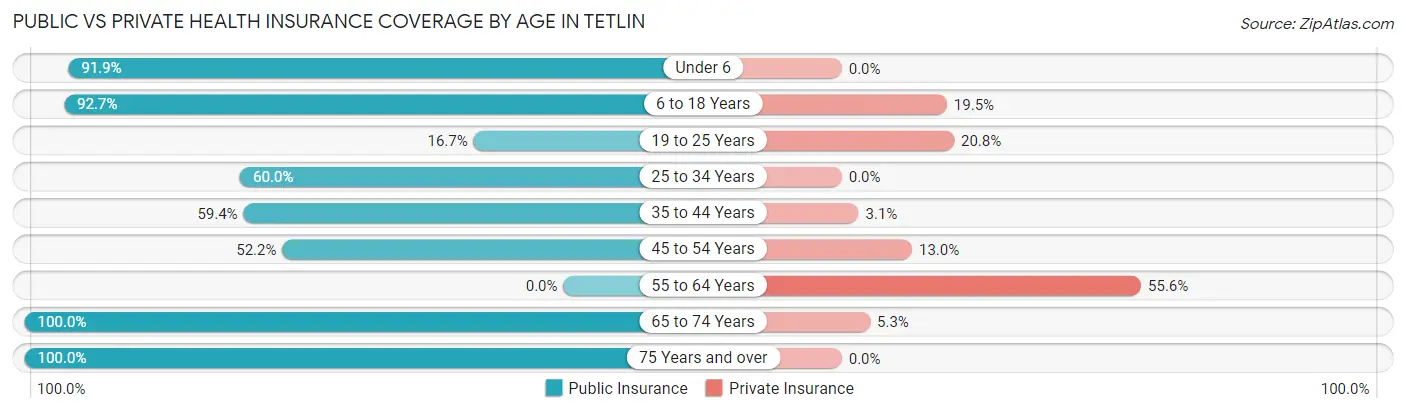
| Age Bracket | Public Insurance | Private Insurance |
| Under 6 | 34 (91.9%) | 0 (0.0%) |
| 6 to 18 Years | 38 (92.7%) | 8 (19.5%) |
| 19 to 25 Years | 4 (16.7%) | 5 (20.8%) |
| 25 to 34 Years | 6 (60.0%) | 0 (0.0%) |
| 35 to 44 Years | 19 (59.4%) | 1 (3.1%) |
| 45 to 54 Years | 12 (52.2%) | 3 (13.0%) |
| 55 to 64 Years | 0 (0.0%) | 5 (55.6%) |
| 65 to 74 Years | 19 (100.0%) | 1 (5.3%) |
| 75 Years and over | 6 (100.0%) | 0 (0.0%) |
| Total | 138 (68.7%) | 23 (11.4%) |
Disability Status by Sex by Age in Tetlin
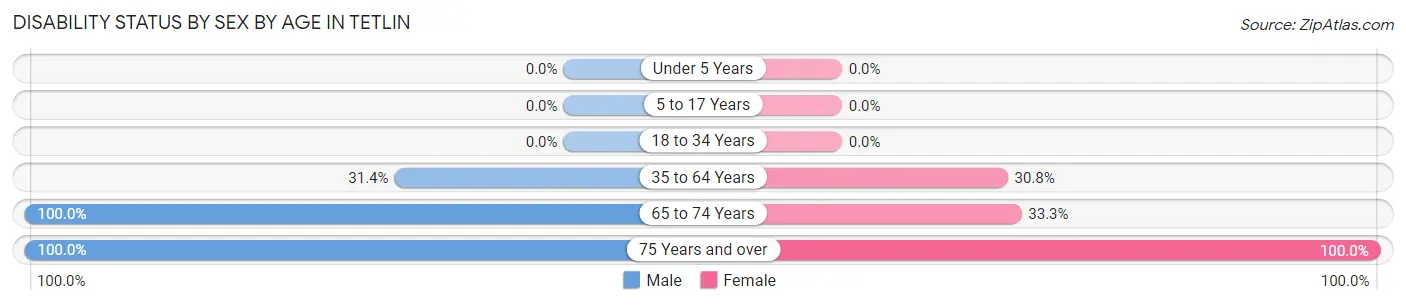
| Age Bracket | Male | Female |
| Under 5 Years | 0 (0.0%) | 0 (0.0%) |
| 5 to 17 Years | 0 (0.0%) | 0 (0.0%) |
| 18 to 34 Years | 0 (0.0%) | 0 (0.0%) |
| 35 to 64 Years | 16 (31.4%) | 4 (30.8%) |
| 65 to 74 Years | 16 (100.0%) | 1 (33.3%) |
| 75 Years and over | 5 (100.0%) | 1 (100.0%) |
Disability Class by Sex by Age in Tetlin
Disability Class: Hearing Difficulty
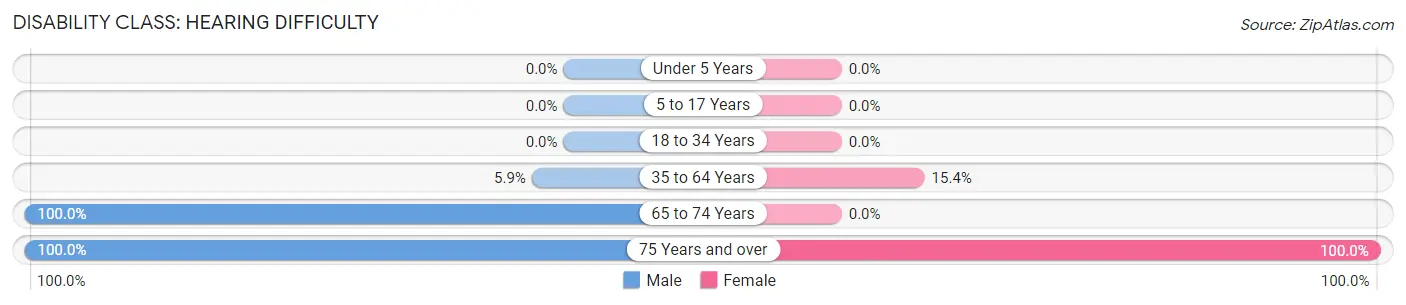
| Age Bracket | Male | Female |
| Under 5 Years | 0 (0.0%) | 0 (0.0%) |
| 5 to 17 Years | 0 (0.0%) | 0 (0.0%) |
| 18 to 34 Years | 0 (0.0%) | 0 (0.0%) |
| 35 to 64 Years | 3 (5.9%) | 2 (15.4%) |
| 65 to 74 Years | 16 (100.0%) | 0 (0.0%) |
| 75 Years and over | 5 (100.0%) | 1 (100.0%) |
Disability Class: Vision Difficulty
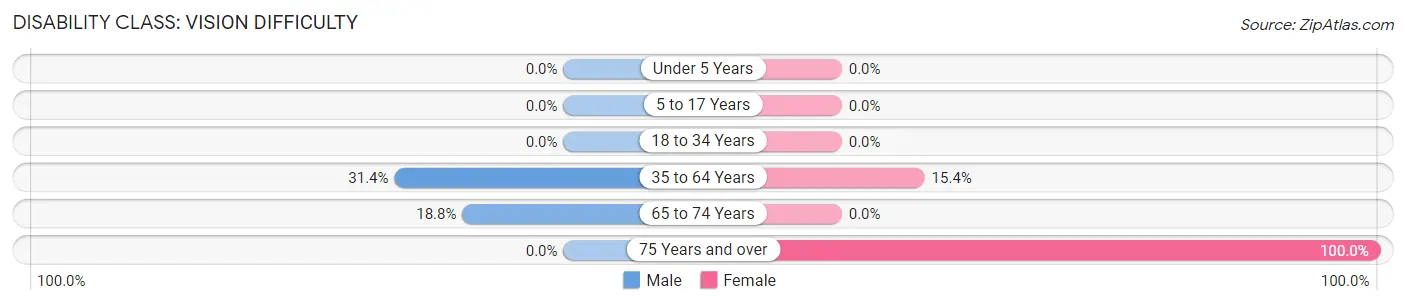
| Age Bracket | Male | Female |
| Under 5 Years | 0 (0.0%) | 0 (0.0%) |
| 5 to 17 Years | 0 (0.0%) | 0 (0.0%) |
| 18 to 34 Years | 0 (0.0%) | 0 (0.0%) |
| 35 to 64 Years | 16 (31.4%) | 2 (15.4%) |
| 65 to 74 Years | 3 (18.8%) | 0 (0.0%) |
| 75 Years and over | 0 (0.0%) | 1 (100.0%) |
Disability Class: Cognitive Difficulty
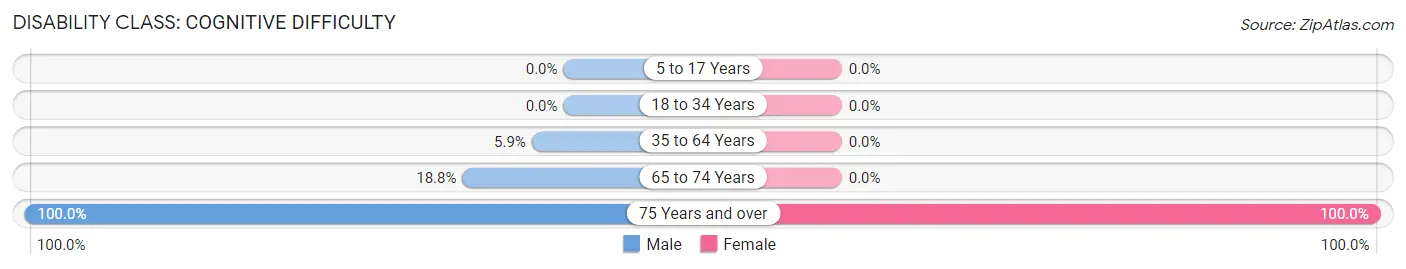
| Age Bracket | Male | Female |
| 5 to 17 Years | 0 (0.0%) | 0 (0.0%) |
| 18 to 34 Years | 0 (0.0%) | 0 (0.0%) |
| 35 to 64 Years | 3 (5.9%) | 0 (0.0%) |
| 65 to 74 Years | 3 (18.8%) | 0 (0.0%) |
| 75 Years and over | 5 (100.0%) | 1 (100.0%) |
Disability Class: Ambulatory Difficulty
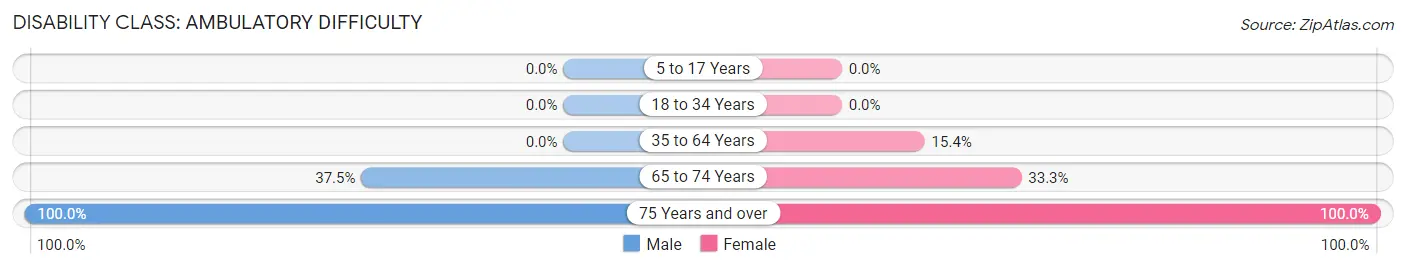
| Age Bracket | Male | Female |
| 5 to 17 Years | 0 (0.0%) | 0 (0.0%) |
| 18 to 34 Years | 0 (0.0%) | 0 (0.0%) |
| 35 to 64 Years | 0 (0.0%) | 2 (15.4%) |
| 65 to 74 Years | 6 (37.5%) | 1 (33.3%) |
| 75 Years and over | 5 (100.0%) | 1 (100.0%) |
Disability Class: Self-Care Difficulty
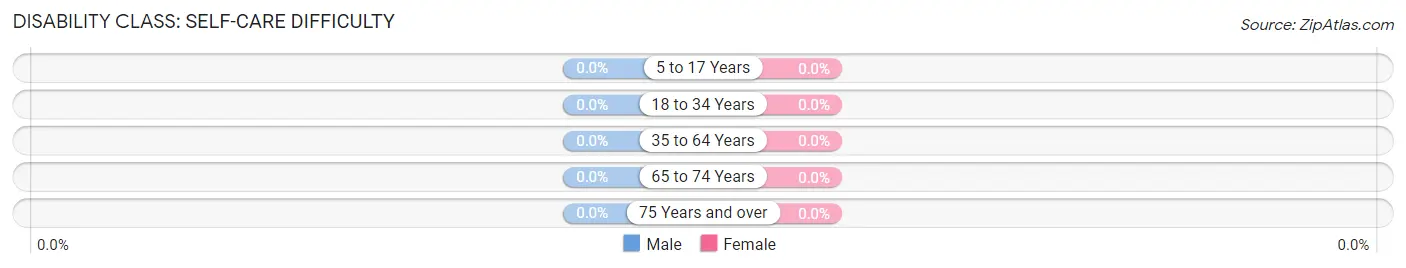
| Age Bracket | Male | Female |
| 5 to 17 Years | 0 (0.0%) | 0 (0.0%) |
| 18 to 34 Years | 0 (0.0%) | 0 (0.0%) |
| 35 to 64 Years | 0 (0.0%) | 0 (0.0%) |
| 65 to 74 Years | 0 (0.0%) | 0 (0.0%) |
| 75 Years and over | 0 (0.0%) | 0 (0.0%) |
Technology Access in Tetlin
Computing Device Access in Tetlin
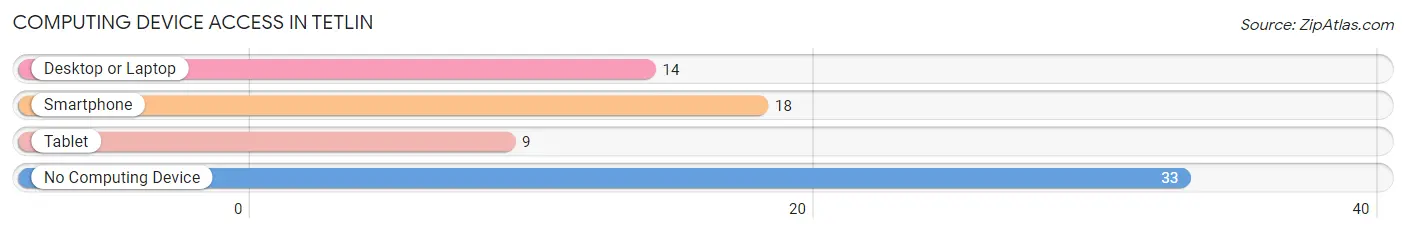
| Device Type | # Households | % Households |
| Desktop or Laptop | 14 | 26.4% |
| Smartphone | 18 | 34.0% |
| Tablet | 9 | 17.0% |
| No Computing Device | 33 | 62.3% |
| Total | 53 | 100.0% |
Internet Access in Tetlin
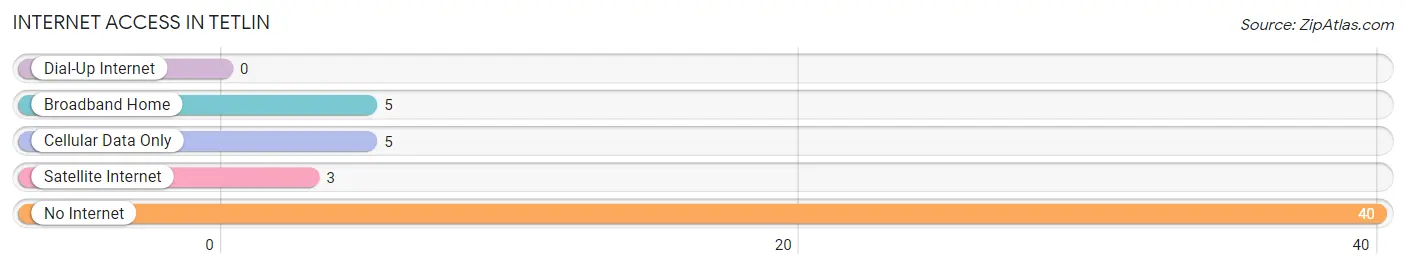
| Internet Type | # Households | % Households |
| Dial-Up Internet | 0 | 0.0% |
| Broadband Home | 5 | 9.4% |
| Cellular Data Only | 5 | 9.4% |
| Satellite Internet | 3 | 5.7% |
| No Internet | 40 | 75.5% |
| Total | 53 | 100.0% |
Tetlin Summary
Tetlin is a small unincorporated community located in the eastern interior of Alaska, approximately 40 miles south of Tok. It is situated on the banks of the Tanana River, near the Canadian border. The community is part of the Yukon-Koyukuk Census Area and is home to approximately 100 people.
History
Tetlin has a long and rich history, dating back to the early 1900s. The area was first inhabited by the Koyukon Athabascan people, who had lived in the region for thousands of years. The first non-Native settlers arrived in the area in the early 1900s, when gold was discovered in the nearby hills. The gold rush brought a large influx of people to the area, and the town of Tetlin was established in 1906.
The town was named after a local Koyukon chief, Tetlin, who had been a leader in the area for many years. The town quickly grew, and by 1910 it had a population of over 500 people. The town was home to a variety of businesses, including a general store, a hotel, a saloon, and a post office.
The gold rush eventually ended, and the population of Tetlin began to decline. By the 1950s, the population had dropped to just over 100 people. The town has remained relatively small since then, but it has continued to be an important part of the local economy.
Geography
Tetlin is located in the eastern interior of Alaska, approximately 40 miles south of Tok. It is situated on the banks of the Tanana River, near the Canadian border. The town is surrounded by the White Mountains, which provide a stunning backdrop for the area. The climate in Tetlin is cold and dry, with temperatures ranging from -20°F in the winter to 70°F in the summer.
Economy
Tetlin’s economy is largely based on subsistence activities, such as hunting, fishing, and trapping. The town is also home to a small sawmill, which provides employment for some of the local residents. The town is also home to a small airport, which serves as a hub for air travel in the region.
Demographics
As of the 2010 census, the population of Tetlin was 100 people. The racial makeup of the town was 95.0% Native American, 4.0% White, and 1.0% from other races. The median household income in Tetlin was $25,000, and the median age was 37 years.
Conclusion
Tetlin is a small unincorporated community located in the eastern interior of Alaska. It has a long and rich history, dating back to the early 1900s, when gold was discovered in the nearby hills. The town has remained relatively small since then, but it has continued to be an important part of the local economy. The town is largely based on subsistence activities, such as hunting, fishing, and trapping. The population of Tetlin is 100 people, and the median household income is $25,000.
Common Questions
What is Per Capita Income in Tetlin?
Per Capita income in Tetlin is $11,811.
What is the Median Family Income in Tetlin?
Median Family Income in Tetlin is $70,625.
What is the Median Household income in Tetlin?
Median Household Income in Tetlin is $20,417.
What is Income or Wage Gap in Tetlin?
Income or Wage Gap in Tetlin is 58.9%.
Women in Tetlin earn 41.1 cents for every dollar earned by a man.
What is Inequality or Gini Index in Tetlin?
Inequality or Gini Index in Tetlin is 0.52.
What is the Total Population of Tetlin?
Total Population of Tetlin is 201.
What is the Total Male Population of Tetlin?
Total Male Population of Tetlin is 146.
What is the Total Female Population of Tetlin?
Total Female Population of Tetlin is 55.
What is the Ratio of Males per 100 Females in Tetlin?
There are 265.45 Males per 100 Females in Tetlin.
What is the Ratio of Females per 100 Males in Tetlin?
There are 37.67 Females per 100 Males in Tetlin.
What is the Median Population Age in Tetlin?
Median Population Age in Tetlin is 25.6 Years.
What is the Average Family Size in Tetlin
Average Family Size in Tetlin is 6.0 People.
What is the Average Household Size in Tetlin
Average Household Size in Tetlin is 3.8 People.
How Large is the Labor Force in Tetlin?
There are 51 People in the Labor Forcein in Tetlin.
What is the Percentage of People in the Labor Force in Tetlin?
40.5% of People are in the Labor Force in Tetlin.
What is the Unemployment Rate in Tetlin?
Unemployment Rate in Tetlin is 23.5%.