Blue Clay Farms, NC Map & Demographics
Blue Clay Farms Map
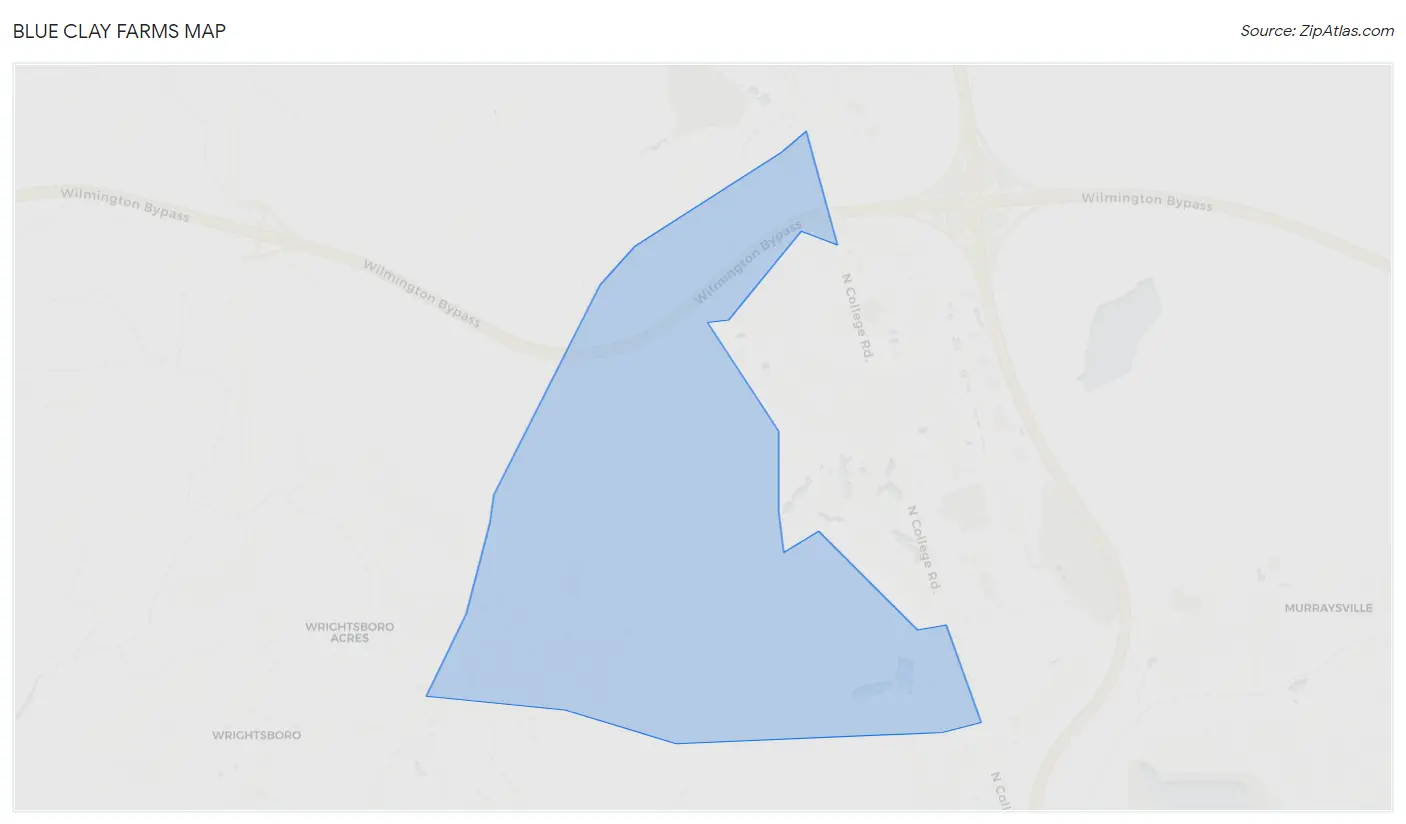
Blue Clay Farms Overview
$64,573
PER CAPITA INCOME
0.25
INEQUALITY / GINI INDEX
124
TOTAL POPULATION
71
MALE POPULATION
53
FEMALE POPULATION
133.96
MALES / 100 FEMALES
74.65
FEMALES / 100 MALES
41.9
MEDIAN AGE
2.3
AVG FAMILY SIZE
2.3
AVG HOUSEHOLD SIZE
49
LABOR FORCE [ PEOPLE ]
48.0%
PERCENT IN LABOR FORCE
Income in Blue Clay Farms
Income Overview in Blue Clay Farms
| Characteristic | Number | Measure |
| Per Capita Income | 124 | $64,573 |
| Median Family Income | 53 | $0 |
| Mean Family Income | 53 | $155,604 |
| Median Household Income | 53 | $0 |
| Mean Household Income | 53 | $155,604 |
| Income Deficit | 53 | $0 |
| Wage / Income Gap (%) | 124 | 0.00% |
| Wage / Income Gap ($) | 124 | 100.00¢ per $1 |
| Gini / Inequality Index | 124 | 0.25 |
Earnings by Sex in Blue Clay Farms
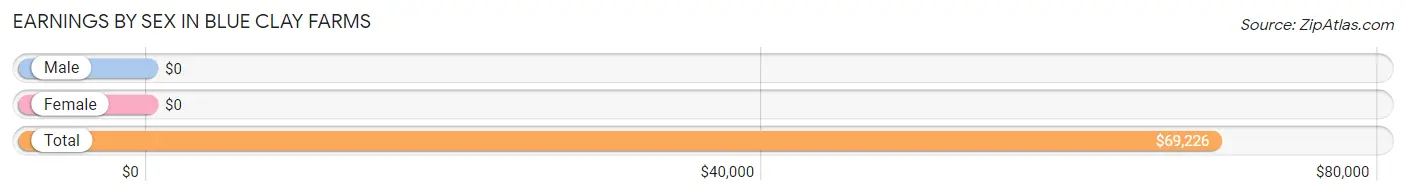
| Sex | Number | Average Earnings |
| Male | 49 (57.7%) | $0 |
| Female | 36 (42.3%) | $0 |
| Total | 85 (100.0%) | $69,226 |
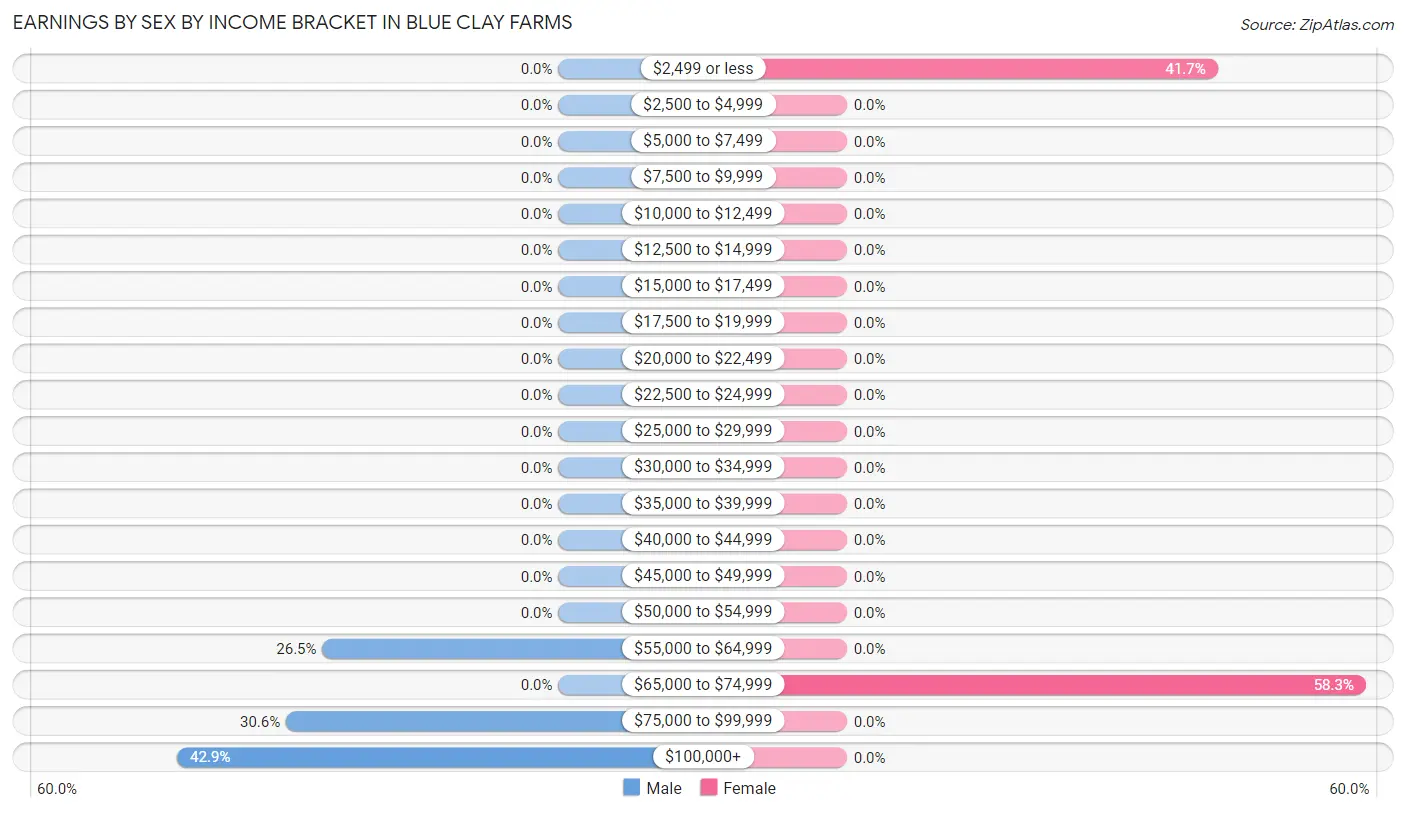
Earnings by Sex by Income Bracket in Blue Clay Farms
The most common earnings brackets in Blue Clay Farms are $100,000+ for men (21 | 42.9%) and $65,000 to $74,999 for women (21 | 58.3%).
| Income | Male | Female |
| $2,499 or less | 0 (0.0%) | 15 (41.7%) |
| $2,500 to $4,999 | 0 (0.0%) | 0 (0.0%) |
| $5,000 to $7,499 | 0 (0.0%) | 0 (0.0%) |
| $7,500 to $9,999 | 0 (0.0%) | 0 (0.0%) |
| $10,000 to $12,499 | 0 (0.0%) | 0 (0.0%) |
| $12,500 to $14,999 | 0 (0.0%) | 0 (0.0%) |
| $15,000 to $17,499 | 0 (0.0%) | 0 (0.0%) |
| $17,500 to $19,999 | 0 (0.0%) | 0 (0.0%) |
| $20,000 to $22,499 | 0 (0.0%) | 0 (0.0%) |
| $22,500 to $24,999 | 0 (0.0%) | 0 (0.0%) |
| $25,000 to $29,999 | 0 (0.0%) | 0 (0.0%) |
| $30,000 to $34,999 | 0 (0.0%) | 0 (0.0%) |
| $35,000 to $39,999 | 0 (0.0%) | 0 (0.0%) |
| $40,000 to $44,999 | 0 (0.0%) | 0 (0.0%) |
| $45,000 to $49,999 | 0 (0.0%) | 0 (0.0%) |
| $50,000 to $54,999 | 0 (0.0%) | 0 (0.0%) |
| $55,000 to $64,999 | 13 (26.5%) | 0 (0.0%) |
| $65,000 to $74,999 | 0 (0.0%) | 21 (58.3%) |
| $75,000 to $99,999 | 15 (30.6%) | 0 (0.0%) |
| $100,000+ | 21 (42.9%) | 0 (0.0%) |
| Total | 49 (100.0%) | 36 (100.0%) |
Earnings by Sex by Educational Attainment in Blue Clay Farms
| Educational Attainment | Male Income | Female Income |
| Less than High School | - | - |
| High School Diploma | - | - |
| College or Associate's Degree | - | - |
| Bachelor's Degree | - | - |
| Graduate Degree | - | - |
| Total | - | - |
Family Income in Blue Clay Farms
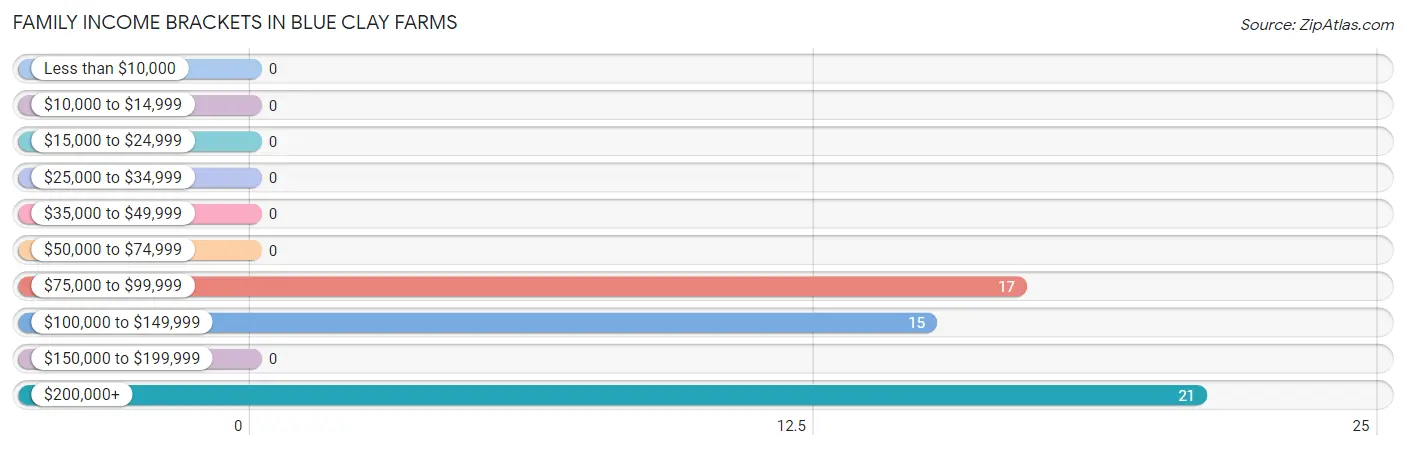
Family Income Brackets in Blue Clay Farms
According to the Blue Clay Farms family income data, there are 21 families falling into the $200,000+ income range, which is the most common income bracket and makes up 39.6% of all families.
| Income Bracket | # Families | % Families |
| Less than $10,000 | 0 | 0.0% |
| $10,000 to $14,999 | 0 | 0.0% |
| $15,000 to $24,999 | 0 | 0.0% |
| $25,000 to $34,999 | 0 | 0.0% |
| $35,000 to $49,999 | 0 | 0.0% |
| $50,000 to $74,999 | 0 | 0.0% |
| $75,000 to $99,999 | 17 | 32.1% |
| $100,000 to $149,999 | 15 | 28.3% |
| $150,000 to $199,999 | 0 | 0.0% |
| $200,000+ | 21 | 39.6% |
Family Income by Famaliy Size in Blue Clay Farms
| Income Bracket | # Families | Median Income |
| 2-Person Families | 32 (60.4%) | $0 |
| 3-Person Families | 21 (39.6%) | $0 |
| 4-Person Families | 0 (0.0%) | $0 |
| 5-Person Families | 0 (0.0%) | $0 |
| 6-Person Families | 0 (0.0%) | $0 |
| 7+ Person Families | 0 (0.0%) | $0 |
| Total | 53 (100.0%) | $0 |
Family Income by Number of Earners in Blue Clay Farms
| Number of Earners | # Families | Median Income |
| No Earners | 0 (0.0%) | $0 |
| 1 Earner | 17 (32.1%) | $0 |
| 2 Earners | 36 (67.9%) | $0 |
| 3+ Earners | 0 (0.0%) | $0 |
| Total | 53 (100.0%) | $0 |
Household Income in Blue Clay Farms
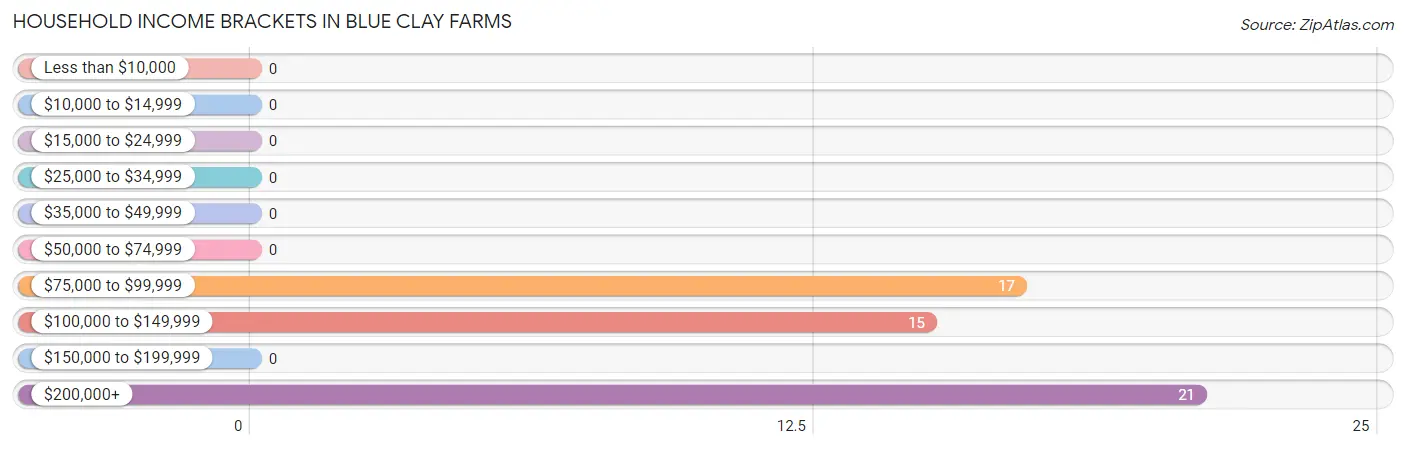
Household Income Brackets in Blue Clay Farms
With 21 households falling in the category, the $200,000+ income range is the most frequent in Blue Clay Farms, accounting for 39.6% of all households.
| Income Bracket | # Households | % Households |
| Less than $10,000 | 0 | 0.0% |
| $10,000 to $14,999 | 0 | 0.0% |
| $15,000 to $24,999 | 0 | 0.0% |
| $25,000 to $34,999 | 0 | 0.0% |
| $35,000 to $49,999 | 0 | 0.0% |
| $50,000 to $74,999 | 0 | 0.0% |
| $75,000 to $99,999 | 17 | 32.1% |
| $100,000 to $149,999 | 15 | 28.3% |
| $150,000 to $199,999 | 0 | 0.0% |
| $200,000+ | 21 | 39.6% |
Household Income by Householder Age in Blue Clay Farms
| Income Bracket | # Households | Median Income |
| 15 to 24 Years | 0 (0.0%) | $0 |
| 25 to 44 Years | 21 (39.6%) | $0 |
| 45 to 64 Years | 32 (60.4%) | $0 |
| 65+ Years | 0 (0.0%) | $0 |
| Total | 53 (100.0%) | $0 |
Poverty in Blue Clay Farms
Income Below Poverty by Sex and Age in Blue Clay Farms
| Age Bracket | Male | Female |
| Under 5 Years | 0 (0.0%) | 0 (0.0%) |
| 5 Years | 0 (0.0%) | 0 (0.0%) |
| 6 to 11 Years | 0 (0.0%) | 0 (0.0%) |
| 12 to 14 Years | 0 (0.0%) | 0 (0.0%) |
| 15 Years | 0 (0.0%) | 0 (0.0%) |
| 16 and 17 Years | 0 (0.0%) | 0 (0.0%) |
| 18 to 24 Years | 0 (0.0%) | 0 (0.0%) |
| 25 to 34 Years | 0 (0.0%) | 0 (0.0%) |
| 35 to 44 Years | 0 (0.0%) | 0 (0.0%) |
| 45 to 54 Years | 0 (0.0%) | 0 (0.0%) |
| 55 to 64 Years | 0 (0.0%) | 0 (0.0%) |
| 65 to 74 Years | 0 (0.0%) | 0 (0.0%) |
| 75 Years and over | 0 (0.0%) | 0 (0.0%) |
| Total | 0 (0.0%) | 0 (0.0%) |
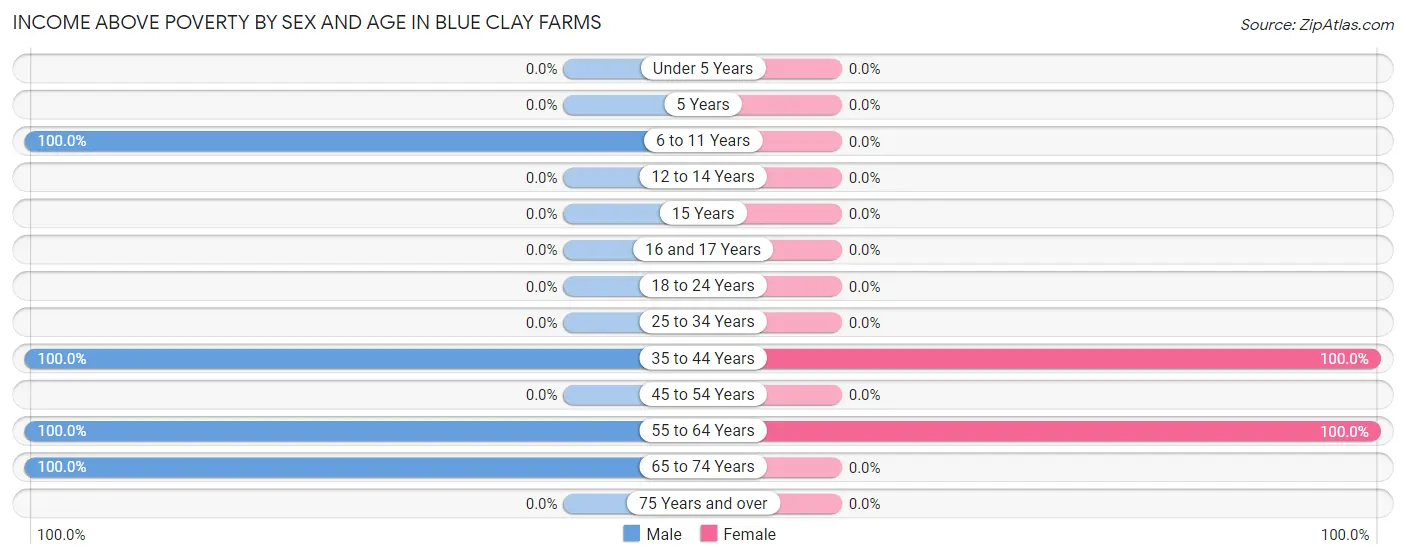
Income Above Poverty by Sex and Age in Blue Clay Farms
According to the poverty statistics in Blue Clay Farms, males aged 6 to 11 years and females aged 35 to 44 years are the age groups that are most secure financially, with 100.0% of males and 100.0% of females in these age groups living above the poverty line.
| Age Bracket | Male | Female |
| Under 5 Years | 0 (0.0%) | 0 (0.0%) |
| 5 Years | 0 (0.0%) | 0 (0.0%) |
| 6 to 11 Years | 22 (100.0%) | 0 (0.0%) |
| 12 to 14 Years | 0 (0.0%) | 0 (0.0%) |
| 15 Years | 0 (0.0%) | 0 (0.0%) |
| 16 and 17 Years | 0 (0.0%) | 0 (0.0%) |
| 18 to 24 Years | 0 (0.0%) | 0 (0.0%) |
| 25 to 34 Years | 0 (0.0%) | 0 (0.0%) |
| 35 to 44 Years | 21 (100.0%) | 21 (100.0%) |
| 45 to 54 Years | 0 (0.0%) | 0 (0.0%) |
| 55 to 64 Years | 13 (100.0%) | 32 (100.0%) |
| 65 to 74 Years | 15 (100.0%) | 0 (0.0%) |
| 75 Years and over | 0 (0.0%) | 0 (0.0%) |
| Total | 71 (100.0%) | 53 (100.0%) |
Income Below Poverty Among Married-Couple Families in Blue Clay Farms
| Children | Above Poverty | Below Poverty |
| No Children | 32 (100.0%) | 0 (0.0%) |
| 1 or 2 Children | 21 (100.0%) | 0 (0.0%) |
| 3 or 4 Children | 0 (0.0%) | 0 (0.0%) |
| 5 or more Children | 0 (0.0%) | 0 (0.0%) |
| Total | 53 (100.0%) | 0 (0.0%) |
Income Below Poverty Among Single-Parent Households in Blue Clay Farms
| Children | Single Father | Single Mother |
| No Children | 0 (0.0%) | 0 (0.0%) |
| 1 or 2 Children | 0 (0.0%) | 0 (0.0%) |
| 3 or 4 Children | 0 (0.0%) | 0 (0.0%) |
| 5 or more Children | 0 (0.0%) | 0 (0.0%) |
| Total | 0 (0.0%) | 0 (0.0%) |
Income Below Poverty Among Married-Couple vs Single-Parent Households in Blue Clay Farms
| Children | Married-Couple Families | Single-Parent Households |
| No Children | 0 (0.0%) | 0 (0.0%) |
| 1 or 2 Children | 0 (0.0%) | 0 (0.0%) |
| 3 or 4 Children | 0 (0.0%) | 0 (0.0%) |
| 5 or more Children | 0 (0.0%) | 0 (0.0%) |
| Total | 0 (0.0%) | 0 (0.0%) |
Race in Blue Clay Farms
The most populous races in Blue Clay Farms are White / Caucasian (94 | 75.8%), and Black / African American (30 | 24.2%).
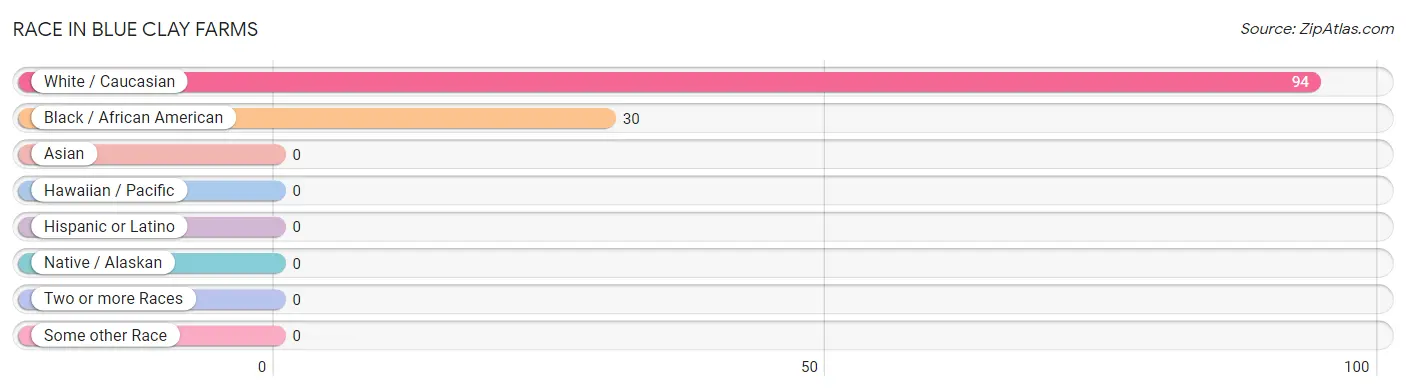
| Race | # Population | % Population |
| Asian | 0 | 0.0% |
| Black / African American | 30 | 24.2% |
| Hawaiian / Pacific | 0 | 0.0% |
| Hispanic or Latino | 0 | 0.0% |
| Native / Alaskan | 0 | 0.0% |
| White / Caucasian | 94 | 75.8% |
| Two or more Races | 0 | 0.0% |
| Some other Race | 0 | 0.0% |
| Total | 124 | 100.0% |
Ancestry in Blue Clay Farms
The most populous ancestries reported in Blue Clay Farms are Irish (57 | 46.0%), French (21 | 16.9%), Italian (21 | 16.9%), English (15 | 12.1%), and German (15 | 12.1%), together accounting for 104.0% of all Blue Clay Farms residents.
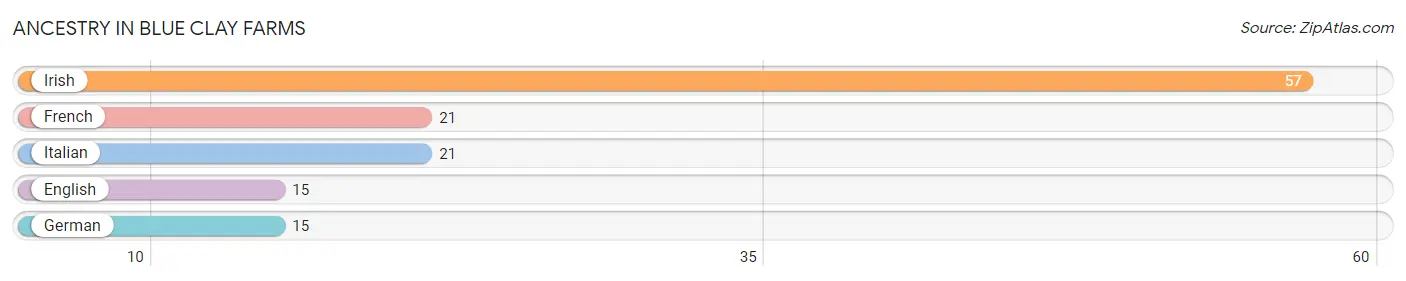
| Ancestry | # Population | % Population |
| English | 15 | 12.1% |
| French | 21 | 16.9% |
| German | 15 | 12.1% |
| Irish | 57 | 46.0% |
| Italian | 21 | 16.9% | View All 5 Rows |
Immigrants in Blue Clay Farms

| Immigration Origin | # Population | % Population | View All 0 Rows |
Sex and Age in Blue Clay Farms
Sex and Age in Blue Clay Farms
The most populous age groups in Blue Clay Farms are 5 to 9 Years (22 | 31.0%) for men and 40 to 44 Years (21 | 39.6%) for women.
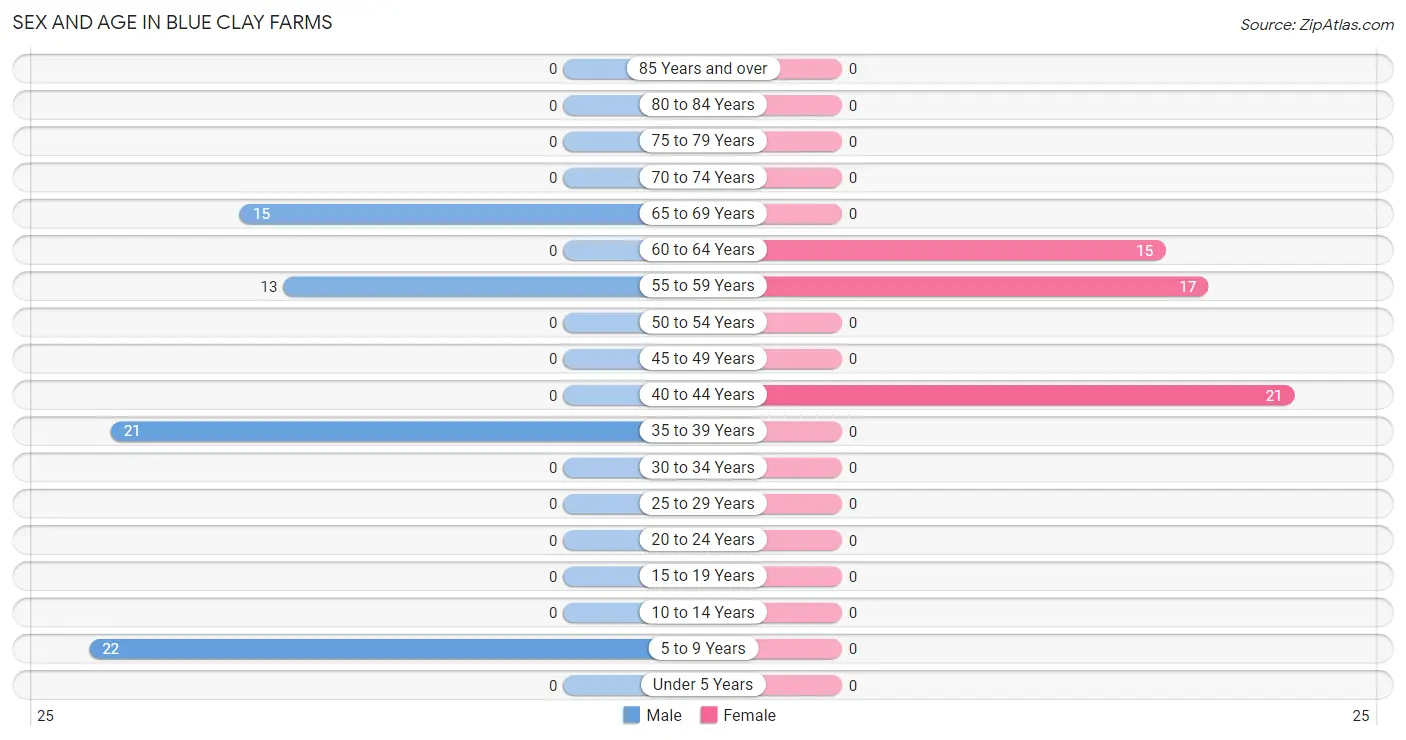
| Age Bracket | Male | Female |
| Under 5 Years | 0 (0.0%) | 0 (0.0%) |
| 5 to 9 Years | 22 (31.0%) | 0 (0.0%) |
| 10 to 14 Years | 0 (0.0%) | 0 (0.0%) |
| 15 to 19 Years | 0 (0.0%) | 0 (0.0%) |
| 20 to 24 Years | 0 (0.0%) | 0 (0.0%) |
| 25 to 29 Years | 0 (0.0%) | 0 (0.0%) |
| 30 to 34 Years | 0 (0.0%) | 0 (0.0%) |
| 35 to 39 Years | 21 (29.6%) | 0 (0.0%) |
| 40 to 44 Years | 0 (0.0%) | 21 (39.6%) |
| 45 to 49 Years | 0 (0.0%) | 0 (0.0%) |
| 50 to 54 Years | 0 (0.0%) | 0 (0.0%) |
| 55 to 59 Years | 13 (18.3%) | 17 (32.1%) |
| 60 to 64 Years | 0 (0.0%) | 15 (28.3%) |
| 65 to 69 Years | 15 (21.1%) | 0 (0.0%) |
| 70 to 74 Years | 0 (0.0%) | 0 (0.0%) |
| 75 to 79 Years | 0 (0.0%) | 0 (0.0%) |
| 80 to 84 Years | 0 (0.0%) | 0 (0.0%) |
| 85 Years and over | 0 (0.0%) | 0 (0.0%) |
| Total | 71 (100.0%) | 53 (100.0%) |
Families and Households in Blue Clay Farms
Median Family Size in Blue Clay Farms
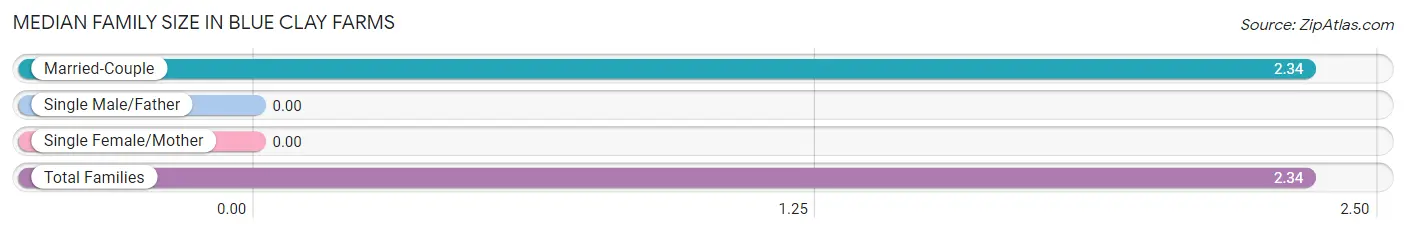
| Family Type | # Families | Family Size |
| Married-Couple | 53 (100.0%) | 2.34 |
| Single Male/Father | 0 (0.0%) | - |
| Single Female/Mother | 0 (0.0%) | - |
| Total Families | 53 (100.0%) | 2.34 |
Median Household Size in Blue Clay Farms
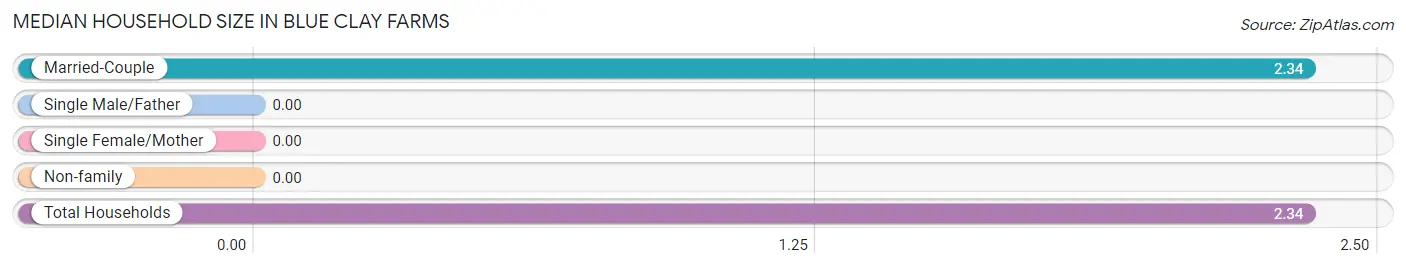
| Household Type | # Households | Household Size |
| Married-Couple | 53 (100.0%) | 2.34 |
| Single Male/Father | 0 (0.0%) | - |
| Single Female/Mother | 0 (0.0%) | - |
| Non-family | 0 (0.0%) | - |
| Total Households | 53 (100.0%) | 2.34 |
Household Size by Marriage Status in Blue Clay Farms
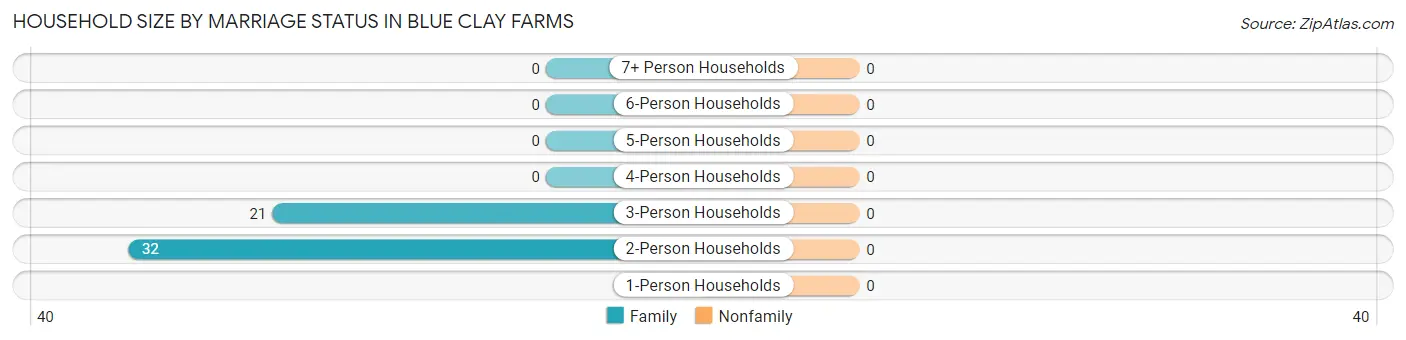
| Household Size | Family Households | Nonfamily Households |
| 1-Person Households | - | 0 (0.0%) |
| 2-Person Households | 32 (60.4%) | 0 (0.0%) |
| 3-Person Households | 21 (39.6%) | 0 (0.0%) |
| 4-Person Households | 0 (0.0%) | 0 (0.0%) |
| 5-Person Households | 0 (0.0%) | 0 (0.0%) |
| 6-Person Households | 0 (0.0%) | 0 (0.0%) |
| 7+ Person Households | 0 (0.0%) | 0 (0.0%) |
| Total | 53 (100.0%) | 0 (0.0%) |
Female Fertility in Blue Clay Farms
Fertility by Age in Blue Clay Farms
| Age Bracket | Women with Births | Births / 1,000 Women |
| 15 to 19 years | 0 (0.0%) | 0.0 |
| 20 to 34 years | 0 (0.0%) | 0.0 |
| 35 to 50 years | 0 (0.0%) | 0.0 |
| Total | 0 (0.0%) | 0.0 |
Fertility by Age by Marriage Status in Blue Clay Farms
| Age Bracket | Married | Unmarried |
| 15 to 19 years | 0 (0.0%) | 0 (0.0%) |
| 20 to 34 years | 0 (0.0%) | 0 (0.0%) |
| 35 to 50 years | 0 (0.0%) | 0 (0.0%) |
| Total | 0 (0.0%) | 0 (0.0%) |
Fertility by Education in Blue Clay Farms
| Educational Attainment | Women with Births | Births / 1,000 Women |
| Less than High School | 0 (0.0%) | 0.0 |
| High School Diploma | 0 (0.0%) | 0.0 |
| College or Associate's Degree | 0 (0.0%) | 0.0 |
| Bachelor's Degree | 0 (0.0%) | 0.0 |
| Graduate Degree | 0 (0.0%) | 0.0 |
| Total | 0 (0.0%) | 0.0 |
Fertility by Education by Marriage Status in Blue Clay Farms
| Educational Attainment | Married | Unmarried |
| Less than High School | 0 (0.0%) | 0 (0.0%) |
| High School Diploma | 0 (0.0%) | 0 (0.0%) |
| College or Associate's Degree | 0 (0.0%) | 0 (0.0%) |
| Bachelor's Degree | 0 (0.0%) | 0 (0.0%) |
| Graduate Degree | 0 (0.0%) | 0 (0.0%) |
| Total | 0 (0.0%) | 0 (0.0%) |
Employment Characteristics in Blue Clay Farms
Employment by Class of Employer in Blue Clay Farms
Among the 49 employed individuals in Blue Clay Farms, private company employees (34 | 69.4%), and self-employed (not incorporated) (15 | 30.6%) make up the most common classes of employment.
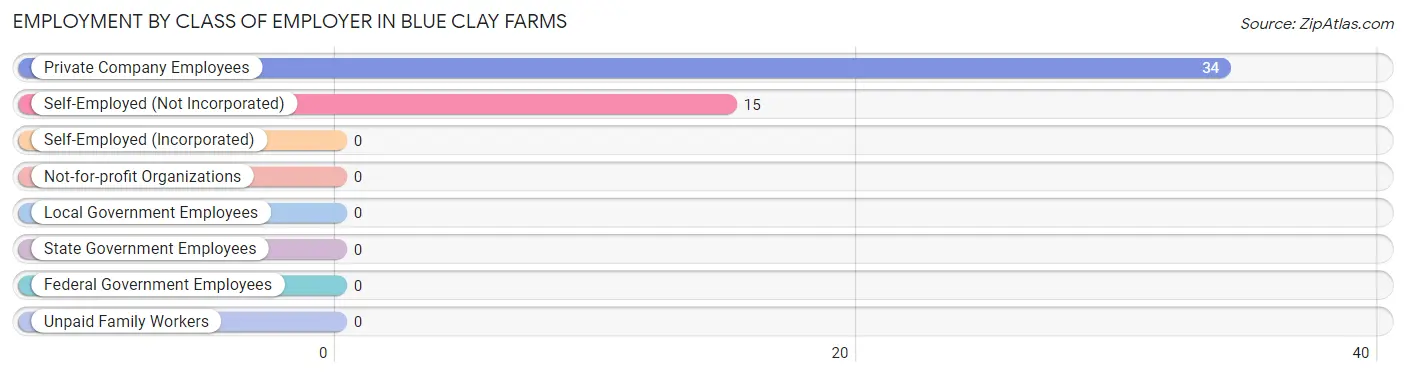
| Employer Class | # Employees | % Employees |
| Private Company Employees | 34 | 69.4% |
| Self-Employed (Incorporated) | 0 | 0.0% |
| Self-Employed (Not Incorporated) | 15 | 30.6% |
| Not-for-profit Organizations | 0 | 0.0% |
| Local Government Employees | 0 | 0.0% |
| State Government Employees | 0 | 0.0% |
| Federal Government Employees | 0 | 0.0% |
| Unpaid Family Workers | 0 | 0.0% |
| Total | 49 | 100.0% |
Employment Status by Age in Blue Clay Farms
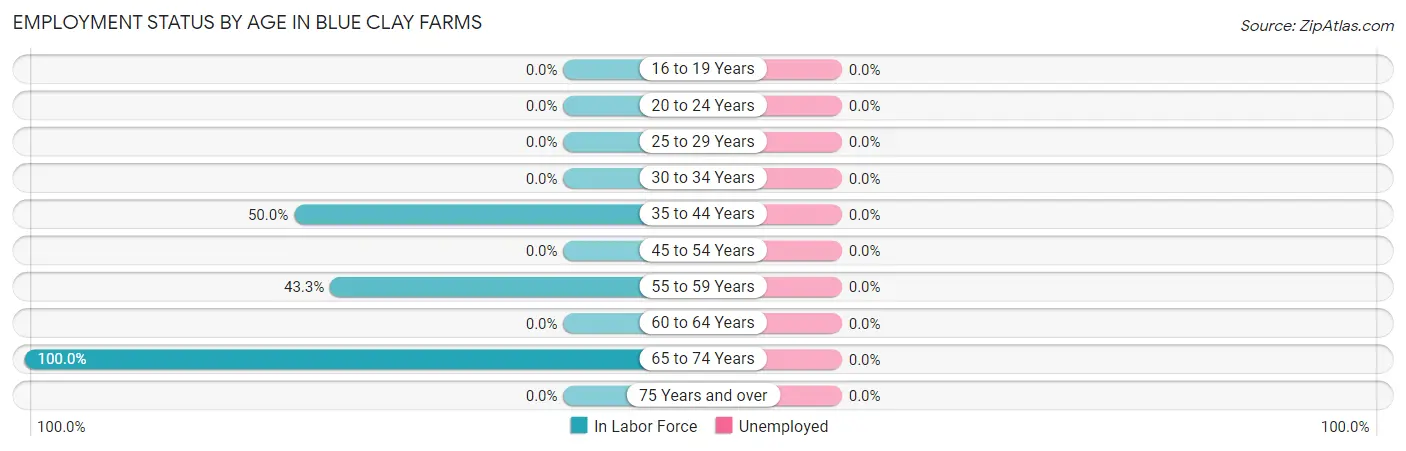
| Age Bracket | In Labor Force | Unemployed |
| 16 to 19 Years | 0 (0.0%) | 0 (0.0%) |
| 20 to 24 Years | 0 (0.0%) | 0 (0.0%) |
| 25 to 29 Years | 0 (0.0%) | 0 (0.0%) |
| 30 to 34 Years | 0 (0.0%) | 0 (0.0%) |
| 35 to 44 Years | 21 (50.0%) | 0 (0.0%) |
| 45 to 54 Years | 0 (0.0%) | 0 (0.0%) |
| 55 to 59 Years | 13 (43.3%) | 0 (0.0%) |
| 60 to 64 Years | 0 (0.0%) | 0 (0.0%) |
| 65 to 74 Years | 15 (100.0%) | 0 (0.0%) |
| 75 Years and over | 0 (0.0%) | 0 (0.0%) |
| Total | 49 (48.0%) | 0 (0.0%) |
Employment Status by Educational Attainment in Blue Clay Farms
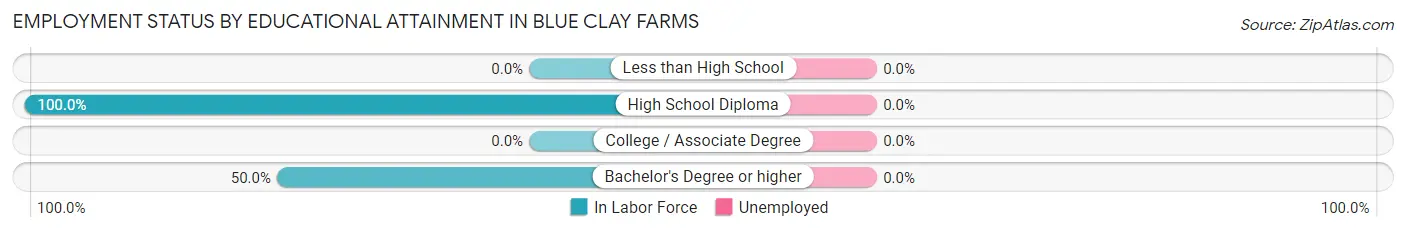
| Educational Attainment | In Labor Force | Unemployed |
| Less than High School | 0 (0.0%) | 0 (0.0%) |
| High School Diploma | 13 (100.0%) | 0 (0.0%) |
| College / Associate Degree | 0 (0.0%) | 0 (0.0%) |
| Bachelor's Degree or higher | 21 (50.0%) | 0 (0.0%) |
| Total | 34 (39.1%) | 0 (0.0%) |
Employment Occupations by Sex in Blue Clay Farms
Management, Business, Science and Arts Occupations
The most common Management, Business, Science and Arts occupations in Blue Clay Farms are Computers, Engineering & Science (21 | 42.9%), Architecture & Engineering (21 | 42.9%), and Business & Financial (15 | 30.6%).
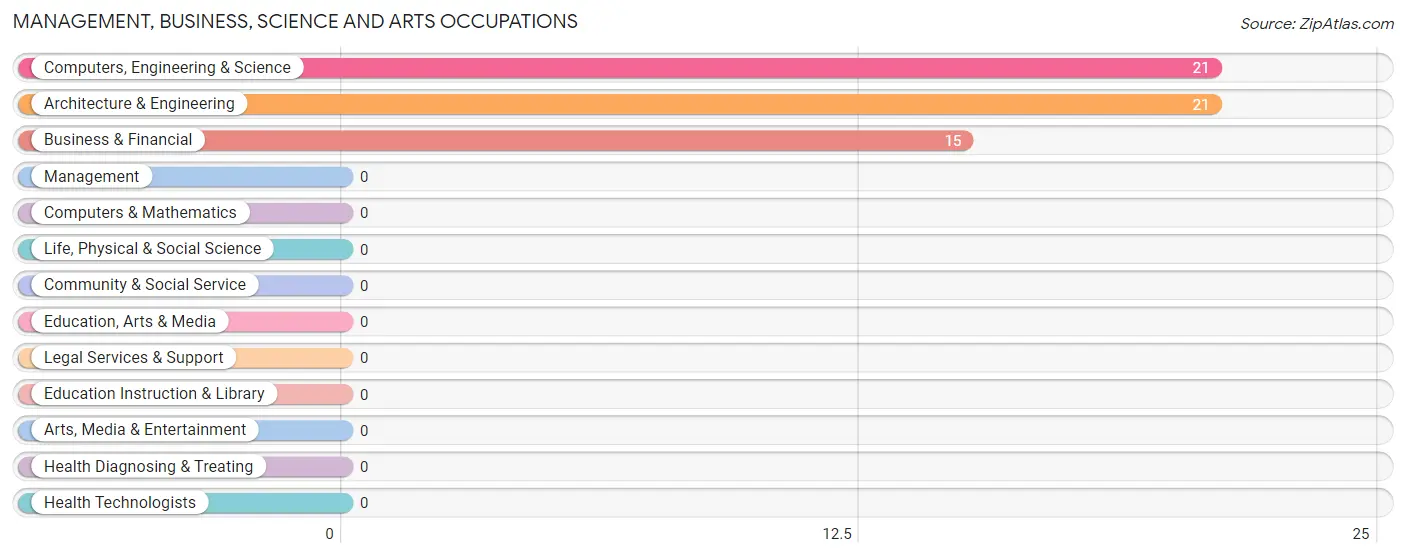
Management, Business, Science and Arts Occupations by Sex
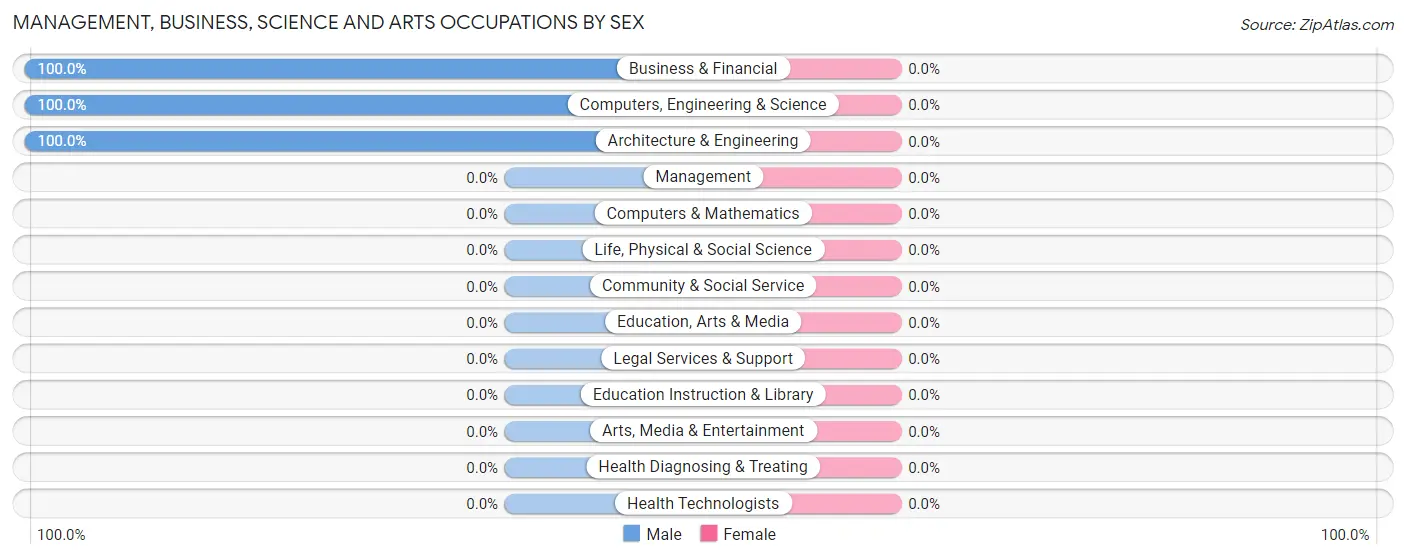
| Occupation | Male | Female |
| Management | 0 (0.0%) | 0 (0.0%) |
| Business & Financial | 15 (100.0%) | 0 (0.0%) |
| Computers, Engineering & Science | 21 (100.0%) | 0 (0.0%) |
| Computers & Mathematics | 0 (0.0%) | 0 (0.0%) |
| Architecture & Engineering | 21 (100.0%) | 0 (0.0%) |
| Life, Physical & Social Science | 0 (0.0%) | 0 (0.0%) |
| Community & Social Service | 0 (0.0%) | 0 (0.0%) |
| Education, Arts & Media | 0 (0.0%) | 0 (0.0%) |
| Legal Services & Support | 0 (0.0%) | 0 (0.0%) |
| Education Instruction & Library | 0 (0.0%) | 0 (0.0%) |
| Arts, Media & Entertainment | 0 (0.0%) | 0 (0.0%) |
| Health Diagnosing & Treating | 0 (0.0%) | 0 (0.0%) |
| Health Technologists | 0 (0.0%) | 0 (0.0%) |
| Total (Category) | 36 (100.0%) | 0 (0.0%) |
| Total (Overall) | 49 (100.0%) | 0 (0.0%) |
Services Occupations
Services Occupations by Sex
| Occupation | Male | Female |
| Healthcare Support | 0 (0.0%) | 0 (0.0%) |
| Security & Protection | 0 (0.0%) | 0 (0.0%) |
| Firefighting & Prevention | 0 (0.0%) | 0 (0.0%) |
| Law Enforcement | 0 (0.0%) | 0 (0.0%) |
| Food Preparation & Serving | 0 (0.0%) | 0 (0.0%) |
| Cleaning & Maintenance | 0 (0.0%) | 0 (0.0%) |
| Personal Care & Service | 0 (0.0%) | 0 (0.0%) |
| Total (Category) | 0 (0.0%) | 0 (0.0%) |
| Total (Overall) | 49 (100.0%) | 0 (0.0%) |
Sales and Office Occupations

Sales and Office Occupations by Sex
| Occupation | Male | Female |
| Sales & Related | 0 (0.0%) | 0 (0.0%) |
| Office & Administration | 0 (0.0%) | 0 (0.0%) |
| Total (Category) | 0 (0.0%) | 0 (0.0%) |
| Total (Overall) | 49 (100.0%) | 0 (0.0%) |
Natural Resources, Construction and Maintenance Occupations
Natural Resources, Construction and Maintenance Occupations by Sex
| Occupation | Male | Female |
| Farming, Fishing & Forestry | 0 (0.0%) | 0 (0.0%) |
| Construction & Extraction | 0 (0.0%) | 0 (0.0%) |
| Installation, Maintenance & Repair | 0 (0.0%) | 0 (0.0%) |
| Total (Category) | 0 (0.0%) | 0 (0.0%) |
| Total (Overall) | 49 (100.0%) | 0 (0.0%) |
Production, Transportation and Moving Occupations
The most common Production, Transportation and Moving occupations in Blue Clay Farms are , and Material Moving (13 | 26.5%).
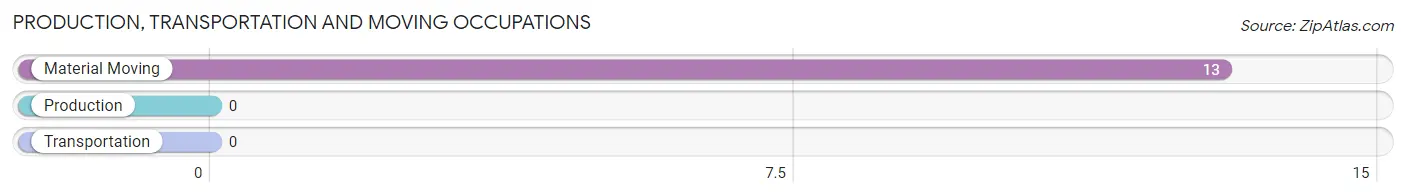
Production, Transportation and Moving Occupations by Sex
| Occupation | Male | Female |
| Production | 0 (0.0%) | 0 (0.0%) |
| Transportation | 0 (0.0%) | 0 (0.0%) |
| Material Moving | 13 (100.0%) | 0 (0.0%) |
| Total (Category) | 13 (100.0%) | 0 (0.0%) |
| Total (Overall) | 49 (100.0%) | 0 (0.0%) |
Employment Industries by Sex in Blue Clay Farms
Employment Industries in Blue Clay Farms
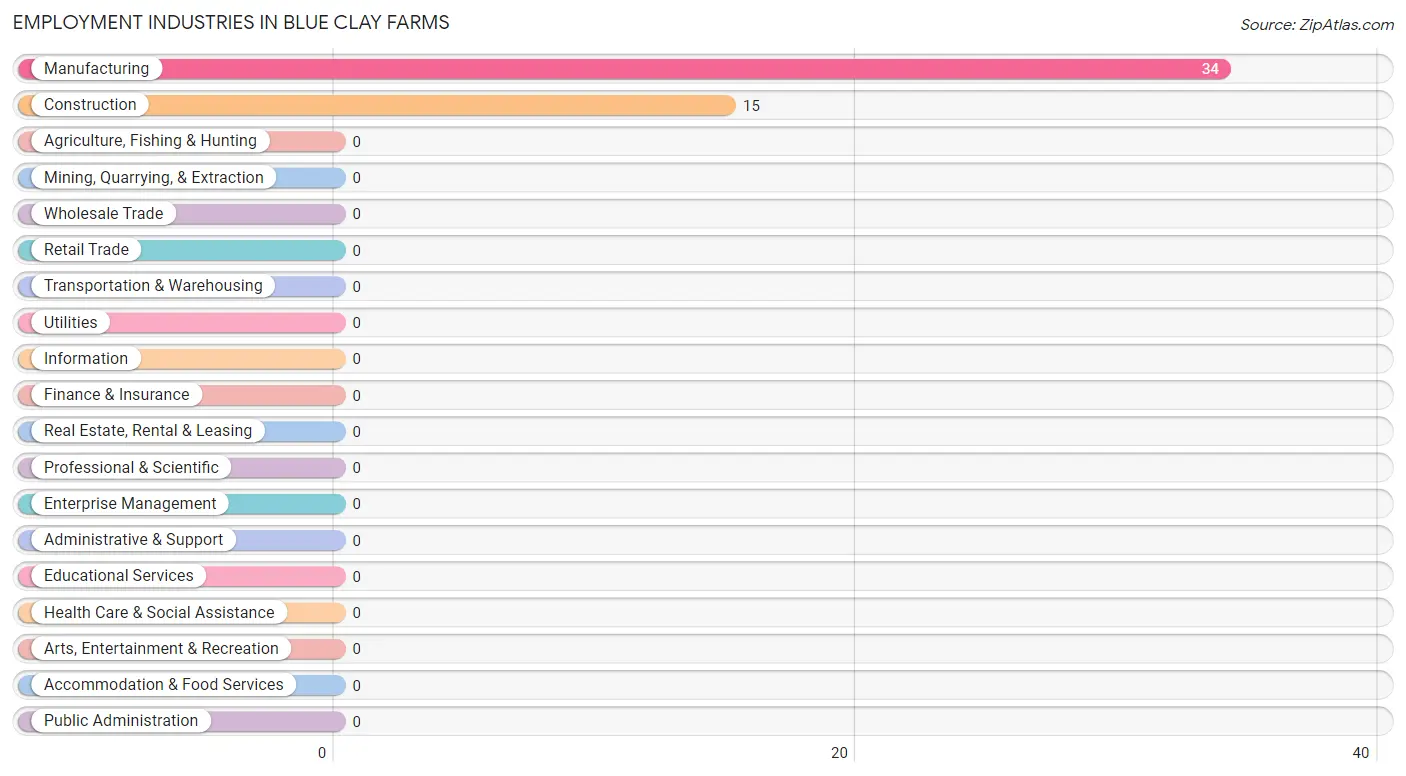
The major employment industries in Blue Clay Farms include Manufacturing (34 | 69.4%), and Construction (15 | 30.6%).
Employment Industries by Sex in Blue Clay Farms
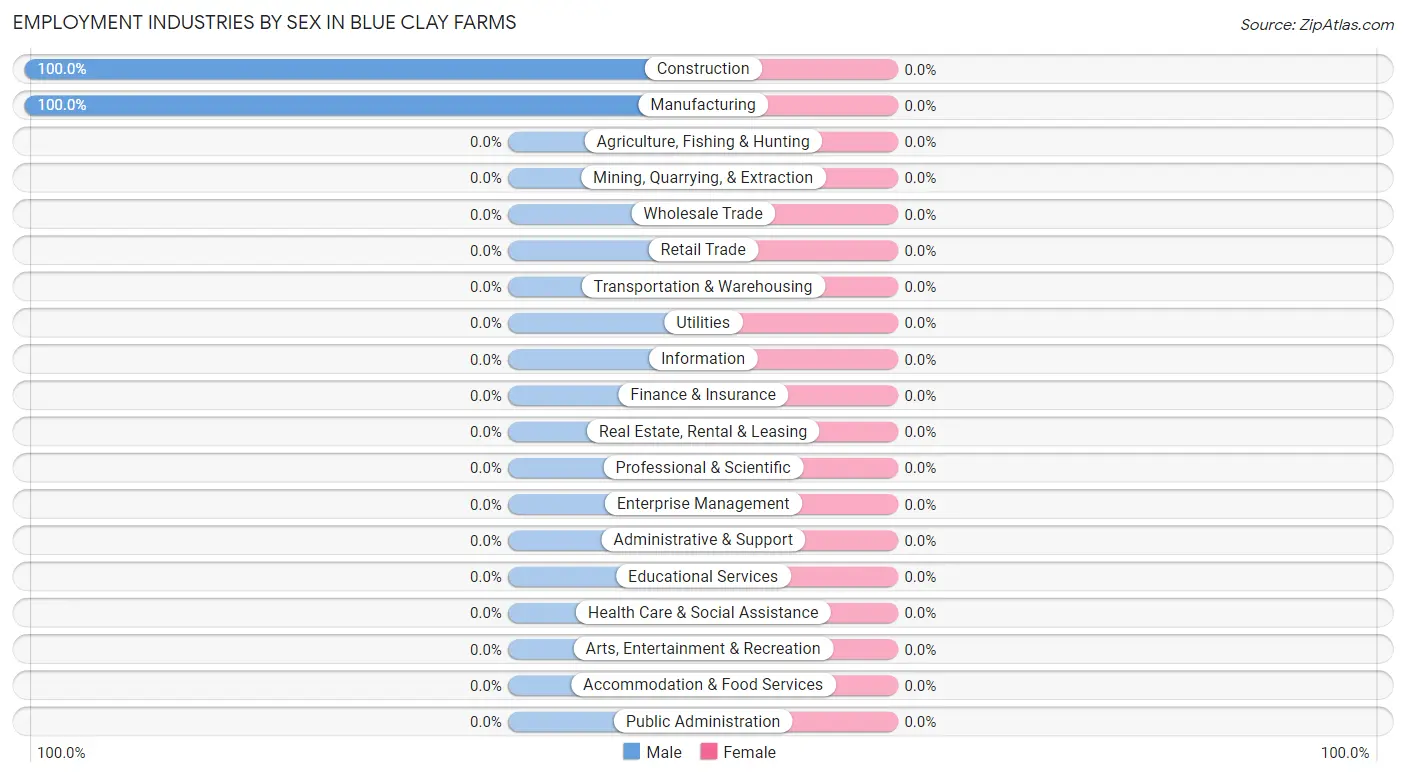
| Industry | Male | Female |
| Agriculture, Fishing & Hunting | 0 (0.0%) | 0 (0.0%) |
| Mining, Quarrying, & Extraction | 0 (0.0%) | 0 (0.0%) |
| Construction | 15 (100.0%) | 0 (0.0%) |
| Manufacturing | 34 (100.0%) | 0 (0.0%) |
| Wholesale Trade | 0 (0.0%) | 0 (0.0%) |
| Retail Trade | 0 (0.0%) | 0 (0.0%) |
| Transportation & Warehousing | 0 (0.0%) | 0 (0.0%) |
| Utilities | 0 (0.0%) | 0 (0.0%) |
| Information | 0 (0.0%) | 0 (0.0%) |
| Finance & Insurance | 0 (0.0%) | 0 (0.0%) |
| Real Estate, Rental & Leasing | 0 (0.0%) | 0 (0.0%) |
| Professional & Scientific | 0 (0.0%) | 0 (0.0%) |
| Enterprise Management | 0 (0.0%) | 0 (0.0%) |
| Administrative & Support | 0 (0.0%) | 0 (0.0%) |
| Educational Services | 0 (0.0%) | 0 (0.0%) |
| Health Care & Social Assistance | 0 (0.0%) | 0 (0.0%) |
| Arts, Entertainment & Recreation | 0 (0.0%) | 0 (0.0%) |
| Accommodation & Food Services | 0 (0.0%) | 0 (0.0%) |
| Public Administration | 0 (0.0%) | 0 (0.0%) |
| Total | 49 (100.0%) | 0 (0.0%) |
Education in Blue Clay Farms
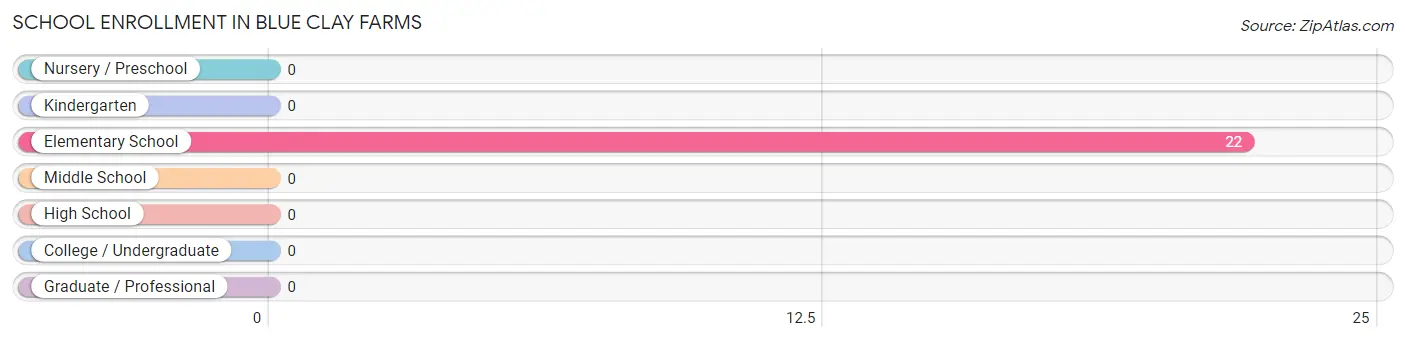
School Enrollment in Blue Clay Farms
| School Level | # Students | % Students |
| Nursery / Preschool | 0 | 0.0% |
| Kindergarten | 0 | 0.0% |
| Elementary School | 22 | 100.0% |
| Middle School | 0 | 0.0% |
| High School | 0 | 0.0% |
| College / Undergraduate | 0 | 0.0% |
| Graduate / Professional | 0 | 0.0% |
| Total | 22 | 100.0% |
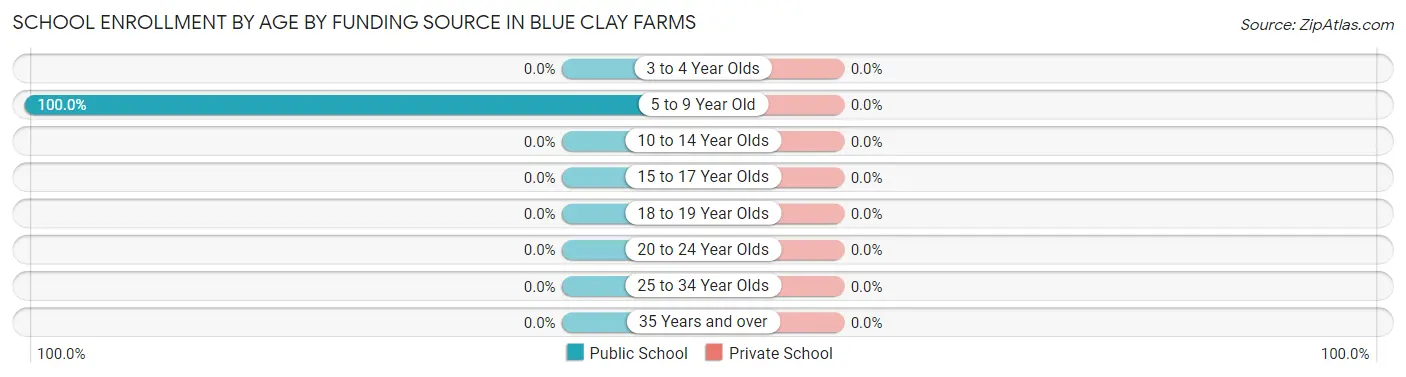
School Enrollment by Age by Funding Source in Blue Clay Farms
| Age Bracket | Public School | Private School |
| 3 to 4 Year Olds | 0 (0.0%) | 0 (0.0%) |
| 5 to 9 Year Old | 22 (100.0%) | 0 (0.0%) |
| 10 to 14 Year Olds | 0 (0.0%) | 0 (0.0%) |
| 15 to 17 Year Olds | 0 (0.0%) | 0 (0.0%) |
| 18 to 19 Year Olds | 0 (0.0%) | 0 (0.0%) |
| 20 to 24 Year Olds | 0 (0.0%) | 0 (0.0%) |
| 25 to 34 Year Olds | 0 (0.0%) | 0 (0.0%) |
| 35 Years and over | 0 (0.0%) | 0 (0.0%) |
| Total | 22 (100.0%) | 0 (0.0%) |
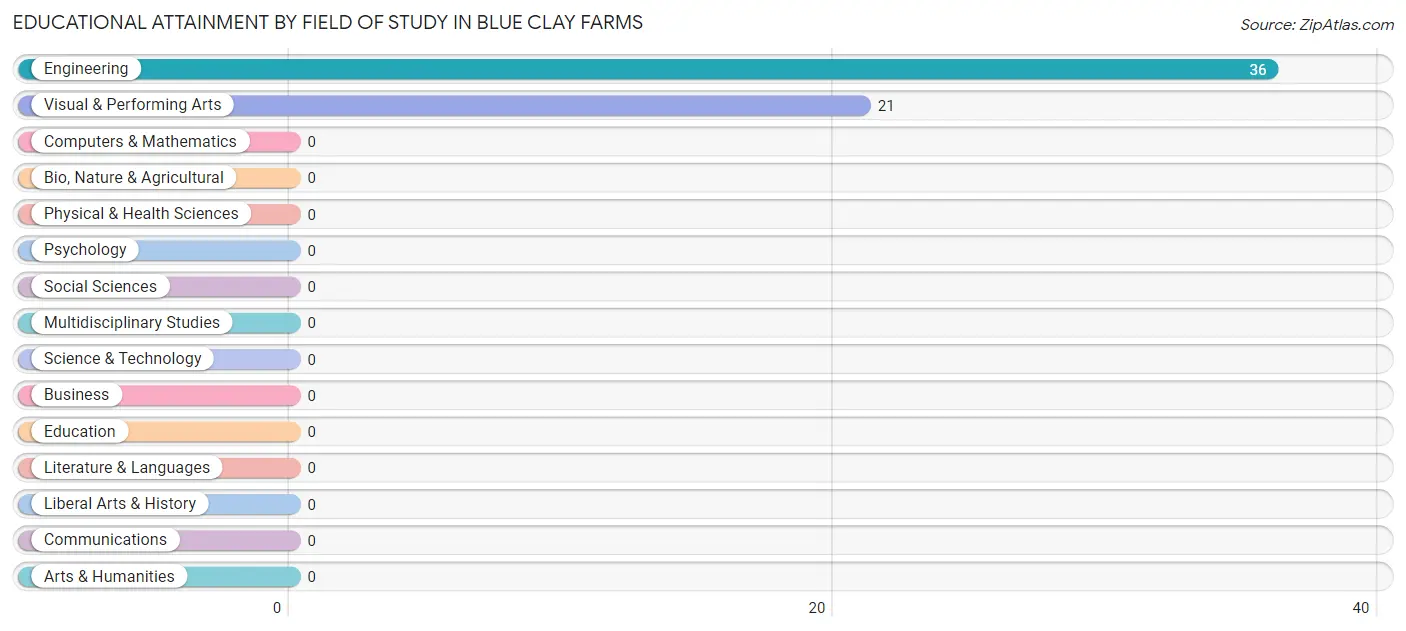
Educational Attainment by Field of Study in Blue Clay Farms
Engineering (36 | 63.2%), and visual & performing arts (21 | 36.8%) are the most common fields of study among 57 individuals in Blue Clay Farms who have obtained a bachelor's degree or higher.
| Field of Study | # Graduates | % Graduates |
| Computers & Mathematics | 0 | 0.0% |
| Bio, Nature & Agricultural | 0 | 0.0% |
| Physical & Health Sciences | 0 | 0.0% |
| Psychology | 0 | 0.0% |
| Social Sciences | 0 | 0.0% |
| Engineering | 36 | 63.2% |
| Multidisciplinary Studies | 0 | 0.0% |
| Science & Technology | 0 | 0.0% |
| Business | 0 | 0.0% |
| Education | 0 | 0.0% |
| Literature & Languages | 0 | 0.0% |
| Liberal Arts & History | 0 | 0.0% |
| Visual & Performing Arts | 21 | 36.8% |
| Communications | 0 | 0.0% |
| Arts & Humanities | 0 | 0.0% |
| Total | 57 | 100.0% |
Transportation & Commute in Blue Clay Farms
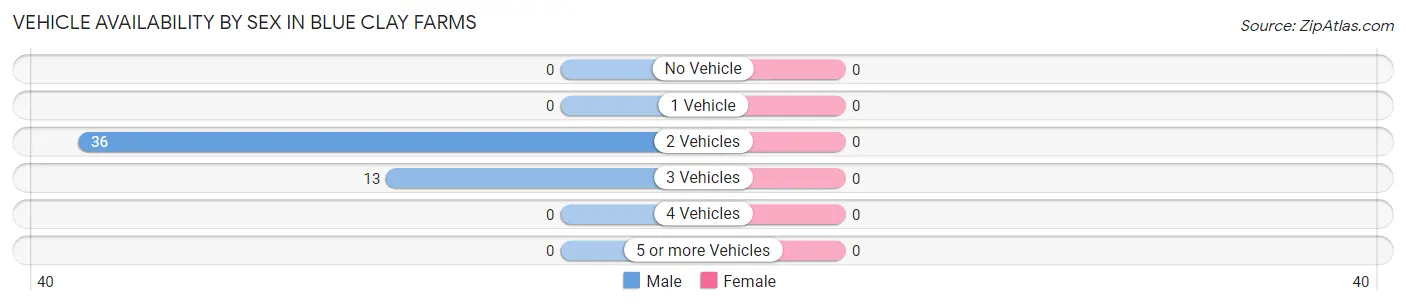
Vehicle Availability by Sex in Blue Clay Farms
| Vehicles Available | Male | Female |
| No Vehicle | 0 (0.0%) | 0 (0.0%) |
| 1 Vehicle | 0 (0.0%) | 0 (0.0%) |
| 2 Vehicles | 36 (73.5%) | 0 (0.0%) |
| 3 Vehicles | 13 (26.5%) | 0 (0.0%) |
| 4 Vehicles | 0 (0.0%) | 0 (0.0%) |
| 5 or more Vehicles | 0 (0.0%) | 0 (0.0%) |
| Total | 49 (100.0%) | 0 (0.0%) |
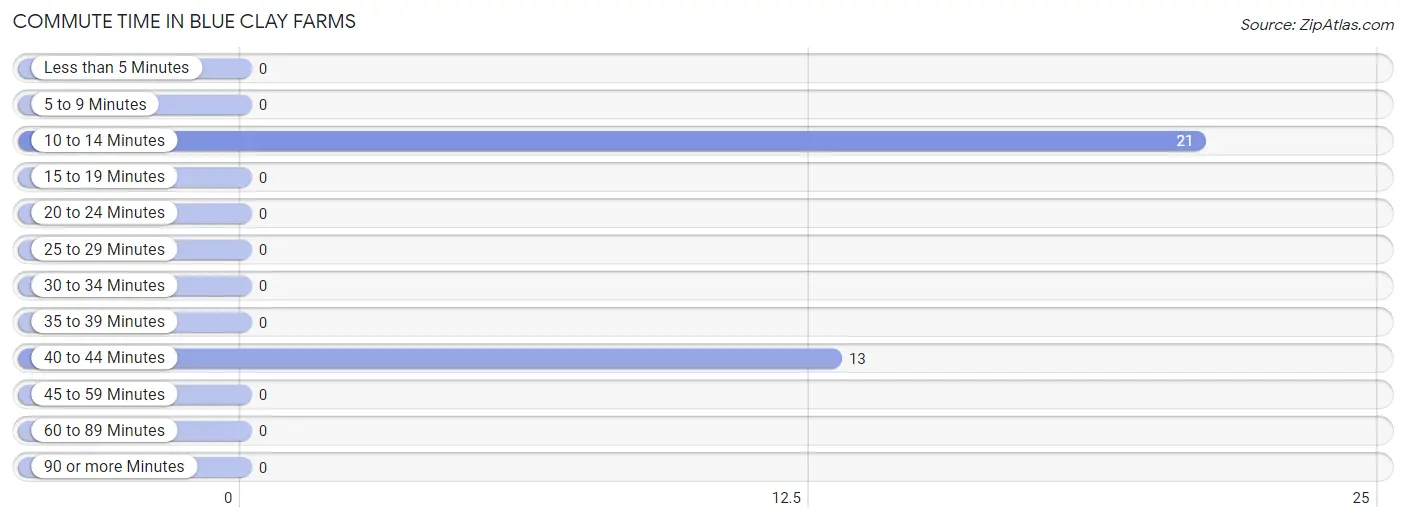
Commute Time in Blue Clay Farms
The most frequently occuring commute durations in Blue Clay Farms are 10 to 14 minutes (21 commuters, 61.8%), 40 to 44 minutes (13 commuters, 38.2%), and less than 5 minutes (0 commuters, 0.0%).
| Commute Time | # Commuters | % Commuters |
| Less than 5 Minutes | 0 | 0.0% |
| 5 to 9 Minutes | 0 | 0.0% |
| 10 to 14 Minutes | 21 | 61.8% |
| 15 to 19 Minutes | 0 | 0.0% |
| 20 to 24 Minutes | 0 | 0.0% |
| 25 to 29 Minutes | 0 | 0.0% |
| 30 to 34 Minutes | 0 | 0.0% |
| 35 to 39 Minutes | 0 | 0.0% |
| 40 to 44 Minutes | 13 | 38.2% |
| 45 to 59 Minutes | 0 | 0.0% |
| 60 to 89 Minutes | 0 | 0.0% |
| 90 or more Minutes | 0 | 0.0% |
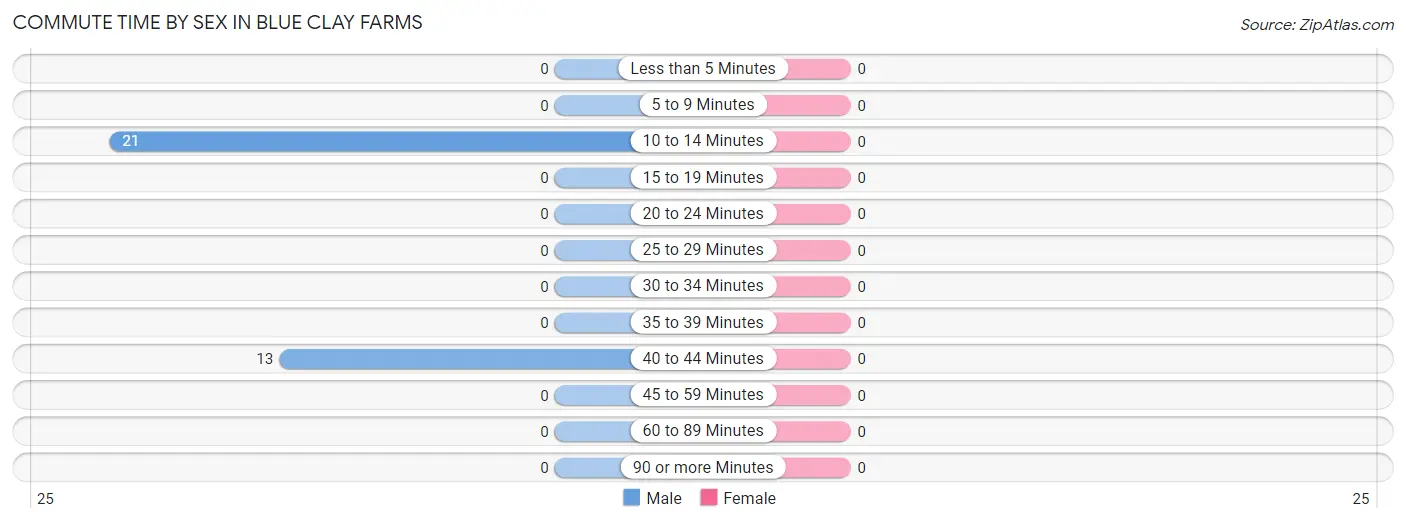
Commute Time by Sex in Blue Clay Farms
| Commute Time | Male | Female |
| Less than 5 Minutes | 0 (0.0%) | 0 (0.0%) |
| 5 to 9 Minutes | 0 (0.0%) | 0 (0.0%) |
| 10 to 14 Minutes | 21 (61.8%) | 0 (0.0%) |
| 15 to 19 Minutes | 0 (0.0%) | 0 (0.0%) |
| 20 to 24 Minutes | 0 (0.0%) | 0 (0.0%) |
| 25 to 29 Minutes | 0 (0.0%) | 0 (0.0%) |
| 30 to 34 Minutes | 0 (0.0%) | 0 (0.0%) |
| 35 to 39 Minutes | 0 (0.0%) | 0 (0.0%) |
| 40 to 44 Minutes | 13 (38.2%) | 0 (0.0%) |
| 45 to 59 Minutes | 0 (0.0%) | 0 (0.0%) |
| 60 to 89 Minutes | 0 (0.0%) | 0 (0.0%) |
| 90 or more Minutes | 0 (0.0%) | 0 (0.0%) |
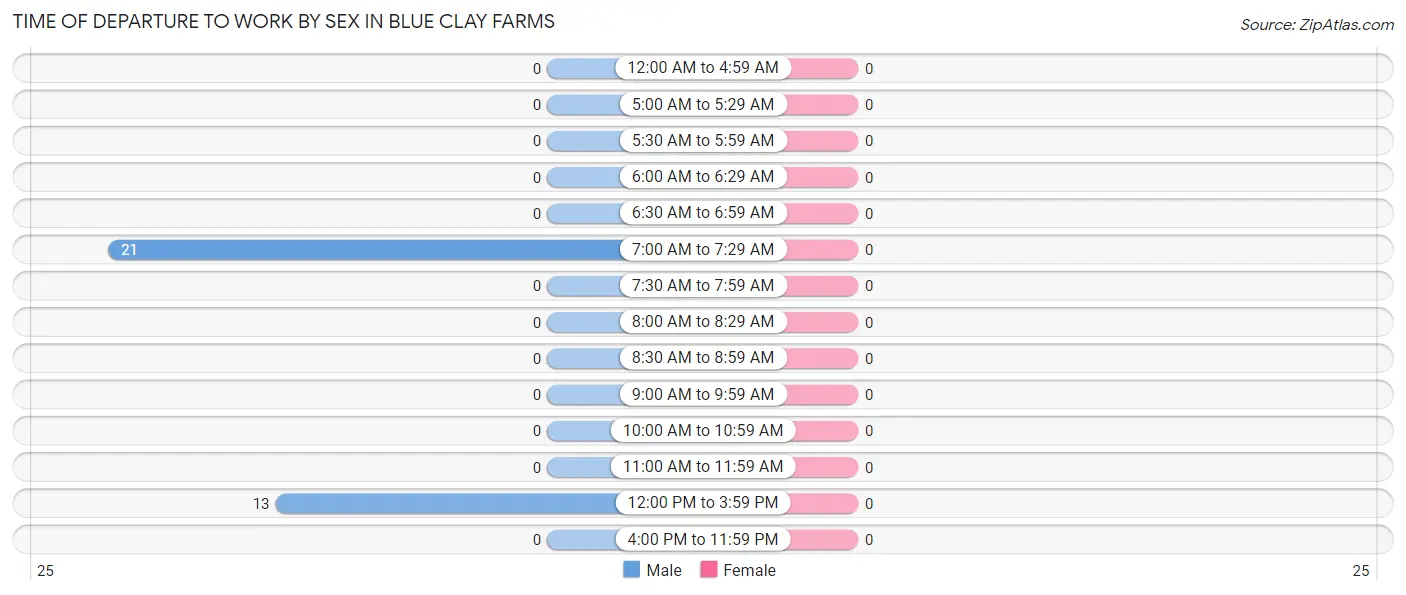
Time of Departure to Work by Sex in Blue Clay Farms
| Time of Departure | Male | Female |
| 12:00 AM to 4:59 AM | 0 (0.0%) | 0 (0.0%) |
| 5:00 AM to 5:29 AM | 0 (0.0%) | 0 (0.0%) |
| 5:30 AM to 5:59 AM | 0 (0.0%) | 0 (0.0%) |
| 6:00 AM to 6:29 AM | 0 (0.0%) | 0 (0.0%) |
| 6:30 AM to 6:59 AM | 0 (0.0%) | 0 (0.0%) |
| 7:00 AM to 7:29 AM | 21 (61.8%) | 0 (0.0%) |
| 7:30 AM to 7:59 AM | 0 (0.0%) | 0 (0.0%) |
| 8:00 AM to 8:29 AM | 0 (0.0%) | 0 (0.0%) |
| 8:30 AM to 8:59 AM | 0 (0.0%) | 0 (0.0%) |
| 9:00 AM to 9:59 AM | 0 (0.0%) | 0 (0.0%) |
| 10:00 AM to 10:59 AM | 0 (0.0%) | 0 (0.0%) |
| 11:00 AM to 11:59 AM | 0 (0.0%) | 0 (0.0%) |
| 12:00 PM to 3:59 PM | 13 (38.2%) | 0 (0.0%) |
| 4:00 PM to 11:59 PM | 0 (0.0%) | 0 (0.0%) |
| Total | 34 (100.0%) | 0 (0.0%) |
Housing Occupancy in Blue Clay Farms
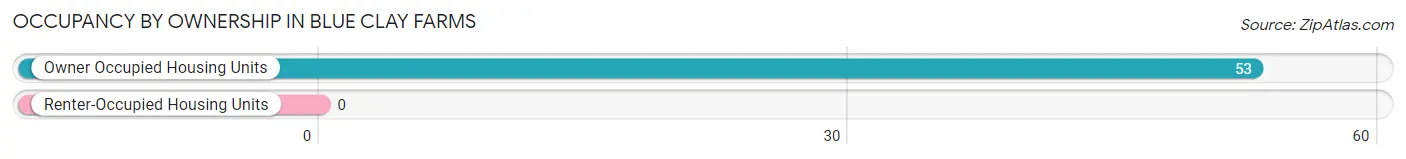
Occupancy by Ownership in Blue Clay Farms
Of the total 53 dwellings in Blue Clay Farms, owner-occupied units account for 53 (100.0%), while renter-occupied units make up 0 (0.0%).
| Occupancy | # Housing Units | % Housing Units |
| Owner Occupied Housing Units | 53 | 100.0% |
| Renter-Occupied Housing Units | 0 | 0.0% |
| Total Occupied Housing Units | 53 | 100.0% |
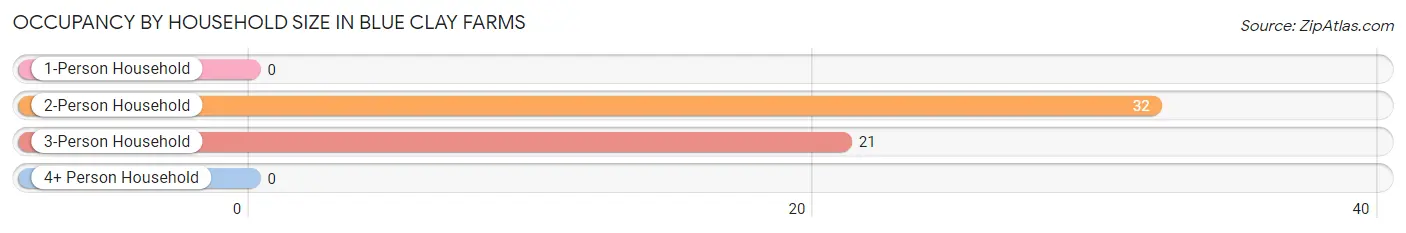
Occupancy by Household Size in Blue Clay Farms
| Household Size | # Housing Units | % Housing Units |
| 1-Person Household | 0 | 0.0% |
| 2-Person Household | 32 | 60.4% |
| 3-Person Household | 21 | 39.6% |
| 4+ Person Household | 0 | 0.0% |
| Total Housing Units | 53 | 100.0% |
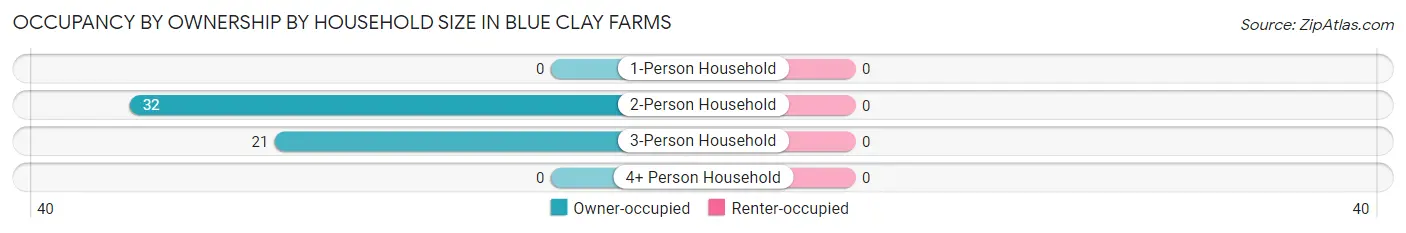
Occupancy by Ownership by Household Size in Blue Clay Farms
| Household Size | Owner-occupied | Renter-occupied |
| 1-Person Household | 0 (0.0%) | 0 (0.0%) |
| 2-Person Household | 32 (100.0%) | 0 (0.0%) |
| 3-Person Household | 21 (100.0%) | 0 (0.0%) |
| 4+ Person Household | 0 (0.0%) | 0 (0.0%) |
| Total Housing Units | 53 (100.0%) | 0 (0.0%) |
Occupancy by Educational Attainment in Blue Clay Farms
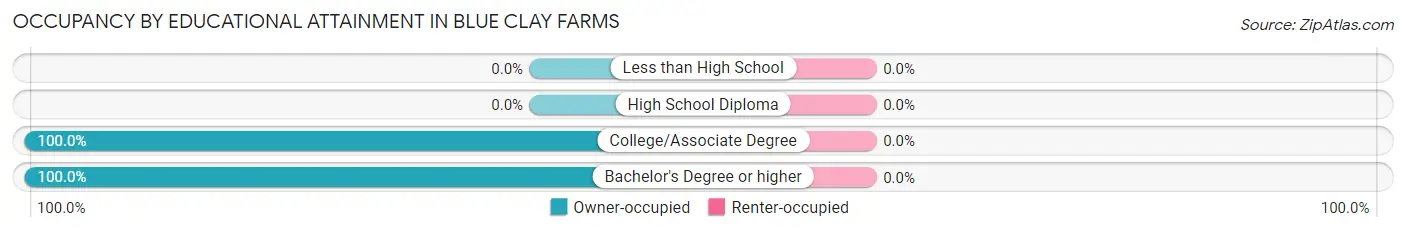
| Household Size | Owner-occupied | Renter-occupied |
| Less than High School | 0 (0.0%) | 0 (0.0%) |
| High School Diploma | 0 (0.0%) | 0 (0.0%) |
| College/Associate Degree | 32 (100.0%) | 0 (0.0%) |
| Bachelor's Degree or higher | 21 (100.0%) | 0 (0.0%) |
Occupancy by Age of Householder in Blue Clay Farms
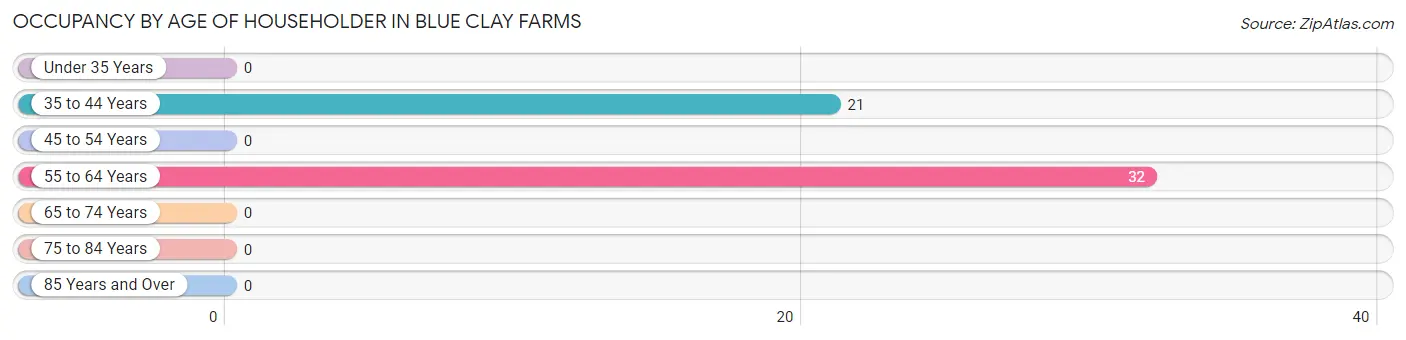
| Age Bracket | # Households | % Households |
| Under 35 Years | 0 | 0.0% |
| 35 to 44 Years | 21 | 39.6% |
| 45 to 54 Years | 0 | 0.0% |
| 55 to 64 Years | 32 | 60.4% |
| 65 to 74 Years | 0 | 0.0% |
| 75 to 84 Years | 0 | 0.0% |
| 85 Years and Over | 0 | 0.0% |
| Total | 53 | 100.0% |
Housing Finances in Blue Clay Farms
Median Income by Occupancy in Blue Clay Farms
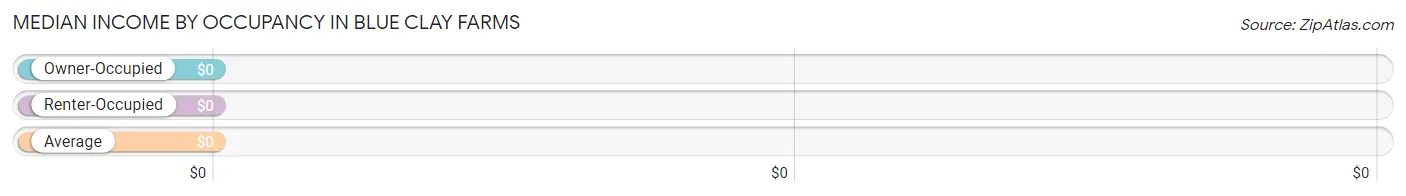
| Occupancy Type | # Households | Median Income |
| Owner-Occupied | 53 (100.0%) | $0 |
| Renter-Occupied | 0 (0.0%) | $0 |
| Average | 53 (100.0%) | $0 |
Occupancy by Householder Income Bracket in Blue Clay Farms
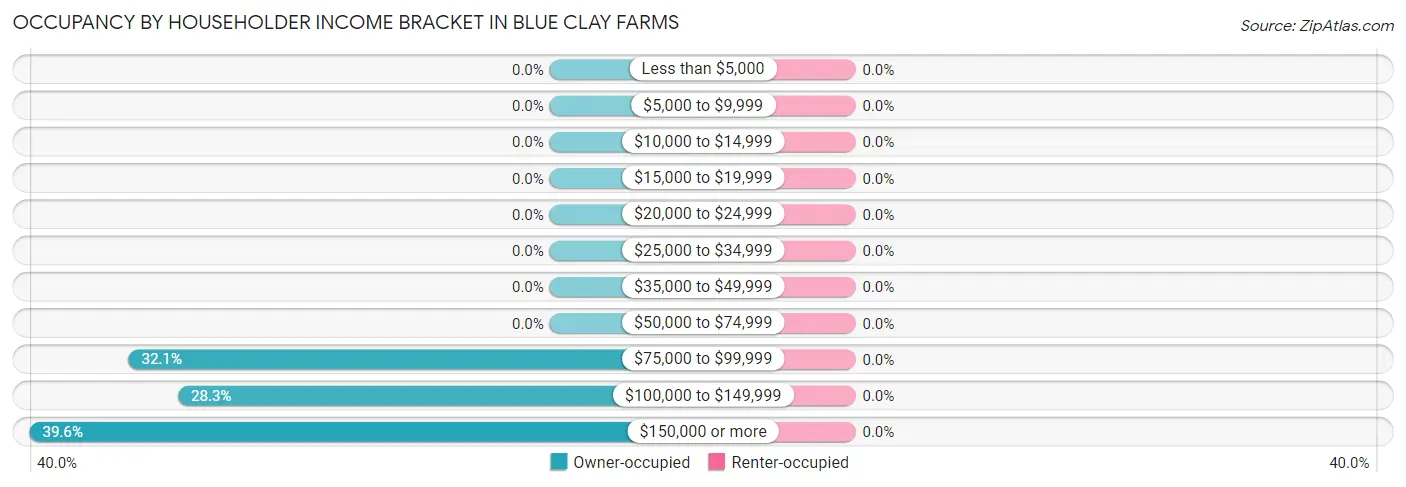
| Income Bracket | Owner-occupied | Renter-occupied |
| Less than $5,000 | 0 (0.0%) | 0 (0.0%) |
| $5,000 to $9,999 | 0 (0.0%) | 0 (0.0%) |
| $10,000 to $14,999 | 0 (0.0%) | 0 (0.0%) |
| $15,000 to $19,999 | 0 (0.0%) | 0 (0.0%) |
| $20,000 to $24,999 | 0 (0.0%) | 0 (0.0%) |
| $25,000 to $34,999 | 0 (0.0%) | 0 (0.0%) |
| $35,000 to $49,999 | 0 (0.0%) | 0 (0.0%) |
| $50,000 to $74,999 | 0 (0.0%) | 0 (0.0%) |
| $75,000 to $99,999 | 17 (32.1%) | 0 (0.0%) |
| $100,000 to $149,999 | 15 (28.3%) | 0 (0.0%) |
| $150,000 or more | 21 (39.6%) | 0 (0.0%) |
| Total | 53 (100.0%) | 0 (0.0%) |
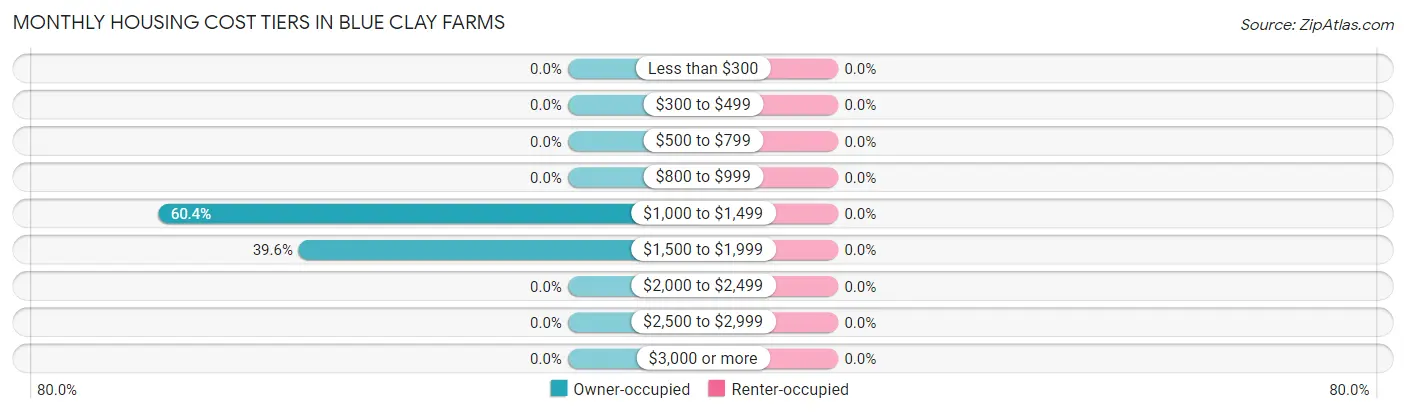
Monthly Housing Cost Tiers in Blue Clay Farms
| Monthly Cost | Owner-occupied | Renter-occupied |
| Less than $300 | 0 (0.0%) | 0 (0.0%) |
| $300 to $499 | 0 (0.0%) | 0 (0.0%) |
| $500 to $799 | 0 (0.0%) | 0 (0.0%) |
| $800 to $999 | 0 (0.0%) | 0 (0.0%) |
| $1,000 to $1,499 | 32 (60.4%) | 0 (0.0%) |
| $1,500 to $1,999 | 21 (39.6%) | 0 (0.0%) |
| $2,000 to $2,499 | 0 (0.0%) | 0 (0.0%) |
| $2,500 to $2,999 | 0 (0.0%) | 0 (0.0%) |
| $3,000 or more | 0 (0.0%) | 0 (0.0%) |
| Total | 53 (100.0%) | 0 (0.0%) |
Physical Housing Characteristics in Blue Clay Farms
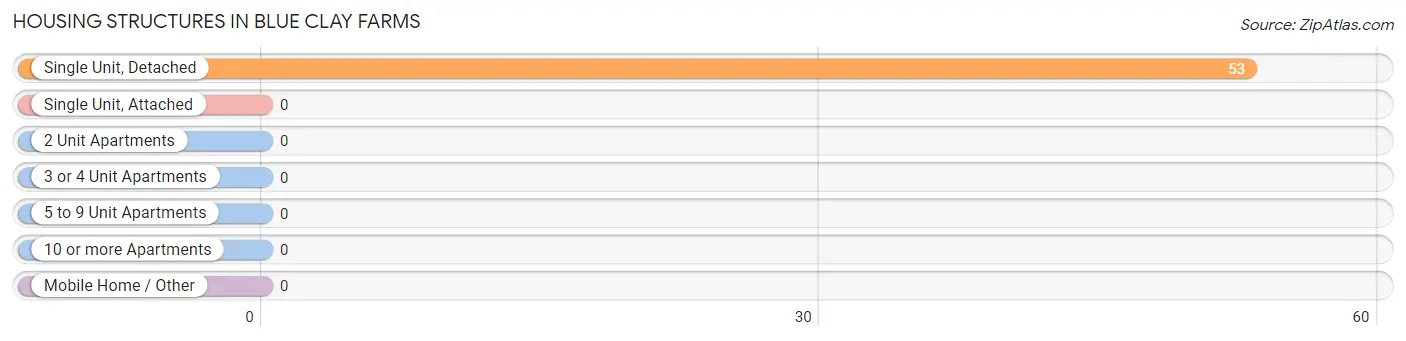
Housing Structures in Blue Clay Farms
| Structure Type | # Housing Units | % Housing Units |
| Single Unit, Detached | 53 | 100.0% |
| Single Unit, Attached | 0 | 0.0% |
| 2 Unit Apartments | 0 | 0.0% |
| 3 or 4 Unit Apartments | 0 | 0.0% |
| 5 to 9 Unit Apartments | 0 | 0.0% |
| 10 or more Apartments | 0 | 0.0% |
| Mobile Home / Other | 0 | 0.0% |
| Total | 53 | 100.0% |
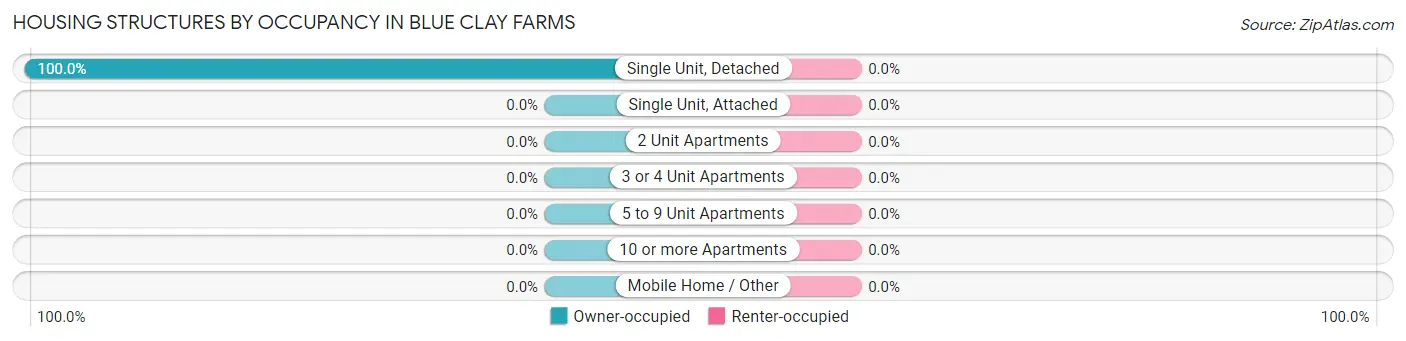
Housing Structures by Occupancy in Blue Clay Farms
| Structure Type | Owner-occupied | Renter-occupied |
| Single Unit, Detached | 53 (100.0%) | 0 (0.0%) |
| Single Unit, Attached | 0 (0.0%) | 0 (0.0%) |
| 2 Unit Apartments | 0 (0.0%) | 0 (0.0%) |
| 3 or 4 Unit Apartments | 0 (0.0%) | 0 (0.0%) |
| 5 to 9 Unit Apartments | 0 (0.0%) | 0 (0.0%) |
| 10 or more Apartments | 0 (0.0%) | 0 (0.0%) |
| Mobile Home / Other | 0 (0.0%) | 0 (0.0%) |
| Total | 53 (100.0%) | 0 (0.0%) |
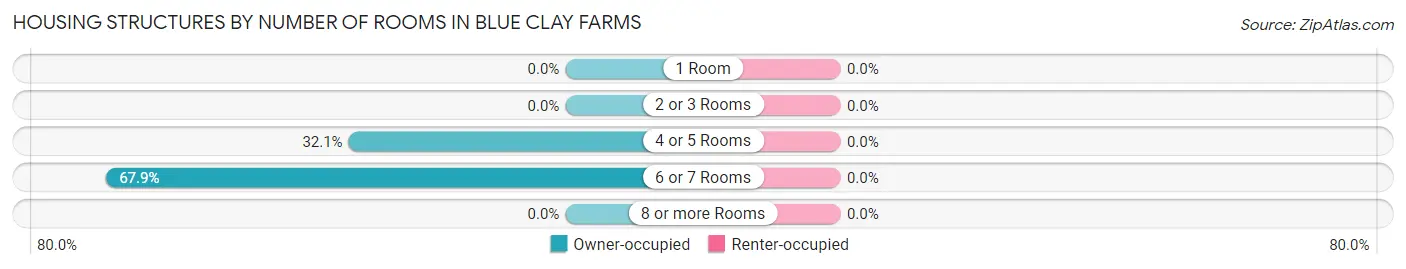
Housing Structures by Number of Rooms in Blue Clay Farms
| Number of Rooms | Owner-occupied | Renter-occupied |
| 1 Room | 0 (0.0%) | 0 (0.0%) |
| 2 or 3 Rooms | 0 (0.0%) | 0 (0.0%) |
| 4 or 5 Rooms | 17 (32.1%) | 0 (0.0%) |
| 6 or 7 Rooms | 36 (67.9%) | 0 (0.0%) |
| 8 or more Rooms | 0 (0.0%) | 0 (0.0%) |
| Total | 53 (100.0%) | 0 (0.0%) |
Housing Structure by Heating Type in Blue Clay Farms
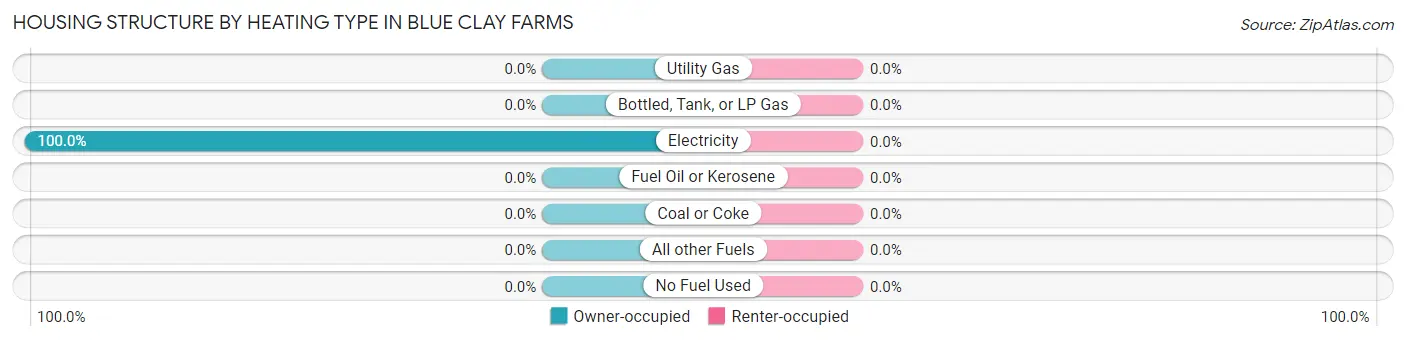
| Heating Type | Owner-occupied | Renter-occupied |
| Utility Gas | 0 (0.0%) | 0 (0.0%) |
| Bottled, Tank, or LP Gas | 0 (0.0%) | 0 (0.0%) |
| Electricity | 53 (100.0%) | 0 (0.0%) |
| Fuel Oil or Kerosene | 0 (0.0%) | 0 (0.0%) |
| Coal or Coke | 0 (0.0%) | 0 (0.0%) |
| All other Fuels | 0 (0.0%) | 0 (0.0%) |
| No Fuel Used | 0 (0.0%) | 0 (0.0%) |
| Total | 53 (100.0%) | 0 (0.0%) |
Household Vehicle Usage in Blue Clay Farms
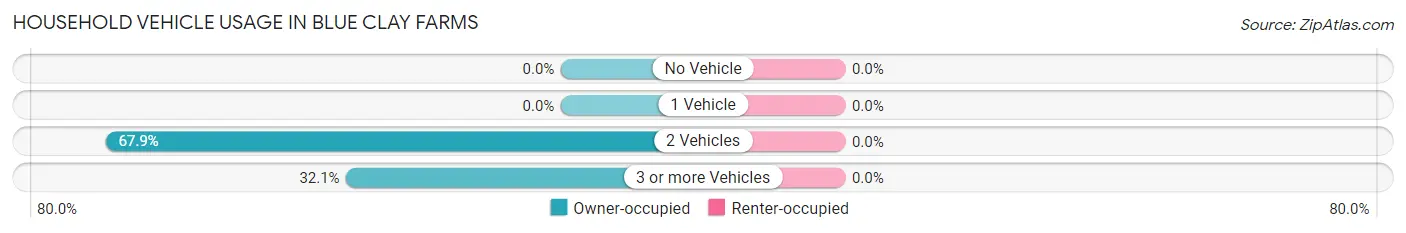
| Vehicles per Household | Owner-occupied | Renter-occupied |
| No Vehicle | 0 (0.0%) | 0 (0.0%) |
| 1 Vehicle | 0 (0.0%) | 0 (0.0%) |
| 2 Vehicles | 36 (67.9%) | 0 (0.0%) |
| 3 or more Vehicles | 17 (32.1%) | 0 (0.0%) |
| Total | 53 (100.0%) | 0 (0.0%) |
Real Estate & Mortgages in Blue Clay Farms
Real Estate and Mortgage Overview in Blue Clay Farms
| Characteristic | Without Mortgage | With Mortgage |
| Housing Units | 0 | 53 |
| Median Property Value | - | - |
| Median Household Income | - | - |
| Monthly Housing Costs | - | - |
| Real Estate Taxes | - | - |
Property Value by Mortgage Status in Blue Clay Farms
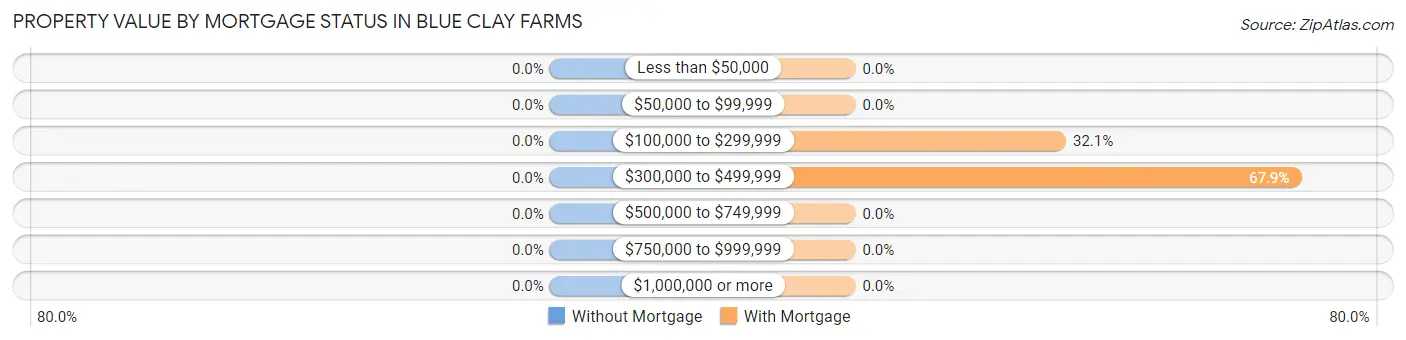
| Property Value | Without Mortgage | With Mortgage |
| Less than $50,000 | 0 (0.0%) | 0 (0.0%) |
| $50,000 to $99,999 | 0 (0.0%) | 0 (0.0%) |
| $100,000 to $299,999 | 0 (0.0%) | 17 (32.1%) |
| $300,000 to $499,999 | 0 (0.0%) | 36 (67.9%) |
| $500,000 to $749,999 | 0 (0.0%) | 0 (0.0%) |
| $750,000 to $999,999 | 0 (0.0%) | 0 (0.0%) |
| $1,000,000 or more | 0 (0.0%) | 0 (0.0%) |
| Total | 0 (0.0%) | 53 (100.0%) |
Household Income by Mortgage Status in Blue Clay Farms
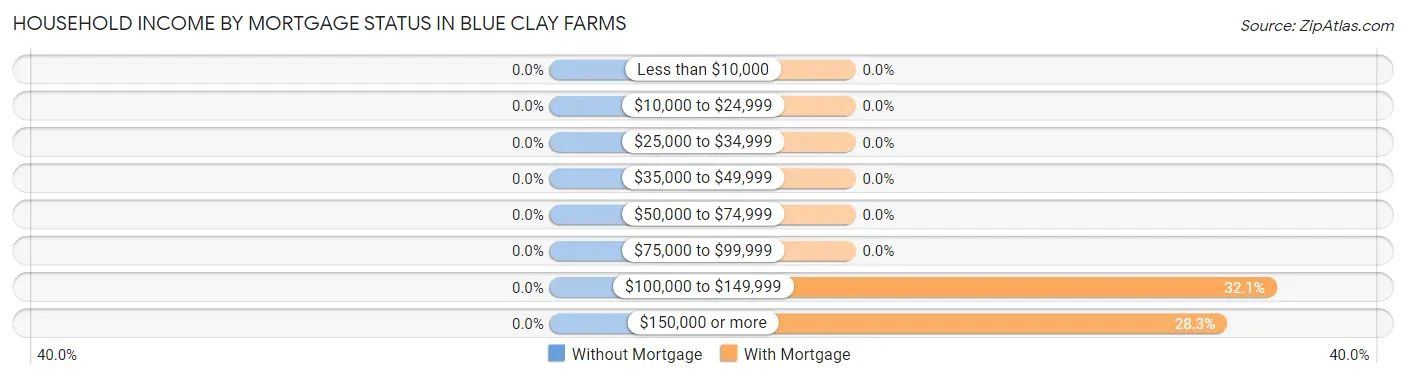
| Household Income | Without Mortgage | With Mortgage |
| Less than $10,000 | 0 (0.0%) | 0 (0.0%) |
| $10,000 to $24,999 | 0 (0.0%) | 0 (0.0%) |
| $25,000 to $34,999 | 0 (0.0%) | 0 (0.0%) |
| $35,000 to $49,999 | 0 (0.0%) | 0 (0.0%) |
| $50,000 to $74,999 | 0 (0.0%) | 0 (0.0%) |
| $75,000 to $99,999 | 0 (0.0%) | 0 (0.0%) |
| $100,000 to $149,999 | 0 (0.0%) | 17 (32.1%) |
| $150,000 or more | 0 (0.0%) | 15 (28.3%) |
| Total | 0 (0.0%) | 53 (100.0%) |
Property Value to Household Income Ratio in Blue Clay Farms
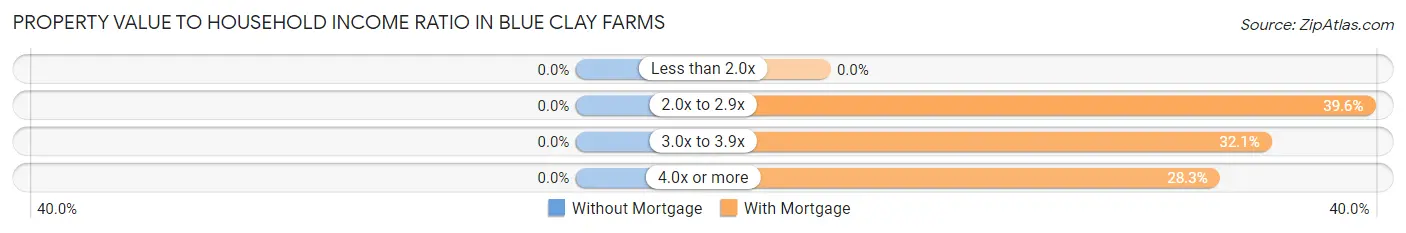
| Value-to-Income Ratio | Without Mortgage | With Mortgage |
| Less than 2.0x | 0 (0.0%) | 0 (0.0%) |
| 2.0x to 2.9x | 0 (0.0%) | 21 (39.6%) |
| 3.0x to 3.9x | 0 (0.0%) | 17 (32.1%) |
| 4.0x or more | 0 (0.0%) | 15 (28.3%) |
| Total | 0 (0.0%) | 53 (100.0%) |
Real Estate Taxes by Mortgage Status in Blue Clay Farms
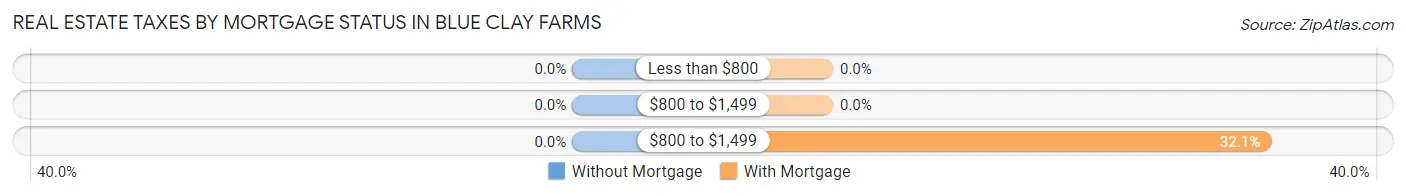
| Property Taxes | Without Mortgage | With Mortgage |
| Less than $800 | 0 (0.0%) | 0 (0.0%) |
| $800 to $1,499 | 0 (0.0%) | 0 (0.0%) |
| $800 to $1,499 | 0 (0.0%) | 17 (32.1%) |
| Total | 0 (0.0%) | 53 (100.0%) |
Health & Disability in Blue Clay Farms
Health Insurance Coverage by Age in Blue Clay Farms
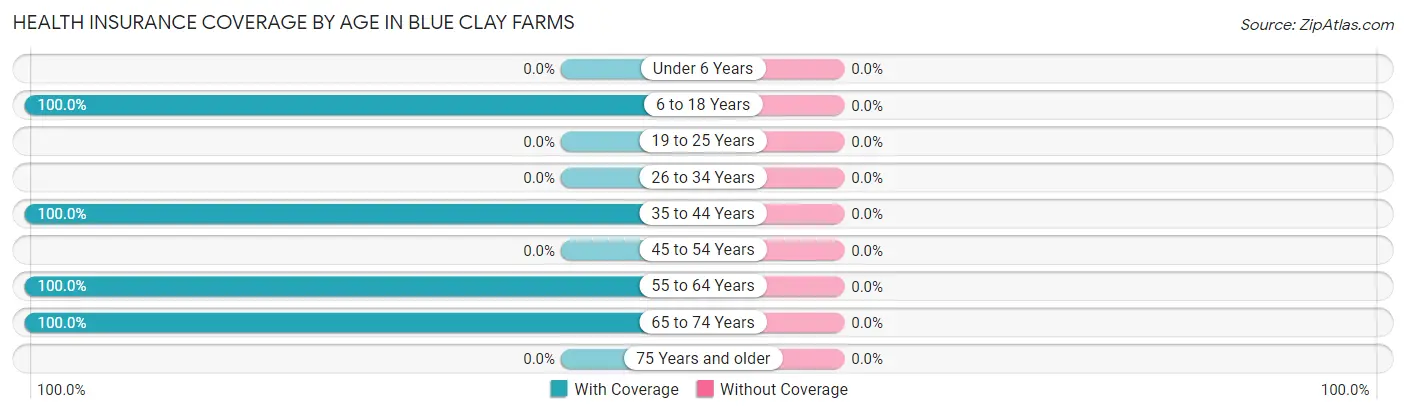
| Age Bracket | With Coverage | Without Coverage |
| Under 6 Years | 0 (0.0%) | 0 (0.0%) |
| 6 to 18 Years | 22 (100.0%) | 0 (0.0%) |
| 19 to 25 Years | 0 (0.0%) | 0 (0.0%) |
| 26 to 34 Years | 0 (0.0%) | 0 (0.0%) |
| 35 to 44 Years | 42 (100.0%) | 0 (0.0%) |
| 45 to 54 Years | 0 (0.0%) | 0 (0.0%) |
| 55 to 64 Years | 45 (100.0%) | 0 (0.0%) |
| 65 to 74 Years | 15 (100.0%) | 0 (0.0%) |
| 75 Years and older | 0 (0.0%) | 0 (0.0%) |
| Total | 124 (100.0%) | 0 (0.0%) |
Health Insurance Coverage by Citizenship Status in Blue Clay Farms
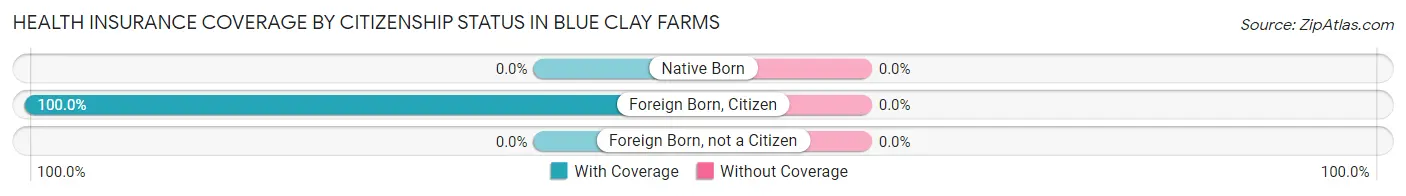
| Citizenship Status | With Coverage | Without Coverage |
| Native Born | 0 (0.0%) | 0 (0.0%) |
| Foreign Born, Citizen | 22 (100.0%) | 0 (0.0%) |
| Foreign Born, not a Citizen | 0 (0.0%) | 0 (0.0%) |
Health Insurance Coverage by Household Income in Blue Clay Farms
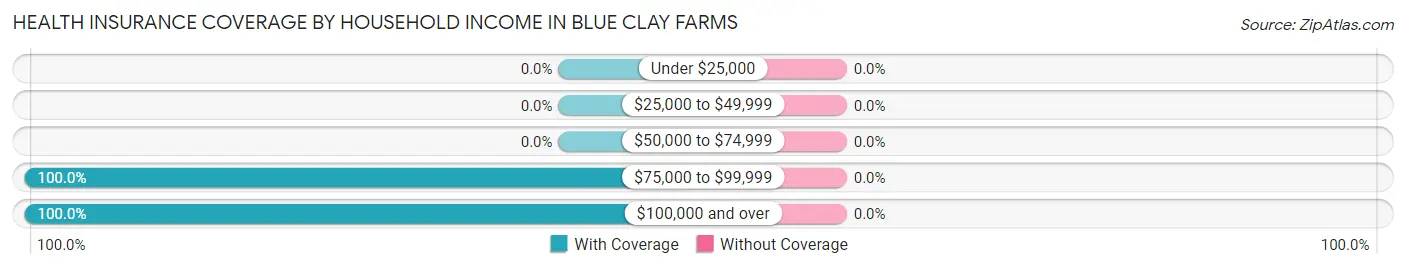
| Household Income | With Coverage | Without Coverage |
| Under $25,000 | 0 (0.0%) | 0 (0.0%) |
| $25,000 to $49,999 | 0 (0.0%) | 0 (0.0%) |
| $50,000 to $74,999 | 0 (0.0%) | 0 (0.0%) |
| $75,000 to $99,999 | 30 (100.0%) | 0 (0.0%) |
| $100,000 and over | 94 (100.0%) | 0 (0.0%) |
Public vs Private Health Insurance Coverage by Age in Blue Clay Farms
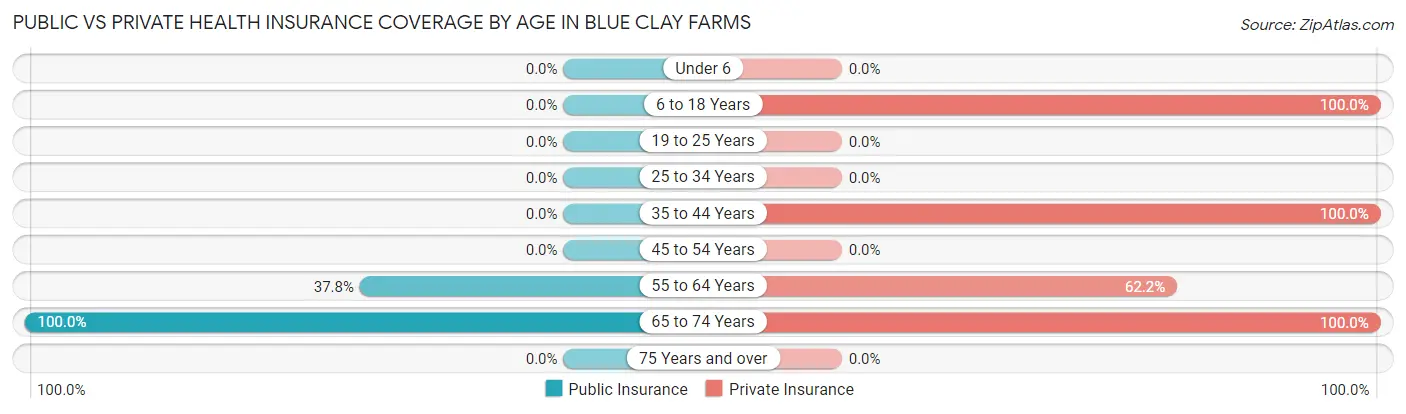
| Age Bracket | Public Insurance | Private Insurance |
| Under 6 | 0 (0.0%) | 0 (0.0%) |
| 6 to 18 Years | 0 (0.0%) | 22 (100.0%) |
| 19 to 25 Years | 0 (0.0%) | 0 (0.0%) |
| 25 to 34 Years | 0 (0.0%) | 0 (0.0%) |
| 35 to 44 Years | 0 (0.0%) | 42 (100.0%) |
| 45 to 54 Years | 0 (0.0%) | 0 (0.0%) |
| 55 to 64 Years | 17 (37.8%) | 28 (62.2%) |
| 65 to 74 Years | 15 (100.0%) | 15 (100.0%) |
| 75 Years and over | 0 (0.0%) | 0 (0.0%) |
| Total | 32 (25.8%) | 107 (86.3%) |
Disability Status by Sex by Age in Blue Clay Farms
| Age Bracket | Male | Female |
| Under 5 Years | 0 (0.0%) | 0 (0.0%) |
| 5 to 17 Years | 0 (0.0%) | 0 (0.0%) |
| 18 to 34 Years | 0 (0.0%) | 0 (0.0%) |
| 35 to 64 Years | 0 (0.0%) | 0 (0.0%) |
| 65 to 74 Years | 0 (0.0%) | 0 (0.0%) |
| 75 Years and over | 0 (0.0%) | 0 (0.0%) |
Disability Class by Sex by Age in Blue Clay Farms
Disability Class: Hearing Difficulty
| Age Bracket | Male | Female |
| Under 5 Years | 0 (0.0%) | 0 (0.0%) |
| 5 to 17 Years | 0 (0.0%) | 0 (0.0%) |
| 18 to 34 Years | 0 (0.0%) | 0 (0.0%) |
| 35 to 64 Years | 0 (0.0%) | 0 (0.0%) |
| 65 to 74 Years | 0 (0.0%) | 0 (0.0%) |
| 75 Years and over | 0 (0.0%) | 0 (0.0%) |
Disability Class: Vision Difficulty
| Age Bracket | Male | Female |
| Under 5 Years | 0 (0.0%) | 0 (0.0%) |
| 5 to 17 Years | 0 (0.0%) | 0 (0.0%) |
| 18 to 34 Years | 0 (0.0%) | 0 (0.0%) |
| 35 to 64 Years | 0 (0.0%) | 0 (0.0%) |
| 65 to 74 Years | 0 (0.0%) | 0 (0.0%) |
| 75 Years and over | 0 (0.0%) | 0 (0.0%) |
Disability Class: Cognitive Difficulty
| Age Bracket | Male | Female |
| 5 to 17 Years | 0 (0.0%) | 0 (0.0%) |
| 18 to 34 Years | 0 (0.0%) | 0 (0.0%) |
| 35 to 64 Years | 0 (0.0%) | 0 (0.0%) |
| 65 to 74 Years | 0 (0.0%) | 0 (0.0%) |
| 75 Years and over | 0 (0.0%) | 0 (0.0%) |
Disability Class: Ambulatory Difficulty
| Age Bracket | Male | Female |
| 5 to 17 Years | 0 (0.0%) | 0 (0.0%) |
| 18 to 34 Years | 0 (0.0%) | 0 (0.0%) |
| 35 to 64 Years | 0 (0.0%) | 0 (0.0%) |
| 65 to 74 Years | 0 (0.0%) | 0 (0.0%) |
| 75 Years and over | 0 (0.0%) | 0 (0.0%) |
Disability Class: Self-Care Difficulty
| Age Bracket | Male | Female |
| 5 to 17 Years | 0 (0.0%) | 0 (0.0%) |
| 18 to 34 Years | 0 (0.0%) | 0 (0.0%) |
| 35 to 64 Years | 0 (0.0%) | 0 (0.0%) |
| 65 to 74 Years | 0 (0.0%) | 0 (0.0%) |
| 75 Years and over | 0 (0.0%) | 0 (0.0%) |
Technology Access in Blue Clay Farms
Computing Device Access in Blue Clay Farms
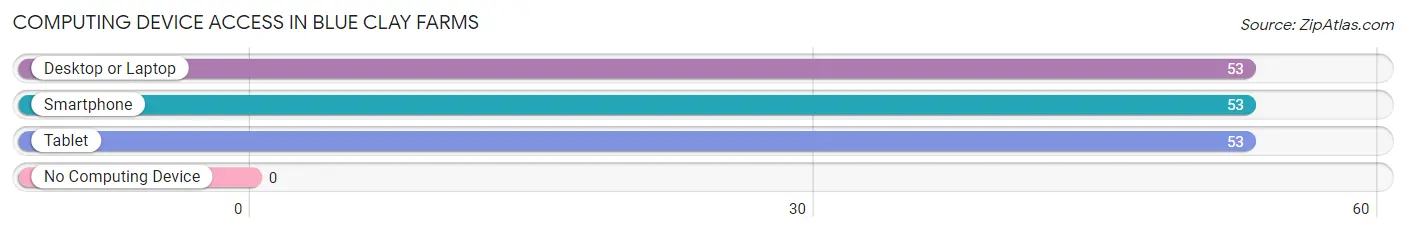
| Device Type | # Households | % Households |
| Desktop or Laptop | 53 | 100.0% |
| Smartphone | 53 | 100.0% |
| Tablet | 53 | 100.0% |
| No Computing Device | 0 | 0.0% |
| Total | 53 | 100.0% |
Internet Access in Blue Clay Farms
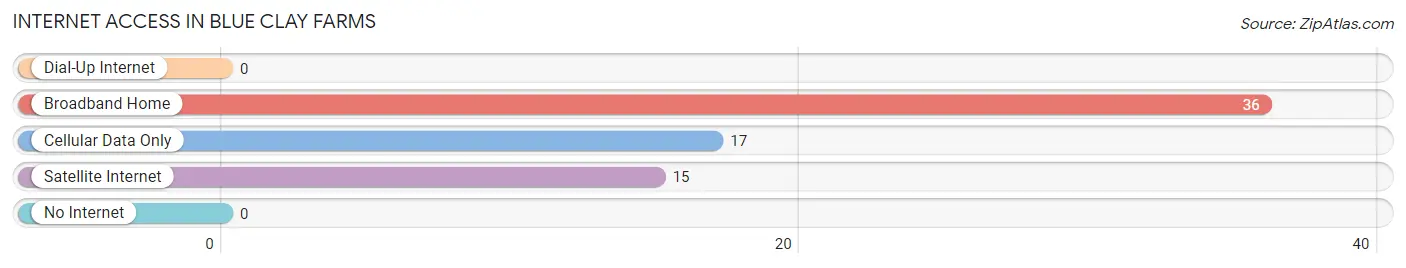
| Internet Type | # Households | % Households |
| Dial-Up Internet | 0 | 0.0% |
| Broadband Home | 36 | 67.9% |
| Cellular Data Only | 17 | 32.1% |
| Satellite Internet | 15 | 28.3% |
| No Internet | 0 | 0.0% |
| Total | 53 | 100.0% |
Blue Clay Farms Summary
Clay County, North Carolina is located in the southeastern corner of the state, and is home to the small town of Blue Clay Farms. The county is bordered by Johnston County to the north, Wayne County to the east, and Sampson County to the south. The county seat is the town of Blue Clay Farms, which is located in the center of the county.
History
Clay County was formed in 1855 from parts of Johnston and Wayne counties. The county was named for Henry Clay, a prominent statesman and senator from Kentucky. The county was originally home to the Tuscarora Indians, who were driven out by settlers in the late 1700s.
The town of Blue Clay Farms was founded in 1858 by a group of settlers from Johnston County. The town was named for the blue clay found in the area, which was used to make pottery and other items. The town quickly grew, and by the early 1900s, it was a thriving agricultural center.
Geography
Clay County is located in the southeastern corner of North Carolina. The county is bordered by Johnston County to the north, Wayne County to the east, and Sampson County to the south. The county is mostly rural, with the majority of the land being used for farming and timber production. The county is home to several small towns, including Blue Clay Farms, which is the county seat.
The terrain of Clay County is mostly flat, with some rolling hills in the northern part of the county. The county is drained by the Neuse River, which flows through the county from north to south. The county is also home to several small lakes, including Lake Waccamaw, which is located in the southern part of the county.
Economy
The economy of Clay County is largely based on agriculture. The county is home to several large farms, which produce a variety of crops, including corn, soybeans, cotton, and tobacco. The county is also home to several timber companies, which harvest timber from the county’s forests.
In addition to agriculture, Clay County is home to several small businesses, including restaurants, retail stores, and service providers. The county is also home to several manufacturing companies, which produce a variety of products, including furniture, textiles, and electronics.
Demographics
As of the 2010 census, Clay County had a population of 21,845. The population is mostly white (87.3%), with small percentages of African Americans (7.7%), Hispanics (2.3%), and Asians (1.2%). The median household income in the county is $41,945, and the median home value is $133,400.
The majority of the population (77.3%) is employed in the service industry, while the remainder is employed in manufacturing (10.2%), retail (7.2%), and agriculture (5.3%). The unemployment rate in the county is 5.2%, which is slightly lower than the national average.
Conclusion
Clay County, North Carolina is a rural county located in the southeastern corner of the state. The county is home to the small town of Blue Clay Farms, which is the county seat. The economy of the county is largely based on agriculture, with several large farms producing a variety of crops. The population of the county is mostly white, with small percentages of African Americans, Hispanics, and Asians. The median household income in the county is $41,945, and the unemployment rate is 5.2%.
Common Questions
What is Per Capita Income in Blue Clay Farms?
Per Capita income in Blue Clay Farms is $64,573.
What is Inequality or Gini Index in Blue Clay Farms?
Inequality or Gini Index in Blue Clay Farms is 0.25.
What is the Total Population of Blue Clay Farms?
Total Population of Blue Clay Farms is 124.
What is the Total Male Population of Blue Clay Farms?
Total Male Population of Blue Clay Farms is 71.
What is the Total Female Population of Blue Clay Farms?
Total Female Population of Blue Clay Farms is 53.
What is the Ratio of Males per 100 Females in Blue Clay Farms?
There are 133.96 Males per 100 Females in Blue Clay Farms.
What is the Ratio of Females per 100 Males in Blue Clay Farms?
There are 74.65 Females per 100 Males in Blue Clay Farms.
What is the Median Population Age in Blue Clay Farms?
Median Population Age in Blue Clay Farms is 41.9 Years.
What is the Average Family Size in Blue Clay Farms
Average Family Size in Blue Clay Farms is 2.3 People.
What is the Average Household Size in Blue Clay Farms
Average Household Size in Blue Clay Farms is 2.3 People.
How Large is the Labor Force in Blue Clay Farms?
There are 49 People in the Labor Forcein in Blue Clay Farms.
What is the Percentage of People in the Labor Force in Blue Clay Farms?
48.0% of People are in the Labor Force in Blue Clay Farms.