Zip Codes with the Highest Percentage of Population Employed in Architecture & Engineering in the United States
RELATED REPORTS & OPTIONS
Architecture & Engineering
United States
Compare Zip Codes
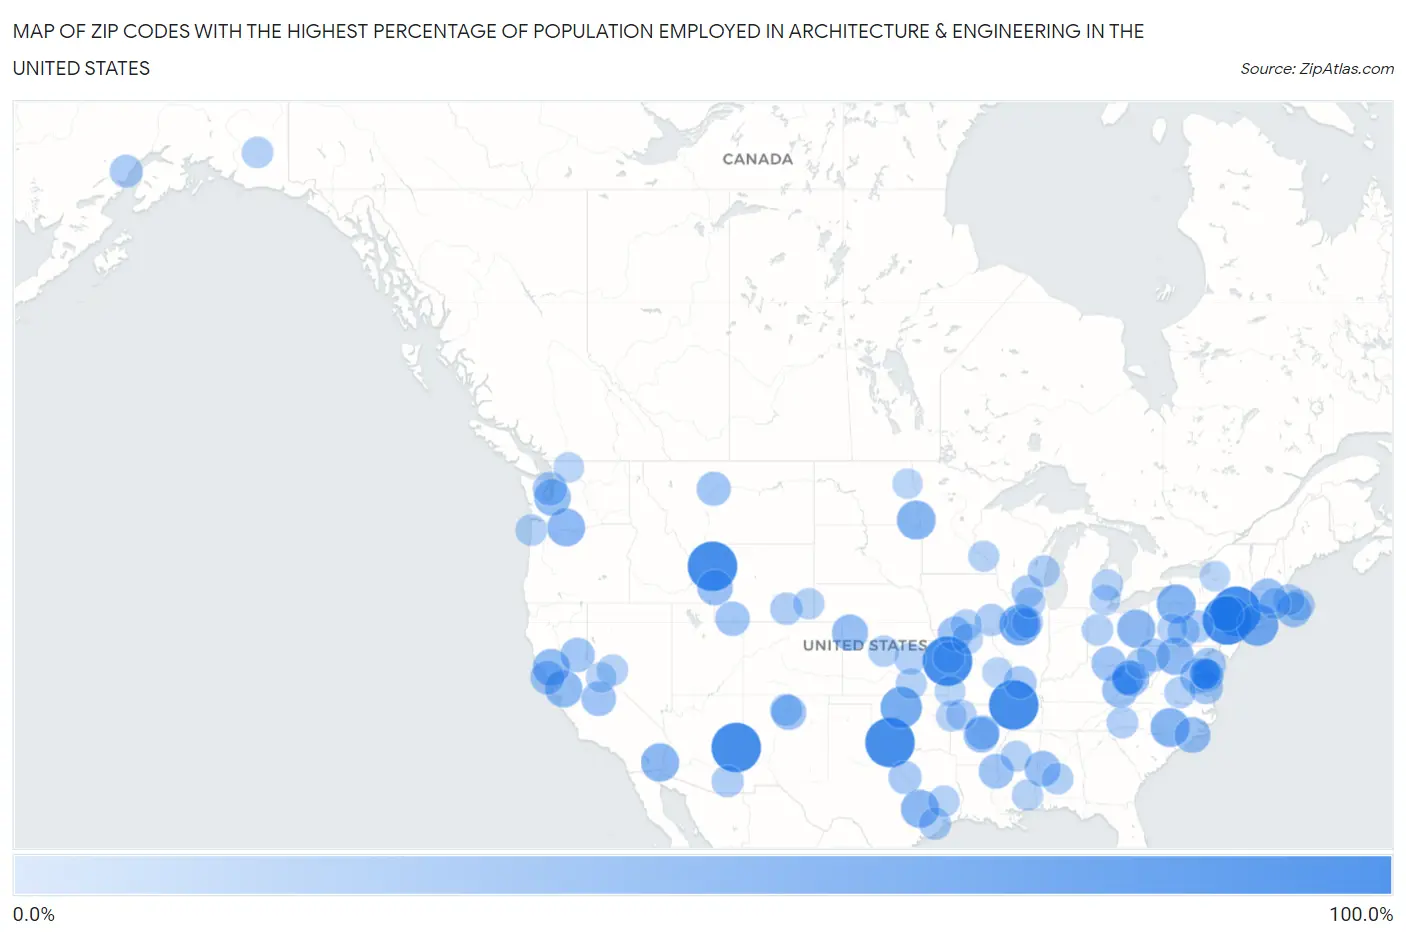
Map of Zip Codes with the Highest Percentage of Population Employed in Architecture & Engineering in the United States
0.0%
100.0%
Zip Codes with the Highest Percentage of Population Employed in Architecture & Engineering in the United States
| Zip Code | % Employed | vs State | vs National | |
| 1. | 85927 | 100.0% | 2.4%(+97.6)#1 | 2.1%(+97.9)#1 |
| 2. | 83424 | 100.0% | 2.2%(+97.8)#1 | 2.1%(+97.9)#2 |
| 3. | 63847 | 100.0% | 1.7%(+98.3)#1 | 2.1%(+97.9)#3 |
| 4. | 10985 | 100.0% | 1.6%(+98.4)#1 | 2.1%(+97.9)#4 |
| 5. | 73553 | 100.0% | 1.8%(+98.2)#1 | 2.1%(+97.9)#5 |
| 6. | 07881 | 100.0% | 1.9%(+98.1)#1 | 2.1%(+97.9)#6 |
| 7. | 66251 | 100.0% | 2.0%(+98.0)#1 | 2.1%(+97.9)#7 |
| 8. | 11973 | 66.7% | 1.6%(+65.1)#2 | 2.1%(+64.5)#8 |
| 9. | 73705 | 65.4% | 1.8%(+63.5)#2 | 2.1%(+63.2)#9 |
| 10. | 61552 | 63.3% | 1.9%(+61.4)#1 | 2.1%(+61.2)#10 |
| 11. | 16727 | 55.6% | 2.0%(+53.5)#1 | 2.1%(+53.4)#11 |
| 12. | 28308 | 54.5% | 1.9%(+52.7)#1 | 2.1%(+52.4)#12 |
| 13. | 58074 | 54.3% | 2.0%(+52.3)#1 | 2.1%(+52.1)#13 |
| 14. | 77863 | 51.9% | 2.2%(+49.6)#1 | 2.1%(+49.7)#14 |
| 15. | 92266 | 51.9% | 2.6%(+49.3)#1 | 2.1%(+49.7)#15 |
| 16. | 44671 | 51.3% | 2.1%(+49.1)#1 | 2.1%(+49.1)#16 |
| 17. | 98623 | 50.0% | 2.8%(+47.2)#1 | 2.1%(+47.9)#17 |
| 18. | 26714 | 48.2% | 1.6%(+46.7)#1 | 2.1%(+46.1)#18 |
| 19. | 95140 | 48.0% | 2.6%(+45.4)#2 | 2.1%(+45.9)#19 |
| 20. | 94576 | 46.7% | 2.6%(+44.1)#3 | 2.1%(+44.5)#20 |
| 21. | 98421 | 45.5% | 2.8%(+42.7)#2 | 2.1%(+43.3)#21 |
| 22. | 69027 | 42.9% | 1.5%(+41.4)#1 | 2.1%(+40.7)#22 |
| 23. | 28542 | 42.0% | 1.9%(+40.1)#2 | 2.1%(+39.8)#23 |
| 24. | 35443 | 41.3% | 2.4%(+38.9)#1 | 2.1%(+39.2)#24 |
| 25. | 41534 | 40.7% | 1.7%(+39.0)#1 | 2.1%(+38.6)#25 |
| 26. | 25047 | 40.7% | 1.6%(+39.2)#2 | 2.1%(+38.6)#26 |
| 27. | 83111 | 40.7% | 1.9%(+38.8)#1 | 2.1%(+38.5)#27 |
| 28. | 01094 | 40.0% | 2.7%(+37.3)#1 | 2.1%(+37.9)#28 |
| 29. | 72201 | 39.4% | 1.3%(+38.1)#1 | 2.1%(+37.2)#29 |
| 30. | 22476 | 38.5% | 2.3%(+36.2)#1 | 2.1%(+36.3)#30 |
| 31. | 18457 | 38.1% | 2.0%(+36.1)#2 | 2.1%(+35.9)#31 |
| 32. | 87578 | 37.8% | 2.5%(+35.3)#1 | 2.1%(+35.7)#32 |
| 33. | 71286 | 37.6% | 1.9%(+35.7)#1 | 2.1%(+35.5)#33 |
| 34. | 20630 | 37.1% | 2.4%(+34.7)#1 | 2.1%(+34.9)#34 |
| 35. | 61562 | 37.0% | 1.9%(+35.1)#2 | 2.1%(+34.9)#35 |
| 36. | 02647 | 36.7% | 2.7%(+34.0)#2 | 2.1%(+34.5)#36 |
| 37. | 93621 | 36.5% | 2.6%(+34.0)#4 | 2.1%(+34.4)#37 |
| 38. | 45616 | 36.2% | 2.1%(+34.1)#2 | 2.1%(+34.1)#38 |
| 39. | 64467 | 36.2% | 1.7%(+34.5)#2 | 2.1%(+34.1)#39 |
| 40. | 82938 | 35.8% | 1.9%(+33.9)#2 | 2.1%(+33.7)#40 |
| 41. | 95715 | 35.8% | 2.6%(+33.3)#5 | 2.1%(+33.7)#41 |
| 42. | 72099 | 35.4% | 1.3%(+34.1)#2 | 2.1%(+33.2)#42 |
| 43. | 21652 | 35.2% | 2.4%(+32.8)#2 | 2.1%(+33.0)#43 |
| 44. | 25108 | 34.9% | 1.6%(+33.4)#3 | 2.1%(+32.8)#44 |
| 45. | 59440 | 34.8% | 1.8%(+33.1)#1 | 2.1%(+32.7)#45 |
| 46. | 94950 | 34.8% | 2.6%(+32.2)#6 | 2.1%(+32.6)#46 |
| 47. | 98345 | 34.3% | 2.8%(+31.5)#3 | 2.1%(+32.2)#47 |
| 48. | 23128 | 31.9% | 2.3%(+29.6)#2 | 2.1%(+29.8)#48 |
| 49. | 76070 | 30.8% | 2.2%(+28.6)#2 | 2.1%(+28.7)#49 |
| 50. | 26349 | 30.6% | 1.6%(+29.1)#4 | 2.1%(+28.5)#50 |
| 51. | 62950 | 29.9% | 1.9%(+28.0)#3 | 2.1%(+27.7)#51 |
| 52. | 99635 | 29.6% | 2.3%(+27.3)#1 | 2.1%(+27.5)#52 |
| 53. | 17861 | 27.6% | 2.0%(+25.6)#3 | 2.1%(+25.5)#53 |
| 54. | 82083 | 27.4% | 1.9%(+25.5)#3 | 2.1%(+25.2)#54 |
| 55. | 52652 | 26.9% | 1.8%(+25.1)#1 | 2.1%(+24.8)#55 |
| 56. | 77481 | 26.7% | 2.2%(+24.4)#3 | 2.1%(+24.5)#56 |
| 57. | 53501 | 26.5% | 2.2%(+24.2)#1 | 2.1%(+24.3)#57 |
| 58. | 87582 | 26.4% | 2.5%(+23.9)#2 | 2.1%(+24.2)#58 |
| 59. | 02663 | 26.0% | 2.7%(+23.3)#3 | 2.1%(+23.8)#59 |
| 60. | 16654 | 25.9% | 2.0%(+23.9)#4 | 2.1%(+23.8)#60 |
| 61. | 85609 | 25.9% | 2.4%(+23.5)#2 | 2.1%(+23.8)#61 |
| 62. | 53031 | 25.6% | 2.2%(+23.4)#2 | 2.1%(+23.5)#62 |
| 63. | 20667 | 24.7% | 2.4%(+22.3)#3 | 2.1%(+22.6)#63 |
| 64. | 25637 | 24.7% | 1.6%(+23.1)#5 | 2.1%(+22.5)#64 |
| 65. | 36775 | 24.7% | 2.4%(+22.3)#2 | 2.1%(+22.5)#65 |
| 66. | 64101 | 24.6% | 1.7%(+22.9)#3 | 2.1%(+22.5)#66 |
| 67. | 02047 | 24.4% | 2.7%(+21.7)#4 | 2.1%(+22.3)#67 |
| 68. | 28735 | 24.2% | 1.9%(+22.3)#3 | 2.1%(+22.0)#68 |
| 69. | 67482 | 24.1% | 2.0%(+22.1)#2 | 2.1%(+22.0)#69 |
| 70. | 77350 | 24.1% | 2.2%(+21.9)#4 | 2.1%(+21.9)#70 |
| 71. | 97130 | 23.9% | 2.8%(+21.1)#1 | 2.1%(+21.7)#71 |
| 72. | 02858 | 23.8% | 2.2%(+21.7)#1 | 2.1%(+21.7)#72 |
| 73. | 99566 | 23.8% | 2.3%(+21.5)#2 | 2.1%(+21.7)#73 |
| 74. | 45884 | 23.7% | 2.1%(+21.6)#3 | 2.1%(+21.6)#74 |
| 75. | 23942 | 23.4% | 2.3%(+21.1)#3 | 2.1%(+21.2)#75 |
| 76. | 67675 | 23.2% | 2.0%(+21.2)#3 | 2.1%(+21.1)#76 |
| 77. | 48440 | 23.2% | 3.4%(+19.8)#1 | 2.1%(+21.0)#77 |
| 78. | 20684 | 22.9% | 2.4%(+20.5)#4 | 2.1%(+20.8)#78 |
| 79. | 82243 | 22.9% | 1.9%(+20.9)#4 | 2.1%(+20.7)#79 |
| 80. | 89422 | 22.9% | 1.5%(+21.4)#1 | 2.1%(+20.7)#80 |
| 81. | 50165 | 22.7% | 1.8%(+20.9)#2 | 2.1%(+20.6)#81 |
| 82. | 39462 | 22.4% | 1.5%(+20.9)#1 | 2.1%(+20.3)#82 |
| 83. | 61321 | 22.3% | 1.9%(+20.4)#4 | 2.1%(+20.2)#83 |
| 84. | 38943 | 22.1% | 1.5%(+20.6)#2 | 2.1%(+20.0)#84 |
| 85. | 67232 | 22.0% | 2.0%(+20.0)#4 | 2.1%(+19.9)#85 |
| 86. | 55968 | 22.0% | 2.4%(+19.6)#1 | 2.1%(+19.9)#86 |
| 87. | 26638 | 21.7% | 1.6%(+20.2)#6 | 2.1%(+19.6)#87 |
| 88. | 64646 | 21.3% | 1.7%(+19.6)#4 | 2.1%(+19.2)#88 |
| 89. | 72717 | 20.9% | 1.3%(+19.6)#3 | 2.1%(+18.7)#89 |
| 90. | 20692 | 20.8% | 2.4%(+18.4)#5 | 2.1%(+18.7)#90 |
| 91. | 72776 | 20.8% | 1.3%(+19.5)#4 | 2.1%(+18.6)#91 |
| 92. | 93541 | 20.6% | 2.6%(+18.1)#7 | 2.1%(+18.5)#92 |
| 93. | 48190 | 20.6% | 3.4%(+17.2)#2 | 2.1%(+18.5)#93 |
| 94. | 15710 | 20.2% | 2.0%(+18.2)#5 | 2.1%(+18.0)#94 |
| 95. | 60111 | 20.0% | 1.9%(+18.1)#5 | 2.1%(+17.9)#95 |
| 96. | 64849 | 19.7% | 1.7%(+18.0)#5 | 2.1%(+17.6)#96 |
| 97. | 98283 | 19.7% | 2.8%(+16.9)#4 | 2.1%(+17.5)#97 |
| 98. | 13483 | 19.6% | 1.6%(+18.0)#3 | 2.1%(+17.5)#98 |
| 99. | 63079 | 19.6% | 1.7%(+17.9)#6 | 2.1%(+17.4)#99 |
| 100. | 58214 | 19.2% | 2.0%(+17.2)#2 | 2.1%(+17.0)#100 |
Common Questions
What are the Top 10 Zip Codes with the Highest Percentage of Population Employed in Architecture & Engineering in the United States?
Top 10 Zip Codes with the Highest Percentage of Population Employed in Architecture & Engineering in the United States are:
What zip code has the Highest Percentage of Population Employed in Architecture & Engineering in the United States?
85927 has the Highest Percentage of Population Employed in Architecture & Engineering in the United States with 100.0%.
What is the Percentage of Population Employed in Architecture & Engineering in the United States?
Percentage of Population Employed in Architecture & Engineering in the United States is 2.1%.