Rock River, WY Map & Demographics
Rock River Map
Rock River Overview
$59,623
PER CAPITA INCOME
$52,250
AVG FAMILY INCOME
$64,821
AVG HOUSEHOLD INCOME
$10,478
FAMILY INCOME DEFICIT
0.56
INEQUALITY / GINI INDEX
269
TOTAL POPULATION
166
MALE POPULATION
103
FEMALE POPULATION
161.17
MALES / 100 FEMALES
62.05
FEMALES / 100 MALES
29.0
MEDIAN AGE
3.3
AVG FAMILY SIZE
2.4
AVG HOUSEHOLD SIZE
139
LABOR FORCE [ PEOPLE ]
63.8%
PERCENT IN LABOR FORCE
Rock River Zip Codes
Rock River Area Codes
Income in Rock River
Income Overview in Rock River
Per Capita Income in Rock River is $59,623, while median incomes of families and households are $52,250 and $64,821 respectively.
| Characteristic | Number | Measure |
| Per Capita Income | 269 | $59,623 |
| Median Family Income | 45 | $52,250 |
| Mean Family Income | 45 | $65,169 |
| Median Household Income | 113 | $64,821 |
| Mean Household Income | 113 | $134,356 |
| Income Deficit | 45 | $10,478 |
| Wage / Income Gap (%) | 269 | 0.00% |
| Wage / Income Gap ($) | 269 | 100.00¢ per $1 |
| Gini / Inequality Index | 269 | 0.56 |
Earnings by Sex in Rock River
| Sex | Number | Average Earnings |
| Male | 109 (70.3%) | $0 |
| Female | 46 (29.7%) | $0 |
| Total | 155 (100.0%) | $0 |
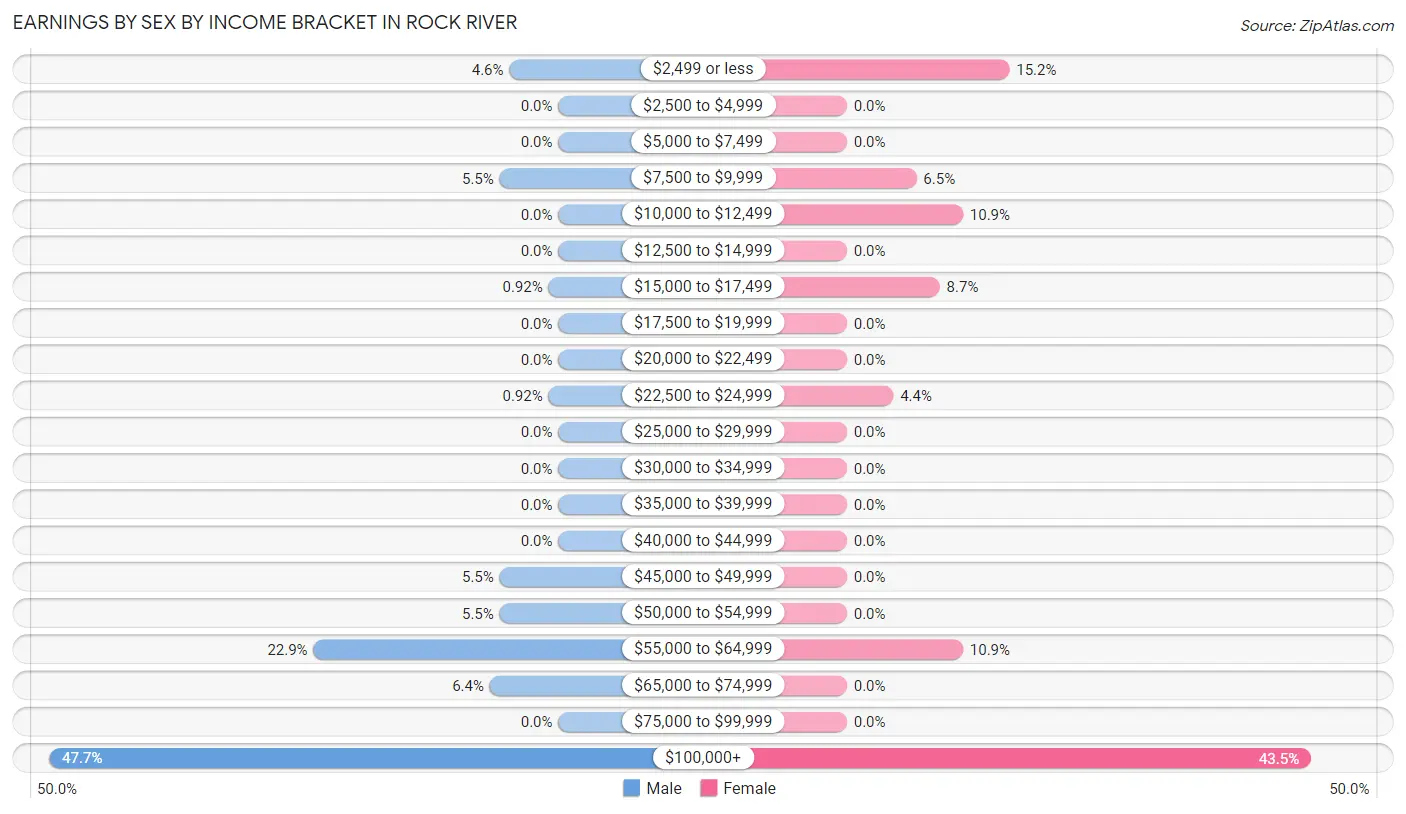
Earnings by Sex by Income Bracket in Rock River
The most common earnings brackets in Rock River are $100,000+ for men (52 | 47.7%) and $100,000+ for women (20 | 43.5%).
| Income | Male | Female |
| $2,499 or less | 5 (4.6%) | 7 (15.2%) |
| $2,500 to $4,999 | 0 (0.0%) | 0 (0.0%) |
| $5,000 to $7,499 | 0 (0.0%) | 0 (0.0%) |
| $7,500 to $9,999 | 6 (5.5%) | 3 (6.5%) |
| $10,000 to $12,499 | 0 (0.0%) | 5 (10.9%) |
| $12,500 to $14,999 | 0 (0.0%) | 0 (0.0%) |
| $15,000 to $17,499 | 1 (0.9%) | 4 (8.7%) |
| $17,500 to $19,999 | 0 (0.0%) | 0 (0.0%) |
| $20,000 to $22,499 | 0 (0.0%) | 0 (0.0%) |
| $22,500 to $24,999 | 1 (0.9%) | 2 (4.3%) |
| $25,000 to $29,999 | 0 (0.0%) | 0 (0.0%) |
| $30,000 to $34,999 | 0 (0.0%) | 0 (0.0%) |
| $35,000 to $39,999 | 0 (0.0%) | 0 (0.0%) |
| $40,000 to $44,999 | 0 (0.0%) | 0 (0.0%) |
| $45,000 to $49,999 | 6 (5.5%) | 0 (0.0%) |
| $50,000 to $54,999 | 6 (5.5%) | 0 (0.0%) |
| $55,000 to $64,999 | 25 (22.9%) | 5 (10.9%) |
| $65,000 to $74,999 | 7 (6.4%) | 0 (0.0%) |
| $75,000 to $99,999 | 0 (0.0%) | 0 (0.0%) |
| $100,000+ | 52 (47.7%) | 20 (43.5%) |
| Total | 109 (100.0%) | 46 (100.0%) |
Earnings by Sex by Educational Attainment in Rock River
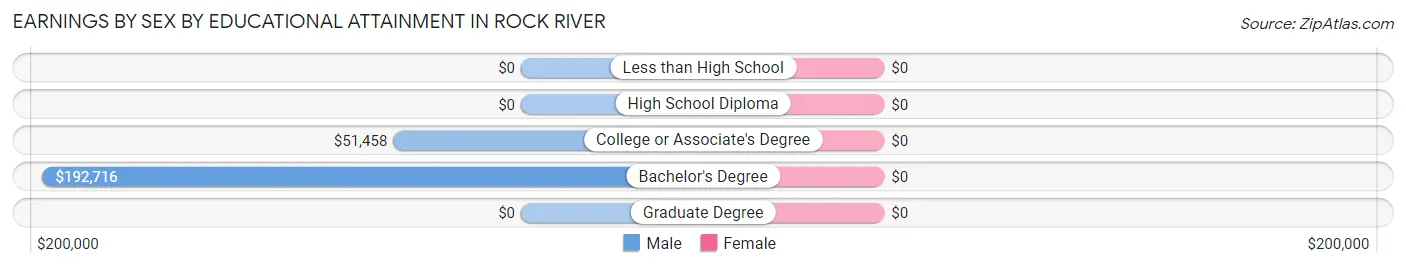
| Educational Attainment | Male Income | Female Income |
| Less than High School | - | - |
| High School Diploma | - | - |
| College or Associate's Degree | $51,458 | $0 |
| Bachelor's Degree | $192,716 | $0 |
| Graduate Degree | - | - |
| Total | - | - |
Family Income in Rock River
Family Income Brackets in Rock River
According to the Rock River family income data, there are 19 families falling into the $50,000 to $74,999 income range, which is the most common income bracket and makes up 42.2% of all families.
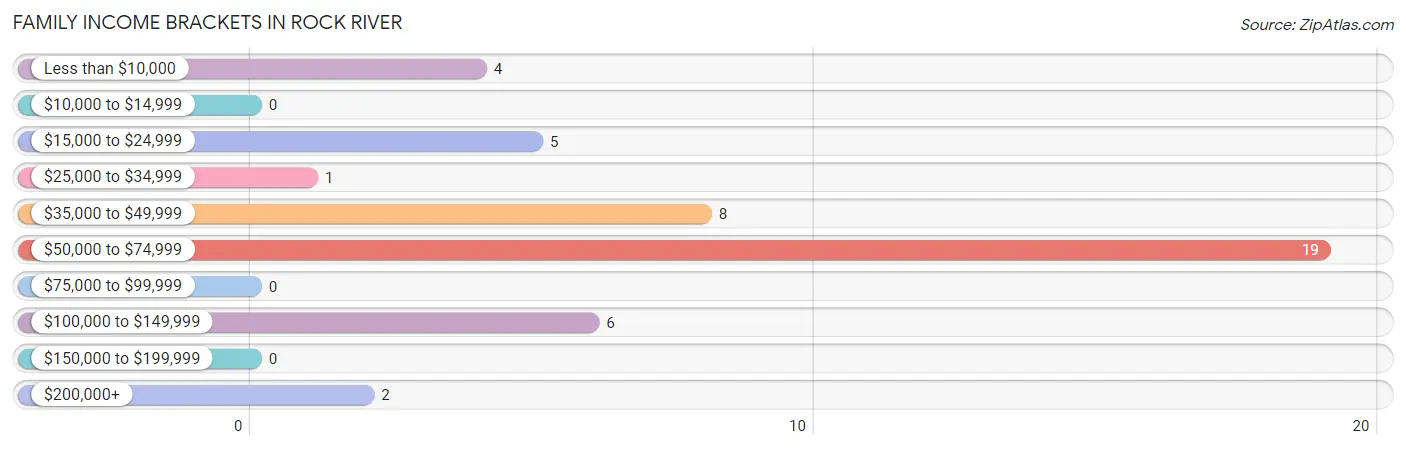
| Income Bracket | # Families | % Families |
| Less than $10,000 | 4 | 8.9% |
| $10,000 to $14,999 | 0 | 0.0% |
| $15,000 to $24,999 | 5 | 11.1% |
| $25,000 to $34,999 | 1 | 2.2% |
| $35,000 to $49,999 | 8 | 17.8% |
| $50,000 to $74,999 | 19 | 42.2% |
| $75,000 to $99,999 | 0 | 0.0% |
| $100,000 to $149,999 | 6 | 13.3% |
| $150,000 to $199,999 | 0 | 0.0% |
| $200,000+ | 2 | 4.4% |
Family Income by Famaliy Size in Rock River
2-person families (18 | 40.0%) account for the highest median family income in Rock River with $47,500 per family, while 2-person families (18 | 40.0%) have the highest median income of $23,750 per family member.
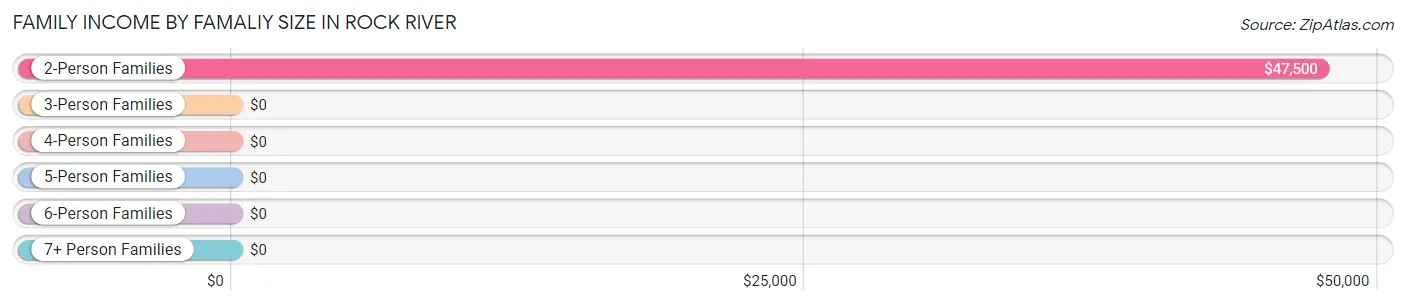
| Income Bracket | # Families | Median Income |
| 2-Person Families | 18 (40.0%) | $47,500 |
| 3-Person Families | 7 (15.6%) | $0 |
| 4-Person Families | 8 (17.8%) | $0 |
| 5-Person Families | 6 (13.3%) | $0 |
| 6-Person Families | 6 (13.3%) | $0 |
| 7+ Person Families | 0 (0.0%) | $0 |
| Total | 45 (100.0%) | $52,250 |
Family Income by Number of Earners in Rock River
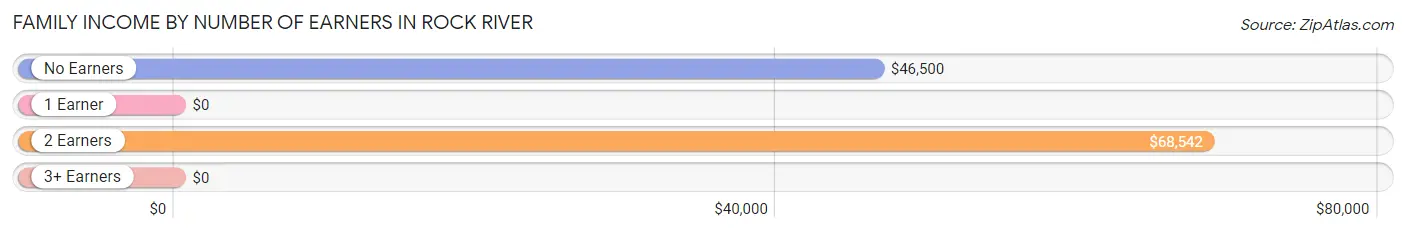
| Number of Earners | # Families | Median Income |
| No Earners | 14 (31.1%) | $46,500 |
| 1 Earner | 10 (22.2%) | $0 |
| 2 Earners | 21 (46.7%) | $68,542 |
| 3+ Earners | 0 (0.0%) | $0 |
| Total | 45 (100.0%) | $52,250 |
Household Income in Rock River
Household Income Brackets in Rock River
With 49 households falling in the category, the $50,000 to $74,999 income range is the most frequent in Rock River, accounting for 43.4% of all households.
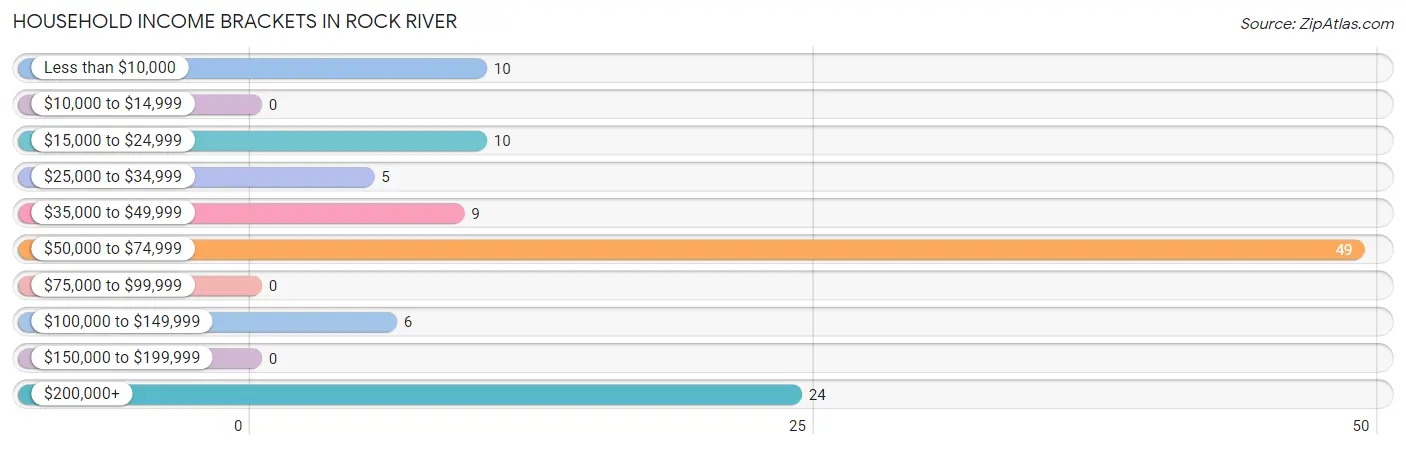
| Income Bracket | # Households | % Households |
| Less than $10,000 | 10 | 8.8% |
| $10,000 to $14,999 | 0 | 0.0% |
| $15,000 to $24,999 | 10 | 8.8% |
| $25,000 to $34,999 | 5 | 4.4% |
| $35,000 to $49,999 | 9 | 8.0% |
| $50,000 to $74,999 | 49 | 43.4% |
| $75,000 to $99,999 | 0 | 0.0% |
| $100,000 to $149,999 | 6 | 5.3% |
| $150,000 to $199,999 | 0 | 0.0% |
| $200,000+ | 24 | 21.2% |
Household Income by Householder Age in Rock River
The median household income in Rock River is $64,821, with the highest median household income of $64,286 found in the 45 to 64 years age bracket for the primary householder. A total of 20 households (17.7%) fall into this category. Meanwhile, the 15 to 24 years age bracket for the primary householder has the lowest median household income of $0, with 18 households (15.9%) in this group.
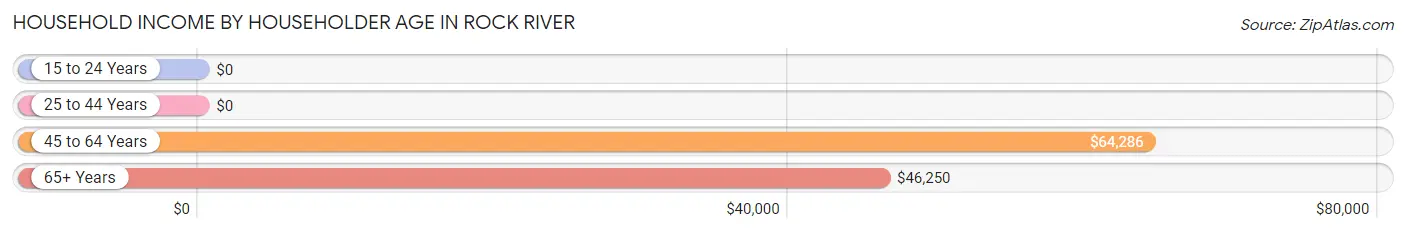
| Income Bracket | # Households | Median Income |
| 15 to 24 Years | 18 (15.9%) | $0 |
| 25 to 44 Years | 47 (41.6%) | $0 |
| 45 to 64 Years | 20 (17.7%) | $64,286 |
| 65+ Years | 28 (24.8%) | $46,250 |
| Total | 113 (100.0%) | $64,821 |
Poverty in Rock River
Income Below Poverty by Sex and Age in Rock River
With 23.5% poverty level for males and 8.7% for females among the residents of Rock River, 5 year old males and 55 to 64 year old females are the most vulnerable to poverty, with 11 males (100.0%) and 2 females (66.7%) in their respective age groups living below the poverty level.
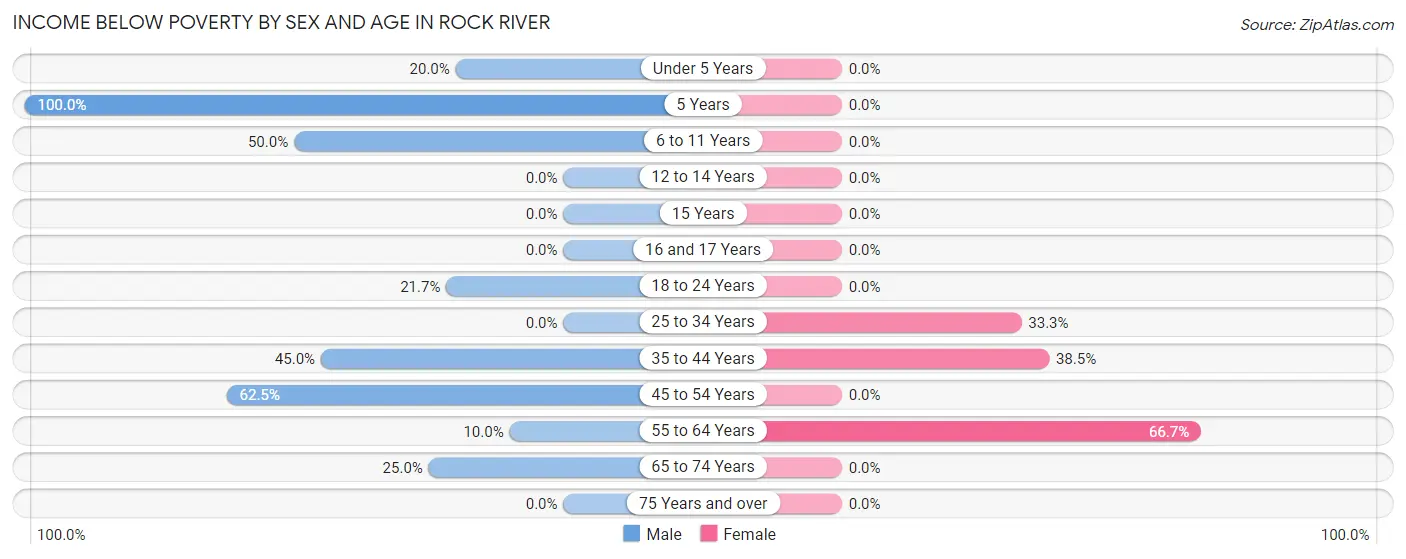
| Age Bracket | Male | Female |
| Under 5 Years | 2 (20.0%) | 0 (0.0%) |
| 5 Years | 11 (100.0%) | 0 (0.0%) |
| 6 to 11 Years | 4 (50.0%) | 0 (0.0%) |
| 12 to 14 Years | 0 (0.0%) | 0 (0.0%) |
| 15 Years | 0 (0.0%) | 0 (0.0%) |
| 16 and 17 Years | 0 (0.0%) | 0 (0.0%) |
| 18 to 24 Years | 5 (21.7%) | 0 (0.0%) |
| 25 to 34 Years | 0 (0.0%) | 2 (33.3%) |
| 35 to 44 Years | 9 (45.0%) | 5 (38.5%) |
| 45 to 54 Years | 5 (62.5%) | 0 (0.0%) |
| 55 to 64 Years | 1 (10.0%) | 2 (66.7%) |
| 65 to 74 Years | 2 (25.0%) | 0 (0.0%) |
| 75 Years and over | 0 (0.0%) | 0 (0.0%) |
| Total | 39 (23.5%) | 9 (8.7%) |
Income Above Poverty by Sex and Age in Rock River
According to the poverty statistics in Rock River, males aged 12 to 14 years and females aged under 5 years are the age groups that are most secure financially, with 100.0% of males and 100.0% of females in these age groups living above the poverty line.
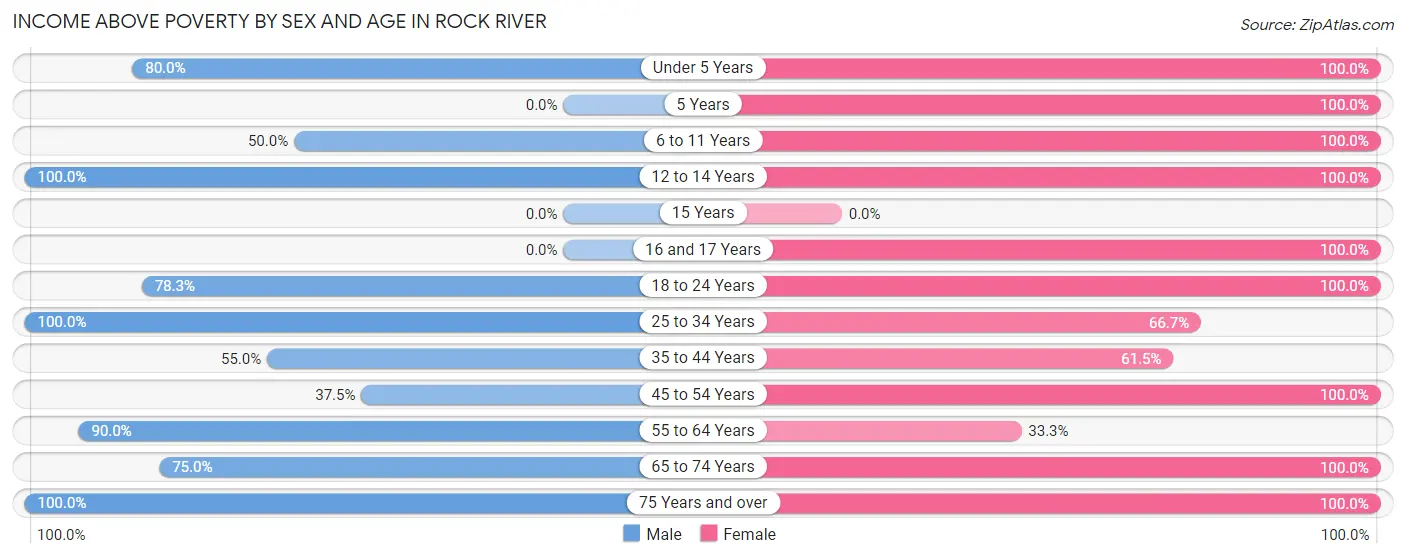
| Age Bracket | Male | Female |
| Under 5 Years | 8 (80.0%) | 3 (100.0%) |
| 5 Years | 0 (0.0%) | 4 (100.0%) |
| 6 to 11 Years | 4 (50.0%) | 4 (100.0%) |
| 12 to 14 Years | 4 (100.0%) | 7 (100.0%) |
| 15 Years | 0 (0.0%) | 0 (0.0%) |
| 16 and 17 Years | 0 (0.0%) | 8 (100.0%) |
| 18 to 24 Years | 18 (78.3%) | 20 (100.0%) |
| 25 to 34 Years | 57 (100.0%) | 4 (66.7%) |
| 35 to 44 Years | 11 (55.0%) | 8 (61.5%) |
| 45 to 54 Years | 3 (37.5%) | 8 (100.0%) |
| 55 to 64 Years | 9 (90.0%) | 1 (33.3%) |
| 65 to 74 Years | 6 (75.0%) | 18 (100.0%) |
| 75 Years and over | 7 (100.0%) | 9 (100.0%) |
| Total | 127 (76.5%) | 94 (91.3%) |
Income Below Poverty Among Married-Couple Families in Rock River
The poverty statistics for married-couple families in Rock River show that 26.5% or 9 of the total 34 families live below the poverty line. Families with 1 or 2 children have the highest poverty rate of 46.7%, comprising of 7 families. On the other hand, families with 3 or 4 children have the lowest poverty rate of 0.0%, which includes 0 families.
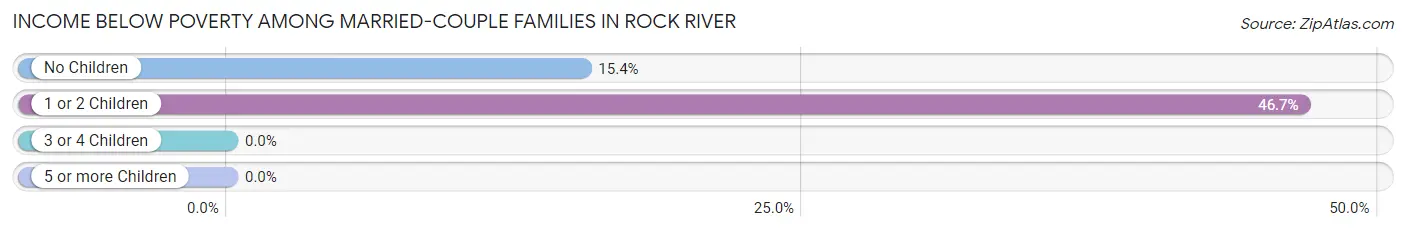
| Children | Above Poverty | Below Poverty |
| No Children | 11 (84.6%) | 2 (15.4%) |
| 1 or 2 Children | 8 (53.3%) | 7 (46.7%) |
| 3 or 4 Children | 6 (100.0%) | 0 (0.0%) |
| 5 or more Children | 0 (0.0%) | 0 (0.0%) |
| Total | 25 (73.5%) | 9 (26.5%) |
Income Below Poverty Among Single-Parent Households in Rock River
| Children | Single Father | Single Mother |
| No Children | 0 (0.0%) | 0 (0.0%) |
| 1 or 2 Children | 0 (0.0%) | 0 (0.0%) |
| 3 or 4 Children | 0 (0.0%) | 0 (0.0%) |
| 5 or more Children | 0 (0.0%) | 0 (0.0%) |
| Total | 0 (0.0%) | 0 (0.0%) |
Income Below Poverty Among Married-Couple vs Single-Parent Households in Rock River
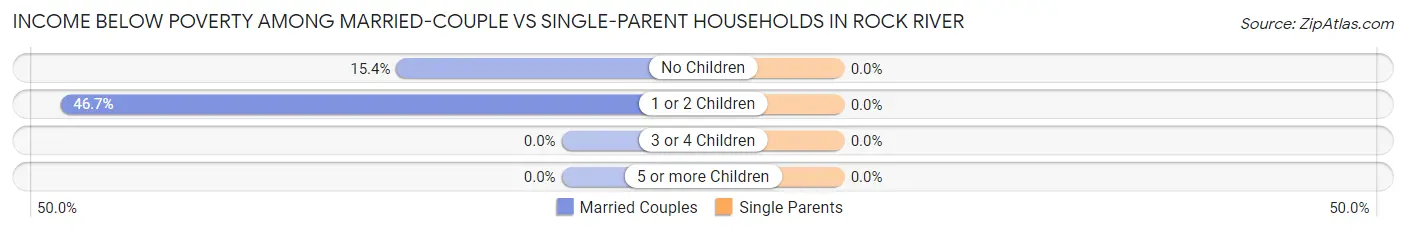
| Children | Married-Couple Families | Single-Parent Households |
| No Children | 2 (15.4%) | 0 (0.0%) |
| 1 or 2 Children | 7 (46.7%) | 0 (0.0%) |
| 3 or 4 Children | 0 (0.0%) | 0 (0.0%) |
| 5 or more Children | 0 (0.0%) | 0 (0.0%) |
| Total | 9 (26.5%) | 0 (0.0%) |
Race in Rock River
The most populous races in Rock River are White / Caucasian (252 | 93.7%), Hispanic or Latino (42 | 15.6%), and Hawaiian / Pacific (11 | 4.1%).
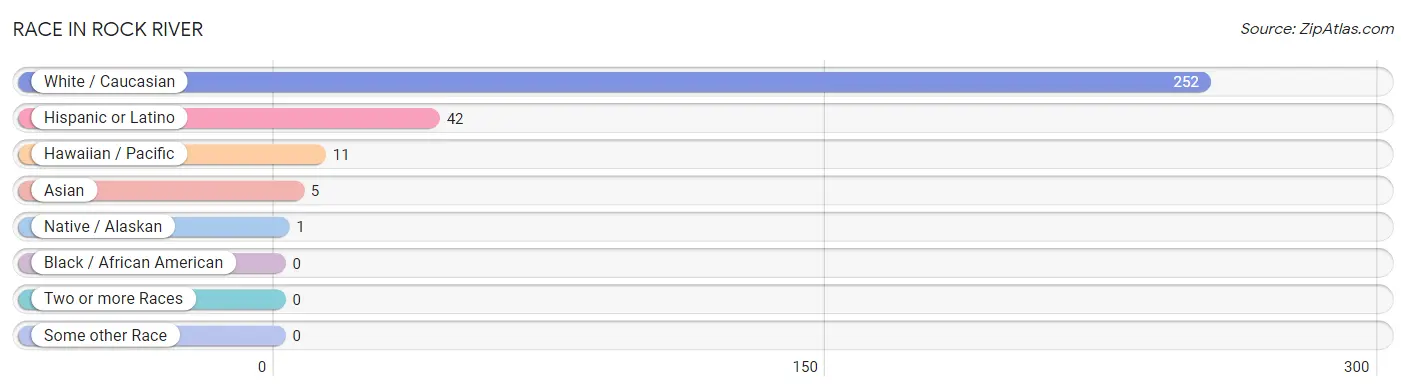
| Race | # Population | % Population |
| Asian | 5 | 1.9% |
| Black / African American | 0 | 0.0% |
| Hawaiian / Pacific | 11 | 4.1% |
| Hispanic or Latino | 42 | 15.6% |
| Native / Alaskan | 1 | 0.4% |
| White / Caucasian | 252 | 93.7% |
| Two or more Races | 0 | 0.0% |
| Some other Race | 0 | 0.0% |
| Total | 269 | 100.0% |
Ancestry in Rock River
The most populous ancestries reported in Rock River are German (83 | 30.9%), Irish (82 | 30.5%), Mexican (42 | 15.6%), American (38 | 14.1%), and English (24 | 8.9%), together accounting for 100.0% of all Rock River residents.
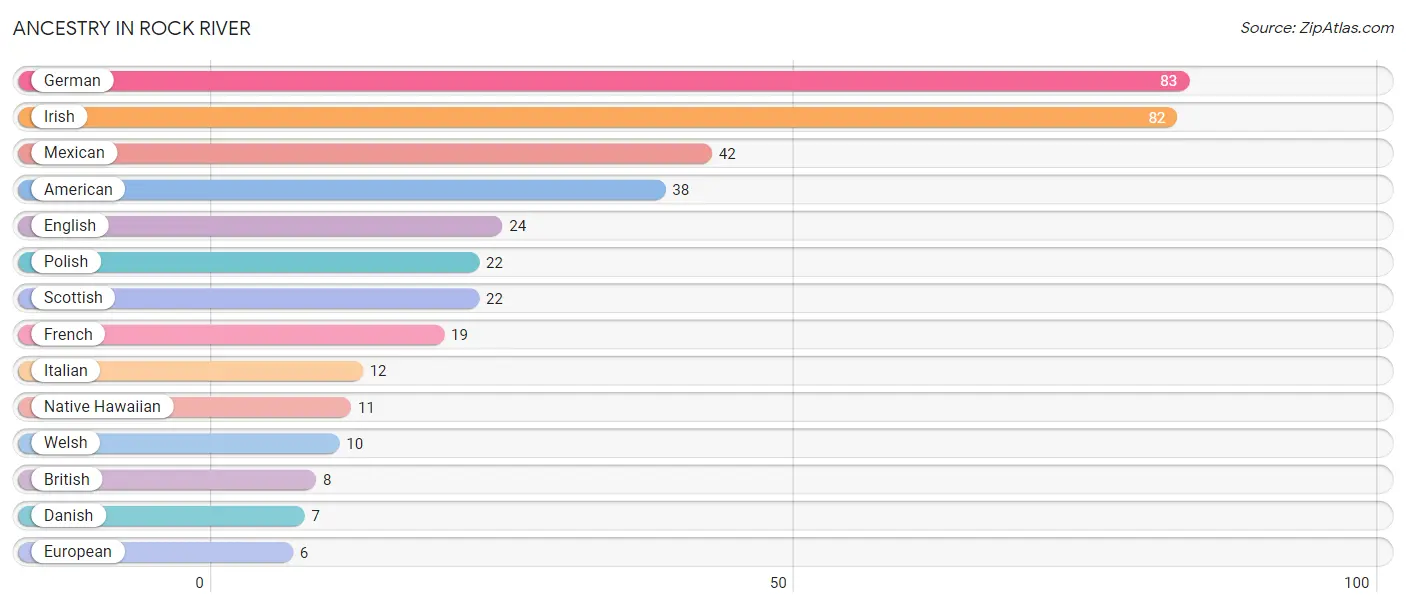
| Ancestry | # Population | % Population |
| American | 38 | 14.1% |
| British | 8 | 3.0% |
| Danish | 7 | 2.6% |
| English | 24 | 8.9% |
| European | 6 | 2.2% |
| French | 19 | 7.1% |
| German | 83 | 30.9% |
| Irish | 82 | 30.5% |
| Italian | 12 | 4.5% |
| Mexican | 42 | 15.6% |
| Native Hawaiian | 11 | 4.1% |
| Polish | 22 | 8.2% |
| Scottish | 22 | 8.2% |
| Welsh | 10 | 3.7% | View All 14 Rows |
Immigrants in Rock River
The most numerous immigrant groups reported in Rock River came from Europe (8 | 3.0%), Italy (6 | 2.2%), Southern Europe (6 | 2.2%), Asia (5 | 1.9%), and Nepal (5 | 1.9%), together accounting for 11.2% of all Rock River residents.
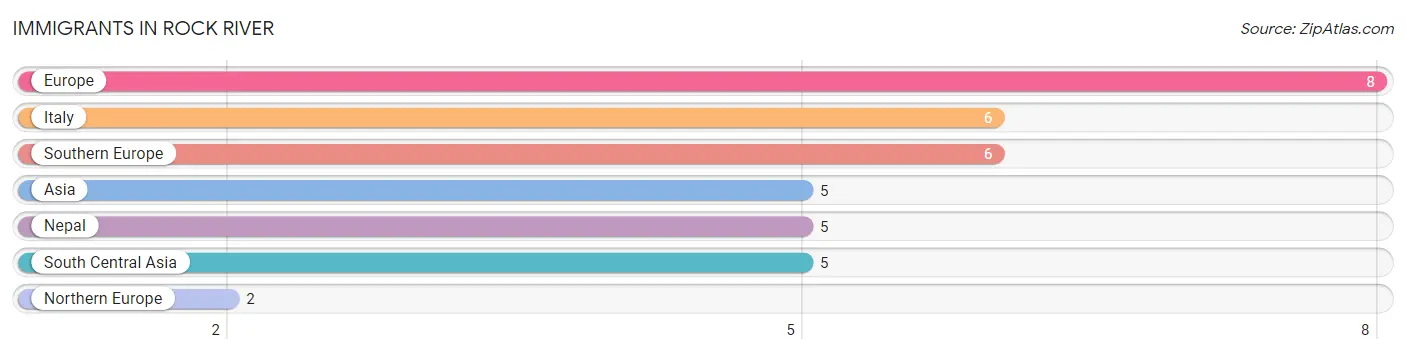
| Immigration Origin | # Population | % Population |
| Asia | 5 | 1.9% |
| Europe | 8 | 3.0% |
| Italy | 6 | 2.2% |
| Nepal | 5 | 1.9% |
| Northern Europe | 2 | 0.7% |
| South Central Asia | 5 | 1.9% |
| Southern Europe | 6 | 2.2% | View All 7 Rows |
Sex and Age in Rock River
Sex and Age in Rock River
The most populous age groups in Rock River are 25 to 29 Years (57 | 34.3%) for men and 20 to 24 Years (20 | 19.4%) for women.
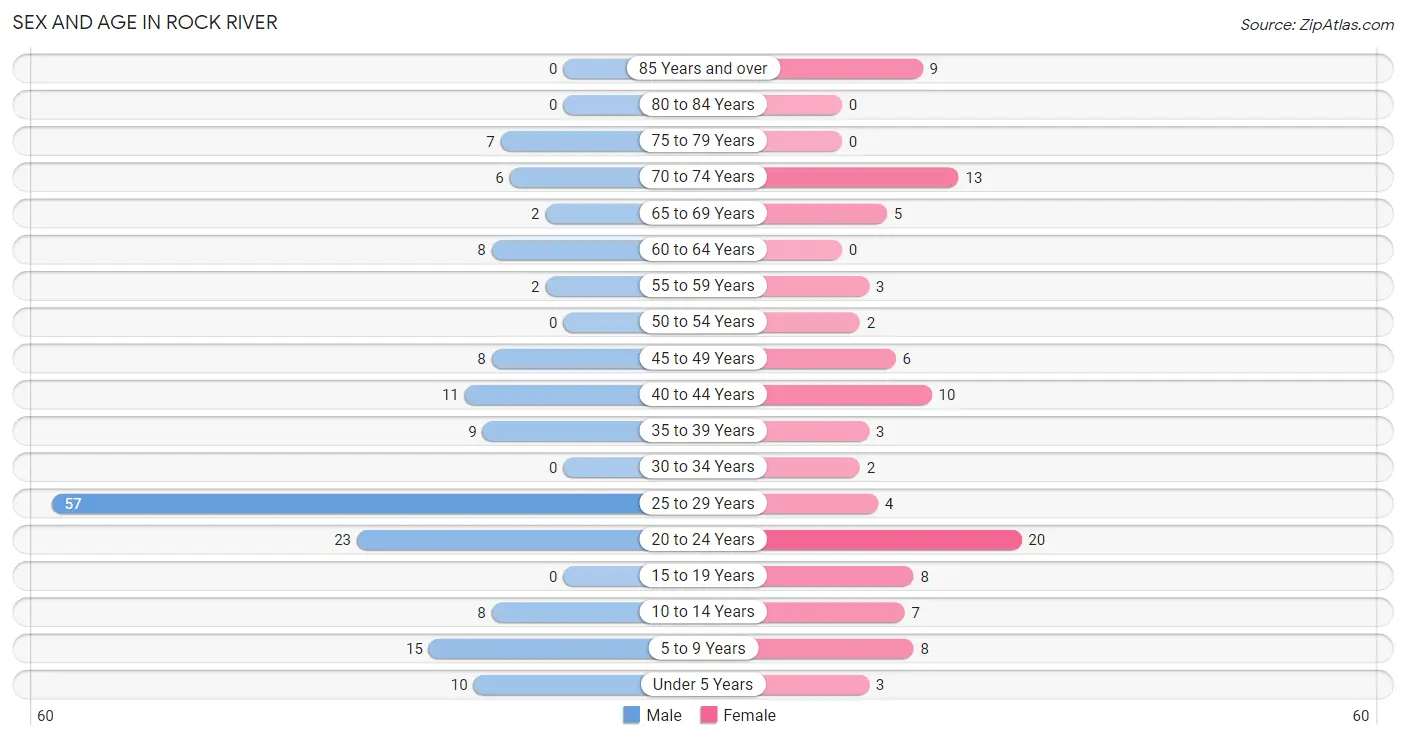
| Age Bracket | Male | Female |
| Under 5 Years | 10 (6.0%) | 3 (2.9%) |
| 5 to 9 Years | 15 (9.0%) | 8 (7.8%) |
| 10 to 14 Years | 8 (4.8%) | 7 (6.8%) |
| 15 to 19 Years | 0 (0.0%) | 8 (7.8%) |
| 20 to 24 Years | 23 (13.9%) | 20 (19.4%) |
| 25 to 29 Years | 57 (34.3%) | 4 (3.9%) |
| 30 to 34 Years | 0 (0.0%) | 2 (1.9%) |
| 35 to 39 Years | 9 (5.4%) | 3 (2.9%) |
| 40 to 44 Years | 11 (6.6%) | 10 (9.7%) |
| 45 to 49 Years | 8 (4.8%) | 6 (5.8%) |
| 50 to 54 Years | 0 (0.0%) | 2 (1.9%) |
| 55 to 59 Years | 2 (1.2%) | 3 (2.9%) |
| 60 to 64 Years | 8 (4.8%) | 0 (0.0%) |
| 65 to 69 Years | 2 (1.2%) | 5 (4.9%) |
| 70 to 74 Years | 6 (3.6%) | 13 (12.6%) |
| 75 to 79 Years | 7 (4.2%) | 0 (0.0%) |
| 80 to 84 Years | 0 (0.0%) | 0 (0.0%) |
| 85 Years and over | 0 (0.0%) | 9 (8.7%) |
| Total | 166 (100.0%) | 103 (100.0%) |
Families and Households in Rock River
Median Family Size in Rock River
The median family size in Rock River is 3.27 persons per family, with single male/father families (6 | 13.3%) accounting for the largest median family size of 4.33 persons per family. On the other hand, single female/mother families (5 | 11.1%) represent the smallest median family size with 1.80 persons per family.
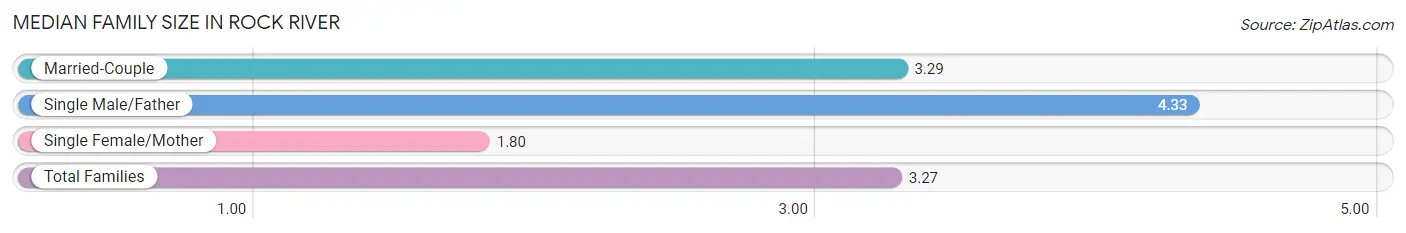
| Family Type | # Families | Family Size |
| Married-Couple | 34 (75.6%) | 3.29 |
| Single Male/Father | 6 (13.3%) | 4.33 |
| Single Female/Mother | 5 (11.1%) | 1.80 |
| Total Families | 45 (100.0%) | 3.27 |
Median Household Size in Rock River
The median household size in Rock River is 2.38 persons per household, with single male/father households (6 | 5.3%) accounting for the largest median household size of 4.33 persons per household. non-family households (68 | 60.2%) represent the smallest median household size with 1.79 persons per household.
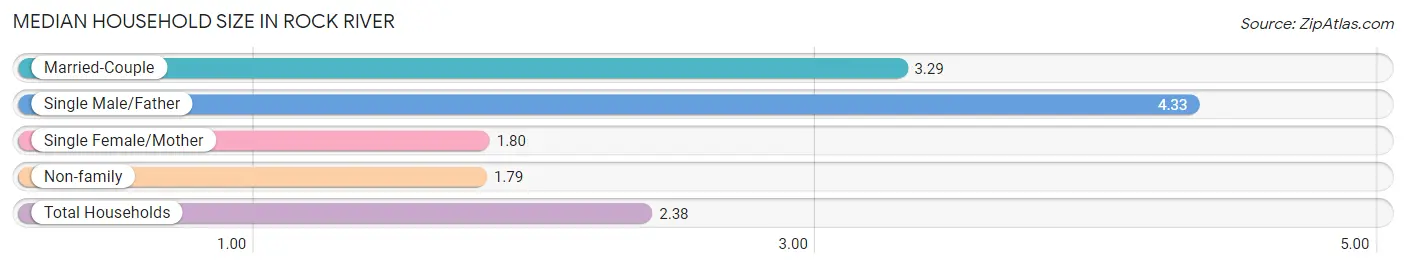
| Household Type | # Households | Household Size |
| Married-Couple | 34 (30.1%) | 3.29 |
| Single Male/Father | 6 (5.3%) | 4.33 |
| Single Female/Mother | 5 (4.4%) | 1.80 |
| Non-family | 68 (60.2%) | 1.79 |
| Total Households | 113 (100.0%) | 2.38 |
Household Size by Marriage Status in Rock River
Out of a total of 113 households in Rock River, 45 (39.8%) are family households, while 68 (60.2%) are nonfamily households. The most numerous type of family households are 2-person households, comprising 18, and the most common type of nonfamily households are 1-person households, comprising 28.
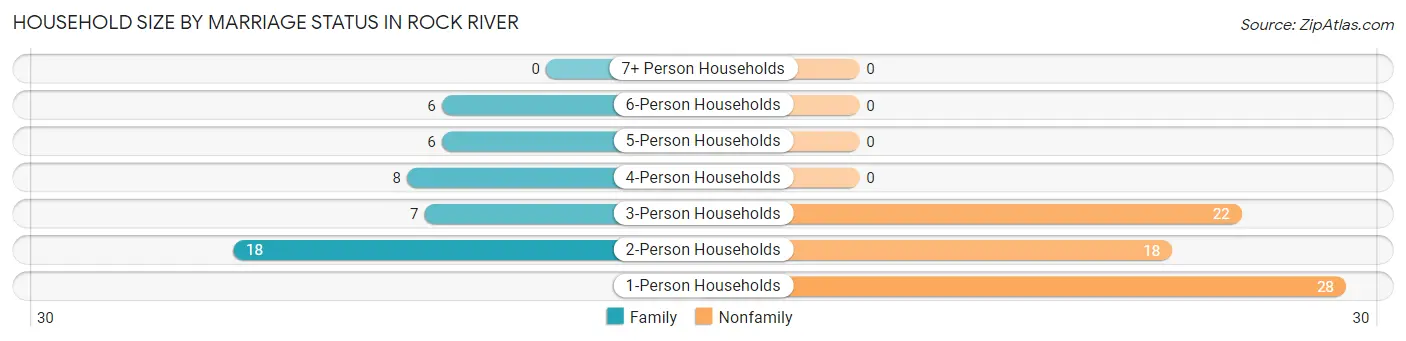
| Household Size | Family Households | Nonfamily Households |
| 1-Person Households | - | 28 (24.8%) |
| 2-Person Households | 18 (15.9%) | 18 (15.9%) |
| 3-Person Households | 7 (6.2%) | 22 (19.5%) |
| 4-Person Households | 8 (7.1%) | 0 (0.0%) |
| 5-Person Households | 6 (5.3%) | 0 (0.0%) |
| 6-Person Households | 6 (5.3%) | 0 (0.0%) |
| 7+ Person Households | 0 (0.0%) | 0 (0.0%) |
| Total | 45 (39.8%) | 68 (60.2%) |
Female Fertility in Rock River
Fertility by Age in Rock River
Average fertility rate in Rock River is 38.0 births per 1,000 women. Women in the age bracket of 20 to 34 years have the highest fertility rate with 77.0 births per 1,000 women. Women in the age bracket of 20 to 34 years acount for 100.0% of all women with births.
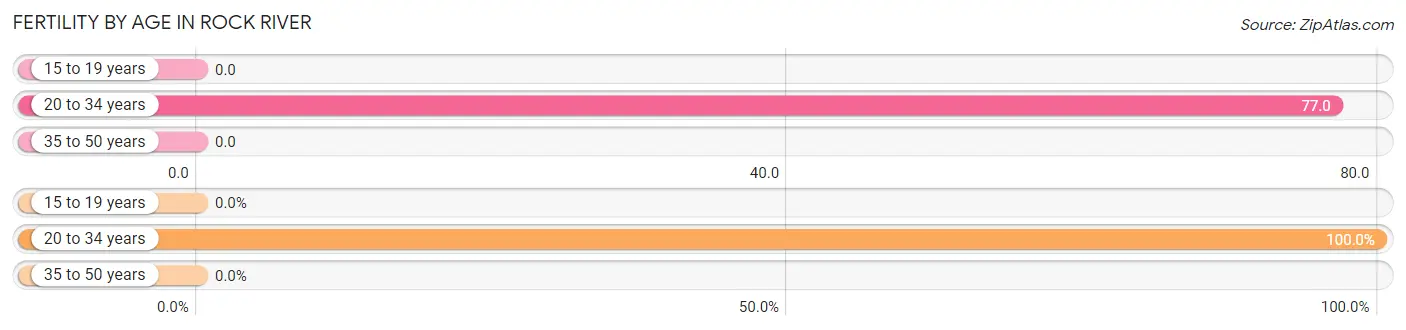
| Age Bracket | Women with Births | Births / 1,000 Women |
| 15 to 19 years | 0 (0.0%) | 0.0 |
| 20 to 34 years | 2 (100.0%) | 77.0 |
| 35 to 50 years | 0 (0.0%) | 0.0 |
| Total | 2 (100.0%) | 38.0 |
Fertility by Age by Marriage Status in Rock River
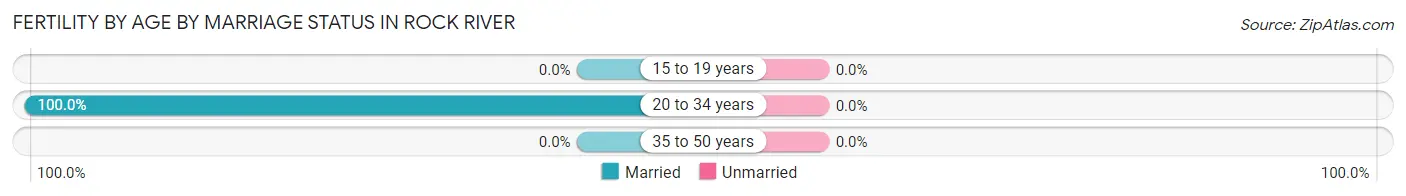
| Age Bracket | Married | Unmarried |
| 15 to 19 years | 0 (0.0%) | 0 (0.0%) |
| 20 to 34 years | 2 (100.0%) | 0 (0.0%) |
| 35 to 50 years | 0 (0.0%) | 0 (0.0%) |
| Total | 2 (100.0%) | 0 (0.0%) |
Fertility by Education in Rock River
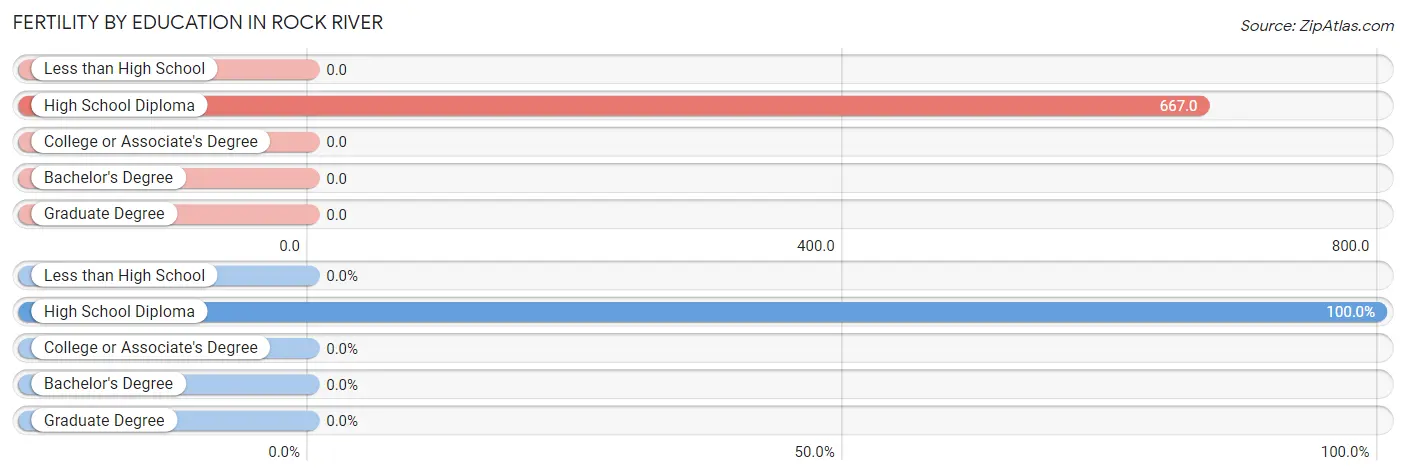
| Educational Attainment | Women with Births | Births / 1,000 Women |
| Less than High School | 0 (0.0%) | 0.0 |
| High School Diploma | 2 (100.0%) | 667.0 |
| College or Associate's Degree | 0 (0.0%) | 0.0 |
| Bachelor's Degree | 0 (0.0%) | 0.0 |
| Graduate Degree | 0 (0.0%) | 0.0 |
| Total | 2 (100.0%) | 38.0 |
Fertility by Education by Marriage Status in Rock River
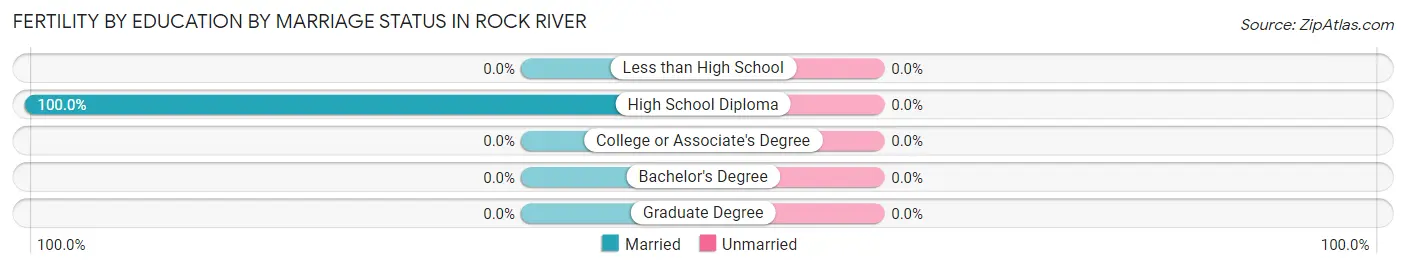
| Educational Attainment | Married | Unmarried |
| Less than High School | 0 (0.0%) | 0 (0.0%) |
| High School Diploma | 2 (100.0%) | 0 (0.0%) |
| College or Associate's Degree | 0 (0.0%) | 0 (0.0%) |
| Bachelor's Degree | 0 (0.0%) | 0 (0.0%) |
| Graduate Degree | 0 (0.0%) | 0 (0.0%) |
| Total | 2 (100.0%) | 0 (0.0%) |
Employment Characteristics in Rock River
Employment by Class of Employer in Rock River
Among the 139 employed individuals in Rock River, private company employees (103 | 74.1%), state government employees (16 | 11.5%), and local government employees (11 | 7.9%) make up the most common classes of employment.
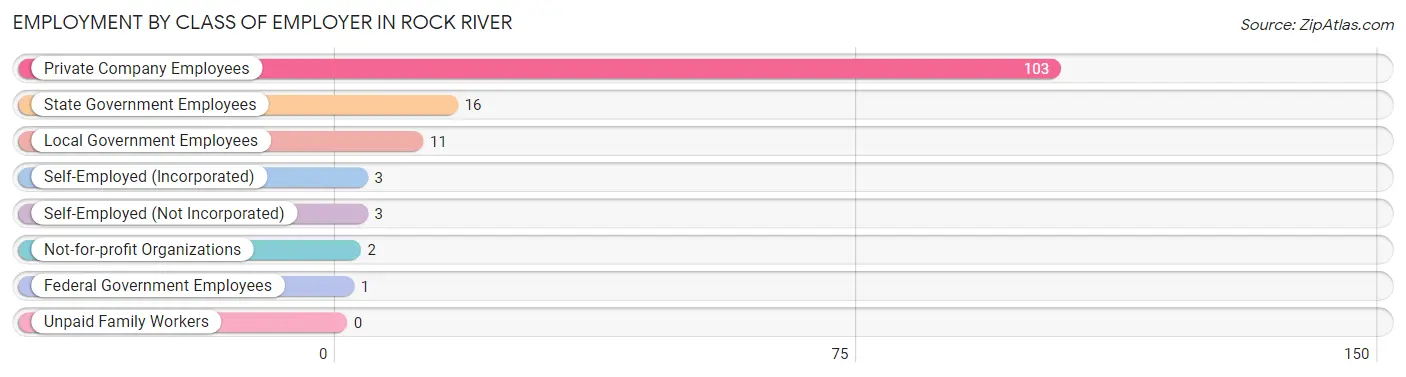
| Employer Class | # Employees | % Employees |
| Private Company Employees | 103 | 74.1% |
| Self-Employed (Incorporated) | 3 | 2.2% |
| Self-Employed (Not Incorporated) | 3 | 2.2% |
| Not-for-profit Organizations | 2 | 1.4% |
| Local Government Employees | 11 | 7.9% |
| State Government Employees | 16 | 11.5% |
| Federal Government Employees | 1 | 0.7% |
| Unpaid Family Workers | 0 | 0.0% |
| Total | 139 | 100.0% |
Employment Status by Age in Rock River
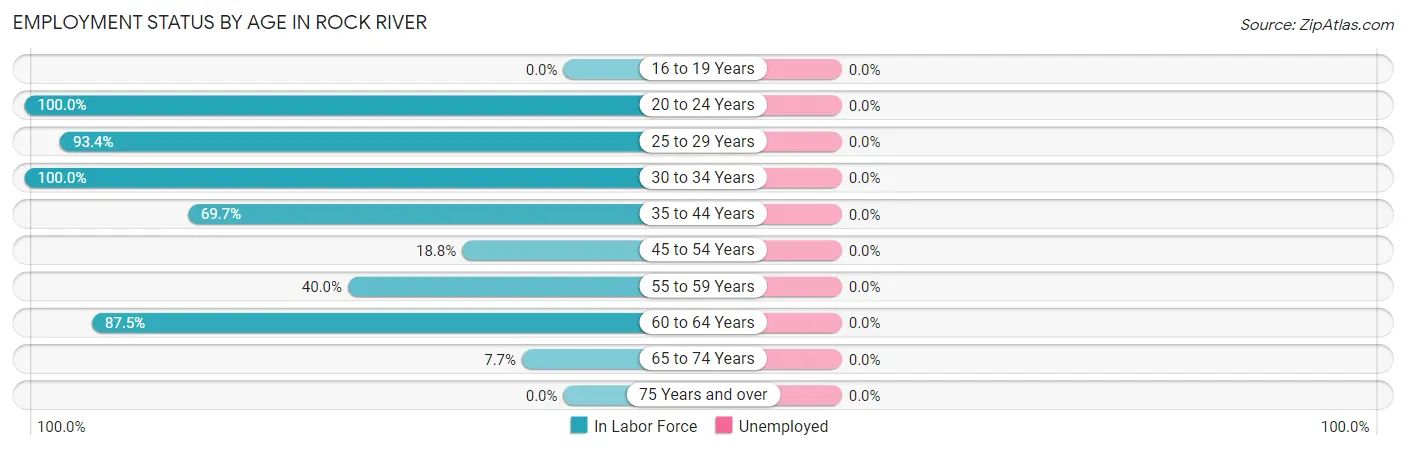
| Age Bracket | In Labor Force | Unemployed |
| 16 to 19 Years | 0 (0.0%) | 0 (0.0%) |
| 20 to 24 Years | 43 (100.0%) | 0 (0.0%) |
| 25 to 29 Years | 57 (93.4%) | 0 (0.0%) |
| 30 to 34 Years | 2 (100.0%) | 0 (0.0%) |
| 35 to 44 Years | 23 (69.7%) | 0 (0.0%) |
| 45 to 54 Years | 3 (18.8%) | 0 (0.0%) |
| 55 to 59 Years | 2 (40.0%) | 0 (0.0%) |
| 60 to 64 Years | 7 (87.5%) | 0 (0.0%) |
| 65 to 74 Years | 2 (7.7%) | 0 (0.0%) |
| 75 Years and over | 0 (0.0%) | 0 (0.0%) |
| Total | 139 (63.8%) | 0 (0.0%) |
Employment Status by Educational Attainment in Rock River
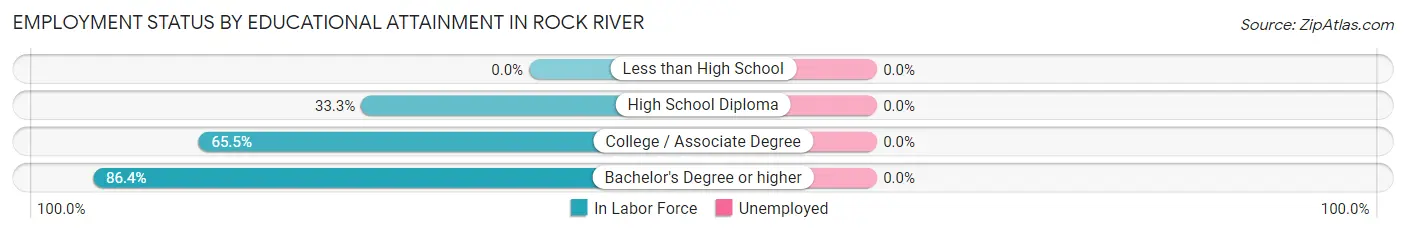
| Educational Attainment | In Labor Force | Unemployed |
| Less than High School | 0 (0.0%) | 0 (0.0%) |
| High School Diploma | 5 (33.3%) | 0 (0.0%) |
| College / Associate Degree | 19 (65.5%) | 0 (0.0%) |
| Bachelor's Degree or higher | 70 (86.4%) | 0 (0.0%) |
| Total | 94 (75.2%) | 0 (0.0%) |
Employment Occupations by Sex in Rock River
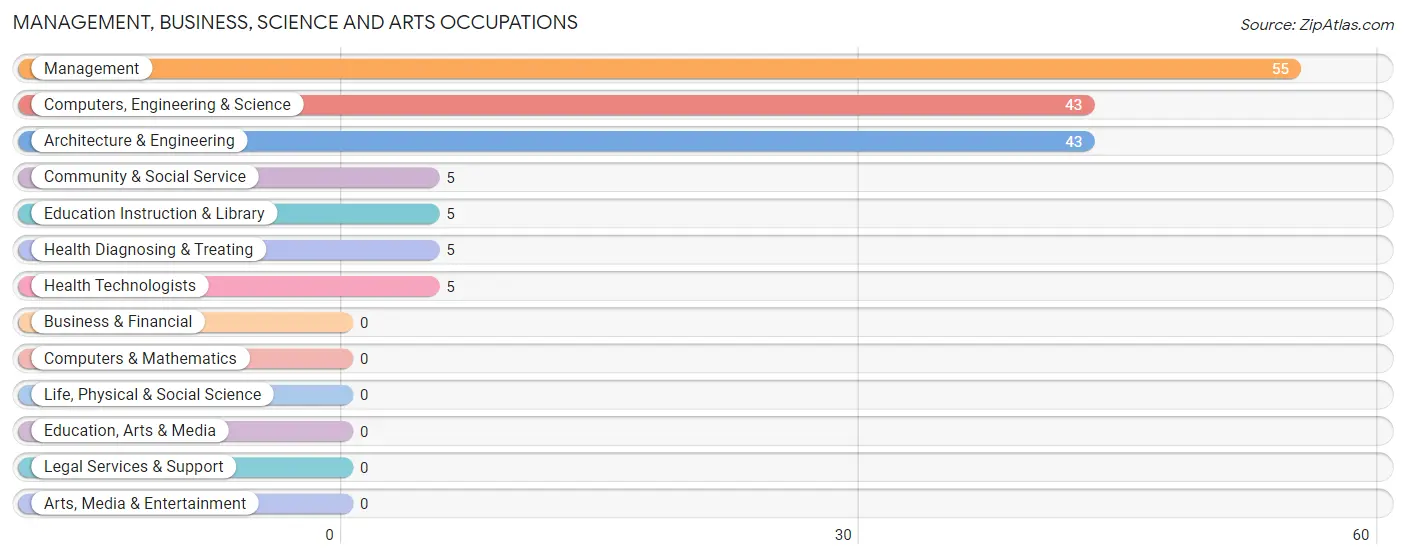
Management, Business, Science and Arts Occupations
The most common Management, Business, Science and Arts occupations in Rock River are Management (55 | 39.6%), Computers, Engineering & Science (43 | 30.9%), Architecture & Engineering (43 | 30.9%), Community & Social Service (5 | 3.6%), and Education Instruction & Library (5 | 3.6%).
Management, Business, Science and Arts Occupations by Sex
Within the Management, Business, Science and Arts occupations in Rock River, the most male-oriented occupations are Community & Social Service (100.0%), Education Instruction & Library (100.0%), and Management (98.2%), while the most female-oriented occupations are Health Diagnosing & Treating (100.0%), Health Technologists (100.0%), and Computers, Engineering & Science (46.5%).
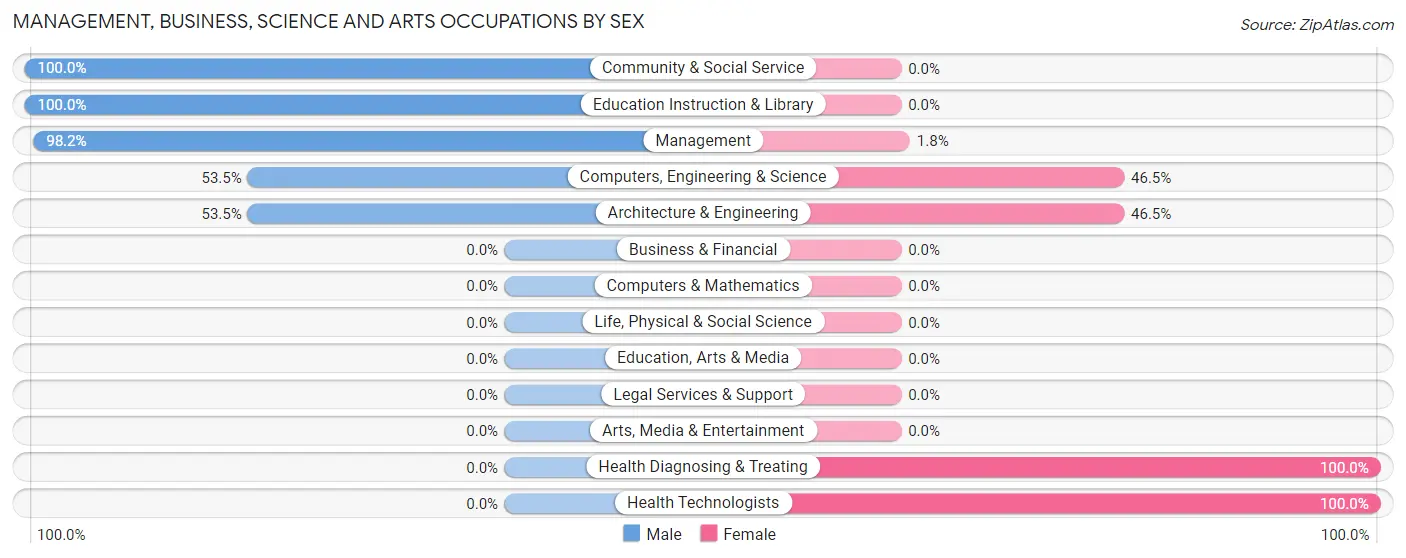
| Occupation | Male | Female |
| Management | 54 (98.2%) | 1 (1.8%) |
| Business & Financial | 0 (0.0%) | 0 (0.0%) |
| Computers, Engineering & Science | 23 (53.5%) | 20 (46.5%) |
| Computers & Mathematics | 0 (0.0%) | 0 (0.0%) |
| Architecture & Engineering | 23 (53.5%) | 20 (46.5%) |
| Life, Physical & Social Science | 0 (0.0%) | 0 (0.0%) |
| Community & Social Service | 5 (100.0%) | 0 (0.0%) |
| Education, Arts & Media | 0 (0.0%) | 0 (0.0%) |
| Legal Services & Support | 0 (0.0%) | 0 (0.0%) |
| Education Instruction & Library | 5 (100.0%) | 0 (0.0%) |
| Arts, Media & Entertainment | 0 (0.0%) | 0 (0.0%) |
| Health Diagnosing & Treating | 0 (0.0%) | 5 (100.0%) |
| Health Technologists | 0 (0.0%) | 5 (100.0%) |
| Total (Category) | 82 (75.9%) | 26 (24.1%) |
| Total (Overall) | 104 (74.8%) | 35 (25.2%) |
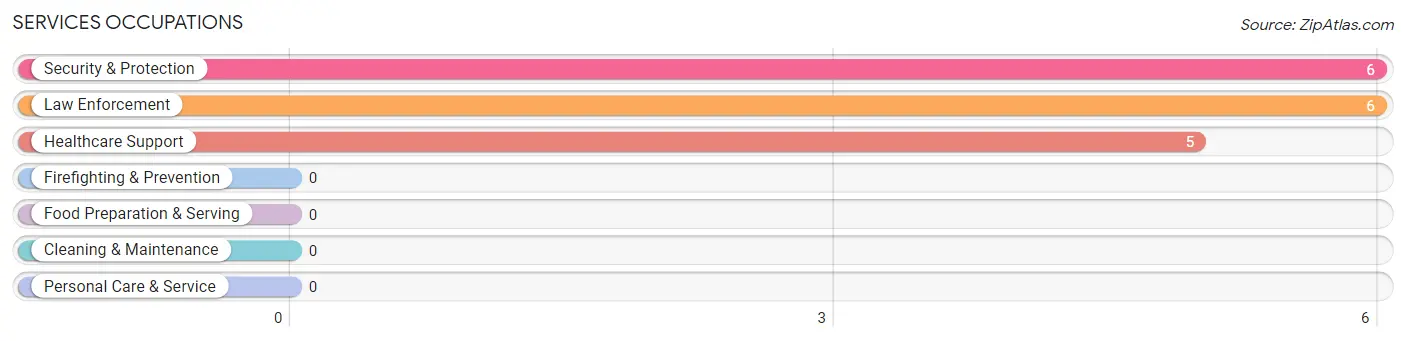
Services Occupations
The most common Services occupations in Rock River are Security & Protection (6 | 4.3%), Law Enforcement (6 | 4.3%), and Healthcare Support (5 | 3.6%).
Services Occupations by Sex
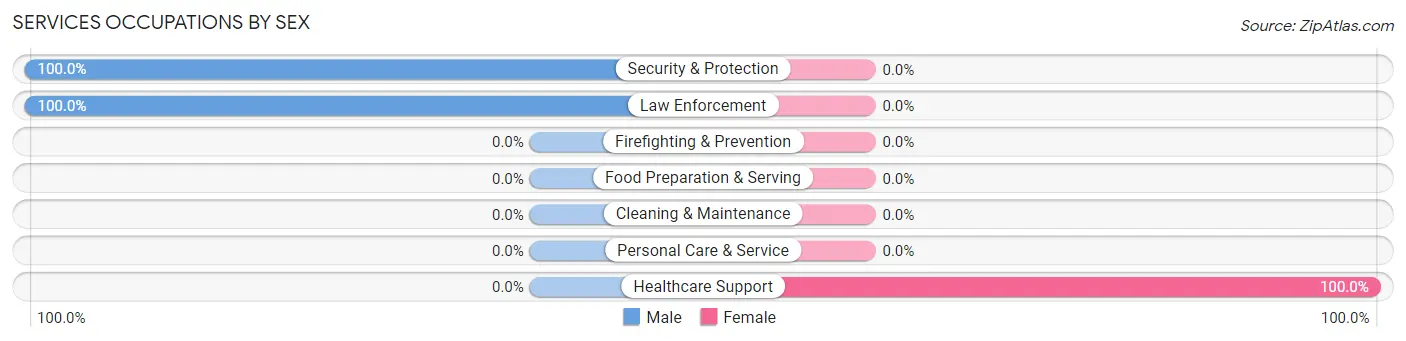
| Occupation | Male | Female |
| Healthcare Support | 0 (0.0%) | 5 (100.0%) |
| Security & Protection | 6 (100.0%) | 0 (0.0%) |
| Firefighting & Prevention | 0 (0.0%) | 0 (0.0%) |
| Law Enforcement | 6 (100.0%) | 0 (0.0%) |
| Food Preparation & Serving | 0 (0.0%) | 0 (0.0%) |
| Cleaning & Maintenance | 0 (0.0%) | 0 (0.0%) |
| Personal Care & Service | 0 (0.0%) | 0 (0.0%) |
| Total (Category) | 6 (54.5%) | 5 (45.5%) |
| Total (Overall) | 104 (74.8%) | 35 (25.2%) |
Sales and Office Occupations
The most common Sales and Office occupations in Rock River are Sales & Related (3 | 2.2%), and Office & Administration (2 | 1.4%).
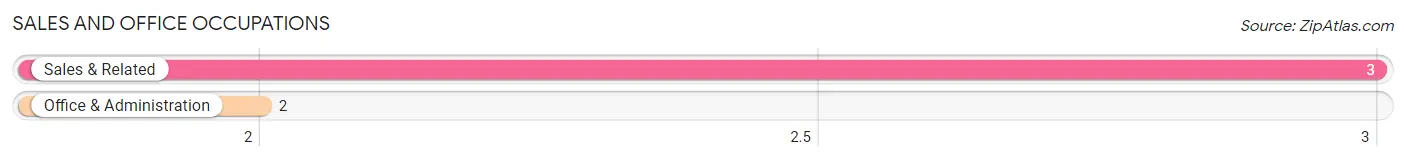
Sales and Office Occupations by Sex

| Occupation | Male | Female |
| Sales & Related | 1 (33.3%) | 2 (66.7%) |
| Office & Administration | 0 (0.0%) | 2 (100.0%) |
| Total (Category) | 1 (20.0%) | 4 (80.0%) |
| Total (Overall) | 104 (74.8%) | 35 (25.2%) |
Natural Resources, Construction and Maintenance Occupations
The most common Natural Resources, Construction and Maintenance occupations in Rock River are Construction & Extraction (13 | 9.3%), and Installation, Maintenance & Repair (2 | 1.4%).
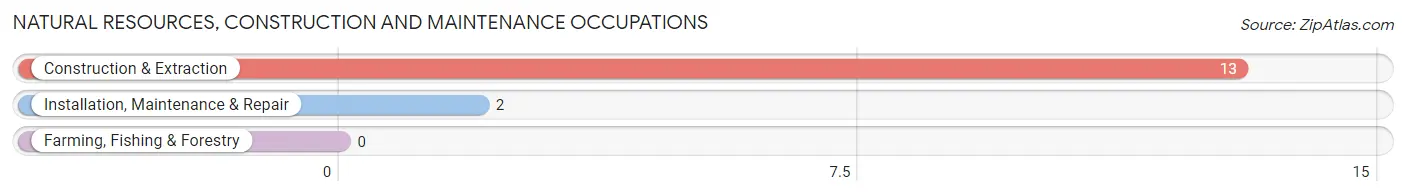
Natural Resources, Construction and Maintenance Occupations by Sex
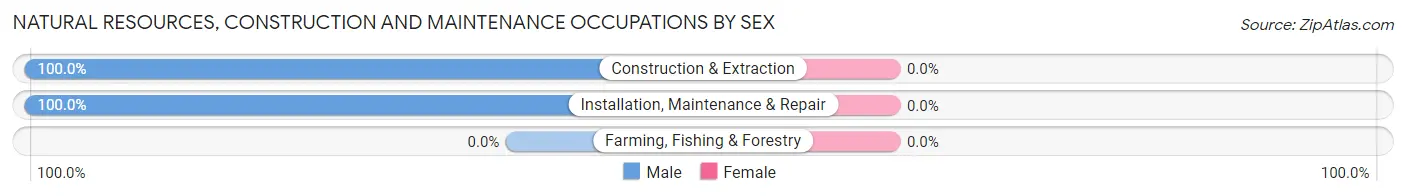
| Occupation | Male | Female |
| Farming, Fishing & Forestry | 0 (0.0%) | 0 (0.0%) |
| Construction & Extraction | 13 (100.0%) | 0 (0.0%) |
| Installation, Maintenance & Repair | 2 (100.0%) | 0 (0.0%) |
| Total (Category) | 15 (100.0%) | 0 (0.0%) |
| Total (Overall) | 104 (74.8%) | 35 (25.2%) |
Production, Transportation and Moving Occupations
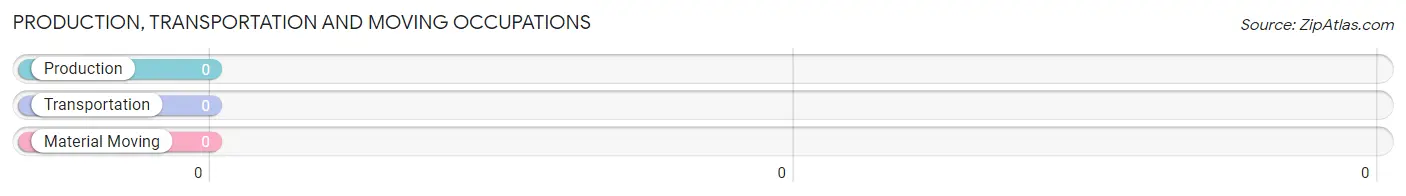
Production, Transportation and Moving Occupations by Sex
| Occupation | Male | Female |
| Production | 0 (0.0%) | 0 (0.0%) |
| Transportation | 0 (0.0%) | 0 (0.0%) |
| Material Moving | 0 (0.0%) | 0 (0.0%) |
| Total (Category) | 0 (0.0%) | 0 (0.0%) |
| Total (Overall) | 104 (74.8%) | 35 (25.2%) |
Employment Industries by Sex in Rock River
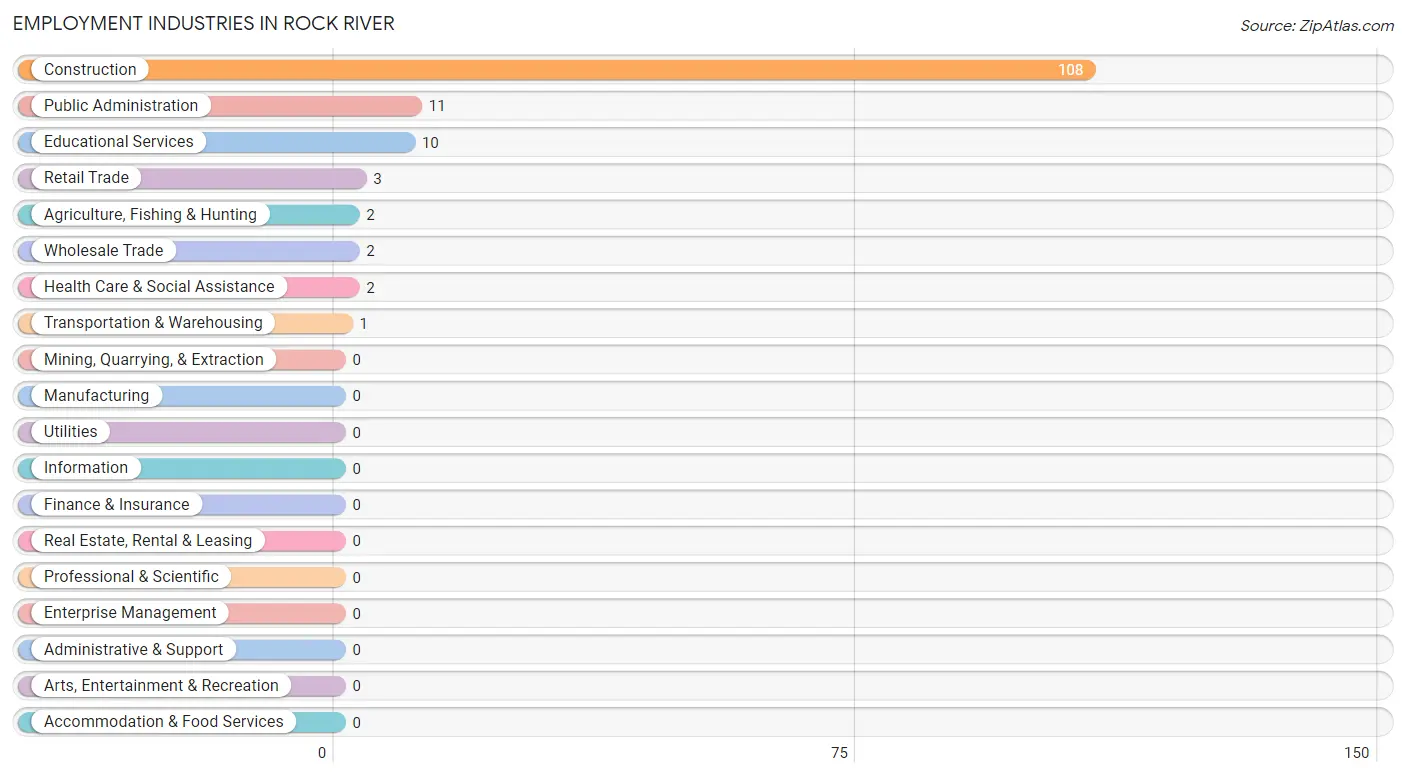
Employment Industries in Rock River
The major employment industries in Rock River include Construction (108 | 77.7%), Public Administration (11 | 7.9%), Educational Services (10 | 7.2%), Retail Trade (3 | 2.2%), and Agriculture, Fishing & Hunting (2 | 1.4%).
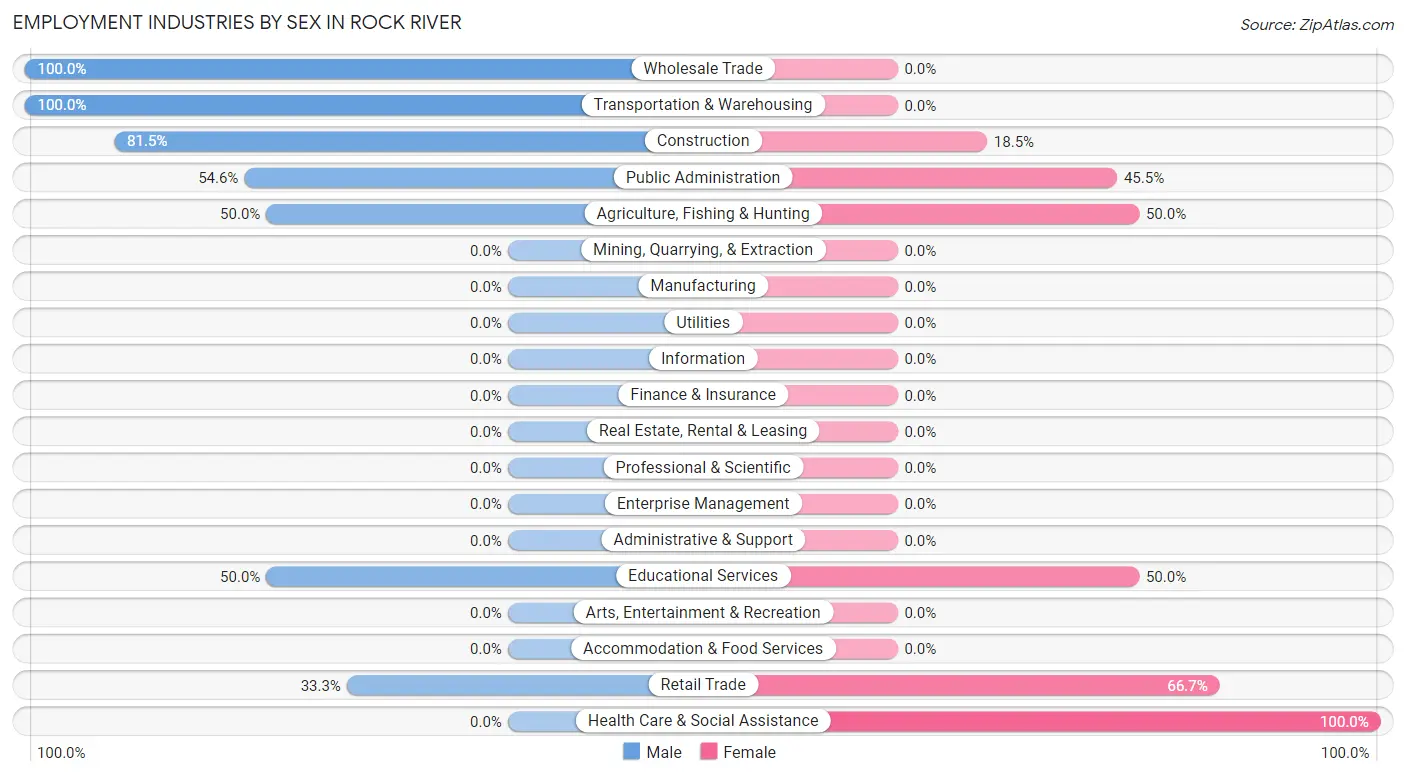
Employment Industries by Sex in Rock River
The Rock River industries that see more men than women are Wholesale Trade (100.0%), Transportation & Warehousing (100.0%), and Construction (81.5%), whereas the industries that tend to have a higher number of women are Health Care & Social Assistance (100.0%), Retail Trade (66.7%), and Agriculture, Fishing & Hunting (50.0%).
| Industry | Male | Female |
| Agriculture, Fishing & Hunting | 1 (50.0%) | 1 (50.0%) |
| Mining, Quarrying, & Extraction | 0 (0.0%) | 0 (0.0%) |
| Construction | 88 (81.5%) | 20 (18.5%) |
| Manufacturing | 0 (0.0%) | 0 (0.0%) |
| Wholesale Trade | 2 (100.0%) | 0 (0.0%) |
| Retail Trade | 1 (33.3%) | 2 (66.7%) |
| Transportation & Warehousing | 1 (100.0%) | 0 (0.0%) |
| Utilities | 0 (0.0%) | 0 (0.0%) |
| Information | 0 (0.0%) | 0 (0.0%) |
| Finance & Insurance | 0 (0.0%) | 0 (0.0%) |
| Real Estate, Rental & Leasing | 0 (0.0%) | 0 (0.0%) |
| Professional & Scientific | 0 (0.0%) | 0 (0.0%) |
| Enterprise Management | 0 (0.0%) | 0 (0.0%) |
| Administrative & Support | 0 (0.0%) | 0 (0.0%) |
| Educational Services | 5 (50.0%) | 5 (50.0%) |
| Health Care & Social Assistance | 0 (0.0%) | 2 (100.0%) |
| Arts, Entertainment & Recreation | 0 (0.0%) | 0 (0.0%) |
| Accommodation & Food Services | 0 (0.0%) | 0 (0.0%) |
| Public Administration | 6 (54.5%) | 5 (45.5%) |
| Total | 104 (74.8%) | 35 (25.2%) |
Education in Rock River
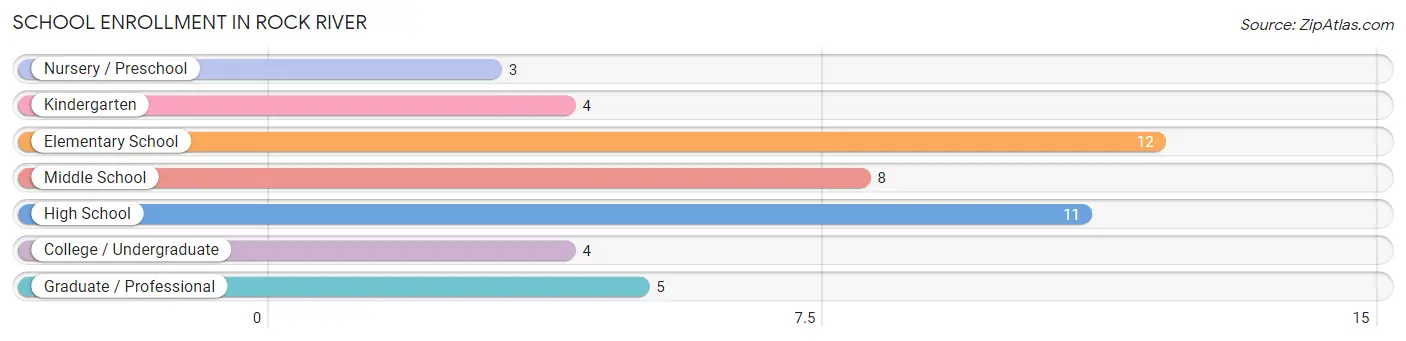
School Enrollment in Rock River
The most common levels of schooling among the 47 students in Rock River are elementary school (12 | 25.5%), high school (11 | 23.4%), and middle school (8 | 17.0%).
| School Level | # Students | % Students |
| Nursery / Preschool | 3 | 6.4% |
| Kindergarten | 4 | 8.5% |
| Elementary School | 12 | 25.5% |
| Middle School | 8 | 17.0% |
| High School | 11 | 23.4% |
| College / Undergraduate | 4 | 8.5% |
| Graduate / Professional | 5 | 10.6% |
| Total | 47 | 100.0% |
School Enrollment by Age by Funding Source in Rock River
Out of a total of 47 students who are enrolled in schools in Rock River, 9 (19.1%) attend a private institution, while the remaining 38 (80.9%) are enrolled in public schools. The age group of 3 to 4 year olds has the highest likelihood of being enrolled in private schools, with 3 (100.0% in the age bracket) enrolled. Conversely, the age group of 5 to 9 year old has the lowest likelihood of being enrolled in a private school, with 12 (100.0% in the age bracket) attending a public institution.
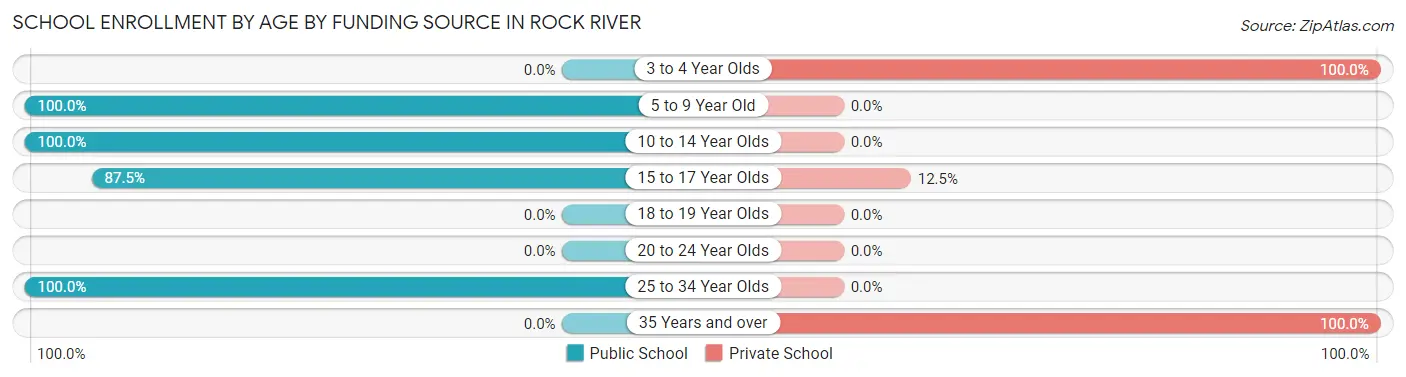
| Age Bracket | Public School | Private School |
| 3 to 4 Year Olds | 0 (0.0%) | 3 (100.0%) |
| 5 to 9 Year Old | 12 (100.0%) | 0 (0.0%) |
| 10 to 14 Year Olds | 15 (100.0%) | 0 (0.0%) |
| 15 to 17 Year Olds | 7 (87.5%) | 1 (12.5%) |
| 18 to 19 Year Olds | 0 (0.0%) | 0 (0.0%) |
| 20 to 24 Year Olds | 0 (0.0%) | 0 (0.0%) |
| 25 to 34 Year Olds | 4 (100.0%) | 0 (0.0%) |
| 35 Years and over | 0 (0.0%) | 5 (100.0%) |
| Total | 38 (80.9%) | 9 (19.1%) |
Educational Attainment by Field of Study in Rock River
Arts & humanities (51 | 39.8%), engineering (22 | 17.2%), literature & languages (13 | 10.2%), bio, nature & agricultural (12 | 9.4%), and science & technology (8 | 6.2%) are the most common fields of study among 128 individuals in Rock River who have obtained a bachelor's degree or higher.
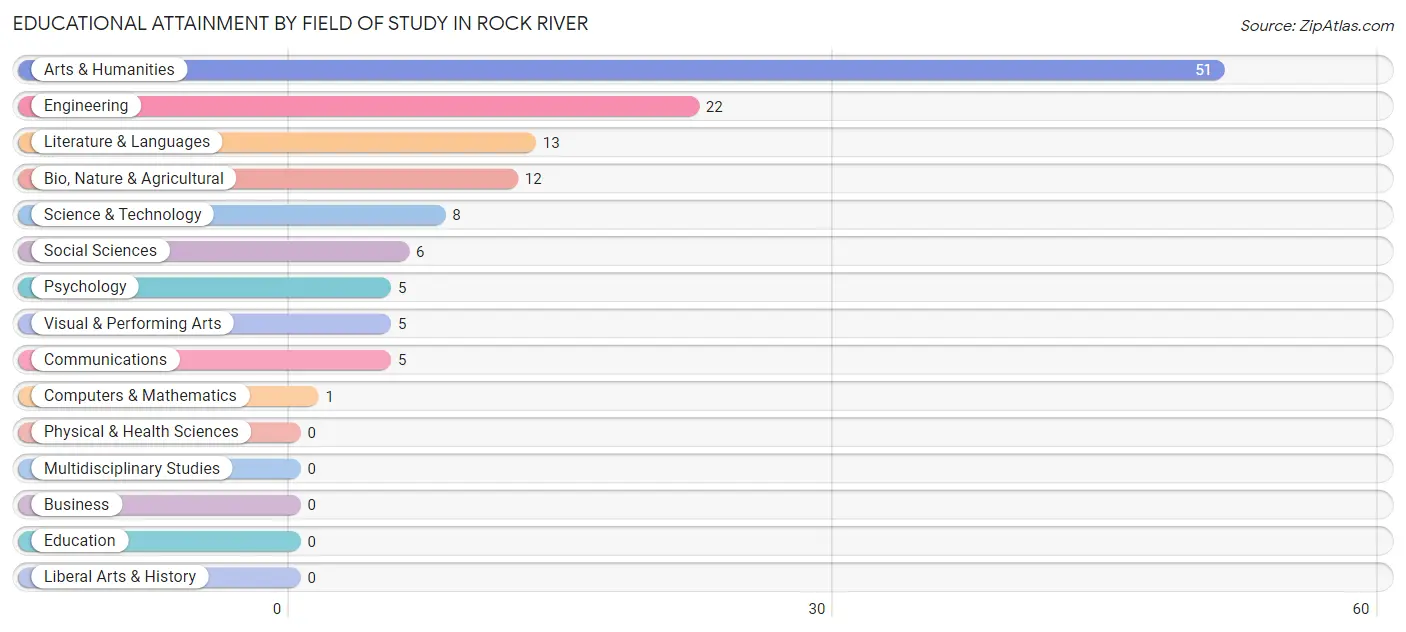
| Field of Study | # Graduates | % Graduates |
| Computers & Mathematics | 1 | 0.8% |
| Bio, Nature & Agricultural | 12 | 9.4% |
| Physical & Health Sciences | 0 | 0.0% |
| Psychology | 5 | 3.9% |
| Social Sciences | 6 | 4.7% |
| Engineering | 22 | 17.2% |
| Multidisciplinary Studies | 0 | 0.0% |
| Science & Technology | 8 | 6.2% |
| Business | 0 | 0.0% |
| Education | 0 | 0.0% |
| Literature & Languages | 13 | 10.2% |
| Liberal Arts & History | 0 | 0.0% |
| Visual & Performing Arts | 5 | 3.9% |
| Communications | 5 | 3.9% |
| Arts & Humanities | 51 | 39.8% |
| Total | 128 | 100.0% |
Transportation & Commute in Rock River
Vehicle Availability by Sex in Rock River
The most prevalent vehicle ownership categories in Rock River are males with 4 vehicles (58, accounting for 55.8%) and females with 4 vehicles (26, making up 165.7%).
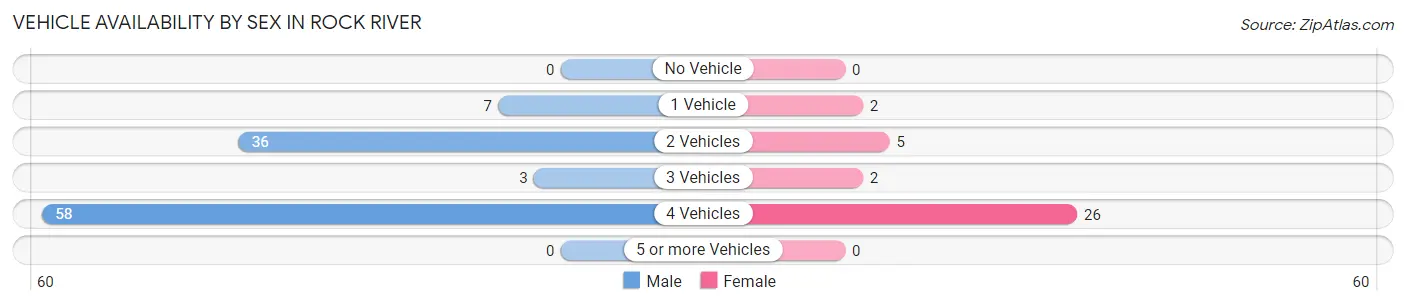
| Vehicles Available | Male | Female |
| No Vehicle | 0 (0.0%) | 0 (0.0%) |
| 1 Vehicle | 7 (6.7%) | 2 (5.7%) |
| 2 Vehicles | 36 (34.6%) | 5 (14.3%) |
| 3 Vehicles | 3 (2.9%) | 2 (5.7%) |
| 4 Vehicles | 58 (55.8%) | 26 (74.3%) |
| 5 or more Vehicles | 0 (0.0%) | 0 (0.0%) |
| Total | 104 (100.0%) | 35 (100.0%) |
Commute Time in Rock River
The most frequently occuring commute durations in Rock River are 30 to 34 minutes (56 commuters, 41.8%), 40 to 44 minutes (38 commuters, 28.4%), and 45 to 59 minutes (23 commuters, 17.2%).
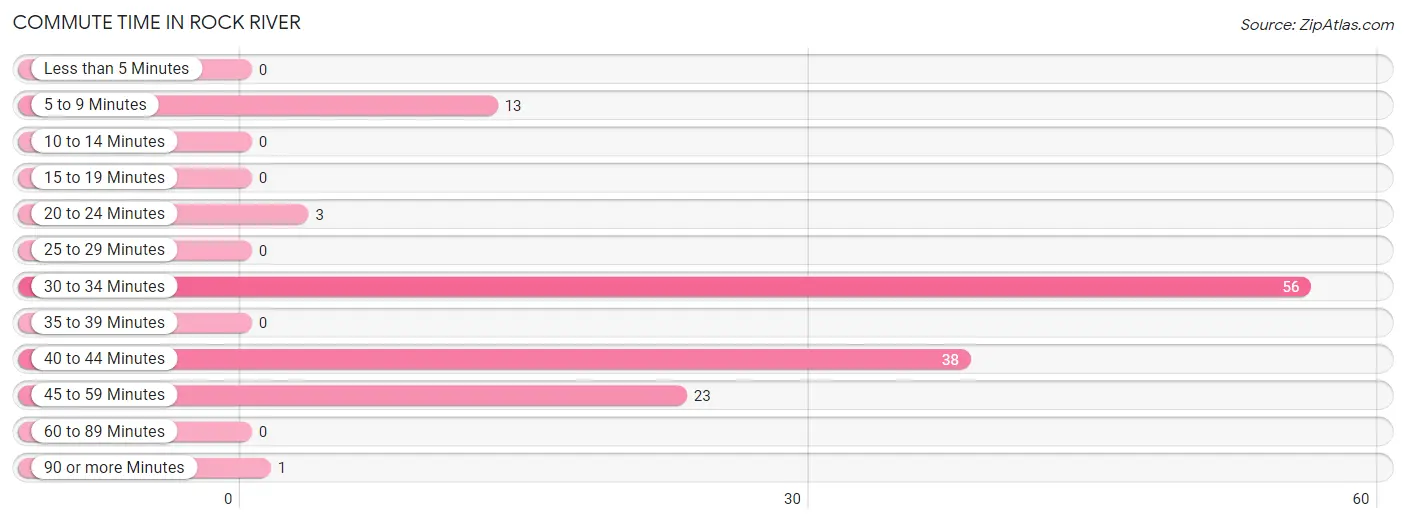
| Commute Time | # Commuters | % Commuters |
| Less than 5 Minutes | 0 | 0.0% |
| 5 to 9 Minutes | 13 | 9.7% |
| 10 to 14 Minutes | 0 | 0.0% |
| 15 to 19 Minutes | 0 | 0.0% |
| 20 to 24 Minutes | 3 | 2.2% |
| 25 to 29 Minutes | 0 | 0.0% |
| 30 to 34 Minutes | 56 | 41.8% |
| 35 to 39 Minutes | 0 | 0.0% |
| 40 to 44 Minutes | 38 | 28.4% |
| 45 to 59 Minutes | 23 | 17.2% |
| 60 to 89 Minutes | 0 | 0.0% |
| 90 or more Minutes | 1 | 0.7% |
Commute Time by Sex in Rock River
The most common commute times in Rock River are 30 to 34 minutes (35 commuters, 33.7%) for males and 30 to 34 minutes (21 commuters, 70.0%) for females.
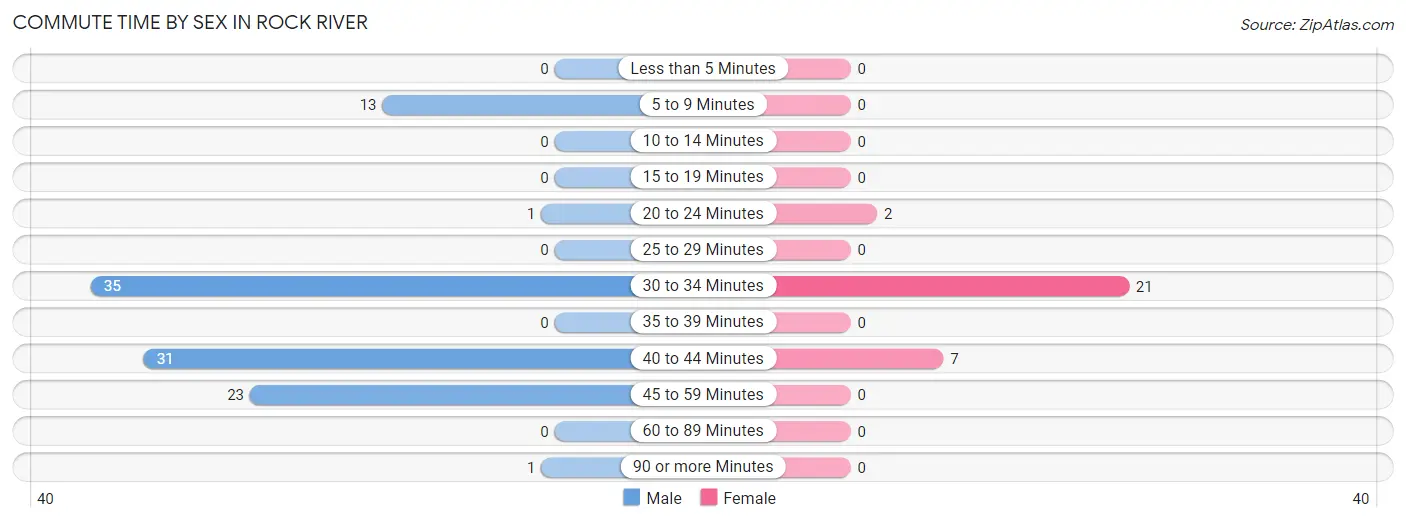
| Commute Time | Male | Female |
| Less than 5 Minutes | 0 (0.0%) | 0 (0.0%) |
| 5 to 9 Minutes | 13 (12.5%) | 0 (0.0%) |
| 10 to 14 Minutes | 0 (0.0%) | 0 (0.0%) |
| 15 to 19 Minutes | 0 (0.0%) | 0 (0.0%) |
| 20 to 24 Minutes | 1 (1.0%) | 2 (6.7%) |
| 25 to 29 Minutes | 0 (0.0%) | 0 (0.0%) |
| 30 to 34 Minutes | 35 (33.7%) | 21 (70.0%) |
| 35 to 39 Minutes | 0 (0.0%) | 0 (0.0%) |
| 40 to 44 Minutes | 31 (29.8%) | 7 (23.3%) |
| 45 to 59 Minutes | 23 (22.1%) | 0 (0.0%) |
| 60 to 89 Minutes | 0 (0.0%) | 0 (0.0%) |
| 90 or more Minutes | 1 (1.0%) | 0 (0.0%) |
Time of Departure to Work by Sex in Rock River
The most frequent times of departure to work in Rock River are 5:30 AM to 5:59 AM (64, 61.5%) for males and 6:00 AM to 6:29 AM (20, 66.7%) for females.
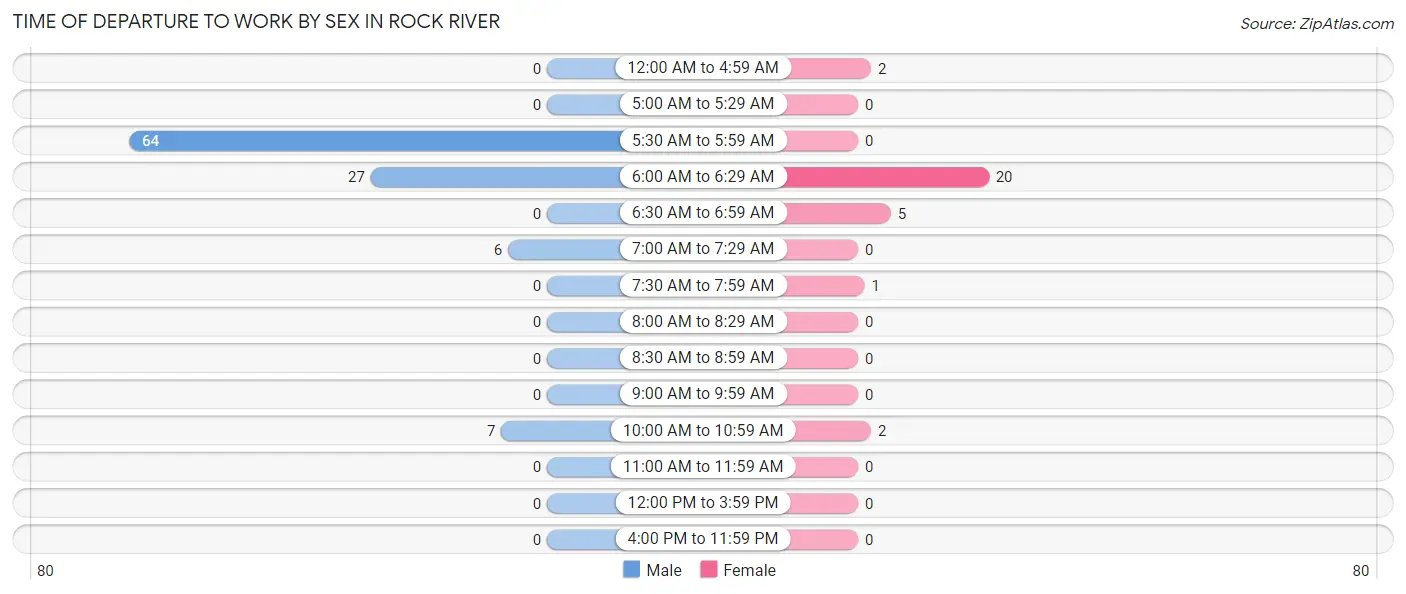
| Time of Departure | Male | Female |
| 12:00 AM to 4:59 AM | 0 (0.0%) | 2 (6.7%) |
| 5:00 AM to 5:29 AM | 0 (0.0%) | 0 (0.0%) |
| 5:30 AM to 5:59 AM | 64 (61.5%) | 0 (0.0%) |
| 6:00 AM to 6:29 AM | 27 (26.0%) | 20 (66.7%) |
| 6:30 AM to 6:59 AM | 0 (0.0%) | 5 (16.7%) |
| 7:00 AM to 7:29 AM | 6 (5.8%) | 0 (0.0%) |
| 7:30 AM to 7:59 AM | 0 (0.0%) | 1 (3.3%) |
| 8:00 AM to 8:29 AM | 0 (0.0%) | 0 (0.0%) |
| 8:30 AM to 8:59 AM | 0 (0.0%) | 0 (0.0%) |
| 9:00 AM to 9:59 AM | 0 (0.0%) | 0 (0.0%) |
| 10:00 AM to 10:59 AM | 7 (6.7%) | 2 (6.7%) |
| 11:00 AM to 11:59 AM | 0 (0.0%) | 0 (0.0%) |
| 12:00 PM to 3:59 PM | 0 (0.0%) | 0 (0.0%) |
| 4:00 PM to 11:59 PM | 0 (0.0%) | 0 (0.0%) |
| Total | 104 (100.0%) | 30 (100.0%) |
Housing Occupancy in Rock River
Occupancy by Ownership in Rock River
Of the total 113 dwellings in Rock River, owner-occupied units account for 50 (44.3%), while renter-occupied units make up 63 (55.7%).
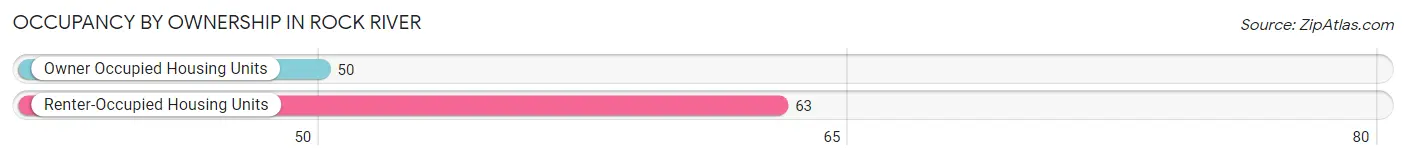
| Occupancy | # Housing Units | % Housing Units |
| Owner Occupied Housing Units | 50 | 44.3% |
| Renter-Occupied Housing Units | 63 | 55.7% |
| Total Occupied Housing Units | 113 | 100.0% |
Occupancy by Household Size in Rock River
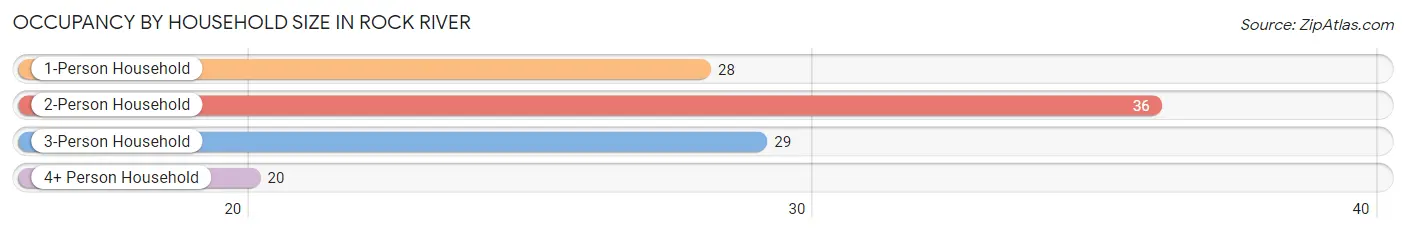
| Household Size | # Housing Units | % Housing Units |
| 1-Person Household | 28 | 24.8% |
| 2-Person Household | 36 | 31.9% |
| 3-Person Household | 29 | 25.7% |
| 4+ Person Household | 20 | 17.7% |
| Total Housing Units | 113 | 100.0% |
Occupancy by Ownership by Household Size in Rock River
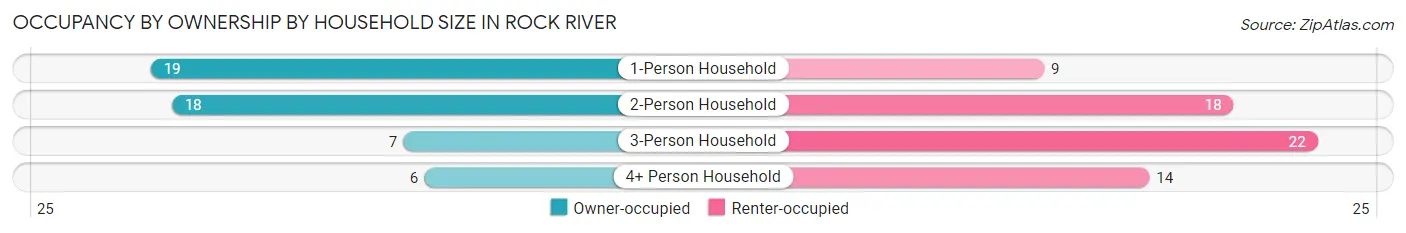
| Household Size | Owner-occupied | Renter-occupied |
| 1-Person Household | 19 (67.9%) | 9 (32.1%) |
| 2-Person Household | 18 (50.0%) | 18 (50.0%) |
| 3-Person Household | 7 (24.1%) | 22 (75.9%) |
| 4+ Person Household | 6 (30.0%) | 14 (70.0%) |
| Total Housing Units | 50 (44.3%) | 63 (55.7%) |
Occupancy by Educational Attainment in Rock River
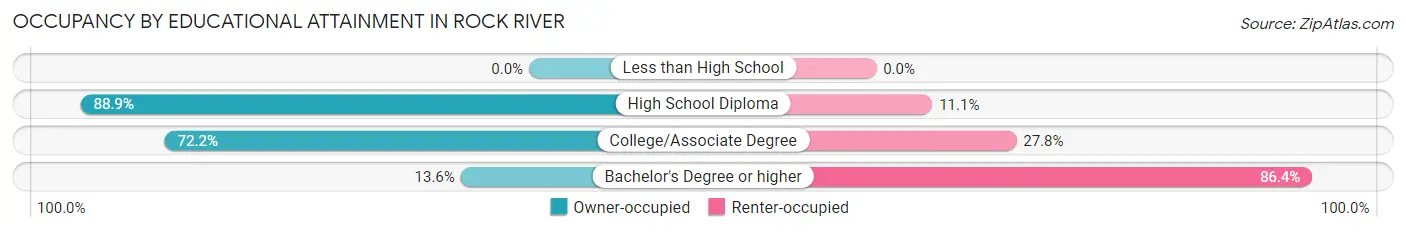
| Household Size | Owner-occupied | Renter-occupied |
| Less than High School | 0 (0.0%) | 0 (0.0%) |
| High School Diploma | 16 (88.9%) | 2 (11.1%) |
| College/Associate Degree | 26 (72.2%) | 10 (27.8%) |
| Bachelor's Degree or higher | 8 (13.6%) | 51 (86.4%) |
Occupancy by Age of Householder in Rock River
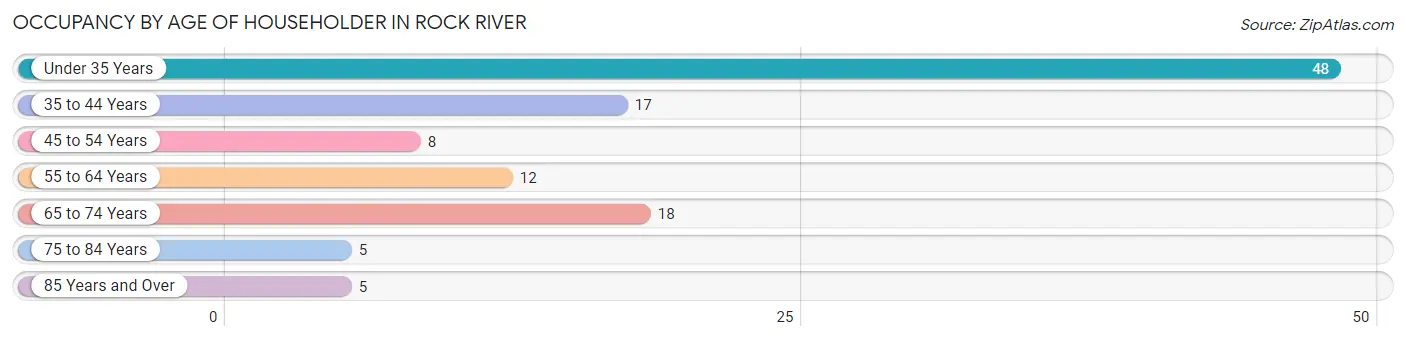
| Age Bracket | # Households | % Households |
| Under 35 Years | 48 | 42.5% |
| 35 to 44 Years | 17 | 15.0% |
| 45 to 54 Years | 8 | 7.1% |
| 55 to 64 Years | 12 | 10.6% |
| 65 to 74 Years | 18 | 15.9% |
| 75 to 84 Years | 5 | 4.4% |
| 85 Years and Over | 5 | 4.4% |
| Total | 113 | 100.0% |
Housing Finances in Rock River
Median Income by Occupancy in Rock River
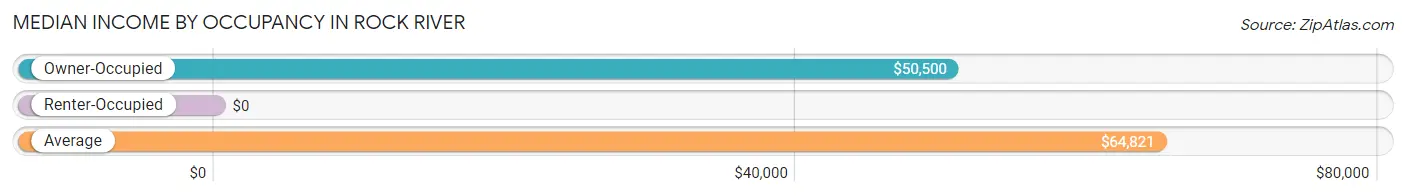
| Occupancy Type | # Households | Median Income |
| Owner-Occupied | 50 (44.3%) | $50,500 |
| Renter-Occupied | 63 (55.7%) | $0 |
| Average | 113 (100.0%) | $64,821 |
Occupancy by Householder Income Bracket in Rock River
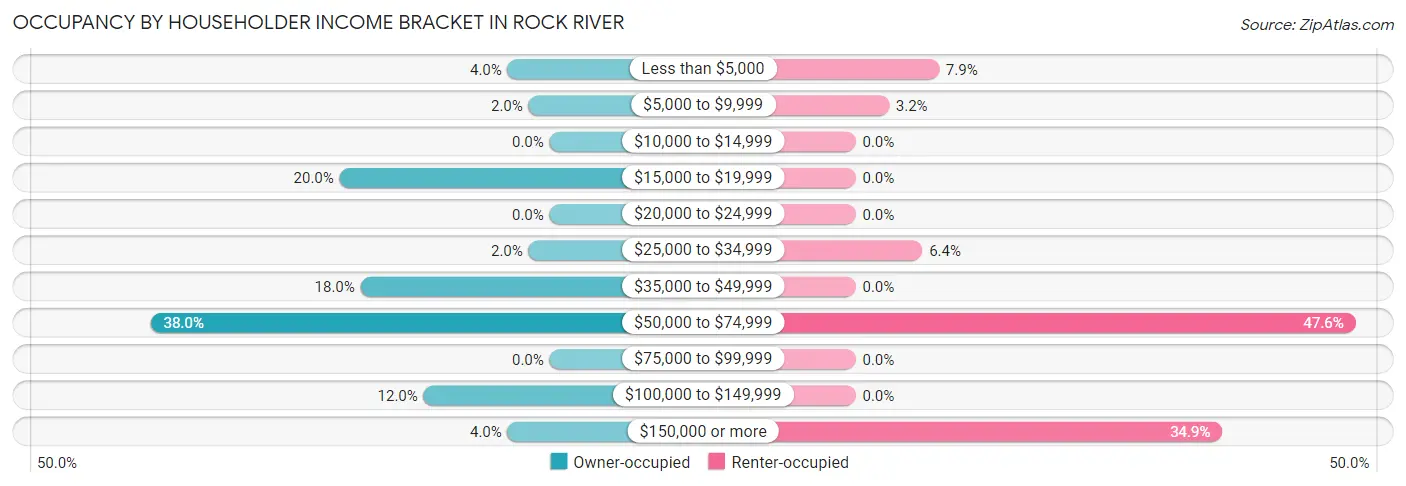
| Income Bracket | Owner-occupied | Renter-occupied |
| Less than $5,000 | 2 (4.0%) | 5 (7.9%) |
| $5,000 to $9,999 | 1 (2.0%) | 2 (3.2%) |
| $10,000 to $14,999 | 0 (0.0%) | 0 (0.0%) |
| $15,000 to $19,999 | 10 (20.0%) | 0 (0.0%) |
| $20,000 to $24,999 | 0 (0.0%) | 0 (0.0%) |
| $25,000 to $34,999 | 1 (2.0%) | 4 (6.4%) |
| $35,000 to $49,999 | 9 (18.0%) | 0 (0.0%) |
| $50,000 to $74,999 | 19 (38.0%) | 30 (47.6%) |
| $75,000 to $99,999 | 0 (0.0%) | 0 (0.0%) |
| $100,000 to $149,999 | 6 (12.0%) | 0 (0.0%) |
| $150,000 or more | 2 (4.0%) | 22 (34.9%) |
| Total | 50 (100.0%) | 63 (100.0%) |
Monthly Housing Cost Tiers in Rock River
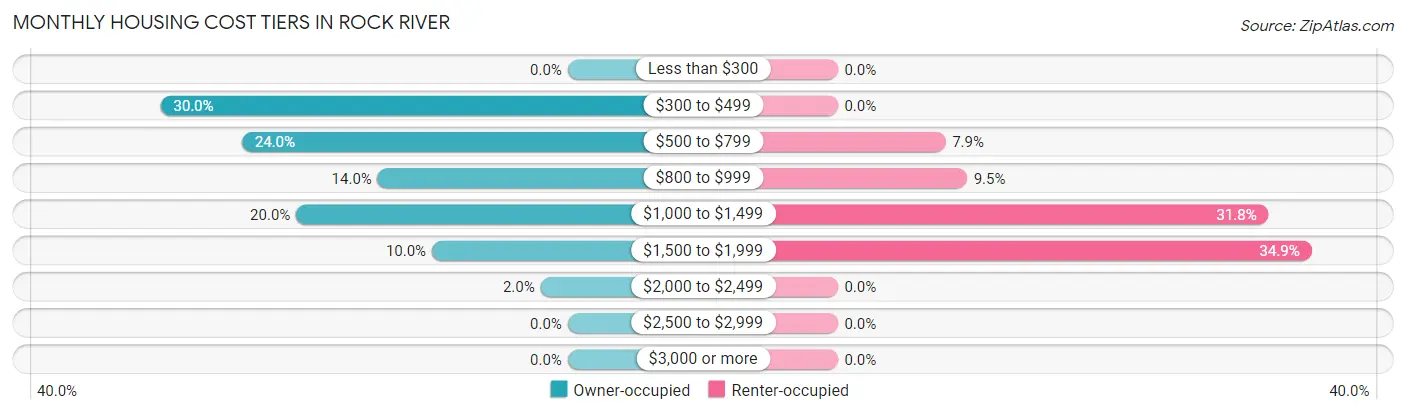
| Monthly Cost | Owner-occupied | Renter-occupied |
| Less than $300 | 0 (0.0%) | 0 (0.0%) |
| $300 to $499 | 15 (30.0%) | 0 (0.0%) |
| $500 to $799 | 12 (24.0%) | 5 (7.9%) |
| $800 to $999 | 7 (14.0%) | 6 (9.5%) |
| $1,000 to $1,499 | 10 (20.0%) | 20 (31.8%) |
| $1,500 to $1,999 | 5 (10.0%) | 22 (34.9%) |
| $2,000 to $2,499 | 1 (2.0%) | 0 (0.0%) |
| $2,500 to $2,999 | 0 (0.0%) | 0 (0.0%) |
| $3,000 or more | 0 (0.0%) | 0 (0.0%) |
| Total | 50 (100.0%) | 63 (100.0%) |
Physical Housing Characteristics in Rock River
Housing Structures in Rock River
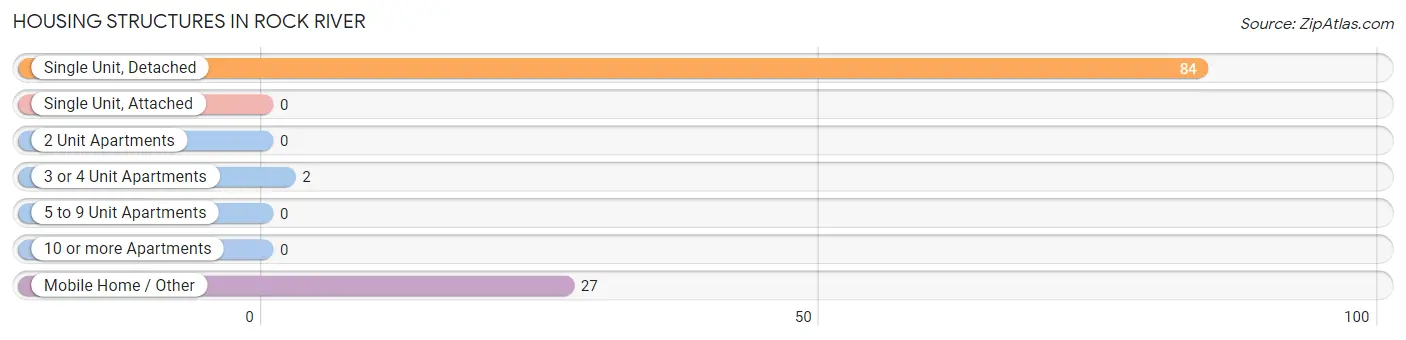
| Structure Type | # Housing Units | % Housing Units |
| Single Unit, Detached | 84 | 74.3% |
| Single Unit, Attached | 0 | 0.0% |
| 2 Unit Apartments | 0 | 0.0% |
| 3 or 4 Unit Apartments | 2 | 1.8% |
| 5 to 9 Unit Apartments | 0 | 0.0% |
| 10 or more Apartments | 0 | 0.0% |
| Mobile Home / Other | 27 | 23.9% |
| Total | 113 | 100.0% |
Housing Structures by Occupancy in Rock River
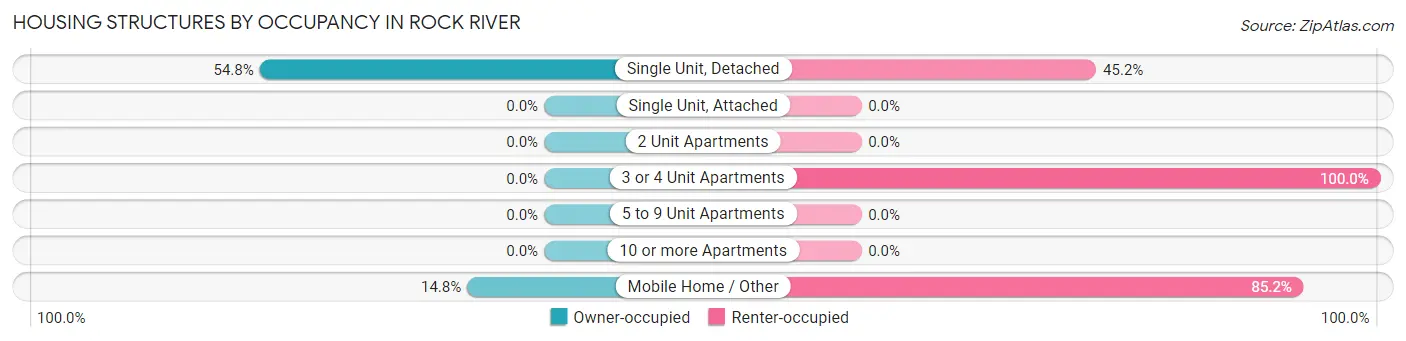
| Structure Type | Owner-occupied | Renter-occupied |
| Single Unit, Detached | 46 (54.8%) | 38 (45.2%) |
| Single Unit, Attached | 0 (0.0%) | 0 (0.0%) |
| 2 Unit Apartments | 0 (0.0%) | 0 (0.0%) |
| 3 or 4 Unit Apartments | 0 (0.0%) | 2 (100.0%) |
| 5 to 9 Unit Apartments | 0 (0.0%) | 0 (0.0%) |
| 10 or more Apartments | 0 (0.0%) | 0 (0.0%) |
| Mobile Home / Other | 4 (14.8%) | 23 (85.2%) |
| Total | 50 (44.3%) | 63 (55.7%) |
Housing Structures by Number of Rooms in Rock River
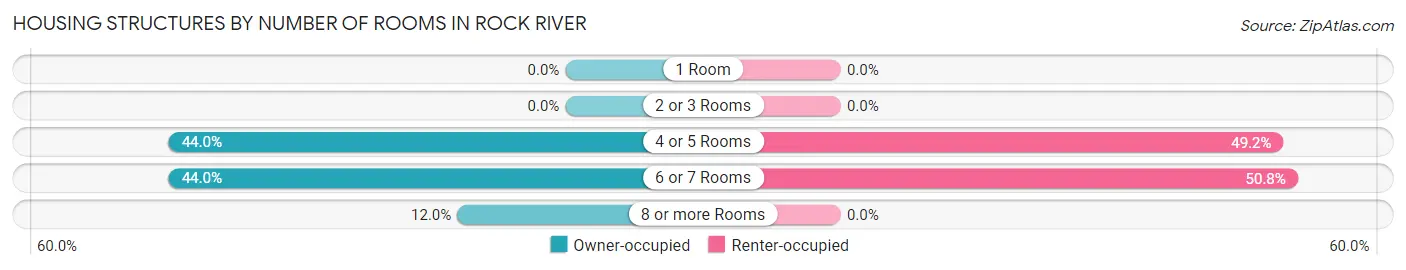
| Number of Rooms | Owner-occupied | Renter-occupied |
| 1 Room | 0 (0.0%) | 0 (0.0%) |
| 2 or 3 Rooms | 0 (0.0%) | 0 (0.0%) |
| 4 or 5 Rooms | 22 (44.0%) | 31 (49.2%) |
| 6 or 7 Rooms | 22 (44.0%) | 32 (50.8%) |
| 8 or more Rooms | 6 (12.0%) | 0 (0.0%) |
| Total | 50 (100.0%) | 63 (100.0%) |
Housing Structure by Heating Type in Rock River
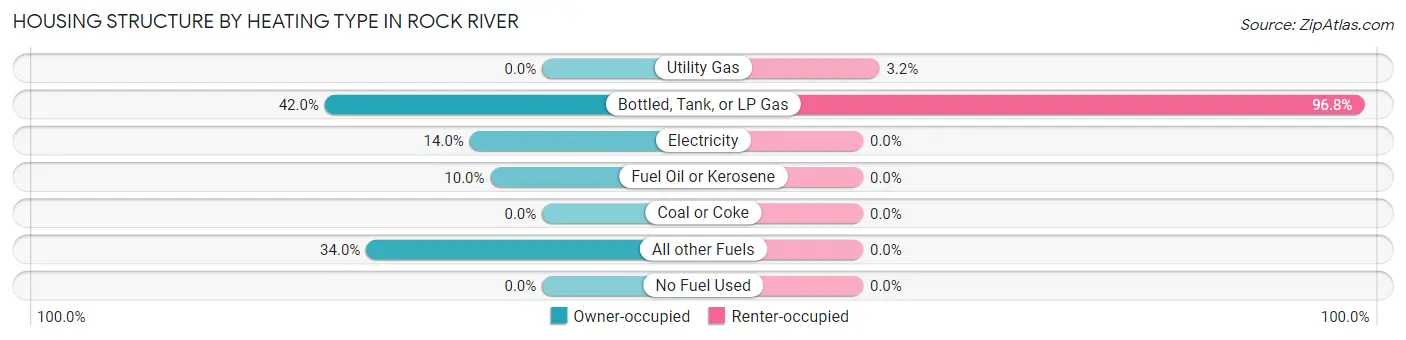
| Heating Type | Owner-occupied | Renter-occupied |
| Utility Gas | 0 (0.0%) | 2 (3.2%) |
| Bottled, Tank, or LP Gas | 21 (42.0%) | 61 (96.8%) |
| Electricity | 7 (14.0%) | 0 (0.0%) |
| Fuel Oil or Kerosene | 5 (10.0%) | 0 (0.0%) |
| Coal or Coke | 0 (0.0%) | 0 (0.0%) |
| All other Fuels | 17 (34.0%) | 0 (0.0%) |
| No Fuel Used | 0 (0.0%) | 0 (0.0%) |
| Total | 50 (100.0%) | 63 (100.0%) |
Household Vehicle Usage in Rock River
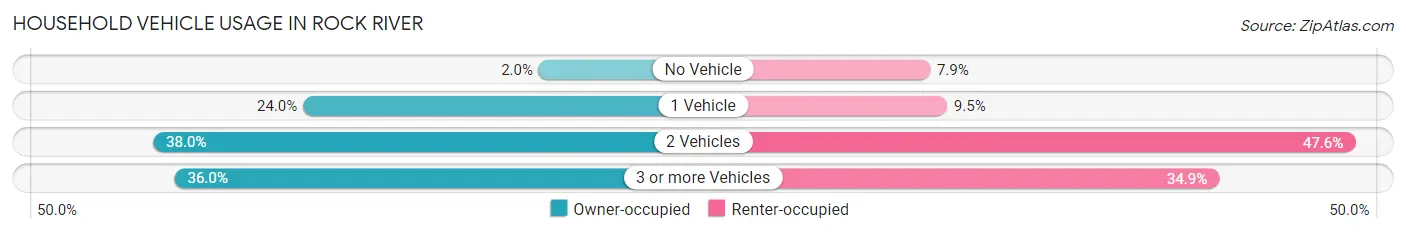
| Vehicles per Household | Owner-occupied | Renter-occupied |
| No Vehicle | 1 (2.0%) | 5 (7.9%) |
| 1 Vehicle | 12 (24.0%) | 6 (9.5%) |
| 2 Vehicles | 19 (38.0%) | 30 (47.6%) |
| 3 or more Vehicles | 18 (36.0%) | 22 (34.9%) |
| Total | 50 (100.0%) | 63 (100.0%) |
Real Estate & Mortgages in Rock River
Real Estate and Mortgage Overview in Rock River
| Characteristic | Without Mortgage | With Mortgage |
| Housing Units | 24 | 26 |
| Median Property Value | $152,500 | $116,700 |
| Median Household Income | $50,000 | $0 |
| Monthly Housing Costs | $475 | $0 |
| Real Estate Taxes | $667 | $0 |
Property Value by Mortgage Status in Rock River
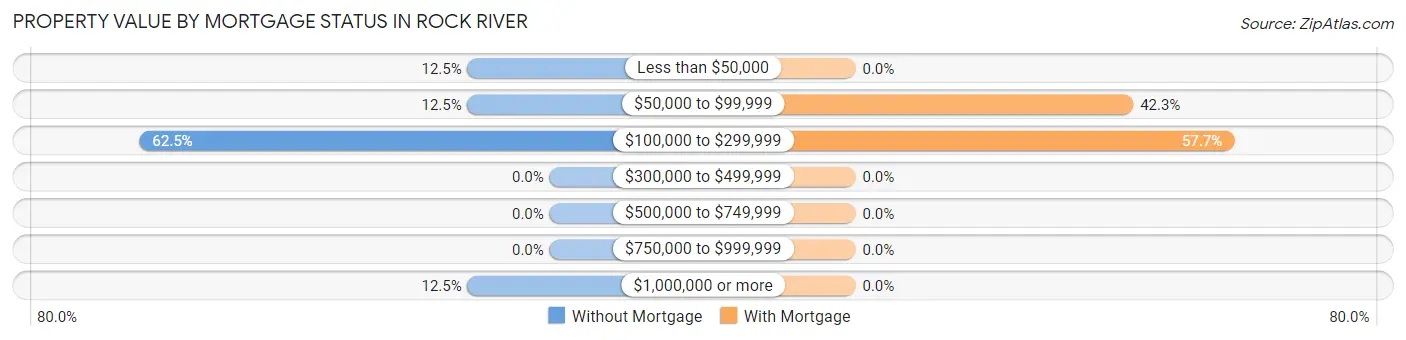
| Property Value | Without Mortgage | With Mortgage |
| Less than $50,000 | 3 (12.5%) | 0 (0.0%) |
| $50,000 to $99,999 | 3 (12.5%) | 11 (42.3%) |
| $100,000 to $299,999 | 15 (62.5%) | 15 (57.7%) |
| $300,000 to $499,999 | 0 (0.0%) | 0 (0.0%) |
| $500,000 to $749,999 | 0 (0.0%) | 0 (0.0%) |
| $750,000 to $999,999 | 0 (0.0%) | 0 (0.0%) |
| $1,000,000 or more | 3 (12.5%) | 0 (0.0%) |
| Total | 24 (100.0%) | 26 (100.0%) |
Household Income by Mortgage Status in Rock River
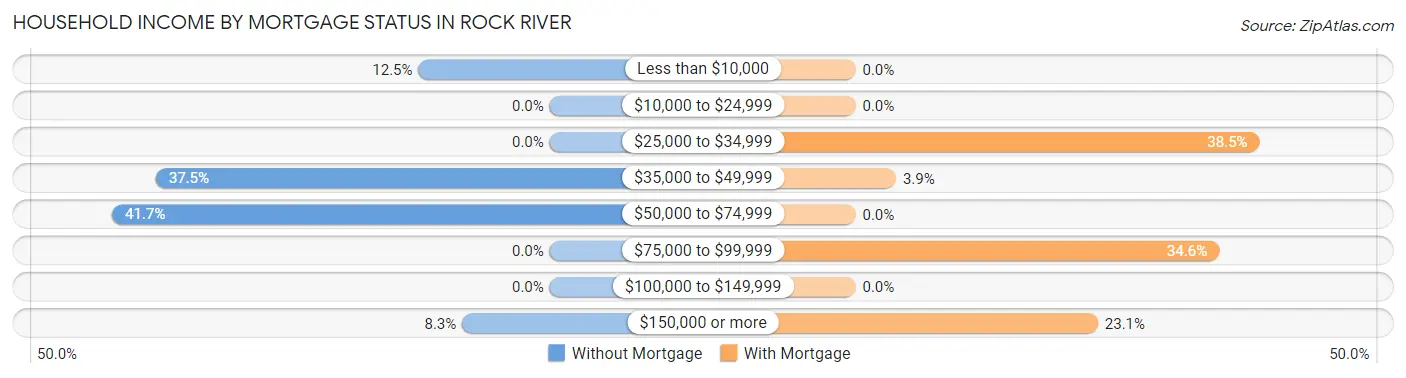
| Household Income | Without Mortgage | With Mortgage |
| Less than $10,000 | 3 (12.5%) | 0 (0.0%) |
| $10,000 to $24,999 | 0 (0.0%) | 0 (0.0%) |
| $25,000 to $34,999 | 0 (0.0%) | 10 (38.5%) |
| $35,000 to $49,999 | 9 (37.5%) | 1 (3.8%) |
| $50,000 to $74,999 | 10 (41.7%) | 0 (0.0%) |
| $75,000 to $99,999 | 0 (0.0%) | 9 (34.6%) |
| $100,000 to $149,999 | 0 (0.0%) | 0 (0.0%) |
| $150,000 or more | 2 (8.3%) | 6 (23.1%) |
| Total | 24 (100.0%) | 26 (100.0%) |
Property Value to Household Income Ratio in Rock River
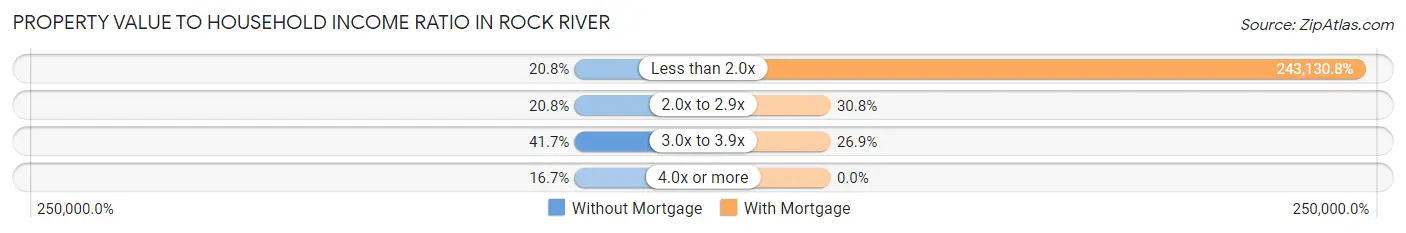
| Value-to-Income Ratio | Without Mortgage | With Mortgage |
| Less than 2.0x | 5 (20.8%) | 63,214 (243,130.8%) |
| 2.0x to 2.9x | 5 (20.8%) | 8 (30.8%) |
| 3.0x to 3.9x | 10 (41.7%) | 7 (26.9%) |
| 4.0x or more | 4 (16.7%) | 0 (0.0%) |
| Total | 24 (100.0%) | 26 (100.0%) |
Real Estate Taxes by Mortgage Status in Rock River
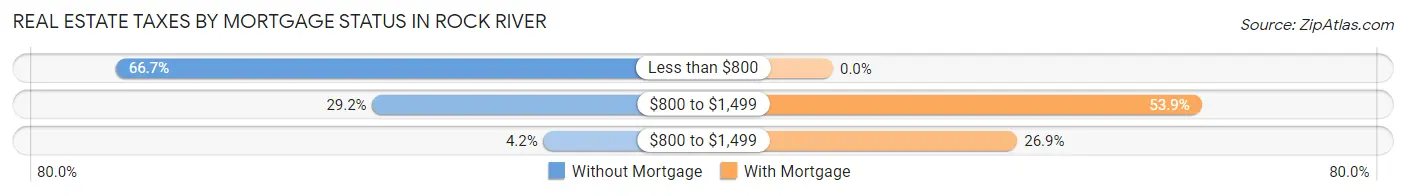
| Property Taxes | Without Mortgage | With Mortgage |
| Less than $800 | 16 (66.7%) | 0 (0.0%) |
| $800 to $1,499 | 7 (29.2%) | 14 (53.8%) |
| $800 to $1,499 | 1 (4.2%) | 7 (26.9%) |
| Total | 24 (100.0%) | 26 (100.0%) |
Health & Disability in Rock River
Health Insurance Coverage by Age in Rock River
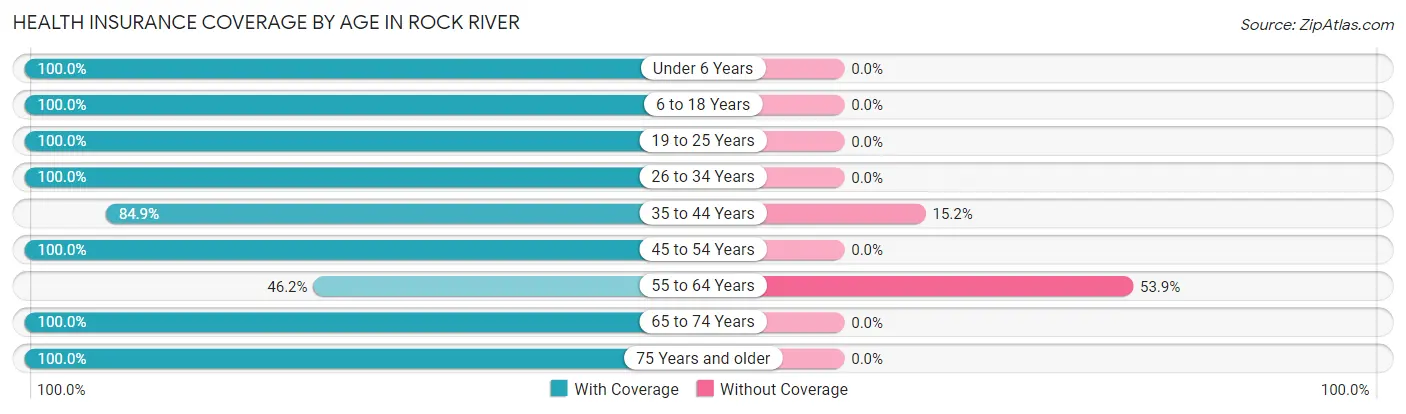
| Age Bracket | With Coverage | Without Coverage |
| Under 6 Years | 28 (100.0%) | 0 (0.0%) |
| 6 to 18 Years | 31 (100.0%) | 0 (0.0%) |
| 19 to 25 Years | 43 (100.0%) | 0 (0.0%) |
| 26 to 34 Years | 63 (100.0%) | 0 (0.0%) |
| 35 to 44 Years | 28 (84.9%) | 5 (15.1%) |
| 45 to 54 Years | 16 (100.0%) | 0 (0.0%) |
| 55 to 64 Years | 6 (46.2%) | 7 (53.8%) |
| 65 to 74 Years | 26 (100.0%) | 0 (0.0%) |
| 75 Years and older | 16 (100.0%) | 0 (0.0%) |
| Total | 257 (95.5%) | 12 (4.5%) |
Health Insurance Coverage by Citizenship Status in Rock River
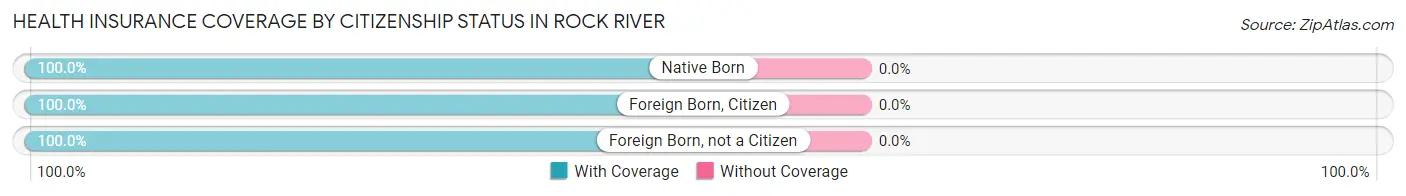
| Citizenship Status | With Coverage | Without Coverage |
| Native Born | 28 (100.0%) | 0 (0.0%) |
| Foreign Born, Citizen | 31 (100.0%) | 0 (0.0%) |
| Foreign Born, not a Citizen | 43 (100.0%) | 0 (0.0%) |
Health Insurance Coverage by Household Income in Rock River
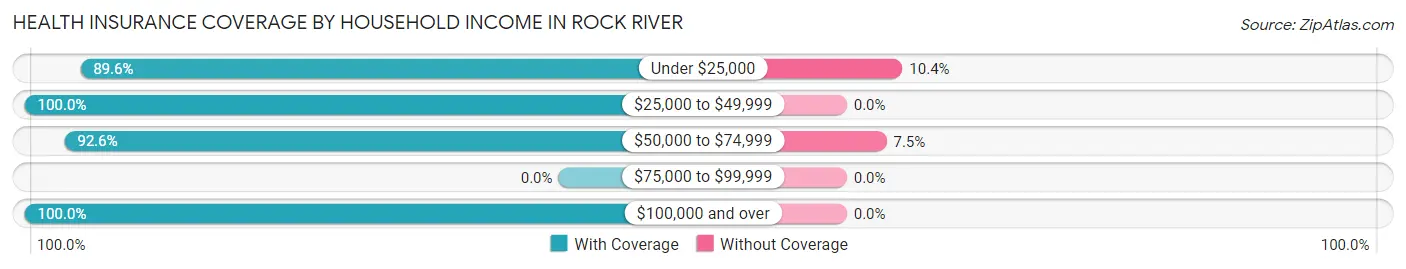
| Household Income | With Coverage | Without Coverage |
| Under $25,000 | 43 (89.6%) | 5 (10.4%) |
| $25,000 to $49,999 | 26 (100.0%) | 0 (0.0%) |
| $50,000 to $74,999 | 87 (92.5%) | 7 (7.4%) |
| $75,000 to $99,999 | 0 (0.0%) | 0 (0.0%) |
| $100,000 and over | 101 (100.0%) | 0 (0.0%) |
Public vs Private Health Insurance Coverage by Age in Rock River
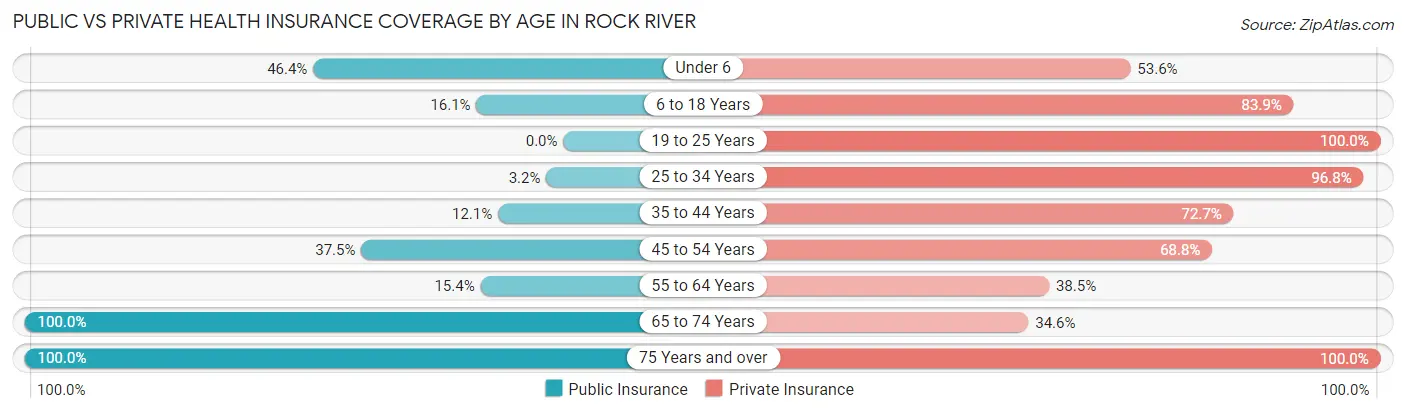
| Age Bracket | Public Insurance | Private Insurance |
| Under 6 | 13 (46.4%) | 15 (53.6%) |
| 6 to 18 Years | 5 (16.1%) | 26 (83.9%) |
| 19 to 25 Years | 0 (0.0%) | 43 (100.0%) |
| 25 to 34 Years | 2 (3.2%) | 61 (96.8%) |
| 35 to 44 Years | 4 (12.1%) | 24 (72.7%) |
| 45 to 54 Years | 6 (37.5%) | 11 (68.8%) |
| 55 to 64 Years | 2 (15.4%) | 5 (38.5%) |
| 65 to 74 Years | 26 (100.0%) | 9 (34.6%) |
| 75 Years and over | 16 (100.0%) | 16 (100.0%) |
| Total | 74 (27.5%) | 210 (78.1%) |
Disability Status by Sex by Age in Rock River
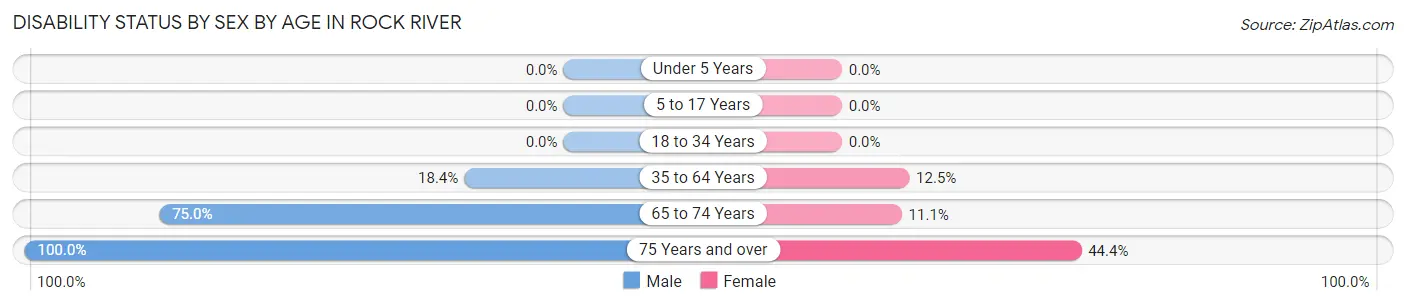
| Age Bracket | Male | Female |
| Under 5 Years | 0 (0.0%) | 0 (0.0%) |
| 5 to 17 Years | 0 (0.0%) | 0 (0.0%) |
| 18 to 34 Years | 0 (0.0%) | 0 (0.0%) |
| 35 to 64 Years | 7 (18.4%) | 3 (12.5%) |
| 65 to 74 Years | 6 (75.0%) | 2 (11.1%) |
| 75 Years and over | 7 (100.0%) | 4 (44.4%) |
Disability Class by Sex by Age in Rock River
Disability Class: Hearing Difficulty
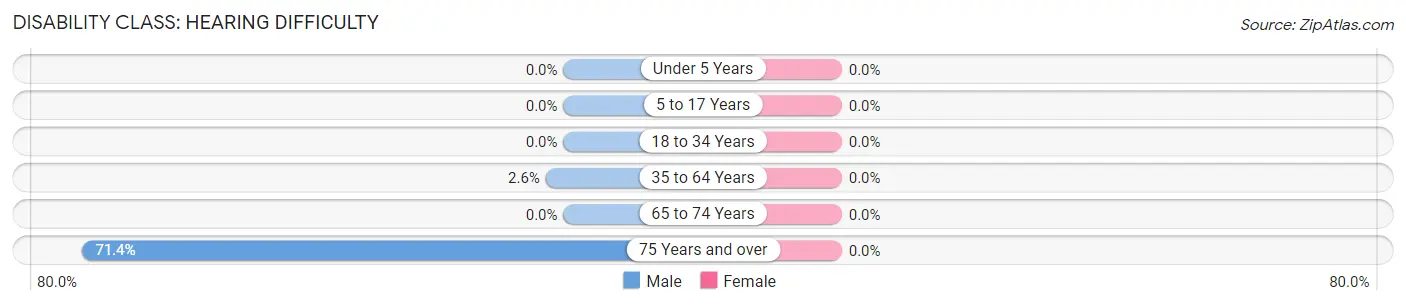
| Age Bracket | Male | Female |
| Under 5 Years | 0 (0.0%) | 0 (0.0%) |
| 5 to 17 Years | 0 (0.0%) | 0 (0.0%) |
| 18 to 34 Years | 0 (0.0%) | 0 (0.0%) |
| 35 to 64 Years | 1 (2.6%) | 0 (0.0%) |
| 65 to 74 Years | 0 (0.0%) | 0 (0.0%) |
| 75 Years and over | 5 (71.4%) | 0 (0.0%) |
Disability Class: Vision Difficulty
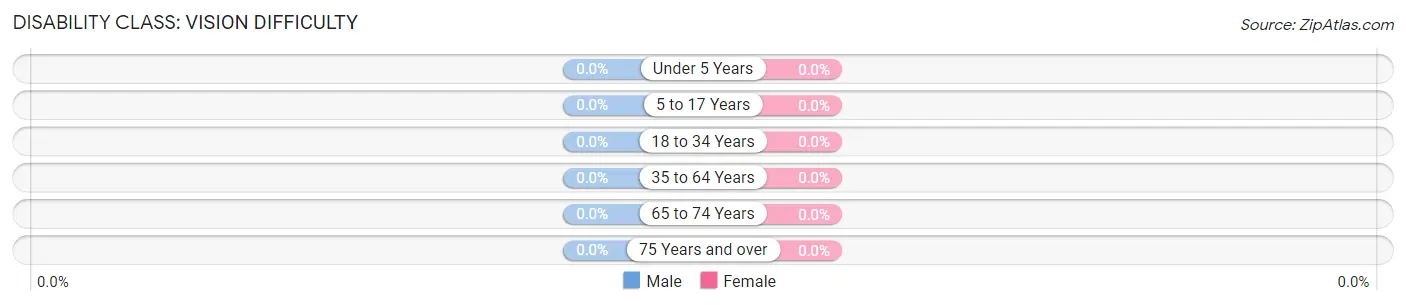
| Age Bracket | Male | Female |
| Under 5 Years | 0 (0.0%) | 0 (0.0%) |
| 5 to 17 Years | 0 (0.0%) | 0 (0.0%) |
| 18 to 34 Years | 0 (0.0%) | 0 (0.0%) |
| 35 to 64 Years | 0 (0.0%) | 0 (0.0%) |
| 65 to 74 Years | 0 (0.0%) | 0 (0.0%) |
| 75 Years and over | 0 (0.0%) | 0 (0.0%) |
Disability Class: Cognitive Difficulty
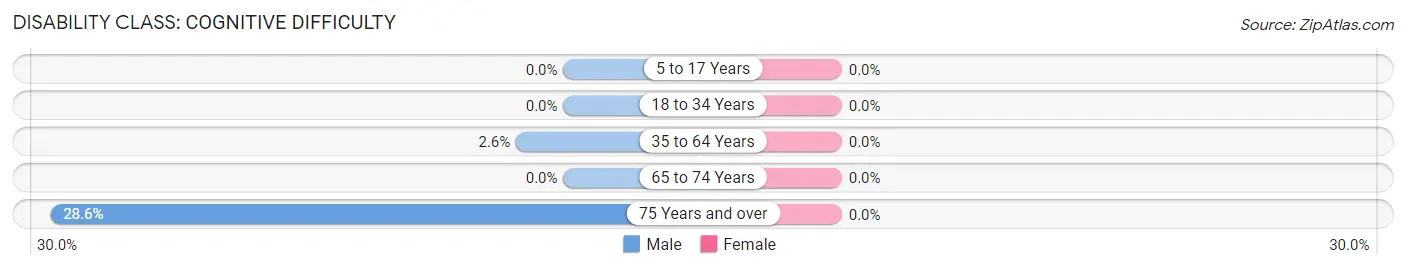
| Age Bracket | Male | Female |
| 5 to 17 Years | 0 (0.0%) | 0 (0.0%) |
| 18 to 34 Years | 0 (0.0%) | 0 (0.0%) |
| 35 to 64 Years | 1 (2.6%) | 0 (0.0%) |
| 65 to 74 Years | 0 (0.0%) | 0 (0.0%) |
| 75 Years and over | 2 (28.6%) | 0 (0.0%) |
Disability Class: Ambulatory Difficulty
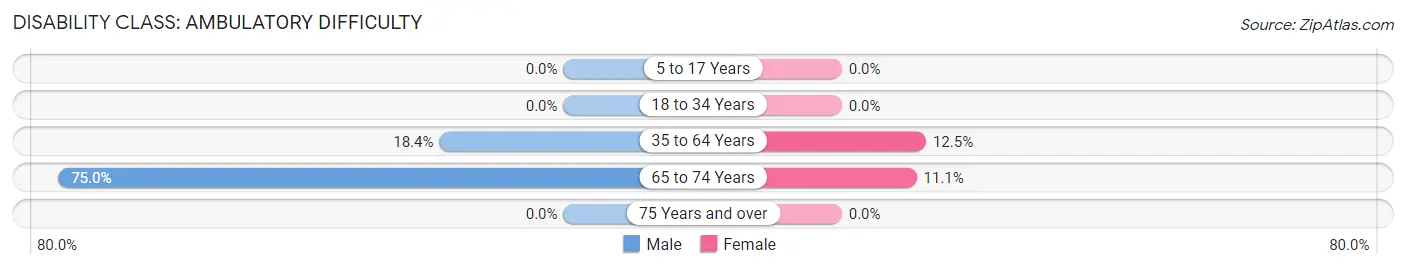
| Age Bracket | Male | Female |
| 5 to 17 Years | 0 (0.0%) | 0 (0.0%) |
| 18 to 34 Years | 0 (0.0%) | 0 (0.0%) |
| 35 to 64 Years | 7 (18.4%) | 3 (12.5%) |
| 65 to 74 Years | 6 (75.0%) | 2 (11.1%) |
| 75 Years and over | 0 (0.0%) | 0 (0.0%) |
Disability Class: Self-Care Difficulty
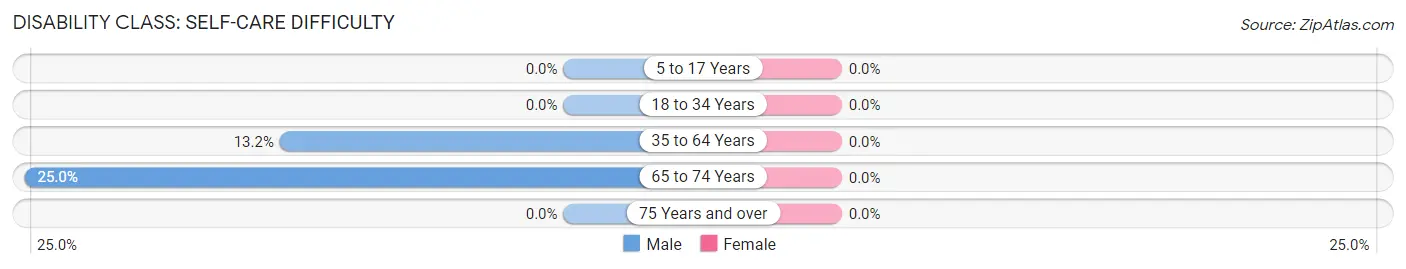
| Age Bracket | Male | Female |
| 5 to 17 Years | 0 (0.0%) | 0 (0.0%) |
| 18 to 34 Years | 0 (0.0%) | 0 (0.0%) |
| 35 to 64 Years | 5 (13.2%) | 0 (0.0%) |
| 65 to 74 Years | 2 (25.0%) | 0 (0.0%) |
| 75 Years and over | 0 (0.0%) | 0 (0.0%) |
Technology Access in Rock River
Computing Device Access in Rock River
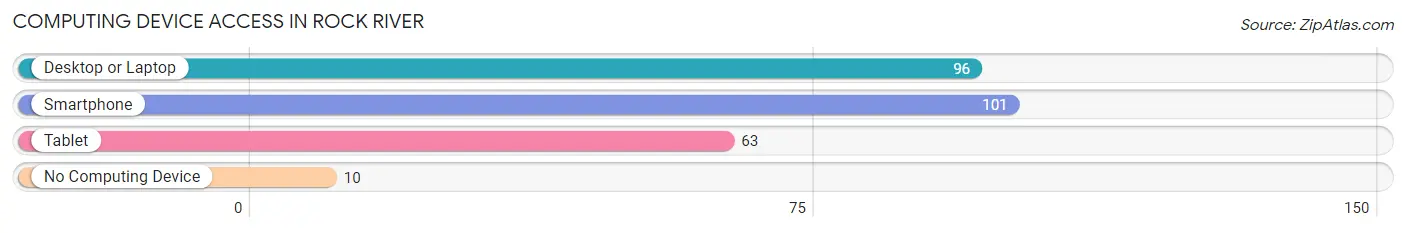
| Device Type | # Households | % Households |
| Desktop or Laptop | 96 | 85.0% |
| Smartphone | 101 | 89.4% |
| Tablet | 63 | 55.7% |
| No Computing Device | 10 | 8.8% |
| Total | 113 | 100.0% |
Internet Access in Rock River
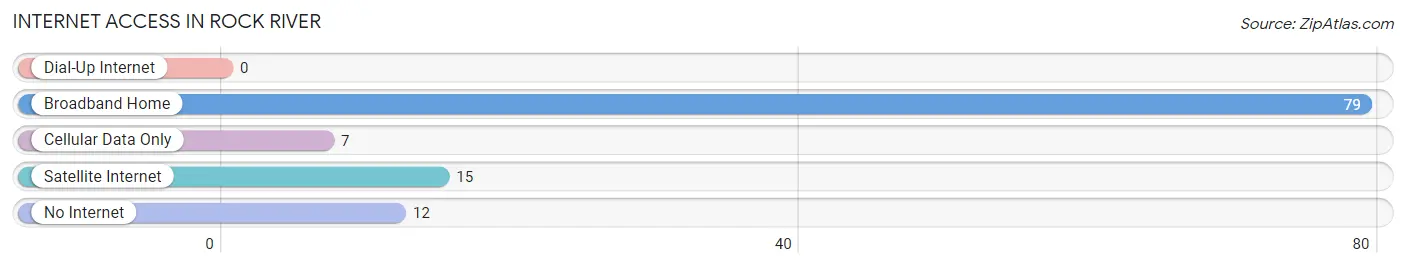
| Internet Type | # Households | % Households |
| Dial-Up Internet | 0 | 0.0% |
| Broadband Home | 79 | 69.9% |
| Cellular Data Only | 7 | 6.2% |
| Satellite Internet | 15 | 13.3% |
| No Internet | 12 | 10.6% |
| Total | 113 | 100.0% |
Rock River Summary
River Rock, Wyoming is a small town located in the southeastern corner of the state, near the border of Colorado. It is situated in the foothills of the Rocky Mountains, and is surrounded by beautiful scenery. The town has a population of just over 500 people, and is a popular destination for outdoor enthusiasts.
The history of River Rock dates back to the late 1800s, when the area was first settled by homesteaders. The town was originally known as “Rocky Ford”, and was a small farming community. In the early 1900s, the town was renamed “River Rock”, and the population began to grow. The town was incorporated in 1909, and the first mayor was elected in 1910.
The economy of River Rock is largely based on tourism and agriculture. The town is home to several small businesses, including a grocery store, a hardware store, and a few restaurants. The town also has a small airport, which serves as a hub for recreational activities such as fishing, hunting, and camping.
The geography of River Rock is characterized by rolling hills, lush forests, and a variety of wildlife. The town is located in the foothills of the Rocky Mountains, and is surrounded by beautiful scenery. The town is also home to several rivers, including the North Platte River, the South Platte River, and the Laramie River.
The demographics of River Rock are largely made up of white, non-Hispanic residents. The median age of the population is 44, and the median household income is $45,000. The town is also home to a small Native American population, as well as a few Hispanic residents.
River Rock is a small town with a rich history and a vibrant economy. The town is home to a variety of businesses, and is a popular destination for outdoor enthusiasts. The town is surrounded by beautiful scenery, and is a great place to live and visit.
Common Questions
What is Per Capita Income in Rock River?
Per Capita income in Rock River is $59,623.
What is the Median Family Income in Rock River?
Median Family Income in Rock River is $52,250.
What is the Median Household income in Rock River?
Median Household Income in Rock River is $64,821.
What is Family Income Deficit in Rock River?
Family Income Deficit in Rock River is $10,478.
Families that are below poverty line in Rock River earn $10,478 less on average than the poverty threshold level.
What is Inequality or Gini Index in Rock River?
Inequality or Gini Index in Rock River is 0.56.
What is the Total Population of Rock River?
Total Population of Rock River is 269.
What is the Total Male Population of Rock River?
Total Male Population of Rock River is 166.
What is the Total Female Population of Rock River?
Total Female Population of Rock River is 103.
What is the Ratio of Males per 100 Females in Rock River?
There are 161.17 Males per 100 Females in Rock River.
What is the Ratio of Females per 100 Males in Rock River?
There are 62.05 Females per 100 Males in Rock River.
What is the Median Population Age in Rock River?
Median Population Age in Rock River is 29.0 Years.
What is the Average Family Size in Rock River
Average Family Size in Rock River is 3.3 People.
What is the Average Household Size in Rock River
Average Household Size in Rock River is 2.4 People.
How Large is the Labor Force in Rock River?
There are 139 People in the Labor Forcein in Rock River.
What is the Percentage of People in the Labor Force in Rock River?
63.8% of People are in the Labor Force in Rock River.