Orason, TX Map & Demographics
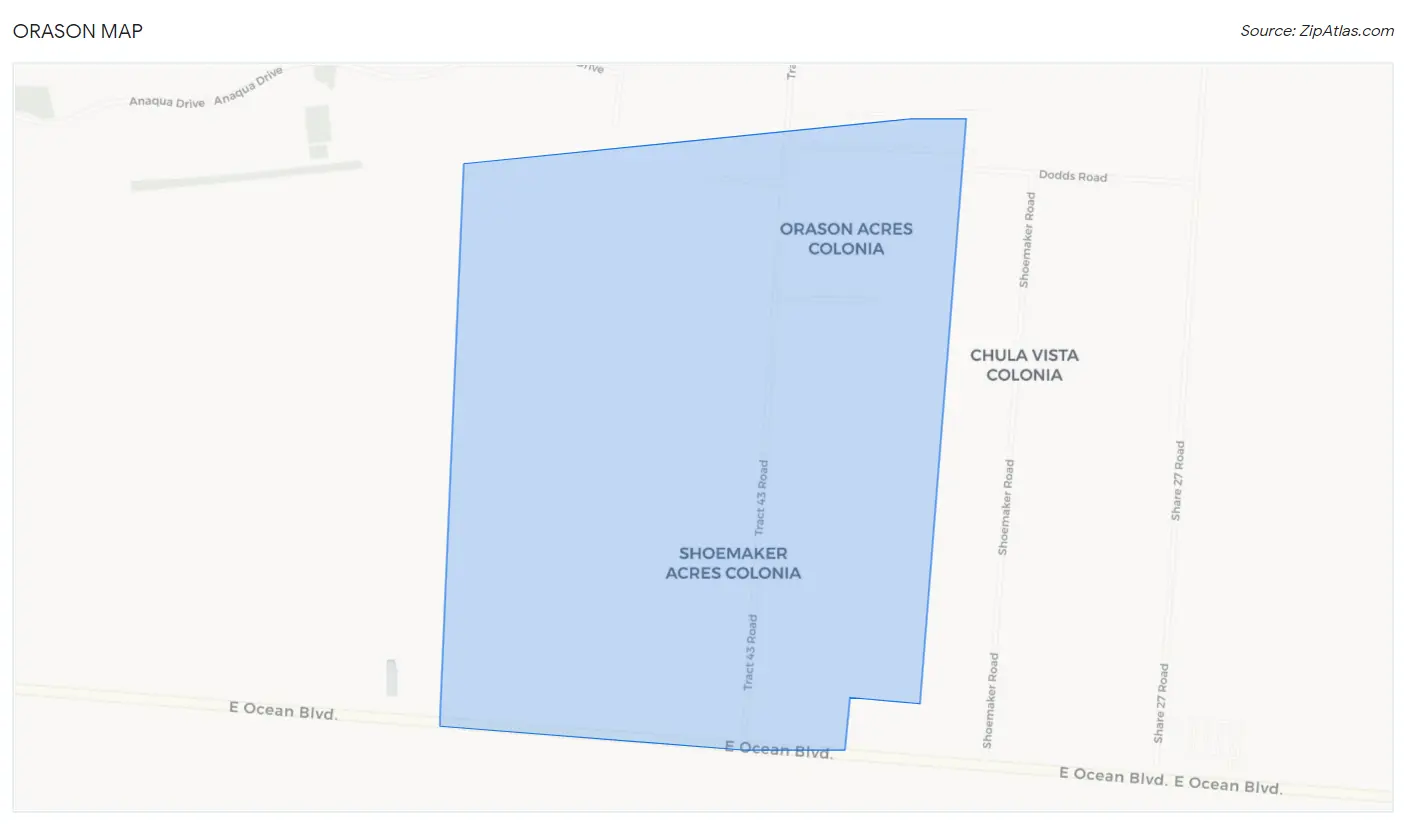
Orason Map
Orason Overview
$9,448
PER CAPITA INCOME
$68,052
AVG FAMILY INCOME
$68,052
AVG HOUSEHOLD INCOME
0.14
INEQUALITY / GINI INDEX
597
TOTAL POPULATION
229
MALE POPULATION
368
FEMALE POPULATION
62.23
MALES / 100 FEMALES
160.70
FEMALES / 100 MALES
19.4
MEDIAN AGE
7.0
AVG FAMILY SIZE
7.0
AVG HOUSEHOLD SIZE
97
LABOR FORCE [ PEOPLE ]
27.2%
PERCENT IN LABOR FORCE
Income in Orason
Income Overview in Orason
Per Capita Income in Orason is $9,448, while median incomes of families and households are $68,052 and $68,052 respectively.
| Characteristic | Number | Measure |
| Per Capita Income | 597 | $9,448 |
| Median Family Income | 85 | $68,052 |
| Mean Family Income | 85 | $56,400 |
| Median Household Income | 85 | $68,052 |
| Mean Household Income | 85 | $56,400 |
| Income Deficit | 85 | $0 |
| Wage / Income Gap (%) | 597 | 0.00% |
| Wage / Income Gap ($) | 597 | 100.00¢ per $1 |
| Gini / Inequality Index | 597 | 0.14 |
Earnings by Sex in Orason
| Sex | Number | Average Earnings |
| Male | 64 (66.0%) | $0 |
| Female | 33 (34.0%) | $0 |
| Total | 97 (100.0%) | $0 |
Earnings by Sex by Income Bracket in Orason
The most common earnings brackets in Orason are $65,000 to $74,999 for men (55 | 85.9%) and $5,000 to $7,499 for women (33 | 100.0%).
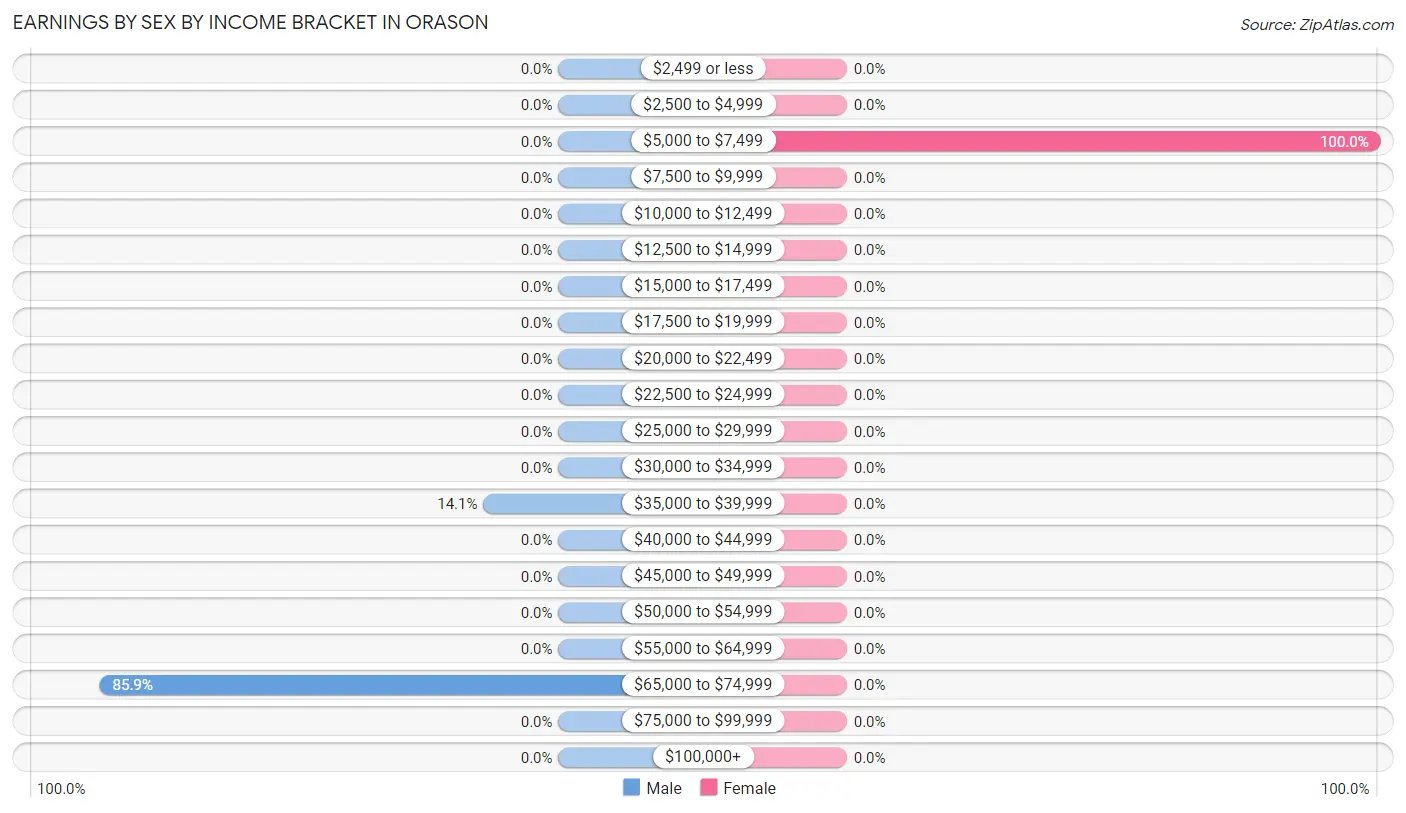
| Income | Male | Female |
| $2,499 or less | 0 (0.0%) | 0 (0.0%) |
| $2,500 to $4,999 | 0 (0.0%) | 0 (0.0%) |
| $5,000 to $7,499 | 0 (0.0%) | 33 (100.0%) |
| $7,500 to $9,999 | 0 (0.0%) | 0 (0.0%) |
| $10,000 to $12,499 | 0 (0.0%) | 0 (0.0%) |
| $12,500 to $14,999 | 0 (0.0%) | 0 (0.0%) |
| $15,000 to $17,499 | 0 (0.0%) | 0 (0.0%) |
| $17,500 to $19,999 | 0 (0.0%) | 0 (0.0%) |
| $20,000 to $22,499 | 0 (0.0%) | 0 (0.0%) |
| $22,500 to $24,999 | 0 (0.0%) | 0 (0.0%) |
| $25,000 to $29,999 | 0 (0.0%) | 0 (0.0%) |
| $30,000 to $34,999 | 0 (0.0%) | 0 (0.0%) |
| $35,000 to $39,999 | 9 (14.1%) | 0 (0.0%) |
| $40,000 to $44,999 | 0 (0.0%) | 0 (0.0%) |
| $45,000 to $49,999 | 0 (0.0%) | 0 (0.0%) |
| $50,000 to $54,999 | 0 (0.0%) | 0 (0.0%) |
| $55,000 to $64,999 | 0 (0.0%) | 0 (0.0%) |
| $65,000 to $74,999 | 55 (85.9%) | 0 (0.0%) |
| $75,000 to $99,999 | 0 (0.0%) | 0 (0.0%) |
| $100,000+ | 0 (0.0%) | 0 (0.0%) |
| Total | 64 (100.0%) | 33 (100.0%) |
Earnings by Sex by Educational Attainment in Orason
| Educational Attainment | Male Income | Female Income |
| Less than High School | - | - |
| High School Diploma | - | - |
| College or Associate's Degree | - | - |
| Bachelor's Degree | - | - |
| Graduate Degree | - | - |
| Total | - | - |
Family Income in Orason
Family Income Brackets in Orason
According to the Orason family income data, there are 52 families falling into the $50,000 to $74,999 income range, which is the most common income bracket and makes up 61.2% of all families.
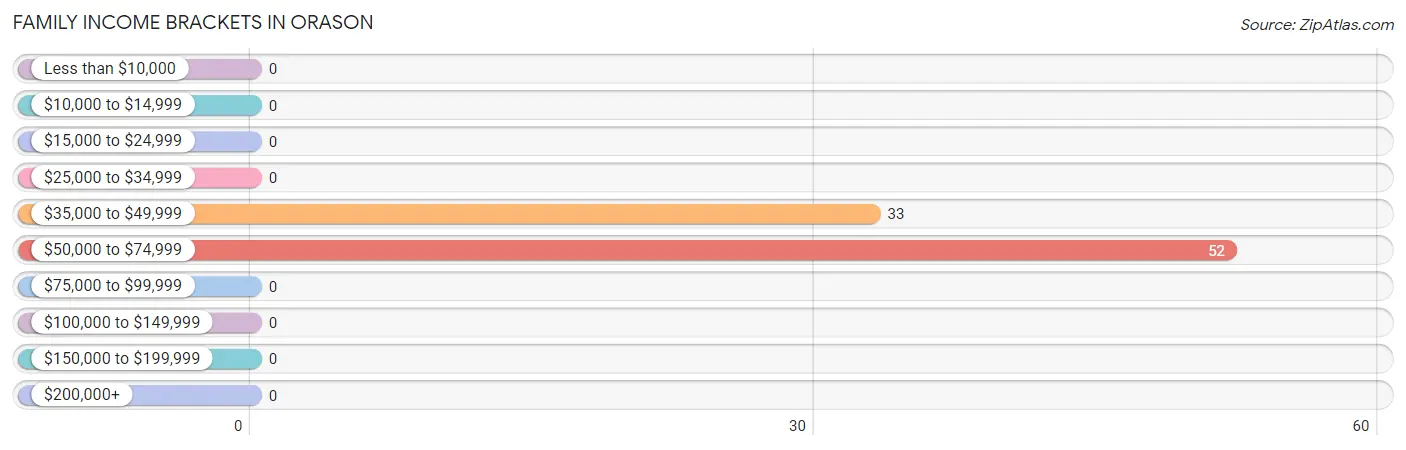
| Income Bracket | # Families | % Families |
| Less than $10,000 | 0 | 0.0% |
| $10,000 to $14,999 | 0 | 0.0% |
| $15,000 to $24,999 | 0 | 0.0% |
| $25,000 to $34,999 | 0 | 0.0% |
| $35,000 to $49,999 | 33 | 38.8% |
| $50,000 to $74,999 | 52 | 61.2% |
| $75,000 to $99,999 | 0 | 0.0% |
| $100,000 to $149,999 | 0 | 0.0% |
| $150,000 to $199,999 | 0 | 0.0% |
| $200,000+ | 0 | 0.0% |
Family Income by Famaliy Size in Orason
| Income Bracket | # Families | Median Income |
| 2-Person Families | 0 (0.0%) | $0 |
| 3-Person Families | 0 (0.0%) | $0 |
| 4-Person Families | 42 (49.4%) | $0 |
| 5-Person Families | 43 (50.6%) | $0 |
| 6-Person Families | 0 (0.0%) | $0 |
| 7+ Person Families | 0 (0.0%) | $0 |
| Total | 85 (100.0%) | $68,052 |
Family Income by Number of Earners in Orason
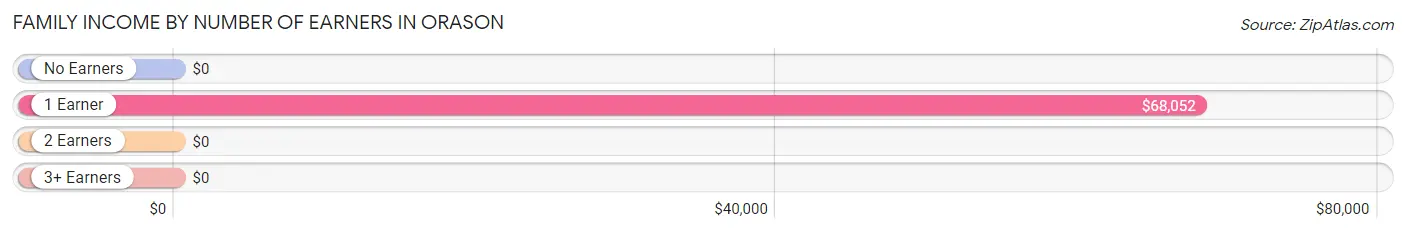
| Number of Earners | # Families | Median Income |
| No Earners | 0 (0.0%) | $0 |
| 1 Earner | 85 (100.0%) | $68,052 |
| 2 Earners | 0 (0.0%) | $0 |
| 3+ Earners | 0 (0.0%) | $0 |
| Total | 85 (100.0%) | $68,052 |
Household Income in Orason
Household Income Brackets in Orason
With 52 households falling in the category, the $50,000 to $74,999 income range is the most frequent in Orason, accounting for 61.2% of all households.
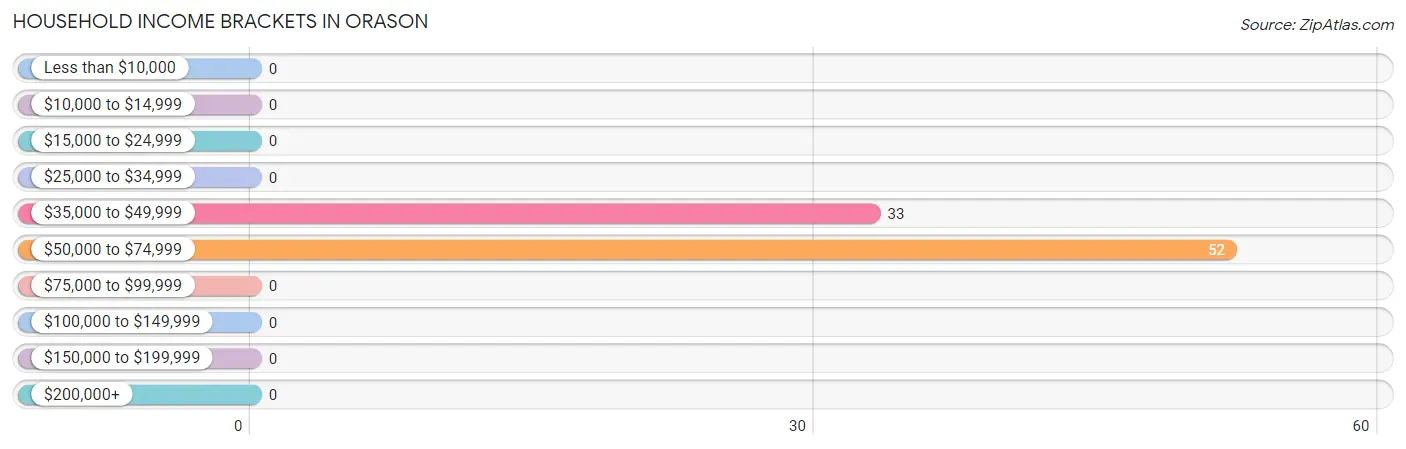
| Income Bracket | # Households | % Households |
| Less than $10,000 | 0 | 0.0% |
| $10,000 to $14,999 | 0 | 0.0% |
| $15,000 to $24,999 | 0 | 0.0% |
| $25,000 to $34,999 | 0 | 0.0% |
| $35,000 to $49,999 | 33 | 38.8% |
| $50,000 to $74,999 | 52 | 61.2% |
| $75,000 to $99,999 | 0 | 0.0% |
| $100,000 to $149,999 | 0 | 0.0% |
| $150,000 to $199,999 | 0 | 0.0% |
| $200,000+ | 0 | 0.0% |
Household Income by Householder Age in Orason
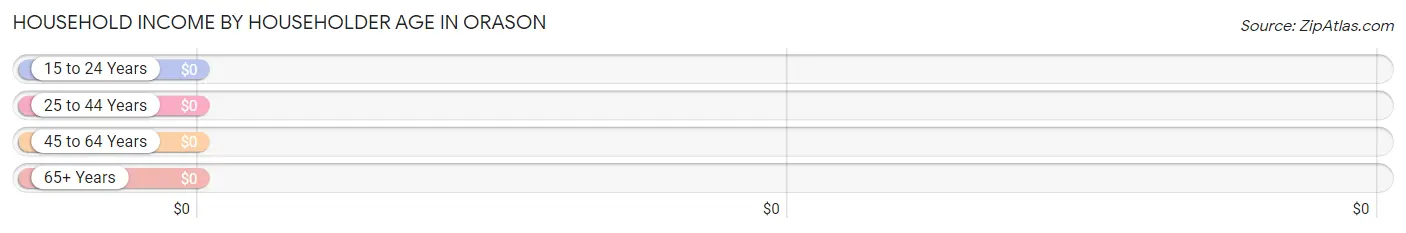
| Income Bracket | # Households | Median Income |
| 15 to 24 Years | 0 (0.0%) | $0 |
| 25 to 44 Years | 43 (50.6%) | $0 |
| 45 to 64 Years | 9 (10.6%) | $0 |
| 65+ Years | 33 (38.8%) | $0 |
| Total | 85 (100.0%) | $68,052 |
Poverty in Orason
Income Below Poverty by Sex and Age in Orason
| Age Bracket | Male | Female |
| Under 5 Years | 0 (0.0%) | 0 (0.0%) |
| 5 Years | 0 (0.0%) | 0 (0.0%) |
| 6 to 11 Years | 0 (0.0%) | 0 (0.0%) |
| 12 to 14 Years | 0 (0.0%) | 0 (0.0%) |
| 15 Years | 0 (0.0%) | 0 (0.0%) |
| 16 and 17 Years | 0 (0.0%) | 0 (0.0%) |
| 18 to 24 Years | 0 (0.0%) | 0 (0.0%) |
| 25 to 34 Years | 0 (0.0%) | 0 (0.0%) |
| 35 to 44 Years | 0 (0.0%) | 0 (0.0%) |
| 45 to 54 Years | 0 (0.0%) | 0 (0.0%) |
| 55 to 64 Years | 0 (0.0%) | 0 (0.0%) |
| 65 to 74 Years | 0 (0.0%) | 0 (0.0%) |
| 75 Years and over | 0 (0.0%) | 0 (0.0%) |
| Total | 0 (0.0%) | 0 (0.0%) |
Income Above Poverty by Sex and Age in Orason
According to the poverty statistics in Orason, males aged 5 years and females aged 6 to 11 years are the age groups that are most secure financially, with 100.0% of males and 100.0% of females in these age groups living above the poverty line.
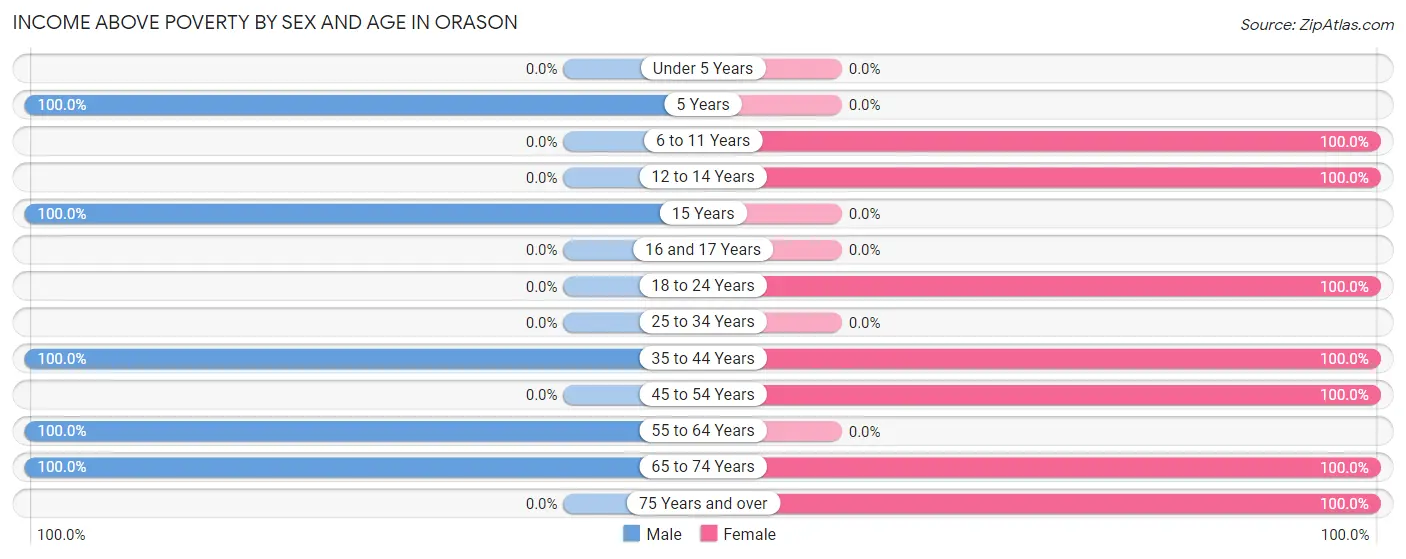
| Age Bracket | Male | Female |
| Under 5 Years | 0 (0.0%) | 0 (0.0%) |
| 5 Years | 49 (100.0%) | 0 (0.0%) |
| 6 to 11 Years | 0 (0.0%) | 54 (100.0%) |
| 12 to 14 Years | 0 (0.0%) | 54 (100.0%) |
| 15 Years | 83 (100.0%) | 0 (0.0%) |
| 16 and 17 Years | 0 (0.0%) | 0 (0.0%) |
| 18 to 24 Years | 0 (0.0%) | 166 (100.0%) |
| 25 to 34 Years | 0 (0.0%) | 0 (0.0%) |
| 35 to 44 Years | 55 (100.0%) | 43 (100.0%) |
| 45 to 54 Years | 0 (0.0%) | 8 (100.0%) |
| 55 to 64 Years | 9 (100.0%) | 0 (0.0%) |
| 65 to 74 Years | 33 (100.0%) | 33 (100.0%) |
| 75 Years and over | 0 (0.0%) | 10 (100.0%) |
| Total | 229 (100.0%) | 368 (100.0%) |
Income Below Poverty Among Married-Couple Families in Orason
| Children | Above Poverty | Below Poverty |
| No Children | 9 (100.0%) | 0 (0.0%) |
| 1 or 2 Children | 33 (100.0%) | 0 (0.0%) |
| 3 or 4 Children | 43 (100.0%) | 0 (0.0%) |
| 5 or more Children | 0 (0.0%) | 0 (0.0%) |
| Total | 85 (100.0%) | 0 (0.0%) |
Income Below Poverty Among Single-Parent Households in Orason
| Children | Single Father | Single Mother |
| No Children | 0 (0.0%) | 0 (0.0%) |
| 1 or 2 Children | 0 (0.0%) | 0 (0.0%) |
| 3 or 4 Children | 0 (0.0%) | 0 (0.0%) |
| 5 or more Children | 0 (0.0%) | 0 (0.0%) |
| Total | 0 (0.0%) | 0 (0.0%) |
Income Below Poverty Among Married-Couple vs Single-Parent Households in Orason
| Children | Married-Couple Families | Single-Parent Households |
| No Children | 0 (0.0%) | 0 (0.0%) |
| 1 or 2 Children | 0 (0.0%) | 0 (0.0%) |
| 3 or 4 Children | 0 (0.0%) | 0 (0.0%) |
| 5 or more Children | 0 (0.0%) | 0 (0.0%) |
| Total | 0 (0.0%) | 0 (0.0%) |
Race in Orason
The most populous races in Orason are White / Caucasian (597 | 100.0%), and Hispanic or Latino (588 | 98.5%).
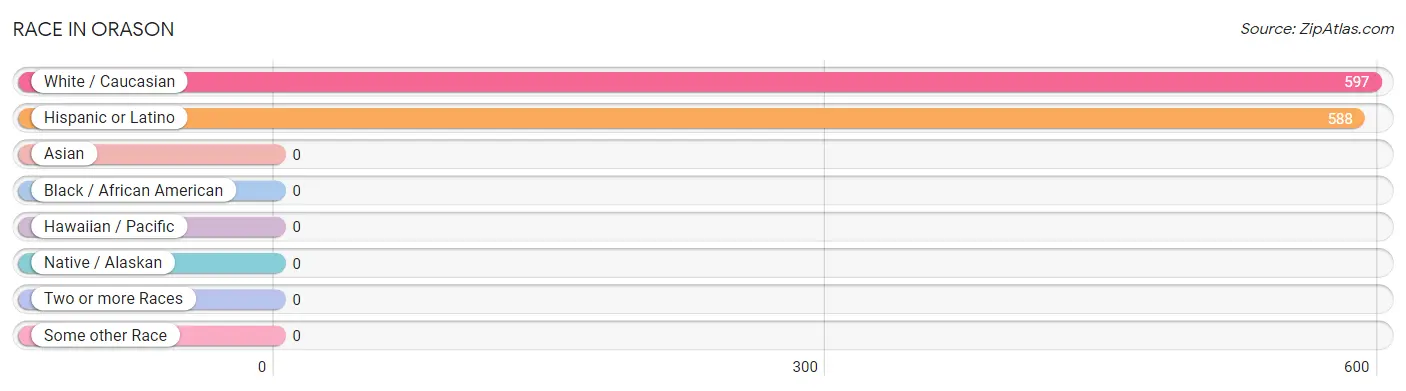
| Race | # Population | % Population |
| Asian | 0 | 0.0% |
| Black / African American | 0 | 0.0% |
| Hawaiian / Pacific | 0 | 0.0% |
| Hispanic or Latino | 588 | 98.5% |
| Native / Alaskan | 0 | 0.0% |
| White / Caucasian | 597 | 100.0% |
| Two or more Races | 0 | 0.0% |
| Some other Race | 0 | 0.0% |
| Total | 597 | 100.0% |
Ancestry in Orason
The most populous ancestries reported in Orason are Mexican (558 | 93.5%), Spanish (12 | 2.0%), and Scottish (9 | 1.5%), together accounting for 97.0% of all Orason residents.
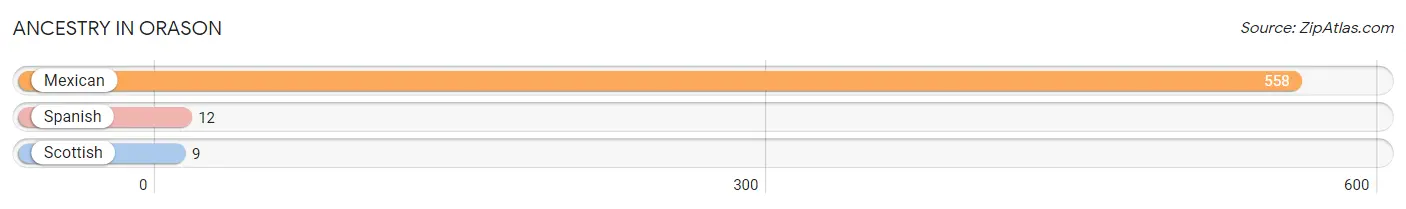
| Ancestry | # Population | % Population |
| Mexican | 558 | 93.5% |
| Scottish | 9 | 1.5% |
| Spanish | 12 | 2.0% | View All 3 Rows |
Immigrants in Orason
The most numerous immigrant groups reported in Orason came from Central America (33 | 5.5%), Latin America (33 | 5.5%), and Mexico (33 | 5.5%), together accounting for 16.6% of all Orason residents.
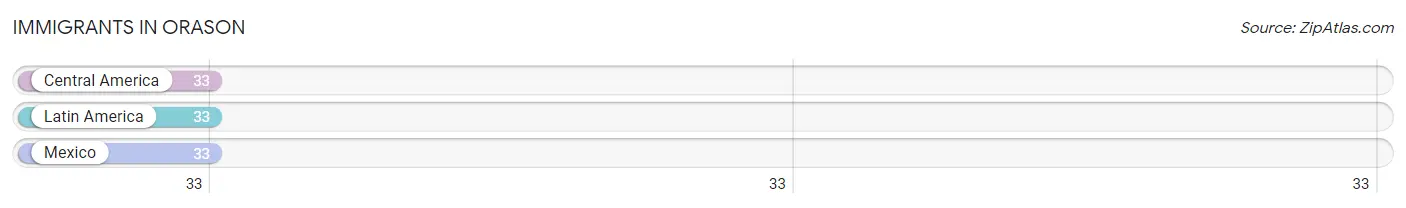
| Immigration Origin | # Population | % Population |
| Central America | 33 | 5.5% |
| Latin America | 33 | 5.5% |
| Mexico | 33 | 5.5% | View All 3 Rows |
Sex and Age in Orason
Sex and Age in Orason
The most populous age groups in Orason are 15 to 19 Years (83 | 36.2%) for men and 15 to 19 Years (154 | 41.8%) for women.
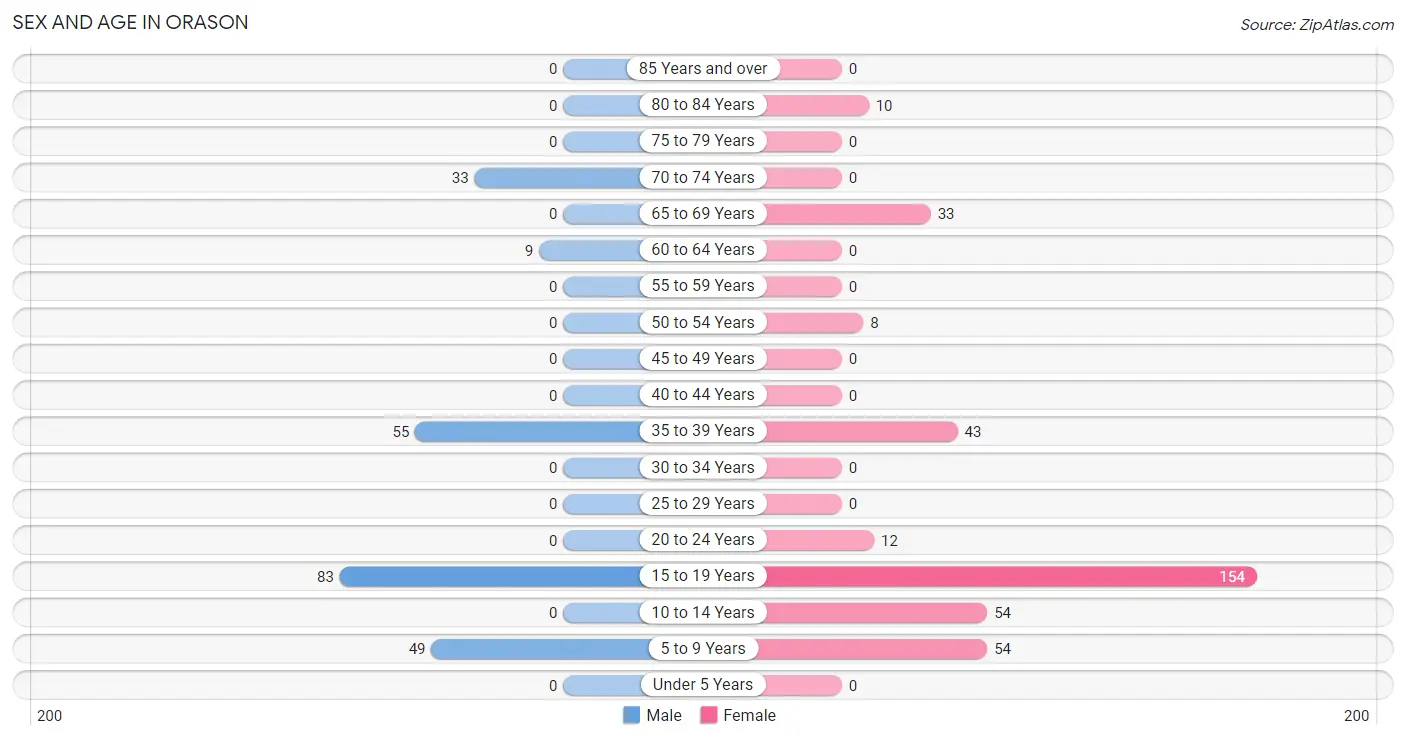
| Age Bracket | Male | Female |
| Under 5 Years | 0 (0.0%) | 0 (0.0%) |
| 5 to 9 Years | 49 (21.4%) | 54 (14.7%) |
| 10 to 14 Years | 0 (0.0%) | 54 (14.7%) |
| 15 to 19 Years | 83 (36.2%) | 154 (41.8%) |
| 20 to 24 Years | 0 (0.0%) | 12 (3.3%) |
| 25 to 29 Years | 0 (0.0%) | 0 (0.0%) |
| 30 to 34 Years | 0 (0.0%) | 0 (0.0%) |
| 35 to 39 Years | 55 (24.0%) | 43 (11.7%) |
| 40 to 44 Years | 0 (0.0%) | 0 (0.0%) |
| 45 to 49 Years | 0 (0.0%) | 0 (0.0%) |
| 50 to 54 Years | 0 (0.0%) | 8 (2.2%) |
| 55 to 59 Years | 0 (0.0%) | 0 (0.0%) |
| 60 to 64 Years | 9 (3.9%) | 0 (0.0%) |
| 65 to 69 Years | 0 (0.0%) | 33 (9.0%) |
| 70 to 74 Years | 33 (14.4%) | 0 (0.0%) |
| 75 to 79 Years | 0 (0.0%) | 0 (0.0%) |
| 80 to 84 Years | 0 (0.0%) | 10 (2.7%) |
| 85 Years and over | 0 (0.0%) | 0 (0.0%) |
| Total | 229 (100.0%) | 368 (100.0%) |
Families and Households in Orason
Median Family Size in Orason
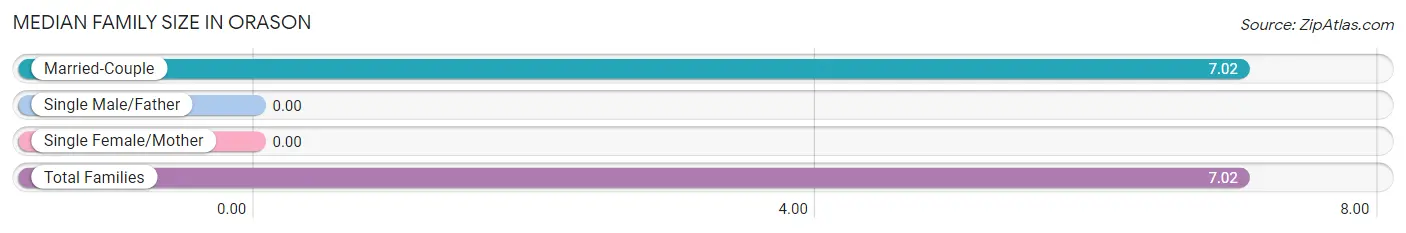
| Family Type | # Families | Family Size |
| Married-Couple | 85 (100.0%) | 7.02 |
| Single Male/Father | 0 (0.0%) | - |
| Single Female/Mother | 0 (0.0%) | - |
| Total Families | 85 (100.0%) | 7.02 |
Median Household Size in Orason
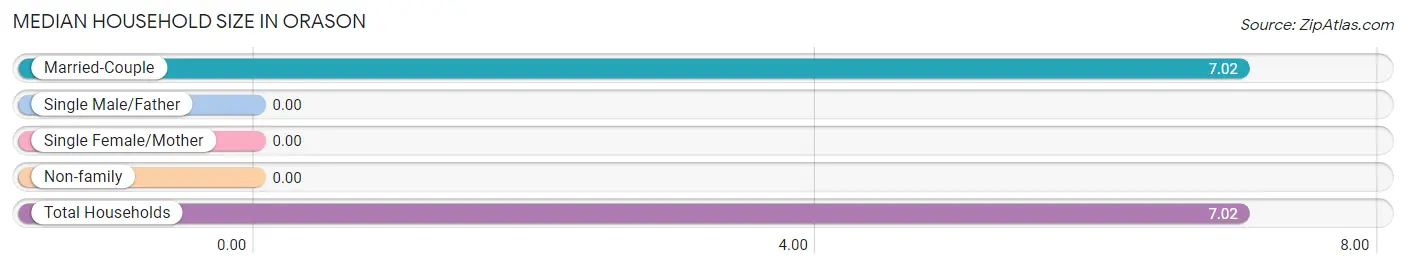
| Household Type | # Households | Household Size |
| Married-Couple | 85 (100.0%) | 7.02 |
| Single Male/Father | 0 (0.0%) | - |
| Single Female/Mother | 0 (0.0%) | - |
| Non-family | 0 (0.0%) | - |
| Total Households | 85 (100.0%) | 7.02 |
Household Size by Marriage Status in Orason
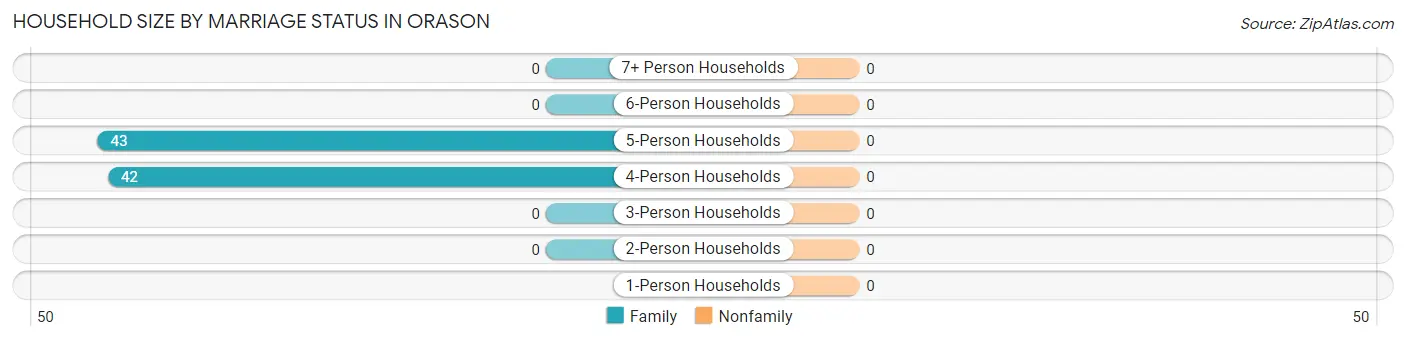
| Household Size | Family Households | Nonfamily Households |
| 1-Person Households | - | 0 (0.0%) |
| 2-Person Households | 0 (0.0%) | 0 (0.0%) |
| 3-Person Households | 0 (0.0%) | 0 (0.0%) |
| 4-Person Households | 42 (49.4%) | 0 (0.0%) |
| 5-Person Households | 43 (50.6%) | 0 (0.0%) |
| 6-Person Households | 0 (0.0%) | 0 (0.0%) |
| 7+ Person Households | 0 (0.0%) | 0 (0.0%) |
| Total | 85 (100.0%) | 0 (0.0%) |
Female Fertility in Orason
Fertility by Age in Orason
| Age Bracket | Women with Births | Births / 1,000 Women |
| 15 to 19 years | 0 (0.0%) | 0.0 |
| 20 to 34 years | 0 (0.0%) | 0.0 |
| 35 to 50 years | 0 (0.0%) | 0.0 |
| Total | 0 (0.0%) | 0.0 |
Fertility by Age by Marriage Status in Orason
| Age Bracket | Married | Unmarried |
| 15 to 19 years | 0 (0.0%) | 0 (0.0%) |
| 20 to 34 years | 0 (0.0%) | 0 (0.0%) |
| 35 to 50 years | 0 (0.0%) | 0 (0.0%) |
| Total | 0 (0.0%) | 0 (0.0%) |
Fertility by Education in Orason
| Educational Attainment | Women with Births | Births / 1,000 Women |
| Less than High School | 0 (0.0%) | 0.0 |
| High School Diploma | 0 (0.0%) | 0.0 |
| College or Associate's Degree | 0 (0.0%) | 0.0 |
| Bachelor's Degree | 0 (0.0%) | 0.0 |
| Graduate Degree | 0 (0.0%) | 0.0 |
| Total | 0 (0.0%) | 0.0 |
Fertility by Education by Marriage Status in Orason
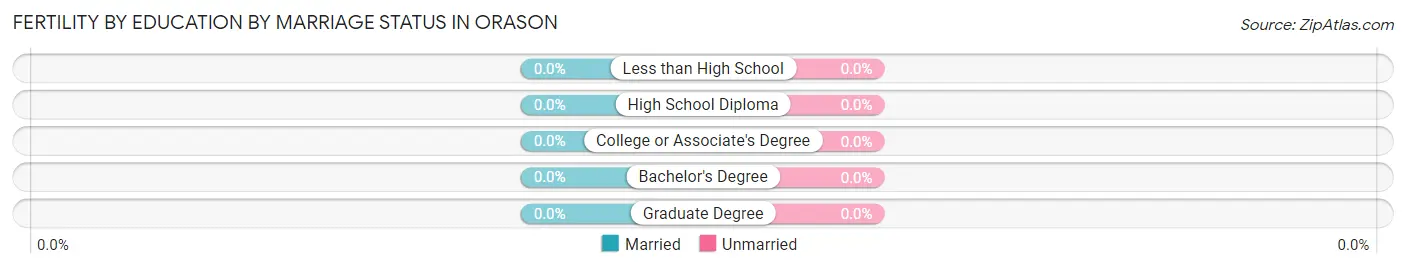
| Educational Attainment | Married | Unmarried |
| Less than High School | 0 (0.0%) | 0 (0.0%) |
| High School Diploma | 0 (0.0%) | 0 (0.0%) |
| College or Associate's Degree | 0 (0.0%) | 0 (0.0%) |
| Bachelor's Degree | 0 (0.0%) | 0 (0.0%) |
| Graduate Degree | 0 (0.0%) | 0 (0.0%) |
| Total | 0 (0.0%) | 0 (0.0%) |
Employment Characteristics in Orason
Employment by Class of Employer in Orason
Among the 97 employed individuals in Orason, local government employees (55 | 56.7%), self-employed (not incorporated) (33 | 34.0%), and private company employees (9 | 9.3%) make up the most common classes of employment.
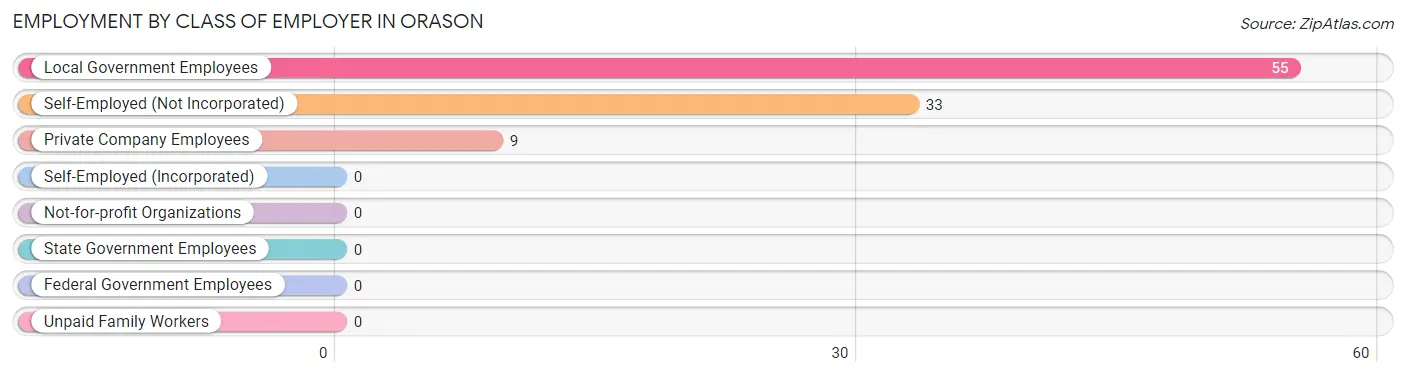
| Employer Class | # Employees | % Employees |
| Private Company Employees | 9 | 9.3% |
| Self-Employed (Incorporated) | 0 | 0.0% |
| Self-Employed (Not Incorporated) | 33 | 34.0% |
| Not-for-profit Organizations | 0 | 0.0% |
| Local Government Employees | 55 | 56.7% |
| State Government Employees | 0 | 0.0% |
| Federal Government Employees | 0 | 0.0% |
| Unpaid Family Workers | 0 | 0.0% |
| Total | 97 | 100.0% |
Employment Status by Age in Orason
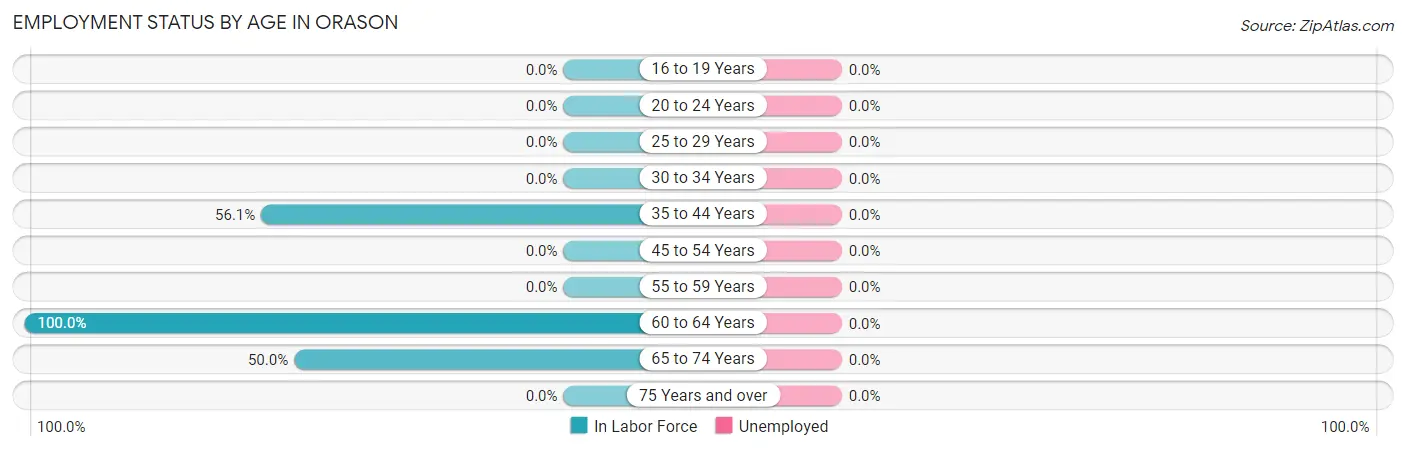
| Age Bracket | In Labor Force | Unemployed |
| 16 to 19 Years | 0 (0.0%) | 0 (0.0%) |
| 20 to 24 Years | 0 (0.0%) | 0 (0.0%) |
| 25 to 29 Years | 0 (0.0%) | 0 (0.0%) |
| 30 to 34 Years | 0 (0.0%) | 0 (0.0%) |
| 35 to 44 Years | 55 (56.1%) | 0 (0.0%) |
| 45 to 54 Years | 0 (0.0%) | 0 (0.0%) |
| 55 to 59 Years | 0 (0.0%) | 0 (0.0%) |
| 60 to 64 Years | 9 (100.0%) | 0 (0.0%) |
| 65 to 74 Years | 33 (50.0%) | 0 (0.0%) |
| 75 Years and over | 0 (0.0%) | 0 (0.0%) |
| Total | 97 (27.2%) | 0 (0.0%) |
Employment Status by Educational Attainment in Orason
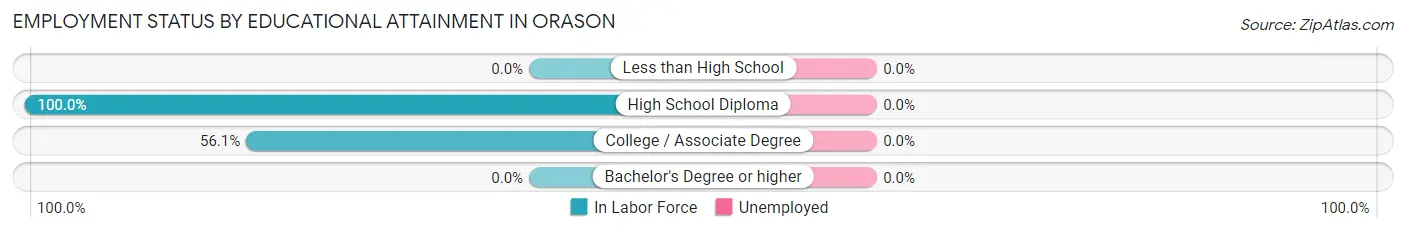
| Educational Attainment | In Labor Force | Unemployed |
| Less than High School | 0 (0.0%) | 0 (0.0%) |
| High School Diploma | 9 (100.0%) | 0 (0.0%) |
| College / Associate Degree | 55 (56.1%) | 0 (0.0%) |
| Bachelor's Degree or higher | 0 (0.0%) | 0 (0.0%) |
| Total | 64 (55.7%) | 0 (0.0%) |
Employment Occupations by Sex in Orason
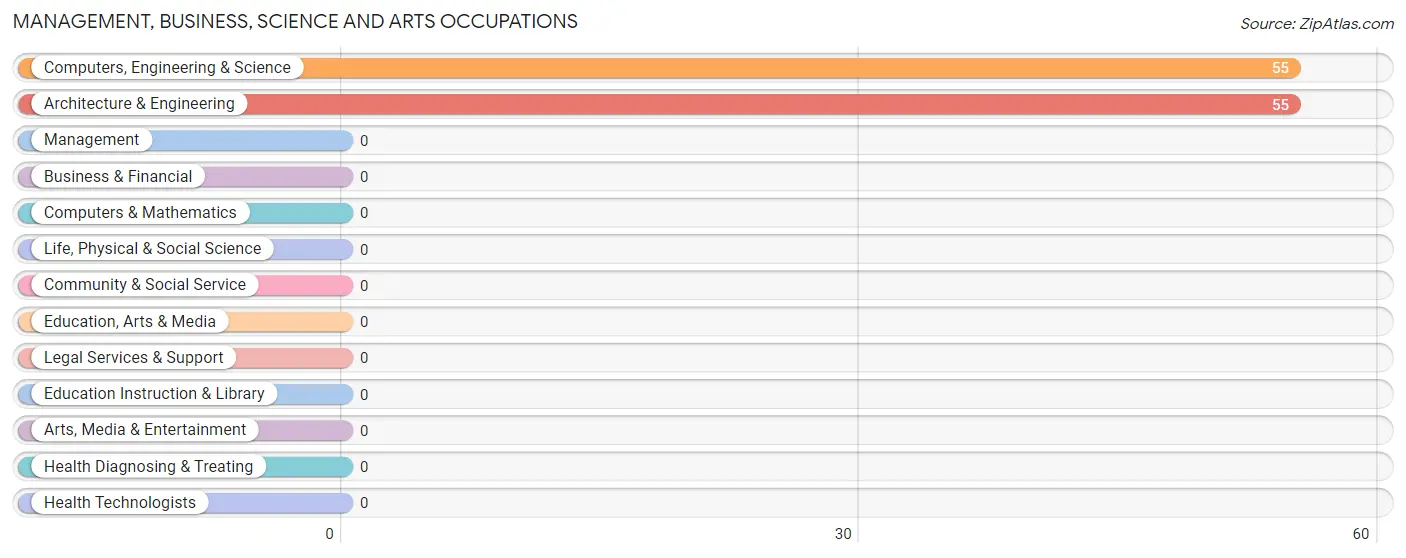
Management, Business, Science and Arts Occupations
The most common Management, Business, Science and Arts occupations in Orason are Computers, Engineering & Science (55 | 56.7%), and Architecture & Engineering (55 | 56.7%).
Management, Business, Science and Arts Occupations by Sex
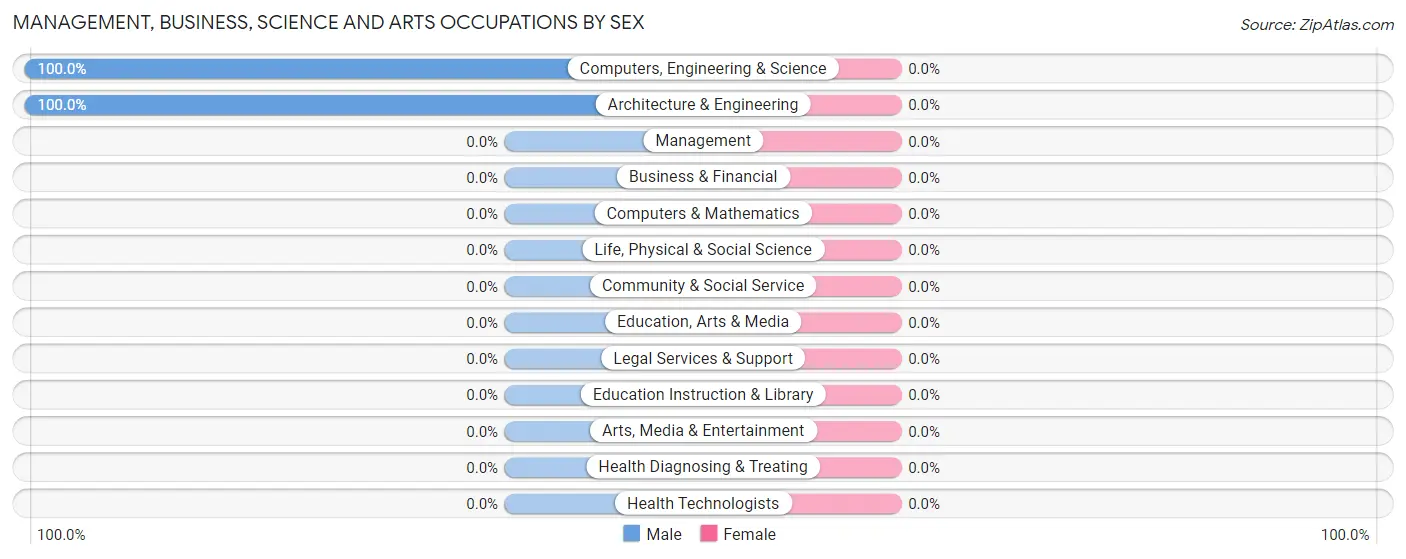
| Occupation | Male | Female |
| Management | 0 (0.0%) | 0 (0.0%) |
| Business & Financial | 0 (0.0%) | 0 (0.0%) |
| Computers, Engineering & Science | 55 (100.0%) | 0 (0.0%) |
| Computers & Mathematics | 0 (0.0%) | 0 (0.0%) |
| Architecture & Engineering | 55 (100.0%) | 0 (0.0%) |
| Life, Physical & Social Science | 0 (0.0%) | 0 (0.0%) |
| Community & Social Service | 0 (0.0%) | 0 (0.0%) |
| Education, Arts & Media | 0 (0.0%) | 0 (0.0%) |
| Legal Services & Support | 0 (0.0%) | 0 (0.0%) |
| Education Instruction & Library | 0 (0.0%) | 0 (0.0%) |
| Arts, Media & Entertainment | 0 (0.0%) | 0 (0.0%) |
| Health Diagnosing & Treating | 0 (0.0%) | 0 (0.0%) |
| Health Technologists | 0 (0.0%) | 0 (0.0%) |
| Total (Category) | 55 (100.0%) | 0 (0.0%) |
| Total (Overall) | 64 (66.0%) | 33 (34.0%) |
Services Occupations
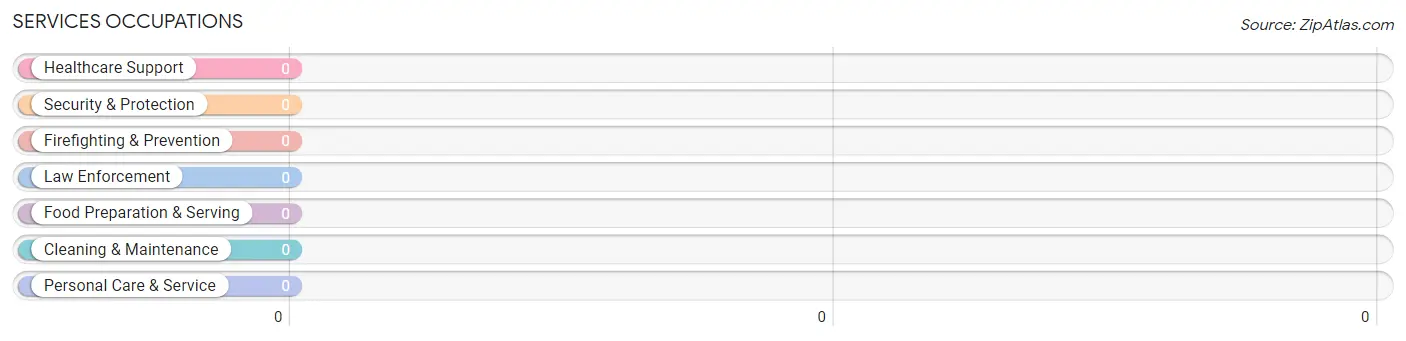
Services Occupations by Sex
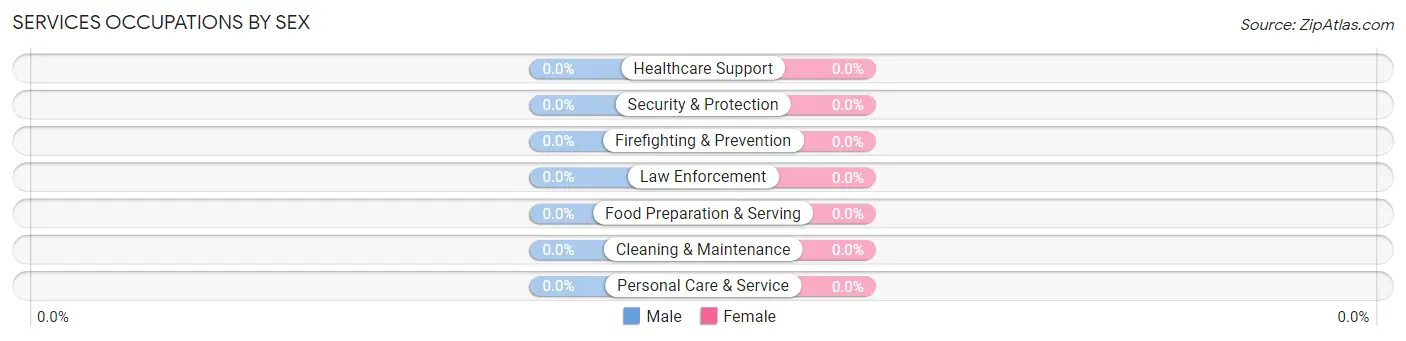
| Occupation | Male | Female |
| Healthcare Support | 0 (0.0%) | 0 (0.0%) |
| Security & Protection | 0 (0.0%) | 0 (0.0%) |
| Firefighting & Prevention | 0 (0.0%) | 0 (0.0%) |
| Law Enforcement | 0 (0.0%) | 0 (0.0%) |
| Food Preparation & Serving | 0 (0.0%) | 0 (0.0%) |
| Cleaning & Maintenance | 0 (0.0%) | 0 (0.0%) |
| Personal Care & Service | 0 (0.0%) | 0 (0.0%) |
| Total (Category) | 0 (0.0%) | 0 (0.0%) |
| Total (Overall) | 64 (66.0%) | 33 (34.0%) |
Sales and Office Occupations
The most common Sales and Office occupations in Orason are , and Sales & Related (33 | 34.0%).
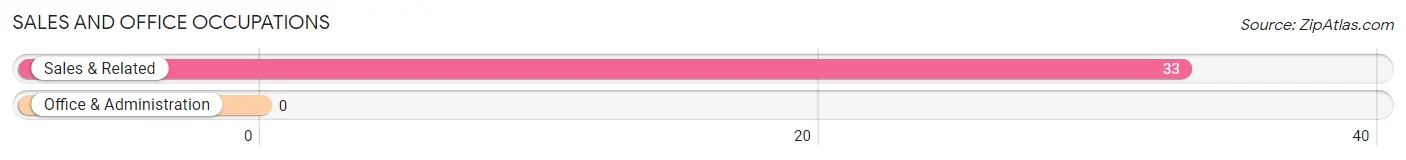
Sales and Office Occupations by Sex
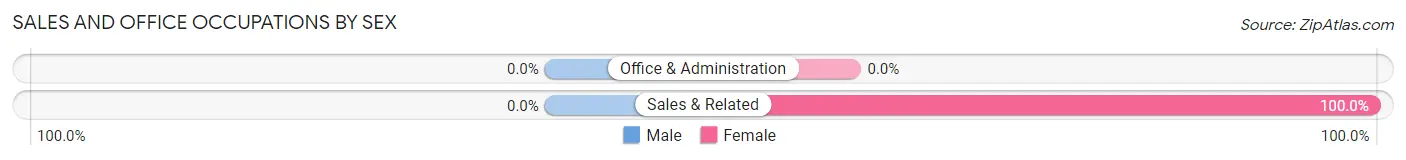
| Occupation | Male | Female |
| Sales & Related | 0 (0.0%) | 33 (100.0%) |
| Office & Administration | 0 (0.0%) | 0 (0.0%) |
| Total (Category) | 0 (0.0%) | 33 (100.0%) |
| Total (Overall) | 64 (66.0%) | 33 (34.0%) |
Natural Resources, Construction and Maintenance Occupations
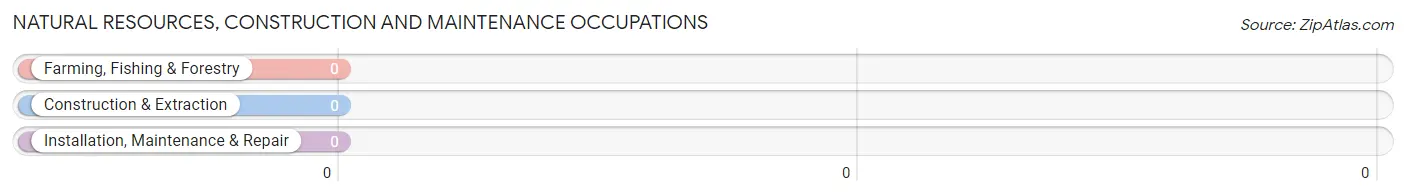
Natural Resources, Construction and Maintenance Occupations by Sex
| Occupation | Male | Female |
| Farming, Fishing & Forestry | 0 (0.0%) | 0 (0.0%) |
| Construction & Extraction | 0 (0.0%) | 0 (0.0%) |
| Installation, Maintenance & Repair | 0 (0.0%) | 0 (0.0%) |
| Total (Category) | 0 (0.0%) | 0 (0.0%) |
| Total (Overall) | 64 (66.0%) | 33 (34.0%) |
Production, Transportation and Moving Occupations
The most common Production, Transportation and Moving occupations in Orason are , and Material Moving (9 | 9.3%).
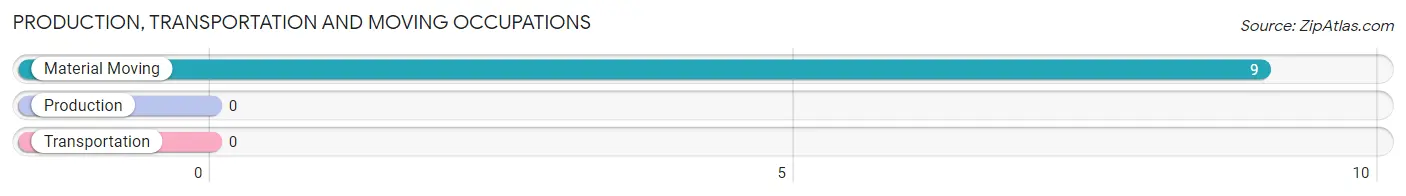
Production, Transportation and Moving Occupations by Sex
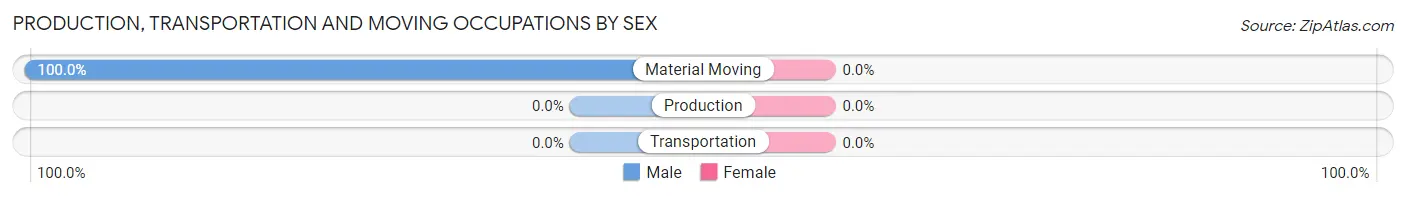
| Occupation | Male | Female |
| Production | 0 (0.0%) | 0 (0.0%) |
| Transportation | 0 (0.0%) | 0 (0.0%) |
| Material Moving | 9 (100.0%) | 0 (0.0%) |
| Total (Category) | 9 (100.0%) | 0 (0.0%) |
| Total (Overall) | 64 (66.0%) | 33 (34.0%) |
Employment Industries by Sex in Orason
Employment Industries in Orason
The major employment industries in Orason include Public Administration (55 | 56.7%), Real Estate, Rental & Leasing (33 | 34.0%), and Manufacturing (9 | 9.3%).
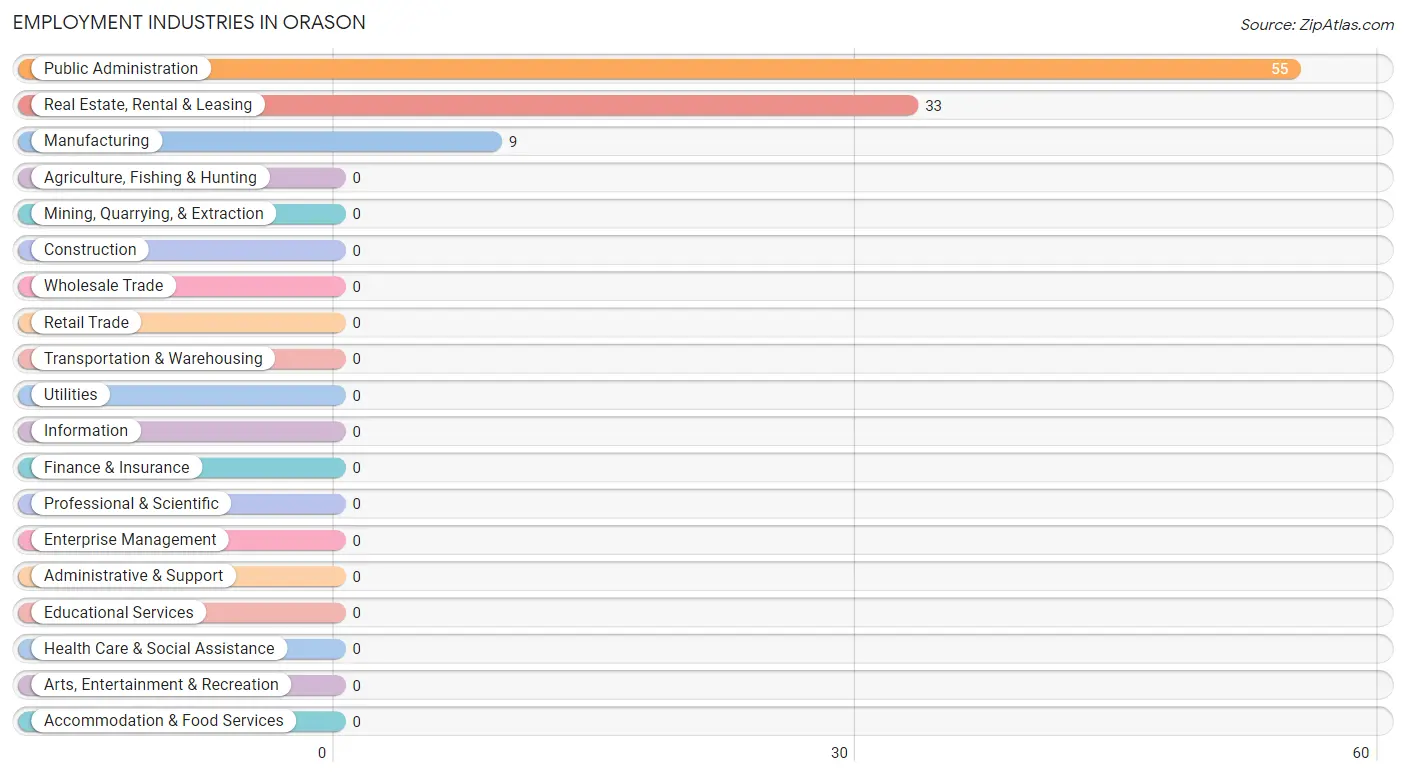
Employment Industries by Sex in Orason
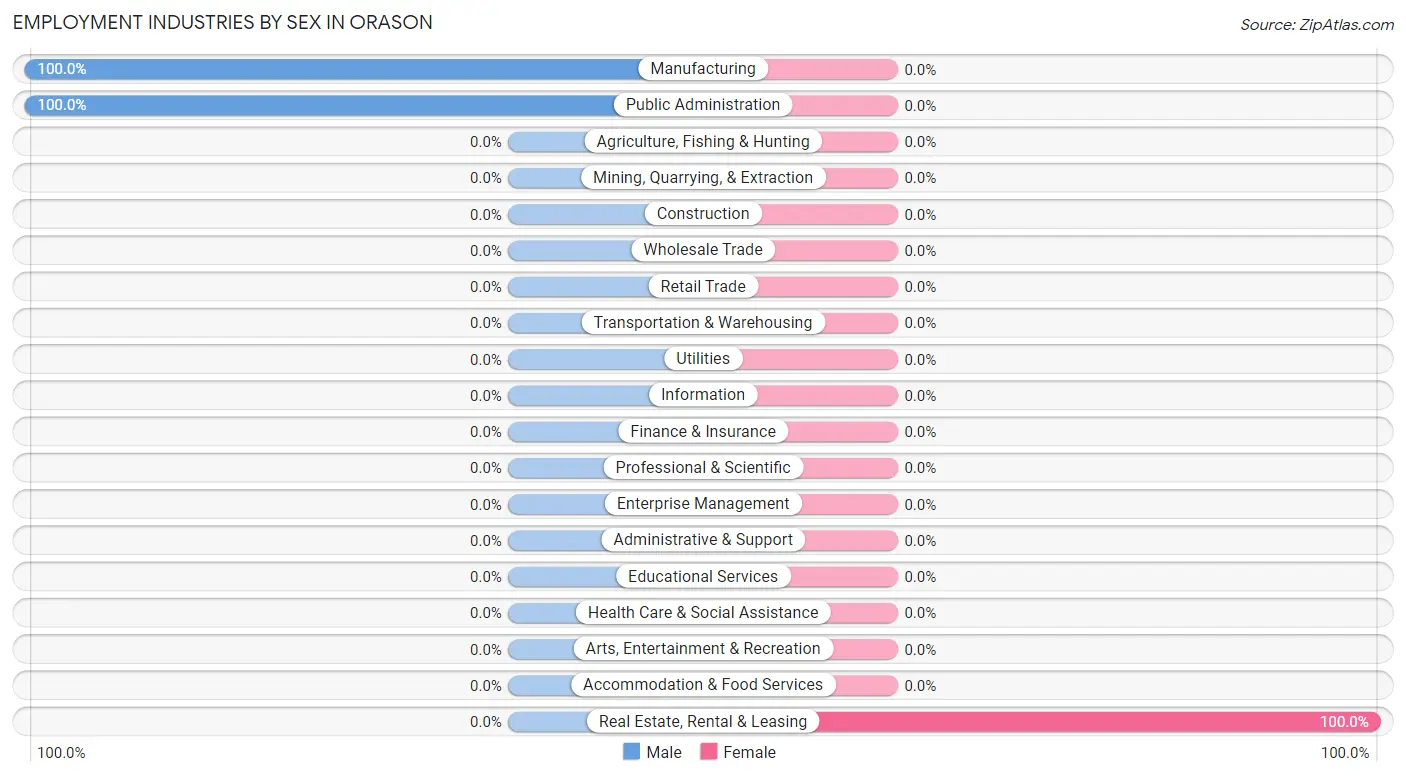
| Industry | Male | Female |
| Agriculture, Fishing & Hunting | 0 (0.0%) | 0 (0.0%) |
| Mining, Quarrying, & Extraction | 0 (0.0%) | 0 (0.0%) |
| Construction | 0 (0.0%) | 0 (0.0%) |
| Manufacturing | 9 (100.0%) | 0 (0.0%) |
| Wholesale Trade | 0 (0.0%) | 0 (0.0%) |
| Retail Trade | 0 (0.0%) | 0 (0.0%) |
| Transportation & Warehousing | 0 (0.0%) | 0 (0.0%) |
| Utilities | 0 (0.0%) | 0 (0.0%) |
| Information | 0 (0.0%) | 0 (0.0%) |
| Finance & Insurance | 0 (0.0%) | 0 (0.0%) |
| Real Estate, Rental & Leasing | 0 (0.0%) | 33 (100.0%) |
| Professional & Scientific | 0 (0.0%) | 0 (0.0%) |
| Enterprise Management | 0 (0.0%) | 0 (0.0%) |
| Administrative & Support | 0 (0.0%) | 0 (0.0%) |
| Educational Services | 0 (0.0%) | 0 (0.0%) |
| Health Care & Social Assistance | 0 (0.0%) | 0 (0.0%) |
| Arts, Entertainment & Recreation | 0 (0.0%) | 0 (0.0%) |
| Accommodation & Food Services | 0 (0.0%) | 0 (0.0%) |
| Public Administration | 55 (100.0%) | 0 (0.0%) |
| Total | 64 (66.0%) | 33 (34.0%) |
Education in Orason
School Enrollment in Orason
The most common levels of schooling among the 406 students in Orason are high school (291 | 71.7%), elementary school (54 | 13.3%), and nursery / preschool (49 | 12.1%).
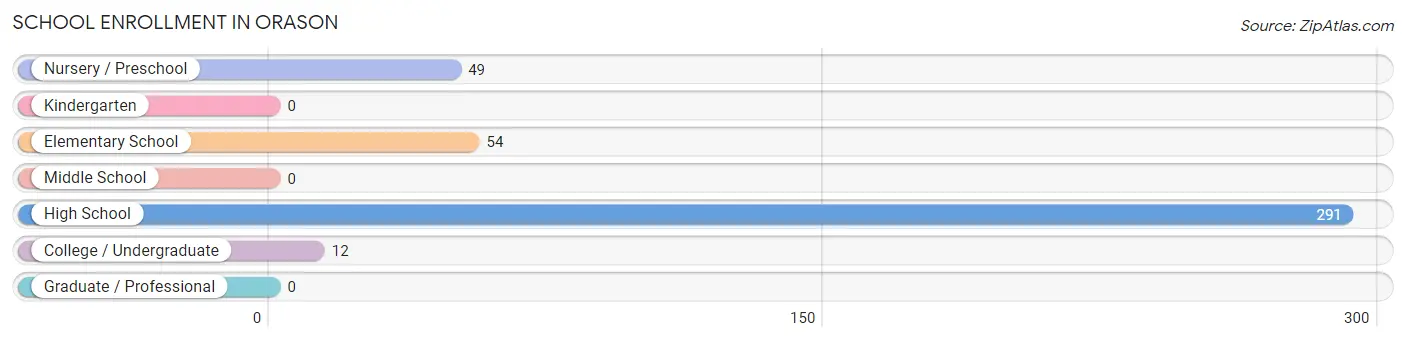
| School Level | # Students | % Students |
| Nursery / Preschool | 49 | 12.1% |
| Kindergarten | 0 | 0.0% |
| Elementary School | 54 | 13.3% |
| Middle School | 0 | 0.0% |
| High School | 291 | 71.7% |
| College / Undergraduate | 12 | 3.0% |
| Graduate / Professional | 0 | 0.0% |
| Total | 406 | 100.0% |
School Enrollment by Age by Funding Source in Orason
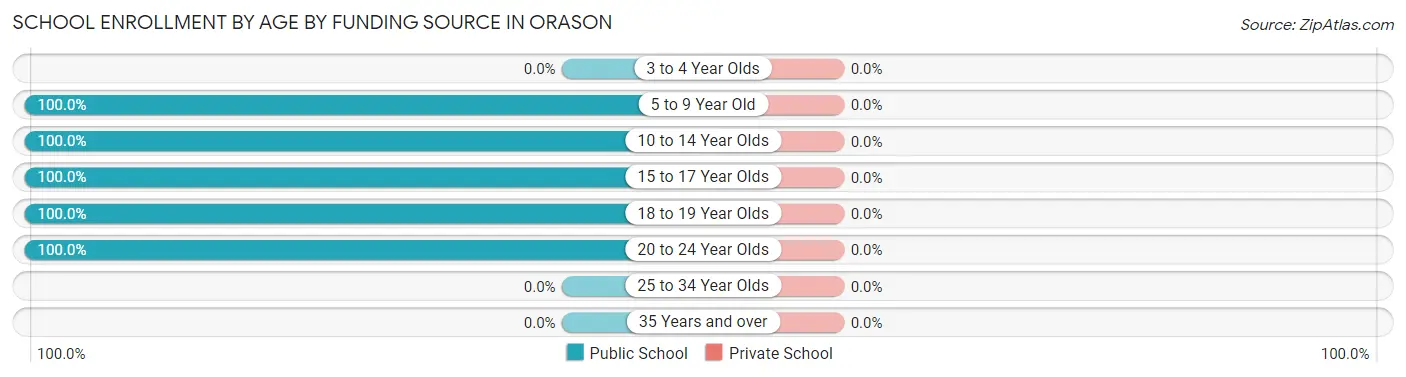
| Age Bracket | Public School | Private School |
| 3 to 4 Year Olds | 0 (0.0%) | 0 (0.0%) |
| 5 to 9 Year Old | 103 (100.0%) | 0 (0.0%) |
| 10 to 14 Year Olds | 54 (100.0%) | 0 (0.0%) |
| 15 to 17 Year Olds | 83 (100.0%) | 0 (0.0%) |
| 18 to 19 Year Olds | 154 (100.0%) | 0 (0.0%) |
| 20 to 24 Year Olds | 12 (100.0%) | 0 (0.0%) |
| 25 to 34 Year Olds | 0 (0.0%) | 0 (0.0%) |
| 35 Years and over | 0 (0.0%) | 0 (0.0%) |
| Total | 406 (100.0%) | 0 (0.0%) |
Educational Attainment by Field of Study in Orason
| Field of Study | # Graduates | % Graduates |
| Computers & Mathematics | 0 | 0.0% |
| Bio, Nature & Agricultural | 0 | 0.0% |
| Physical & Health Sciences | 0 | 0.0% |
| Psychology | 0 | 0.0% |
| Social Sciences | 0 | 0.0% |
| Engineering | 0 | 0.0% |
| Multidisciplinary Studies | 0 | 0.0% |
| Science & Technology | 0 | 0.0% |
| Business | 0 | 0.0% |
| Education | 0 | 0.0% |
| Literature & Languages | 0 | 0.0% |
| Liberal Arts & History | 0 | 0.0% |
| Visual & Performing Arts | 0 | 0.0% |
| Communications | 0 | 0.0% |
| Arts & Humanities | 0 | 0.0% |
| Total | 0 | 0.0% |
Transportation & Commute in Orason
Vehicle Availability by Sex in Orason
The most prevalent vehicle ownership categories in Orason are males with 2 vehicles (55, accounting for 85.9%) and females with 2 vehicles (0, making up 166.7%).
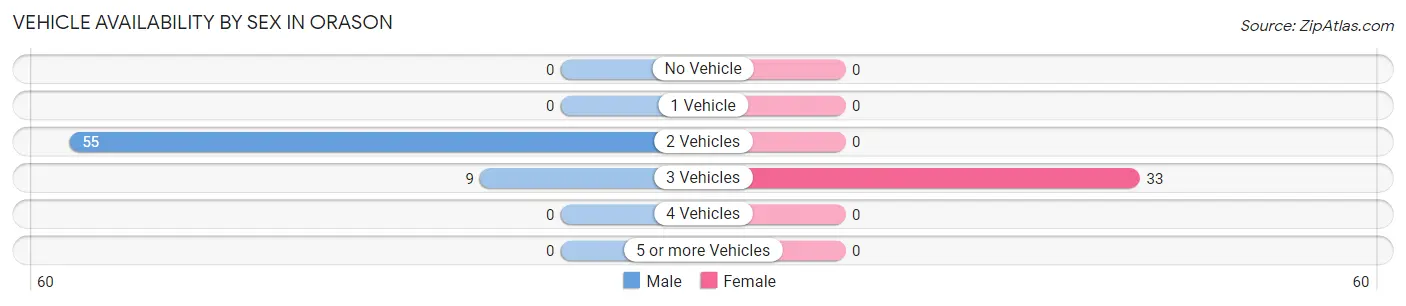
| Vehicles Available | Male | Female |
| No Vehicle | 0 (0.0%) | 0 (0.0%) |
| 1 Vehicle | 0 (0.0%) | 0 (0.0%) |
| 2 Vehicles | 55 (85.9%) | 0 (0.0%) |
| 3 Vehicles | 9 (14.1%) | 33 (100.0%) |
| 4 Vehicles | 0 (0.0%) | 0 (0.0%) |
| 5 or more Vehicles | 0 (0.0%) | 0 (0.0%) |
| Total | 64 (100.0%) | 33 (100.0%) |
Commute Time in Orason
The most frequently occuring commute durations in Orason are 30 to 34 minutes (64 commuters, 100.0%), less than 5 minutes (0 commuters, 0.0%), and 5 to 9 minutes (0 commuters, 0.0%).
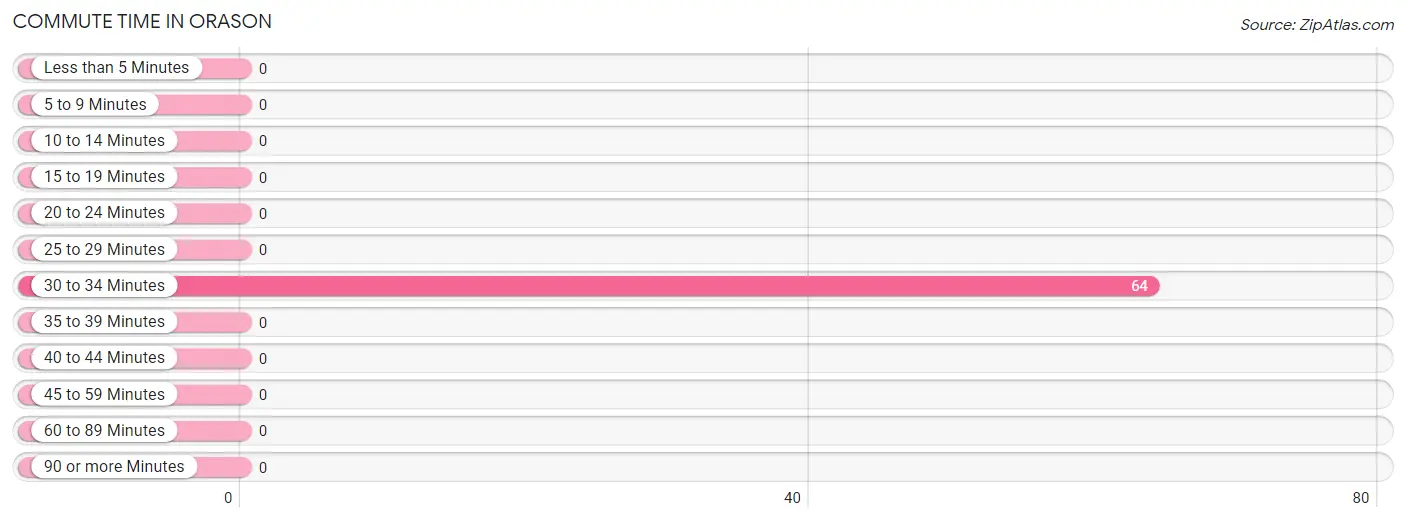
| Commute Time | # Commuters | % Commuters |
| Less than 5 Minutes | 0 | 0.0% |
| 5 to 9 Minutes | 0 | 0.0% |
| 10 to 14 Minutes | 0 | 0.0% |
| 15 to 19 Minutes | 0 | 0.0% |
| 20 to 24 Minutes | 0 | 0.0% |
| 25 to 29 Minutes | 0 | 0.0% |
| 30 to 34 Minutes | 64 | 100.0% |
| 35 to 39 Minutes | 0 | 0.0% |
| 40 to 44 Minutes | 0 | 0.0% |
| 45 to 59 Minutes | 0 | 0.0% |
| 60 to 89 Minutes | 0 | 0.0% |
| 90 or more Minutes | 0 | 0.0% |
Commute Time by Sex in Orason
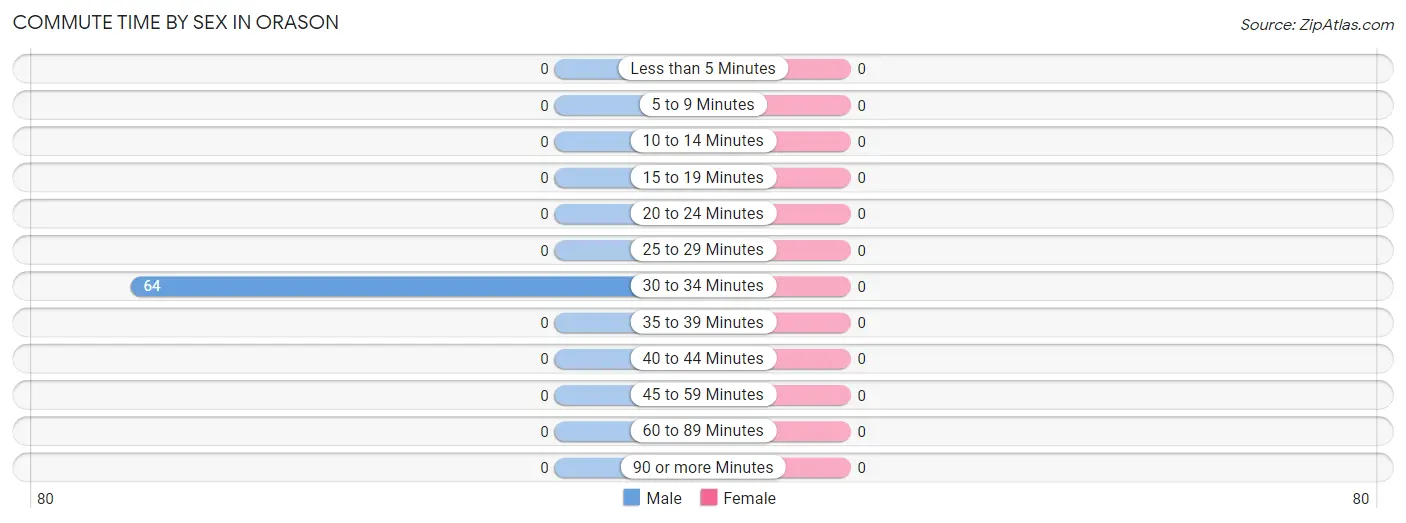
| Commute Time | Male | Female |
| Less than 5 Minutes | 0 (0.0%) | 0 (0.0%) |
| 5 to 9 Minutes | 0 (0.0%) | 0 (0.0%) |
| 10 to 14 Minutes | 0 (0.0%) | 0 (0.0%) |
| 15 to 19 Minutes | 0 (0.0%) | 0 (0.0%) |
| 20 to 24 Minutes | 0 (0.0%) | 0 (0.0%) |
| 25 to 29 Minutes | 0 (0.0%) | 0 (0.0%) |
| 30 to 34 Minutes | 64 (100.0%) | 0 (0.0%) |
| 35 to 39 Minutes | 0 (0.0%) | 0 (0.0%) |
| 40 to 44 Minutes | 0 (0.0%) | 0 (0.0%) |
| 45 to 59 Minutes | 0 (0.0%) | 0 (0.0%) |
| 60 to 89 Minutes | 0 (0.0%) | 0 (0.0%) |
| 90 or more Minutes | 0 (0.0%) | 0 (0.0%) |
Time of Departure to Work by Sex in Orason
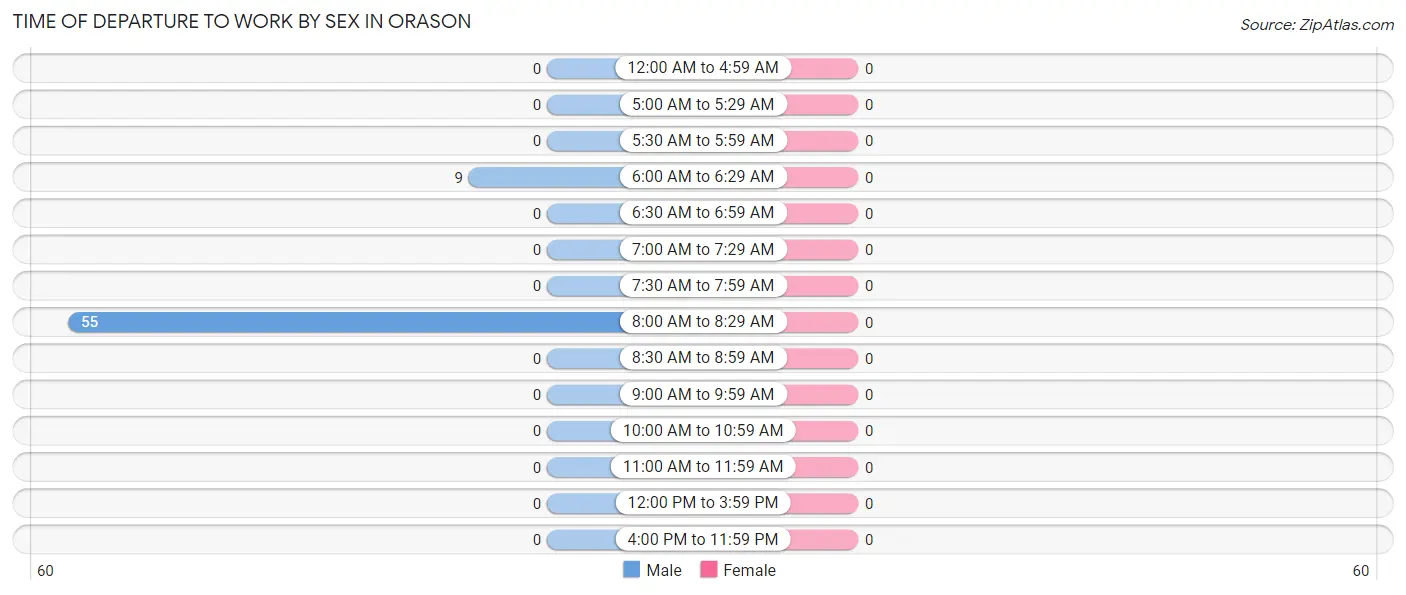
| Time of Departure | Male | Female |
| 12:00 AM to 4:59 AM | 0 (0.0%) | 0 (0.0%) |
| 5:00 AM to 5:29 AM | 0 (0.0%) | 0 (0.0%) |
| 5:30 AM to 5:59 AM | 0 (0.0%) | 0 (0.0%) |
| 6:00 AM to 6:29 AM | 9 (14.1%) | 0 (0.0%) |
| 6:30 AM to 6:59 AM | 0 (0.0%) | 0 (0.0%) |
| 7:00 AM to 7:29 AM | 0 (0.0%) | 0 (0.0%) |
| 7:30 AM to 7:59 AM | 0 (0.0%) | 0 (0.0%) |
| 8:00 AM to 8:29 AM | 55 (85.9%) | 0 (0.0%) |
| 8:30 AM to 8:59 AM | 0 (0.0%) | 0 (0.0%) |
| 9:00 AM to 9:59 AM | 0 (0.0%) | 0 (0.0%) |
| 10:00 AM to 10:59 AM | 0 (0.0%) | 0 (0.0%) |
| 11:00 AM to 11:59 AM | 0 (0.0%) | 0 (0.0%) |
| 12:00 PM to 3:59 PM | 0 (0.0%) | 0 (0.0%) |
| 4:00 PM to 11:59 PM | 0 (0.0%) | 0 (0.0%) |
| Total | 64 (100.0%) | 0 (0.0%) |
Housing Occupancy in Orason
Occupancy by Ownership in Orason
Of the total 85 dwellings in Orason, owner-occupied units account for 42 (49.4%), while renter-occupied units make up 43 (50.6%).
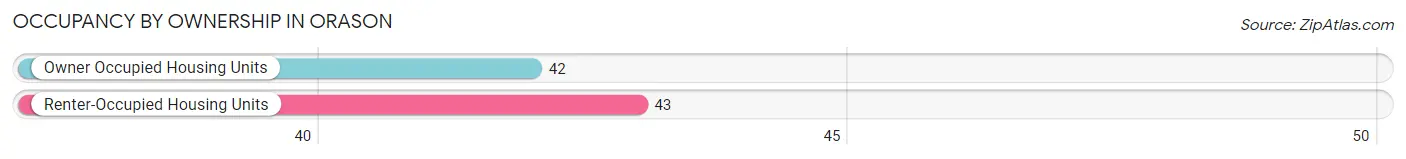
| Occupancy | # Housing Units | % Housing Units |
| Owner Occupied Housing Units | 42 | 49.4% |
| Renter-Occupied Housing Units | 43 | 50.6% |
| Total Occupied Housing Units | 85 | 100.0% |
Occupancy by Household Size in Orason
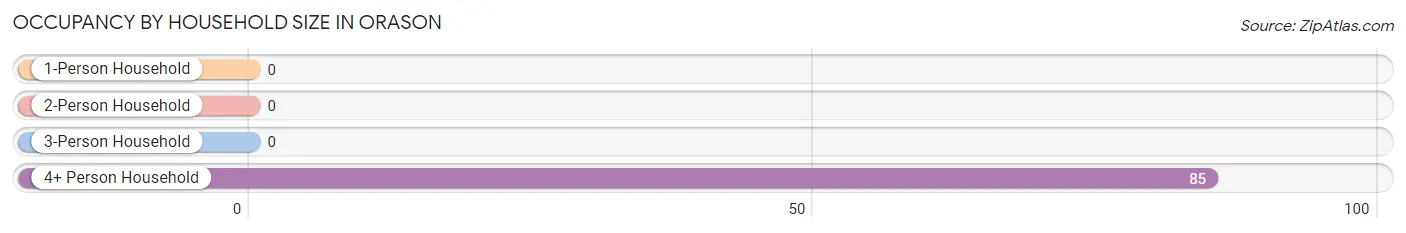
| Household Size | # Housing Units | % Housing Units |
| 1-Person Household | 0 | 0.0% |
| 2-Person Household | 0 | 0.0% |
| 3-Person Household | 0 | 0.0% |
| 4+ Person Household | 85 | 100.0% |
| Total Housing Units | 85 | 100.0% |
Occupancy by Ownership by Household Size in Orason
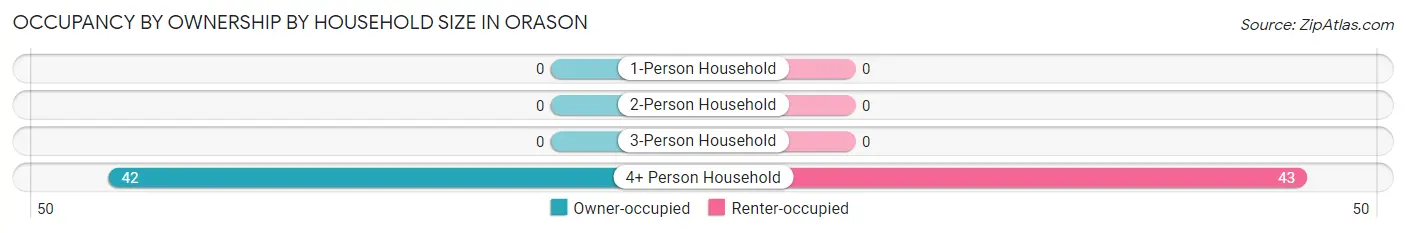
| Household Size | Owner-occupied | Renter-occupied |
| 1-Person Household | 0 (0.0%) | 0 (0.0%) |
| 2-Person Household | 0 (0.0%) | 0 (0.0%) |
| 3-Person Household | 0 (0.0%) | 0 (0.0%) |
| 4+ Person Household | 42 (49.4%) | 43 (50.6%) |
| Total Housing Units | 42 (49.4%) | 43 (50.6%) |
Occupancy by Educational Attainment in Orason
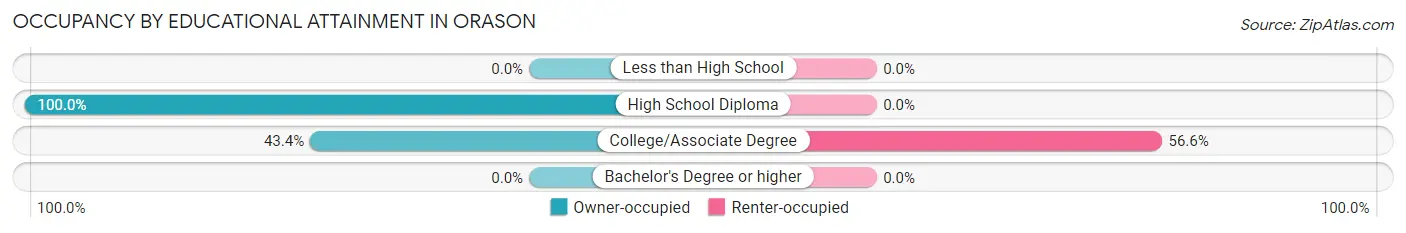
| Household Size | Owner-occupied | Renter-occupied |
| Less than High School | 0 (0.0%) | 0 (0.0%) |
| High School Diploma | 9 (100.0%) | 0 (0.0%) |
| College/Associate Degree | 33 (43.4%) | 43 (56.6%) |
| Bachelor's Degree or higher | 0 (0.0%) | 0 (0.0%) |
Occupancy by Age of Householder in Orason
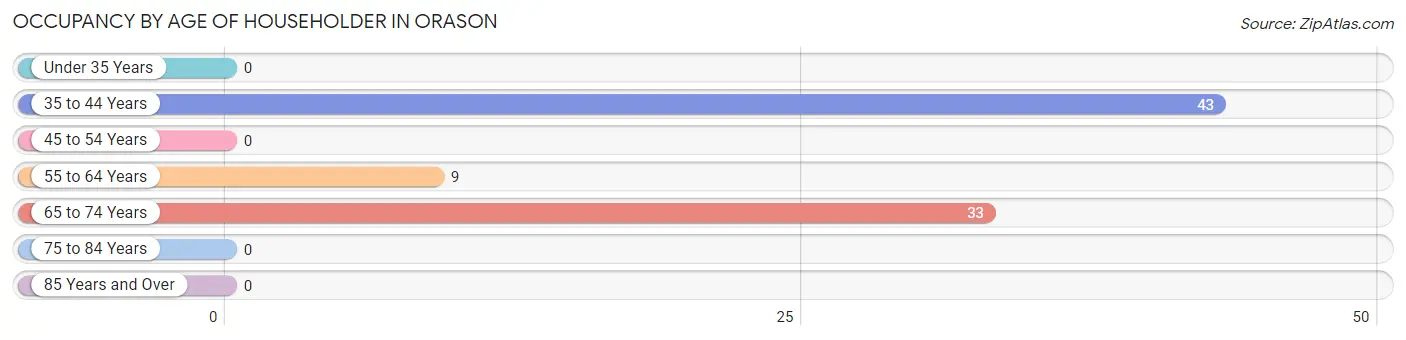
| Age Bracket | # Households | % Households |
| Under 35 Years | 0 | 0.0% |
| 35 to 44 Years | 43 | 50.6% |
| 45 to 54 Years | 0 | 0.0% |
| 55 to 64 Years | 9 | 10.6% |
| 65 to 74 Years | 33 | 38.8% |
| 75 to 84 Years | 0 | 0.0% |
| 85 Years and Over | 0 | 0.0% |
| Total | 85 | 100.0% |
Housing Finances in Orason
Median Income by Occupancy in Orason
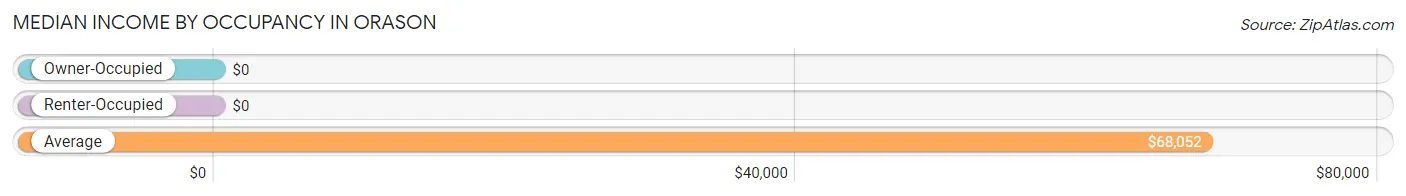
| Occupancy Type | # Households | Median Income |
| Owner-Occupied | 42 (49.4%) | $0 |
| Renter-Occupied | 43 (50.6%) | $0 |
| Average | 85 (100.0%) | $68,052 |
Occupancy by Householder Income Bracket in Orason
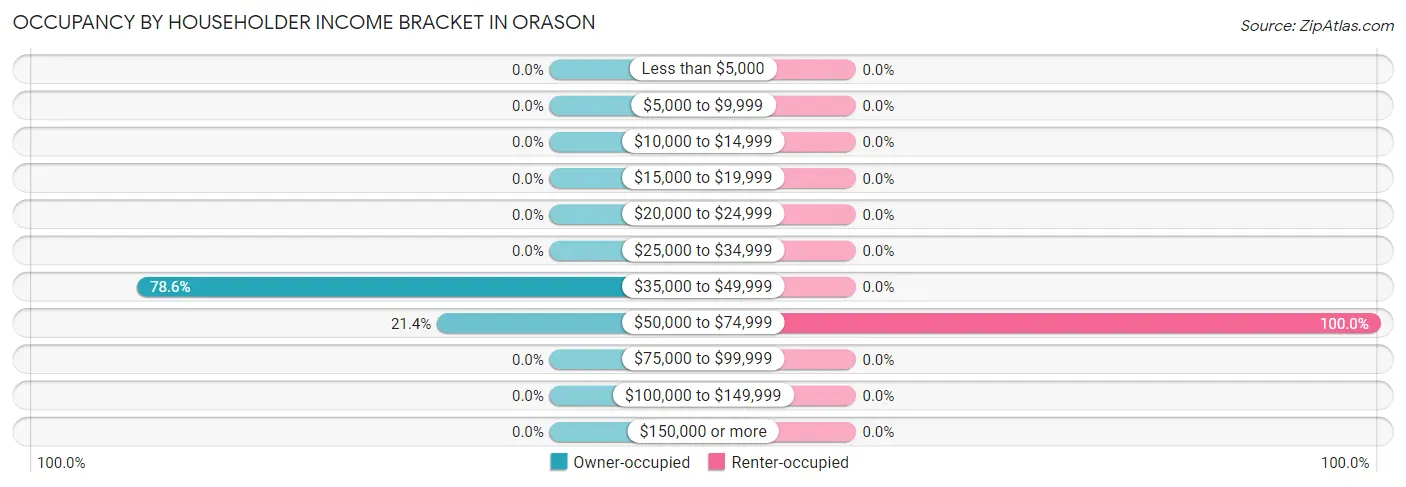
| Income Bracket | Owner-occupied | Renter-occupied |
| Less than $5,000 | 0 (0.0%) | 0 (0.0%) |
| $5,000 to $9,999 | 0 (0.0%) | 0 (0.0%) |
| $10,000 to $14,999 | 0 (0.0%) | 0 (0.0%) |
| $15,000 to $19,999 | 0 (0.0%) | 0 (0.0%) |
| $20,000 to $24,999 | 0 (0.0%) | 0 (0.0%) |
| $25,000 to $34,999 | 0 (0.0%) | 0 (0.0%) |
| $35,000 to $49,999 | 33 (78.6%) | 0 (0.0%) |
| $50,000 to $74,999 | 9 (21.4%) | 43 (100.0%) |
| $75,000 to $99,999 | 0 (0.0%) | 0 (0.0%) |
| $100,000 to $149,999 | 0 (0.0%) | 0 (0.0%) |
| $150,000 or more | 0 (0.0%) | 0 (0.0%) |
| Total | 42 (100.0%) | 43 (100.0%) |
Monthly Housing Cost Tiers in Orason
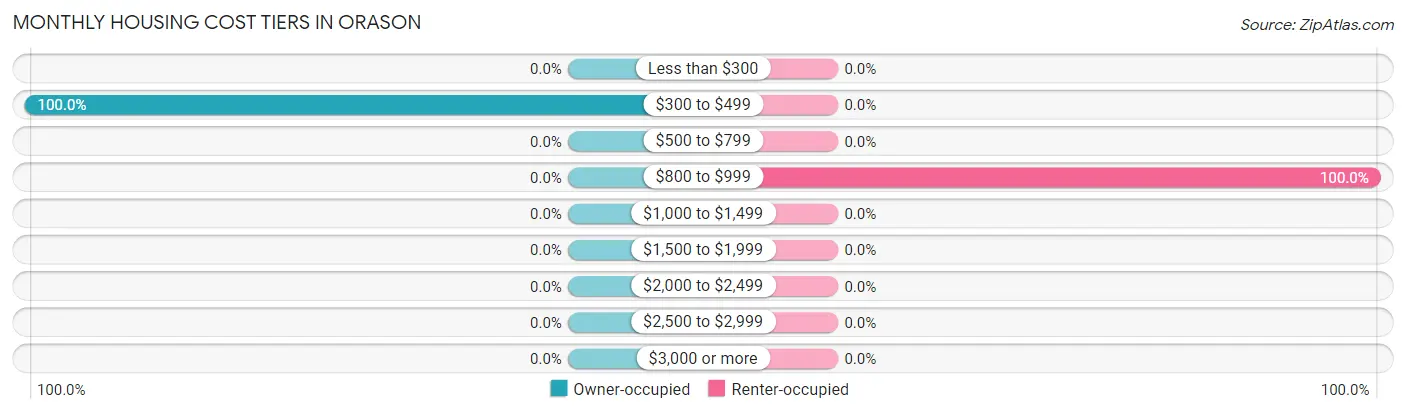
| Monthly Cost | Owner-occupied | Renter-occupied |
| Less than $300 | 0 (0.0%) | 0 (0.0%) |
| $300 to $499 | 42 (100.0%) | 0 (0.0%) |
| $500 to $799 | 0 (0.0%) | 0 (0.0%) |
| $800 to $999 | 0 (0.0%) | 43 (100.0%) |
| $1,000 to $1,499 | 0 (0.0%) | 0 (0.0%) |
| $1,500 to $1,999 | 0 (0.0%) | 0 (0.0%) |
| $2,000 to $2,499 | 0 (0.0%) | 0 (0.0%) |
| $2,500 to $2,999 | 0 (0.0%) | 0 (0.0%) |
| $3,000 or more | 0 (0.0%) | 0 (0.0%) |
| Total | 42 (100.0%) | 43 (100.0%) |
Physical Housing Characteristics in Orason
Housing Structures in Orason
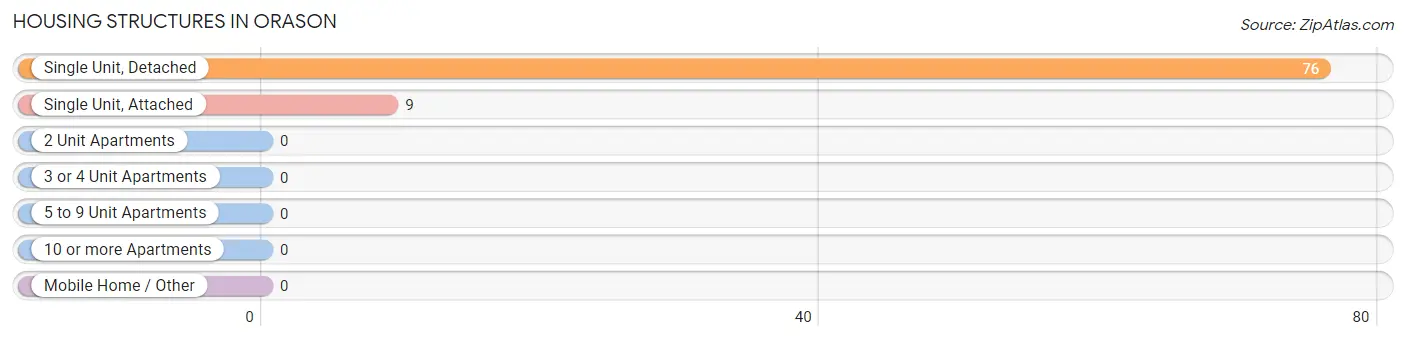
| Structure Type | # Housing Units | % Housing Units |
| Single Unit, Detached | 76 | 89.4% |
| Single Unit, Attached | 9 | 10.6% |
| 2 Unit Apartments | 0 | 0.0% |
| 3 or 4 Unit Apartments | 0 | 0.0% |
| 5 to 9 Unit Apartments | 0 | 0.0% |
| 10 or more Apartments | 0 | 0.0% |
| Mobile Home / Other | 0 | 0.0% |
| Total | 85 | 100.0% |
Housing Structures by Occupancy in Orason
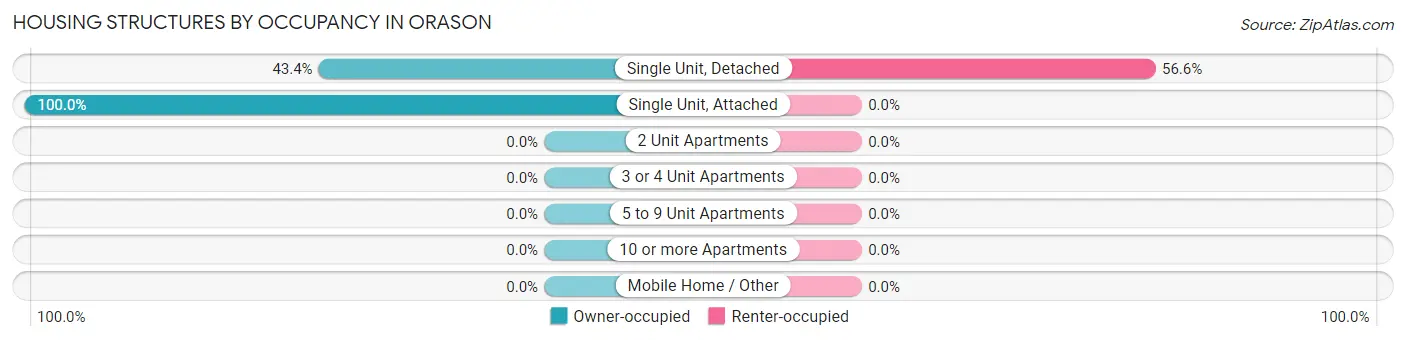
| Structure Type | Owner-occupied | Renter-occupied |
| Single Unit, Detached | 33 (43.4%) | 43 (56.6%) |
| Single Unit, Attached | 9 (100.0%) | 0 (0.0%) |
| 2 Unit Apartments | 0 (0.0%) | 0 (0.0%) |
| 3 or 4 Unit Apartments | 0 (0.0%) | 0 (0.0%) |
| 5 to 9 Unit Apartments | 0 (0.0%) | 0 (0.0%) |
| 10 or more Apartments | 0 (0.0%) | 0 (0.0%) |
| Mobile Home / Other | 0 (0.0%) | 0 (0.0%) |
| Total | 42 (49.4%) | 43 (50.6%) |
Housing Structures by Number of Rooms in Orason
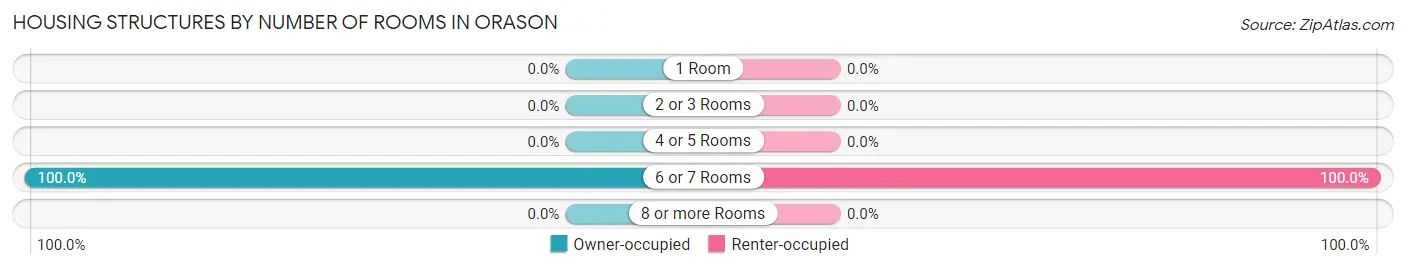
| Number of Rooms | Owner-occupied | Renter-occupied |
| 1 Room | 0 (0.0%) | 0 (0.0%) |
| 2 or 3 Rooms | 0 (0.0%) | 0 (0.0%) |
| 4 or 5 Rooms | 0 (0.0%) | 0 (0.0%) |
| 6 or 7 Rooms | 42 (100.0%) | 43 (100.0%) |
| 8 or more Rooms | 0 (0.0%) | 0 (0.0%) |
| Total | 42 (100.0%) | 43 (100.0%) |
Housing Structure by Heating Type in Orason
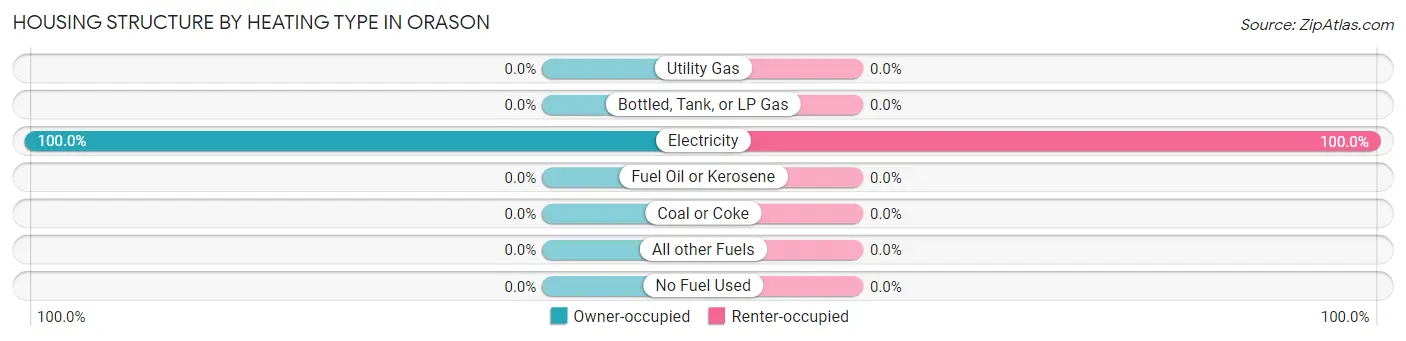
| Heating Type | Owner-occupied | Renter-occupied |
| Utility Gas | 0 (0.0%) | 0 (0.0%) |
| Bottled, Tank, or LP Gas | 0 (0.0%) | 0 (0.0%) |
| Electricity | 42 (100.0%) | 43 (100.0%) |
| Fuel Oil or Kerosene | 0 (0.0%) | 0 (0.0%) |
| Coal or Coke | 0 (0.0%) | 0 (0.0%) |
| All other Fuels | 0 (0.0%) | 0 (0.0%) |
| No Fuel Used | 0 (0.0%) | 0 (0.0%) |
| Total | 42 (100.0%) | 43 (100.0%) |
Household Vehicle Usage in Orason
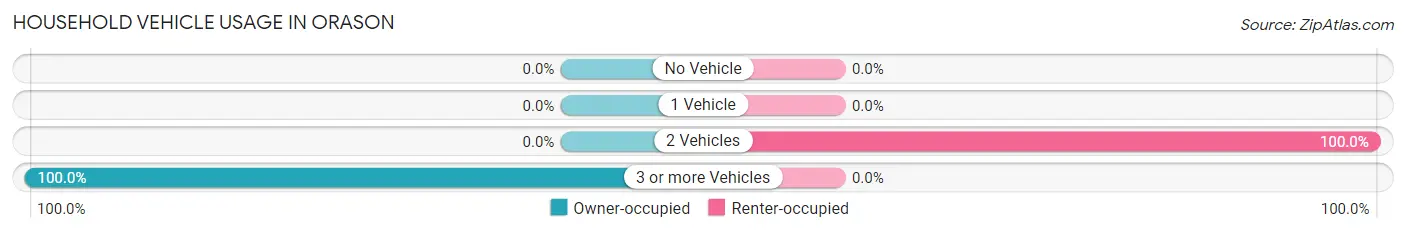
| Vehicles per Household | Owner-occupied | Renter-occupied |
| No Vehicle | 0 (0.0%) | 0 (0.0%) |
| 1 Vehicle | 0 (0.0%) | 0 (0.0%) |
| 2 Vehicles | 0 (0.0%) | 43 (100.0%) |
| 3 or more Vehicles | 42 (100.0%) | 0 (0.0%) |
| Total | 42 (100.0%) | 43 (100.0%) |
Real Estate & Mortgages in Orason
Real Estate and Mortgage Overview in Orason
| Characteristic | Without Mortgage | With Mortgage |
| Housing Units | 42 | 0 |
| Median Property Value | - | - |
| Median Household Income | - | - |
| Monthly Housing Costs | - | - |
| Real Estate Taxes | - | - |
Property Value by Mortgage Status in Orason
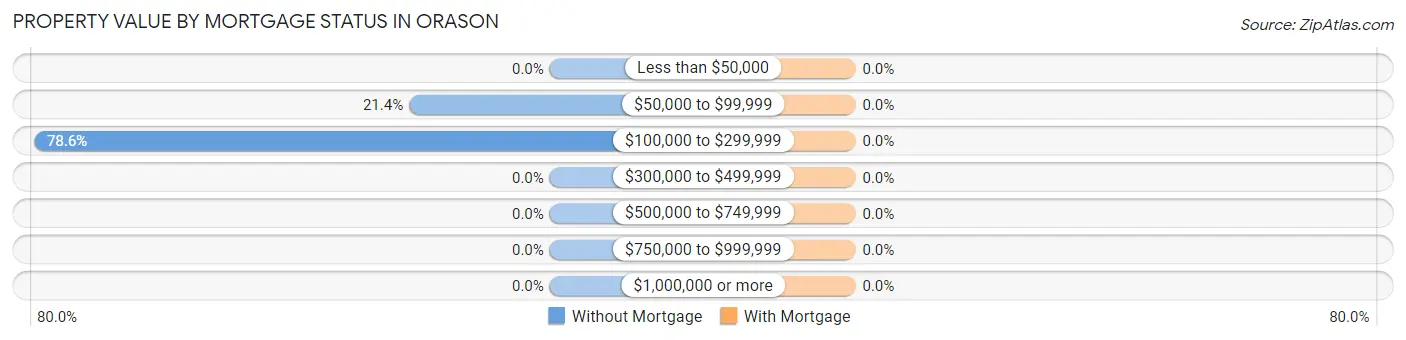
| Property Value | Without Mortgage | With Mortgage |
| Less than $50,000 | 0 (0.0%) | 0 (0.0%) |
| $50,000 to $99,999 | 9 (21.4%) | 0 (0.0%) |
| $100,000 to $299,999 | 33 (78.6%) | 0 (0.0%) |
| $300,000 to $499,999 | 0 (0.0%) | 0 (0.0%) |
| $500,000 to $749,999 | 0 (0.0%) | 0 (0.0%) |
| $750,000 to $999,999 | 0 (0.0%) | 0 (0.0%) |
| $1,000,000 or more | 0 (0.0%) | 0 (0.0%) |
| Total | 42 (100.0%) | 0 (0.0%) |
Household Income by Mortgage Status in Orason
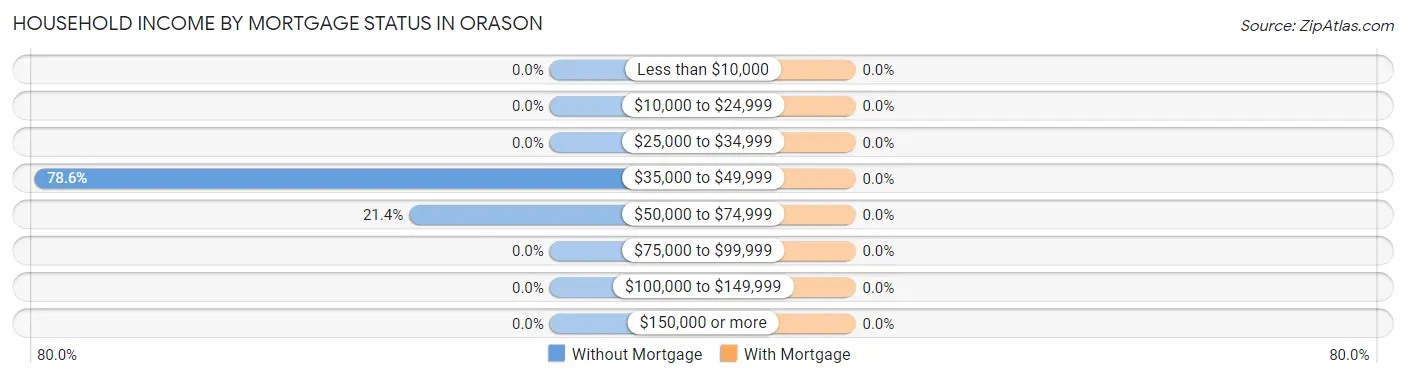
| Household Income | Without Mortgage | With Mortgage |
| Less than $10,000 | 0 (0.0%) | 0 (0.0%) |
| $10,000 to $24,999 | 0 (0.0%) | 0 (0.0%) |
| $25,000 to $34,999 | 0 (0.0%) | 0 (0.0%) |
| $35,000 to $49,999 | 33 (78.6%) | 0 (0.0%) |
| $50,000 to $74,999 | 9 (21.4%) | 0 (0.0%) |
| $75,000 to $99,999 | 0 (0.0%) | 0 (0.0%) |
| $100,000 to $149,999 | 0 (0.0%) | 0 (0.0%) |
| $150,000 or more | 0 (0.0%) | 0 (0.0%) |
| Total | 42 (100.0%) | 0 (0.0%) |
Property Value to Household Income Ratio in Orason
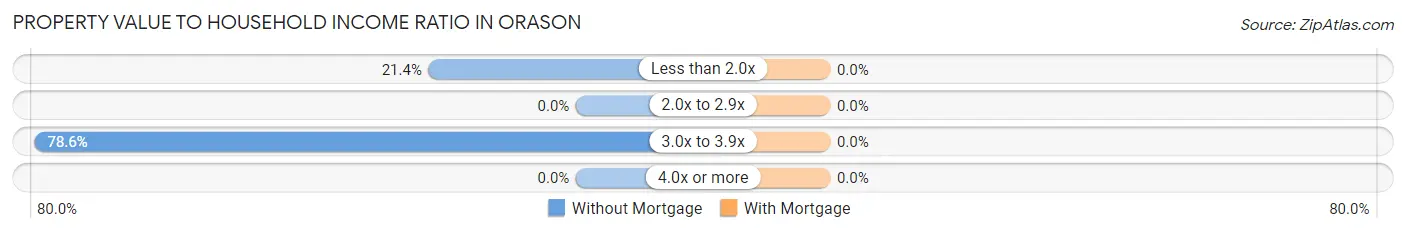
| Value-to-Income Ratio | Without Mortgage | With Mortgage |
| Less than 2.0x | 9 (21.4%) | 0 (0.0%) |
| 2.0x to 2.9x | 0 (0.0%) | 0 (0.0%) |
| 3.0x to 3.9x | 33 (78.6%) | 0 (0.0%) |
| 4.0x or more | 0 (0.0%) | 0 (0.0%) |
| Total | 42 (100.0%) | 0 (0.0%) |
Real Estate Taxes by Mortgage Status in Orason
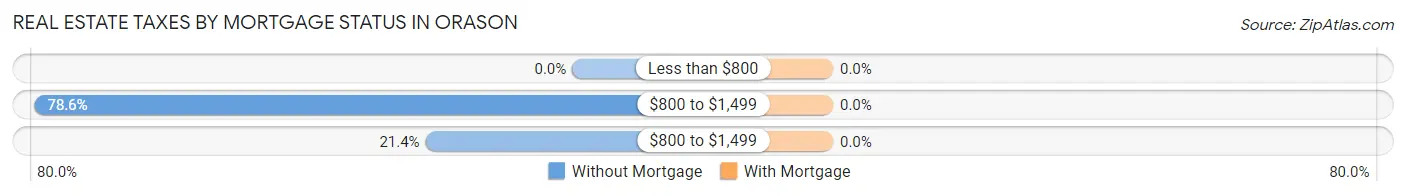
| Property Taxes | Without Mortgage | With Mortgage |
| Less than $800 | 0 (0.0%) | 0 (0.0%) |
| $800 to $1,499 | 33 (78.6%) | 0 (0.0%) |
| $800 to $1,499 | 9 (21.4%) | 0 (0.0%) |
| Total | 42 (100.0%) | 0 (0.0%) |
Health & Disability in Orason
Health Insurance Coverage by Age in Orason
| Age Bracket | With Coverage | Without Coverage |
| Under 6 Years | 49 (100.0%) | 0 (0.0%) |
| 6 to 18 Years | 191 (100.0%) | 0 (0.0%) |
| 19 to 25 Years | 12 (7.2%) | 154 (92.8%) |
| 26 to 34 Years | 0 (0.0%) | 0 (0.0%) |
| 35 to 44 Years | 98 (100.0%) | 0 (0.0%) |
| 45 to 54 Years | 0 (0.0%) | 8 (100.0%) |
| 55 to 64 Years | 9 (100.0%) | 0 (0.0%) |
| 65 to 74 Years | 66 (100.0%) | 0 (0.0%) |
| 75 Years and older | 10 (100.0%) | 0 (0.0%) |
| Total | 435 (72.9%) | 162 (27.1%) |
Health Insurance Coverage by Citizenship Status in Orason
| Citizenship Status | With Coverage | Without Coverage |
| Native Born | 49 (100.0%) | 0 (0.0%) |
| Foreign Born, Citizen | 191 (100.0%) | 0 (0.0%) |
| Foreign Born, not a Citizen | 12 (7.2%) | 154 (92.8%) |
Health Insurance Coverage by Household Income in Orason
| Household Income | With Coverage | Without Coverage |
| Under $25,000 | 0 (0.0%) | 0 (0.0%) |
| $25,000 to $49,999 | 149 (49.2%) | 154 (50.8%) |
| $50,000 to $74,999 | 286 (97.3%) | 8 (2.7%) |
| $75,000 to $99,999 | 0 (0.0%) | 0 (0.0%) |
| $100,000 and over | 0 (0.0%) | 0 (0.0%) |
Public vs Private Health Insurance Coverage by Age in Orason
| Age Bracket | Public Insurance | Private Insurance |
| Under 6 | 0 (0.0%) | 49 (100.0%) |
| 6 to 18 Years | 83 (43.5%) | 108 (56.5%) |
| 19 to 25 Years | 0 (0.0%) | 12 (7.2%) |
| 25 to 34 Years | 0 (0.0%) | 0 (0.0%) |
| 35 to 44 Years | 0 (0.0%) | 98 (100.0%) |
| 45 to 54 Years | 0 (0.0%) | 0 (0.0%) |
| 55 to 64 Years | 9 (100.0%) | 0 (0.0%) |
| 65 to 74 Years | 66 (100.0%) | 0 (0.0%) |
| 75 Years and over | 10 (100.0%) | 0 (0.0%) |
| Total | 168 (28.1%) | 267 (44.7%) |
Disability Status by Sex by Age in Orason
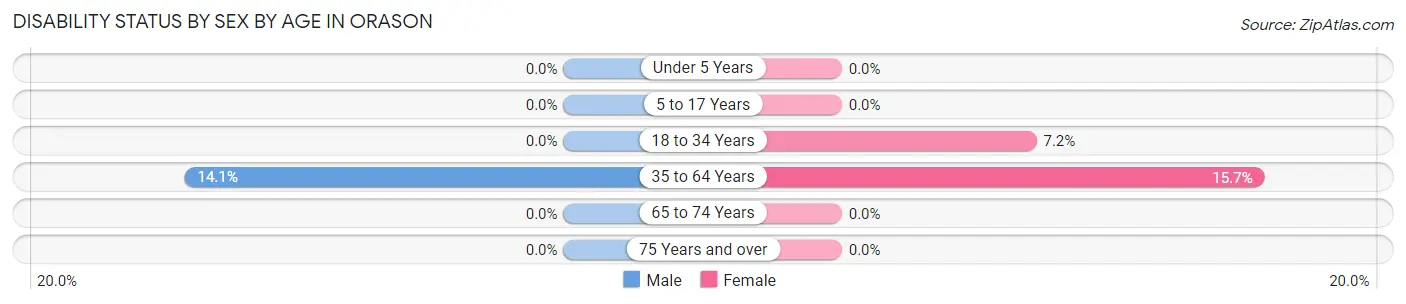
| Age Bracket | Male | Female |
| Under 5 Years | 0 (0.0%) | 0 (0.0%) |
| 5 to 17 Years | 0 (0.0%) | 0 (0.0%) |
| 18 to 34 Years | 0 (0.0%) | 12 (7.2%) |
| 35 to 64 Years | 9 (14.1%) | 8 (15.7%) |
| 65 to 74 Years | 0 (0.0%) | 0 (0.0%) |
| 75 Years and over | 0 (0.0%) | 0 (0.0%) |
Disability Class by Sex by Age in Orason
Disability Class: Hearing Difficulty
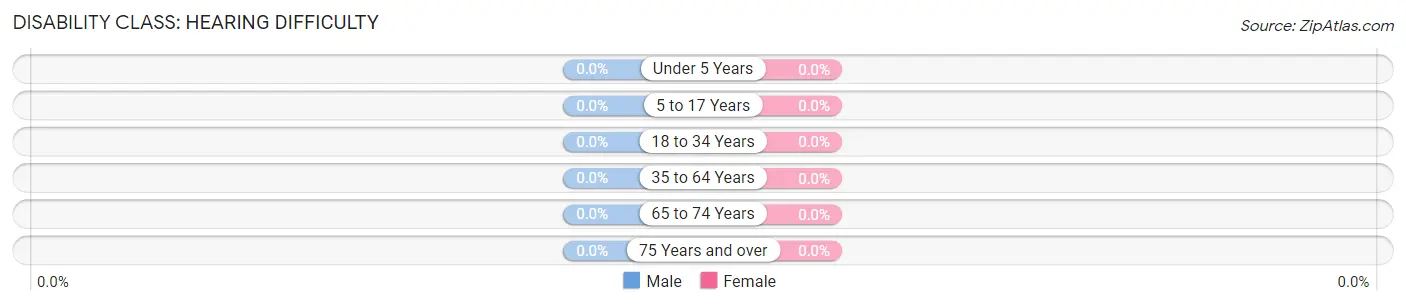
| Age Bracket | Male | Female |
| Under 5 Years | 0 (0.0%) | 0 (0.0%) |
| 5 to 17 Years | 0 (0.0%) | 0 (0.0%) |
| 18 to 34 Years | 0 (0.0%) | 0 (0.0%) |
| 35 to 64 Years | 0 (0.0%) | 0 (0.0%) |
| 65 to 74 Years | 0 (0.0%) | 0 (0.0%) |
| 75 Years and over | 0 (0.0%) | 0 (0.0%) |
Disability Class: Vision Difficulty
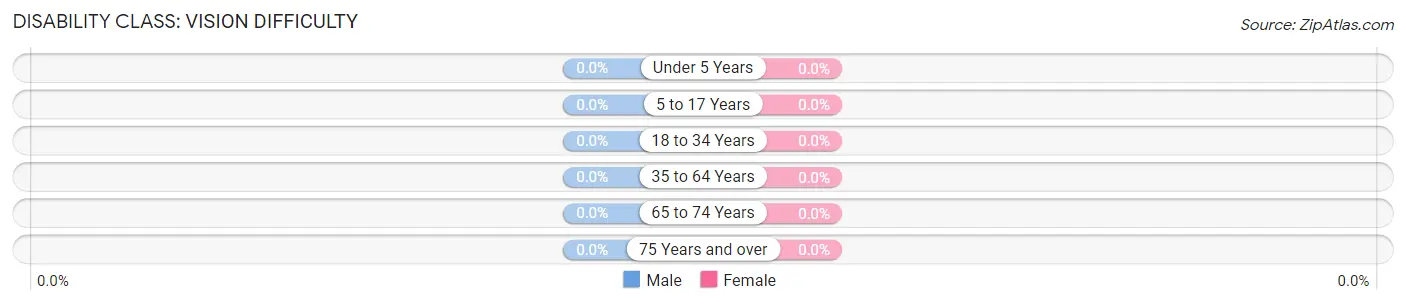
| Age Bracket | Male | Female |
| Under 5 Years | 0 (0.0%) | 0 (0.0%) |
| 5 to 17 Years | 0 (0.0%) | 0 (0.0%) |
| 18 to 34 Years | 0 (0.0%) | 0 (0.0%) |
| 35 to 64 Years | 0 (0.0%) | 0 (0.0%) |
| 65 to 74 Years | 0 (0.0%) | 0 (0.0%) |
| 75 Years and over | 0 (0.0%) | 0 (0.0%) |
Disability Class: Cognitive Difficulty
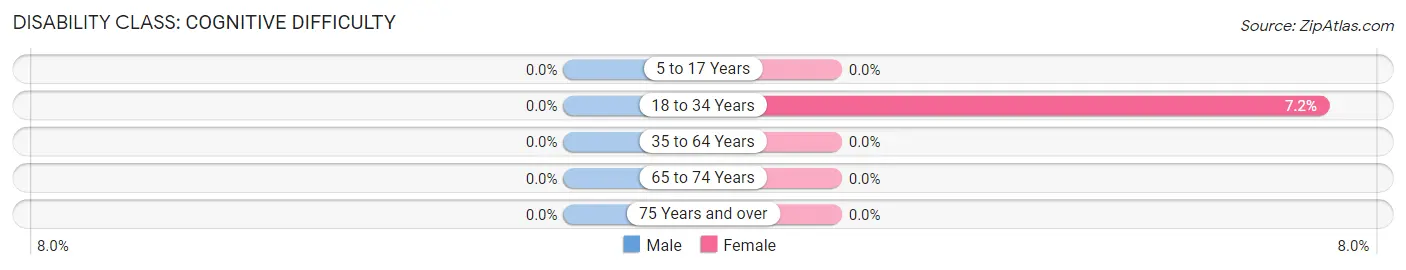
| Age Bracket | Male | Female |
| 5 to 17 Years | 0 (0.0%) | 0 (0.0%) |
| 18 to 34 Years | 0 (0.0%) | 12 (7.2%) |
| 35 to 64 Years | 0 (0.0%) | 0 (0.0%) |
| 65 to 74 Years | 0 (0.0%) | 0 (0.0%) |
| 75 Years and over | 0 (0.0%) | 0 (0.0%) |
Disability Class: Ambulatory Difficulty
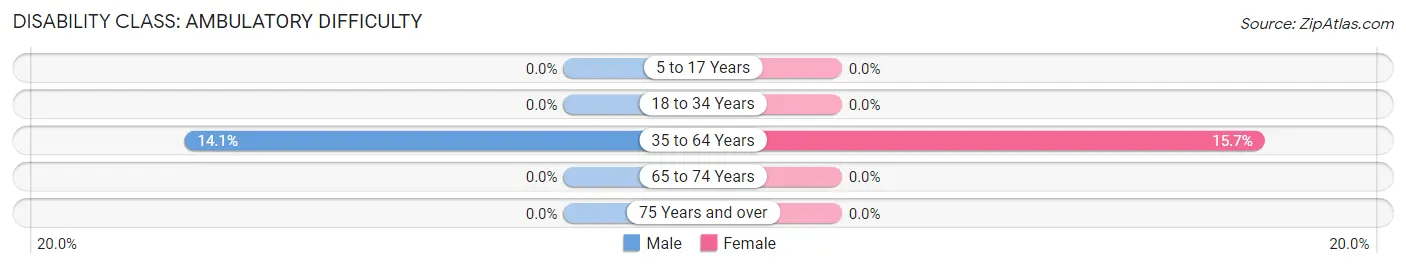
| Age Bracket | Male | Female |
| 5 to 17 Years | 0 (0.0%) | 0 (0.0%) |
| 18 to 34 Years | 0 (0.0%) | 0 (0.0%) |
| 35 to 64 Years | 9 (14.1%) | 8 (15.7%) |
| 65 to 74 Years | 0 (0.0%) | 0 (0.0%) |
| 75 Years and over | 0 (0.0%) | 0 (0.0%) |
Disability Class: Self-Care Difficulty
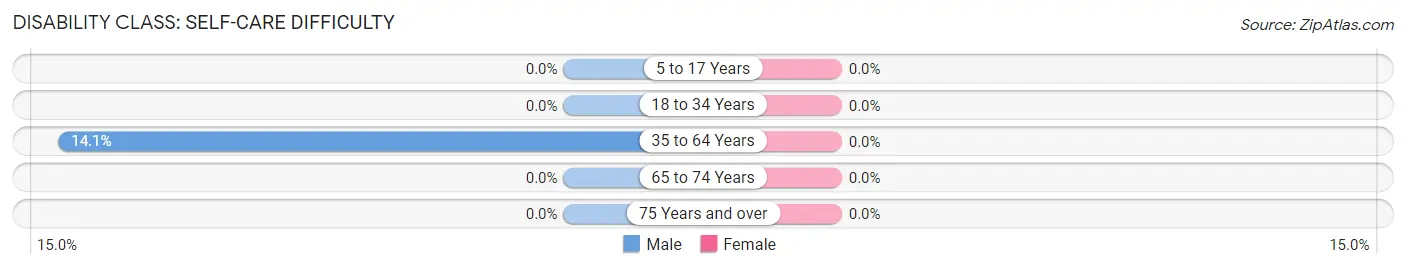
| Age Bracket | Male | Female |
| 5 to 17 Years | 0 (0.0%) | 0 (0.0%) |
| 18 to 34 Years | 0 (0.0%) | 0 (0.0%) |
| 35 to 64 Years | 9 (14.1%) | 0 (0.0%) |
| 65 to 74 Years | 0 (0.0%) | 0 (0.0%) |
| 75 Years and over | 0 (0.0%) | 0 (0.0%) |
Technology Access in Orason
Computing Device Access in Orason
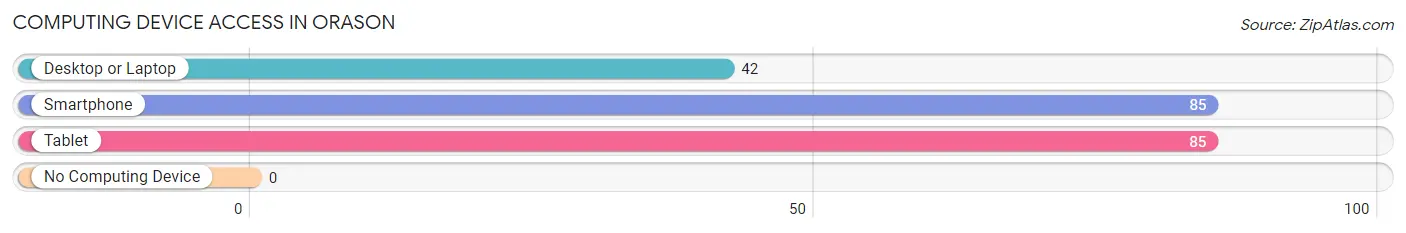
| Device Type | # Households | % Households |
| Desktop or Laptop | 42 | 49.4% |
| Smartphone | 85 | 100.0% |
| Tablet | 85 | 100.0% |
| No Computing Device | 0 | 0.0% |
| Total | 85 | 100.0% |
Internet Access in Orason
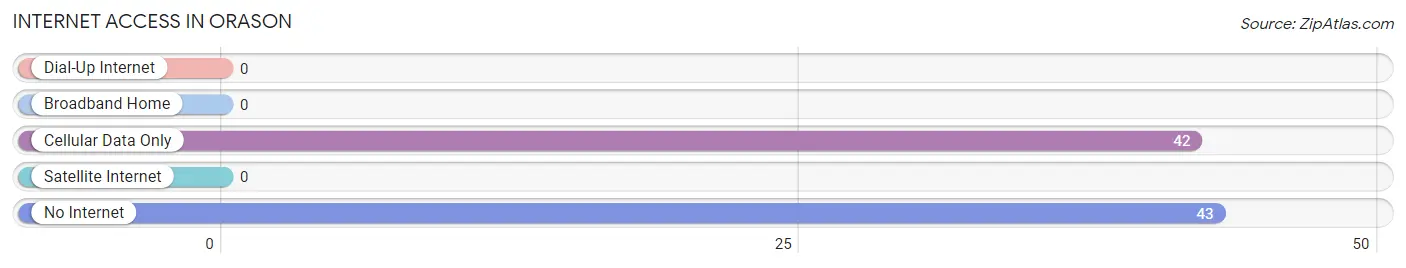
| Internet Type | # Households | % Households |
| Dial-Up Internet | 0 | 0.0% |
| Broadband Home | 0 | 0.0% |
| Cellular Data Only | 42 | 49.4% |
| Satellite Internet | 0 | 0.0% |
| No Internet | 43 | 50.6% |
| Total | 85 | 100.0% |
Orason Summary
Orason is a small town located in the state of Texas, in the United States. It is situated in the county of Brazoria, and is part of the Houston–The Woodlands–Sugar Land metropolitan area. The town has a population of approximately 1,000 people, and is known for its rural charm and small-town atmosphere.
Geography
Orason is located in the southeastern part of Brazoria County, in the Houston–The Woodlands–Sugar Land metropolitan area. It is situated on the Gulf Coast, approximately 40 miles south of Houston. The town is bordered by the cities of Alvin, Manvel, and Pearland. The terrain of the area is mostly flat, with some rolling hills. The climate is humid subtropical, with hot summers and mild winters.
Economy
The economy of Orason is largely based on agriculture and oil and gas production. The town is home to several farms, which produce a variety of crops, including cotton, corn, and soybeans. The oil and gas industry is also a major employer in the area, with several oil and gas companies operating in the region. Additionally, the town is home to several small businesses, including restaurants, retail stores, and service providers.
Demographics
As of the 2010 census, the population of Orason was 1,000 people. The racial makeup of the town was 79.2% White, 15.2% Hispanic or Latino, 2.2% African American, and 3.4% other. The median household income was $45,000, and the median age was 37.
History
Orason was founded in 1891 by a group of settlers from the nearby town of Alvin. The town was named after the Orason family, who were among the first settlers. The town grew slowly over the years, and by the early 20th century, it had become a thriving agricultural community. In the 1950s, the oil and gas industry began to take off in the area, and the town experienced a period of rapid growth. In the late 20th century, the town began to decline, as many of the oil and gas companies moved away. Today, Orason is a small, rural town, with a population of approximately 1,000 people.
Conclusion
Orason is a small town located in the state of Texas, in the United States. It is situated in the county of Brazoria, and is part of the Houston–The Woodlands–Sugar Land metropolitan area. The town has a population of approximately 1,000 people, and is known for its rural charm and small-town atmosphere. The economy of Orason is largely based on agriculture and oil and gas production, and the town is home to several small businesses. The racial makeup of the town is 79.2% White, 15.2% Hispanic or Latino, 2.2% African American, and 3.4% other. Orason was founded in 1891 by a group of settlers from the nearby town of Alvin, and has since become a small, rural town.
Common Questions
What is Per Capita Income in Orason?
Per Capita income in Orason is $9,448.
What is the Median Family Income in Orason?
Median Family Income in Orason is $68,052.
What is the Median Household income in Orason?
Median Household Income in Orason is $68,052.
What is Inequality or Gini Index in Orason?
Inequality or Gini Index in Orason is 0.14.
What is the Total Population of Orason?
Total Population of Orason is 597.
What is the Total Male Population of Orason?
Total Male Population of Orason is 229.
What is the Total Female Population of Orason?
Total Female Population of Orason is 368.
What is the Ratio of Males per 100 Females in Orason?
There are 62.23 Males per 100 Females in Orason.
What is the Ratio of Females per 100 Males in Orason?
There are 160.70 Females per 100 Males in Orason.
What is the Median Population Age in Orason?
Median Population Age in Orason is 19.4 Years.
What is the Average Family Size in Orason
Average Family Size in Orason is 7.0 People.
What is the Average Household Size in Orason
Average Household Size in Orason is 7.0 People.
How Large is the Labor Force in Orason?
There are 97 People in the Labor Forcein in Orason.
What is the Percentage of People in the Labor Force in Orason?
27.2% of People are in the Labor Force in Orason.