Patmos, AR Map & Demographics
Patmos Map
Patmos Overview
$14,808
PER CAPITA INCOME
$36,500
AVG FAMILY INCOME
$30,625
AVG HOUSEHOLD INCOME
0.29
INEQUALITY / GINI INDEX
65
TOTAL POPULATION
39
MALE POPULATION
26
FEMALE POPULATION
150.00
MALES / 100 FEMALES
66.67
FEMALES / 100 MALES
35.9
MEDIAN AGE
4.3
AVG FAMILY SIZE
2.6
AVG HOUSEHOLD SIZE
11
LABOR FORCE [ PEOPLE ]
26.8%
PERCENT IN LABOR FORCE
Income in Patmos
Income Overview in Patmos
Per Capita Income in Patmos is $14,808, while median incomes of families and households are $36,500 and $30,625 respectively.
| Characteristic | Number | Measure |
| Per Capita Income | 65 | $14,808 |
| Median Family Income | 12 | $36,500 |
| Mean Family Income | 12 | $45,750 |
| Median Household Income | 25 | $30,625 |
| Mean Household Income | 25 | $37,872 |
| Income Deficit | 12 | $0 |
| Wage / Income Gap (%) | 65 | 0.00% |
| Wage / Income Gap ($) | 65 | 100.00¢ per $1 |
| Gini / Inequality Index | 65 | 0.29 |
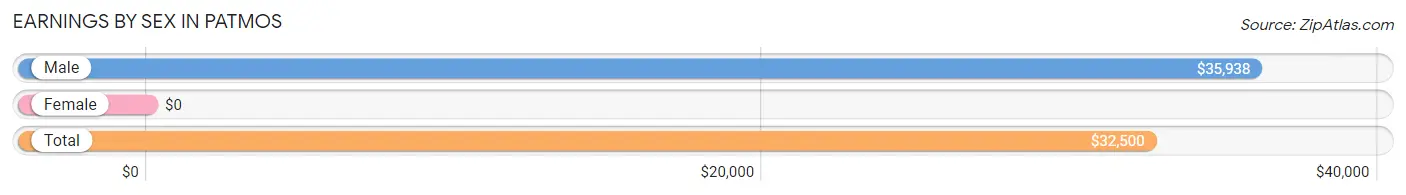
Earnings by Sex in Patmos
| Sex | Number | Average Earnings |
| Male | 7 (58.3%) | $35,938 |
| Female | 5 (41.7%) | $0 |
| Total | 12 (100.0%) | $32,500 |
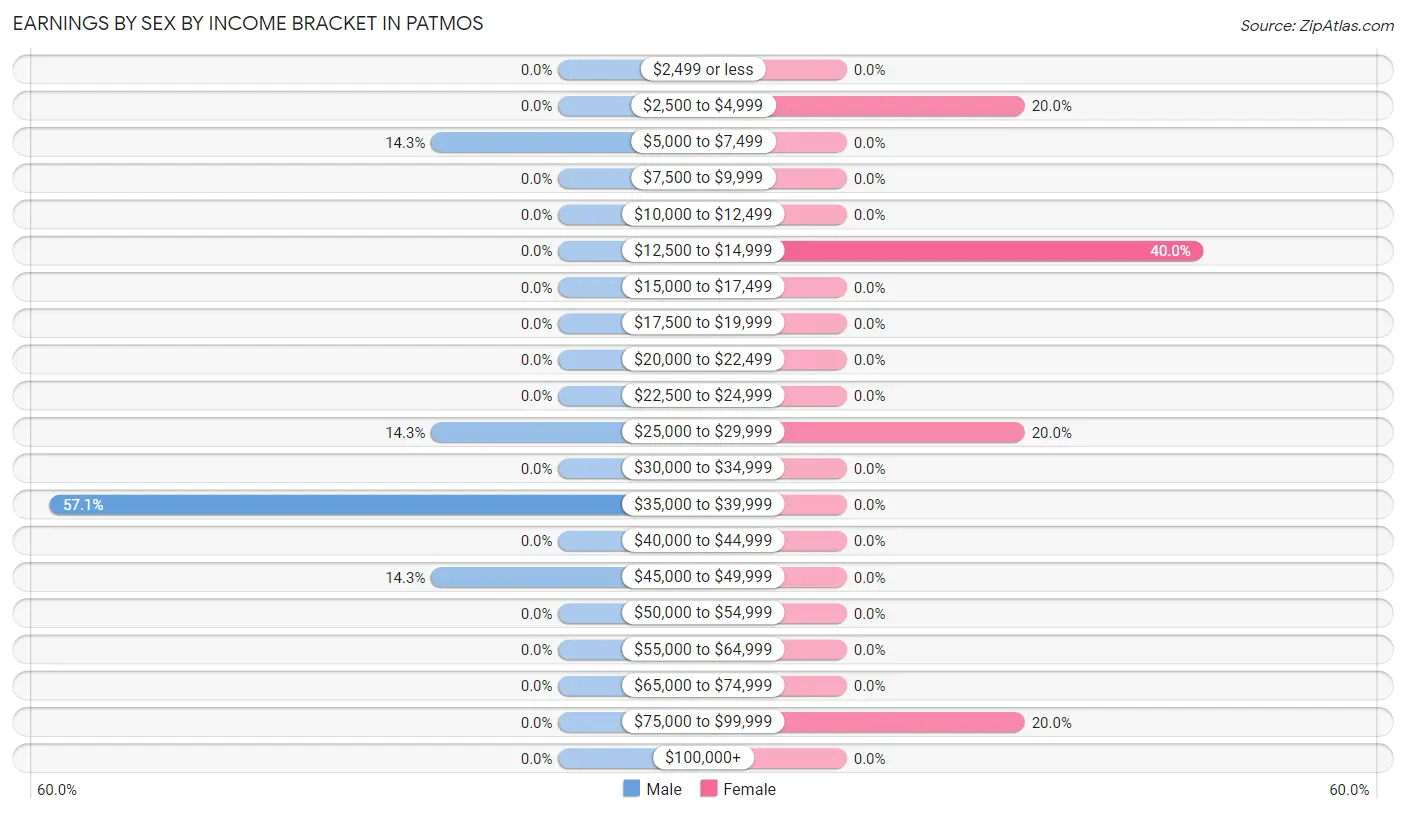
Earnings by Sex by Income Bracket in Patmos
The most common earnings brackets in Patmos are $35,000 to $39,999 for men (4 | 57.1%) and $12,500 to $14,999 for women (2 | 40.0%).
| Income | Male | Female |
| $2,499 or less | 0 (0.0%) | 0 (0.0%) |
| $2,500 to $4,999 | 0 (0.0%) | 1 (20.0%) |
| $5,000 to $7,499 | 1 (14.3%) | 0 (0.0%) |
| $7,500 to $9,999 | 0 (0.0%) | 0 (0.0%) |
| $10,000 to $12,499 | 0 (0.0%) | 0 (0.0%) |
| $12,500 to $14,999 | 0 (0.0%) | 2 (40.0%) |
| $15,000 to $17,499 | 0 (0.0%) | 0 (0.0%) |
| $17,500 to $19,999 | 0 (0.0%) | 0 (0.0%) |
| $20,000 to $22,499 | 0 (0.0%) | 0 (0.0%) |
| $22,500 to $24,999 | 0 (0.0%) | 0 (0.0%) |
| $25,000 to $29,999 | 1 (14.3%) | 1 (20.0%) |
| $30,000 to $34,999 | 0 (0.0%) | 0 (0.0%) |
| $35,000 to $39,999 | 4 (57.1%) | 0 (0.0%) |
| $40,000 to $44,999 | 0 (0.0%) | 0 (0.0%) |
| $45,000 to $49,999 | 1 (14.3%) | 0 (0.0%) |
| $50,000 to $54,999 | 0 (0.0%) | 0 (0.0%) |
| $55,000 to $64,999 | 0 (0.0%) | 0 (0.0%) |
| $65,000 to $74,999 | 0 (0.0%) | 0 (0.0%) |
| $75,000 to $99,999 | 0 (0.0%) | 1 (20.0%) |
| $100,000+ | 0 (0.0%) | 0 (0.0%) |
| Total | 7 (100.0%) | 5 (100.0%) |
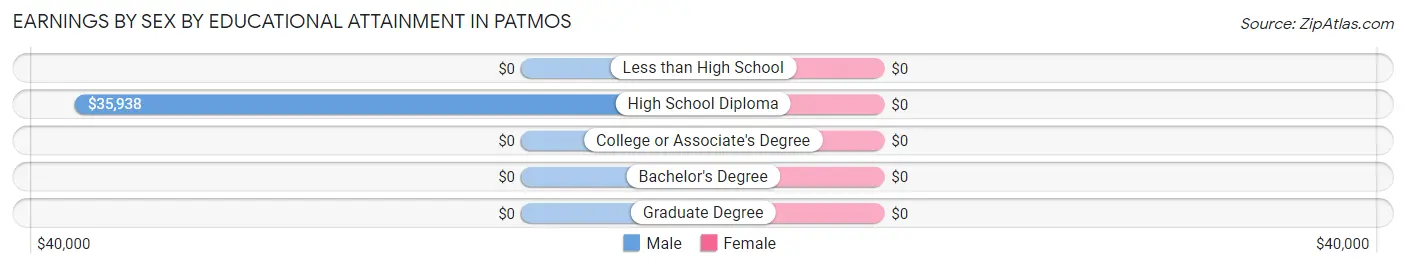
Earnings by Sex by Educational Attainment in Patmos
| Educational Attainment | Male Income | Female Income |
| Less than High School | - | - |
| High School Diploma | $35,938 | $0 |
| College or Associate's Degree | - | - |
| Bachelor's Degree | - | - |
| Graduate Degree | - | - |
| Total | $35,938 | $0 |
Family Income in Patmos
Family Income Brackets in Patmos
According to the Patmos family income data, there are 7 families falling into the $35,000 to $49,999 income range, which is the most common income bracket and makes up 58.3% of all families.
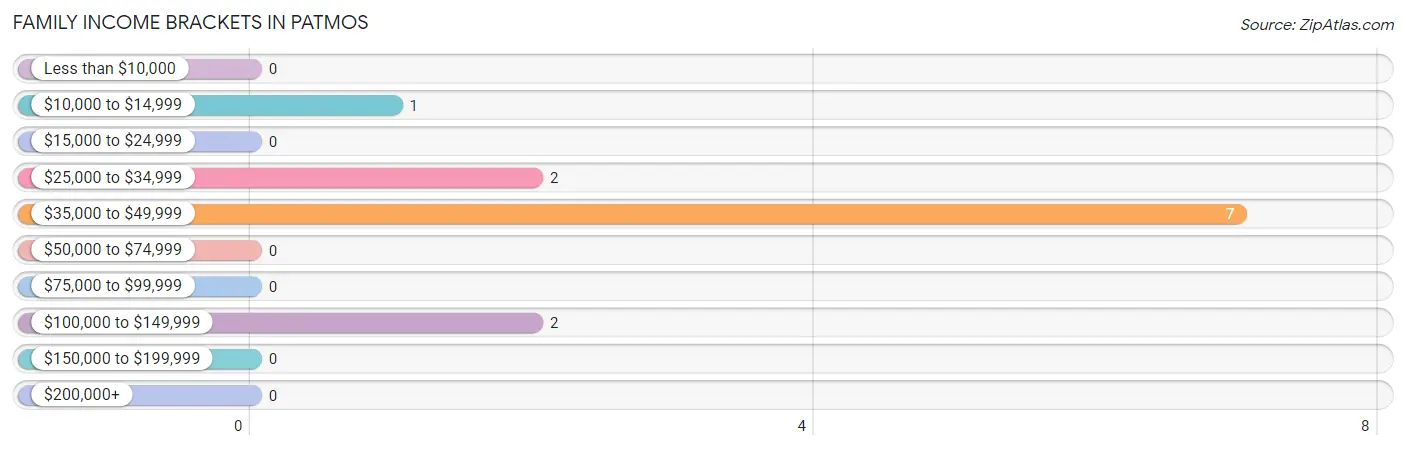
| Income Bracket | # Families | % Families |
| Less than $10,000 | 0 | 0.0% |
| $10,000 to $14,999 | 1 | 8.3% |
| $15,000 to $24,999 | 0 | 0.0% |
| $25,000 to $34,999 | 2 | 16.7% |
| $35,000 to $49,999 | 7 | 58.3% |
| $50,000 to $74,999 | 0 | 0.0% |
| $75,000 to $99,999 | 0 | 0.0% |
| $100,000 to $149,999 | 2 | 16.7% |
| $150,000 to $199,999 | 0 | 0.0% |
| $200,000+ | 0 | 0.0% |
Family Income by Famaliy Size in Patmos
2-person families (6 | 50.0%) account for the highest median family income in Patmos with $36,250 per family, while 2-person families (6 | 50.0%) have the highest median income of $18,125 per family member.
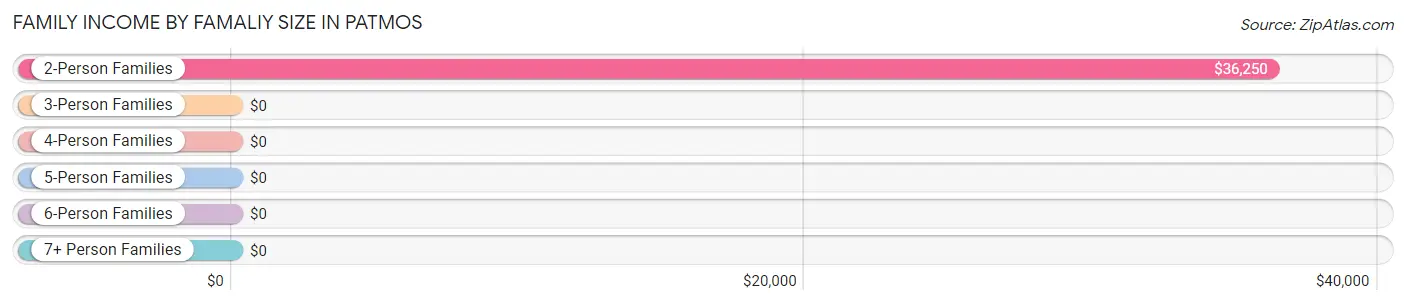
| Income Bracket | # Families | Median Income |
| 2-Person Families | 6 (50.0%) | $36,250 |
| 3-Person Families | 2 (16.7%) | $0 |
| 4-Person Families | 1 (8.3%) | $0 |
| 5-Person Families | 0 (0.0%) | $0 |
| 6-Person Families | 3 (25.0%) | $0 |
| 7+ Person Families | 0 (0.0%) | $0 |
| Total | 12 (100.0%) | $36,500 |
Family Income by Number of Earners in Patmos
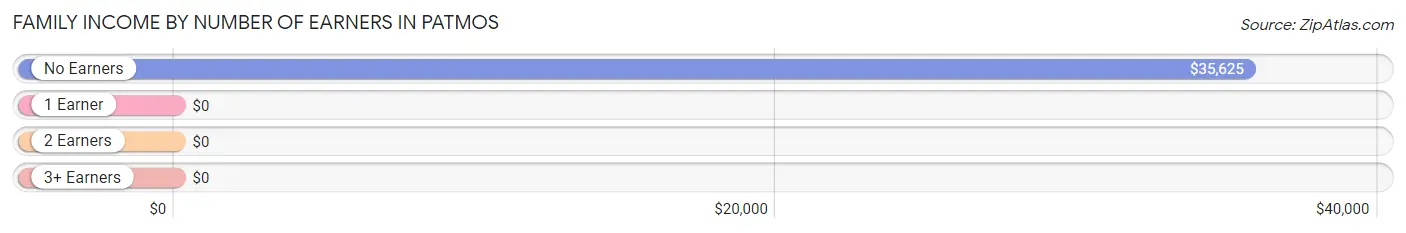
| Number of Earners | # Families | Median Income |
| No Earners | 7 (58.3%) | $35,625 |
| 1 Earner | 3 (25.0%) | $0 |
| 2 Earners | 2 (16.7%) | $0 |
| 3+ Earners | 0 (0.0%) | $0 |
| Total | 12 (100.0%) | $36,500 |
Household Income in Patmos
Household Income Brackets in Patmos
With 8 households falling in the category, the $25,000 to $34,999 income range is the most frequent in Patmos, accounting for 32.0% of all households.
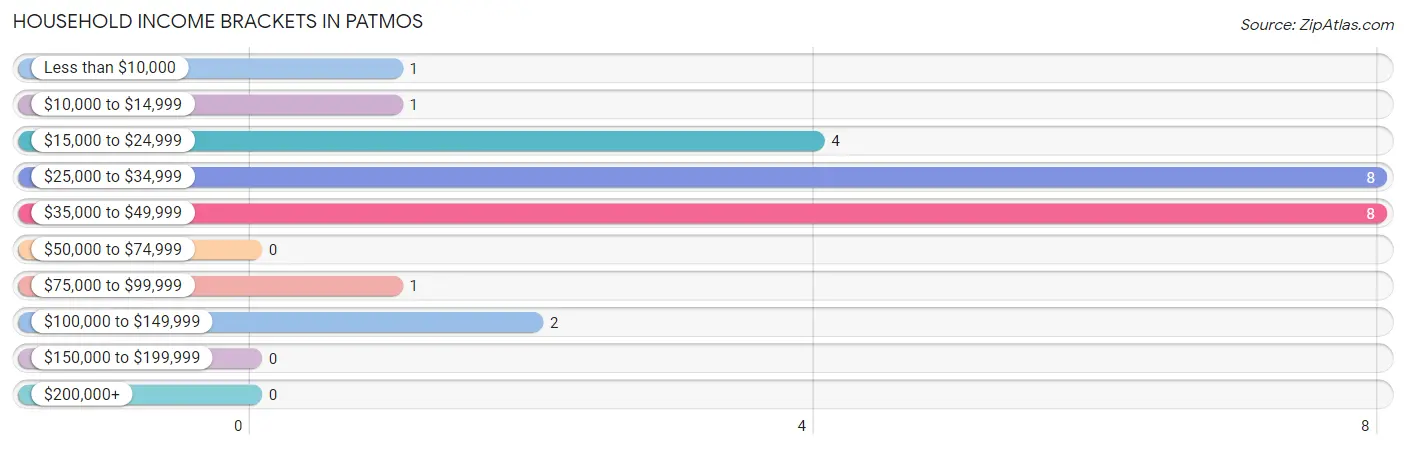
| Income Bracket | # Households | % Households |
| Less than $10,000 | 1 | 4.0% |
| $10,000 to $14,999 | 1 | 4.0% |
| $15,000 to $24,999 | 4 | 16.0% |
| $25,000 to $34,999 | 8 | 32.0% |
| $35,000 to $49,999 | 8 | 32.0% |
| $50,000 to $74,999 | 0 | 0.0% |
| $75,000 to $99,999 | 1 | 4.0% |
| $100,000 to $149,999 | 2 | 8.0% |
| $150,000 to $199,999 | 0 | 0.0% |
| $200,000+ | 0 | 0.0% |
Household Income by Householder Age in Patmos
The median household income in Patmos is $30,625, with the highest median household income of $38,750 found in the 45 to 64 years age bracket for the primary householder. A total of 7 households (28.0%) fall into this category.
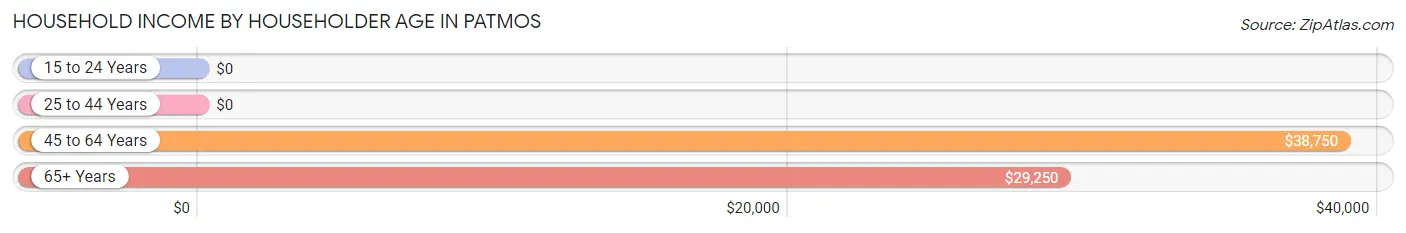
| Income Bracket | # Households | Median Income |
| 15 to 24 Years | 0 (0.0%) | $0 |
| 25 to 44 Years | 3 (12.0%) | $0 |
| 45 to 64 Years | 7 (28.0%) | $38,750 |
| 65+ Years | 15 (60.0%) | $29,250 |
| Total | 25 (100.0%) | $30,625 |
Poverty in Patmos
Income Below Poverty by Sex and Age in Patmos
With 56.4% poverty level for males and 50.0% for females among the residents of Patmos, under 5 year old males and under 5 year old females are the most vulnerable to poverty, with 9 males (100.0%) and 1 females (100.0%) in their respective age groups living below the poverty level.
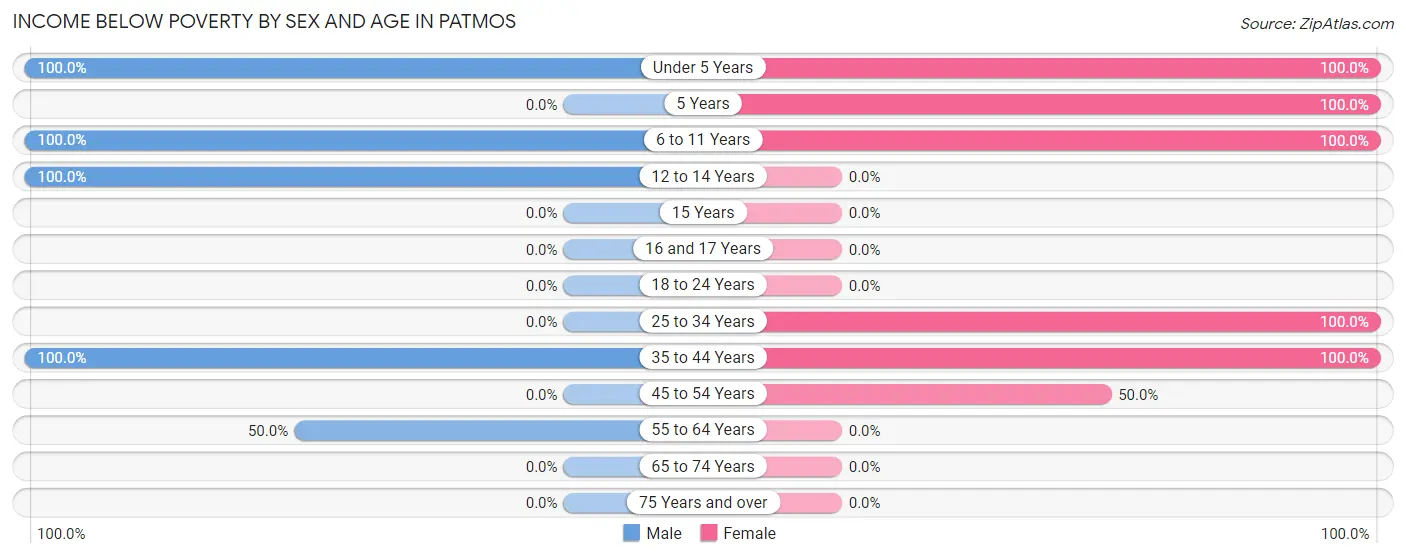
| Age Bracket | Male | Female |
| Under 5 Years | 9 (100.0%) | 1 (100.0%) |
| 5 Years | 0 (0.0%) | 4 (100.0%) |
| 6 to 11 Years | 5 (100.0%) | 1 (100.0%) |
| 12 to 14 Years | 4 (100.0%) | 0 (0.0%) |
| 15 Years | 0 (0.0%) | 0 (0.0%) |
| 16 and 17 Years | 0 (0.0%) | 0 (0.0%) |
| 18 to 24 Years | 0 (0.0%) | 0 (0.0%) |
| 25 to 34 Years | 0 (0.0%) | 3 (100.0%) |
| 35 to 44 Years | 3 (100.0%) | 3 (100.0%) |
| 45 to 54 Years | 0 (0.0%) | 1 (50.0%) |
| 55 to 64 Years | 1 (50.0%) | 0 (0.0%) |
| 65 to 74 Years | 0 (0.0%) | 0 (0.0%) |
| 75 Years and over | 0 (0.0%) | 0 (0.0%) |
| Total | 22 (56.4%) | 13 (50.0%) |
Income Above Poverty by Sex and Age in Patmos
According to the poverty statistics in Patmos, males aged 45 to 54 years and females aged 55 to 64 years are the age groups that are most secure financially, with 100.0% of males and 100.0% of females in these age groups living above the poverty line.
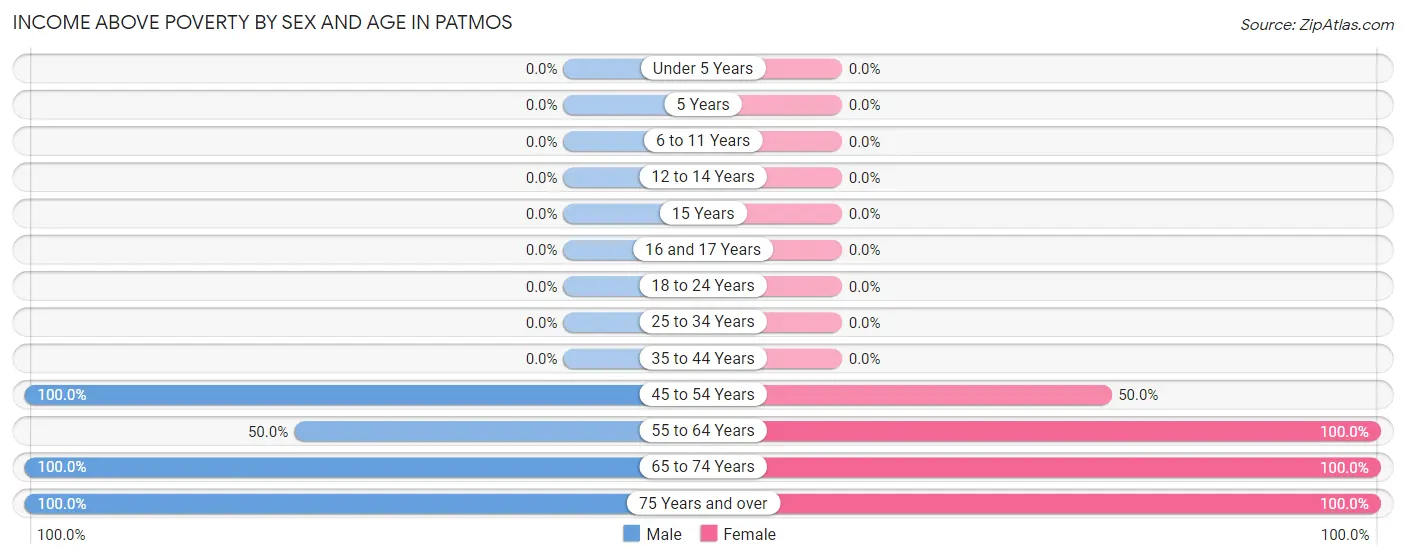
| Age Bracket | Male | Female |
| Under 5 Years | 0 (0.0%) | 0 (0.0%) |
| 5 Years | 0 (0.0%) | 0 (0.0%) |
| 6 to 11 Years | 0 (0.0%) | 0 (0.0%) |
| 12 to 14 Years | 0 (0.0%) | 0 (0.0%) |
| 15 Years | 0 (0.0%) | 0 (0.0%) |
| 16 and 17 Years | 0 (0.0%) | 0 (0.0%) |
| 18 to 24 Years | 0 (0.0%) | 0 (0.0%) |
| 25 to 34 Years | 0 (0.0%) | 0 (0.0%) |
| 35 to 44 Years | 0 (0.0%) | 0 (0.0%) |
| 45 to 54 Years | 6 (100.0%) | 1 (50.0%) |
| 55 to 64 Years | 1 (50.0%) | 5 (100.0%) |
| 65 to 74 Years | 6 (100.0%) | 2 (100.0%) |
| 75 Years and over | 4 (100.0%) | 5 (100.0%) |
| Total | 17 (43.6%) | 13 (50.0%) |
Income Below Poverty Among Married-Couple Families in Patmos
The poverty statistics for married-couple families in Patmos show that 27.3% or 3 of the total 11 families live below the poverty line. Families with 3 or 4 children have the highest poverty rate of 100.0%, comprising of 3 families. On the other hand, families with no children have the lowest poverty rate of 0.0%, which includes 0 families.
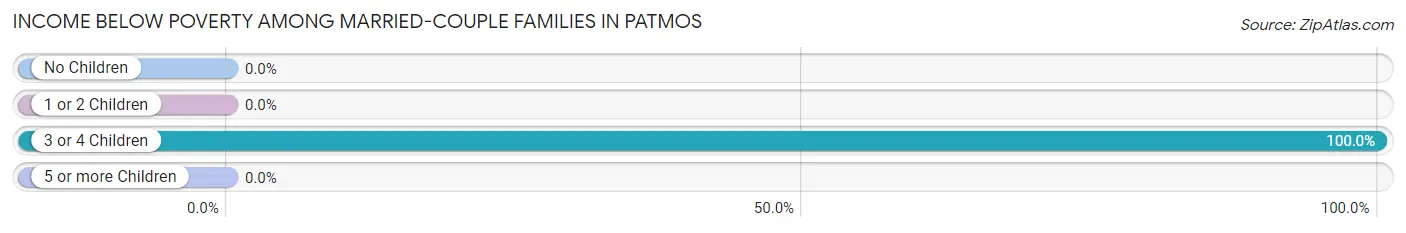
| Children | Above Poverty | Below Poverty |
| No Children | 8 (100.0%) | 0 (0.0%) |
| 1 or 2 Children | 0 (0.0%) | 0 (0.0%) |
| 3 or 4 Children | 0 (0.0%) | 3 (100.0%) |
| 5 or more Children | 0 (0.0%) | 0 (0.0%) |
| Total | 8 (72.7%) | 3 (27.3%) |
Income Below Poverty Among Single-Parent Households in Patmos
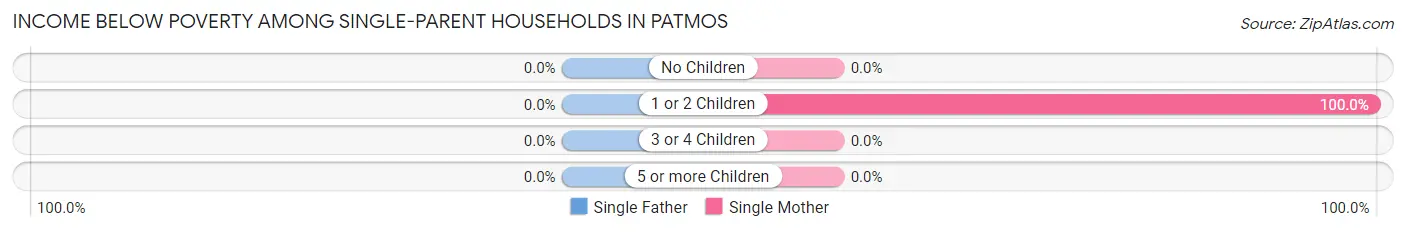
| Children | Single Father | Single Mother |
| No Children | 0 (0.0%) | 0 (0.0%) |
| 1 or 2 Children | 0 (0.0%) | 1 (100.0%) |
| 3 or 4 Children | 0 (0.0%) | 0 (0.0%) |
| 5 or more Children | 0 (0.0%) | 0 (0.0%) |
| Total | 0 (0.0%) | 1 (100.0%) |
Income Below Poverty Among Married-Couple vs Single-Parent Households in Patmos
The poverty data for Patmos shows that 3 of the married-couple family households (27.3%) and 1 of the single-parent households (100.0%) are living below the poverty level. Within the married-couple family households, those with 3 or 4 children have the highest poverty rate, with 3 households (100.0%) falling below the poverty line. Among the single-parent households, those with 1 or 2 children have the highest poverty rate, with 1 household (100.0%) living below poverty.
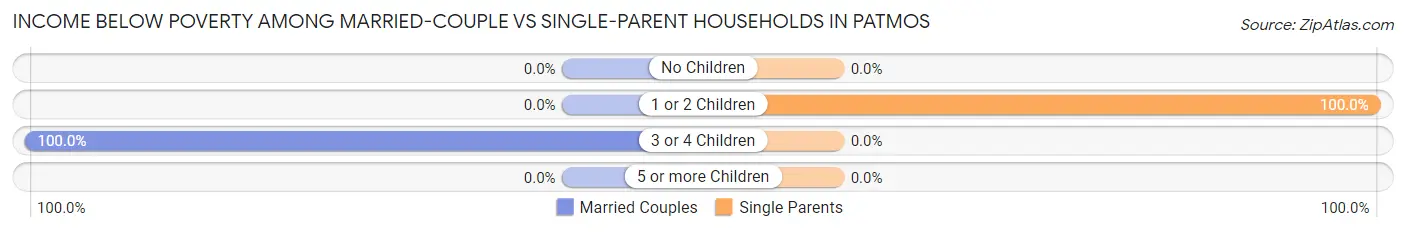
| Children | Married-Couple Families | Single-Parent Households |
| No Children | 0 (0.0%) | 0 (0.0%) |
| 1 or 2 Children | 0 (0.0%) | 1 (100.0%) |
| 3 or 4 Children | 3 (100.0%) | 0 (0.0%) |
| 5 or more Children | 0 (0.0%) | 0 (0.0%) |
| Total | 3 (27.3%) | 1 (100.0%) |
Race in Patmos
The most populous races in Patmos are White / Caucasian (63 | 96.9%), Two or more Races (2 | 3.1%), and Hispanic or Latino (1 | 1.5%).
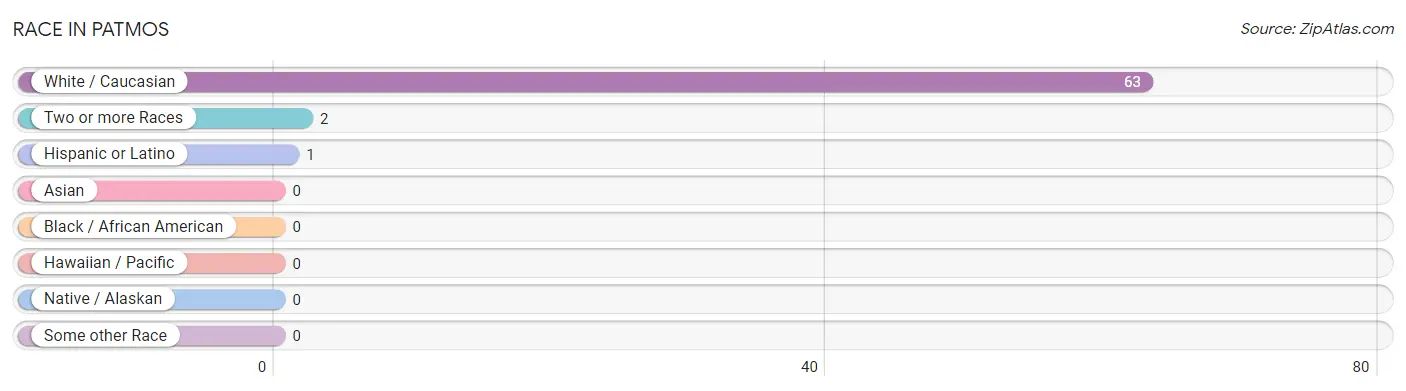
| Race | # Population | % Population |
| Asian | 0 | 0.0% |
| Black / African American | 0 | 0.0% |
| Hawaiian / Pacific | 0 | 0.0% |
| Hispanic or Latino | 1 | 1.5% |
| Native / Alaskan | 0 | 0.0% |
| White / Caucasian | 63 | 96.9% |
| Two or more Races | 2 | 3.1% |
| Some other Race | 0 | 0.0% |
| Total | 65 | 100.0% |
Ancestry in Patmos
The most populous ancestries reported in Patmos are German (10 | 15.4%), English (8 | 12.3%), Italian (5 | 7.7%), American (3 | 4.6%), and Cherokee (1 | 1.5%), together accounting for 41.5% of all Patmos residents.
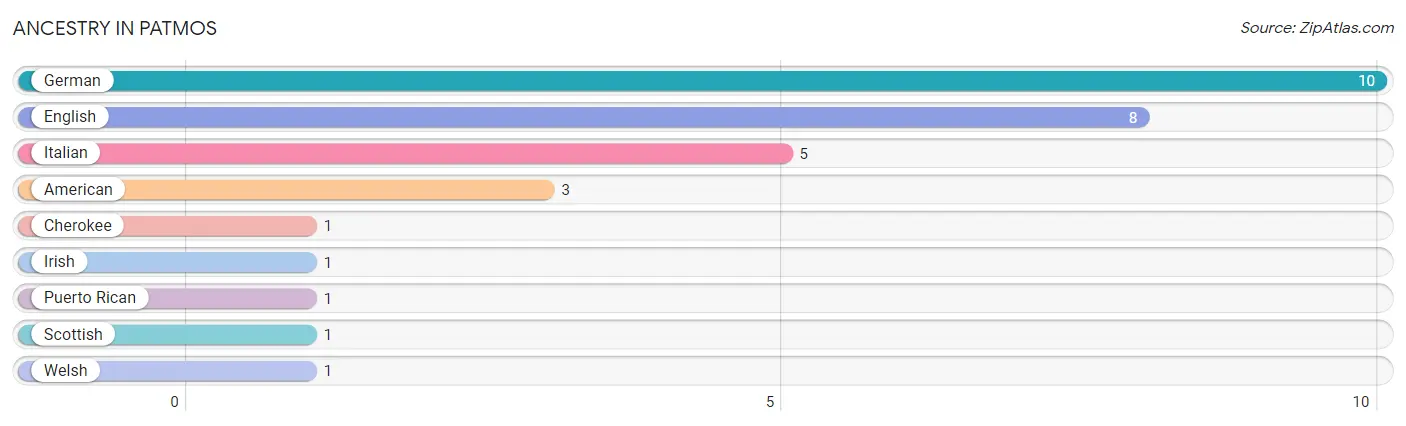
| Ancestry | # Population | % Population |
| American | 3 | 4.6% |
| Cherokee | 1 | 1.5% |
| English | 8 | 12.3% |
| German | 10 | 15.4% |
| Irish | 1 | 1.5% |
| Italian | 5 | 7.7% |
| Puerto Rican | 1 | 1.5% |
| Scottish | 1 | 1.5% |
| Welsh | 1 | 1.5% | View All 9 Rows |
Immigrants in Patmos

| Immigration Origin | # Population | % Population | View All 0 Rows |
Sex and Age in Patmos
Sex and Age in Patmos
The most populous age groups in Patmos are Under 5 Years (9 | 23.1%) for men and 5 to 9 Years (5 | 19.2%) for women.
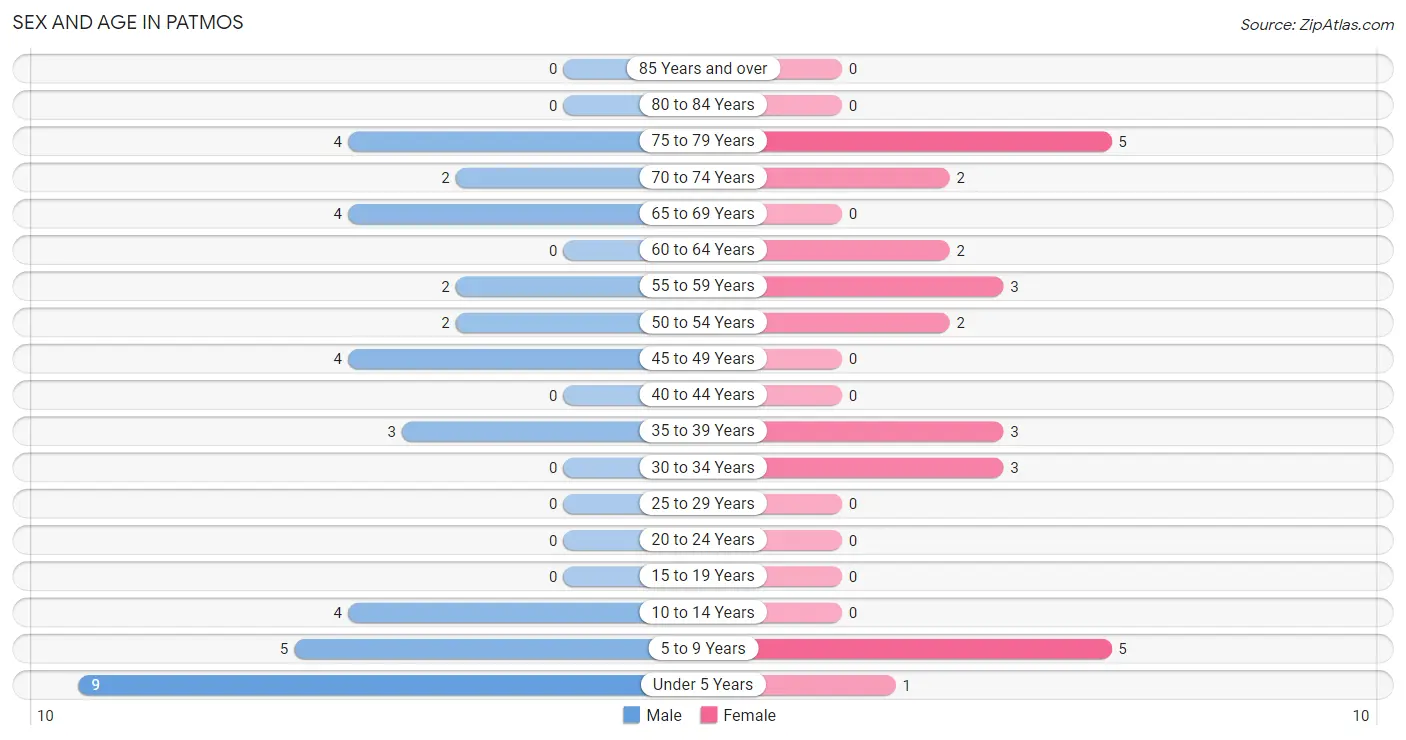
| Age Bracket | Male | Female |
| Under 5 Years | 9 (23.1%) | 1 (3.8%) |
| 5 to 9 Years | 5 (12.8%) | 5 (19.2%) |
| 10 to 14 Years | 4 (10.3%) | 0 (0.0%) |
| 15 to 19 Years | 0 (0.0%) | 0 (0.0%) |
| 20 to 24 Years | 0 (0.0%) | 0 (0.0%) |
| 25 to 29 Years | 0 (0.0%) | 0 (0.0%) |
| 30 to 34 Years | 0 (0.0%) | 3 (11.5%) |
| 35 to 39 Years | 3 (7.7%) | 3 (11.5%) |
| 40 to 44 Years | 0 (0.0%) | 0 (0.0%) |
| 45 to 49 Years | 4 (10.3%) | 0 (0.0%) |
| 50 to 54 Years | 2 (5.1%) | 2 (7.7%) |
| 55 to 59 Years | 2 (5.1%) | 3 (11.5%) |
| 60 to 64 Years | 0 (0.0%) | 2 (7.7%) |
| 65 to 69 Years | 4 (10.3%) | 0 (0.0%) |
| 70 to 74 Years | 2 (5.1%) | 2 (7.7%) |
| 75 to 79 Years | 4 (10.3%) | 5 (19.2%) |
| 80 to 84 Years | 0 (0.0%) | 0 (0.0%) |
| 85 Years and over | 0 (0.0%) | 0 (0.0%) |
| Total | 39 (100.0%) | 26 (100.0%) |
Families and Households in Patmos
Median Family Size in Patmos
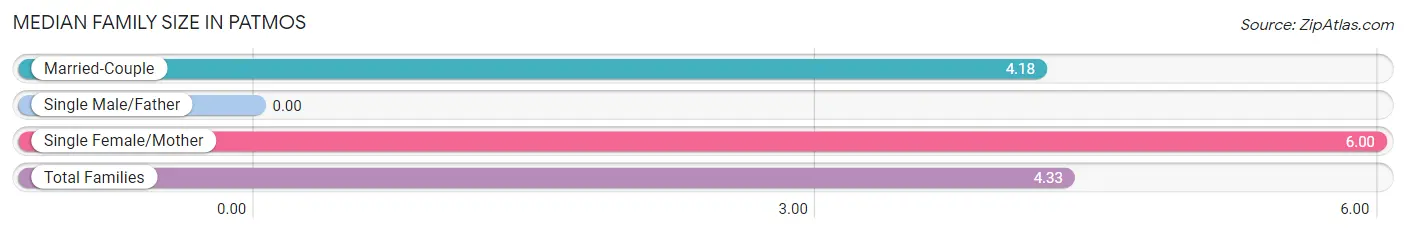
| Family Type | # Families | Family Size |
| Married-Couple | 11 (91.7%) | 4.18 |
| Single Male/Father | 0 (0.0%) | - |
| Single Female/Mother | 1 (8.3%) | 6.00 |
| Total Families | 12 (100.0%) | 4.33 |
Median Household Size in Patmos
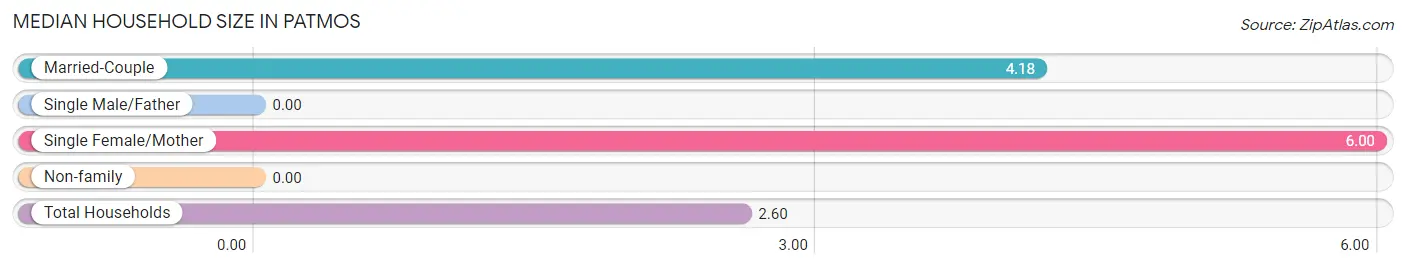
| Household Type | # Households | Household Size |
| Married-Couple | 11 (44.0%) | 4.18 |
| Single Male/Father | 0 (0.0%) | - |
| Single Female/Mother | 1 (4.0%) | 6.00 |
| Non-family | 13 (52.0%) | - |
| Total Households | 25 (100.0%) | 2.60 |
Household Size by Marriage Status in Patmos
Out of a total of 25 households in Patmos, 12 (48.0%) are family households, while 13 (52.0%) are nonfamily households. The most numerous type of family households are 2-person households, comprising 6, and the most common type of nonfamily households are 1-person households, comprising 13.
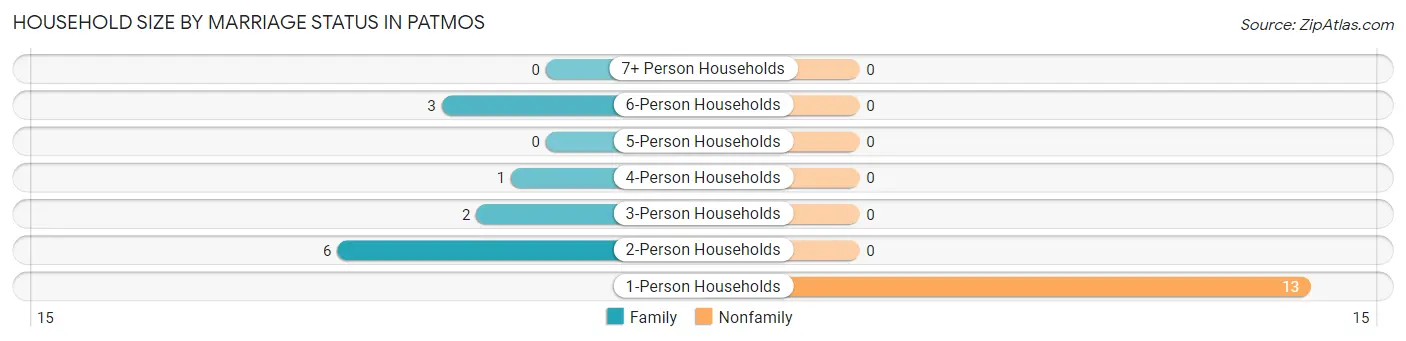
| Household Size | Family Households | Nonfamily Households |
| 1-Person Households | - | 13 (52.0%) |
| 2-Person Households | 6 (24.0%) | 0 (0.0%) |
| 3-Person Households | 2 (8.0%) | 0 (0.0%) |
| 4-Person Households | 1 (4.0%) | 0 (0.0%) |
| 5-Person Households | 0 (0.0%) | 0 (0.0%) |
| 6-Person Households | 3 (12.0%) | 0 (0.0%) |
| 7+ Person Households | 0 (0.0%) | 0 (0.0%) |
| Total | 12 (48.0%) | 13 (52.0%) |
Female Fertility in Patmos
Fertility by Age in Patmos
| Age Bracket | Women with Births | Births / 1,000 Women |
| 15 to 19 years | 0 (0.0%) | 0.0 |
| 20 to 34 years | 0 (0.0%) | 0.0 |
| 35 to 50 years | 0 (0.0%) | 0.0 |
| Total | 0 (0.0%) | 0.0 |
Fertility by Age by Marriage Status in Patmos
| Age Bracket | Married | Unmarried |
| 15 to 19 years | 0 (0.0%) | 0 (0.0%) |
| 20 to 34 years | 0 (0.0%) | 0 (0.0%) |
| 35 to 50 years | 0 (0.0%) | 0 (0.0%) |
| Total | 0 (0.0%) | 0 (0.0%) |
Fertility by Education in Patmos
| Educational Attainment | Women with Births | Births / 1,000 Women |
| Less than High School | 0 (0.0%) | 0.0 |
| High School Diploma | 0 (0.0%) | 0.0 |
| College or Associate's Degree | 0 (0.0%) | 0.0 |
| Bachelor's Degree | 0 (0.0%) | 0.0 |
| Graduate Degree | 0 (0.0%) | 0.0 |
| Total | 0 (0.0%) | 0.0 |
Fertility by Education by Marriage Status in Patmos
| Educational Attainment | Married | Unmarried |
| Less than High School | 0 (0.0%) | 0 (0.0%) |
| High School Diploma | 0 (0.0%) | 0 (0.0%) |
| College or Associate's Degree | 0 (0.0%) | 0 (0.0%) |
| Bachelor's Degree | 0 (0.0%) | 0 (0.0%) |
| Graduate Degree | 0 (0.0%) | 0 (0.0%) |
| Total | 0 (0.0%) | 0 (0.0%) |
Employment Characteristics in Patmos
Employment by Class of Employer in Patmos
Among the 11 employed individuals in Patmos, private company employees (10 | 90.9%), and federal government employees (1 | 9.1%) make up the most common classes of employment.
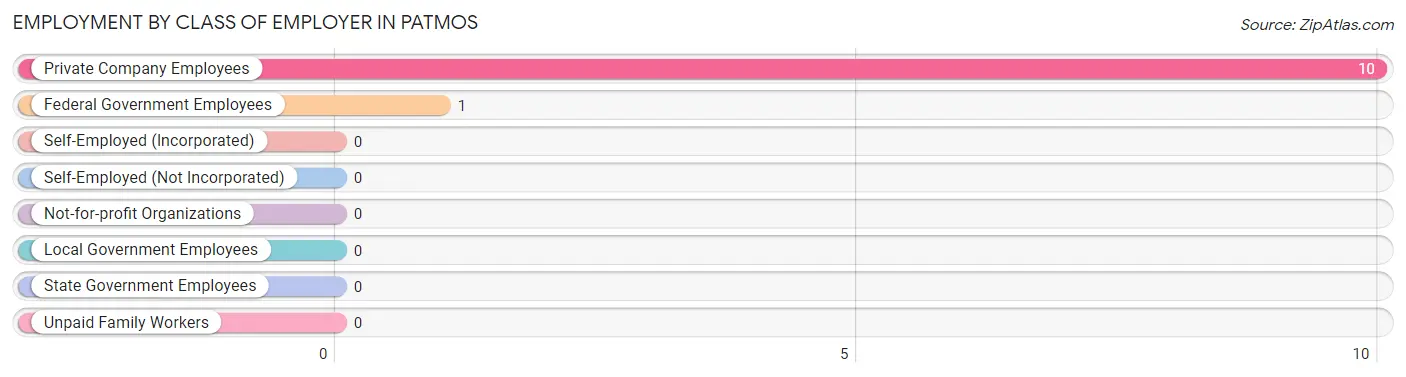
| Employer Class | # Employees | % Employees |
| Private Company Employees | 10 | 90.9% |
| Self-Employed (Incorporated) | 0 | 0.0% |
| Self-Employed (Not Incorporated) | 0 | 0.0% |
| Not-for-profit Organizations | 0 | 0.0% |
| Local Government Employees | 0 | 0.0% |
| State Government Employees | 0 | 0.0% |
| Federal Government Employees | 1 | 9.1% |
| Unpaid Family Workers | 0 | 0.0% |
| Total | 11 | 100.0% |
Employment Status by Age in Patmos
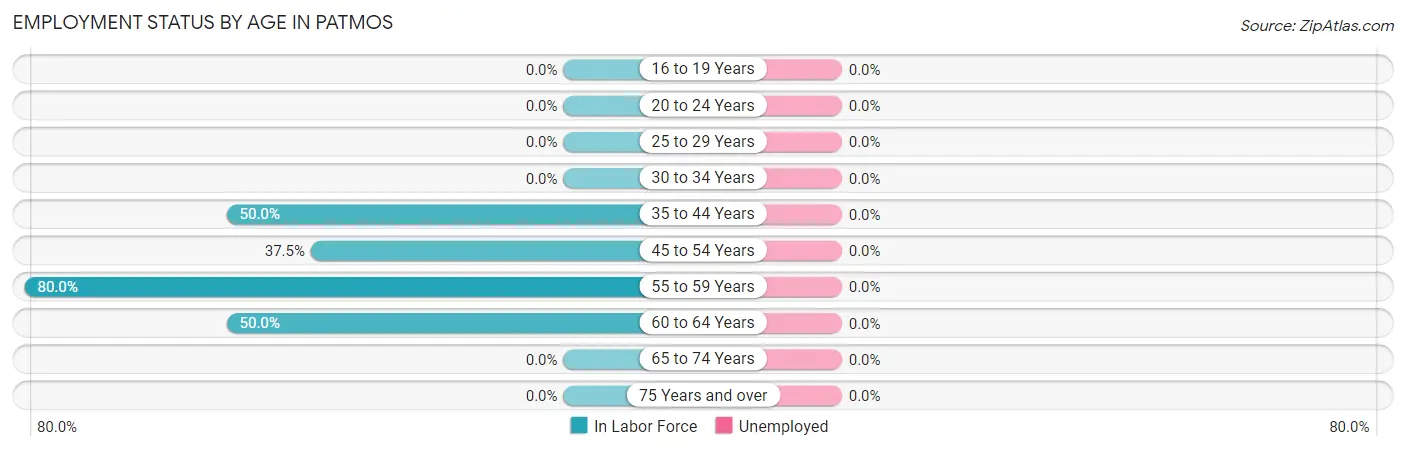
| Age Bracket | In Labor Force | Unemployed |
| 16 to 19 Years | 0 (0.0%) | 0 (0.0%) |
| 20 to 24 Years | 0 (0.0%) | 0 (0.0%) |
| 25 to 29 Years | 0 (0.0%) | 0 (0.0%) |
| 30 to 34 Years | 0 (0.0%) | 0 (0.0%) |
| 35 to 44 Years | 3 (50.0%) | 0 (0.0%) |
| 45 to 54 Years | 3 (37.5%) | 0 (0.0%) |
| 55 to 59 Years | 4 (80.0%) | 0 (0.0%) |
| 60 to 64 Years | 1 (50.0%) | 0 (0.0%) |
| 65 to 74 Years | 0 (0.0%) | 0 (0.0%) |
| 75 Years and over | 0 (0.0%) | 0 (0.0%) |
| Total | 11 (26.8%) | 0 (0.0%) |
Employment Status by Educational Attainment in Patmos
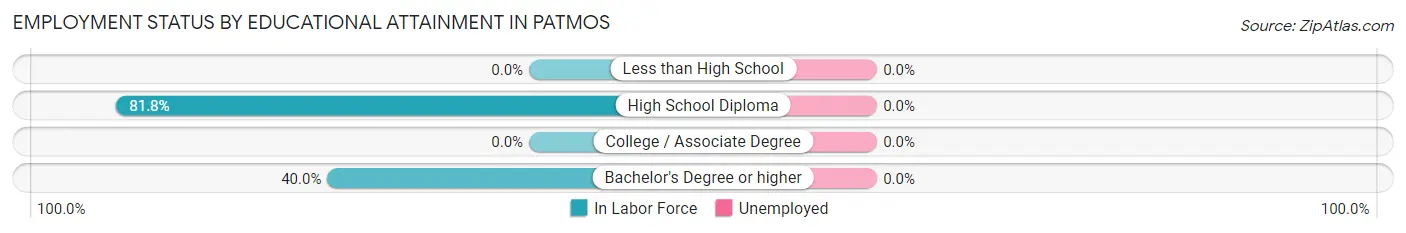
| Educational Attainment | In Labor Force | Unemployed |
| Less than High School | 0 (0.0%) | 0 (0.0%) |
| High School Diploma | 9 (81.8%) | 0 (0.0%) |
| College / Associate Degree | 0 (0.0%) | 0 (0.0%) |
| Bachelor's Degree or higher | 2 (40.0%) | 0 (0.0%) |
| Total | 11 (45.8%) | 0 (0.0%) |
Employment Occupations by Sex in Patmos
Management, Business, Science and Arts Occupations
The most common Management, Business, Science and Arts occupations in Patmos are Computers, Engineering & Science (4 | 36.4%), and Architecture & Engineering (4 | 36.4%).
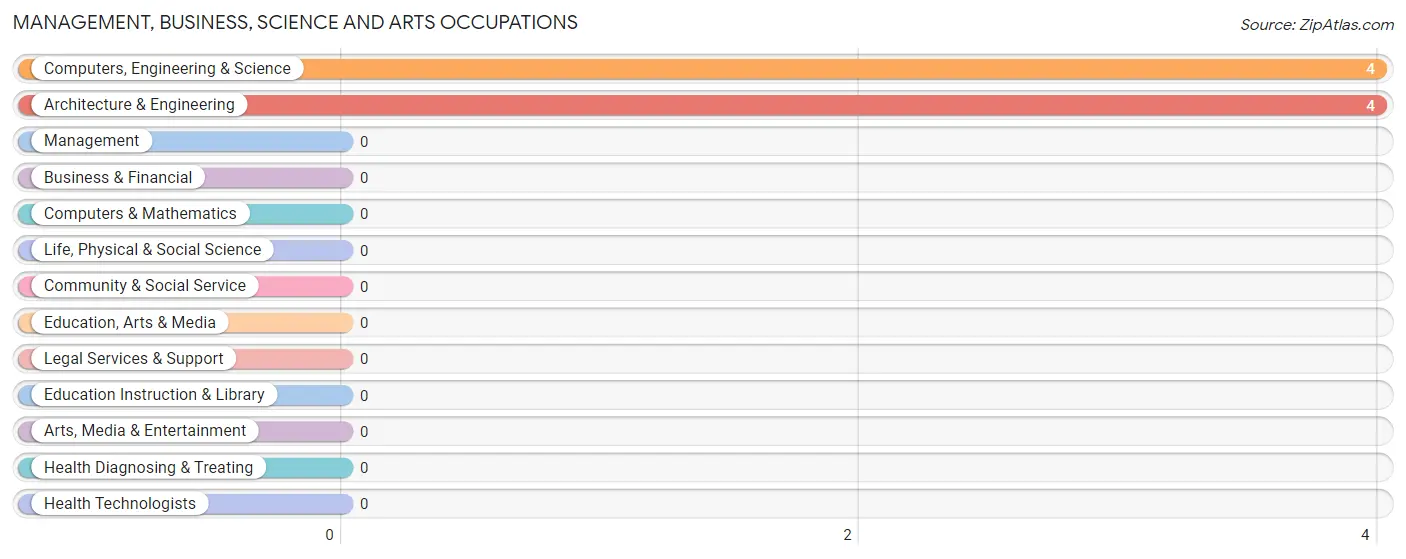
Management, Business, Science and Arts Occupations by Sex
Within the Management, Business, Science and Arts occupations in Patmos, the most male-oriented occupations are Computers, Engineering & Science (75.0%), and Architecture & Engineering (75.0%), while the most female-oriented occupations are Computers, Engineering & Science (25.0%), and Architecture & Engineering (25.0%).
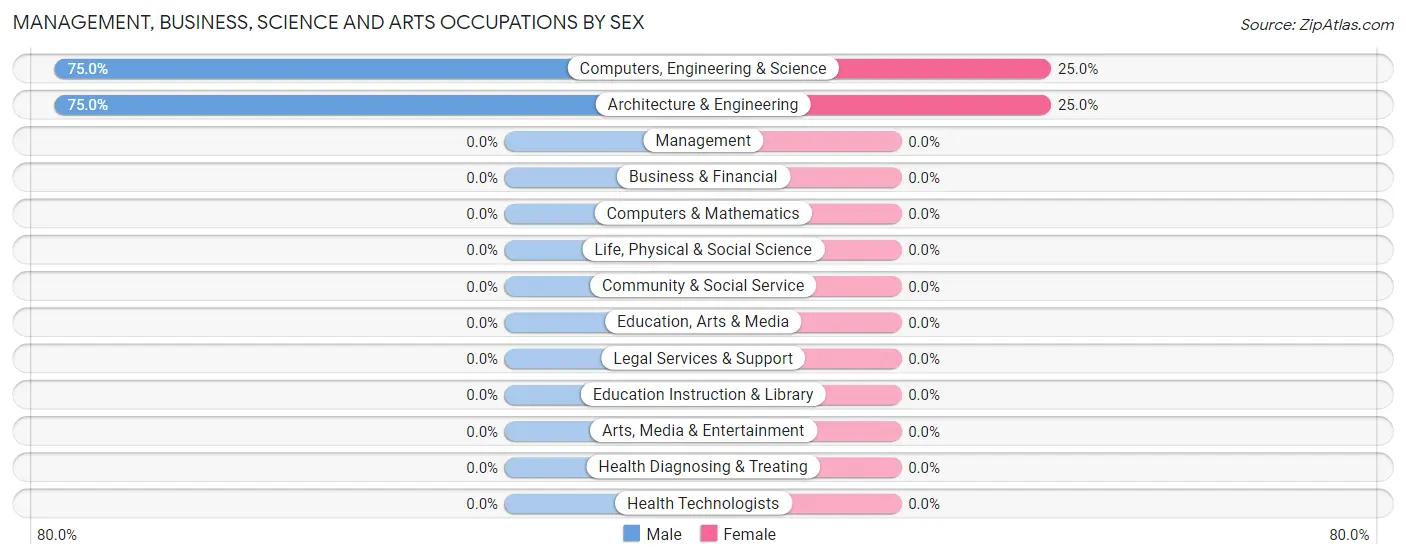
| Occupation | Male | Female |
| Management | 0 (0.0%) | 0 (0.0%) |
| Business & Financial | 0 (0.0%) | 0 (0.0%) |
| Computers, Engineering & Science | 3 (75.0%) | 1 (25.0%) |
| Computers & Mathematics | 0 (0.0%) | 0 (0.0%) |
| Architecture & Engineering | 3 (75.0%) | 1 (25.0%) |
| Life, Physical & Social Science | 0 (0.0%) | 0 (0.0%) |
| Community & Social Service | 0 (0.0%) | 0 (0.0%) |
| Education, Arts & Media | 0 (0.0%) | 0 (0.0%) |
| Legal Services & Support | 0 (0.0%) | 0 (0.0%) |
| Education Instruction & Library | 0 (0.0%) | 0 (0.0%) |
| Arts, Media & Entertainment | 0 (0.0%) | 0 (0.0%) |
| Health Diagnosing & Treating | 0 (0.0%) | 0 (0.0%) |
| Health Technologists | 0 (0.0%) | 0 (0.0%) |
| Total (Category) | 3 (75.0%) | 1 (25.0%) |
| Total (Overall) | 6 (54.5%) | 5 (45.5%) |
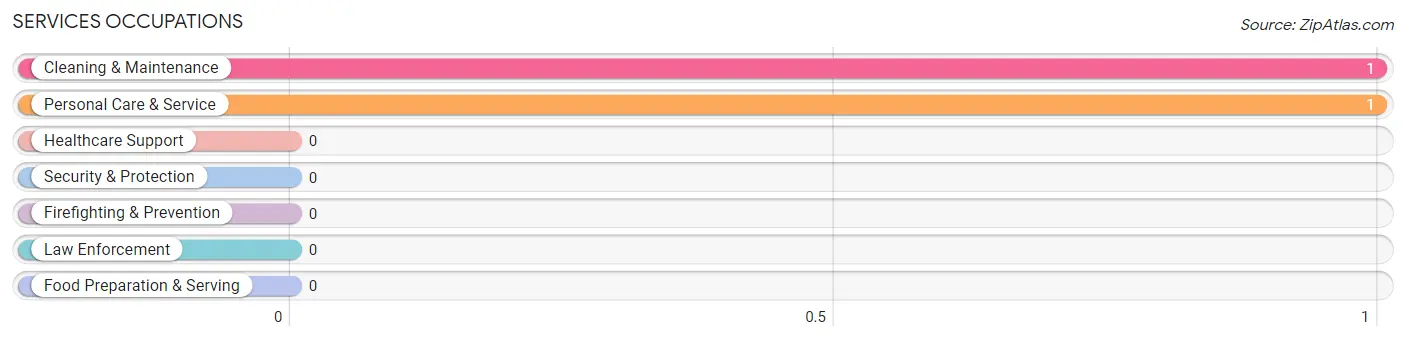
Services Occupations
The most common Services occupations in Patmos are Cleaning & Maintenance (1 | 9.1%), and Personal Care & Service (1 | 9.1%).
Services Occupations by Sex
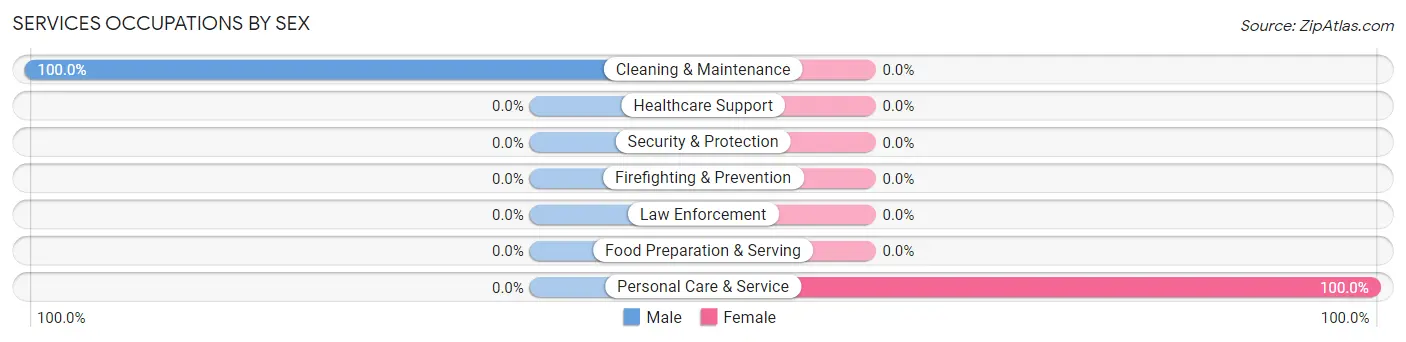
| Occupation | Male | Female |
| Healthcare Support | 0 (0.0%) | 0 (0.0%) |
| Security & Protection | 0 (0.0%) | 0 (0.0%) |
| Firefighting & Prevention | 0 (0.0%) | 0 (0.0%) |
| Law Enforcement | 0 (0.0%) | 0 (0.0%) |
| Food Preparation & Serving | 0 (0.0%) | 0 (0.0%) |
| Cleaning & Maintenance | 1 (100.0%) | 0 (0.0%) |
| Personal Care & Service | 0 (0.0%) | 1 (100.0%) |
| Total (Category) | 1 (50.0%) | 1 (50.0%) |
| Total (Overall) | 6 (54.5%) | 5 (45.5%) |
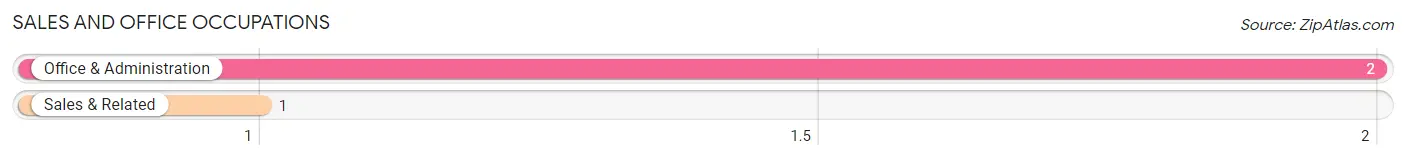
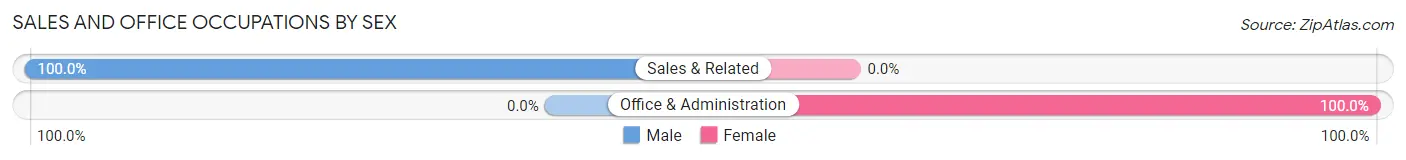
Sales and Office Occupations
The most common Sales and Office occupations in Patmos are Office & Administration (2 | 18.2%), and Sales & Related (1 | 9.1%).
Sales and Office Occupations by Sex
| Occupation | Male | Female |
| Sales & Related | 1 (100.0%) | 0 (0.0%) |
| Office & Administration | 0 (0.0%) | 2 (100.0%) |
| Total (Category) | 1 (33.3%) | 2 (66.7%) |
| Total (Overall) | 6 (54.5%) | 5 (45.5%) |
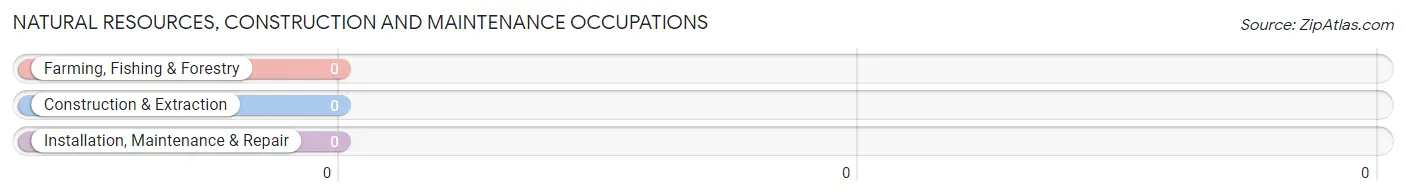
Natural Resources, Construction and Maintenance Occupations
Natural Resources, Construction and Maintenance Occupations by Sex
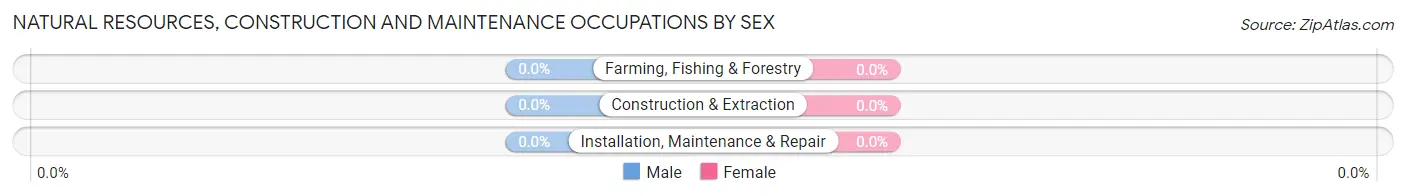
| Occupation | Male | Female |
| Farming, Fishing & Forestry | 0 (0.0%) | 0 (0.0%) |
| Construction & Extraction | 0 (0.0%) | 0 (0.0%) |
| Installation, Maintenance & Repair | 0 (0.0%) | 0 (0.0%) |
| Total (Category) | 0 (0.0%) | 0 (0.0%) |
| Total (Overall) | 6 (54.5%) | 5 (45.5%) |
Production, Transportation and Moving Occupations
The most common Production, Transportation and Moving occupations in Patmos are , and Production (2 | 18.2%).
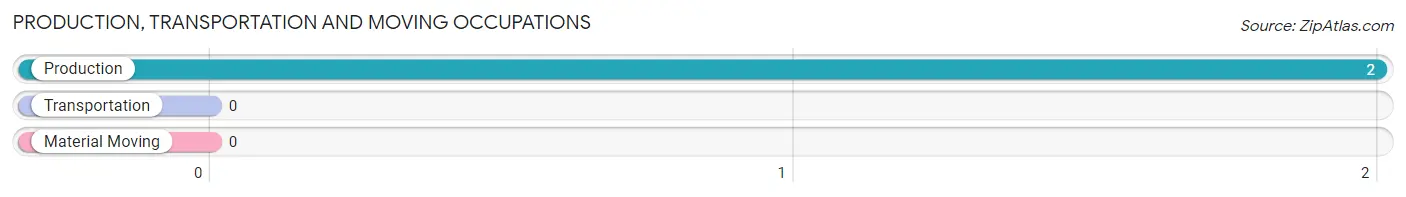
Production, Transportation and Moving Occupations by Sex
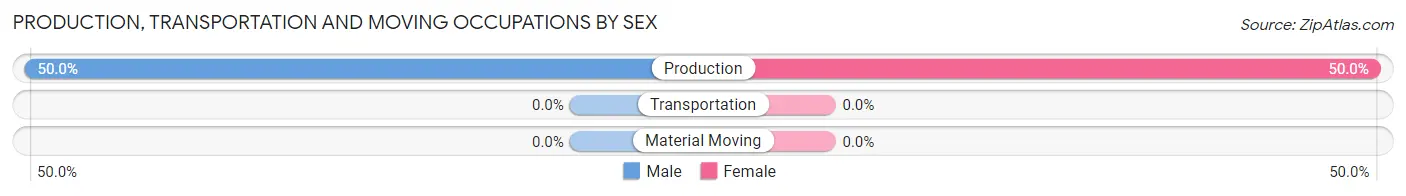
| Occupation | Male | Female |
| Production | 1 (50.0%) | 1 (50.0%) |
| Transportation | 0 (0.0%) | 0 (0.0%) |
| Material Moving | 0 (0.0%) | 0 (0.0%) |
| Total (Category) | 1 (50.0%) | 1 (50.0%) |
| Total (Overall) | 6 (54.5%) | 5 (45.5%) |
Employment Industries by Sex in Patmos
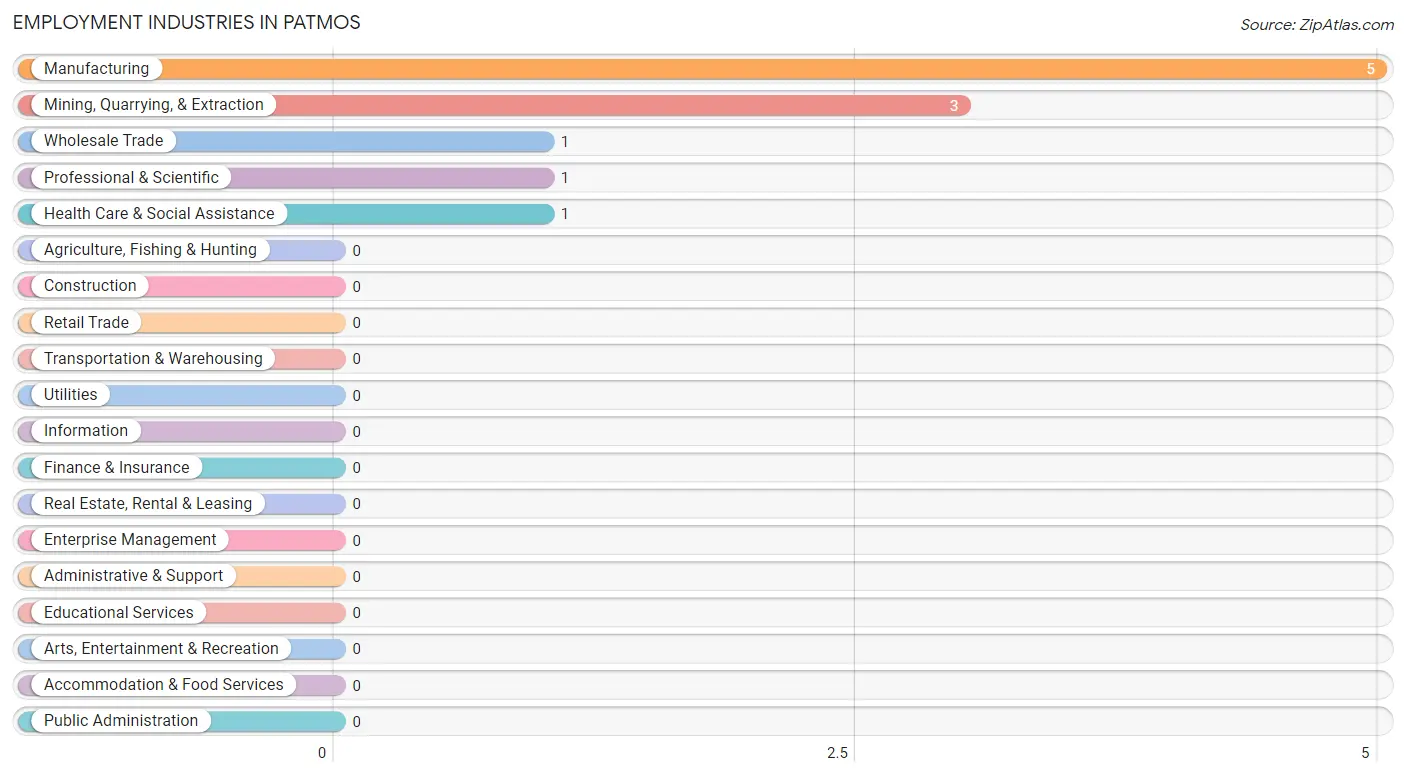
Employment Industries in Patmos
The major employment industries in Patmos include Manufacturing (5 | 45.5%), Mining, Quarrying, & Extraction (3 | 27.3%), Wholesale Trade (1 | 9.1%), Professional & Scientific (1 | 9.1%), and Health Care & Social Assistance (1 | 9.1%).
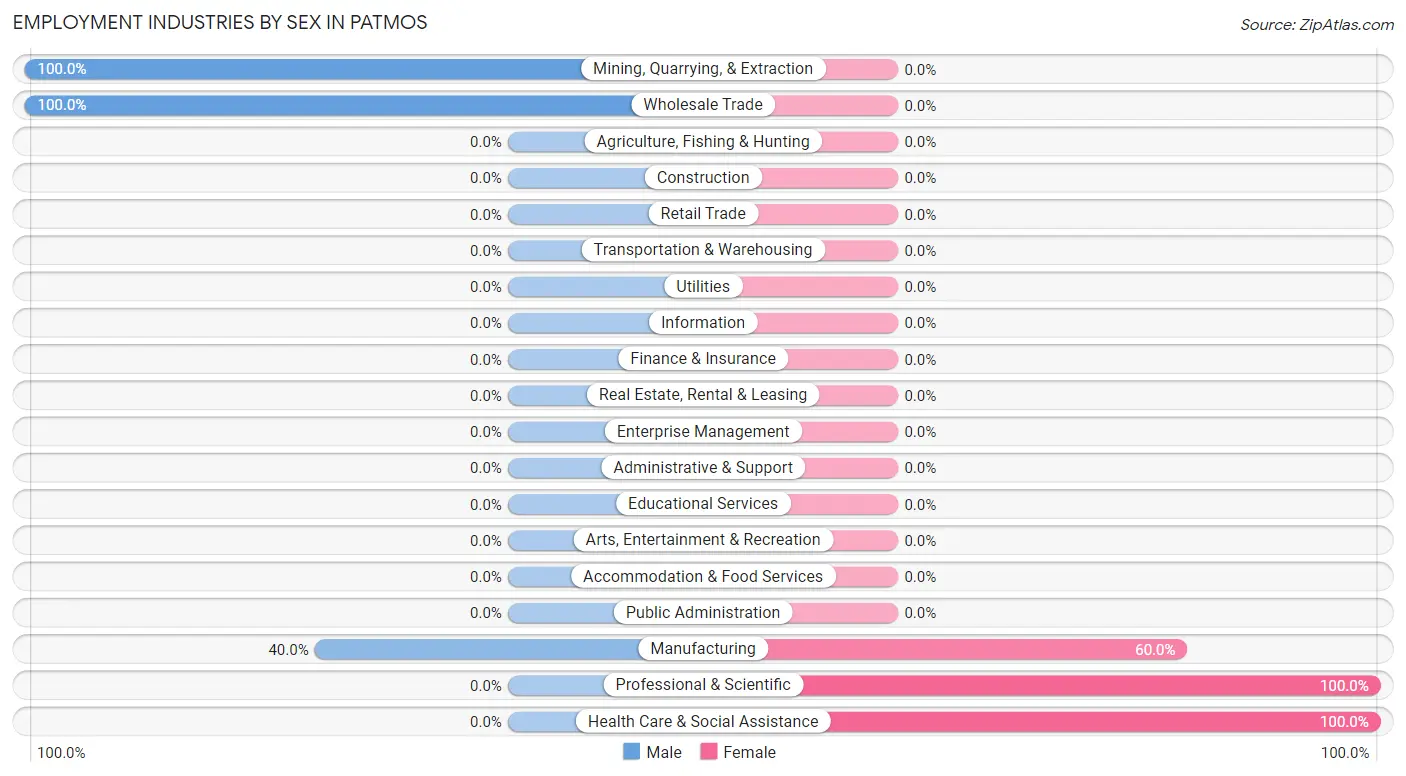
Employment Industries by Sex in Patmos
The Patmos industries that see more men than women are Mining, Quarrying, & Extraction (100.0%), Wholesale Trade (100.0%), and Manufacturing (40.0%), whereas the industries that tend to have a higher number of women are Professional & Scientific (100.0%), Health Care & Social Assistance (100.0%), and Manufacturing (60.0%).
| Industry | Male | Female |
| Agriculture, Fishing & Hunting | 0 (0.0%) | 0 (0.0%) |
| Mining, Quarrying, & Extraction | 3 (100.0%) | 0 (0.0%) |
| Construction | 0 (0.0%) | 0 (0.0%) |
| Manufacturing | 2 (40.0%) | 3 (60.0%) |
| Wholesale Trade | 1 (100.0%) | 0 (0.0%) |
| Retail Trade | 0 (0.0%) | 0 (0.0%) |
| Transportation & Warehousing | 0 (0.0%) | 0 (0.0%) |
| Utilities | 0 (0.0%) | 0 (0.0%) |
| Information | 0 (0.0%) | 0 (0.0%) |
| Finance & Insurance | 0 (0.0%) | 0 (0.0%) |
| Real Estate, Rental & Leasing | 0 (0.0%) | 0 (0.0%) |
| Professional & Scientific | 0 (0.0%) | 1 (100.0%) |
| Enterprise Management | 0 (0.0%) | 0 (0.0%) |
| Administrative & Support | 0 (0.0%) | 0 (0.0%) |
| Educational Services | 0 (0.0%) | 0 (0.0%) |
| Health Care & Social Assistance | 0 (0.0%) | 1 (100.0%) |
| Arts, Entertainment & Recreation | 0 (0.0%) | 0 (0.0%) |
| Accommodation & Food Services | 0 (0.0%) | 0 (0.0%) |
| Public Administration | 0 (0.0%) | 0 (0.0%) |
| Total | 6 (54.5%) | 5 (45.5%) |
Education in Patmos
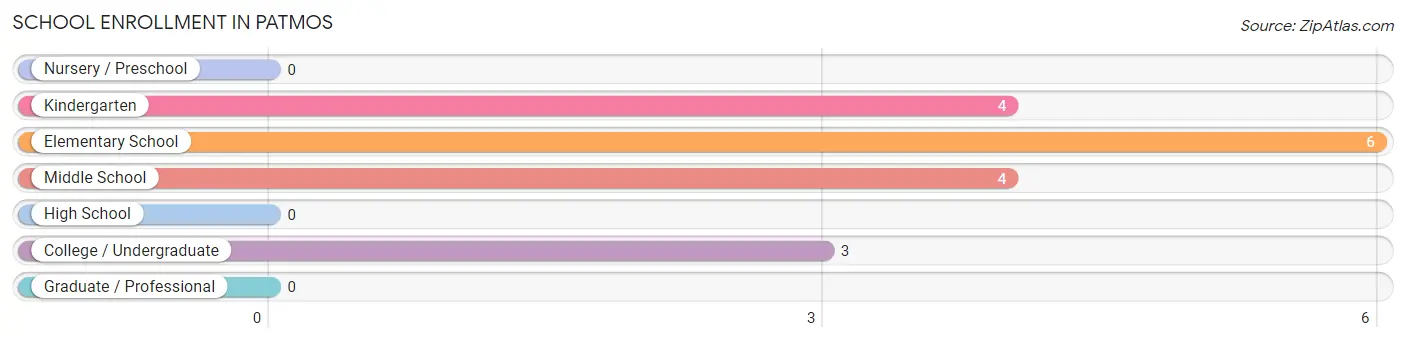
School Enrollment in Patmos
The most common levels of schooling among the 17 students in Patmos are elementary school (6 | 35.3%), kindergarten (4 | 23.5%), and middle school (4 | 23.5%).
| School Level | # Students | % Students |
| Nursery / Preschool | 0 | 0.0% |
| Kindergarten | 4 | 23.5% |
| Elementary School | 6 | 35.3% |
| Middle School | 4 | 23.5% |
| High School | 0 | 0.0% |
| College / Undergraduate | 3 | 17.6% |
| Graduate / Professional | 0 | 0.0% |
| Total | 17 | 100.0% |
School Enrollment by Age by Funding Source in Patmos
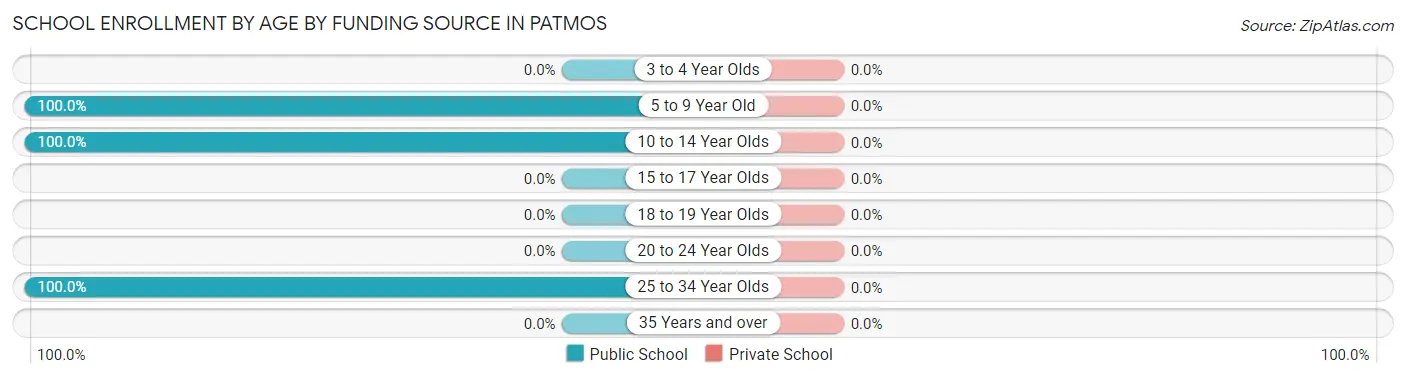
| Age Bracket | Public School | Private School |
| 3 to 4 Year Olds | 0 (0.0%) | 0 (0.0%) |
| 5 to 9 Year Old | 10 (100.0%) | 0 (0.0%) |
| 10 to 14 Year Olds | 4 (100.0%) | 0 (0.0%) |
| 15 to 17 Year Olds | 0 (0.0%) | 0 (0.0%) |
| 18 to 19 Year Olds | 0 (0.0%) | 0 (0.0%) |
| 20 to 24 Year Olds | 0 (0.0%) | 0 (0.0%) |
| 25 to 34 Year Olds | 3 (100.0%) | 0 (0.0%) |
| 35 Years and over | 0 (0.0%) | 0 (0.0%) |
| Total | 17 (100.0%) | 0 (0.0%) |
Educational Attainment by Field of Study in Patmos
Psychology (3 | 37.5%), arts & humanities (3 | 37.5%), engineering (1 | 12.5%), and business (1 | 12.5%) are the most common fields of study among 8 individuals in Patmos who have obtained a bachelor's degree or higher.
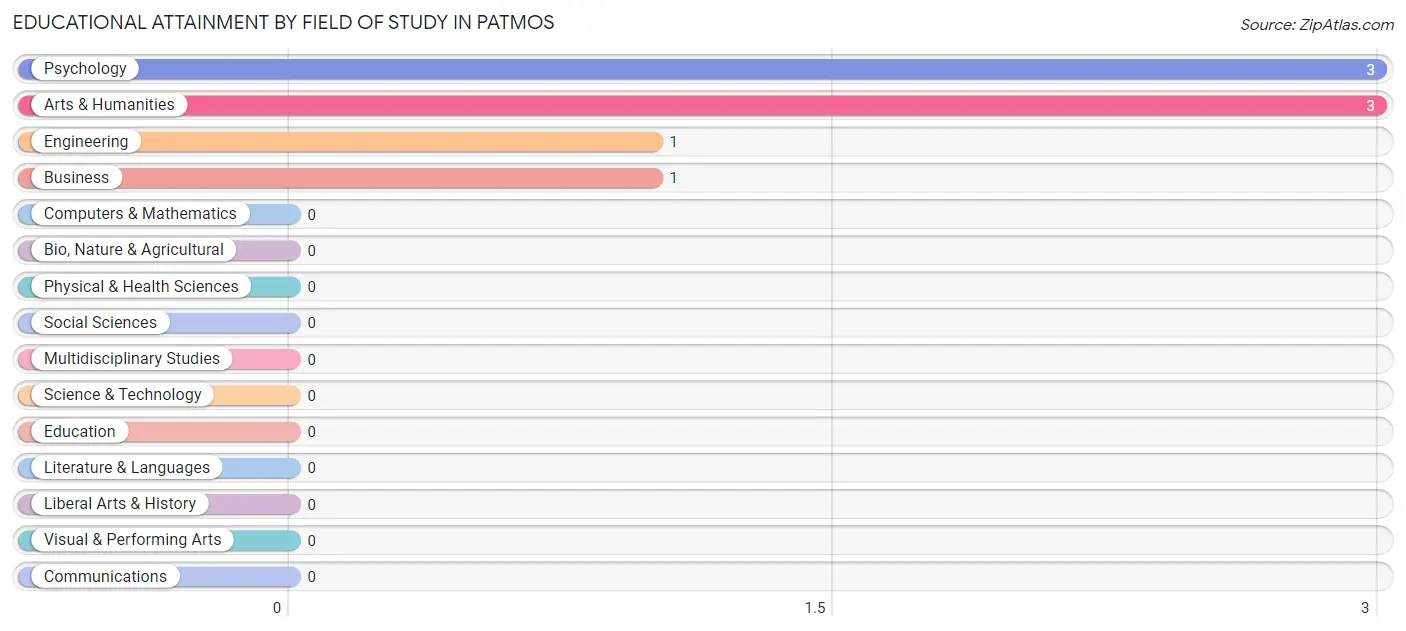
| Field of Study | # Graduates | % Graduates |
| Computers & Mathematics | 0 | 0.0% |
| Bio, Nature & Agricultural | 0 | 0.0% |
| Physical & Health Sciences | 0 | 0.0% |
| Psychology | 3 | 37.5% |
| Social Sciences | 0 | 0.0% |
| Engineering | 1 | 12.5% |
| Multidisciplinary Studies | 0 | 0.0% |
| Science & Technology | 0 | 0.0% |
| Business | 1 | 12.5% |
| Education | 0 | 0.0% |
| Literature & Languages | 0 | 0.0% |
| Liberal Arts & History | 0 | 0.0% |
| Visual & Performing Arts | 0 | 0.0% |
| Communications | 0 | 0.0% |
| Arts & Humanities | 3 | 37.5% |
| Total | 8 | 100.0% |
Transportation & Commute in Patmos
Vehicle Availability by Sex in Patmos
The most prevalent vehicle ownership categories in Patmos are males with 2 vehicles (3, accounting for 50.0%) and females with 2 vehicles (1, making up 60.0%).
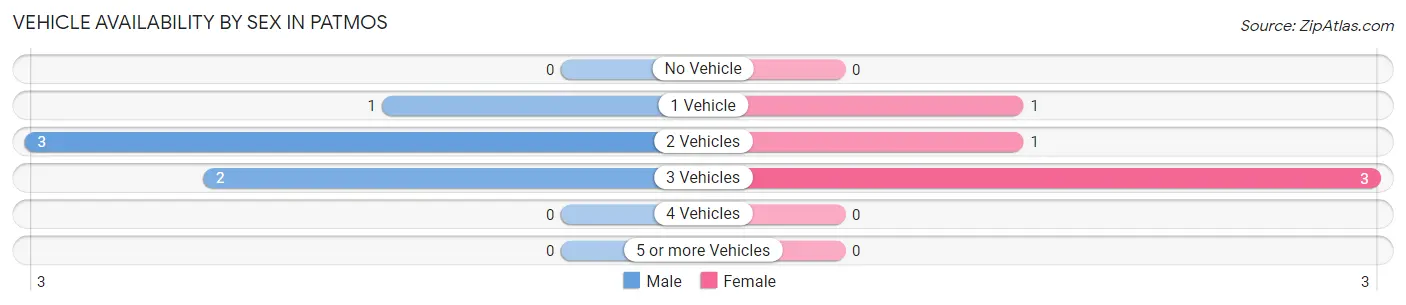
| Vehicles Available | Male | Female |
| No Vehicle | 0 (0.0%) | 0 (0.0%) |
| 1 Vehicle | 1 (16.7%) | 1 (20.0%) |
| 2 Vehicles | 3 (50.0%) | 1 (20.0%) |
| 3 Vehicles | 2 (33.3%) | 3 (60.0%) |
| 4 Vehicles | 0 (0.0%) | 0 (0.0%) |
| 5 or more Vehicles | 0 (0.0%) | 0 (0.0%) |
| Total | 6 (100.0%) | 5 (100.0%) |
Commute Time in Patmos
The most frequently occuring commute durations in Patmos are 30 to 34 minutes (5 commuters, 45.5%), 10 to 14 minutes (3 commuters, 27.3%), and 25 to 29 minutes (2 commuters, 18.2%).
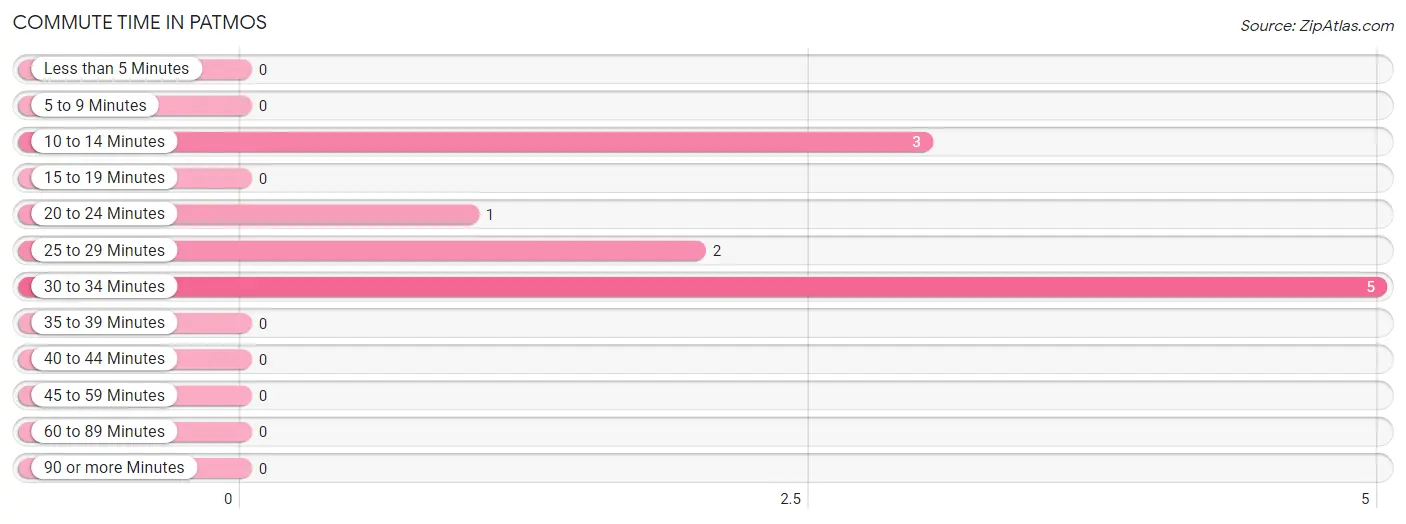
| Commute Time | # Commuters | % Commuters |
| Less than 5 Minutes | 0 | 0.0% |
| 5 to 9 Minutes | 0 | 0.0% |
| 10 to 14 Minutes | 3 | 27.3% |
| 15 to 19 Minutes | 0 | 0.0% |
| 20 to 24 Minutes | 1 | 9.1% |
| 25 to 29 Minutes | 2 | 18.2% |
| 30 to 34 Minutes | 5 | 45.5% |
| 35 to 39 Minutes | 0 | 0.0% |
| 40 to 44 Minutes | 0 | 0.0% |
| 45 to 59 Minutes | 0 | 0.0% |
| 60 to 89 Minutes | 0 | 0.0% |
| 90 or more Minutes | 0 | 0.0% |
Commute Time by Sex in Patmos
The most common commute times in Patmos are 10 to 14 minutes (3 commuters, 50.0%) for males and 25 to 29 minutes (2 commuters, 40.0%) for females.
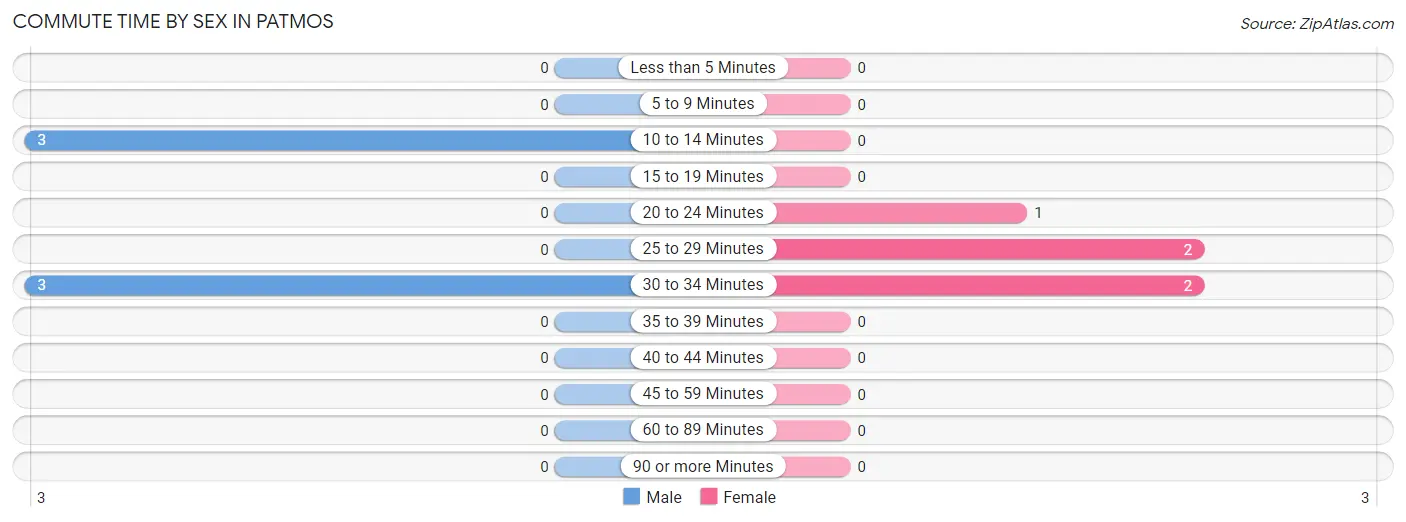
| Commute Time | Male | Female |
| Less than 5 Minutes | 0 (0.0%) | 0 (0.0%) |
| 5 to 9 Minutes | 0 (0.0%) | 0 (0.0%) |
| 10 to 14 Minutes | 3 (50.0%) | 0 (0.0%) |
| 15 to 19 Minutes | 0 (0.0%) | 0 (0.0%) |
| 20 to 24 Minutes | 0 (0.0%) | 1 (20.0%) |
| 25 to 29 Minutes | 0 (0.0%) | 2 (40.0%) |
| 30 to 34 Minutes | 3 (50.0%) | 2 (40.0%) |
| 35 to 39 Minutes | 0 (0.0%) | 0 (0.0%) |
| 40 to 44 Minutes | 0 (0.0%) | 0 (0.0%) |
| 45 to 59 Minutes | 0 (0.0%) | 0 (0.0%) |
| 60 to 89 Minutes | 0 (0.0%) | 0 (0.0%) |
| 90 or more Minutes | 0 (0.0%) | 0 (0.0%) |
Time of Departure to Work by Sex in Patmos
The most frequent times of departure to work in Patmos are 9:00 AM to 9:59 AM (3, 50.0%) for males and 6:00 AM to 6:29 AM (2, 40.0%) for females.
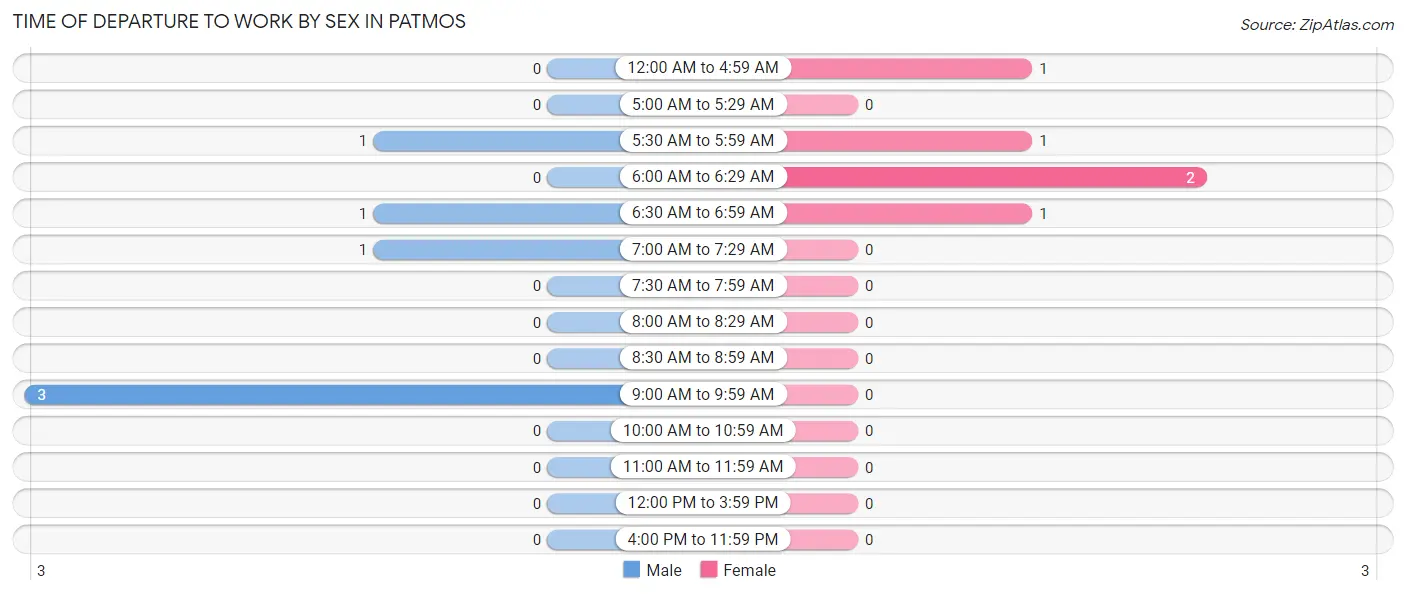
| Time of Departure | Male | Female |
| 12:00 AM to 4:59 AM | 0 (0.0%) | 1 (20.0%) |
| 5:00 AM to 5:29 AM | 0 (0.0%) | 0 (0.0%) |
| 5:30 AM to 5:59 AM | 1 (16.7%) | 1 (20.0%) |
| 6:00 AM to 6:29 AM | 0 (0.0%) | 2 (40.0%) |
| 6:30 AM to 6:59 AM | 1 (16.7%) | 1 (20.0%) |
| 7:00 AM to 7:29 AM | 1 (16.7%) | 0 (0.0%) |
| 7:30 AM to 7:59 AM | 0 (0.0%) | 0 (0.0%) |
| 8:00 AM to 8:29 AM | 0 (0.0%) | 0 (0.0%) |
| 8:30 AM to 8:59 AM | 0 (0.0%) | 0 (0.0%) |
| 9:00 AM to 9:59 AM | 3 (50.0%) | 0 (0.0%) |
| 10:00 AM to 10:59 AM | 0 (0.0%) | 0 (0.0%) |
| 11:00 AM to 11:59 AM | 0 (0.0%) | 0 (0.0%) |
| 12:00 PM to 3:59 PM | 0 (0.0%) | 0 (0.0%) |
| 4:00 PM to 11:59 PM | 0 (0.0%) | 0 (0.0%) |
| Total | 6 (100.0%) | 5 (100.0%) |
Housing Occupancy in Patmos
Occupancy by Ownership in Patmos
Of the total 25 dwellings in Patmos, owner-occupied units account for 25 (100.0%), while renter-occupied units make up 0 (0.0%).
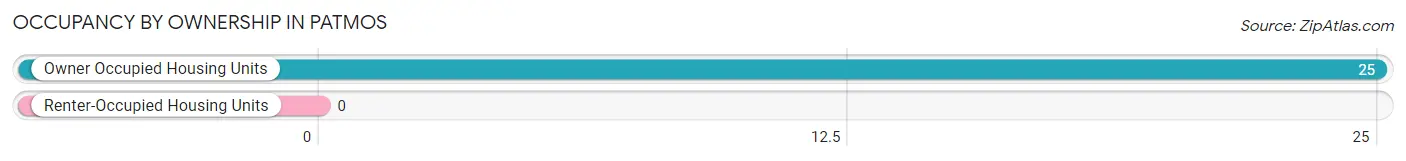
| Occupancy | # Housing Units | % Housing Units |
| Owner Occupied Housing Units | 25 | 100.0% |
| Renter-Occupied Housing Units | 0 | 0.0% |
| Total Occupied Housing Units | 25 | 100.0% |
Occupancy by Household Size in Patmos
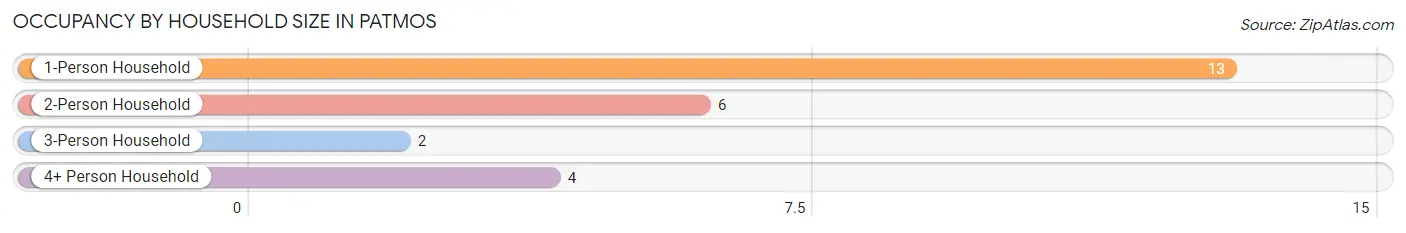
| Household Size | # Housing Units | % Housing Units |
| 1-Person Household | 13 | 52.0% |
| 2-Person Household | 6 | 24.0% |
| 3-Person Household | 2 | 8.0% |
| 4+ Person Household | 4 | 16.0% |
| Total Housing Units | 25 | 100.0% |
Occupancy by Ownership by Household Size in Patmos
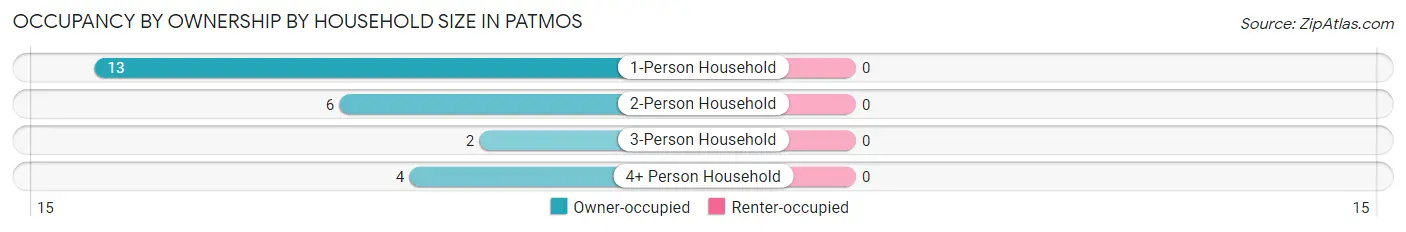
| Household Size | Owner-occupied | Renter-occupied |
| 1-Person Household | 13 (100.0%) | 0 (0.0%) |
| 2-Person Household | 6 (100.0%) | 0 (0.0%) |
| 3-Person Household | 2 (100.0%) | 0 (0.0%) |
| 4+ Person Household | 4 (100.0%) | 0 (0.0%) |
| Total Housing Units | 25 (100.0%) | 0 (0.0%) |
Occupancy by Educational Attainment in Patmos
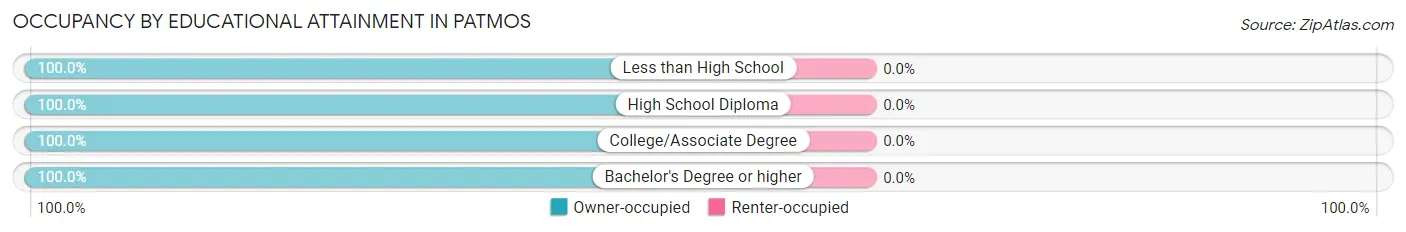
| Household Size | Owner-occupied | Renter-occupied |
| Less than High School | 5 (100.0%) | 0 (0.0%) |
| High School Diploma | 8 (100.0%) | 0 (0.0%) |
| College/Associate Degree | 7 (100.0%) | 0 (0.0%) |
| Bachelor's Degree or higher | 5 (100.0%) | 0 (0.0%) |
Occupancy by Age of Householder in Patmos
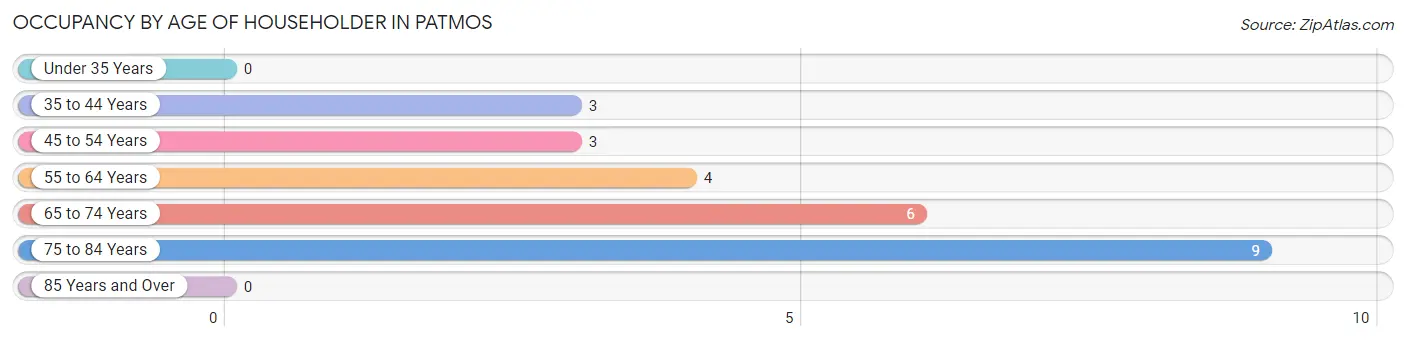
| Age Bracket | # Households | % Households |
| Under 35 Years | 0 | 0.0% |
| 35 to 44 Years | 3 | 12.0% |
| 45 to 54 Years | 3 | 12.0% |
| 55 to 64 Years | 4 | 16.0% |
| 65 to 74 Years | 6 | 24.0% |
| 75 to 84 Years | 9 | 36.0% |
| 85 Years and Over | 0 | 0.0% |
| Total | 25 | 100.0% |
Housing Finances in Patmos
Median Income by Occupancy in Patmos
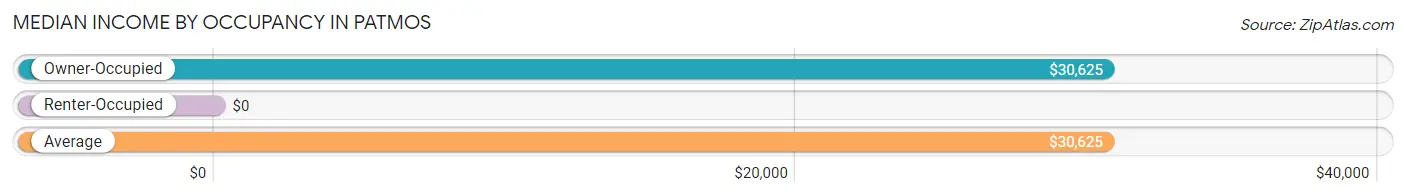
| Occupancy Type | # Households | Median Income |
| Owner-Occupied | 25 (100.0%) | $30,625 |
| Renter-Occupied | 0 (0.0%) | $0 |
| Average | 25 (100.0%) | $30,625 |
Occupancy by Householder Income Bracket in Patmos
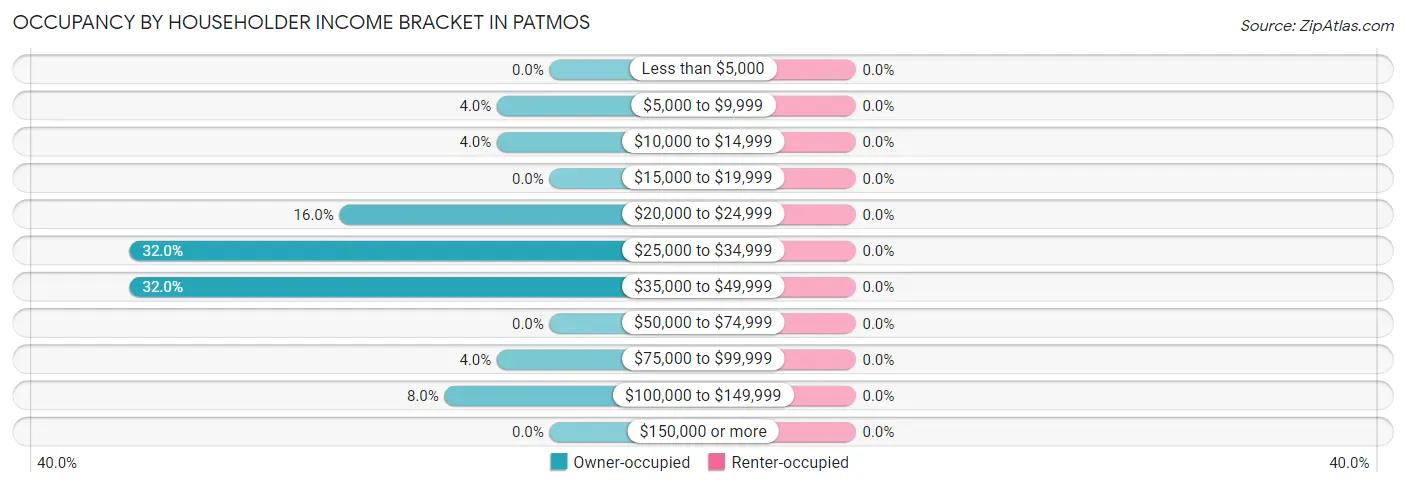
| Income Bracket | Owner-occupied | Renter-occupied |
| Less than $5,000 | 0 (0.0%) | 0 (0.0%) |
| $5,000 to $9,999 | 1 (4.0%) | 0 (0.0%) |
| $10,000 to $14,999 | 1 (4.0%) | 0 (0.0%) |
| $15,000 to $19,999 | 0 (0.0%) | 0 (0.0%) |
| $20,000 to $24,999 | 4 (16.0%) | 0 (0.0%) |
| $25,000 to $34,999 | 8 (32.0%) | 0 (0.0%) |
| $35,000 to $49,999 | 8 (32.0%) | 0 (0.0%) |
| $50,000 to $74,999 | 0 (0.0%) | 0 (0.0%) |
| $75,000 to $99,999 | 1 (4.0%) | 0 (0.0%) |
| $100,000 to $149,999 | 2 (8.0%) | 0 (0.0%) |
| $150,000 or more | 0 (0.0%) | 0 (0.0%) |
| Total | 25 (100.0%) | 0 (0.0%) |
Monthly Housing Cost Tiers in Patmos
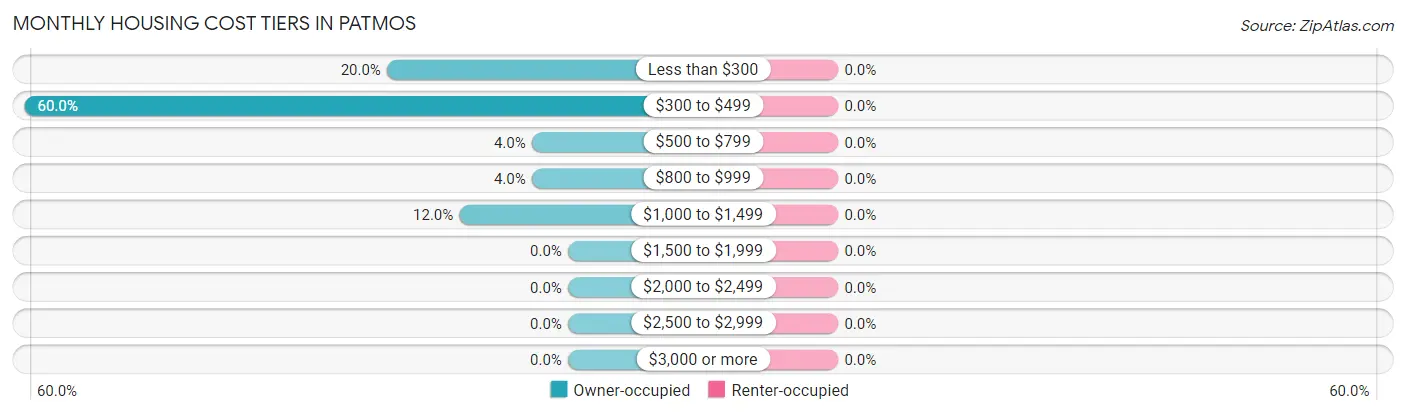
| Monthly Cost | Owner-occupied | Renter-occupied |
| Less than $300 | 5 (20.0%) | 0 (0.0%) |
| $300 to $499 | 15 (60.0%) | 0 (0.0%) |
| $500 to $799 | 1 (4.0%) | 0 (0.0%) |
| $800 to $999 | 1 (4.0%) | 0 (0.0%) |
| $1,000 to $1,499 | 3 (12.0%) | 0 (0.0%) |
| $1,500 to $1,999 | 0 (0.0%) | 0 (0.0%) |
| $2,000 to $2,499 | 0 (0.0%) | 0 (0.0%) |
| $2,500 to $2,999 | 0 (0.0%) | 0 (0.0%) |
| $3,000 or more | 0 (0.0%) | 0 (0.0%) |
| Total | 25 (100.0%) | 0 (0.0%) |
Physical Housing Characteristics in Patmos
Housing Structures in Patmos
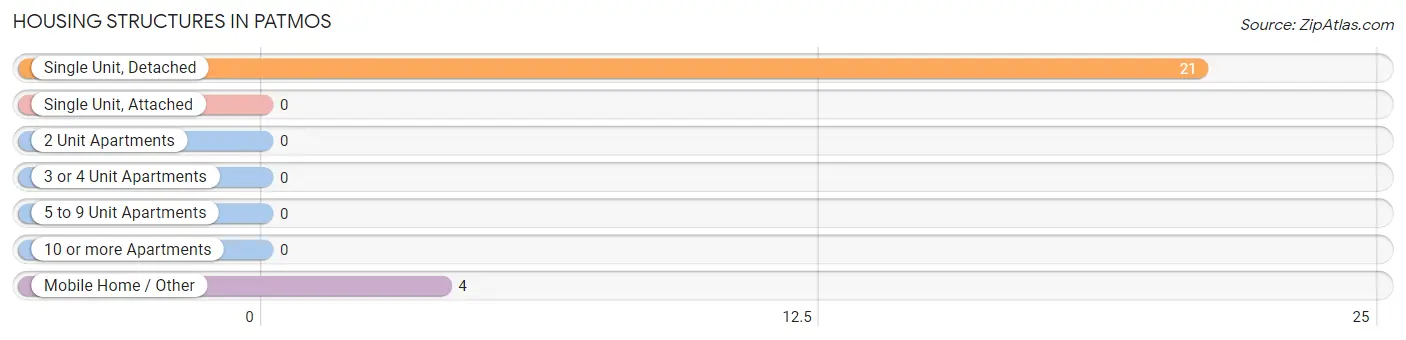
| Structure Type | # Housing Units | % Housing Units |
| Single Unit, Detached | 21 | 84.0% |
| Single Unit, Attached | 0 | 0.0% |
| 2 Unit Apartments | 0 | 0.0% |
| 3 or 4 Unit Apartments | 0 | 0.0% |
| 5 to 9 Unit Apartments | 0 | 0.0% |
| 10 or more Apartments | 0 | 0.0% |
| Mobile Home / Other | 4 | 16.0% |
| Total | 25 | 100.0% |
Housing Structures by Occupancy in Patmos
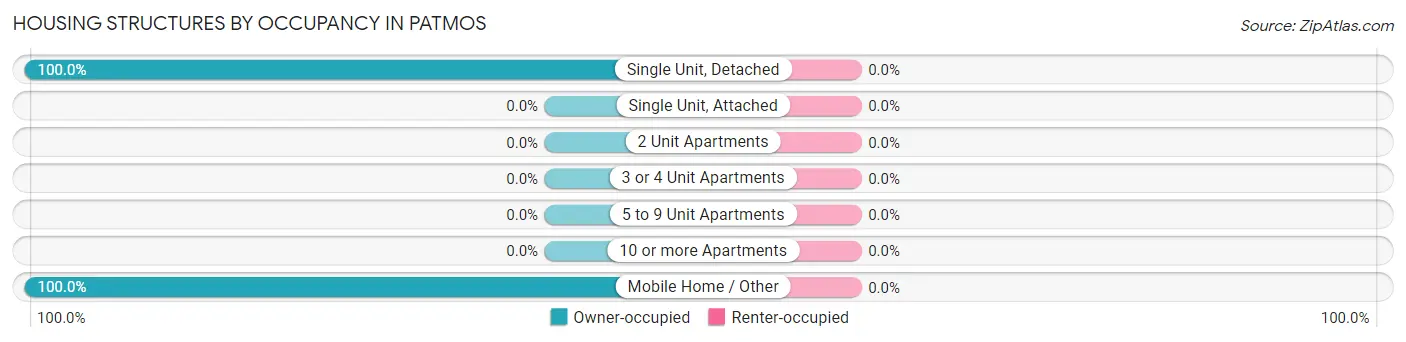
| Structure Type | Owner-occupied | Renter-occupied |
| Single Unit, Detached | 21 (100.0%) | 0 (0.0%) |
| Single Unit, Attached | 0 (0.0%) | 0 (0.0%) |
| 2 Unit Apartments | 0 (0.0%) | 0 (0.0%) |
| 3 or 4 Unit Apartments | 0 (0.0%) | 0 (0.0%) |
| 5 to 9 Unit Apartments | 0 (0.0%) | 0 (0.0%) |
| 10 or more Apartments | 0 (0.0%) | 0 (0.0%) |
| Mobile Home / Other | 4 (100.0%) | 0 (0.0%) |
| Total | 25 (100.0%) | 0 (0.0%) |
Housing Structures by Number of Rooms in Patmos
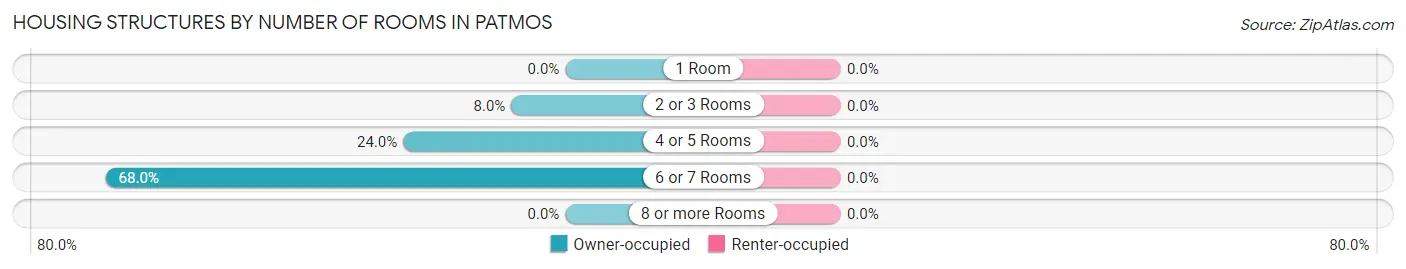
| Number of Rooms | Owner-occupied | Renter-occupied |
| 1 Room | 0 (0.0%) | 0 (0.0%) |
| 2 or 3 Rooms | 2 (8.0%) | 0 (0.0%) |
| 4 or 5 Rooms | 6 (24.0%) | 0 (0.0%) |
| 6 or 7 Rooms | 17 (68.0%) | 0 (0.0%) |
| 8 or more Rooms | 0 (0.0%) | 0 (0.0%) |
| Total | 25 (100.0%) | 0 (0.0%) |
Housing Structure by Heating Type in Patmos
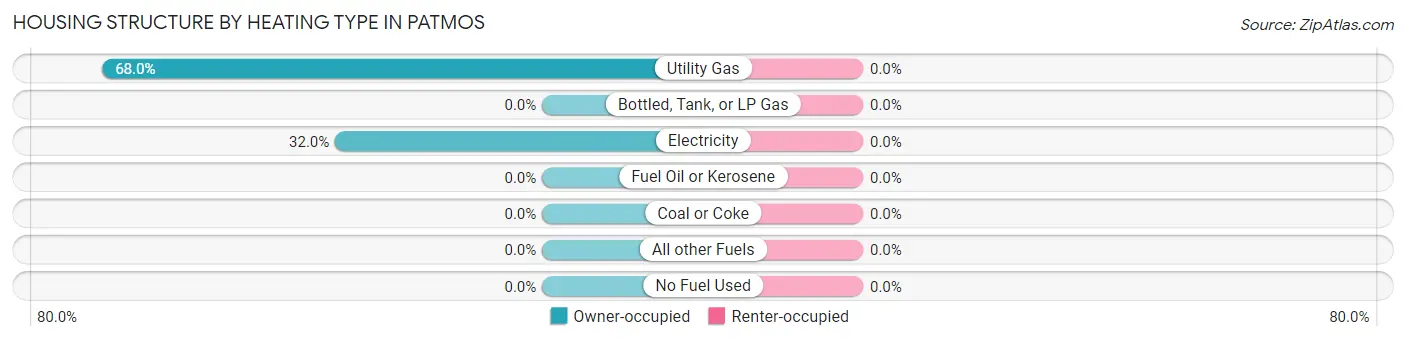
| Heating Type | Owner-occupied | Renter-occupied |
| Utility Gas | 17 (68.0%) | 0 (0.0%) |
| Bottled, Tank, or LP Gas | 0 (0.0%) | 0 (0.0%) |
| Electricity | 8 (32.0%) | 0 (0.0%) |
| Fuel Oil or Kerosene | 0 (0.0%) | 0 (0.0%) |
| Coal or Coke | 0 (0.0%) | 0 (0.0%) |
| All other Fuels | 0 (0.0%) | 0 (0.0%) |
| No Fuel Used | 0 (0.0%) | 0 (0.0%) |
| Total | 25 (100.0%) | 0 (0.0%) |
Household Vehicle Usage in Patmos
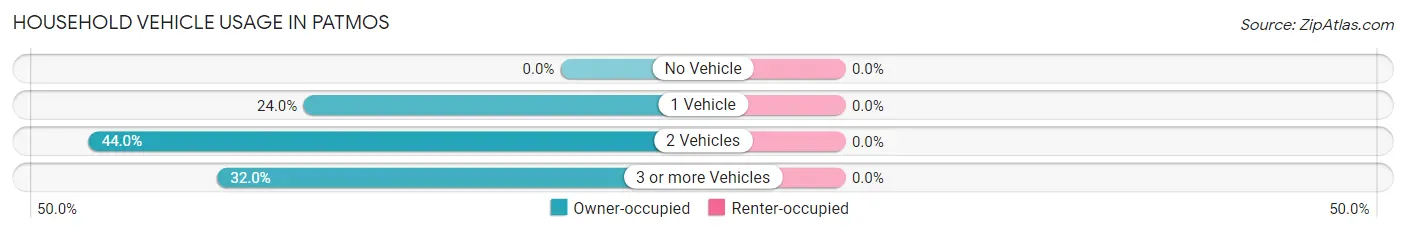
| Vehicles per Household | Owner-occupied | Renter-occupied |
| No Vehicle | 0 (0.0%) | 0 (0.0%) |
| 1 Vehicle | 6 (24.0%) | 0 (0.0%) |
| 2 Vehicles | 11 (44.0%) | 0 (0.0%) |
| 3 or more Vehicles | 8 (32.0%) | 0 (0.0%) |
| Total | 25 (100.0%) | 0 (0.0%) |
Real Estate & Mortgages in Patmos
Real Estate and Mortgage Overview in Patmos
| Characteristic | Without Mortgage | With Mortgage |
| Housing Units | 18 | 7 |
| Median Property Value | $70,000 | $103,100 |
| Median Household Income | $29,500 | $0 |
| Monthly Housing Costs | $350 | $0 |
| Real Estate Taxes | - | - |
Property Value by Mortgage Status in Patmos
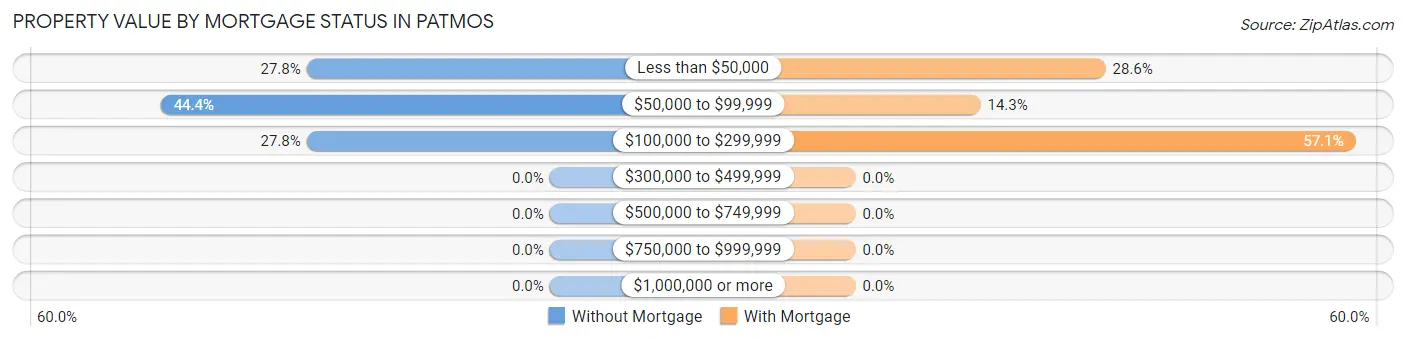
| Property Value | Without Mortgage | With Mortgage |
| Less than $50,000 | 5 (27.8%) | 2 (28.6%) |
| $50,000 to $99,999 | 8 (44.4%) | 1 (14.3%) |
| $100,000 to $299,999 | 5 (27.8%) | 4 (57.1%) |
| $300,000 to $499,999 | 0 (0.0%) | 0 (0.0%) |
| $500,000 to $749,999 | 0 (0.0%) | 0 (0.0%) |
| $750,000 to $999,999 | 0 (0.0%) | 0 (0.0%) |
| $1,000,000 or more | 0 (0.0%) | 0 (0.0%) |
| Total | 18 (100.0%) | 7 (100.0%) |
Household Income by Mortgage Status in Patmos
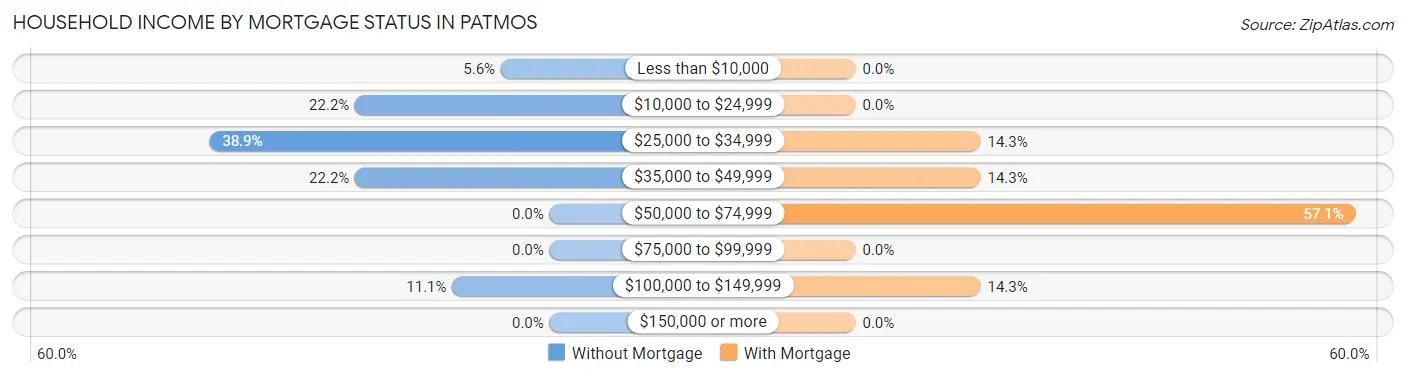
| Household Income | Without Mortgage | With Mortgage |
| Less than $10,000 | 1 (5.6%) | 0 (0.0%) |
| $10,000 to $24,999 | 4 (22.2%) | 0 (0.0%) |
| $25,000 to $34,999 | 7 (38.9%) | 1 (14.3%) |
| $35,000 to $49,999 | 4 (22.2%) | 1 (14.3%) |
| $50,000 to $74,999 | 0 (0.0%) | 4 (57.1%) |
| $75,000 to $99,999 | 0 (0.0%) | 0 (0.0%) |
| $100,000 to $149,999 | 2 (11.1%) | 1 (14.3%) |
| $150,000 or more | 0 (0.0%) | 0 (0.0%) |
| Total | 18 (100.0%) | 7 (100.0%) |
Property Value to Household Income Ratio in Patmos
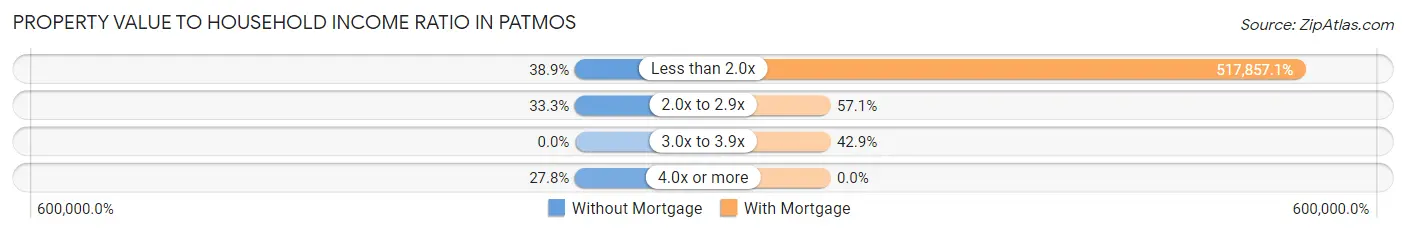
| Value-to-Income Ratio | Without Mortgage | With Mortgage |
| Less than 2.0x | 7 (38.9%) | 36,250 (517,857.1%) |
| 2.0x to 2.9x | 6 (33.3%) | 4 (57.1%) |
| 3.0x to 3.9x | 0 (0.0%) | 3 (42.9%) |
| 4.0x or more | 5 (27.8%) | 0 (0.0%) |
| Total | 18 (100.0%) | 7 (100.0%) |
Real Estate Taxes by Mortgage Status in Patmos
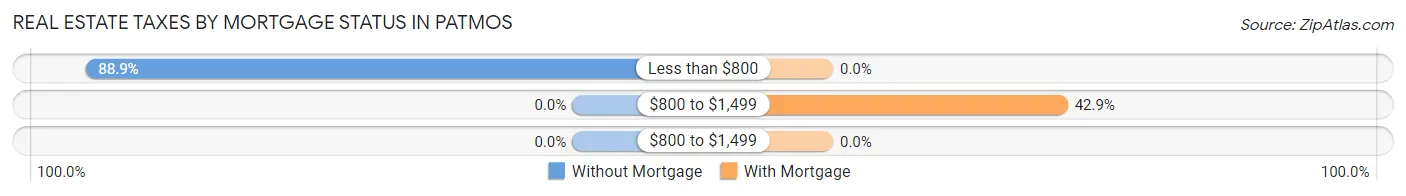
| Property Taxes | Without Mortgage | With Mortgage |
| Less than $800 | 16 (88.9%) | 0 (0.0%) |
| $800 to $1,499 | 0 (0.0%) | 3 (42.9%) |
| $800 to $1,499 | 0 (0.0%) | 0 (0.0%) |
| Total | 18 (100.0%) | 7 (100.0%) |
Health & Disability in Patmos
Health Insurance Coverage by Age in Patmos
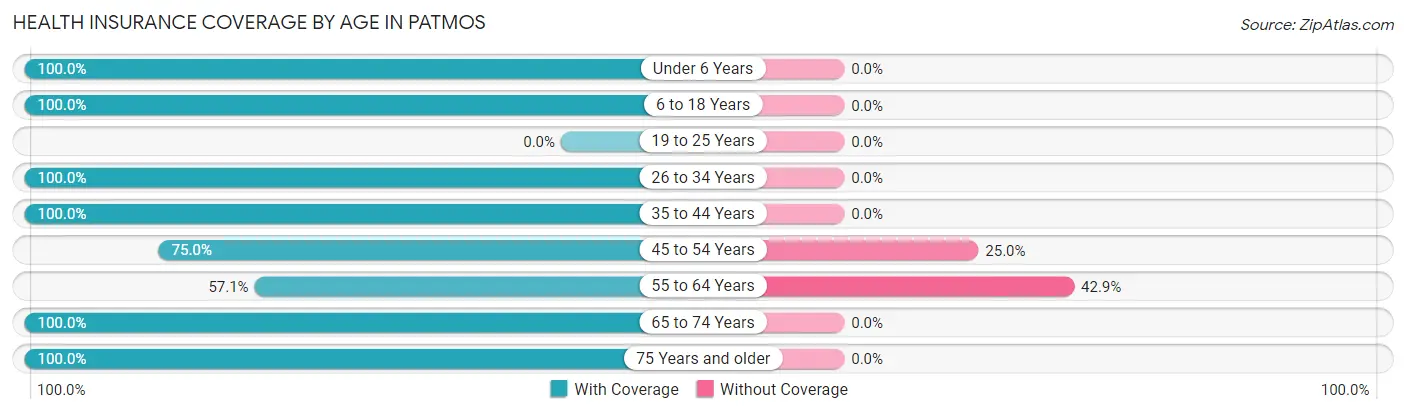
| Age Bracket | With Coverage | Without Coverage |
| Under 6 Years | 14 (100.0%) | 0 (0.0%) |
| 6 to 18 Years | 10 (100.0%) | 0 (0.0%) |
| 19 to 25 Years | 0 (0.0%) | 0 (0.0%) |
| 26 to 34 Years | 3 (100.0%) | 0 (0.0%) |
| 35 to 44 Years | 6 (100.0%) | 0 (0.0%) |
| 45 to 54 Years | 6 (75.0%) | 2 (25.0%) |
| 55 to 64 Years | 4 (57.1%) | 3 (42.9%) |
| 65 to 74 Years | 8 (100.0%) | 0 (0.0%) |
| 75 Years and older | 9 (100.0%) | 0 (0.0%) |
| Total | 60 (92.3%) | 5 (7.7%) |
Health Insurance Coverage by Citizenship Status in Patmos
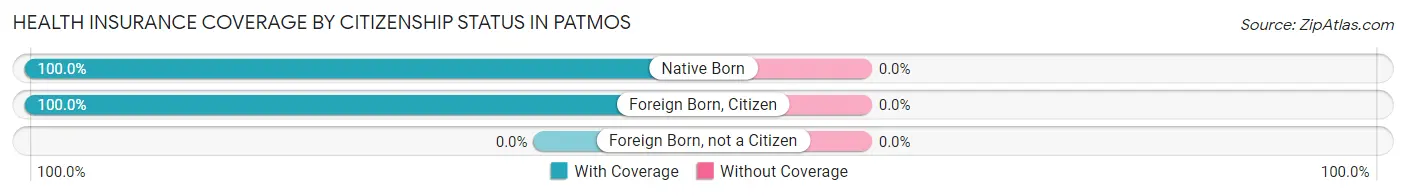
| Citizenship Status | With Coverage | Without Coverage |
| Native Born | 14 (100.0%) | 0 (0.0%) |
| Foreign Born, Citizen | 10 (100.0%) | 0 (0.0%) |
| Foreign Born, not a Citizen | 0 (0.0%) | 0 (0.0%) |
Health Insurance Coverage by Household Income in Patmos
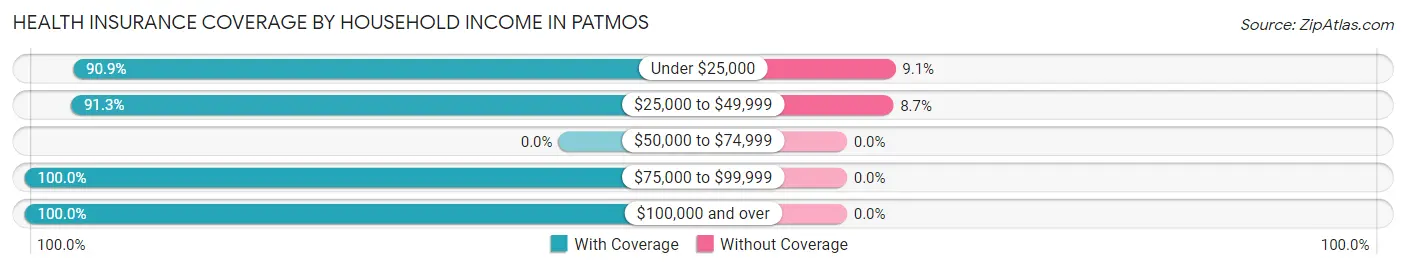
| Household Income | With Coverage | Without Coverage |
| Under $25,000 | 10 (90.9%) | 1 (9.1%) |
| $25,000 to $49,999 | 42 (91.3%) | 4 (8.7%) |
| $50,000 to $74,999 | 0 (0.0%) | 0 (0.0%) |
| $75,000 to $99,999 | 1 (100.0%) | 0 (0.0%) |
| $100,000 and over | 7 (100.0%) | 0 (0.0%) |
Public vs Private Health Insurance Coverage by Age in Patmos

| Age Bracket | Public Insurance | Private Insurance |
| Under 6 | 1 (7.1%) | 13 (92.9%) |
| 6 to 18 Years | 1 (10.0%) | 9 (90.0%) |
| 19 to 25 Years | 0 (0.0%) | 0 (0.0%) |
| 25 to 34 Years | 3 (100.0%) | 0 (0.0%) |
| 35 to 44 Years | 0 (0.0%) | 6 (100.0%) |
| 45 to 54 Years | 5 (62.5%) | 1 (12.5%) |
| 55 to 64 Years | 0 (0.0%) | 4 (57.1%) |
| 65 to 74 Years | 8 (100.0%) | 4 (50.0%) |
| 75 Years and over | 9 (100.0%) | 7 (77.8%) |
| Total | 27 (41.5%) | 44 (67.7%) |
Disability Status by Sex by Age in Patmos
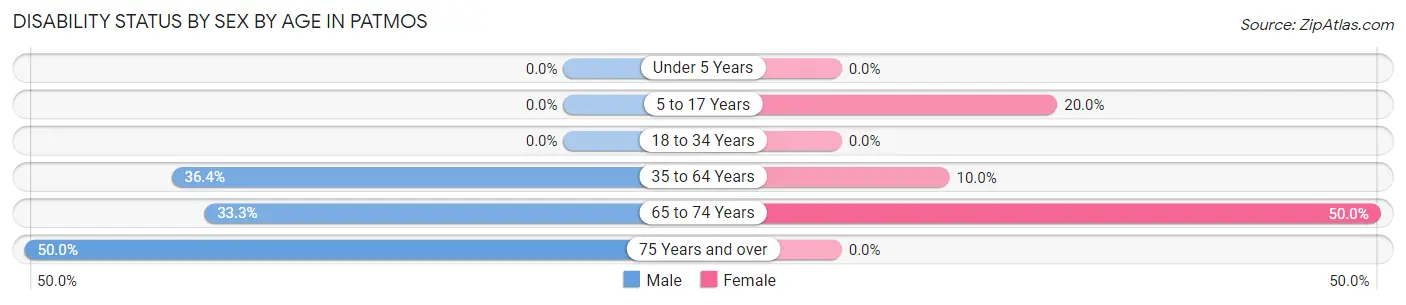
| Age Bracket | Male | Female |
| Under 5 Years | 0 (0.0%) | 0 (0.0%) |
| 5 to 17 Years | 0 (0.0%) | 1 (20.0%) |
| 18 to 34 Years | 0 (0.0%) | 0 (0.0%) |
| 35 to 64 Years | 4 (36.4%) | 1 (10.0%) |
| 65 to 74 Years | 2 (33.3%) | 1 (50.0%) |
| 75 Years and over | 2 (50.0%) | 0 (0.0%) |
Disability Class by Sex by Age in Patmos
Disability Class: Hearing Difficulty
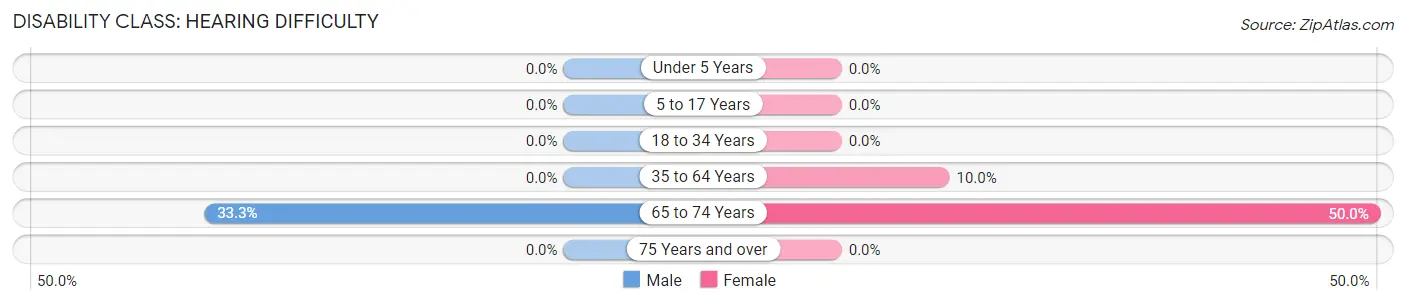
| Age Bracket | Male | Female |
| Under 5 Years | 0 (0.0%) | 0 (0.0%) |
| 5 to 17 Years | 0 (0.0%) | 0 (0.0%) |
| 18 to 34 Years | 0 (0.0%) | 0 (0.0%) |
| 35 to 64 Years | 0 (0.0%) | 1 (10.0%) |
| 65 to 74 Years | 2 (33.3%) | 1 (50.0%) |
| 75 Years and over | 0 (0.0%) | 0 (0.0%) |
Disability Class: Vision Difficulty
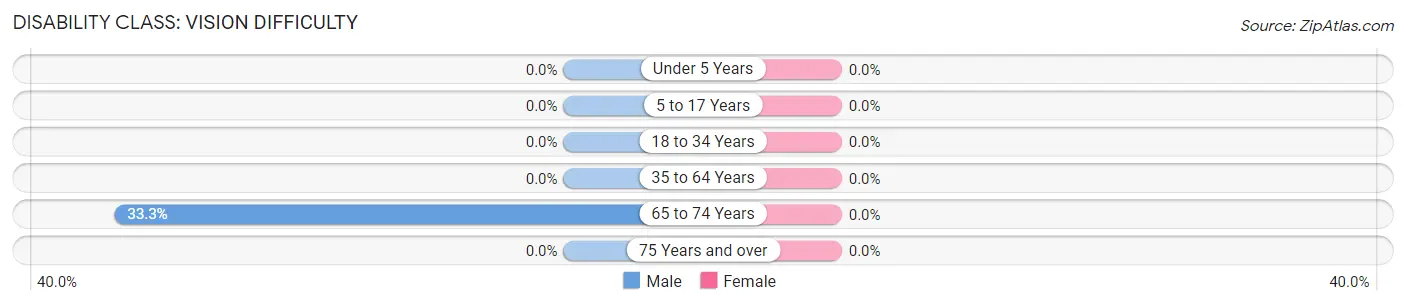
| Age Bracket | Male | Female |
| Under 5 Years | 0 (0.0%) | 0 (0.0%) |
| 5 to 17 Years | 0 (0.0%) | 0 (0.0%) |
| 18 to 34 Years | 0 (0.0%) | 0 (0.0%) |
| 35 to 64 Years | 0 (0.0%) | 0 (0.0%) |
| 65 to 74 Years | 2 (33.3%) | 0 (0.0%) |
| 75 Years and over | 0 (0.0%) | 0 (0.0%) |
Disability Class: Cognitive Difficulty
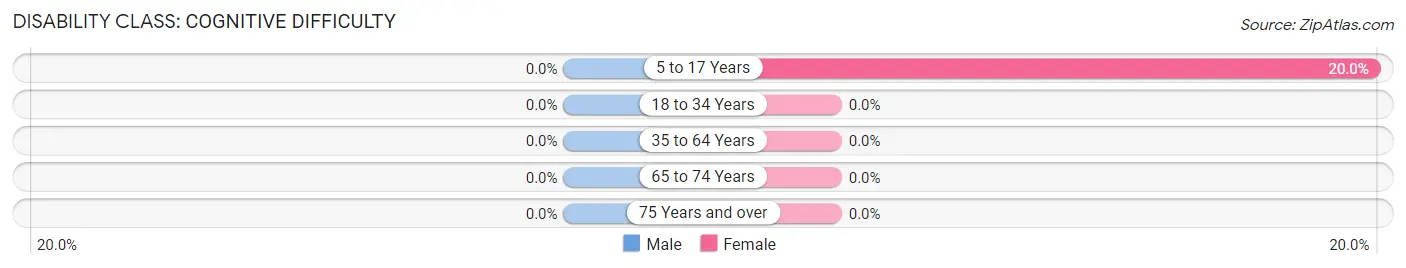
| Age Bracket | Male | Female |
| 5 to 17 Years | 0 (0.0%) | 1 (20.0%) |
| 18 to 34 Years | 0 (0.0%) | 0 (0.0%) |
| 35 to 64 Years | 0 (0.0%) | 0 (0.0%) |
| 65 to 74 Years | 0 (0.0%) | 0 (0.0%) |
| 75 Years and over | 0 (0.0%) | 0 (0.0%) |
Disability Class: Ambulatory Difficulty
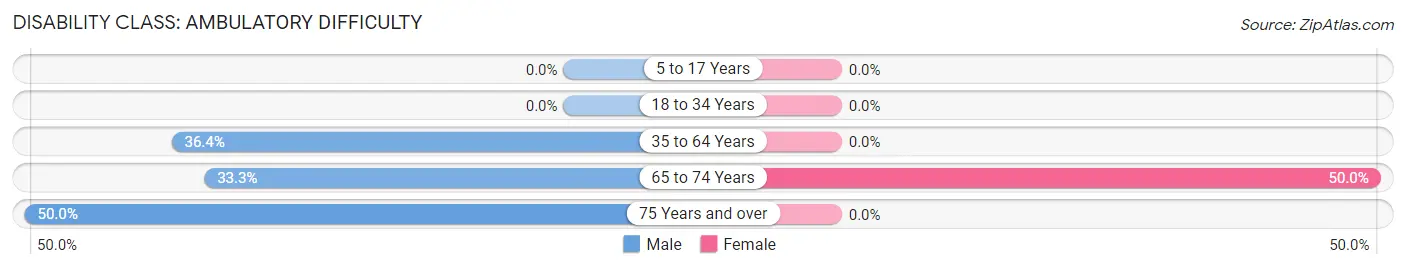
| Age Bracket | Male | Female |
| 5 to 17 Years | 0 (0.0%) | 0 (0.0%) |
| 18 to 34 Years | 0 (0.0%) | 0 (0.0%) |
| 35 to 64 Years | 4 (36.4%) | 0 (0.0%) |
| 65 to 74 Years | 2 (33.3%) | 1 (50.0%) |
| 75 Years and over | 2 (50.0%) | 0 (0.0%) |
Disability Class: Self-Care Difficulty

| Age Bracket | Male | Female |
| 5 to 17 Years | 0 (0.0%) | 0 (0.0%) |
| 18 to 34 Years | 0 (0.0%) | 0 (0.0%) |
| 35 to 64 Years | 4 (36.4%) | 0 (0.0%) |
| 65 to 74 Years | 2 (33.3%) | 0 (0.0%) |
| 75 Years and over | 2 (50.0%) | 0 (0.0%) |
Technology Access in Patmos
Computing Device Access in Patmos
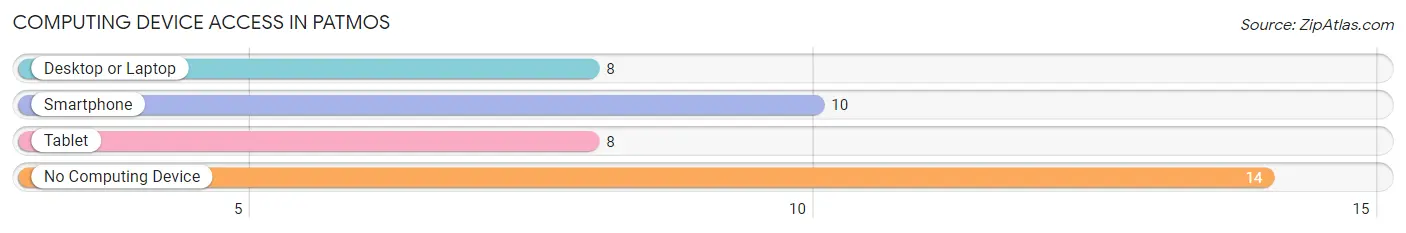
| Device Type | # Households | % Households |
| Desktop or Laptop | 8 | 32.0% |
| Smartphone | 10 | 40.0% |
| Tablet | 8 | 32.0% |
| No Computing Device | 14 | 56.0% |
| Total | 25 | 100.0% |
Internet Access in Patmos
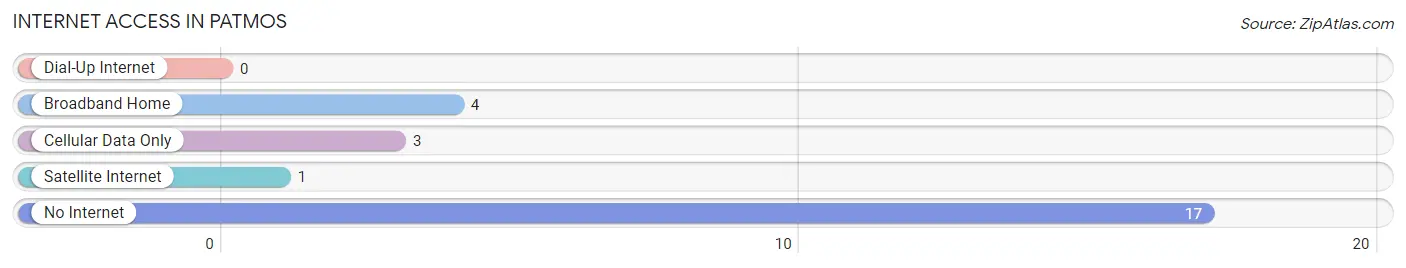
| Internet Type | # Households | % Households |
| Dial-Up Internet | 0 | 0.0% |
| Broadband Home | 4 | 16.0% |
| Cellular Data Only | 3 | 12.0% |
| Satellite Internet | 1 | 4.0% |
| No Internet | 17 | 68.0% |
| Total | 25 | 100.0% |
Patmos Summary
Patmos is a small town located in the Arkansas Delta region of the United States. It is situated in the southeastern corner of the state, about 30 miles south of Little Rock. The town is part of the Little Rock-North Little Rock-Conway Metropolitan Statistical Area.
History
Patmos was founded in 1883 by a group of settlers from the nearby town of Stuttgart. The town was named after the biblical island of Patmos, where the Book of Revelation was written. The town was incorporated in 1887 and quickly grew to become a thriving agricultural center. The town was home to a number of cotton gins, sawmills, and other businesses.
In the early 20th century, Patmos was a popular destination for African Americans seeking a better life. The town was home to a number of black-owned businesses, including a hotel, a barbershop, and a grocery store. The town also had a thriving music scene, with a number of jazz and blues clubs.
Geography
Patmos is located in the Arkansas Delta region of the United States. The town is situated in the southeastern corner of the state, about 30 miles south of Little Rock. The town is part of the Little Rock-North Little Rock-Conway Metropolitan Statistical Area.
The town is situated on the banks of the Arkansas River. The town is surrounded by a number of small lakes and ponds, including Lake Patmos, which is located just outside of town. The town is also home to a number of parks and recreational areas, including the Patmos State Park.
Economy
Patmos is a small town with a population of just over 1,000 people. The town is primarily a farming community, with a number of small farms located in the area. The town is also home to a number of small businesses, including a grocery store, a hardware store, and a few restaurants.
The town is also home to a number of manufacturing companies, including a furniture factory and a plastics factory. The town is also home to a number of small businesses, including a number of antique stores and a few art galleries.
Demographics
As of the 2010 census, the population of Patmos was 1,072. The town is predominantly white, with a population that is 94.3% white. The town is also home to a small African American population, which makes up 4.2% of the population. The town is also home to a small Hispanic population, which makes up 1.5% of the population.
The median household income in Patmos is $37,500, and the median home value is $90,000. The town has a poverty rate of 17.3%, which is higher than the national average. The town also has a high unemployment rate, with 8.3% of the population unemployed.
Conclusion
Patmos is a small town located in the Arkansas Delta region of the United States. The town is situated in the southeastern corner of the state, about 30 miles south of Little Rock. The town is part of the Little Rock-North Little Rock-Conway Metropolitan Statistical Area. The town is predominantly white, with a population that is 94.3% white. The town is primarily a farming community, with a number of small farms located in the area. The town is also home to a number of small businesses, including a grocery store, a hardware store, and a few restaurants. The town is also home to a number of manufacturing companies, including a furniture factory and a plastics factory. The town has a poverty rate of 17.3%, which is higher than the national average. The town also has a high unemployment rate, with 8.3% of the population unemployed.
Common Questions
What is Per Capita Income in Patmos?
Per Capita income in Patmos is $14,808.
What is the Median Family Income in Patmos?
Median Family Income in Patmos is $36,500.
What is the Median Household income in Patmos?
Median Household Income in Patmos is $30,625.
What is Inequality or Gini Index in Patmos?
Inequality or Gini Index in Patmos is 0.29.
What is the Total Population of Patmos?
Total Population of Patmos is 65.
What is the Total Male Population of Patmos?
Total Male Population of Patmos is 39.
What is the Total Female Population of Patmos?
Total Female Population of Patmos is 26.
What is the Ratio of Males per 100 Females in Patmos?
There are 150.00 Males per 100 Females in Patmos.
What is the Ratio of Females per 100 Males in Patmos?
There are 66.67 Females per 100 Males in Patmos.
What is the Median Population Age in Patmos?
Median Population Age in Patmos is 35.9 Years.
What is the Average Family Size in Patmos
Average Family Size in Patmos is 4.3 People.
What is the Average Household Size in Patmos
Average Household Size in Patmos is 2.6 People.
How Large is the Labor Force in Patmos?
There are 11 People in the Labor Forcein in Patmos.
What is the Percentage of People in the Labor Force in Patmos?
26.8% of People are in the Labor Force in Patmos.