East Verde Estates, AZ Map & Demographics
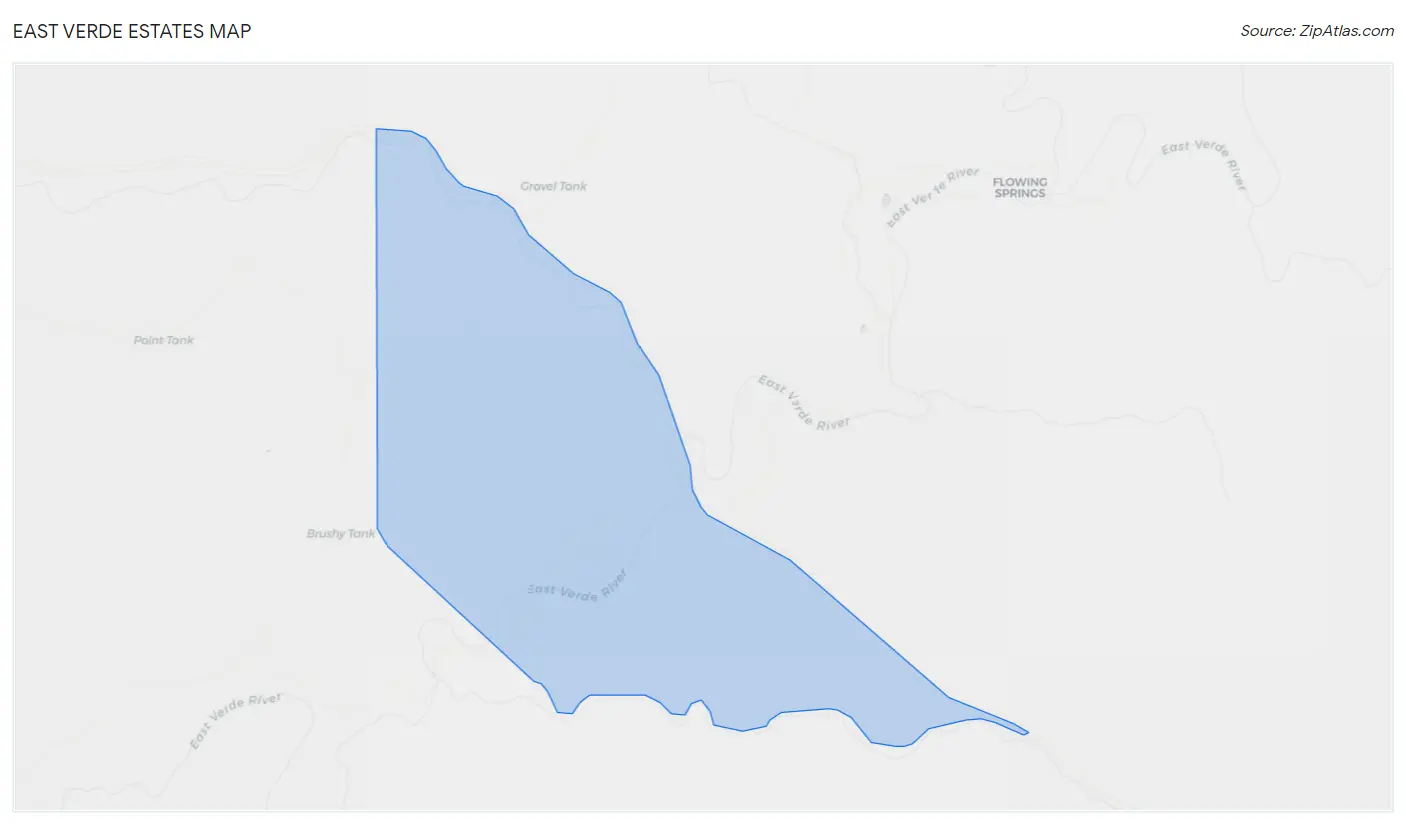
East Verde Estates Map
East Verde Estates Overview
$45,054
PER CAPITA INCOME
$126,688
AVG FAMILY INCOME
$125,438
AVG HOUSEHOLD INCOME
0.23
INEQUALITY / GINI INDEX
149
TOTAL POPULATION
90
MALE POPULATION
59
FEMALE POPULATION
152.54
MALES / 100 FEMALES
65.56
FEMALES / 100 MALES
60.5
MEDIAN AGE
2.9
AVG FAMILY SIZE
2.4
AVG HOUSEHOLD SIZE
85
LABOR FORCE [ PEOPLE ]
57.0%
PERCENT IN LABOR FORCE
15.3%
UNEMPLOYMENT RATE
Income in East Verde Estates
Income Overview in East Verde Estates
Per Capita Income in East Verde Estates is $45,054, while median incomes of families and households are $126,688 and $125,438 respectively.
| Characteristic | Number | Measure |
| Per Capita Income | 149 | $45,054 |
| Median Family Income | 43 | $126,688 |
| Mean Family Income | 43 | $121,163 |
| Median Household Income | 63 | $125,438 |
| Mean Household Income | 63 | $102,119 |
| Income Deficit | 43 | $0 |
| Wage / Income Gap (%) | 149 | 0.00% |
| Wage / Income Gap ($) | 149 | 100.00¢ per $1 |
| Gini / Inequality Index | 149 | 0.23 |
Earnings by Sex in East Verde Estates
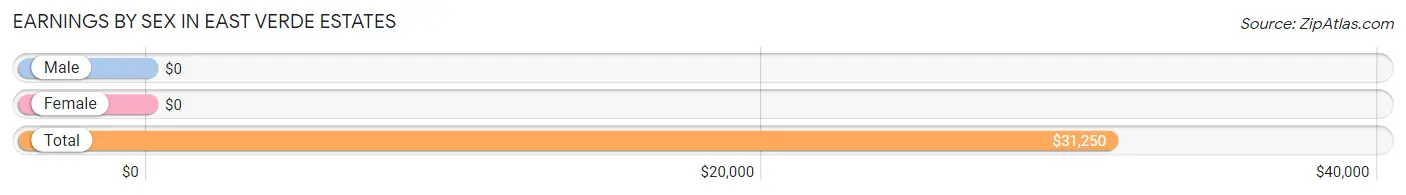
| Sex | Number | Average Earnings |
| Male | 64 (59.3%) | $0 |
| Female | 44 (40.7%) | $0 |
| Total | 108 (100.0%) | $31,250 |
Earnings by Sex by Income Bracket in East Verde Estates
The most common earnings brackets in East Verde Estates are $25,000 to $29,999 for men (31 | 48.4%) and $2,500 to $4,999 for women (23 | 52.3%).
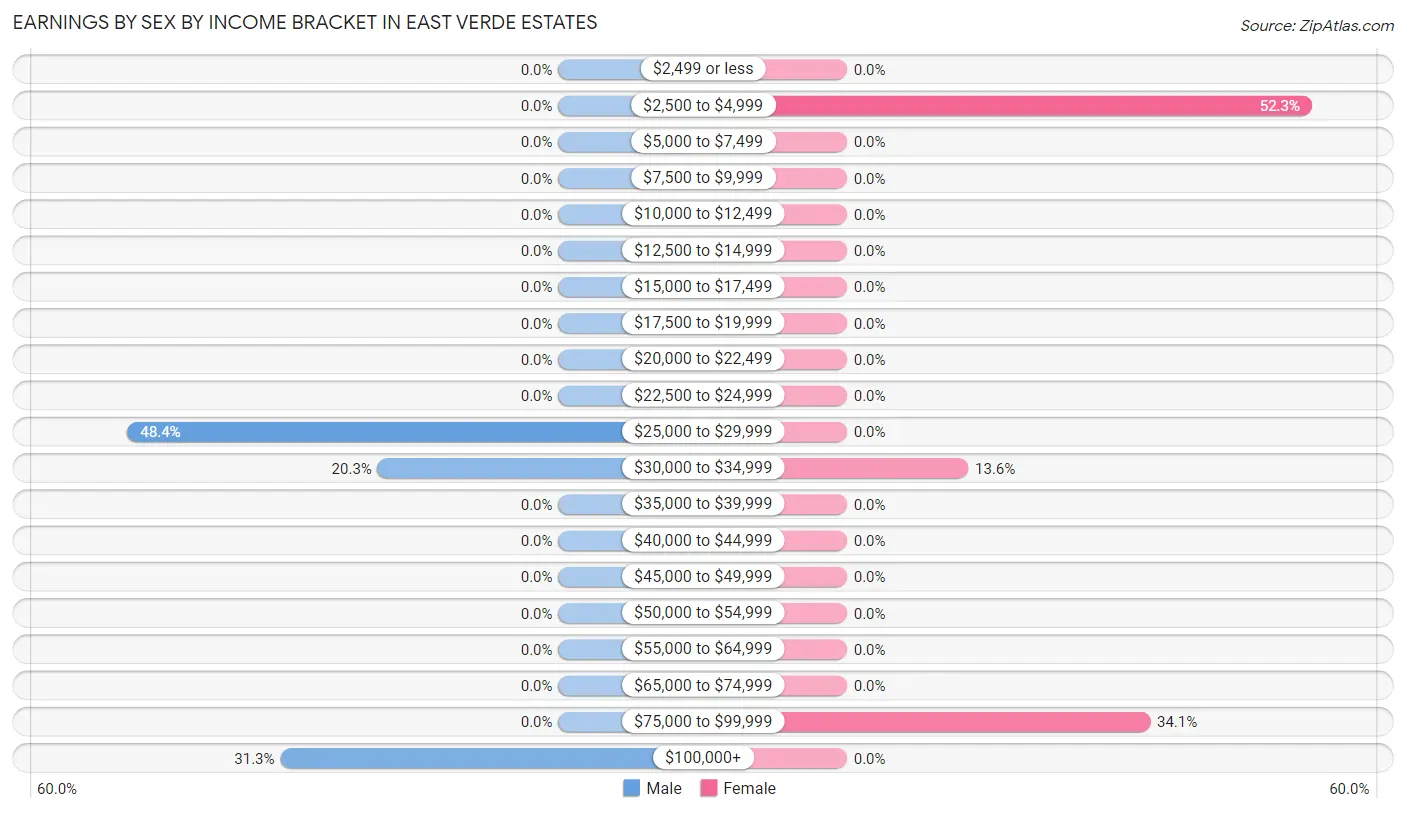
| Income | Male | Female |
| $2,499 or less | 0 (0.0%) | 0 (0.0%) |
| $2,500 to $4,999 | 0 (0.0%) | 23 (52.3%) |
| $5,000 to $7,499 | 0 (0.0%) | 0 (0.0%) |
| $7,500 to $9,999 | 0 (0.0%) | 0 (0.0%) |
| $10,000 to $12,499 | 0 (0.0%) | 0 (0.0%) |
| $12,500 to $14,999 | 0 (0.0%) | 0 (0.0%) |
| $15,000 to $17,499 | 0 (0.0%) | 0 (0.0%) |
| $17,500 to $19,999 | 0 (0.0%) | 0 (0.0%) |
| $20,000 to $22,499 | 0 (0.0%) | 0 (0.0%) |
| $22,500 to $24,999 | 0 (0.0%) | 0 (0.0%) |
| $25,000 to $29,999 | 31 (48.4%) | 0 (0.0%) |
| $30,000 to $34,999 | 13 (20.3%) | 6 (13.6%) |
| $35,000 to $39,999 | 0 (0.0%) | 0 (0.0%) |
| $40,000 to $44,999 | 0 (0.0%) | 0 (0.0%) |
| $45,000 to $49,999 | 0 (0.0%) | 0 (0.0%) |
| $50,000 to $54,999 | 0 (0.0%) | 0 (0.0%) |
| $55,000 to $64,999 | 0 (0.0%) | 0 (0.0%) |
| $65,000 to $74,999 | 0 (0.0%) | 0 (0.0%) |
| $75,000 to $99,999 | 0 (0.0%) | 15 (34.1%) |
| $100,000+ | 20 (31.2%) | 0 (0.0%) |
| Total | 64 (100.0%) | 44 (100.0%) |
Earnings by Sex by Educational Attainment in East Verde Estates
| Educational Attainment | Male Income | Female Income |
| Less than High School | - | - |
| High School Diploma | - | - |
| College or Associate's Degree | - | - |
| Bachelor's Degree | - | - |
| Graduate Degree | - | - |
| Total | - | - |
Family Income in East Verde Estates
Family Income Brackets in East Verde Estates
According to the East Verde Estates family income data, there are 20 families falling into the $100,000 to $149,999 income range, which is the most common income bracket and makes up 46.5% of all families.
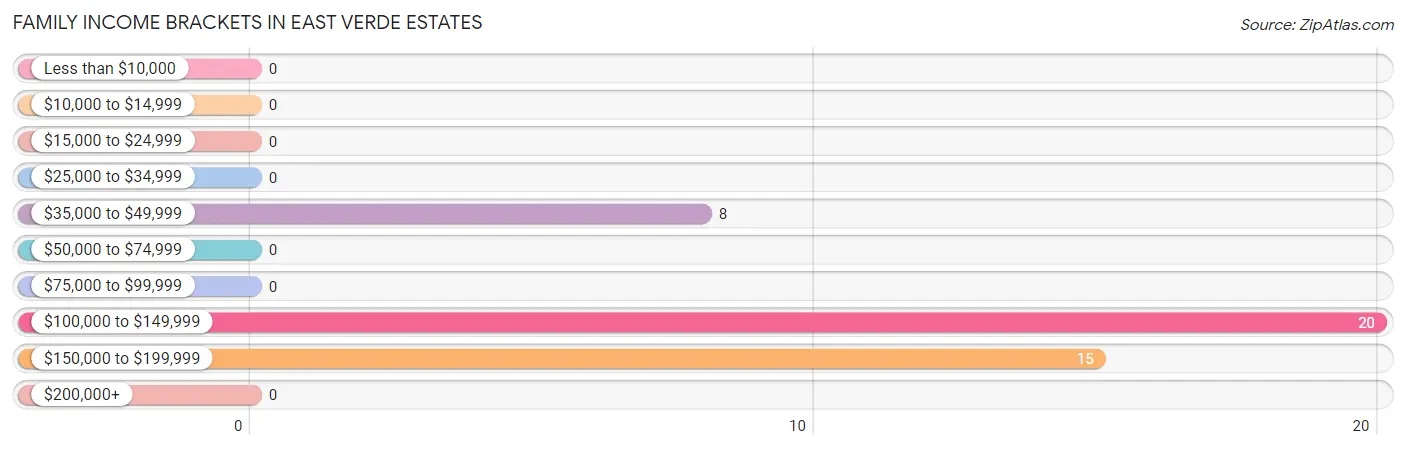
| Income Bracket | # Families | % Families |
| Less than $10,000 | 0 | 0.0% |
| $10,000 to $14,999 | 0 | 0.0% |
| $15,000 to $24,999 | 0 | 0.0% |
| $25,000 to $34,999 | 0 | 0.0% |
| $35,000 to $49,999 | 8 | 18.6% |
| $50,000 to $74,999 | 0 | 0.0% |
| $75,000 to $99,999 | 0 | 0.0% |
| $100,000 to $149,999 | 20 | 46.5% |
| $150,000 to $199,999 | 15 | 34.9% |
| $200,000+ | 0 | 0.0% |
Family Income by Famaliy Size in East Verde Estates
| Income Bracket | # Families | Median Income |
| 2-Person Families | 28 (65.1%) | $0 |
| 3-Person Families | 15 (34.9%) | $0 |
| 4-Person Families | 0 (0.0%) | $0 |
| 5-Person Families | 0 (0.0%) | $0 |
| 6-Person Families | 0 (0.0%) | $0 |
| 7+ Person Families | 0 (0.0%) | $0 |
| Total | 43 (100.0%) | $126,688 |
Family Income by Number of Earners in East Verde Estates
| Number of Earners | # Families | Median Income |
| No Earners | 8 (18.6%) | $0 |
| 1 Earner | 0 (0.0%) | $0 |
| 2 Earners | 35 (81.4%) | $0 |
| 3+ Earners | 0 (0.0%) | $0 |
| Total | 43 (100.0%) | $126,688 |
Household Income in East Verde Estates
Household Income Brackets in East Verde Estates
With 20 households falling in the category, the $100,000 to $149,999 income range is the most frequent in East Verde Estates, accounting for 31.8% of all households.
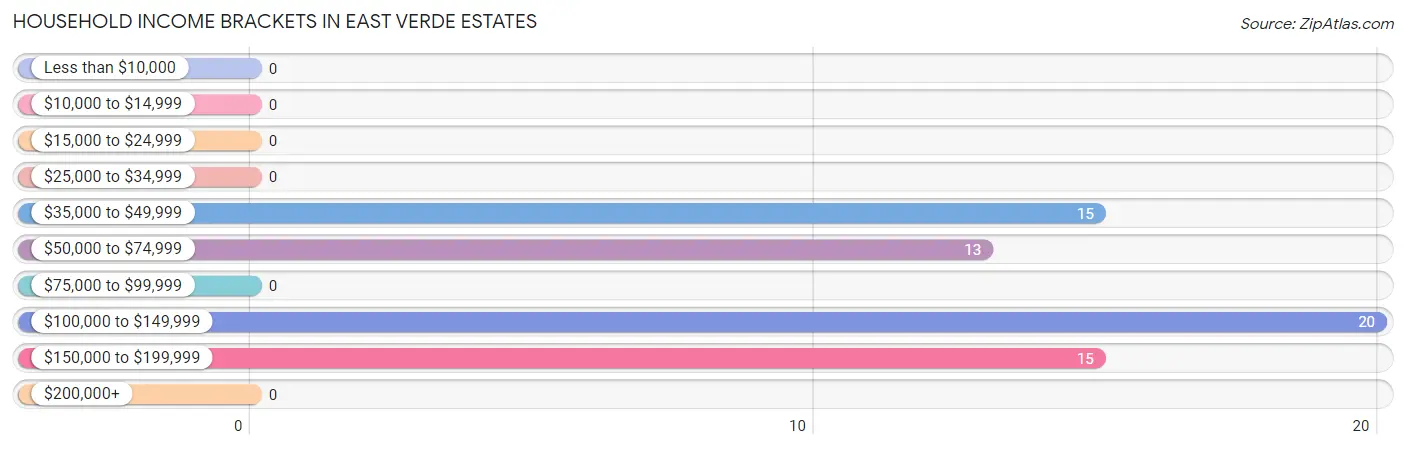
| Income Bracket | # Households | % Households |
| Less than $10,000 | 0 | 0.0% |
| $10,000 to $14,999 | 0 | 0.0% |
| $15,000 to $24,999 | 0 | 0.0% |
| $25,000 to $34,999 | 0 | 0.0% |
| $35,000 to $49,999 | 15 | 23.8% |
| $50,000 to $74,999 | 13 | 20.6% |
| $75,000 to $99,999 | 0 | 0.0% |
| $100,000 to $149,999 | 20 | 31.7% |
| $150,000 to $199,999 | 15 | 23.8% |
| $200,000+ | 0 | 0.0% |
Household Income by Householder Age in East Verde Estates
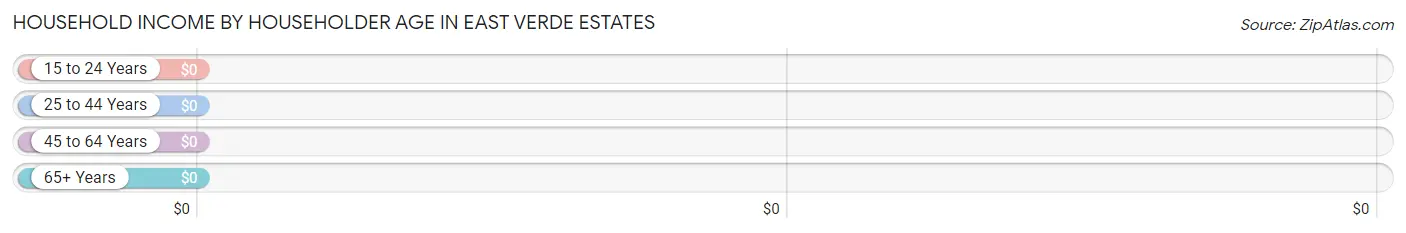
| Income Bracket | # Households | Median Income |
| 15 to 24 Years | 0 (0.0%) | $0 |
| 25 to 44 Years | 0 (0.0%) | $0 |
| 45 to 64 Years | 28 (44.4%) | $0 |
| 65+ Years | 35 (55.6%) | $0 |
| Total | 63 (100.0%) | $125,438 |
Poverty in East Verde Estates
Income Below Poverty by Sex and Age in East Verde Estates
| Age Bracket | Male | Female |
| Under 5 Years | 0 (0.0%) | 0 (0.0%) |
| 5 Years | 0 (0.0%) | 0 (0.0%) |
| 6 to 11 Years | 0 (0.0%) | 0 (0.0%) |
| 12 to 14 Years | 0 (0.0%) | 0 (0.0%) |
| 15 Years | 0 (0.0%) | 0 (0.0%) |
| 16 and 17 Years | 0 (0.0%) | 0 (0.0%) |
| 18 to 24 Years | 0 (0.0%) | 0 (0.0%) |
| 25 to 34 Years | 0 (0.0%) | 0 (0.0%) |
| 35 to 44 Years | 0 (0.0%) | 0 (0.0%) |
| 45 to 54 Years | 0 (0.0%) | 0 (0.0%) |
| 55 to 64 Years | 0 (0.0%) | 0 (0.0%) |
| 65 to 74 Years | 0 (0.0%) | 0 (0.0%) |
| 75 Years and over | 0 (0.0%) | 0 (0.0%) |
| Total | 0 (0.0%) | 0 (0.0%) |
Income Above Poverty by Sex and Age in East Verde Estates
According to the poverty statistics in East Verde Estates, males aged 25 to 34 years and females aged 35 to 44 years are the age groups that are most secure financially, with 100.0% of males and 100.0% of females in these age groups living above the poverty line.
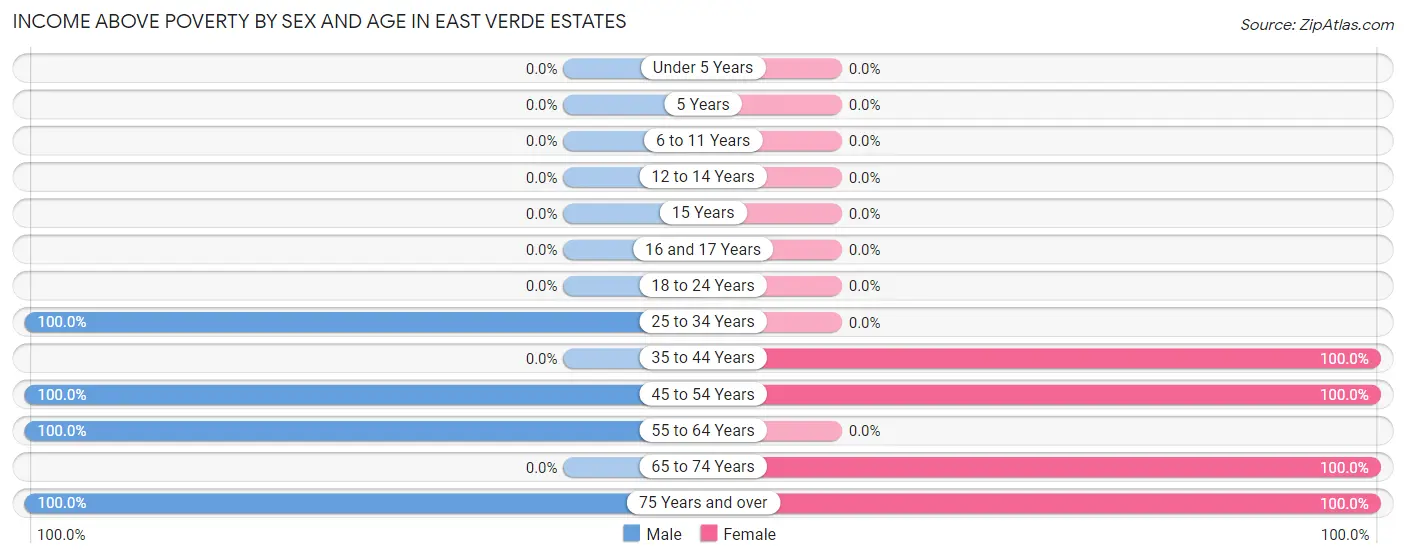
| Age Bracket | Male | Female |
| Under 5 Years | 0 (0.0%) | 0 (0.0%) |
| 5 Years | 0 (0.0%) | 0 (0.0%) |
| 6 to 11 Years | 0 (0.0%) | 0 (0.0%) |
| 12 to 14 Years | 0 (0.0%) | 0 (0.0%) |
| 15 Years | 0 (0.0%) | 0 (0.0%) |
| 16 and 17 Years | 0 (0.0%) | 0 (0.0%) |
| 18 to 24 Years | 0 (0.0%) | 0 (0.0%) |
| 25 to 34 Years | 31 (100.0%) | 0 (0.0%) |
| 35 to 44 Years | 0 (0.0%) | 6 (100.0%) |
| 45 to 54 Years | 13 (100.0%) | 15 (100.0%) |
| 55 to 64 Years | 19 (100.0%) | 0 (0.0%) |
| 65 to 74 Years | 0 (0.0%) | 23 (100.0%) |
| 75 Years and over | 27 (100.0%) | 15 (100.0%) |
| Total | 90 (100.0%) | 59 (100.0%) |
Income Below Poverty Among Married-Couple Families in East Verde Estates
| Children | Above Poverty | Below Poverty |
| No Children | 43 (100.0%) | 0 (0.0%) |
| 1 or 2 Children | 0 (0.0%) | 0 (0.0%) |
| 3 or 4 Children | 0 (0.0%) | 0 (0.0%) |
| 5 or more Children | 0 (0.0%) | 0 (0.0%) |
| Total | 43 (100.0%) | 0 (0.0%) |
Income Below Poverty Among Single-Parent Households in East Verde Estates
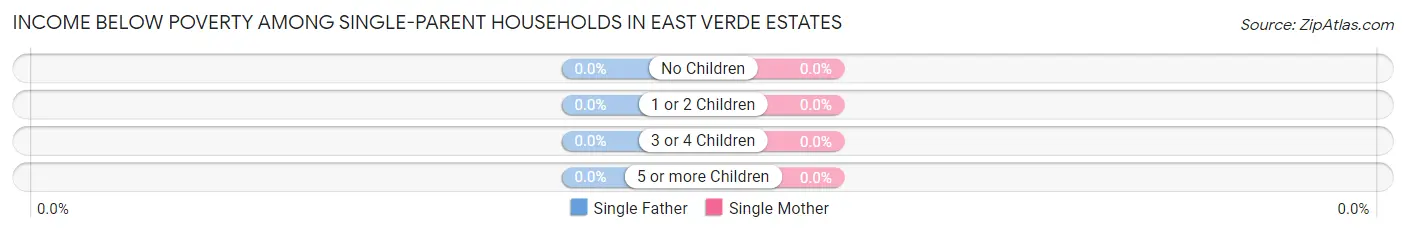
| Children | Single Father | Single Mother |
| No Children | 0 (0.0%) | 0 (0.0%) |
| 1 or 2 Children | 0 (0.0%) | 0 (0.0%) |
| 3 or 4 Children | 0 (0.0%) | 0 (0.0%) |
| 5 or more Children | 0 (0.0%) | 0 (0.0%) |
| Total | 0 (0.0%) | 0 (0.0%) |
Income Below Poverty Among Married-Couple vs Single-Parent Households in East Verde Estates
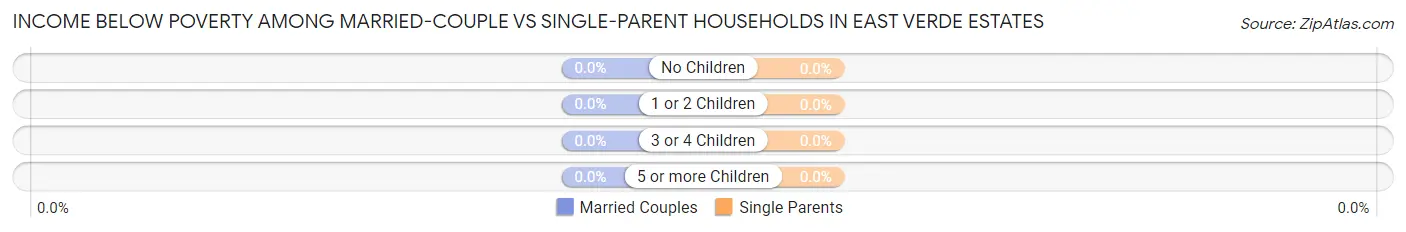
| Children | Married-Couple Families | Single-Parent Households |
| No Children | 0 (0.0%) | 0 (0.0%) |
| 1 or 2 Children | 0 (0.0%) | 0 (0.0%) |
| 3 or 4 Children | 0 (0.0%) | 0 (0.0%) |
| 5 or more Children | 0 (0.0%) | 0 (0.0%) |
| Total | 0 (0.0%) | 0 (0.0%) |
Race in East Verde Estates
The most populous races in East Verde Estates are White / Caucasian (67 | 45.0%), Two or more Races (54 | 36.2%), and Hawaiian / Pacific (15 | 10.1%).
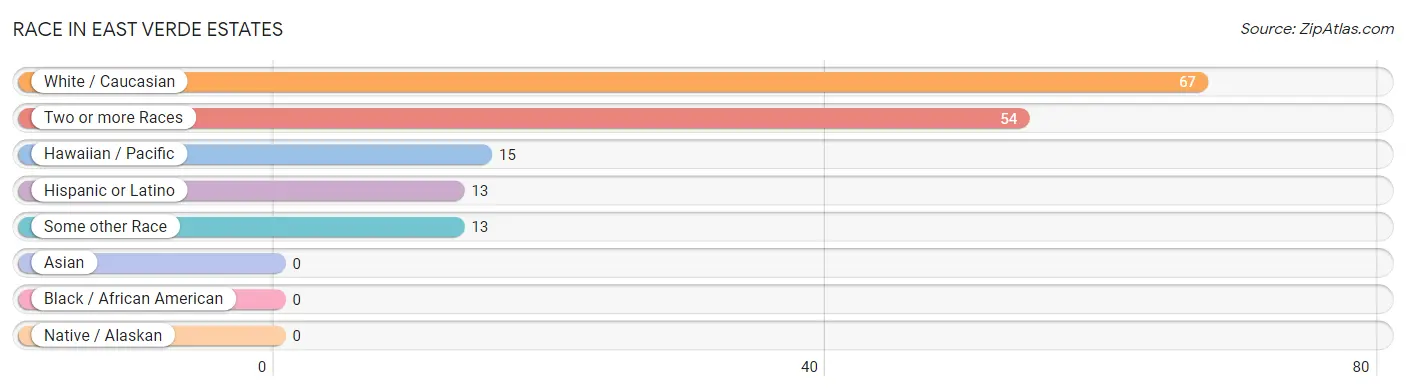
| Race | # Population | % Population |
| Asian | 0 | 0.0% |
| Black / African American | 0 | 0.0% |
| Hawaiian / Pacific | 15 | 10.1% |
| Hispanic or Latino | 13 | 8.7% |
| Native / Alaskan | 0 | 0.0% |
| White / Caucasian | 67 | 45.0% |
| Two or more Races | 54 | 36.2% |
| Some other Race | 13 | 8.7% |
| Total | 149 | 100.0% |
Ancestry in East Verde Estates
The most populous ancestries reported in East Verde Estates are German (47 | 31.5%), Native Hawaiian (46 | 30.9%), English (26 | 17.4%), Scottish (23 | 15.4%), and Welsh (20 | 13.4%), together accounting for 108.7% of all East Verde Estates residents.
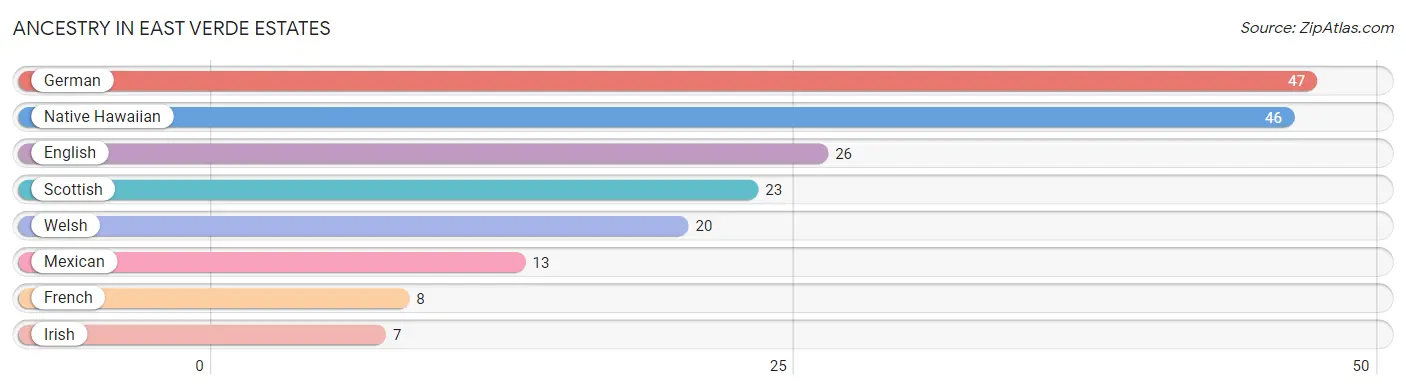
| Ancestry | # Population | % Population |
| English | 26 | 17.4% |
| French | 8 | 5.4% |
| German | 47 | 31.5% |
| Irish | 7 | 4.7% |
| Mexican | 13 | 8.7% |
| Native Hawaiian | 46 | 30.9% |
| Scottish | 23 | 15.4% |
| Welsh | 20 | 13.4% | View All 8 Rows |
Immigrants in East Verde Estates

| Immigration Origin | # Population | % Population | View All 0 Rows |
Sex and Age in East Verde Estates
Sex and Age in East Verde Estates
The most populous age groups in East Verde Estates are 25 to 29 Years (31 | 34.4%) for men and 65 to 69 Years (23 | 39.0%) for women.
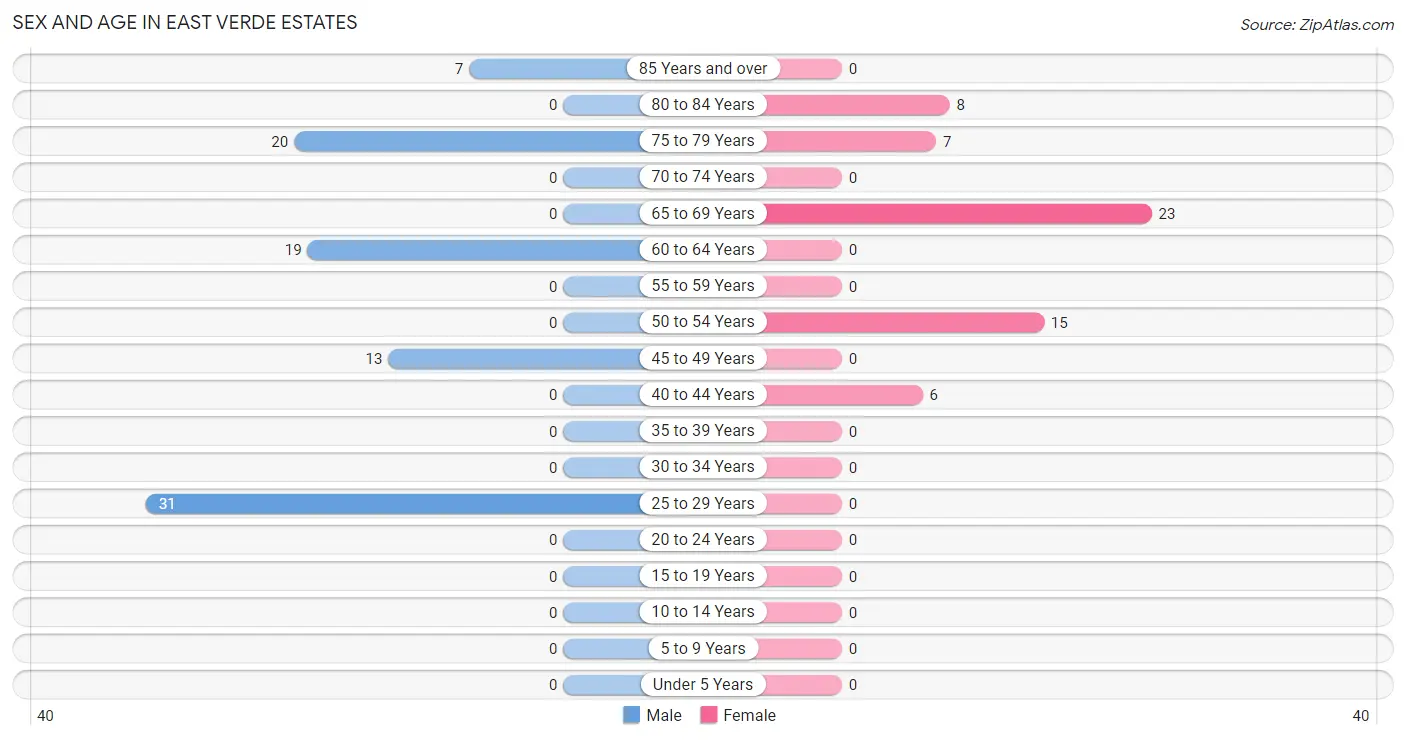
| Age Bracket | Male | Female |
| Under 5 Years | 0 (0.0%) | 0 (0.0%) |
| 5 to 9 Years | 0 (0.0%) | 0 (0.0%) |
| 10 to 14 Years | 0 (0.0%) | 0 (0.0%) |
| 15 to 19 Years | 0 (0.0%) | 0 (0.0%) |
| 20 to 24 Years | 0 (0.0%) | 0 (0.0%) |
| 25 to 29 Years | 31 (34.4%) | 0 (0.0%) |
| 30 to 34 Years | 0 (0.0%) | 0 (0.0%) |
| 35 to 39 Years | 0 (0.0%) | 0 (0.0%) |
| 40 to 44 Years | 0 (0.0%) | 6 (10.2%) |
| 45 to 49 Years | 13 (14.4%) | 0 (0.0%) |
| 50 to 54 Years | 0 (0.0%) | 15 (25.4%) |
| 55 to 59 Years | 0 (0.0%) | 0 (0.0%) |
| 60 to 64 Years | 19 (21.1%) | 0 (0.0%) |
| 65 to 69 Years | 0 (0.0%) | 23 (39.0%) |
| 70 to 74 Years | 0 (0.0%) | 0 (0.0%) |
| 75 to 79 Years | 20 (22.2%) | 7 (11.9%) |
| 80 to 84 Years | 0 (0.0%) | 8 (13.6%) |
| 85 Years and over | 7 (7.8%) | 0 (0.0%) |
| Total | 90 (100.0%) | 59 (100.0%) |
Families and Households in East Verde Estates
Median Family Size in East Verde Estates
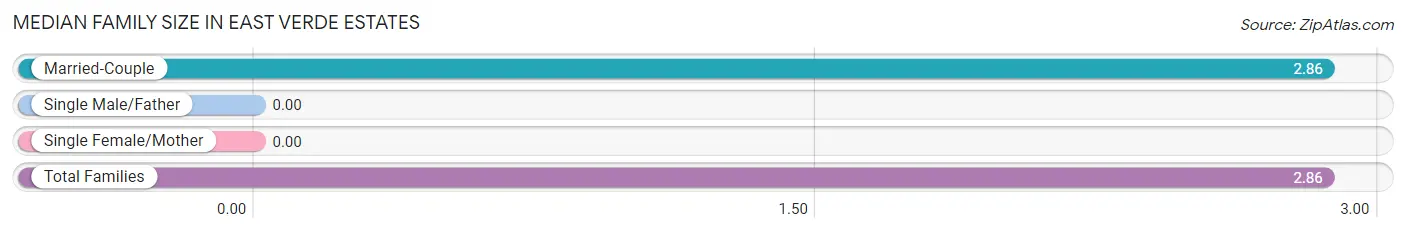
| Family Type | # Families | Family Size |
| Married-Couple | 43 (100.0%) | 2.86 |
| Single Male/Father | 0 (0.0%) | - |
| Single Female/Mother | 0 (0.0%) | - |
| Total Families | 43 (100.0%) | 2.86 |
Median Household Size in East Verde Estates
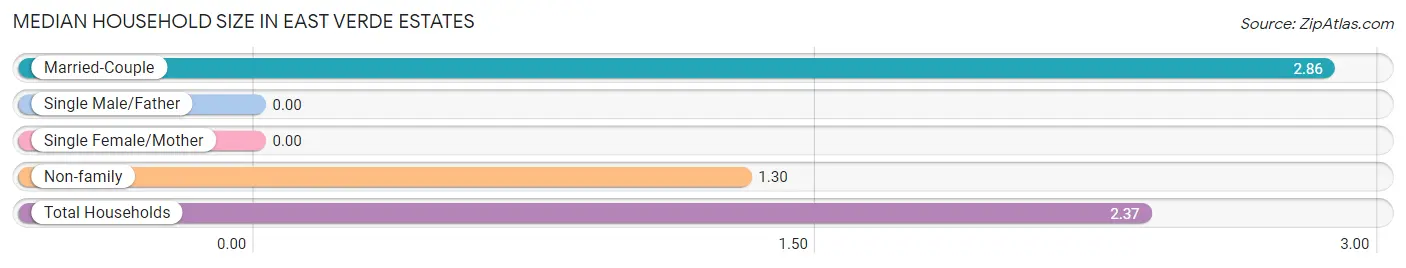
| Household Type | # Households | Household Size |
| Married-Couple | 43 (68.2%) | 2.86 |
| Single Male/Father | 0 (0.0%) | - |
| Single Female/Mother | 0 (0.0%) | - |
| Non-family | 20 (31.8%) | 1.30 |
| Total Households | 63 (100.0%) | 2.37 |
Household Size by Marriage Status in East Verde Estates
Out of a total of 63 households in East Verde Estates, 43 (68.2%) are family households, while 20 (31.8%) are nonfamily households. The most numerous type of family households are 2-person households, comprising 28, and the most common type of nonfamily households are 2-person households, comprising 13.
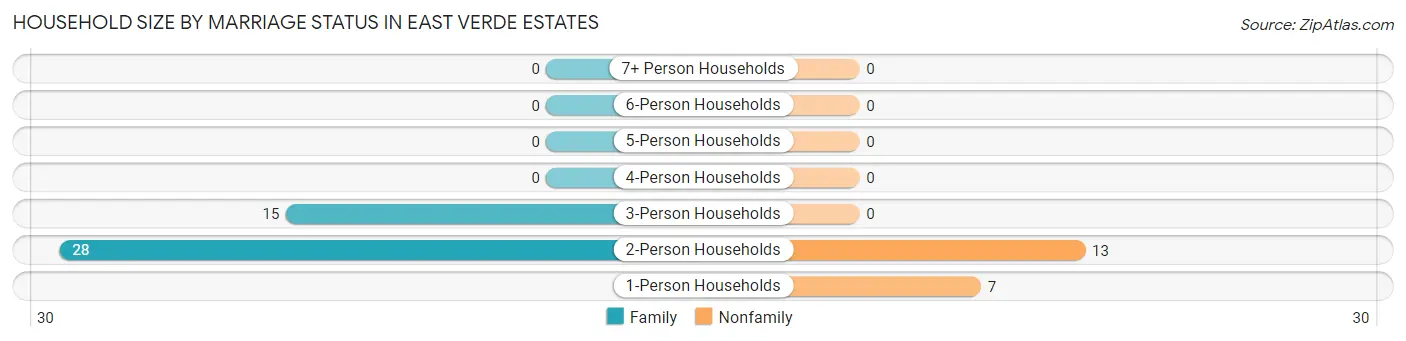
| Household Size | Family Households | Nonfamily Households |
| 1-Person Households | - | 7 (11.1%) |
| 2-Person Households | 28 (44.4%) | 13 (20.6%) |
| 3-Person Households | 15 (23.8%) | 0 (0.0%) |
| 4-Person Households | 0 (0.0%) | 0 (0.0%) |
| 5-Person Households | 0 (0.0%) | 0 (0.0%) |
| 6-Person Households | 0 (0.0%) | 0 (0.0%) |
| 7+ Person Households | 0 (0.0%) | 0 (0.0%) |
| Total | 43 (68.2%) | 20 (31.8%) |
Female Fertility in East Verde Estates
Fertility by Age in East Verde Estates
| Age Bracket | Women with Births | Births / 1,000 Women |
| 15 to 19 years | 0 (0.0%) | 0.0 |
| 20 to 34 years | 0 (0.0%) | 0.0 |
| 35 to 50 years | 0 (0.0%) | 0.0 |
| Total | 0 (0.0%) | 0.0 |
Fertility by Age by Marriage Status in East Verde Estates
| Age Bracket | Married | Unmarried |
| 15 to 19 years | 0 (0.0%) | 0 (0.0%) |
| 20 to 34 years | 0 (0.0%) | 0 (0.0%) |
| 35 to 50 years | 0 (0.0%) | 0 (0.0%) |
| Total | 0 (0.0%) | 0 (0.0%) |
Fertility by Education in East Verde Estates
| Educational Attainment | Women with Births | Births / 1,000 Women |
| Less than High School | 0 (0.0%) | 0.0 |
| High School Diploma | 0 (0.0%) | 0.0 |
| College or Associate's Degree | 0 (0.0%) | 0.0 |
| Bachelor's Degree | 0 (0.0%) | 0.0 |
| Graduate Degree | 0 (0.0%) | 0.0 |
| Total | 0 (0.0%) | 0.0 |
Fertility by Education by Marriage Status in East Verde Estates
| Educational Attainment | Married | Unmarried |
| Less than High School | 0 (0.0%) | 0 (0.0%) |
| High School Diploma | 0 (0.0%) | 0 (0.0%) |
| College or Associate's Degree | 0 (0.0%) | 0 (0.0%) |
| Bachelor's Degree | 0 (0.0%) | 0 (0.0%) |
| Graduate Degree | 0 (0.0%) | 0 (0.0%) |
| Total | 0 (0.0%) | 0 (0.0%) |
Employment Characteristics in East Verde Estates
Employment by Class of Employer in East Verde Estates
Among the 72 employed individuals in East Verde Estates, private company employees (37 | 51.4%), self-employed (incorporated) (20 | 27.8%), and state government employees (15 | 20.8%) make up the most common classes of employment.
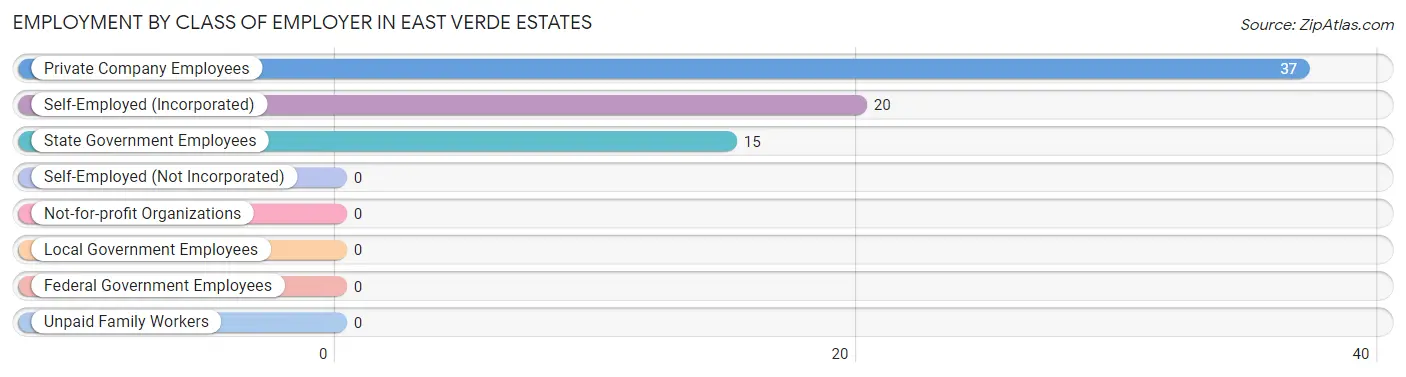
| Employer Class | # Employees | % Employees |
| Private Company Employees | 37 | 51.4% |
| Self-Employed (Incorporated) | 20 | 27.8% |
| Self-Employed (Not Incorporated) | 0 | 0.0% |
| Not-for-profit Organizations | 0 | 0.0% |
| Local Government Employees | 0 | 0.0% |
| State Government Employees | 15 | 20.8% |
| Federal Government Employees | 0 | 0.0% |
| Unpaid Family Workers | 0 | 0.0% |
| Total | 72 | 100.0% |
Employment Status by Age in East Verde Estates
According to the labor force statistics for East Verde Estates, out of the total population over 16 years of age (149), 57.0% or 85 individuals are in the labor force, with 15.3% or 13 of them unemployed. The age group with the highest labor force participation rate is 25 to 29 years, with 100.0% or 31 individuals in the labor force. Within the labor force, the 45 to 54 years age range has the highest percentage of unemployed individuals, with 46.4% or 13 of them being unemployed.
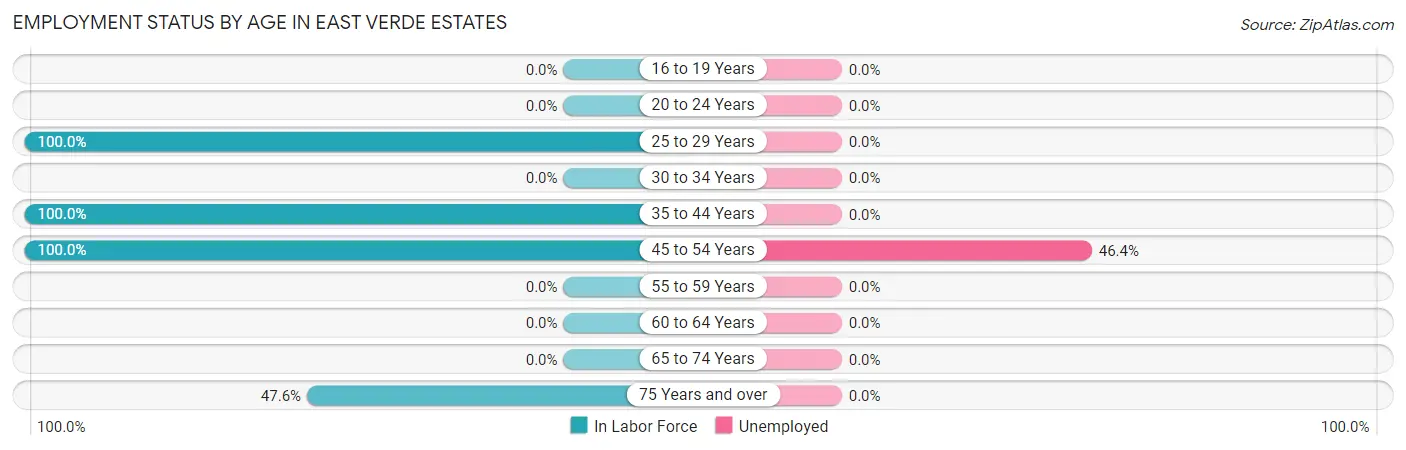
| Age Bracket | In Labor Force | Unemployed |
| 16 to 19 Years | 0 (0.0%) | 0 (0.0%) |
| 20 to 24 Years | 0 (0.0%) | 0 (0.0%) |
| 25 to 29 Years | 31 (100.0%) | 0 (0.0%) |
| 30 to 34 Years | 0 (0.0%) | 0 (0.0%) |
| 35 to 44 Years | 6 (100.0%) | 0 (0.0%) |
| 45 to 54 Years | 28 (100.0%) | 13 (46.4%) |
| 55 to 59 Years | 0 (0.0%) | 0 (0.0%) |
| 60 to 64 Years | 0 (0.0%) | 0 (0.0%) |
| 65 to 74 Years | 0 (0.0%) | 0 (0.0%) |
| 75 Years and over | 20 (47.6%) | 0 (0.0%) |
| Total | 85 (57.0%) | 13 (15.3%) |
Employment Status by Educational Attainment in East Verde Estates
According to labor force statistics for East Verde Estates, 77.4% of individuals (65) out of the total population between 25 and 64 years of age (84) are in the labor force, with 20.0% or 13 of them being unemployed. The group with the highest labor force participation rate are those with the educational attainment of less than high school, with 100.0% or 46 individuals in the labor force. Within the labor force, individuals with college / associate degree education have the highest percentage of unemployment, with 100.0% or 13 of them being unemployed.
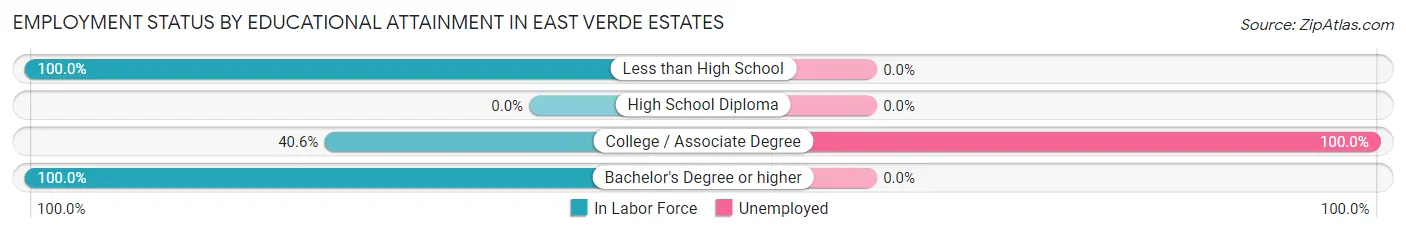
| Educational Attainment | In Labor Force | Unemployed |
| Less than High School | 46 (100.0%) | 0 (0.0%) |
| High School Diploma | 0 (0.0%) | 0 (0.0%) |
| College / Associate Degree | 13 (40.6%) | 32 (100.0%) |
| Bachelor's Degree or higher | 6 (100.0%) | 0 (0.0%) |
| Total | 65 (77.4%) | 17 (20.0%) |
Employment Occupations by Sex in East Verde Estates
Management, Business, Science and Arts Occupations
The most common Management, Business, Science and Arts occupations in East Verde Estates are Computers, Engineering & Science (20 | 27.8%), Architecture & Engineering (20 | 27.8%), Community & Social Service (15 | 20.8%), and Education Instruction & Library (15 | 20.8%).
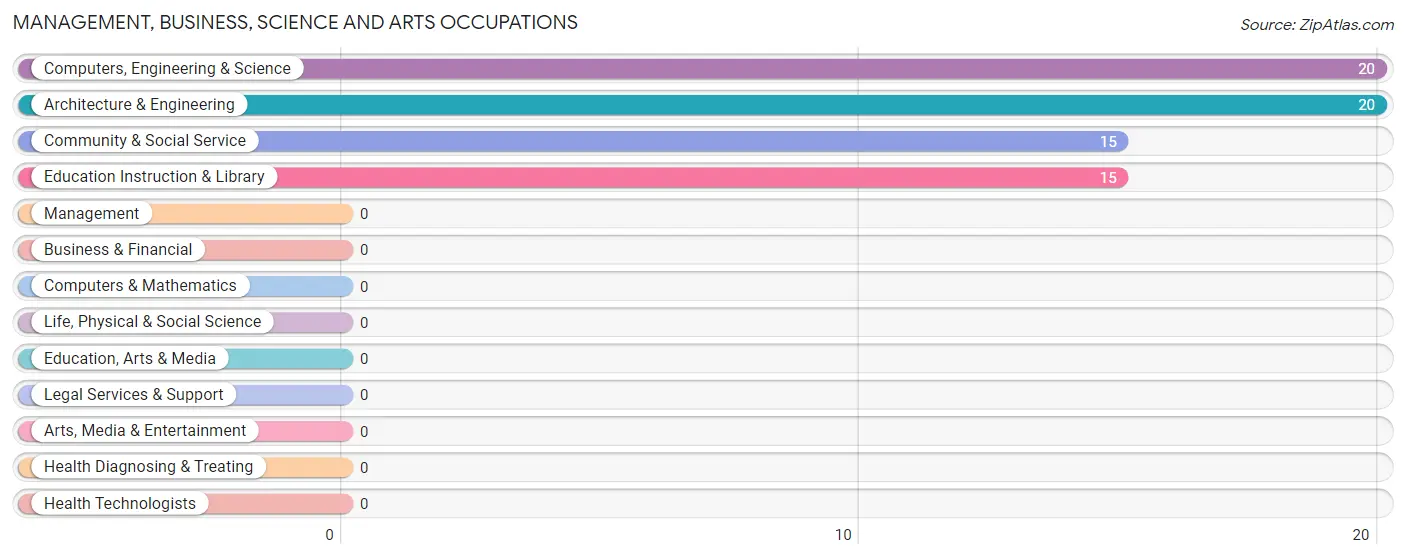
Management, Business, Science and Arts Occupations by Sex
Within the Management, Business, Science and Arts occupations in East Verde Estates, the most male-oriented occupations are Computers, Engineering & Science (100.0%), and Architecture & Engineering (100.0%), while the most female-oriented occupations are Community & Social Service (100.0%), and Education Instruction & Library (100.0%).
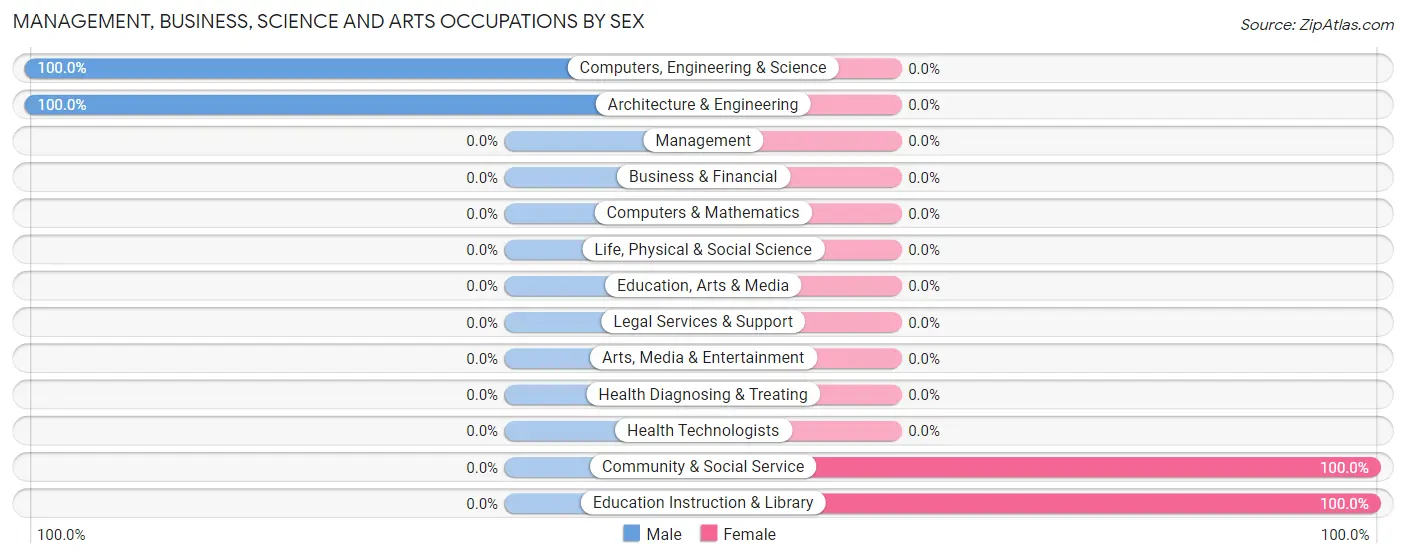
| Occupation | Male | Female |
| Management | 0 (0.0%) | 0 (0.0%) |
| Business & Financial | 0 (0.0%) | 0 (0.0%) |
| Computers, Engineering & Science | 20 (100.0%) | 0 (0.0%) |
| Computers & Mathematics | 0 (0.0%) | 0 (0.0%) |
| Architecture & Engineering | 20 (100.0%) | 0 (0.0%) |
| Life, Physical & Social Science | 0 (0.0%) | 0 (0.0%) |
| Community & Social Service | 0 (0.0%) | 15 (100.0%) |
| Education, Arts & Media | 0 (0.0%) | 0 (0.0%) |
| Legal Services & Support | 0 (0.0%) | 0 (0.0%) |
| Education Instruction & Library | 0 (0.0%) | 15 (100.0%) |
| Arts, Media & Entertainment | 0 (0.0%) | 0 (0.0%) |
| Health Diagnosing & Treating | 0 (0.0%) | 0 (0.0%) |
| Health Technologists | 0 (0.0%) | 0 (0.0%) |
| Total (Category) | 20 (57.1%) | 15 (42.9%) |
| Total (Overall) | 51 (70.8%) | 21 (29.2%) |
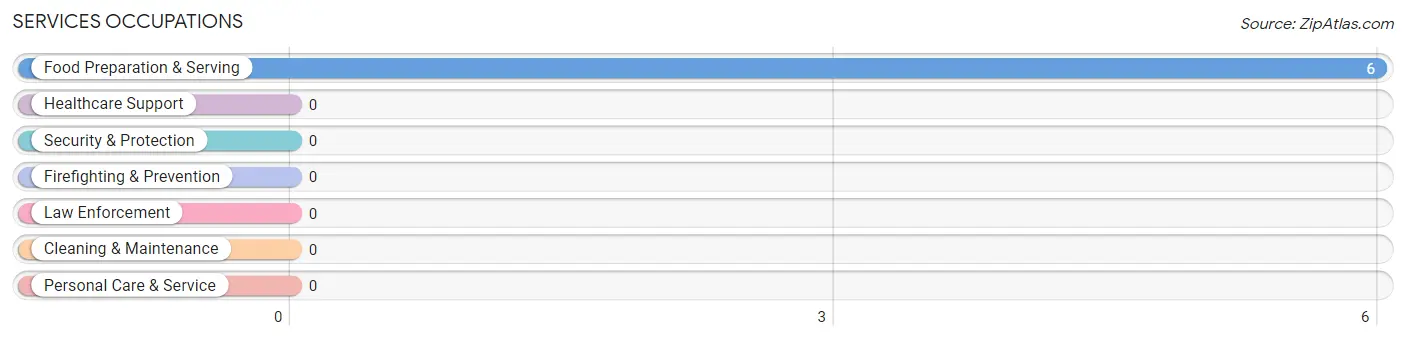
Services Occupations
The most common Services occupations in East Verde Estates are , and Food Preparation & Serving (6 | 8.3%).
Services Occupations by Sex
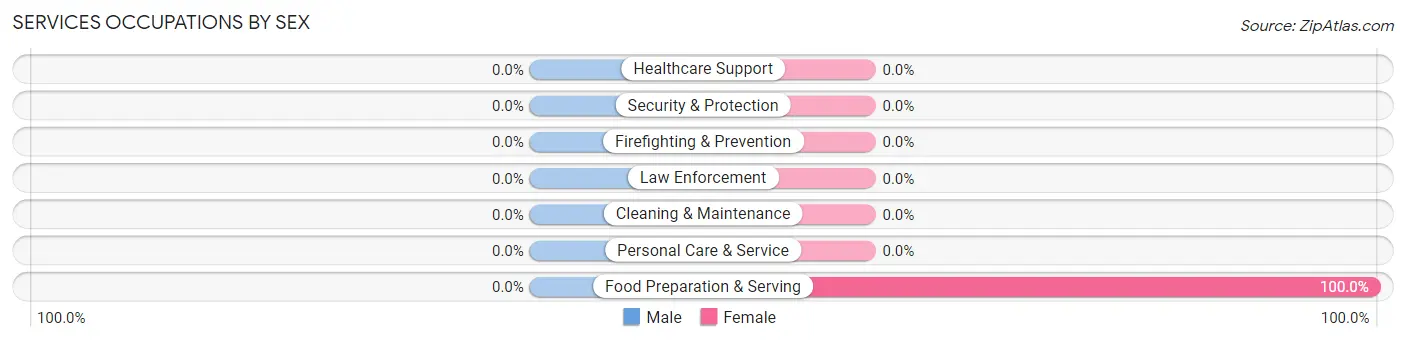
| Occupation | Male | Female |
| Healthcare Support | 0 (0.0%) | 0 (0.0%) |
| Security & Protection | 0 (0.0%) | 0 (0.0%) |
| Firefighting & Prevention | 0 (0.0%) | 0 (0.0%) |
| Law Enforcement | 0 (0.0%) | 0 (0.0%) |
| Food Preparation & Serving | 0 (0.0%) | 6 (100.0%) |
| Cleaning & Maintenance | 0 (0.0%) | 0 (0.0%) |
| Personal Care & Service | 0 (0.0%) | 0 (0.0%) |
| Total (Category) | 0 (0.0%) | 6 (100.0%) |
| Total (Overall) | 51 (70.8%) | 21 (29.2%) |
Sales and Office Occupations
The most common Sales and Office occupations in East Verde Estates are , and Office & Administration (31 | 43.1%).

Sales and Office Occupations by Sex

| Occupation | Male | Female |
| Sales & Related | 0 (0.0%) | 0 (0.0%) |
| Office & Administration | 31 (100.0%) | 0 (0.0%) |
| Total (Category) | 31 (100.0%) | 0 (0.0%) |
| Total (Overall) | 51 (70.8%) | 21 (29.2%) |
Natural Resources, Construction and Maintenance Occupations
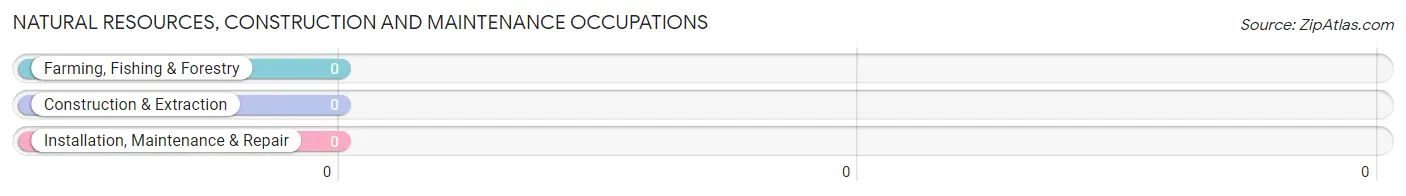
Natural Resources, Construction and Maintenance Occupations by Sex
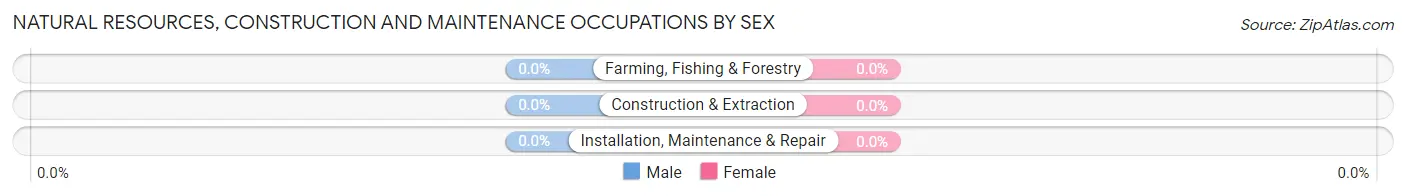
| Occupation | Male | Female |
| Farming, Fishing & Forestry | 0 (0.0%) | 0 (0.0%) |
| Construction & Extraction | 0 (0.0%) | 0 (0.0%) |
| Installation, Maintenance & Repair | 0 (0.0%) | 0 (0.0%) |
| Total (Category) | 0 (0.0%) | 0 (0.0%) |
| Total (Overall) | 51 (70.8%) | 21 (29.2%) |
Production, Transportation and Moving Occupations
Production, Transportation and Moving Occupations by Sex
| Occupation | Male | Female |
| Production | 0 (0.0%) | 0 (0.0%) |
| Transportation | 0 (0.0%) | 0 (0.0%) |
| Material Moving | 0 (0.0%) | 0 (0.0%) |
| Total (Category) | 0 (0.0%) | 0 (0.0%) |
| Total (Overall) | 51 (70.8%) | 21 (29.2%) |
Employment Industries by Sex in East Verde Estates
Employment Industries in East Verde Estates
The major employment industries in East Verde Estates include Retail Trade (31 | 43.1%), Professional & Scientific (20 | 27.8%), Educational Services (15 | 20.8%), and Manufacturing (6 | 8.3%).
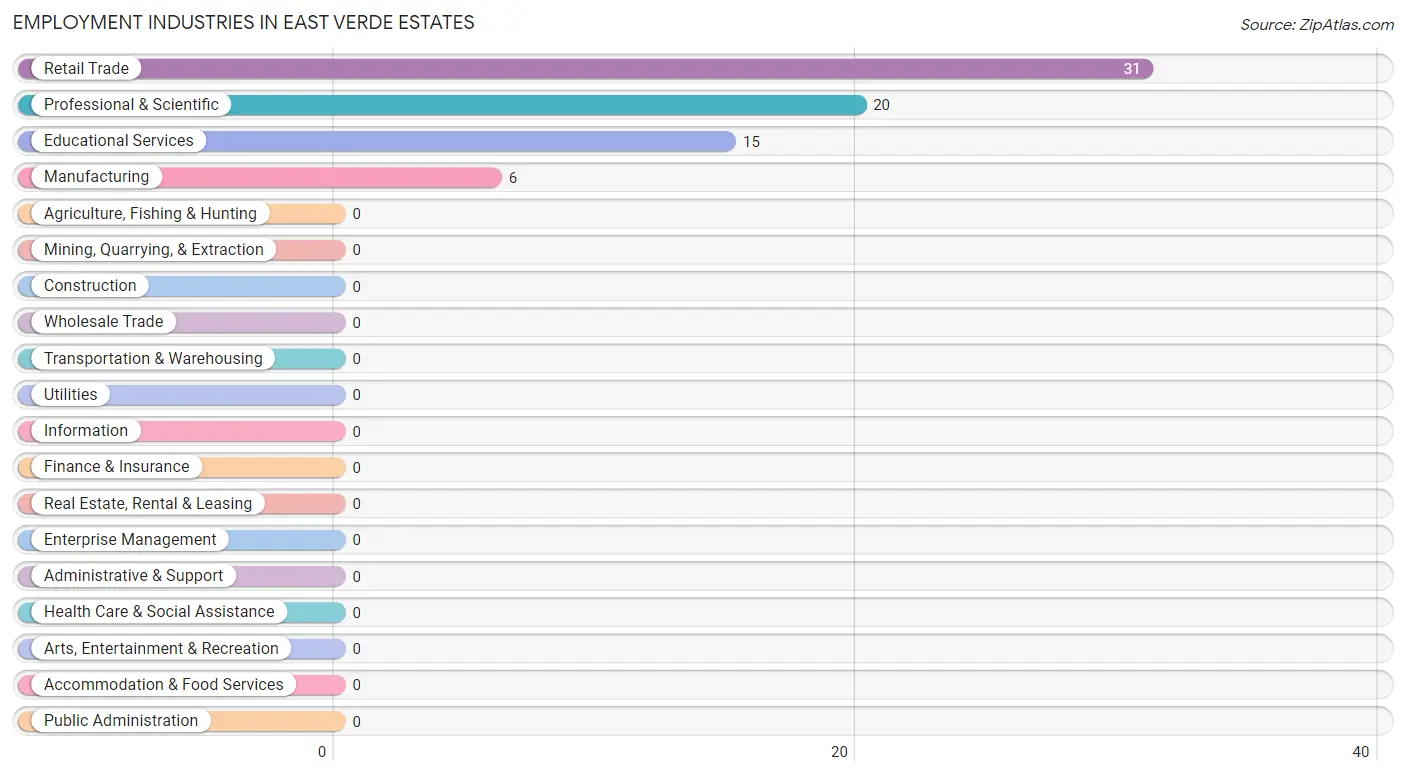
Employment Industries by Sex in East Verde Estates
The East Verde Estates industries that see more men than women are Retail Trade (100.0%), and Professional & Scientific (100.0%), whereas the industries that tend to have a higher number of women are Manufacturing (100.0%), and Educational Services (100.0%).
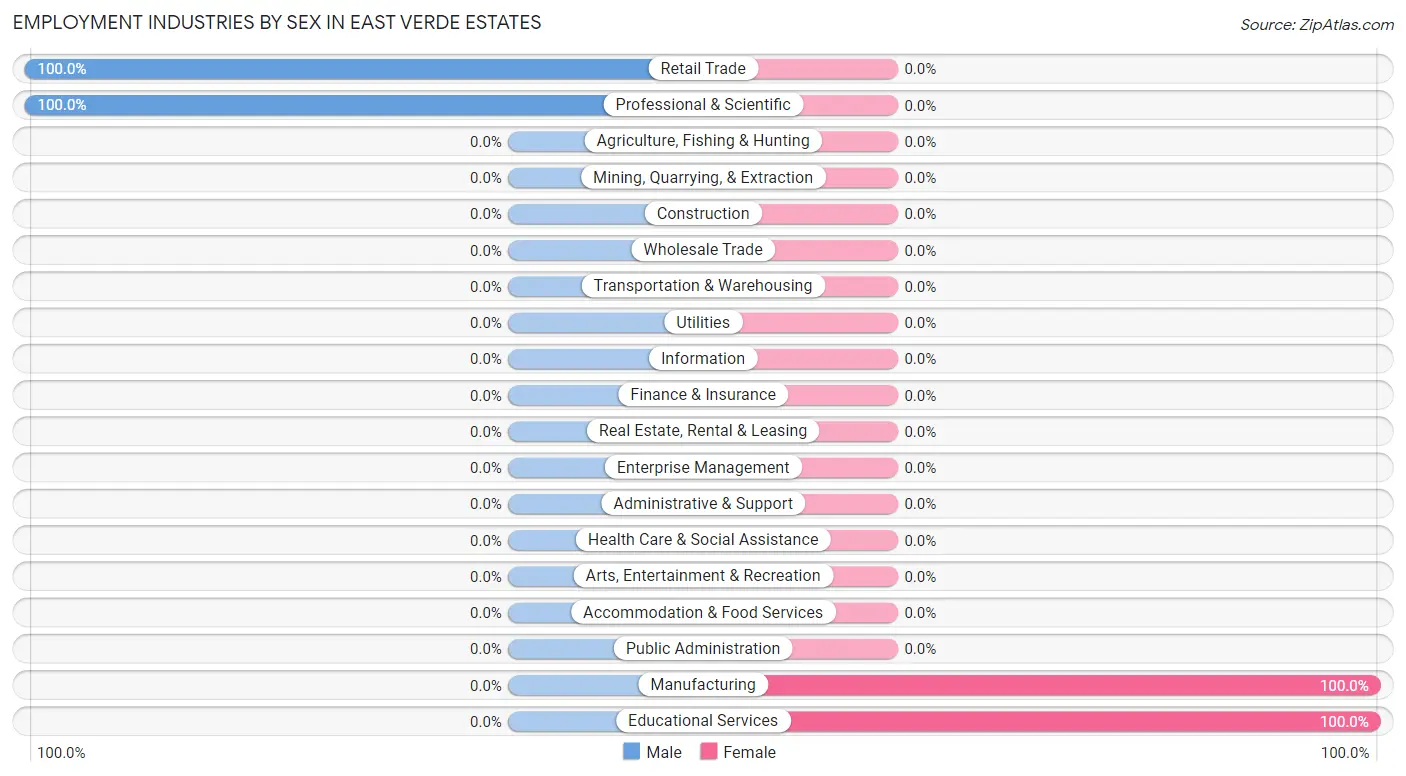
| Industry | Male | Female |
| Agriculture, Fishing & Hunting | 0 (0.0%) | 0 (0.0%) |
| Mining, Quarrying, & Extraction | 0 (0.0%) | 0 (0.0%) |
| Construction | 0 (0.0%) | 0 (0.0%) |
| Manufacturing | 0 (0.0%) | 6 (100.0%) |
| Wholesale Trade | 0 (0.0%) | 0 (0.0%) |
| Retail Trade | 31 (100.0%) | 0 (0.0%) |
| Transportation & Warehousing | 0 (0.0%) | 0 (0.0%) |
| Utilities | 0 (0.0%) | 0 (0.0%) |
| Information | 0 (0.0%) | 0 (0.0%) |
| Finance & Insurance | 0 (0.0%) | 0 (0.0%) |
| Real Estate, Rental & Leasing | 0 (0.0%) | 0 (0.0%) |
| Professional & Scientific | 20 (100.0%) | 0 (0.0%) |
| Enterprise Management | 0 (0.0%) | 0 (0.0%) |
| Administrative & Support | 0 (0.0%) | 0 (0.0%) |
| Educational Services | 0 (0.0%) | 15 (100.0%) |
| Health Care & Social Assistance | 0 (0.0%) | 0 (0.0%) |
| Arts, Entertainment & Recreation | 0 (0.0%) | 0 (0.0%) |
| Accommodation & Food Services | 0 (0.0%) | 0 (0.0%) |
| Public Administration | 0 (0.0%) | 0 (0.0%) |
| Total | 51 (70.8%) | 21 (29.2%) |
Education in East Verde Estates
School Enrollment in East Verde Estates
| School Level | # Students | % Students |
| Nursery / Preschool | 0 | 0.0% |
| Kindergarten | 0 | 0.0% |
| Elementary School | 0 | 0.0% |
| Middle School | 0 | 0.0% |
| High School | 0 | 0.0% |
| College / Undergraduate | 0 | 0.0% |
| Graduate / Professional | 0 | 0.0% |
| Total | 0 | 0.0% |
School Enrollment by Age by Funding Source in East Verde Estates
| Age Bracket | Public School | Private School |
| 3 to 4 Year Olds | 0 (0.0%) | 0 (0.0%) |
| 5 to 9 Year Old | 0 (0.0%) | 0 (0.0%) |
| 10 to 14 Year Olds | 0 (0.0%) | 0 (0.0%) |
| 15 to 17 Year Olds | 0 (0.0%) | 0 (0.0%) |
| 18 to 19 Year Olds | 0 (0.0%) | 0 (0.0%) |
| 20 to 24 Year Olds | 0 (0.0%) | 0 (0.0%) |
| 25 to 34 Year Olds | 0 (0.0%) | 0 (0.0%) |
| 35 Years and over | 0 (0.0%) | 0 (0.0%) |
| Total | 0 (0.0%) | 0 (0.0%) |
Educational Attainment by Field of Study in East Verde Estates
Education (14 | 70.0%), and bio, nature & agricultural (6 | 30.0%) are the most common fields of study among 20 individuals in East Verde Estates who have obtained a bachelor's degree or higher.
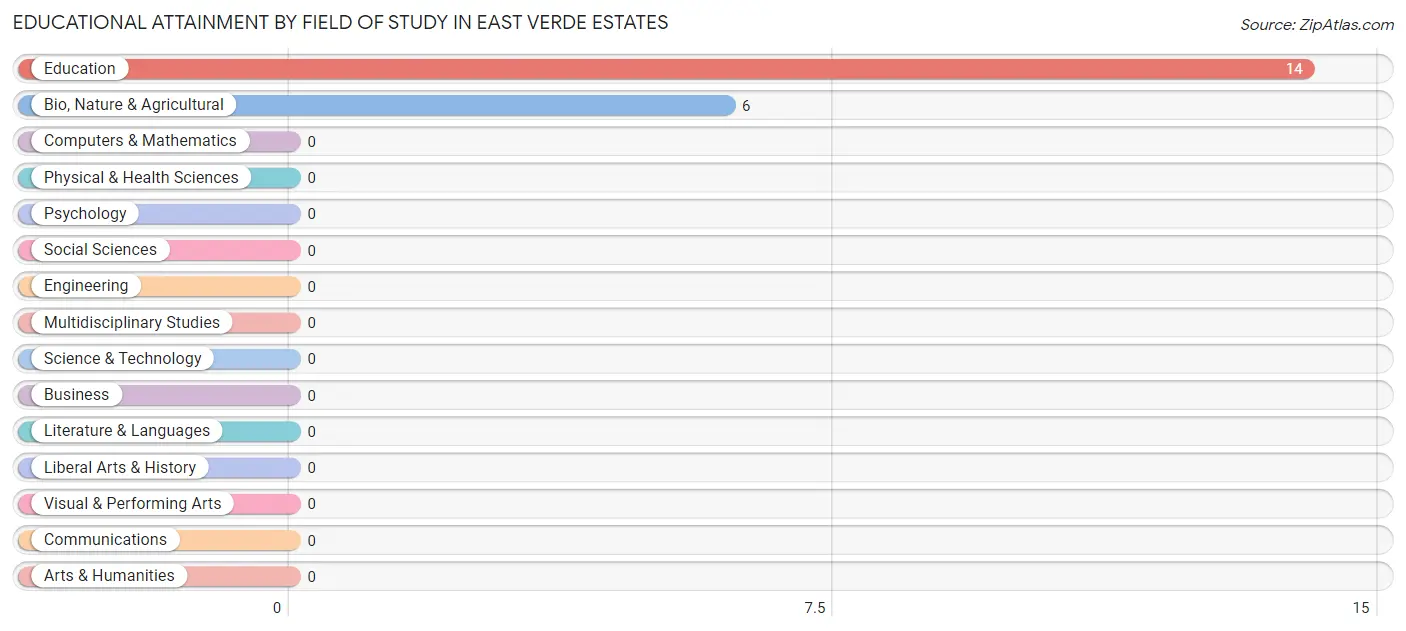
| Field of Study | # Graduates | % Graduates |
| Computers & Mathematics | 0 | 0.0% |
| Bio, Nature & Agricultural | 6 | 30.0% |
| Physical & Health Sciences | 0 | 0.0% |
| Psychology | 0 | 0.0% |
| Social Sciences | 0 | 0.0% |
| Engineering | 0 | 0.0% |
| Multidisciplinary Studies | 0 | 0.0% |
| Science & Technology | 0 | 0.0% |
| Business | 0 | 0.0% |
| Education | 14 | 70.0% |
| Literature & Languages | 0 | 0.0% |
| Liberal Arts & History | 0 | 0.0% |
| Visual & Performing Arts | 0 | 0.0% |
| Communications | 0 | 0.0% |
| Arts & Humanities | 0 | 0.0% |
| Total | 20 | 100.0% |
Transportation & Commute in East Verde Estates
Vehicle Availability by Sex in East Verde Estates
The most prevalent vehicle ownership categories in East Verde Estates are males with 2 vehicles (51, accounting for 100.0%) and females with 2 vehicles (15, making up 242.9%).
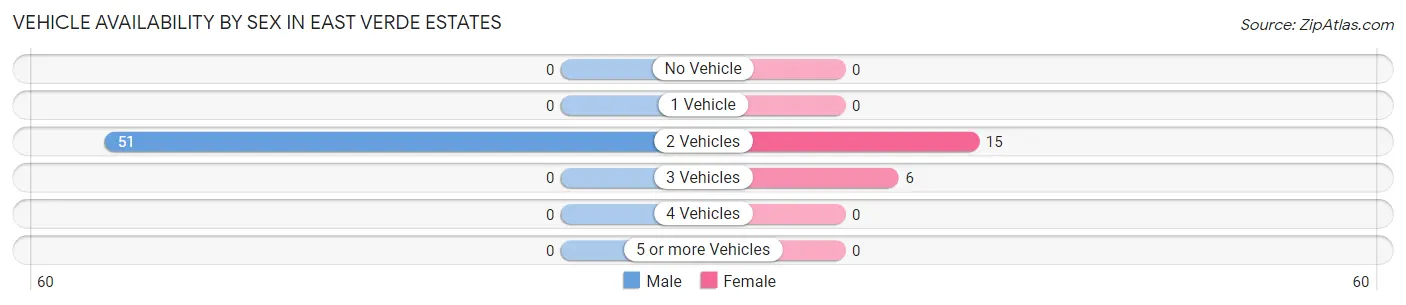
| Vehicles Available | Male | Female |
| No Vehicle | 0 (0.0%) | 0 (0.0%) |
| 1 Vehicle | 0 (0.0%) | 0 (0.0%) |
| 2 Vehicles | 51 (100.0%) | 15 (71.4%) |
| 3 Vehicles | 0 (0.0%) | 6 (28.6%) |
| 4 Vehicles | 0 (0.0%) | 0 (0.0%) |
| 5 or more Vehicles | 0 (0.0%) | 0 (0.0%) |
| Total | 51 (100.0%) | 21 (100.0%) |
Commute Time in East Verde Estates
The most frequently occuring commute durations in East Verde Estates are 10 to 14 minutes (46 commuters, 88.5%), 5 to 9 minutes (6 commuters, 11.5%), and less than 5 minutes (0 commuters, 0.0%).
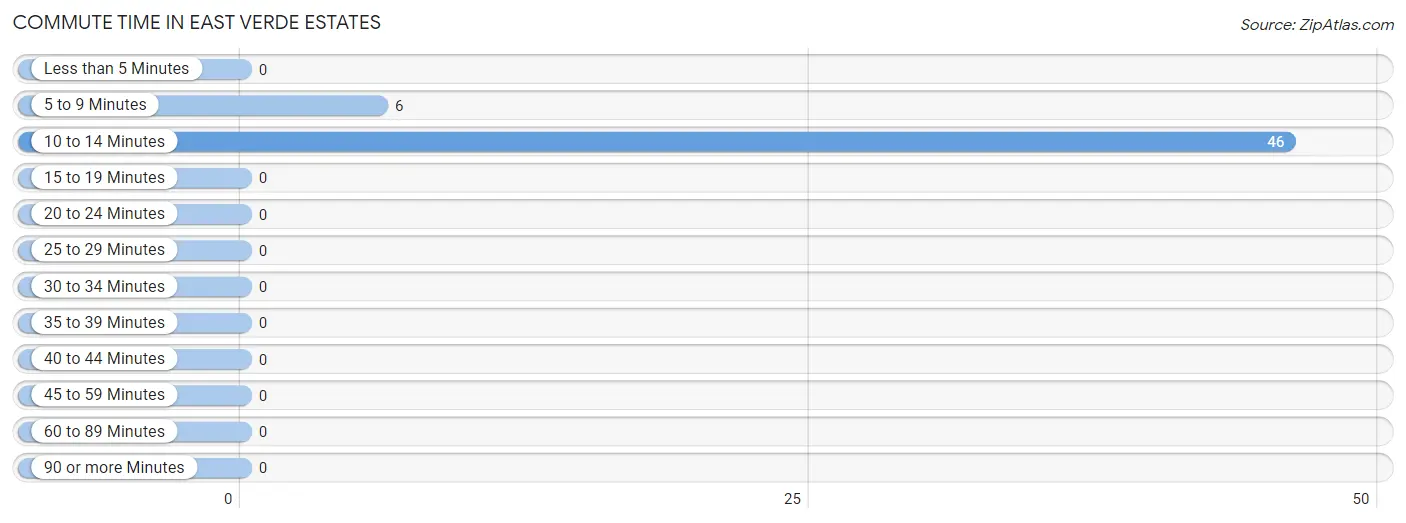
| Commute Time | # Commuters | % Commuters |
| Less than 5 Minutes | 0 | 0.0% |
| 5 to 9 Minutes | 6 | 11.5% |
| 10 to 14 Minutes | 46 | 88.5% |
| 15 to 19 Minutes | 0 | 0.0% |
| 20 to 24 Minutes | 0 | 0.0% |
| 25 to 29 Minutes | 0 | 0.0% |
| 30 to 34 Minutes | 0 | 0.0% |
| 35 to 39 Minutes | 0 | 0.0% |
| 40 to 44 Minutes | 0 | 0.0% |
| 45 to 59 Minutes | 0 | 0.0% |
| 60 to 89 Minutes | 0 | 0.0% |
| 90 or more Minutes | 0 | 0.0% |
Commute Time by Sex in East Verde Estates
The most common commute times in East Verde Estates are 10 to 14 minutes (31 commuters, 100.0%) for males and 10 to 14 minutes (15 commuters, 71.4%) for females.
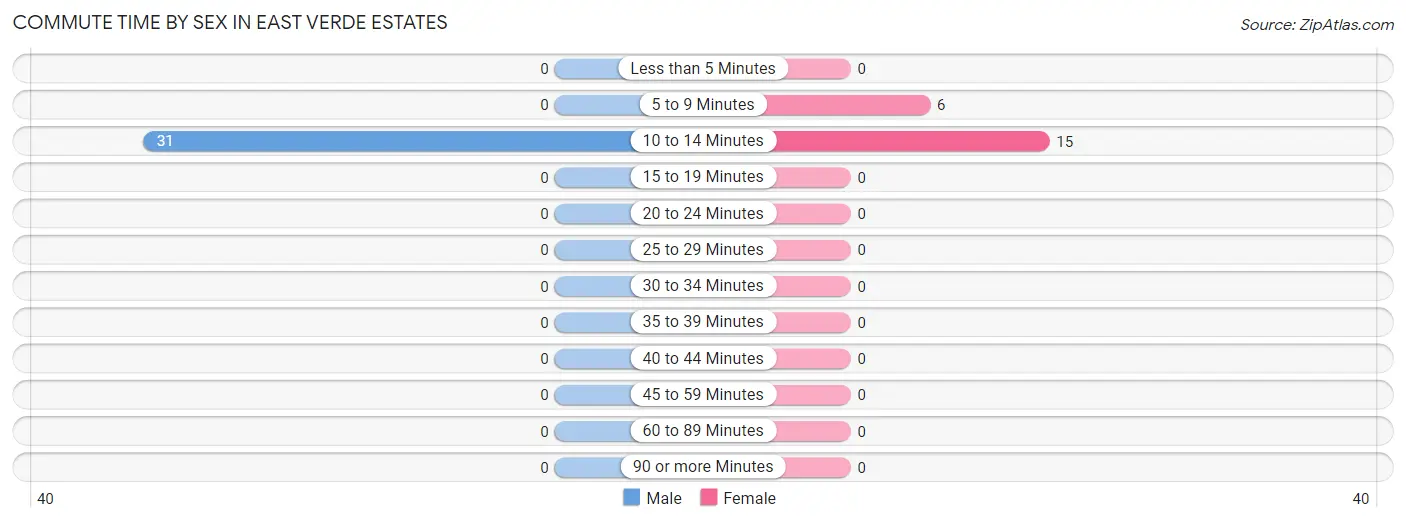
| Commute Time | Male | Female |
| Less than 5 Minutes | 0 (0.0%) | 0 (0.0%) |
| 5 to 9 Minutes | 0 (0.0%) | 6 (28.6%) |
| 10 to 14 Minutes | 31 (100.0%) | 15 (71.4%) |
| 15 to 19 Minutes | 0 (0.0%) | 0 (0.0%) |
| 20 to 24 Minutes | 0 (0.0%) | 0 (0.0%) |
| 25 to 29 Minutes | 0 (0.0%) | 0 (0.0%) |
| 30 to 34 Minutes | 0 (0.0%) | 0 (0.0%) |
| 35 to 39 Minutes | 0 (0.0%) | 0 (0.0%) |
| 40 to 44 Minutes | 0 (0.0%) | 0 (0.0%) |
| 45 to 59 Minutes | 0 (0.0%) | 0 (0.0%) |
| 60 to 89 Minutes | 0 (0.0%) | 0 (0.0%) |
| 90 or more Minutes | 0 (0.0%) | 0 (0.0%) |
Time of Departure to Work by Sex in East Verde Estates
The most frequent times of departure to work in East Verde Estates are 6:30 AM to 6:59 AM (31, 100.0%) for males and 7:00 AM to 7:29 AM (15, 71.4%) for females.
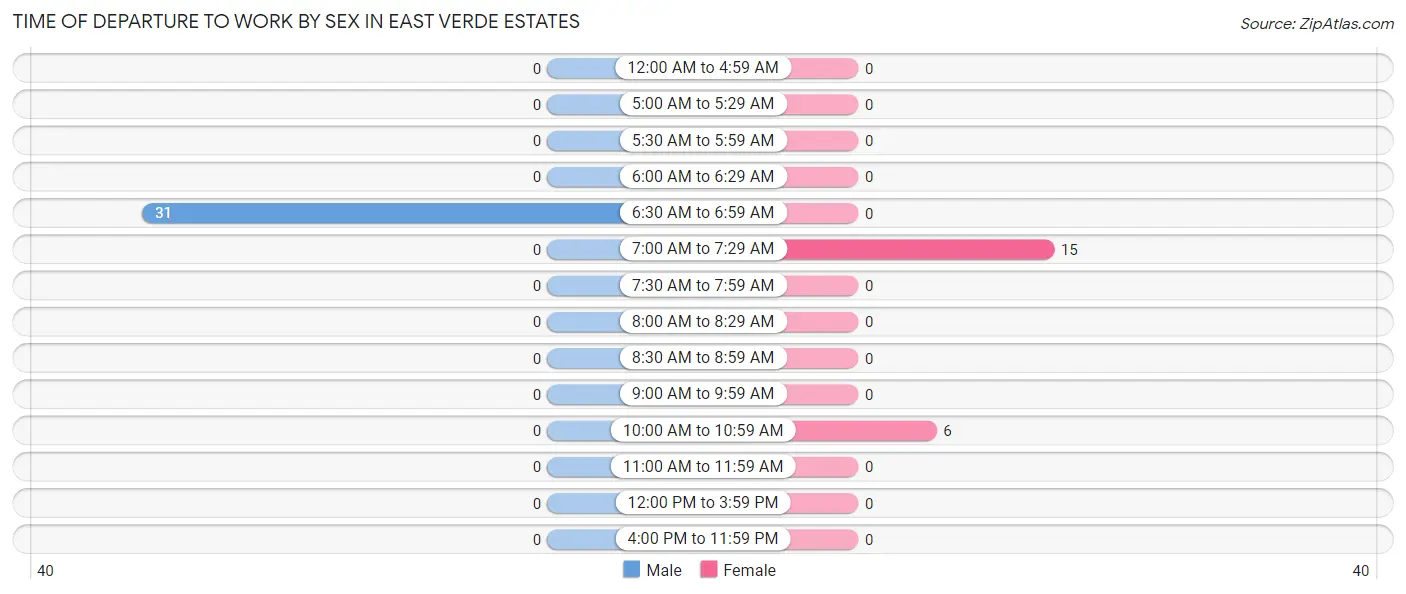
| Time of Departure | Male | Female |
| 12:00 AM to 4:59 AM | 0 (0.0%) | 0 (0.0%) |
| 5:00 AM to 5:29 AM | 0 (0.0%) | 0 (0.0%) |
| 5:30 AM to 5:59 AM | 0 (0.0%) | 0 (0.0%) |
| 6:00 AM to 6:29 AM | 0 (0.0%) | 0 (0.0%) |
| 6:30 AM to 6:59 AM | 31 (100.0%) | 0 (0.0%) |
| 7:00 AM to 7:29 AM | 0 (0.0%) | 15 (71.4%) |
| 7:30 AM to 7:59 AM | 0 (0.0%) | 0 (0.0%) |
| 8:00 AM to 8:29 AM | 0 (0.0%) | 0 (0.0%) |
| 8:30 AM to 8:59 AM | 0 (0.0%) | 0 (0.0%) |
| 9:00 AM to 9:59 AM | 0 (0.0%) | 0 (0.0%) |
| 10:00 AM to 10:59 AM | 0 (0.0%) | 6 (28.6%) |
| 11:00 AM to 11:59 AM | 0 (0.0%) | 0 (0.0%) |
| 12:00 PM to 3:59 PM | 0 (0.0%) | 0 (0.0%) |
| 4:00 PM to 11:59 PM | 0 (0.0%) | 0 (0.0%) |
| Total | 31 (100.0%) | 21 (100.0%) |
Housing Occupancy in East Verde Estates
Occupancy by Ownership in East Verde Estates
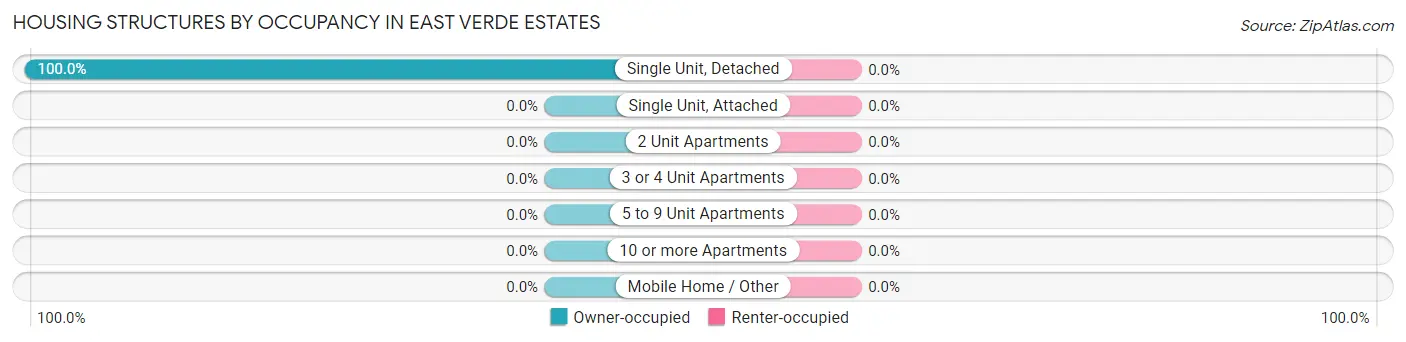
Of the total 63 dwellings in East Verde Estates, owner-occupied units account for 63 (100.0%), while renter-occupied units make up 0 (0.0%).
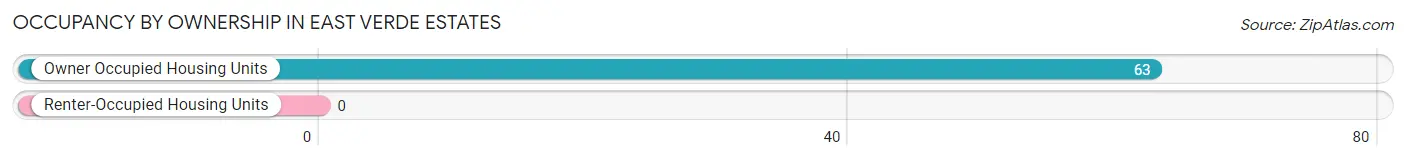
| Occupancy | # Housing Units | % Housing Units |
| Owner Occupied Housing Units | 63 | 100.0% |
| Renter-Occupied Housing Units | 0 | 0.0% |
| Total Occupied Housing Units | 63 | 100.0% |
Occupancy by Household Size in East Verde Estates
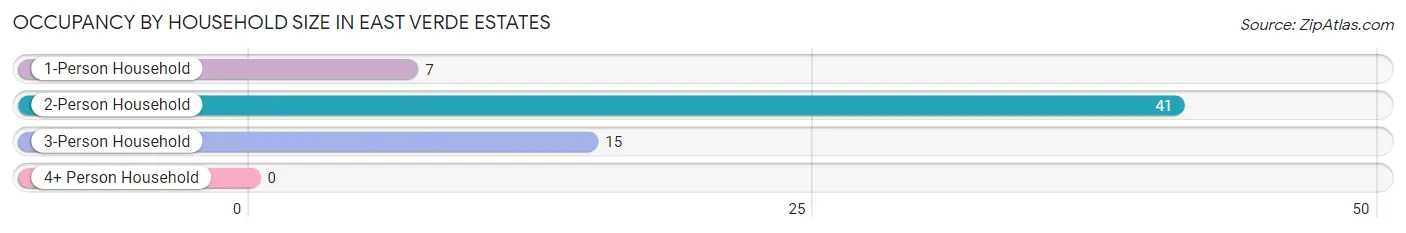
| Household Size | # Housing Units | % Housing Units |
| 1-Person Household | 7 | 11.1% |
| 2-Person Household | 41 | 65.1% |
| 3-Person Household | 15 | 23.8% |
| 4+ Person Household | 0 | 0.0% |
| Total Housing Units | 63 | 100.0% |
Occupancy by Ownership by Household Size in East Verde Estates
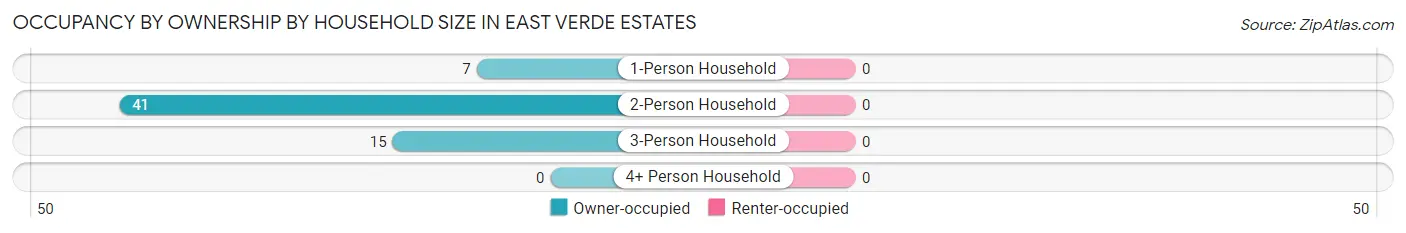
| Household Size | Owner-occupied | Renter-occupied |
| 1-Person Household | 7 (100.0%) | 0 (0.0%) |
| 2-Person Household | 41 (100.0%) | 0 (0.0%) |
| 3-Person Household | 15 (100.0%) | 0 (0.0%) |
| 4+ Person Household | 0 (0.0%) | 0 (0.0%) |
| Total Housing Units | 63 (100.0%) | 0 (0.0%) |
Occupancy by Educational Attainment in East Verde Estates
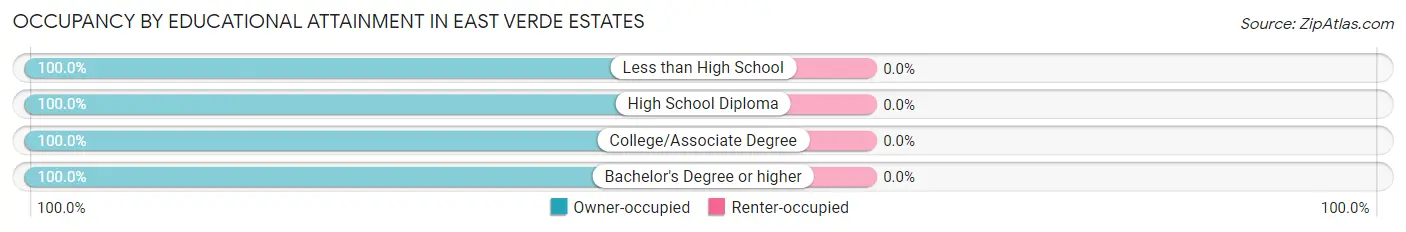
| Household Size | Owner-occupied | Renter-occupied |
| Less than High School | 15 (100.0%) | 0 (0.0%) |
| High School Diploma | 8 (100.0%) | 0 (0.0%) |
| College/Associate Degree | 33 (100.0%) | 0 (0.0%) |
| Bachelor's Degree or higher | 7 (100.0%) | 0 (0.0%) |
Occupancy by Age of Householder in East Verde Estates
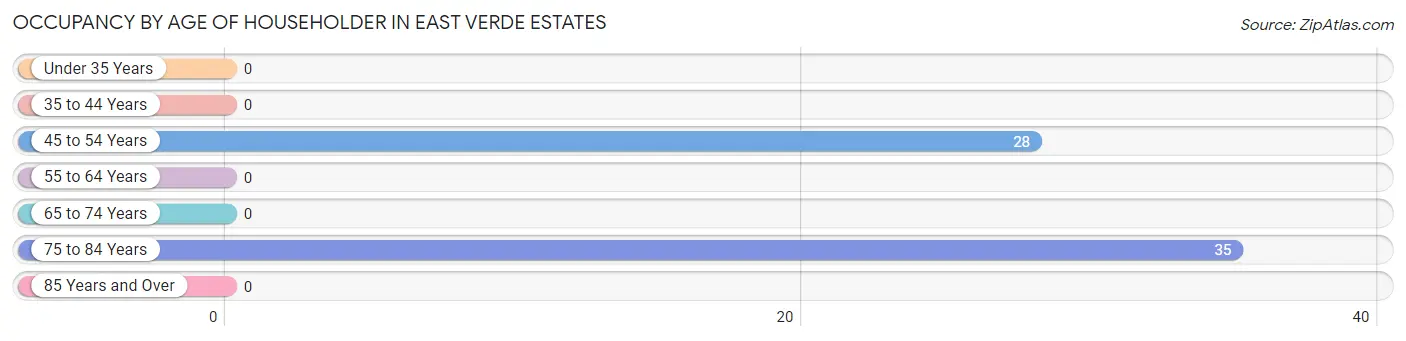
| Age Bracket | # Households | % Households |
| Under 35 Years | 0 | 0.0% |
| 35 to 44 Years | 0 | 0.0% |
| 45 to 54 Years | 28 | 44.4% |
| 55 to 64 Years | 0 | 0.0% |
| 65 to 74 Years | 0 | 0.0% |
| 75 to 84 Years | 35 | 55.6% |
| 85 Years and Over | 0 | 0.0% |
| Total | 63 | 100.0% |
Housing Finances in East Verde Estates
Median Income by Occupancy in East Verde Estates
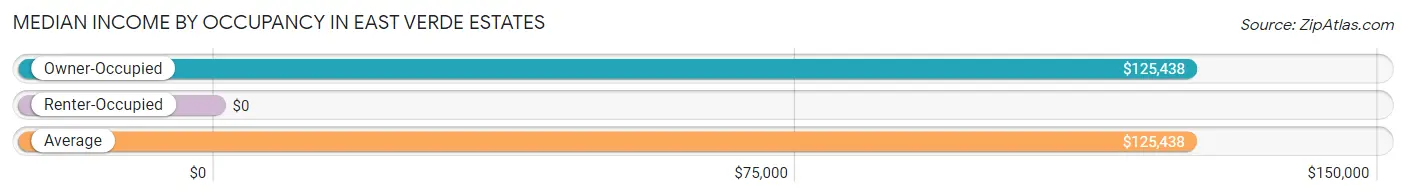
| Occupancy Type | # Households | Median Income |
| Owner-Occupied | 63 (100.0%) | $125,438 |
| Renter-Occupied | 0 (0.0%) | $0 |
| Average | 63 (100.0%) | $125,438 |
Occupancy by Householder Income Bracket in East Verde Estates
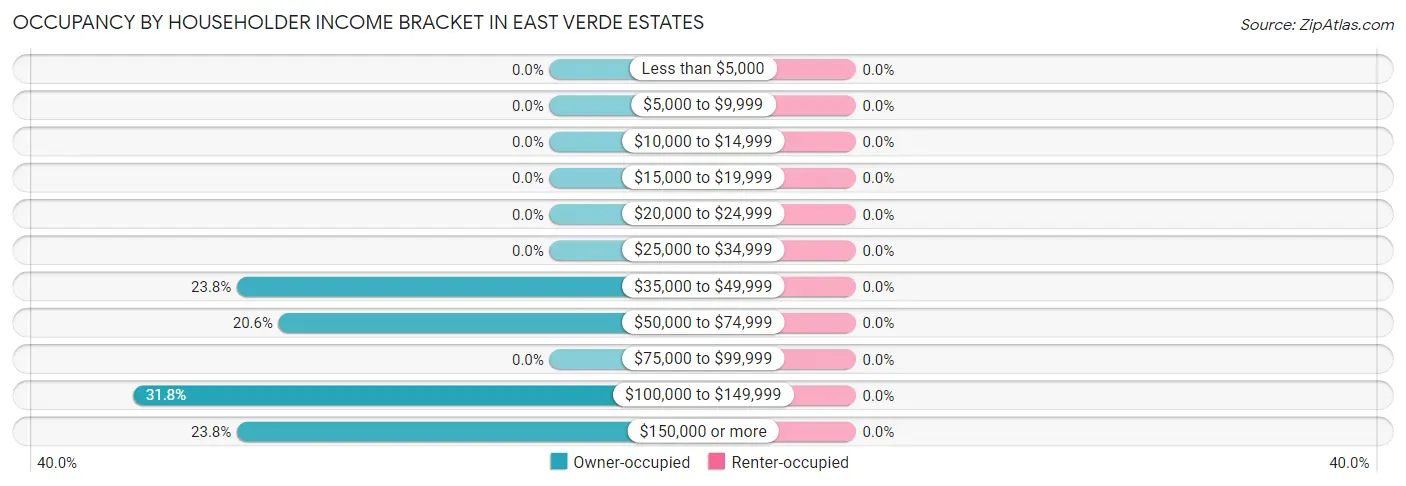
| Income Bracket | Owner-occupied | Renter-occupied |
| Less than $5,000 | 0 (0.0%) | 0 (0.0%) |
| $5,000 to $9,999 | 0 (0.0%) | 0 (0.0%) |
| $10,000 to $14,999 | 0 (0.0%) | 0 (0.0%) |
| $15,000 to $19,999 | 0 (0.0%) | 0 (0.0%) |
| $20,000 to $24,999 | 0 (0.0%) | 0 (0.0%) |
| $25,000 to $34,999 | 0 (0.0%) | 0 (0.0%) |
| $35,000 to $49,999 | 15 (23.8%) | 0 (0.0%) |
| $50,000 to $74,999 | 13 (20.6%) | 0 (0.0%) |
| $75,000 to $99,999 | 0 (0.0%) | 0 (0.0%) |
| $100,000 to $149,999 | 20 (31.8%) | 0 (0.0%) |
| $150,000 or more | 15 (23.8%) | 0 (0.0%) |
| Total | 63 (100.0%) | 0 (0.0%) |
Monthly Housing Cost Tiers in East Verde Estates

| Monthly Cost | Owner-occupied | Renter-occupied |
| Less than $300 | 0 (0.0%) | 0 (0.0%) |
| $300 to $499 | 35 (55.6%) | 0 (0.0%) |
| $500 to $799 | 0 (0.0%) | 0 (0.0%) |
| $800 to $999 | 0 (0.0%) | 0 (0.0%) |
| $1,000 to $1,499 | 13 (20.6%) | 0 (0.0%) |
| $1,500 to $1,999 | 15 (23.8%) | 0 (0.0%) |
| $2,000 to $2,499 | 0 (0.0%) | 0 (0.0%) |
| $2,500 to $2,999 | 0 (0.0%) | 0 (0.0%) |
| $3,000 or more | 0 (0.0%) | 0 (0.0%) |
| Total | 63 (100.0%) | 0 (0.0%) |
Physical Housing Characteristics in East Verde Estates
Housing Structures in East Verde Estates
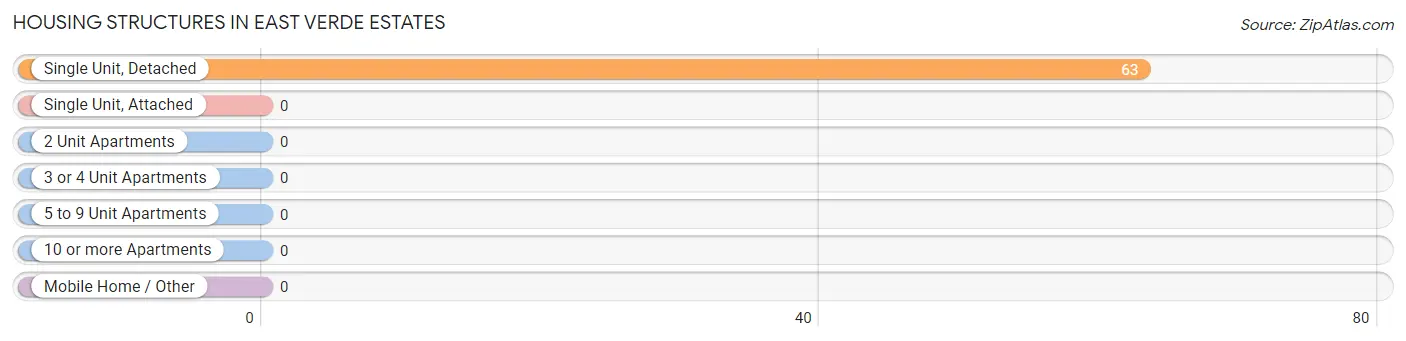
| Structure Type | # Housing Units | % Housing Units |
| Single Unit, Detached | 63 | 100.0% |
| Single Unit, Attached | 0 | 0.0% |
| 2 Unit Apartments | 0 | 0.0% |
| 3 or 4 Unit Apartments | 0 | 0.0% |
| 5 to 9 Unit Apartments | 0 | 0.0% |
| 10 or more Apartments | 0 | 0.0% |
| Mobile Home / Other | 0 | 0.0% |
| Total | 63 | 100.0% |
Housing Structures by Occupancy in East Verde Estates
| Structure Type | Owner-occupied | Renter-occupied |
| Single Unit, Detached | 63 (100.0%) | 0 (0.0%) |
| Single Unit, Attached | 0 (0.0%) | 0 (0.0%) |
| 2 Unit Apartments | 0 (0.0%) | 0 (0.0%) |
| 3 or 4 Unit Apartments | 0 (0.0%) | 0 (0.0%) |
| 5 to 9 Unit Apartments | 0 (0.0%) | 0 (0.0%) |
| 10 or more Apartments | 0 (0.0%) | 0 (0.0%) |
| Mobile Home / Other | 0 (0.0%) | 0 (0.0%) |
| Total | 63 (100.0%) | 0 (0.0%) |
Housing Structures by Number of Rooms in East Verde Estates
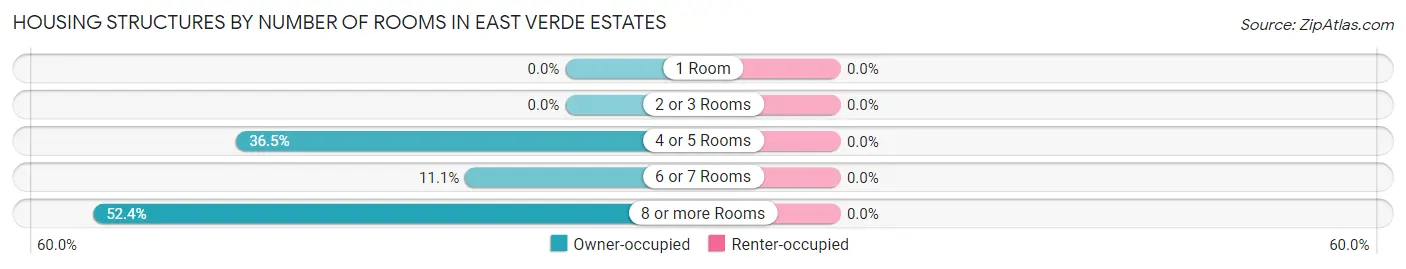
| Number of Rooms | Owner-occupied | Renter-occupied |
| 1 Room | 0 (0.0%) | 0 (0.0%) |
| 2 or 3 Rooms | 0 (0.0%) | 0 (0.0%) |
| 4 or 5 Rooms | 23 (36.5%) | 0 (0.0%) |
| 6 or 7 Rooms | 7 (11.1%) | 0 (0.0%) |
| 8 or more Rooms | 33 (52.4%) | 0 (0.0%) |
| Total | 63 (100.0%) | 0 (0.0%) |
Housing Structure by Heating Type in East Verde Estates
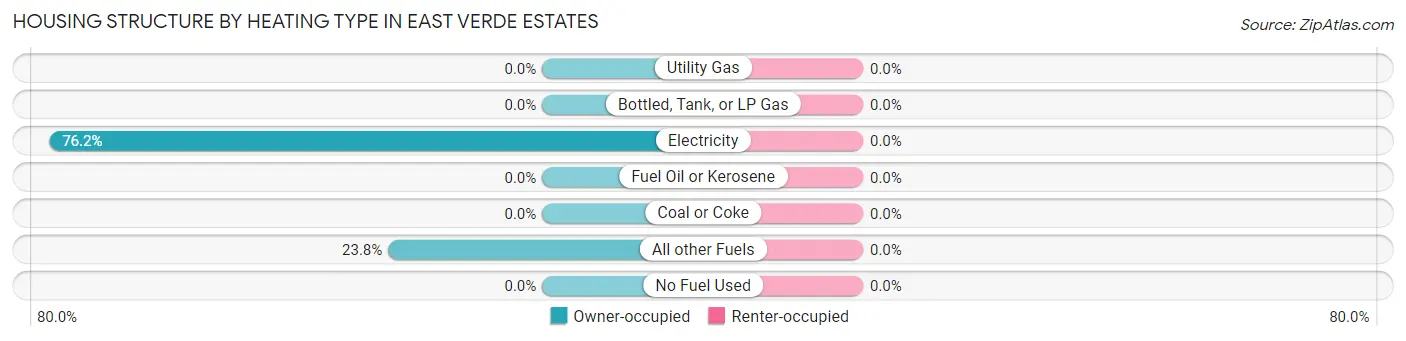
| Heating Type | Owner-occupied | Renter-occupied |
| Utility Gas | 0 (0.0%) | 0 (0.0%) |
| Bottled, Tank, or LP Gas | 0 (0.0%) | 0 (0.0%) |
| Electricity | 48 (76.2%) | 0 (0.0%) |
| Fuel Oil or Kerosene | 0 (0.0%) | 0 (0.0%) |
| Coal or Coke | 0 (0.0%) | 0 (0.0%) |
| All other Fuels | 15 (23.8%) | 0 (0.0%) |
| No Fuel Used | 0 (0.0%) | 0 (0.0%) |
| Total | 63 (100.0%) | 0 (0.0%) |
Household Vehicle Usage in East Verde Estates
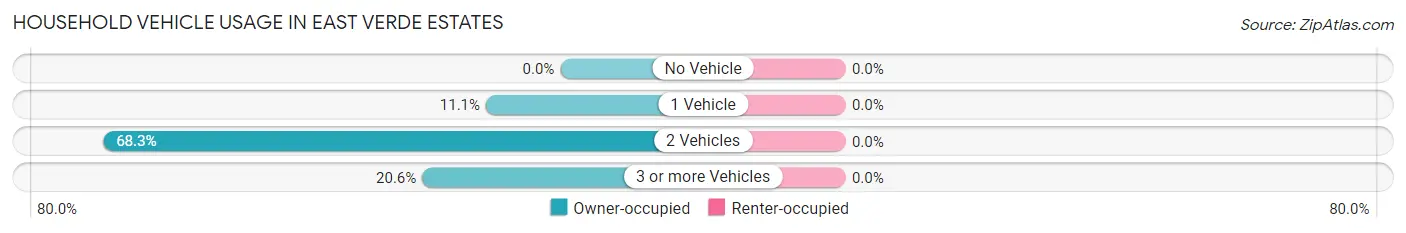
| Vehicles per Household | Owner-occupied | Renter-occupied |
| No Vehicle | 0 (0.0%) | 0 (0.0%) |
| 1 Vehicle | 7 (11.1%) | 0 (0.0%) |
| 2 Vehicles | 43 (68.2%) | 0 (0.0%) |
| 3 or more Vehicles | 13 (20.6%) | 0 (0.0%) |
| Total | 63 (100.0%) | 0 (0.0%) |
Real Estate & Mortgages in East Verde Estates
Real Estate and Mortgage Overview in East Verde Estates
| Characteristic | Without Mortgage | With Mortgage |
| Housing Units | 35 | 28 |
| Median Property Value | $531,300 | $0 |
| Median Household Income | - | - |
| Monthly Housing Costs | $413 | $0 |
| Real Estate Taxes | $1,824 | $0 |
Property Value by Mortgage Status in East Verde Estates
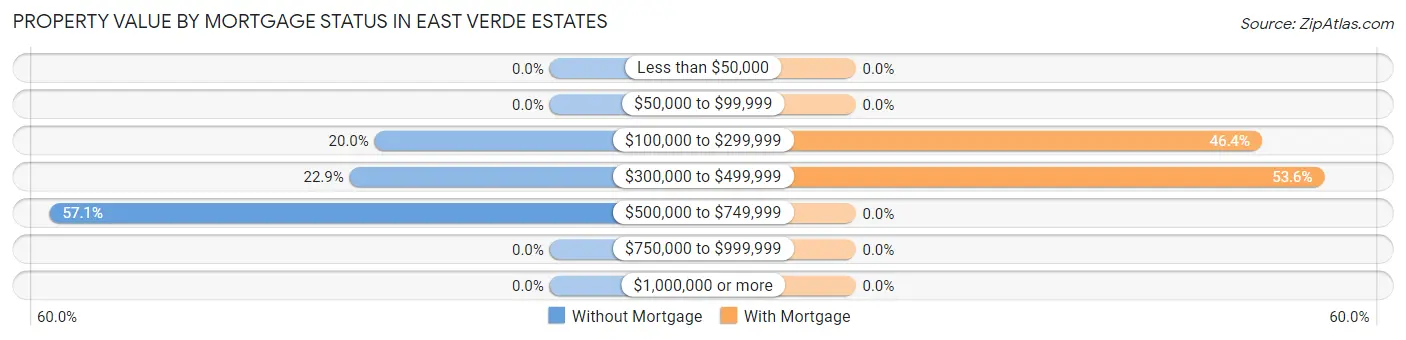
| Property Value | Without Mortgage | With Mortgage |
| Less than $50,000 | 0 (0.0%) | 0 (0.0%) |
| $50,000 to $99,999 | 0 (0.0%) | 0 (0.0%) |
| $100,000 to $299,999 | 7 (20.0%) | 13 (46.4%) |
| $300,000 to $499,999 | 8 (22.9%) | 15 (53.6%) |
| $500,000 to $749,999 | 20 (57.1%) | 0 (0.0%) |
| $750,000 to $999,999 | 0 (0.0%) | 0 (0.0%) |
| $1,000,000 or more | 0 (0.0%) | 0 (0.0%) |
| Total | 35 (100.0%) | 28 (100.0%) |
Household Income by Mortgage Status in East Verde Estates
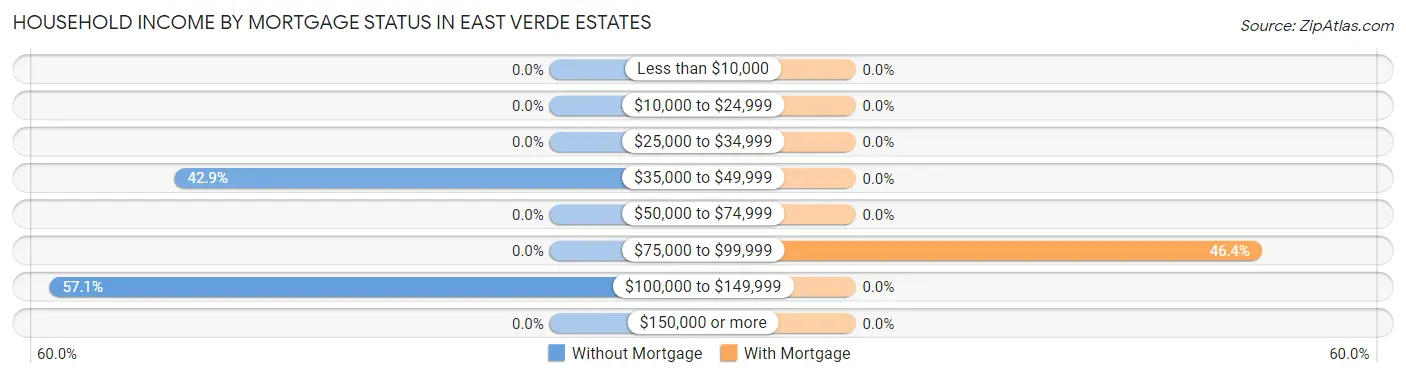
| Household Income | Without Mortgage | With Mortgage |
| Less than $10,000 | 0 (0.0%) | 0 (0.0%) |
| $10,000 to $24,999 | 0 (0.0%) | 0 (0.0%) |
| $25,000 to $34,999 | 0 (0.0%) | 0 (0.0%) |
| $35,000 to $49,999 | 15 (42.9%) | 0 (0.0%) |
| $50,000 to $74,999 | 0 (0.0%) | 0 (0.0%) |
| $75,000 to $99,999 | 0 (0.0%) | 13 (46.4%) |
| $100,000 to $149,999 | 20 (57.1%) | 0 (0.0%) |
| $150,000 or more | 0 (0.0%) | 0 (0.0%) |
| Total | 35 (100.0%) | 28 (100.0%) |
Property Value to Household Income Ratio in East Verde Estates
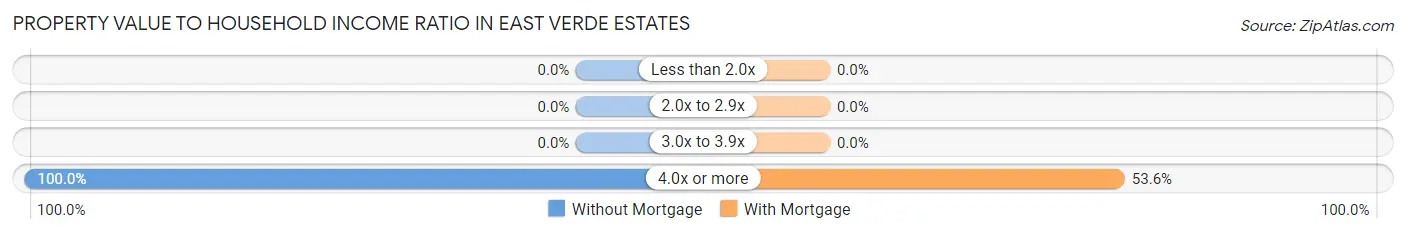
| Value-to-Income Ratio | Without Mortgage | With Mortgage |
| Less than 2.0x | 0 (0.0%) | 0 (0.0%) |
| 2.0x to 2.9x | 0 (0.0%) | 0 (0.0%) |
| 3.0x to 3.9x | 0 (0.0%) | 0 (0.0%) |
| 4.0x or more | 35 (100.0%) | 15 (53.6%) |
| Total | 35 (100.0%) | 28 (100.0%) |
Real Estate Taxes by Mortgage Status in East Verde Estates
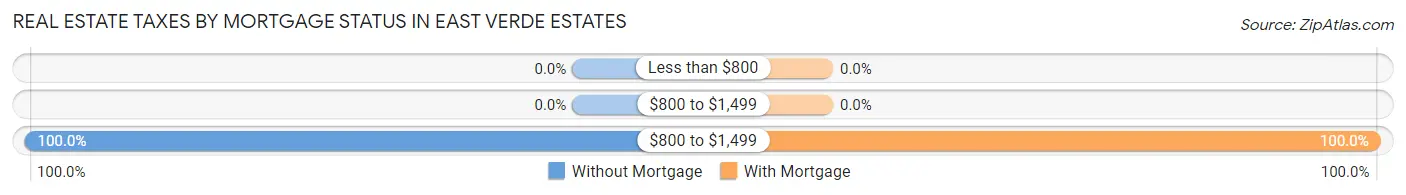
| Property Taxes | Without Mortgage | With Mortgage |
| Less than $800 | 0 (0.0%) | 0 (0.0%) |
| $800 to $1,499 | 0 (0.0%) | 0 (0.0%) |
| $800 to $1,499 | 35 (100.0%) | 28 (100.0%) |
| Total | 35 (100.0%) | 28 (100.0%) |
Health & Disability in East Verde Estates
Health Insurance Coverage by Age in East Verde Estates
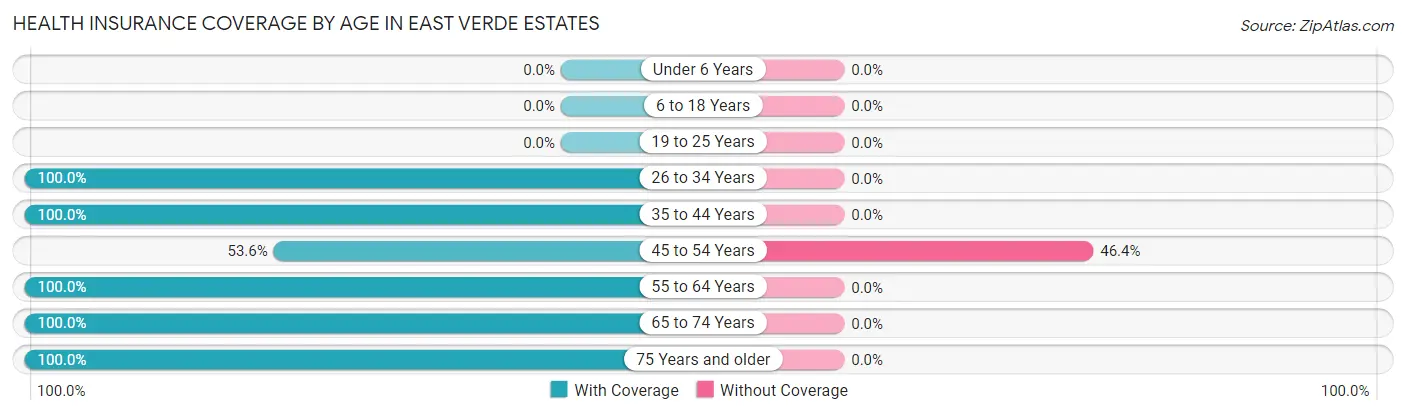
| Age Bracket | With Coverage | Without Coverage |
| Under 6 Years | 0 (0.0%) | 0 (0.0%) |
| 6 to 18 Years | 0 (0.0%) | 0 (0.0%) |
| 19 to 25 Years | 0 (0.0%) | 0 (0.0%) |
| 26 to 34 Years | 31 (100.0%) | 0 (0.0%) |
| 35 to 44 Years | 6 (100.0%) | 0 (0.0%) |
| 45 to 54 Years | 15 (53.6%) | 13 (46.4%) |
| 55 to 64 Years | 19 (100.0%) | 0 (0.0%) |
| 65 to 74 Years | 23 (100.0%) | 0 (0.0%) |
| 75 Years and older | 42 (100.0%) | 0 (0.0%) |
| Total | 136 (91.3%) | 13 (8.7%) |
Health Insurance Coverage by Citizenship Status in East Verde Estates
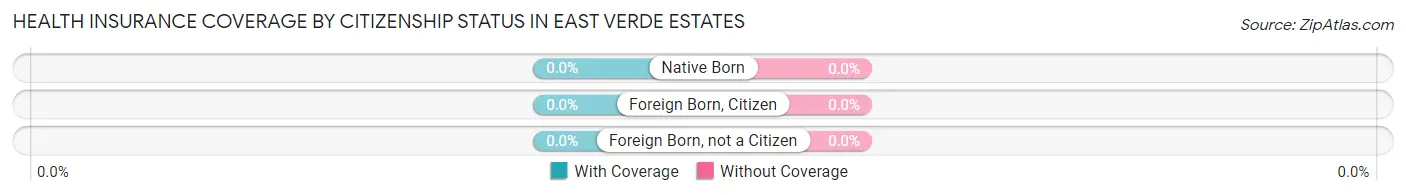
| Citizenship Status | With Coverage | Without Coverage |
| Native Born | 0 (0.0%) | 0 (0.0%) |
| Foreign Born, Citizen | 0 (0.0%) | 0 (0.0%) |
| Foreign Born, not a Citizen | 0 (0.0%) | 0 (0.0%) |
Health Insurance Coverage by Household Income in East Verde Estates
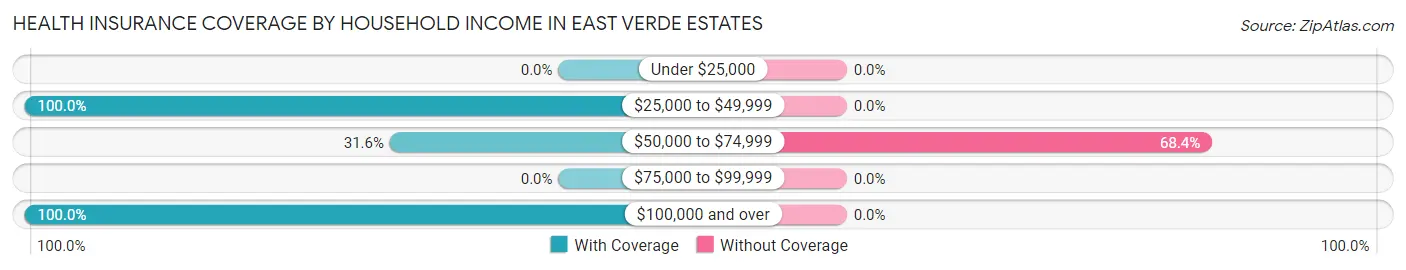
| Household Income | With Coverage | Without Coverage |
| Under $25,000 | 0 (0.0%) | 0 (0.0%) |
| $25,000 to $49,999 | 22 (100.0%) | 0 (0.0%) |
| $50,000 to $74,999 | 6 (31.6%) | 13 (68.4%) |
| $75,000 to $99,999 | 0 (0.0%) | 0 (0.0%) |
| $100,000 and over | 108 (100.0%) | 0 (0.0%) |
Public vs Private Health Insurance Coverage by Age in East Verde Estates
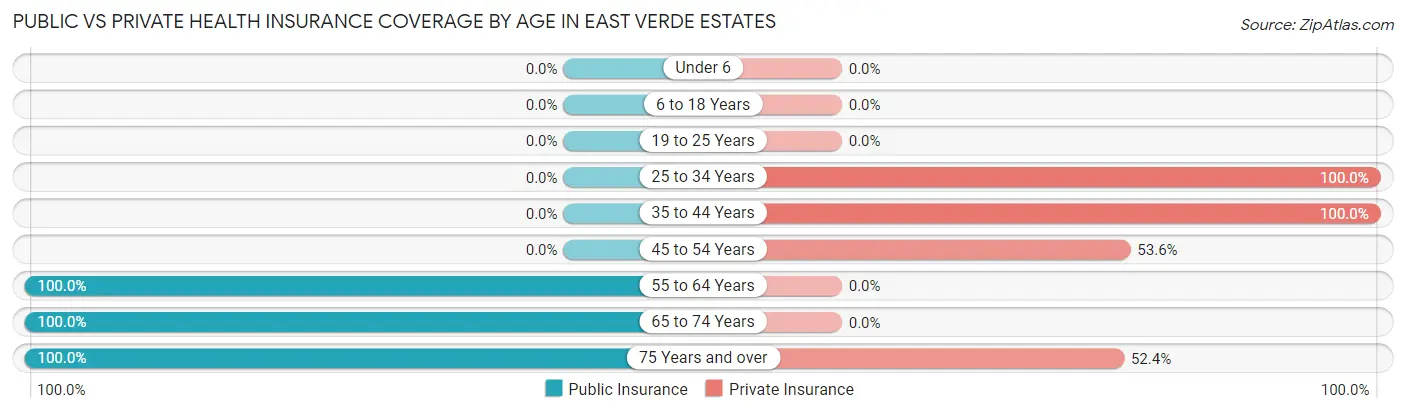
| Age Bracket | Public Insurance | Private Insurance |
| Under 6 | 0 (0.0%) | 0 (0.0%) |
| 6 to 18 Years | 0 (0.0%) | 0 (0.0%) |
| 19 to 25 Years | 0 (0.0%) | 0 (0.0%) |
| 25 to 34 Years | 0 (0.0%) | 31 (100.0%) |
| 35 to 44 Years | 0 (0.0%) | 6 (100.0%) |
| 45 to 54 Years | 0 (0.0%) | 15 (53.6%) |
| 55 to 64 Years | 19 (100.0%) | 0 (0.0%) |
| 65 to 74 Years | 23 (100.0%) | 0 (0.0%) |
| 75 Years and over | 42 (100.0%) | 22 (52.4%) |
| Total | 84 (56.4%) | 74 (49.7%) |
Disability Status by Sex by Age in East Verde Estates
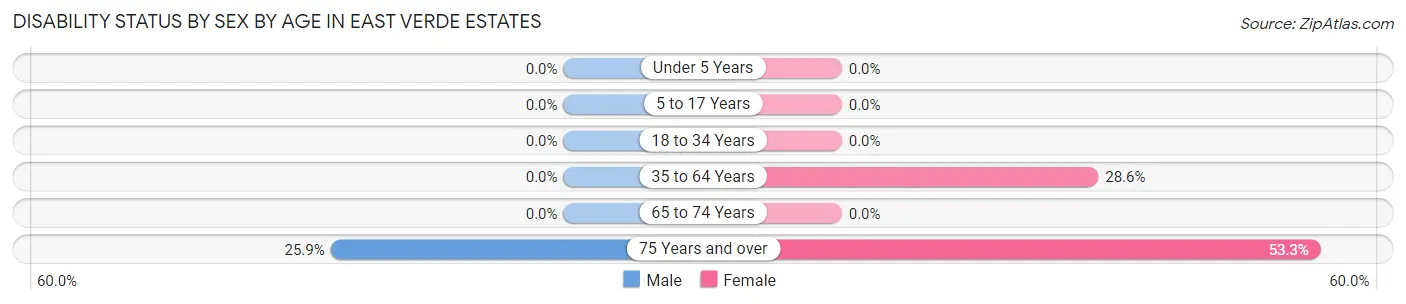
| Age Bracket | Male | Female |
| Under 5 Years | 0 (0.0%) | 0 (0.0%) |
| 5 to 17 Years | 0 (0.0%) | 0 (0.0%) |
| 18 to 34 Years | 0 (0.0%) | 0 (0.0%) |
| 35 to 64 Years | 0 (0.0%) | 6 (28.6%) |
| 65 to 74 Years | 0 (0.0%) | 0 (0.0%) |
| 75 Years and over | 7 (25.9%) | 8 (53.3%) |
Disability Class by Sex by Age in East Verde Estates
Disability Class: Hearing Difficulty
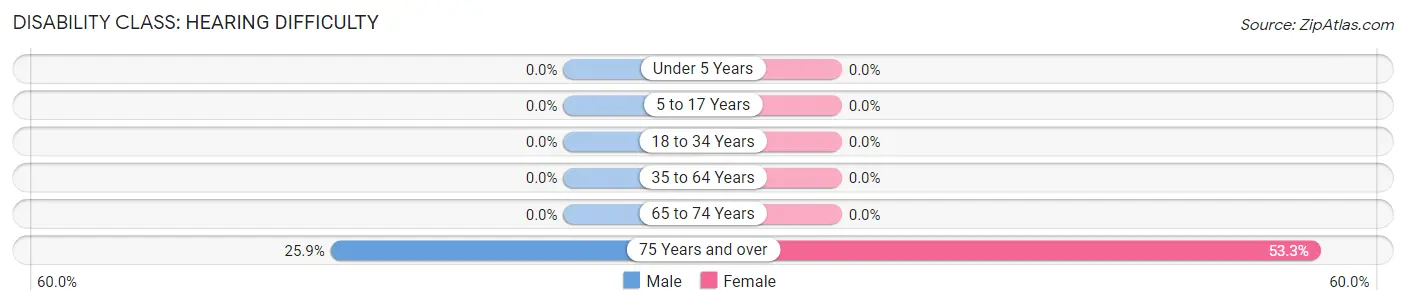
| Age Bracket | Male | Female |
| Under 5 Years | 0 (0.0%) | 0 (0.0%) |
| 5 to 17 Years | 0 (0.0%) | 0 (0.0%) |
| 18 to 34 Years | 0 (0.0%) | 0 (0.0%) |
| 35 to 64 Years | 0 (0.0%) | 0 (0.0%) |
| 65 to 74 Years | 0 (0.0%) | 0 (0.0%) |
| 75 Years and over | 7 (25.9%) | 8 (53.3%) |
Disability Class: Vision Difficulty
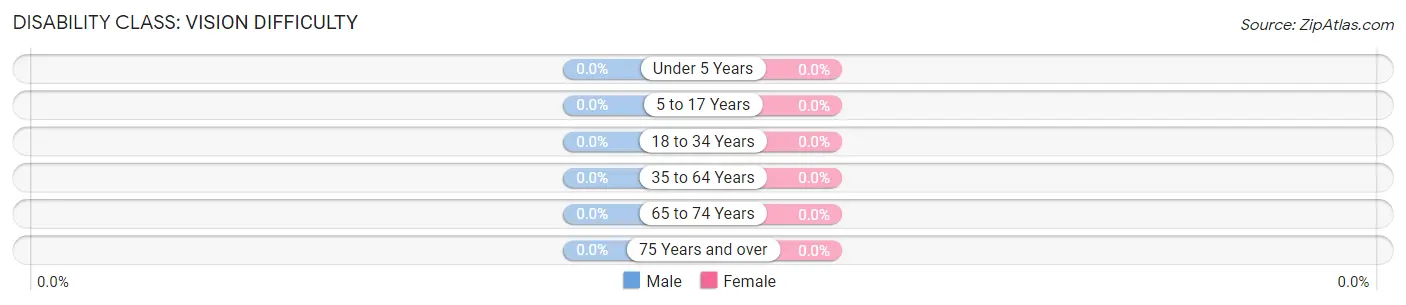
| Age Bracket | Male | Female |
| Under 5 Years | 0 (0.0%) | 0 (0.0%) |
| 5 to 17 Years | 0 (0.0%) | 0 (0.0%) |
| 18 to 34 Years | 0 (0.0%) | 0 (0.0%) |
| 35 to 64 Years | 0 (0.0%) | 0 (0.0%) |
| 65 to 74 Years | 0 (0.0%) | 0 (0.0%) |
| 75 Years and over | 0 (0.0%) | 0 (0.0%) |
Disability Class: Cognitive Difficulty
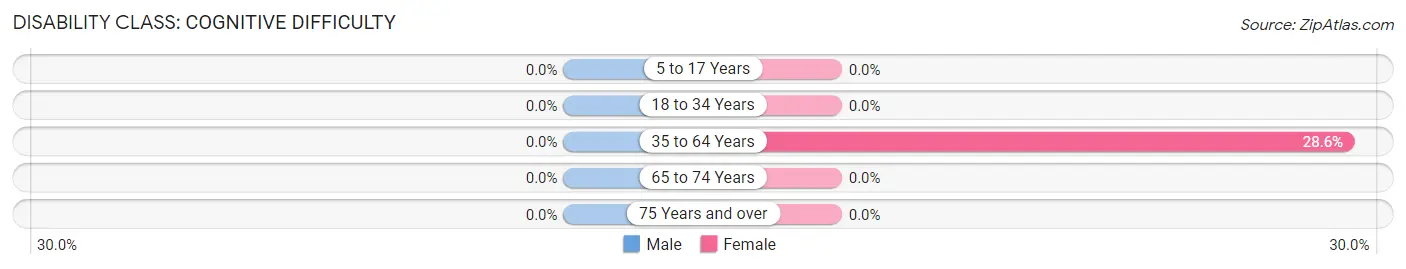
| Age Bracket | Male | Female |
| 5 to 17 Years | 0 (0.0%) | 0 (0.0%) |
| 18 to 34 Years | 0 (0.0%) | 0 (0.0%) |
| 35 to 64 Years | 0 (0.0%) | 6 (28.6%) |
| 65 to 74 Years | 0 (0.0%) | 0 (0.0%) |
| 75 Years and over | 0 (0.0%) | 0 (0.0%) |
Disability Class: Ambulatory Difficulty
| Age Bracket | Male | Female |
| 5 to 17 Years | 0 (0.0%) | 0 (0.0%) |
| 18 to 34 Years | 0 (0.0%) | 0 (0.0%) |
| 35 to 64 Years | 0 (0.0%) | 0 (0.0%) |
| 65 to 74 Years | 0 (0.0%) | 0 (0.0%) |
| 75 Years and over | 0 (0.0%) | 0 (0.0%) |
Disability Class: Self-Care Difficulty
| Age Bracket | Male | Female |
| 5 to 17 Years | 0 (0.0%) | 0 (0.0%) |
| 18 to 34 Years | 0 (0.0%) | 0 (0.0%) |
| 35 to 64 Years | 0 (0.0%) | 0 (0.0%) |
| 65 to 74 Years | 0 (0.0%) | 0 (0.0%) |
| 75 Years and over | 0 (0.0%) | 0 (0.0%) |
Technology Access in East Verde Estates
Computing Device Access in East Verde Estates
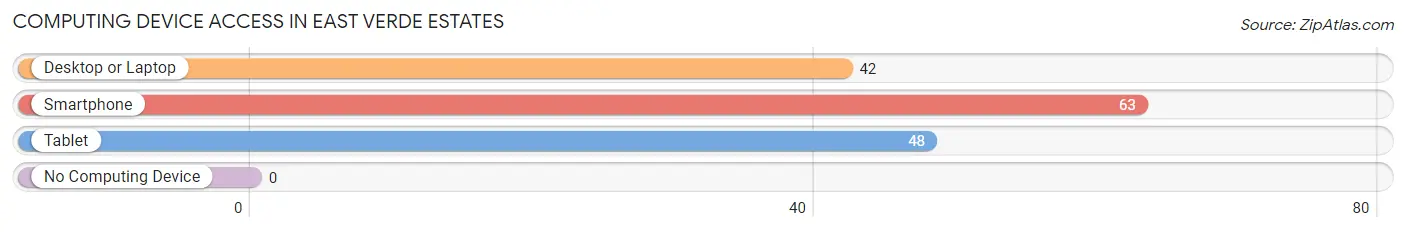
| Device Type | # Households | % Households |
| Desktop or Laptop | 42 | 66.7% |
| Smartphone | 63 | 100.0% |
| Tablet | 48 | 76.2% |
| No Computing Device | 0 | 0.0% |
| Total | 63 | 100.0% |
Internet Access in East Verde Estates
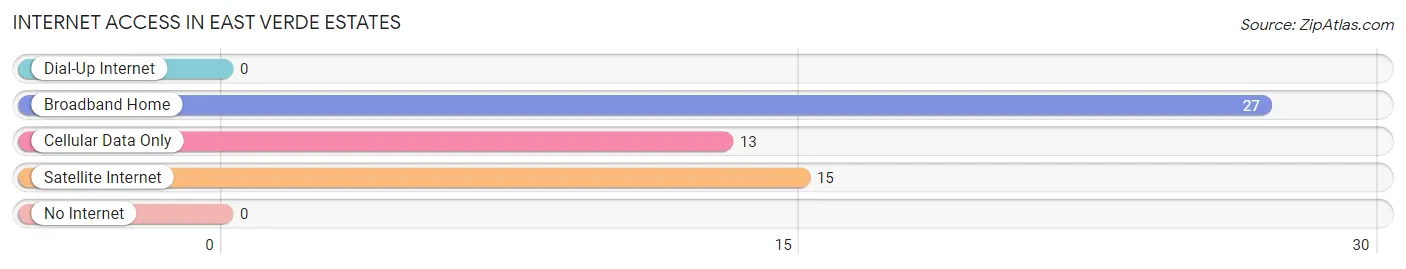
| Internet Type | # Households | % Households |
| Dial-Up Internet | 0 | 0.0% |
| Broadband Home | 27 | 42.9% |
| Cellular Data Only | 13 | 20.6% |
| Satellite Internet | 15 | 23.8% |
| No Internet | 0 | 0.0% |
| Total | 63 | 100.0% |
East Verde Estates Summary
Verde Estates, Arizona is a small unincorporated community located in the Tonto National Forest in Gila County, Arizona. It is situated in the East Verde River Valley, approximately 25 miles east of Payson, Arizona. The community is located at an elevation of 4,400 feet and is surrounded by the Mogollon Rim to the north and the Mazatzal Mountains to the south.
History
Verde Estates was established in the late 1800s by settlers who were drawn to the area by the abundance of natural resources. The first settlers were ranchers who raised cattle and sheep, and the area was also known for its mining operations. The first post office was established in 1891 and the community was officially incorporated in 1912.
The area was originally known as East Verde, but the name was changed to Verde Estates in the early 1900s. The name was chosen to reflect the area’s rural character and the abundance of natural resources.
Geography
Verde Estates is located in the East Verde River Valley, which is part of the Tonto National Forest. The area is surrounded by the Mogollon Rim to the north and the Mazatzal Mountains to the south. The climate is semi-arid, with hot summers and mild winters. The average annual precipitation is approximately 18 inches.
The area is home to a variety of wildlife, including deer, elk, coyotes, bobcats, and mountain lions. The East Verde River runs through the valley and is a popular destination for fishing and camping.
Economy
Verde Estates is a rural community with a small population and a limited economy. The primary industries are ranching and tourism. The area is home to several guest ranches, which offer horseback riding, fishing, and other outdoor activities.
The area is also home to several small businesses, including a general store, a gas station, and a restaurant. The community is served by a volunteer fire department and a post office.
Demographics
As of the 2010 census, the population of Verde Estates was 1,093. The racial makeup of the community was 97.3% White, 0.3% African American, 0.2% Native American, 0.2% Asian, 0.1% Pacific Islander, 0.7% from other races, and 1.3% from two or more races. Hispanic or Latino of any race were 2.2% of the population.
The median household income in Verde Estates was $37,500, and the median family income was $41,250. The per capita income was $17,857. About 11.3% of families and 14.2% of the population were below the poverty line, including 18.2% of those under age 18 and 8.3% of those age 65 or over.
Verde Estates is a small, rural community with a limited economy and a population that is largely white and middle-class. The area is known for its natural beauty and abundance of outdoor activities, and is a popular destination for tourists and outdoor enthusiasts.
Common Questions
What is Per Capita Income in East Verde Estates?
Per Capita income in East Verde Estates is $45,054.
What is the Median Family Income in East Verde Estates?
Median Family Income in East Verde Estates is $126,688.
What is the Median Household income in East Verde Estates?
Median Household Income in East Verde Estates is $125,438.
What is Inequality or Gini Index in East Verde Estates?
Inequality or Gini Index in East Verde Estates is 0.23.
What is the Total Population of East Verde Estates?
Total Population of East Verde Estates is 149.
What is the Total Male Population of East Verde Estates?
Total Male Population of East Verde Estates is 90.
What is the Total Female Population of East Verde Estates?
Total Female Population of East Verde Estates is 59.
What is the Ratio of Males per 100 Females in East Verde Estates?
There are 152.54 Males per 100 Females in East Verde Estates.
What is the Ratio of Females per 100 Males in East Verde Estates?
There are 65.56 Females per 100 Males in East Verde Estates.
What is the Median Population Age in East Verde Estates?
Median Population Age in East Verde Estates is 60.5 Years.
What is the Average Family Size in East Verde Estates
Average Family Size in East Verde Estates is 2.9 People.
What is the Average Household Size in East Verde Estates
Average Household Size in East Verde Estates is 2.4 People.
How Large is the Labor Force in East Verde Estates?
There are 85 People in the Labor Forcein in East Verde Estates.
What is the Percentage of People in the Labor Force in East Verde Estates?
57.0% of People are in the Labor Force in East Verde Estates.
What is the Unemployment Rate in East Verde Estates?
Unemployment Rate in East Verde Estates is 15.3%.